
UNDERSTANDING THE CHARACTERISTICS OF OLDER ADULTS IN DIFFERENT RESIDENTIAL SETTINGS: DATA SOURCES AND TRENDS
Matthew Toth, PhD, Lauren A. Martin Palmer, PhD, Lawren E. Bercaw, PhD, Ruby Johnson, MS, Jessica Jones, BA, Rebekah Love, BS, Helena Voltmer, BA, and Sarita Karon, PhD
RTI International
October 2020
Printer Friendly Version in PDF Format (59 PDF pages)
ABSTRACT
As the U.S. population ages, the prevalence of disability and functional limitations, as well as the demand for long-term services and supports (LTSS), is anticipated to increase. LTSS include a variety of personal care, mobility, and social services to assist individuals with functional limitations due to disability or other physical or cognitive conditions. Individuals can receive LTSS in a variety of settings ranging from traditional housing to community-based residential care settings (such as assisted living facilities) and institutional settings (such as nursing homes). We used multiple data sources to estimate the older adult (age 65+) population in the United States, their places of residence, and their demographic, health, and functional characteristics. We found a decline in the proportion of older adults residing in nursing homes and a corresponding increase in the proportion living in traditional housing, while the proportion of people residing in community-based residential care has remained stable. Increases in cognitive and functional limitations among older adults, coupled with a decline in the use of nursing homes, highlight the importance of meeting the LTSS needs of older adults in the community.
This report was prepared under contract #HHSP233201600021I between HHS's ASPE/BHDAP and RTI International. For additional information about this subject, you can visit the BHDAP home page at https://aspe.hhs.gov/bhdap or contact the ASPE Project Officers at HHS/ASPE/BHDAP, Room 424E, H.H. Humphrey Building, 200 Independence Avenue, S.W., Washington, D.C. 20201; William.Haltermann@hhs.gov, William.Marton@hhs.gov, Helen.Lamont@hhs.gov.
DISCLAIMER: The opinions and views expressed in this report are those of the authors. They do not reflect the views of the Department of Health and Human Services, the contractor or any other funding organization. This report was completed and submitted on September 20, 2019.
TABLE OF CONTENTS
2. METHODS
2.1. Data Sources
2.2. Analytic Sample and Weighting
2.3. Statistical Approach
2.4. Defining Residential Settings
2.5. Variables of Interest
4. CHARACTERISTICS OF THE POPULATION BY RESIDENTIAL SETTING
4.1. Demographics
4.2. Health and Functional Status
5.1. Discussion
5.2. Conclusion
6. REFERENCES
LIST OF EXHIBITS
- EXHIBIT 1: Definition of Residential Care Settings by Survey
- EXHIBIT 2: Age-Adjusted Residential Population Estimates and Percentages by Housing Setting, Data Source, and Year
- EXHIBIT 3: Change in the Proportion of the Older Adult Population Residing in Traditional Housing, by Year and Data Source
- EXHIBIT 4: Change in the Proportion of the Older Adult Population Residing in Community-Based Residential Care, by Year and Data Source
- EXHIBIT 5: Change in the Proportion of the Older Adult Population Residing in Nursing Homes, by Year and Data Source
- EXHIBIT 6: Age Distribution by Residential Setting and Data Source
- EXHIBIT 7: Traditional Housing: Age Distribution Over Time by Data Source
- EXHIBIT 8: Community-Based Residential Care: Age Distribution Over Time by Data Source
- EXHIBIT 9: Nursing Facility: Age Distribution Over Time by Data Source
- EXHIBIT 10: ADL and IADL Limitations among Traditional Housing and Community-Based Residential Care Using the Most Recent Data for Each Source
- EXHIBIT 11: Traditional Housing Residents: ADL and IADL Limitations Over Time by Data Source
- EXHIBIT 12: Community-Based Residential Care Residents: ADL and IADL Limitations Over Time by Data Source
- EXHIBIT 13: Prevalence of Diabetes Over Time among Individuals Living in Different Residential Settings
- EXHIBIT 14: Prevalence of Hip Fracture Over Time among Individuals Living in Different Residential Settings
- EXHIBIT 15: Prevalence of Arthritis Over Time among Individuals Living in Different Residential Settings
- EXHIBIT 16: Prevalence of Stroke Over Time among Individuals Living in Different Residential Settings
- EXHIBIT 17: Prevalence of Lung Disease Over Time among Individuals Living in Different Residential Settings
- EXHIBIT 18: Prevalence of Mental Disorder/Depression Over Time among Individuals Living in Difference Residential Settings
- EXHIBIT 19: Prevalence of Alzheimer's Disease or Other Dementia Over Time among Individuals Living in Different Residential Settings
- EXHIBIT 20: Prevalence of HIPAA-Defined Disability among Individuals Living in Different Residential Settings
- EXHIBIT A-1: Data Source Description and Design
- EXHIBIT A-2: Services Available by Housing Setting and Data Source
- EXHIBIT A-3: Demographic Characteristics of Individuals 65 and Older by their Residential Setting: Data Over Time from 4 National Datasets
- EXHIBIT A-4: Functional Status and Health Characteristics of Individuals 65 and Older by their Residential Setting: Data Over Time from 4 National Datasets
ACRONYMS
The following acronyms are mentioned in this report and/or appendix.
| ACS | American Community Survey |
|---|---|
| ADL | Activity of Daily Living |
| ASPE | Office of the Assistant Secretary for Planning and Evaluation |
| CCRC | Continuing Care Retirement Community |
| CES-D | Center for Epidemiologic Studies Depression Scale |
| CMS | Centers for Medicare & Medicaid Services |
| COPD | Chronic Obstructive Pulmonary Disease |
| CVA | Cerebrovascular Accident |
| FQ | Facility Questionnaire |
| HIPAA | Health Insurance Portability and Accountability Act |
| HRS | Health and Retirement Study |
| IADL | Instrumental Activity of Daily Living |
| LTSS | Long-Term Services and Supports |
| MCBS | Medicare Current Beneficiary Survey |
| MSA | Metropolitan Statistical Area |
| NCHS | National Center for Health Statistics |
| NHATS | National Health and Aging Trends Study |
| NSLTCP | National Study of Long-Term Care Providers |
| NSRCF | National Study of Residential Care Facilities |
| RCF | Residential Care Facility |
| RIC | Record Identification Code |
| SP | Sample Person |
EXECUTIVE SUMMARY
Introduction
By 2050, the number of adults 65 years and older is expected to more than double to 88.5 million from 40.2 million in 2010 (U.S. Census Bureau, 2010a). As the population ages, the prevalence of disability and functional limitations, as well as the demand for long-term services and supports (LTSS), is anticipated to increase. A recent report from the Office of the Assistant Secretary for Planning and Evaluation estimated that more than half of older adults turning 65 will develop a disability that necessitates LTSS (Favreault & Dey, 2016). LTSS include a variety of personal care, mobility, health, and social services to assist individuals with functional limitations due to disability or other physical or cognitive conditions (Tach & Wiener, 2018).
Despite this need, most older adults say they would like to live in their homes and communities for as long as they are able, rather than move to nursing homes, which provide high-acuity care for residents with serious health concerns, multiple comorbidities, and chronic conditions (Keenan, 2010). LTSS can be provided in a variety of residential settings, from traditional housing and assisted living (non-institutional) to nursing homes (institutional). Yet we lack consistent and reliable estimates of older adults' use of each type of setting.
Most research has identified a trend toward an increasing use of non-institutional residential care, such as assisted living facilities (Silver et al., 2018), and a decline in the use of institutional care such as nursing homes (Spillman & Black, 2005; Grabowski, Stevenson, & Cornell, 2012; Degenholtz et al., 2016). However, survey and regulatory differences in the definitions of non-institutional LTSS can vary across surveys and states, hindering researchers' and policy makers' understanding of the LTSS needs of people residing in these settings.
Building upon prior work by Spillman & Black (2006), this project describes where older adults live, how their needs differ by residential setting type, and how population demographics, health, disability, and functional status have changed over time. We present and compare information from different data sources and surveys, each with a slightly different sampling frame, purpose, and set of limitations. Exploring multiple data sources provides a more complete picture of the characteristics of older adults across different residential settings. Additionally, understanding the differences between survey methods provides insight into why the picture of the older adult population may vary depending on the source information.
This work extends that of Spillman & Black by using more recent data from surveys that they analyzed. We also augment this data with information from other, more recent datasets that sample the older adult population and survey long-term care facilities. Through a longitudinal analysis of data from multiple sources, we address the following questions:
-
How many older adults live in traditional housing, community-based residential care facilities (RCFs), and nursing homes, and how have these numbers changed in recent years?
-
What do we know about the demographic, health, and functional characteristics of older adults living in these settings, and how they differ across the three types of living arrangements?
Data Sources
We used multiple data sources to estimate the older adult (age 65+) population[1] in the United States, their places of residence, and their demographic, health, and functional characteristics. These data sources include the Medicare Current Beneficiary Survey (MCBS) 2008 and 2013 Cost and Use Files; the 2008 and 2014 Health and Retirement Study (HRS); the 2011 and 2015 National Health and Aging Trends Study (NHATS); and the 2010, 2012 and 2014 National Study of Long-Term Care Providers, 2010, 2012.
Findings
How many older adults live in traditional housing, community-based RCFs, and nursing homes, and how have these numbers changed in recent years?
-
Population growth. The older population (age 65+) has grown from approximately 34 million in 2002 to 42-46 million in 2014/2015.
-
Residential setting changes. The proportion of older adults residing in nursing homes is declining, and there is a corresponding increase in the proportion of older adults living in traditional housing (p0.05). Although the number of people living in community-based residential care settings has increased, the proportion of older adults residing in these settings remained stable (HRS and MCBS) or slightly declined (NHATS) over time.
-
In the most recent years for which data were available, the MCBS indicates 979,481 people in community-based residential care settings (2013), up from 781,982 in 2002 but proportionally the same (2.3%). The HRS reports many fewer (0.8 million; 2014), and the NHATS reports many more (2 million; 2015). These differences across surveys likely reflect variation in how residential care settings are defined by each survey, and in how samples are selected.
-
What do we know about the demographic, health, and functional characteristics of older adults living in these settings, and how they differ across the three types of living arrangements?
-
Demographics. The demographic characteristics of residents were similar across years within each setting, and across settings, with some key exceptions.
-
Age. The age distributions of older adults living in community-based residential care were comparable to those living in nursing homes in the most recent year of each survey (53%-61.5% of residents were aged 85 and older).
-
Race. There were increases in non-White residents in community-based residential care over time, across all datasets except the HRS.
-
Marriage status. The presence of single or widowed adults increased slightly in community-based residential care, but not in traditional housing or nursing facilities.
-
Income. The proportion of low-income older adults declined over time in traditional housing and community-based residential care, but not in nursing homes.
-
-
Functional limitations. Estimates of functional limitation varied across data sources, likely resulting from differences in variable definitions and approaches to data collection. The general patterns, however, were consistent.
-
In all data sources, and at all points in time, people living in community-based residential care settings reported more impairments than did those living in traditional settings. Those residing in nursing homes had the highest prevalence of functional limitations across all settings.
-
In general, functional limitations have increased over time for those residing in community-based residential care settings and nursing homes across all surveys, though this increase was only statistically significant for those in nursing homes. Changes in functional limitations of those residing in traditional housing varied by survey: the HRS indicated that there was very little change in functional limitations (not statistically significant), the MCBS showed an increase in 2013 relative to 2008 (p0.05), while the NHATS reported a decline from 2011 to 2015 (p0.01).
-
-
Disability. Estimates of Health Insurance Portability and Accountability Act (HIPAA)-defined disability show the prevalence in community-based residential care settings ranged from 22.4%-41.6%, depending on the survey, and was 95% (MCBS) in nursing facilities during the latest year of the study period. Depending on the survey, the prevalence of HIPAA-defined disability among traditional housing residents ranged from 5.8%-11% in the latest year of the study period. The trend overtime was mixed, depending on the survey.
-
Alzheimer's and other dementia. The prevalence of Alzheimer's disease and other dementias was lowest among those living in traditional settings, and highest among those living in nursing homes. In all settings, the proportion of people with any type of dementia increased from the baseline year to the most recent year of each survey, though not all changes were statistically significant. These patterns were consistent across datasets, but the prevalence rates varied, depending on how data were collected.
Each dataset has implications for estimating the characteristics and size of the residential care population. Differences in setting definitions, data collection procedures, and sampling frame can impact findings. Surveys that capture a mix of LTSS services offered within a setting, in addition to place names, can reliably capture residential care estimates beyond assisted living facilities or facilities regulated by state agencies. Researchers need to consider these methodological differences across datasets to understand how they impact estimates on the size of each setting, as well as the demographic and health status characteristics of residents within settings.
Despite these differences, the consistency in these findings suggest a growing role for non-institutional residential care settings within the long-term care continuum. In particular, as the proportion of older adults living in traditional housing is increasing, along with the health and functional needs of those residents, there may be a growing role for LTSS services outside of both community-based residential care and nursing homes.
1. BACKGROUND AND PURPOSE
By 2050, the number of adults 65 years and older is expected to more than double to 88.5 million from 40.2 million in 2010 (U.S. Census Bureau, 2010). As the population ages, the prevalence of disability, dementia, and other functional limitations is anticipated to grow, increasing demand for long-term services and supports (LTSS) (Courtney-Long et al., 2015; Freedman et al., 2013; Hebert et al., 2013). A recent report from the Office of the Assistant Secretary for Planning and Evaluation (ASPE) estimated that more than half of older adults turning 65 will develop a disability that necessitates LTSS (Favreault & Dey, 2016). LTSS include a variety of personal care, mobility, health, and social services to assist individuals with functional limitations due to disability or other physical or cognitive conditions (Tach & Wiener, 2018).
Older Americans live in a variety of settings, including alone at home (e.g., a house or apartment), in an institutional setting like a nursing facility, or in a non-institutional setting, such as living with other older adults in assisted living or a group home. This last category of non-institutional settings is described in this study as community-based residential care, wherein older adults may live independently with access to needed LTSS on-site. Given the variation in LTSS offered in each of these settings, it is critical for researchers, policy makers, and stakeholders to understand where older adults live and how they manage LTSS needs.
Most older adults say they would like to live in their homes and communities for as long as they are able, rather than moving to nursing homes, which provide high-acuity care for residents with serious health concerns, multiple comorbidities, and chronic conditions (Keenan, 2010). Previous work has documented a trend toward home or community-based LTSS and away from nursing homes (Spillman & Black, 2005). Some estimates show the number of nursing facility residents has declined since 2000 (Eiken et al., 2015), suggesting that many older people are receiving care in other settings or types of residences that offer LTSS.
The number of people living in non-institutional community-based residential care has been increasing in recent years, but estimates vary depending on the data source. Work done in the early 2000s offered a range of estimates, depending on the data source and sampling method used (Spillman & Black, 2005). More recent estimates document a decline in nursing home use, coupled with an increase in non-institutional community-based residential care such as assisted living (Freedman & Spillman, 2014; Degenholtz et al., 2016). Driving the trend toward receiving support in settings outside the nursing home are the high costs of residing in a nursing facility; state Medicaid programs enacting policies to shift long-term care services away from the nursing facility to the community (White House Conference on Aging, 2015); and people's desires to stay in their own homes (Wiener, 2013).
Differences in how non-institutional community-based residential care settings are defined and how data are collected can hinder researchers' and policy makers' understanding of LTSS offered in these settings. State approaches to regulations vary, and there are no centralized administrative data on the use of community-based residential care settings. Accordingly, researchers and policy makers need to rely on multiple data sources to fully understand the range of services available and how they are used. For example, assisted living facilities are commonly thought of as a community-based residential care setting, yet the array of LTSS they provide varies by state and locality (Stevenson & Grabowski, 2010). Many studies examine the LTSS needs of people living in a specific type of setting (Caffrey et al., 2012; Zimmerman, Sloan, & Reed, 2014), yet do not capture other types of community-based residential care settings that may be unregulated by the state and federal government and provide services similar to those provided by licensed settings (e.g., unlicensed care homes or senior co-housing). Comparing data from multiple surveys or sources may provide more confidence in accurately estimating the size and LTSS needs of people living in community-based residential care settings.
The importance of accurately capturing the size and characteristics of the residential care population, both institutional and community-based, is clear. Residential care facilities (RCFs) play a critical role in meeting the LTSS needs of persons with disabilities and functional limitations (Degenholtz et al., 2016). Medical and LTSS spending across these settings can vary and limited research has been conducted in this domain; more current and reliable estimates of the role of residential care settings, both institutional and community-based, are needed to support appropriate policy development.
To understand the shifting residential choices of older adults in the United States, ASPE engaged RTI to analyze data from four surveys. This effort builds upon prior work by Spillman & Black (2006), focusing on where older adults live, how their needs differ by residential setting type, and how this population's demographics, health, disability, and functional status have changed over time. This report describes the datasets used for these analyses, as well as methods for categorizing residential settings into three categories: traditional housing, community-based residential care, or nursing facility. These analyses address the following questions:
-
How many older adults live in traditional housing, community-based RCFs, and nursing homes, and how have these numbers changed in recent years?
-
What do we know about the demographic, health, and functional characteristics of older adults living in these settings, and how they differ across the three types of living arrangements?
This report addresses these questions and discusses potential policy implications. In addition, this report provides insight into how the structure of each dataset affects the results observed, providing guidance to researchers seeking to determine the optimal data source for their specific needs.
2. METHODS
2.1. Data Sources
We used multiple data sources to estimate the older adult (ages 65 and older) population[2] in the United States, their places of residence, and their demographic, health, and functional characteristics. Below we describe each data source, its sampling and survey methodology, and highlight the differences between each source. Exhibit A-1 offers a concise description of the data sources and design.
2.1.1. Medicare Current Beneficiary Survey (MCBS)
Background and purpose. The Medicare Current Beneficiary Survey (MCBS) is a longitudinal panel survey that uses a three-stage probability sample of the Medicare population, and captures sociodemographic factors, health characteristics, health care utilization, and functioning among the Medicare population. The MCBS is a nationally representative sample of the institutionalized and non-institutionalized Medicare population (CMS, 2013). It was first deployed in 1991 and has been administered continuously each year.[3] The MCBS also captures residential setting information for both the institutionalized and non-institutionalized population during the fall of each year and whenever an individual transitions between a facility and the community, and vice versa, during the year. For this study, we used the MCBS Cost and Use files, which are representative of the ever-enrolled Medicare population, and combine survey data with additional data from Medicare claims and other administrative data. The primary purpose of the Cost and Use files is to estimate expenditures, source of payment, and health outcomes over time for the Medicare-covered population (CMS, 2013).
Sample frame. The Cost and Use files are a composite sample drawn from Medicare enrollees as of January 1 of the previous survey year. This sample is then supplemented by two additional rounds of surveys. For example, the 2008 MCBS draws a supplemental sample from the fall of the survey year to include those newly enrolled in 2007 and who survived into 2008, as well as one during the fall of the next year to include those newly enrolled in 2008. Sample persons included in the MCBS are stratified by age: under 45, 45-64, 65-69, 70-74, 75-79, 80-84, and 85 and over. The MCBS oversamples persons with disabilities (those under 65) and very old persons (those over 80), to ensure reliable estimates of the long-term care facility population.
Weight construction. The cross-sectional weights on the Cost and Use files reflect the selection probability of each person included in the sample, adjusted for non-responses and post-stratification to control totals based on age, sex, race, region, and metropolitan statistical area (MSA). The weights inflate the total sample to the ever-enrolled Medicare population for the survey year.
Data collection. The MCBS collects survey data in as many as five interviews per sampled person. People residing in the community receive a community survey. This survey collects demographic, health, and residential characteristics of the sampled person. For those residing in a long-term care facility, a facility questionnaire is delivered and collects similar demographic, health, and residential setting characteristics as the community interview. However, information for the facility questionnaire is obtained through facility records (e.g., Minimum Data Set); the sample person or their family are never directly interviewed. If a person moves from a facility to the community, then a community questionnaire is provided, and vice versa. In this way, the MCBS is able to track the residential settings of the sample person throughout the year. Health status information is collected during the fall of the survey year.
We analyzed data from the MCBS Cost and Use files from 2008 and 2013 for people ages 65 and older. For comparison, we also include data from the 2002 MCBS, as reported in a prior study by Spillman & Black (2006).
2.1.2. Health and Retirement Study (HRS)
Background and purpose. The HRS is a publicly available biennial, longitudinal panel survey that is nationally representative of Americans ages 50 and older. The HRS was established in the late 1980s to address the need for a national survey of America's growing population of older adults (HRS, 2008, 2014). The purpose of the HRS is to provide policy makers with current information on the work and retirement, disability, physical and mental health, health services spending, housing, and financial patterns of the aging population. The first HRS survey year was in 1992. Beginning in 1998, and every subsequent 6 years, the HRS has added a new birth cohort to the sample. The Early Baby Boomers, born 1948-1953, were added in 2004 and are included in both the 2008 and 2014 data. The Mid Baby Boomers, born 1954-1959, were added in 2010 and are included in only the 2014 data.
Sample frame. The HRS uses a multi-stage area probability sample of United States households with oversamples of African Americans, Hispanics, and Floridians. In 2010, the HRS expanded the minority sample by undertaking a new strategy for oversampling minorities. The HRS does not include a representative sample of individuals living in nursing facilities.
Weight construction. The HRS weights are post-stratified to represent the American Community Survey (ACS) so that they are representative of all United States households, or of all non-institutional individuals in the Unites States, as of March of the previous survey year (U.S. Census Bureau, 2014).
Data collection. Using in-depth interviews with the sample person or proxy respondents, the HRS collects detailed information related to demographics, health, income and wealth, employment, relationship status, and housing. Interviews are conducted with the same respondents each year, unless they die or refuse to participate.
This study uses the HRS data from the 2008 and 2014 interview years. For the purposes of comparing the HRS data to other data sources included in this report, we restricted the population to those aged 65 and older for analysis. For comparison, we also included data from the 2002 HRS, as reported by Spillman & Black (2006).
2.1.3. National Health and Aging Trends Study (NHATS)
Background and purpose. The National Health and Aging Trends Study (NHATS) is a nationally representative sample of the Medicare population and is administered annually (Montaquila et al., 2012). The purpose of the survey is to follow a representative cohort of adults 65 years and older over time, tracking their health, functional limitations, financial assets, home environment, employment, and demographics. The first wave of data was collected in 2011 from a stratified three-stage sample of Medicare beneficiaries ages 65 and older. Data were collected again in 2012, 2013, and 2014 among these same respondents. In 2015, additional respondents were included in the dataset to correct for attrition since the initial sample was created.
Sample frame. The sampling frame is individual Medicare beneficiaries (ages 65 and older), derived from the Medicare enrollment database, regardless of residential setting; African American and oldest-old (ages 80 and older) seniors are oversampled. The sample is drawn from the Medicare enrollment file in October of the preceding year. Participants remain in the sample until they die or otherwise refuse to continue participating.
Weight construction. The NHATS weights for 2011 are designed to represent Medicare beneficiaries 65 years and older as of September 30, 2010. Separate weights are included for the 2015 cohort to account for the replenishment of the sample. These weights are designed to represent Medicare beneficiaries 65 years and older as of September 30, 2014.
Data collection. The NHATS data are collected through in-person interviews conducted in the respondents' homes or other residences. The information collected includes both interviewee responses and interviewer observation during the in-person interviews (Sample Person interviews). Individuals who cannot complete the interview because of health or language and communication concerns may have a proxy respondent speak with the NHATS interviewer. The NHATS in-depth interview questions relate to health and daily living for older Americans, with specific topics covering social relationships, financial assets, health, home environment, mobility, activities of daily living (ADLs), instrumental activities of daily living (IADLs), employment, and demographics. These questions are asked of people residing in their own homes or in community-based residential care settings. The annual NHATS survey tracks participants as they age, following them as they move to other residences or care settings over time. For participants who live in nursing facilities, interviews are conducted with facility staff only (Facility Questionnaire interviews); consequently, the interview topics focus on facility services provided and limited demographic and health characteristics of the participants.
This study uses data from the 2011 and 2015 surveys, the earliest and most recent years for which data were available.
2.1.4. National Study of Long-Term Care Providers (NSLTCP)
Background and purpose. The NSLTCP began in 2012 and replaces the Centers for Disease Control and Prevention's National Center for Health Statistics' (NCHS's) previous study of RCFs, the National Study of Residential Care Facilities (NSRCF) (NCHS, 2015). These studies were designed to produce national estimates of residential care providers and their residents. The survey uses a stratified two-stage probability sampling design. The first stage was the selection of RCFs. The NCHS conducts the NSLTCP biannually.
Sample frame. Facilities eligible for the survey must have been licensed, registered, listed, certified, or otherwise regulated by the state; have four or more licensed, certified, or registered beds; have at least one resident currently living in the facility; and must provide room and board with at least two meals per day, around-the-clock on-site supervision, and help with personal care, such as bathing and dressing, or health-related services, such as medication management. The sample frame for the NSRCF is the same as the NSLTCP. Nursing homes and facilities licensed to serve persons with mental illness or developmental disability were excluded. The NSLTCP survey used a sample of residential care communities in some states and a census of residential care communities in other states, depending on the number of communities. The primary sampling strata of facilities were defined by facility size (number of beds) and census region.
Weight construction. For sampled states, the sample weight reflects the probability of selection for each facility that was randomly selected. The service user weights used in the 2010 NSRCF reflect a national estimate of all residents living in residential care communities on any given day between March and November 2010.
Data collection. In-person interviews are conducted with residential care administrators, who provide information about the facility characteristics such as ownership, size, and services offered. As part of the NSRCF, facility staff also provided information about 3-6 randomly selected residents. In the NSLTCP, facility administrators provide aggregate information about characteristics of their residents, such as age, sex, race, and number residents needing assistance with ADLs.
For this study, we analyzed publicly available data for the 2010 NSRCF. Data for the 2012 and 2014 NSLTCP are drawn from the NCHS Vital and Health Statistics, Series 3 Reports.
2.2. Analytic Sample and Weighting
The data sources used in these analyses differ in how the samples are selected, and the population to which they are weighted. To improve comparability across surveys, our methodological approach was to construct the analytic samples.
The MCBS Cost and Use files are a nationally representative sample of the non-institutionalized and institutionalized beneficiaries ever-enrolled in Medicare during the year. To provide estimates of the residential care population, we selected a cross-section of those enrolled and alive on September 1. In this way, we are approximating the sample selection approach used by Spillman & Black (2006).[4] Moreover, we ensured that the respondents' health characteristics correspond with their residential location. We determined the beneficiary's residential location using the household composition file, the facility characteristics file, and the residential timeline file. We excluded respondents who are younger than 65.
The HRS is a nationally representative sample of the United States adult population aged 50 and older. The HRS uses person-level weights for each respective year, structured to match the Current Population Survey, which includes living, non-institutionalized respondents. The HRS sets these person-level weights to zero for those not age-eligible, living outside the United States, or living in a nursing facility. Consequently, our results do not show people living in nursing facilities. However, to approximate the size of the residential care population relative to the total population, we used the 2008 and 2014 total population estimates from the ACS as the denominator in place of the total sum of the HRS weights. For this study, we excluded those ages 64 and younger.
The NHATS is designed to represent a cross-section of the Medicare population during the survey year, regardless of whether they resided in community or an institution. We used the NHATS analytic weight to correct for oversampling of the oldest-old and minority seniors to create a nationally representative sample, and we excluded those younger than 65.
Data from the NSLTCP survey were weighted to include a nationally representative sample of residential care providers and their residents (NCHS, 2015). Because these data were drawn from publicly available sources, we did not incorporate weights for this analysis; weights were drawn from aggregated output within publicly available sources.
2.3. Statistical Approach
2.3.1. Age-Standardization
Age-standardization eliminates the effects of the aging of the population, allowing us to understand how the characteristics of people residing in different residential settings have changed over time. To age-standardize, we calculated the prevalence of the characteristic of interest by age categories, multiplied each statistic by the proportion of the population in the respective age category of the baseline line year, then summed the products to produce an age-standardized prevalence estimate. To produce estimates that are comparable to estimates from 2002, we chose to standardize the MCBS and HRS estimates to the age distribution of the 2002 estimates for each survey, respectively (Spillman & Black, 2002). Specifically, we used the age distribution in each setting to standardize the health and functional limitations characteristics described below. To age-adjust the proportion of older adults residing in each setting, we used the age distribution of the entire sample from the 2002 HRS and MCBS results. To adjust for any change in the NHATS age distribution, we used the age distribution from 2011, the first year for which we had data, to age-adjust estimates for 2015.
2.3.2. Tests of Significance
To determine whether the age-standardized prevalence of selected characteristics are changing over time, we computed both t-tests and F-tests, depending on the outcome, between the baseline and each of the later years for the HRS, MCBS, and the NHATs. When there was not a 2002 estimate, we tested for whether the prevalence in the latest year of the survey was significantly different than the earliest year of the survey. We also compared the proportion of older adults within settings in each year with the baseline year. A difference in the prevalence of the health characteristic between years was determined to be statistically significant if the p-value was less than 0.05. To account for multiple comparisons within an outcome, we used a Bonferroni correction to the p-value threshold to determine statistical significance.
2.4. Defining Residential Settings
The ability to estimate the population living in different types of residential settings depends on how each survey defines those settings and the target population of the survey. Differences across surveys' definitions of residential settings and target populations have implications for interpretation of the data. Generally, surveys include one or more of three types of settings: traditional (non-institutional), community-based residential care (non-institutional), and facility-based residential care (institutional). Traditional settings refer to private homes; facility-based residential care refers to nursing facilities. All community-based residential care definitions include some type of residence other than a traditional private home or nursing facility that offers some mix of LTSS, such as help with bathing, washing, meals, and/or medication assistance. However, how those settings are defined varies by the survey.
To estimate the size and characteristics of the older adult population living in different types of residential settings, an understanding of the different definitions of each type of setting is necessary. Community-based residential care in particular may be defined in a variety of ways. In the literature on the size and characteristics of the older adult population, alternative residential care has different definitions, such as state licensed assisted living facilities (Caffrey et al., 2012) or facilities offering a defined set of LTSS (Freedman & Spillman, 2014), which has implications for population estimates. Assisted living facilities are commonly considered alternative residential care, yet these settings can vary by the type of services they offer (Stevenson & Grabowski, 2010), which can impact the disability and functional needs characteristics of the residents. The data presented in our analyses are drawn from surveys that vary in how residential care is defined: by the type of services offered, the way the setting is defined by the respondent or facility administrator, and state or local licensure. Exhibit 1 summarizes the definitions we used for each of these residential settings. Exhibit A-2 offers more detail about how each survey captures the types of services available for community-based residential care settings.
| EXHIBIT 1. Definition of Residential Care Settings by Survey | ||||
|---|---|---|---|---|
| HRS | MCBS | NHATS | NSLTCP | |
| Community-Based Residential Care | Respondents who reported that their residence helped with ADLs [OR] Who reported their residence did not help with ADLs but offered housekeeping, AND group meals, AND either emergency call button/checks on residents or nursing services. | Community interview. Person indicated residence was an assisted living facility; OR Person indicated residence was a retirement community, or senior citizens housing, or a continuing care community, or staged living community, or retirement apartments, or church-provided house, or a person or residential care home, or other type of residence AND they have access to help with meals, and housekeeping or laundry services, and medications. Facility interview. Includes residential settings described as a CCRC, or a retirement community, or assisted living, or board and care home, or domiciliary care facility, or a personal care facility, or rest home/retirement home, or independent living units, or adult/group home AND Has 3 or more beds AND Is certified by Medicaid or Medicare, or licensed as nursing facility or other long-term facility, or provides at least 1 personal care service, or provides 24-hour, 7-day a week supervision. Excludes facilities in which all beds are certified by Medicare or Medicaid, as those are counted as nursing facilities. | Community-based residential care residents were defined by NHATS interviewers as being eligible for both the SP interview and the FQ. Examples include group home/board and care/supervised housing, assisted living facility or CCRC, and religious group quarters. | RCFs must have been licensed, registered, listed, certified, or otherwise regulated by the state; have 4 or more licensed, certified, or registered beds; have at least 1 resident currently living in the facility; and must provide room and board with at least 2 meals a day, around-the-clock on-site supervision, and help with personal care, such as bathing and dressing, or health-related services, such as medication management. These facilities serve a predominantly adult population. Facilities solely licensed to serve individuals with mental illness or developmental disabilities exclusively were excluded. |
| Traditional Housing | Classified as anyone not included in one of the other setting types. For example, this includes people living in residences with no services or ADL support, as well as people who said their residence offered services such as housekeeping and group meals, but did not offer nursing services or have a way to check on residents. | Anyone who self-identified as residing in traditional housing; AND Anyone who reported residing in other types of housing, such as retirement apartments, but did not indicate the setting offered the combined assistance with medication, laundry, housekeeping and meal support. The setting could offer any one of these services, such as laundry and housekeeping and meal support, but not medication assistance. | Traditional housing residents were identified by NHATS interviewers to receive only the SP NHATS interview questions (i.e., no FQ was administered). | N/A |
| Nursing Facility | N/A | Defined as all facilities that self-identify as being a nursing facility. We further included facilities identified as a facility-based residential care setting and that reported that all beds were Medicare or Medicaid certified. | Nursing facility residents were those determined by NHATS interviewers to be eligible only for the FQ, not the SP. | Nursing facilities were excluded unless they had a unit or wing meeting the above definition and residents of those units could be separately enumerated. |
2.4.1. HRS Community-Based Residential Settings
Traditional housing. Any individuals who state they live in a retirement community, senior housing, or other housing providing services, but who do not report this combination of services, are classified as residing in traditional housing. All individuals not classified as living in a community-based residential care setting or other non-traditional housing were also considered living in traditional housing.
Community-based residential care. Individuals living in community-based residential care are identified by the question, "Is your house or apartment part of a retirement community, senior housing, or some other type of housing that offers services for older adults or someone with a disability?" If respondents answer yes to this question and report that their residence provides assistance with ADLs, they are classified as living in community-based residential care. They are also considered living in community-based residential care if the residence does not help with ADLs, but provides housekeeping, group meals, and either emergency call buttons or nursing services.
The HRS samples only people living in the community and sets sampling weights to zero for anyone living in a nursing facility during the time of their interview; we did not include nursing facility residents in this study.
2.4.2. MCBS Community and Facility Settings
Traditional housing. We defined individuals residing in traditional housing as those who responded that they lived in the community and did not live in assisted living facilities or other types of residential settings that provide assistance with meals, personal care, or other supports. Traditional housing also includes those residing in the community who reported that they lived in other types of housing other than a traditional home (i.e., continuing care retirement community [CCRC]), but did not report having access to help with meals, housekeeping or laundry, and medication assistance.
Community-based residential care. We defined individuals residing in community-based residential care as those who reside in the community, who self-identify as residing in an alternative setting, and report access to help with meals, housekeeping or laundry, and medication assistance. The alternative settings include retirement community, continuing care community, assisted living facility, personal or residential care home, senior citizens housing, and staged living community. As described in Exhibit 1, the MCBS definition of "facility" incorporates both nursing facilitiesand alternative residential care settings.[5] Those who completed a facility interview and identified they resided in CCRC, retirement community, assisted living, board and care home, domiciliary care facility, personal care facility, rest or retirement home, independent living units, and adult/group homes, where not all beds were Medicare or Medicaid certified, we classified as residing in community-based residential care.
Nursing facility. Those who resided in a facility identified as a nursing facility, or as an alternative facility setting identified above, in which all beds were certified Medicare or Medicaid, were included in the nursing facility estimates.
The MCBS tracks beneficiaries as they move from setting to setting during the year. For beneficiaries who resided in more than one type of setting in a given year, we assigned them to the residential setting in which they resided as of September 1 of that year, using the residential timeline to identify where they resided on that date. The residential timeline includes indicators for whether the beneficiary resides in the community or a facility (as defined by the MCBS). The 2013 MCBS does not include a provider number for each facility setting, so for beneficiaries with unverified residence types, we randomly assigned those individuals to a setting, based on the setting distribution for that year. Additionally, the fall survey sometimes did not correspond with the beneficiary's residential location (i.e., a beneficiary received a community survey when they resided in a nursing facility in September). For these beneficiaries, we assigned them to the residential setting in which they received the Fall Interview.
2.4.3. NHATS Community and Facility Settings
We used the NHATS residential care status information to define residential settings for this analysis. This variable relies on the interviewer to confirm the type of setting in which the interviewee resides.
Traditional housing. We defined traditional housing as any setting where the NHATS interviewer determined that the beneficiary should receive only the Sample Person (SP) NHATS interview, and not the Facility Questionnaire (FQ).
Community-based residential care. We classified beneficiaries as residing in community-based residential care if the NHATS interviewer identified the beneficiary as eligible for both the Sample Person interview and the Facility Questionnaire.
Nursing facility. We classified beneficiaries as residing in a nursing facility if it was determined by the NHATS interviewers that the resident was eligible only for the Facility Questionnaire. This approach is similar to other work where the Facility Questionnaire is used identify residential status (Freedman & Spillman, 2014).
2.4.4. NSLTCP Community-Based Residential Settings
The NSLTCP and its predecessor the NSRCF survey community-based RCFs. To be eligible for the NSRCF and NSLTCP studies, RCFs must have been licensed, registered, listed, certified, or otherwise regulated by the state; have four or more licensed, certified, or registered beds; have at least one resident currently living in the facility; and must provide room and board with at least two meals a day, around-the-clock on-site supervision, and help with personal care such as bathing and dressing or health-related services such as medication management. These facilities serve a predominantly adult population. Facilities solely licensed to serve persons with mental illness or developmental disabilities were excluded. Nursing facilities were also excluded unless they had a unit or wing meeting the above definition, and residents of those units could be separately enumerated.
2.5. Variables of Interest
Data from each survey were used to describe the characteristics of people living in each type of residential setting (traditional housing, community-based residential care, or nursing facility). Key variables of interest included demographics, health, and functional status. Demographic information included age, income, race, gender, education, and marital status. Health measures included general health status and some specific diagnoses. Functional status included measures of self-reported disability, number of limitations in ADLs, and limitations in IADLs. The availability and definition of these variables differed across surveys; these differences are noted below.
2.5.1. Disability
Functional limitations. The HRS, MCBS, and NHATS surveys captured limitations in up to six ADLs for those residing in the community (bathing, dressing, transferring (to or from bed or chair), walking, toileting, and eating). Both the NHATS and NSLTCP defined ADLs as having received assistance with the activity, while the other surveys captured whether the individual had difficulty with the activities. As a result, the NHATS and NSLTCP estimates of ADLs will be lower because not all people with difficulty receive assistance. The NHATS participants who resided in nursing facilities were not asked about ADLs.
Functional limitation also was measured by limitations in IADLs. For the MCBS and the HRS, we defined limitation in IADLS as having any difficulty preparing meals, shopping, telephoning, managing money, and taking medications (HRS only) for those residing in the community.[6] For those residing in a facility as defined by the MCBS (which can include nursing facilities or other community-based residential care), respondents are only asked about the level of difficulty using telephone, shopping, and managing money. The NHATS included both assistance with each IADL and whether a disability keeps the respondent from completing tasks. For this study, IADLs were identified based on whether the respondent reported receiving any assistance with IADLs in the past month. As a result, the IADL estimates from the NHATS may be greater than the HRS and the MCBS because of the 1-month look-back period. For all surveys, we defined the variable as a limitation in one or more IADLs.
Health Insurance Portability and Accountability Act (HIPAA) disability. In addition to identifying the number of ADLs and IADLs in residential care, we also included an indicator for the HIPAA definition of disability, defined as being unable to perform at least two ADLs[7] and requiring substantial supervision to protect the individual's health and safety due to severe cognitive impairment (Drabek & Marton, 2015). This definition of disability is used frequently by policy makers and insurers to determine benefit eligibility for LTSS services. In all surveys, we defined severe cognitive impairment as ever having a diagnosis of Alzheimer's disease or other dementia.
In addition to the ADLs included above, the HIPAA definition also identifies incontinence as an ADL. In the MCBS, we defined incontinence as having lost bladder control more than once a week, once a week, 2-3 times a month, or being catheterized in last 12 months. Bowel incontinence was not captured for those in the community, but was identified for those who completed the Facility Questionnaire; it was flagged if the resident was identified as anything other than continent. The HRS identified incontinence as having lost urine every day in the last month/more than 5 days in the last month/more than 15 days in the last month or having used a catheter, Depends, diaper, or pessary. Bowel incontinence was not included in the HRS definition. Incontinence was not captured in the NHATS data. As such, the MCBS may capture more adults with disability in community-based residential care and nursing facilities than the HRS or the NHATS. We did not include a disability indicator using the NSLTCP data.
2.5.2. Health Status
We present health status using the prevalence of several conditions, including hip fracture, chronic lung disease, stroke, diabetes, Alzheimer's disease and other dementia, mental health disorders, and arthritis. These conditions were identified for community residents in the HRS and MCBS, but only the MCBS captures these conditions for those residing in the facility. The NHATS includes only items for diabetes, hip fracture, arthritis, stroke, and lung disease. The MCBS and the HRS ask respondents if they have ever been told they have the respective condition. For the NHATS, the look-back period was "ever" in 2011. In 2015, the conditions identified were "in the past year" plus "reported previously in the NHATS data collection," except for stroke, which is only "in the past year." Most questions in the NSLTCP had an "ever" look-back period; a 12-month look-back period was included for stroke.
Definitions of some of these health conditions varied across surveys and across years within surveys. In the 2013 MCBS, respondents of the facility survey were asked if the resident has cerebrovascular accident (CVA)/transient ischemic attack/stroke, whereas the "CVA" language was not included in the facility survey in 2008, potentially resulting in higher stroke estimates in 2013. In the NSLTCP, only chronic obstructive pulmonary disease (COPD) is included as lung disease, whereas the MCBS, HRS, and NHATS include asthma and emphysema in addition to COPD.
The MCBS defines the presence of a mental health disorder based on whether the person had ever been told they have a mental disorder or whether they had depression. For those residing in a nursing facility, and some who reside in community-based residential care, we also include whether the person was bipolar or had schizophrenia; these variables are not available for people residing in the community.[8] The HRS defined a mental disorder as having significant depressive symptoms in the past week, based on receiving a score of 4 or higher on the HRS Center for Epidemiologic Studies Depression Scale, which ranges from 0-8. The NSLTCP reported on the prevalence of schizophrenia or psychosis. We did not include data on mental health from NHATS respondents due to a high non-response rate.
2.5.3. Income
For this analysis, we report household income as a dichotomous indicator greater than or equal to $15,000 per year, or below $15,000 per year. Household income was included, rather than individual income, because it is more reflective of the financial resources of the individual. We used a threshold of $15,000 because it is a close approximation of the federal poverty level for a family of two between 2008 and 2014.
The MCBS reports a categorical household indicator, which we used for our definition, but because there were many observations with missing household income values in the MCBS, we used the continuous income variable to supplement missing values and dichotomized based on our definition of less than or equal to $15,000. The NHATS reports a continuous income variable, where missing income values were imputed by the survey designers using Social Security, Supplemental Security Income, and Veterans Affairs pension, earnings, interest/dividends, and retirement accounts. No income information was available for those in a nursing facility. The HRS household income variable was continuous and self-reported.
3. WHERE PEOPLE LIVE
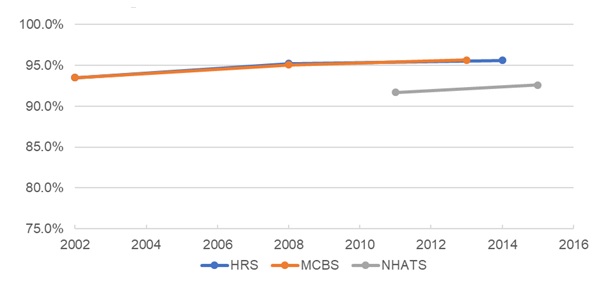
Exhibit 2 shows the number of individuals ages 65 and older by the type of setting in which they resided, by data source and year. Estimates of the number of older adults in the United States varied by dataset. The NHATs and the MCBS had the most similar estimates, which show the number of older adults grew from approximately 34 million in 2002 to 42 million in 2015. Estimates from the HRS are similar for the mid-point year (2008), but show a greater number of older adults, roughly 46 million, in 2014. All surveys indicate that most older adults resided in traditional housing. This was true for all years and studies, with very similar rates found in MCBS and HRS. The percentage of older adults residing in traditional housing increased slightly over time in all studies.
The estimated number of older adults in traditional housing increased from approximately 32 million in 2002 to 44 million in 2014. Each survey identified an increase between 5 and 11 million older adults from the earliest year of the survey to the latest year. Additionally, there was a consistent increase across surveys in the proportion of older adults residing in traditional housing over time. The MCBS documented a statistically significant increase from 93.5% to 95.7% from 2002 to 2013 (p0.01). A similar increase was observed in the HRS in years 2008 (p0.05) and 2014 (not significant), whereas there was a statistically significant, but less robust, increase identified in the NHATS (91.7-92.6 from 2011 to 2015) (p0.05).
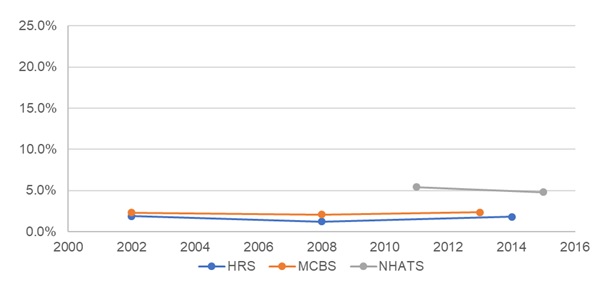
Each survey shows the number of people living in community-based residential care has increased over time. The number of individuals in these settings varies significantly across the surveys. For the most recent years, MCBS indicates 979,481 in these settings, while HRS reports many fewer (approximately 0.8 million), and NHATS reports many more (approximately 2 million). Data from the NSLTCP were generally consistent with the findings from the HRS.
However, there was no statistically significant change in the proportion of older adults residing in community-based residential care over time in either the MCBS, HRS, or the NHATs. Data from the MCBS show the share of the population living in community-based residential care was unchanged from 2.3% in 2002 to 2.3% in 2013, with a slight dip in 2008. Similarly, the HRS reported that the share of the population living in community-based residential care was fairly stable from 2002 to 2014, with a dip in the intermediate year. NHATS data showed a decline in the percent of the population living in community-based residential care from 2011 to 2015, but the size of the population and percentage of total population that it represented was greater than in either MCBS or HRS. The number of residents in community-based residential care per the 2010 NSRCF and the 2012 and 2014 NSLTCP show a slight decline in 2012 and a significant increase in 2014. These numbers are comparable to those found by the HRS, but are less than those reported by the other surveys (MCBS, NHATS). These differences likely reflect variation in setting definitions, rather than substantial population changes. In particular, the NSLTCP data capture only those residential settings that are licensed.
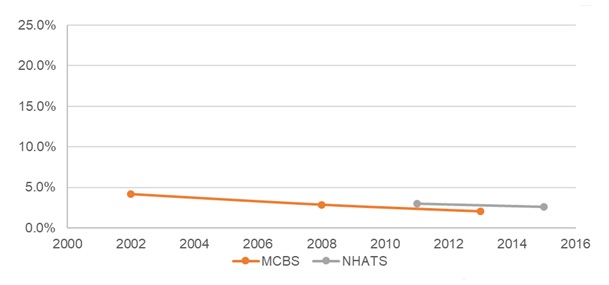
The number of older adults living in nursing facilities remained stable over time in the NHATS, even though the number has declined slightly as a percent of the older adult population. The MCBS reported a sharper decline in the percent residing in nursing facilities, from 4.2% in 2002 to 2.0% in 2013 (p0.01).
Differences in population estimates within setting types across the data sources are likely due to differences in how eligible facilities were defined for each survey. For example, the MCBS definition for community-based residential care includes criteria such as offering ADL or IADL support. The definition used for NHATS, by contrast, does not pose a similar criterion for offering ADL/IADL support. This difference causes the NHATS to include a greater proportion of older adults in community-based residential care than the MCBS.
In addition, the method for selecting a cross-section of the MCBS population impacted the total older adult sample, but disproportionately impacted the nursing facility sample, likely resulting in an undercount of the nursing facility population. For example, nursing facility residents accounted for 2.4% of the population in 2013 (weighted, not age-adjusted), but were 21.2% of the population who were excluded in 2013 (weighted, not age-adjusted). In both 2008 and 2013, the application of the exclusion criteria reduced the entire sample by about 4%, but reduced the sample of people residing in nursingfacilities by about 20%. However, including all beneficiaries residing in a nursing facility throughout the year, not just on September 1, did not impact these findings.
| EXHIBIT 2. Age-Adjusted Residential Population Estimates and Percentages of the 65 Years and Older Population by Housing Setting, Data Source, and Year | ||||||||
|---|---|---|---|---|---|---|---|---|
| Data Source | Year | Total | Housing Setting | |||||
| Traditional Housing | Community-Based Residential Care | Nursing Home | ||||||
| # | % | # | % | # | % | |||
| MCBS1 | 2002 | 34,347,619 | 32,120,018 | 93.5 | 781,982 | 2.3 | 1,445,619 | 4.2 |
| 2008 | 36,726,354 | 34,915,661 | 95.1** | 756,993 | 2.1 | 1,053,700 | 2.9** | |
| 2013 | 42,184,842 | 40,349,942 | 95.7** | 979,481 | 2.3 | 855,419 | 2.0** | |
| HRS2 | 2002 | 35,841,266 | 33,524,186 | 93.5 | 674,984 | 1.9 | --- | --- |
| 2008 | 38,812,253 | 36,934,841 | 95.2* | 475,710 | 1.2* | --- | --- | |
| 2014 | 46,214,893 | 44,171,963 | 95.6 | 835,060 | 1.8 | --- | --- | |
| NHATS3 | 2011 | 36,385,946 | 33,355,114 | 91.7 | 1,950,517 | 5.4 | 1,080,315 | 3.0 |
| 2015 | 41,789,316 | 38,696,907 | 92.6* | 2,005,887 | 4.8 | 1,086,522 | 2.6 | |
| NSLTCP4 | 2010 | --- | --- | --- | 733,300 | --- | --- | --- |
| 2012 | --- | --- | --- | 713,300 | --- | --- | --- | |
| 2014 | --- | --- | --- | 835,200 | --- | --- | --- | |
--- = not applicable. *p0.05, **p0.01.
| ||||||||
The graphs in Exhibit 3, Exhibit 4, and Exhibit 5 illustrate the change in the proportion of residents living in each of the three settings--traditional housing, community-based residential care, and nursing facilities--over time, and as reported by the different surveys.
| EXHIBIT 3. Change in the Proportion of the Older Adult Population Residing in Traditional Housing, by Year and Data Source |
|---|
 |
| EXHIBIT 4. Change in the Proportion of the Older Adult Population Residing in Community-Based Residential Care, by Year and Data Source |
|---|
 |
| EXHIBIT 5. Change in the Proportion of the Older Adult Population Residing in Nursing Homes, by Year and Data Source |
|---|
 |
All data sources show growth in the older adult population over time. The proportion of the older adult population residing in community-based residential care remained fairly stable over time within each of the surveys and was not statistically significantly different across years. That proportion was greater in the NHATS than in the MCBS and the HRS, in part because the NHATS incorporated a broader definition of community-based residential care, whereas the HRS and MCBS incorporated a setting label and whether ADL/IADL assistance was offered. Both the HRS and MCBS indicated some decrease in the proportion of the population residing in nursing facilities over time, with an increase in the proportion of people living in traditional housing.
The variation in the number of residents reported by the NSLTCP and NSRCF in these years largely reflects differences in the methods used to conduct the surveys. The NCHS assessed these differences between the 2010 NSRCF and the 2012 NSLTCP and concluded that they were largely related to survey design differences between 2010 and 2012. Specifically, overall screener-based eligibility dropped from 81.0% in 2010 to 67.1% in 2012, which mostly impacted providers with small bed size (NCHS, 2015). All surveys used the same eligibility criteria. However, the data collection modes differed: the 2010 NSRCF utilized interviewer-administered screening followed by in-person interview for eligible communities, whereas the 2012 NSLTCP primarily relied on respondent self-administered screening and questionnaires completed by mail or Internet. This resulted in differences in how the respondents who self-administered the questionnaire interpreted the eligibility questions, a probable reason for the eligibility differences between 2010 and 2012. For the 2014 NSLCTP, NCHS revised the eligibility question that asked whether the residential care community provided 24-hour supervision. Estimates for number of providers from the 2014 wave (30,200 providers) were comparable to the estimates from the 2010 NSRCF (31,100 providers), while the 2012 NSLCTP estimated 22,200 providers (Harris-Kojetin, 2013).
4. CHARACTERISTICS OF THE POPULATION BY RESIDENTIAL SETTING
This research examined the demographic, health, and functional status of individuals living in different types of residential settings. Below we summarize these findings. For more details on the populations in each setting (traditional housing, community-based residential care, and nursing homes), as well as characteristics of respondents from each survey by setting and across years, please refer to Exhibit A-3 and Exhibit A-4.
4.1. Demographics
4.1.1. Age
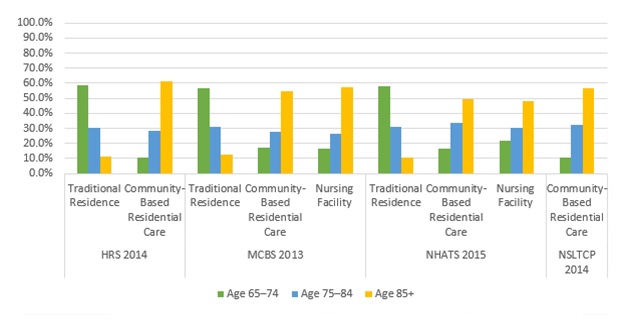
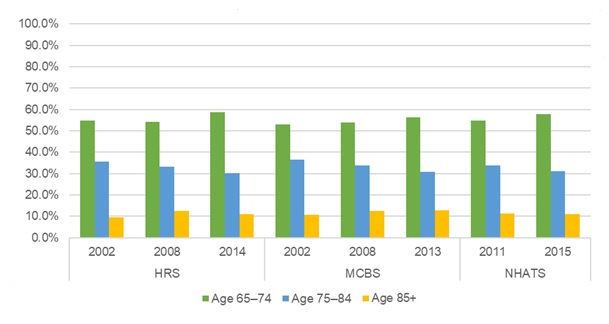
In all settings, across all data sources, people living in traditional housing were younger than those living in other settings (Exhibit 6). For the most recent years of data available, among older adults living in traditional housing, approximately half of all older adults represented were ages 65-74, with the oldest-old (85 and older) representing the smallest percentage (approximately 9%-13%, depending on dataset). The age distributions of older adults living in community-based residential care were comparable to those living in nursing facilities. In both settings, and across data sources, approximately half of residents were aged 85 and older in the latest year of the survey.
| EXHIBIT 6. Age Distribution by Residential Setting and Data Source |
|---|
 |
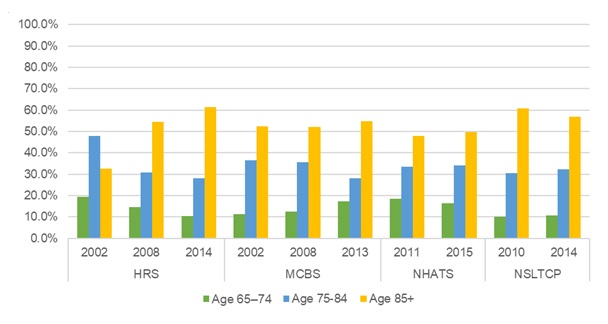
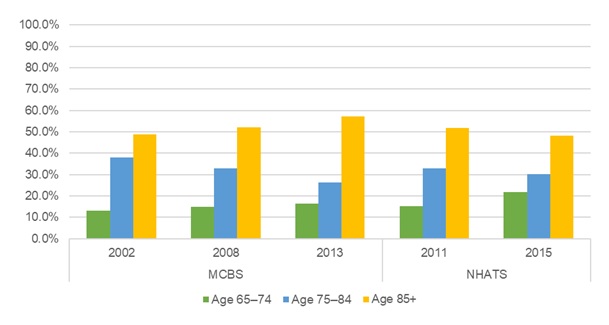
Age distribution also was consistent over time by individuals' residential type as presented below for traditional housing (Exhibit 7), community-based residential care (Exhibit 8) and nursing facilities (Exhibit 9). The proportion of younger seniors (65-74) increased slightly for traditional housing, while the proportion of the oldest-old (85 and older) increased slightly for both community-based residential care and nursing facility residents with a couple exceptions. The NSRCF/NSLTCP and NHATS show slight decreases in the proportion of the oldest-old in community-based residential care and nursing facilities, respectively.
| EXHIBIT 7. Traditional Housing: Age Distribution over Time by Data Source |
|---|
 |
| EXHIBIT 8. Community-Based Residential Care: Age Distribution over Time by Data Source |
|---|
 |
| EXHIBIT 9. Nursing Facility: Age Distribution over Time by Data Source |
|---|
 |
4.1.2. Gender
Women comprised more than half the population across settings and datasets, representing 55%-57% of older adults living in traditional housing, 66%-75% of those in community-based residential care, and 71%-74% of those in nursing facilities. These percentages remained consistent over time (see Exhibit A-3).
4.1.3. Race and Ethnicity
Among people living in traditional settings, both the MCBS and HRS found that 85%-89% of older adults were White; this proportion was slightly less in the NHATS data (78%-80%). These percentages decreased very slightly over time. A somewhat higher proportion of those living in community-based residential care were White. The percentage of community-based residential care residents who were White declined slightly over time in the MCBS, NHATS, and the NSRCF/NSLTCP, but increased somewhat in the HRS survey. The racial distribution among nursing facility residents was similar to that of people in traditional settings (see Exhibit A-3).
Notably, older adults living in traditional housing were more likely to be Hispanic (7%-10%) than those who were living in other settings. People living in community-based residential care were the least likely to be Hispanic (1%-5%).
4.1.4. Education
For all datasets in traditional housing and community-based residential care, there was an increase in the proportion of individuals with some college or higher level of education over time. However, level of education varied by dataset and by residential setting. Among those living in traditional residences, slightly less than half (HRS, MCBS) to somewhat more than half (NHATS, 56%) of people had some college or higher level of education in the most recent years for which data were available. This level of education was less common among people living in community-based residential care, when measured by the MCBS (39%) or NHATS (50%). However, the HRS reported a much larger proportion of people in community-based care with a college level education (63% in 2014). This difference is likely due to a broader definition of community-based residential care in the HRS relative to the MCBS.
Data on educational level for nursing facility residents were available only from the MCBS. That survey found much lower levels of education among nursing facility residents than for people living in other settings, with less than 20% of nursing facility residents reported to have any college level education. However, findings from the MCBS should be interpreted with caution, because educational level was not reported for large numbers of people residing in nursing facilities.
4.1.5. Marital Status
Marital status varied greatly across residential settings. Among those living in traditional housing, most respondents (about 55%-60%) were married/partnered, with widow(er)s being the second largest group (about 21%-32%). These findings were consistent across data sources and over time. In contrast, for the community-based residential care and nursing facility populations, more than half were widowed, and about a quarter were married across datasets.
The HRS data included more married individuals living in community-based residential care settings compared to MCBS, NHATS, and NSLTCP. The HRS and NHATS definitions of "married" combine married or partnered, whereas the MCBS and NSLTCP only identifies whether the person was married. This difference may explain why the HRS and NHATS have greater percentages of people married in traditional housing and community-based residential care. Over time, there was an observable decline in the percentage of older adults who were widowed and residing in traditional housing. This decline was generally not observed in other settings, although the MCBS reported a decline in widows from 2002 to 2013 (60%-53%) among older adults residing in community-based residential care.
4.1.6. Income
Across datasets and time, older adults in traditional housing tend to have more financial resources than those living in community-based residential care or nursing facilities. Individuals with an annual household income at or below $15,000 comprised around 13%-21% of older adults in traditional housing and around 17%-38% of older adults in community-based residential care. Income of nursing facility residents was only reported in the MCBS, where the proportion of residents with incomes at or below $15,000 was approximately 40%. The percentage of those reporting at or below $15,000 declined over time among those in traditional housing and community-based residential care, in all datasets (see Exhibit A-3).
4.2. Health and Functional Status
The following results have been age-standardized to the age distribution of the 2002 sample for MCBS and HRS, and the 2011 sample for NHATS. Age-standardization allows one to observe changes in health and functional status characteristics of people in each setting over time, while controlling for changes in the age of the people living in these settings. We also computed F-tests to determine statistical significance between the prevalence in later years to the baseline year within each setting and survey.
4.2.1. Functional Limitations
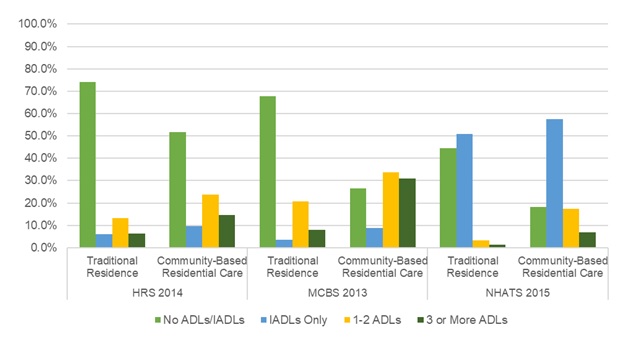
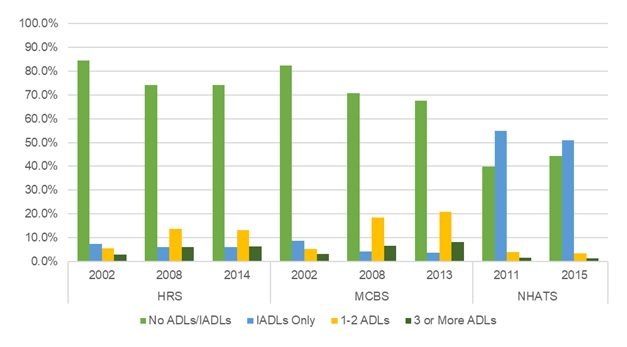
For the most recent years in which data were available, a large majority of individuals living in traditional housing were free from ADL or IADL limitations, as reported by both the HRS and MCBS. In contrast, fewer than 50% of NHATS respondents in traditional housing were free of ADL and IADL limitations; more than 50% reported IADL challenges, but no ADL limitations. This may be in part due to how the NHATS includes a 1-month look-back period for having received any assistance with IADL limitations.
The distributions of functional limitations among those living in community-based residential care in recent years were more varied across data sources. In all cases, when compared with people in traditional residences, those in community-based residential care were much more likely to report ADL or IADL limitations. However, the number and type of limitations they reported varied considerably by data source. The HRS and MCBS data reported similar percentages of people with IADL limitations only or with 1-2 ADL limitations; however, the MCBS data showed a much larger percentage of people with three or more ADL limitations. By contrast, when compared to the other data sources, the NHATS data showed a larger percentage of people in community-based residential care with only IADL limitations (Exhibit 10).
| EXHIBIT 10. ADL and IADL Limitations among Traditional Housing and Community-Based Residential Care Using the Most Recent Data for Each Source |
|---|
 |
These differences between datasets are likely due to differences in how these data are collected. Although our analyses included only the variable related to receipt of assistance, this NHATS item followed a much more detailed NHATS interview discussion and other variables related to limitations. Because of the broader conversation, respondents may self-report more difficulties than participants in other datasets who are asked just one question about a given ADL or IADL limitation.
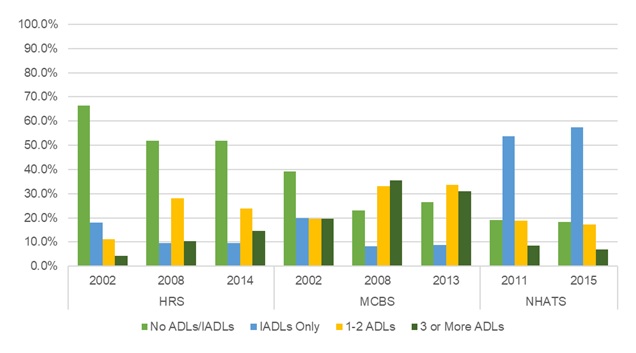
Over time there was a statistically significant increase in the estimated age-adjusted proportion of individuals with ADL limitations in traditional housing (Exhibit 11), but not in community-based residential care settings (Exhibit 12). Among those in traditional housing, the MCBS indicated a statistically significant decline in the percentage of people with no ADL or IADL limitations from 2008 to 2013 (p0.01). A decline in the percentage of people reporting no ADL or IADL limitations was observed in the HRS, but it was not statistically significant. The NHATS showed a statistically significant increase in the percentage of older adults with no ADL/IADL limitations from 2011 to 2015 (p0.01). The distributions are most similar for the HRS and MCBS data. The NHATS data show a much smaller percentage of people with no limitations, as discussed previously. Among those living in community-based residential care, fewer individuals had no limitations. The HRS and MCBS data show roughly similar percentages of people in each year who have only IADL limitations or 1-2 ADL limitations. There was a slight uptick in the percentage reporting no ADL/IADL in the MCBS from 2008 to 2013 (23%-27%), but this percentage is still below 2002 values (39%) and not statistically significant. The NHATS data show little change over time in the functional status of people living in community-based residential care. In both years, the NHATS data show many more people with IADL limitations than do the other data sources.
| EXHIBIT 11. Traditional Housing Residents: ADL and IADL Limitations over Time by Data Source |
|---|
 |
| EXHIBIT 12. Community-Based Residential Care Residents: ADL and IADL Limitations over Time by Data Source |
|---|
 |
4.2.2. Self-Reported Health and Medical Conditions
Among older adults living in traditional housing, most were in excellent/very good/good health. Depending on the dataset and year, this ranged from approximately 70%-82% of residents. In each dataset, the percentage reporting this level of health was generally stable over time, though there were small but statistically significant increases between 2002 and 2013 in the MCBS (p0.05), between 2002 and 2014 in the HRS (p0.01), and between 2011 and 2015 in the NHATS (p0.05).
Those living in community-based residential care were also generally in good health, although the proportion was smaller than those in traditional housing (approximately 61%-73%, depending on the dataset and year). The percentage of community-based residential care residents in good health increased over time in the HRS data. However, there were small declines in the MCBS and NHATS data, neither of which was statistically significant. The difference in the observed trend is likely due to the broad HRS definition of community-based residential care, which includes individuals in community-based residential care who would have otherwise been assigned to traditional housing using the MCBS definition.
Residents of nursing facilities were typically less healthy than residents of other settings, with the majority self-reporting as being in fair/poor health. The age-adjusted percent of nursing facility residents reporting excellent/very good/good health declined over time, from 33% to 29%; this decline was not statistically significant.
Exhibits 13-18[9] show the age-adjusted prevalence of health conditions over time by setting and data source. Most of the health conditions measured increased over time among those in traditional housing, in each dataset. In all settings and in each data source, diabetes and lung disease increased over time (Exhibit 13 and Exhibit 17). In all data sources, arthritis was the most prevalent condition in traditional housing and community-based residential care. Diabetes was most prevalent among older adults in nursing facilities relative to other settings.
The prevalence of hip fracture (Exhibit 14) was greatest in community-based residential care in the NHATS and MCBS, compared to other settings. The prevalence of hip fracture appears to have been stable in all settings, except in the NHATS data which showed a small but statistically significant decline in hip fractures in traditional housing (p0.01), and a slight non-significant increase in hip fractures for people living in community-based residential care.
The HRS data shows stroke was more prevalent in community-based residential care (HRS) than traditional housing. The MCBS data, which includes nursing facility residents, shows stroke was more prevalent in nursing facilities than other settings (Exhibit 16). The NHATS reported declines in the prevalence of stroke over time for older adults in traditional housing (p0.05) and community-based residential care, but this decline was not statistically significant. The MCBS and HRS both reported a statistically significant decline in the prevalence of stroke in traditional housing in both 2008 and the most recent year of the HRS and MCBS (p0.01). There was a slight non-significant increase in stroke in community-based residential care from 2002 to 2013 and 2014 for both the MCBS and HRS, respectively. Among older adults in nursing facilities, the prevalence of stroke declined overtime, but this observed trend was not statistically significant.
Differences in trends for hip fracture and stroke between surveys are likely the result of how the data are collected and how the setting are defined. For example, for some respondents in community-based residential care, the MCBS identifies whether the person has the condition concurrently (i.e., "SP has a hip fracture"), whereas the NHATS identifies whether the person ever had the condition (i.e., "Since age 50 has a doctor told you"). This difference would likely result in a lower prevalence estimate in the MCBS among respondents in community-based residential care.
The prevalence of arthritis increased over time among those in traditional housing in all surveys, but there was a statistically significant difference between the baseline and each later year in only the NHATS and the HRS (p0.05). There was no discernible pattern evident among those in community-based residential care across surveys, and a small non-significant decline among those in nursing facilities (Exhibit 15). In traditional housing, 57%-70% of older adults had arthritis in the most recent year of each survey. In community-based residential care 75% of older adults were diagnosed with arthritis in the HRS, whereas only 50% (MCBS) and 61% (NHATS) were diagnosed in other surveys during the latest year of each survey. Older adults in nursing facilities were less likely to have arthritis relative to other settings.
MCBS is the only dataset that reported in an increase in mental health disorders and depression over time, in all settings (Exhibit 18). There was a statistically significant increase in the prevalence of mental health disorders between the baseline year and the later years in traditional housing and community-based residential care, and between the baseline year and 2008 among older adults in nursing facilities (p0.05). The HRS and NSLTCP reported a decline in the prevalence mental disorder and depression among those in community-based residential care from 22% to 12% from 2002 to 2014, respectively, in the HRS (p0.01), and from 28% to 23% from 2010 to 2015 in the NSLTCP. This difference may result from differences in how the surveys define these variables and collect the data. The HRS uses a depression scale and identifies whether depressive symptoms occurred in the past week, whereas the MCBS identifies whether the participant has ever been told they have depression, mental disorder, or identified as having bipolar depression or schizophrenia. Furthermore, the MCBS prevalence estimates in community-based residential care and nursing facilities may include assessment-based results, such as the Minimum Data Set, and may be more reliable than self-reported findings.
| EXHIBIT 13. Prevalence of Diabetes over Time among Individuals Living in Different Residential Settings |
|---|
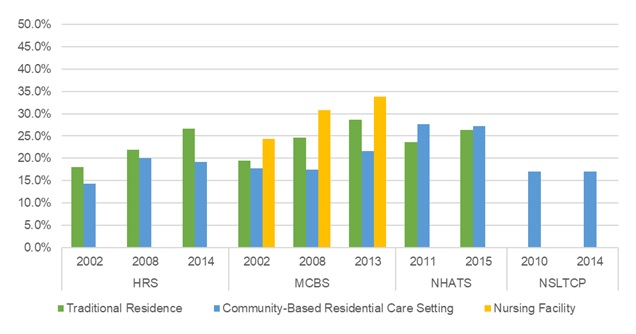 |
| EXHIBIT 14. Prevalence of Hip Fracture over Time among Individuals Living in Different Residential Settingss |
|---|
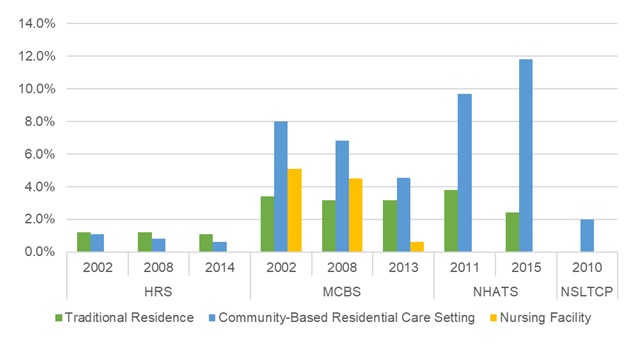 |
| EXHIBIT 15. Prevalence of Arthritis over Time among Individuals Living in Different Residential Settings |
|---|
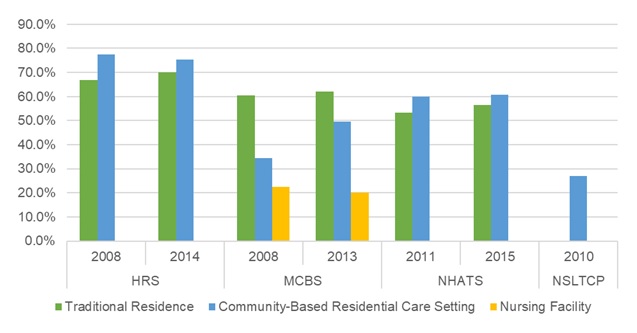 |
| EXHIBIT 16. Prevalence of Stroke over Time among Individuals Living in Different Residential Settings |
|---|
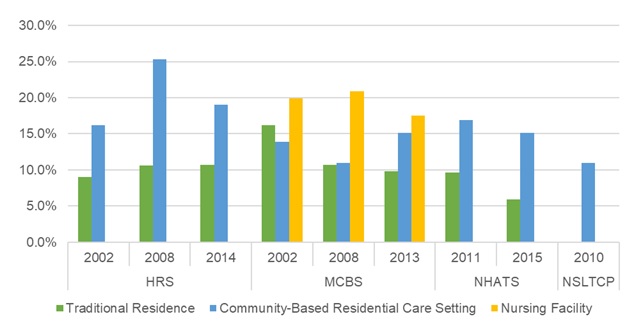 |
| EXHIBIT 17. Prevalence of Lung Disease over Time among Individuals Living in Different Residential Settings |
|---|
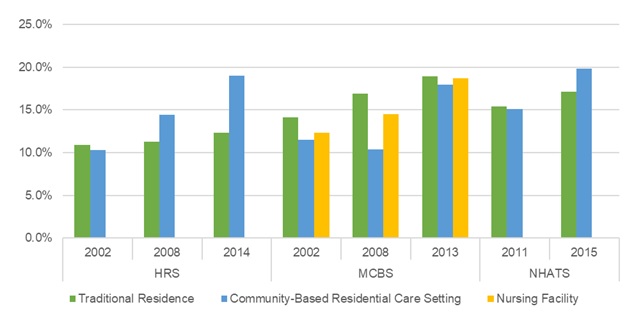 |
| EXHIBIT 18. Prevalence of Mental Disorder/Depression over Time among Individuals Living in Different Residential Settings |
|---|
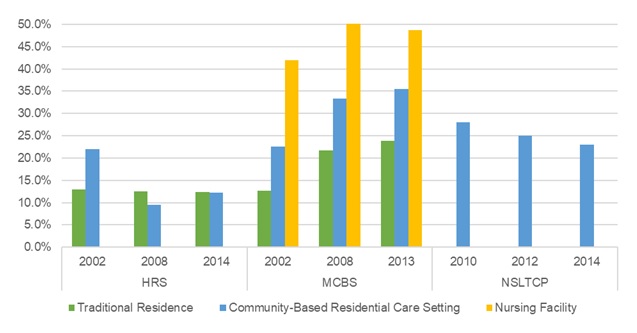 |
4.2.3. Alzheimer's Disease and Other Dementia
Data presented in Exhibit 19 show that prevalence of dementia was greater among those living in community-based residential care than those living in traditional housing and was greatest among those living in nursing facilities. The prevalence of dementia generally has been increasing over time, relative to the baseline year, except in the NSLTCP data, where the rates of dementia among people living in community-based residential care were much higher than in other data sources and were consistent over time. There were statistically significant increases in the prevalence of dementia among those in traditional housing each year in the HRS and the MCBS. However, only the 2014 HRS reported a statistically significant increase in dementia among those in community-based residential care. The discrepancy between data sources in the prevalence of Alzheimer's or dementia in community-based residential care may reflect the difference in the types of residential care settings included in the data sources.
Similar to most comorbidities, there was a low prevalence of Alzheimer's disease and other dementia among traditional housing residents; 2.3%-5.8% regardless of time or data source. However, community-based residential care residents had higher rates of dementia with tremendous variation across years and datasets (only 5% in the HRS in 2002, but as much as 42% in the NSLTCP in 2010). Some variation in dementia reporting may stem from the data collection methods employed by each dataset, such that a simple question about dementia diagnoses (NHATS)[10] that relies on self-reported responses from participants may be less accurate than a full panel of dementia screening questions asked of each participant. Because the facility interview in the MCBS incorporates assessment data to capture comorbidities such as dementia, the MCBS may have a more accurate reflection of the prevalence of our selected conditions including dementia, specifically for those in the nursing facility setting.
| EXHIBIT 19. Prevalence of Alzheimer's Disease or Other Dementia over Time among Individuals Living in Different Residential Settings |
|---|
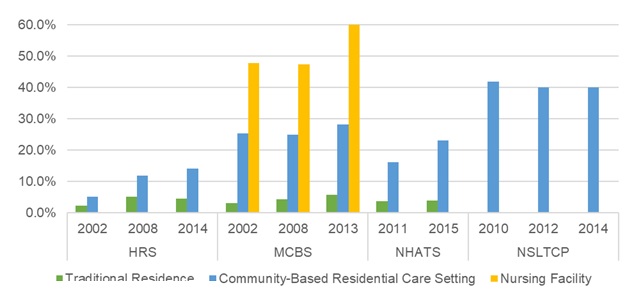 |
4.2.4. HIPAA-Defined Disability
The HIPAA disability variable combines measures of functional status and cognition, and is a definition of disability frequently used by policy makers. Among traditional housing residents, the MCBS reported 4%-6% HIPAA disability, compared to 11%-14% in the HRS, and 7%-10% in NHATS. The variation across datasets was much greater for those living in community-based residential care; the prevalence of HIPAA disability ranged from 22% in 2014 (HRS) to 42% in 2013 (MCBS). These differences likely result from the different ways in which the underlying measures are defined in each of the surveys and differences in setting definitions. For example, the HRS includes a more restrictive definition of incontinence (i.e., every day in the past month) than the MCBS, identifying a smaller proportion of the population meeting the disability definition. Both the HRS and NHATS reported a statistically significant decline in the prevalence of disability in traditional housing (p0.01), and a decline in disability among those in community-based residential care over time, but it was not statistically significant. The prevalence of disability reported in the MCBS was stable in all settings, though there was a small statistically significant increase from 2008 to 2013 among those in traditional housing (p0.01). Despite variations across datasets, more individuals in community-based residential care met the HIPAA disability criteria than those living in traditional housing, and nursing facility residents met the criteria most often (Exhibit 20).
| EXHIBIT 20. Prevalence of HIPAA-Defined Disability among Individuals Living in Different Residential Settings |
|---|
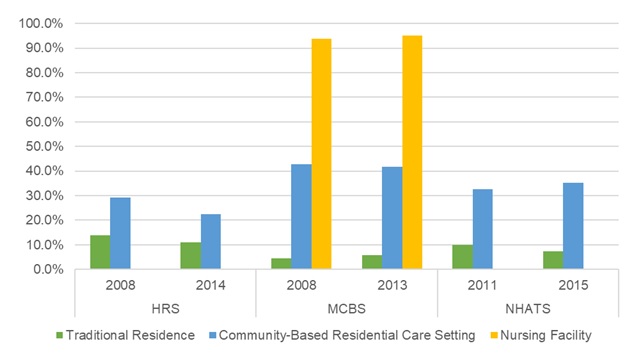 |
5. DISCUSSION AND CONCLUSION
5.1. Discussion
This report builds upon prior work, focusing on where older adults live and how their needs differ by residential setting type (i.e., traditional housing, community-based residential care, and nursing facilities). It also examines how the demographics, health, disability, and functional status for these residential populations have changed over time. Understanding the characteristics and health care needs of people living in these different settings, and how they have changed over time provides important information for developing responsive systems of care.
5.1.1. Population by Setting
The size of the older adult population (ages 65 and older) in the United States has increased over time. In 2002, there were approximately 34 million older adults. By 2014, that number had increased to roughly 42-45 million. The number of people residing in traditional housing and community-based residential care has grown with the population.
This report finds the proportion of older adults residing in traditional housing is increasing over time (∼93% in 2002 to ∼96% in 2013/2014), and that the proportion of older adults residing in community-based residential care has remained stable from 2002 to 2013/2014 (HRS and MCBS), or declined slightly from 2011 to 2015 (NHATS). A corresponding statistically significant decline in the proportion of older adults in nursing facilities was also observed in the MCBS (p0.01), and a non-significant decline was observed in the NHATS. These findings are consistent with other work documenting the decline in the use of institutional LTSS (Spillman & Black, 2005; Degenholtz et al., 2016), but stands in contrast to work suggesting a growing role for community-based residential care (Spillman & Black, 2005; Grabowski, Stevenson, & Cornell, 2012; Freedman & Spillman, 2014).
5.1.2. Demographic Characteristics
In general, the demographic characteristics of residents were similar across years and across datasets. People living in traditional housing were younger and had higher incomes than those living in other settings. Notably, the age distributions of older adults living in community-based residential care were comparable to the age distributions of those living in nursing facilities. In both settings, roughly half of all residents were age 85 or older. This percentage increased slightly over time for those living in community-based residential care settings. In addition, while there was a small increase in the percentage of those earning $15,000 or more a year among those in community-based residential care, there was a decline among those in nursing facilities. These findings suggest that people may be remaining in their homes longer (at more advanced ages) before moving into a community-based residential care setting and utilizing the available LTSS. Older adults with more financial resources may be using community-based residential care if they have the income to afford, or private insurance that covers, LTSS provided in non-nursing facility settings (Brown & Finkelstein, 2011; Stevenson & Grabowski, 2010).
Older adults residing in community-based residential care are becoming more racially diverse. While White older adults are a large majority of those residing in these settings, each dataset demonstrated an increase in non-White minority populations. This trend highlights the importance of monitoring potential racial and ethnic disparities in community-based residential care and nursing facilities (Feng et al., 2011).
Older adults living in community-based residential care were more likely to be widowed than were those living in traditional housing, many of whom were married. Only in the MCBS did the percent of widowed residing in community-based residential care decline from 2002 to 2013, although this corresponded with an increase in the proportion who were divorced or separated. To the extent that people living in traditional housing have support needs similar to those of people living in other settings, these findings highlight the importance of spouses as primary caregivers to community-dwelling adults with functional needs (Wolff et al., 2017).
5.1.3. Health and Functional Status
Older adults living in traditional housing generally were healthier and had fewer functional impairments than people living in other types of settings. However, the proportion of older adults with functional limitations increased over time among older adults in traditional housing in two surveys (MCBS and HRS). This trend was observed in community-based residential care in all data sources, and among those in nursing facilities, but the rates of functional impairment differed between the data sources, with the MCBS data suggesting a much greater prevalence of ADL impairment than was found in the HRS by year and setting. This difference is likely due to how the MCBS samples the institutional population, as well as the community-dwelling population. Some people residing in an MCBS-defined "institution" were categorized as residing in community-based residential care in our analysis. By contrast, the HRS samples only community-dwelling older adults, not the institutional population, which may explain why the HRS sample has fewer ADL and IADL needs relative to the MCBS sample.
Across all surveys, the health status of older adults across all settings was generally consistent. Most older adults reported being in good health, and this trend was stable over time. The most prevalent health conditions across settings and over time were arthritis and diabetes. The age-adjusted prevalence of some health conditions measured increased over time, while others declined depending on the data source and setting. For example, we observed that diabetes and lung disease increased over time in all residential settings and data sources studied, though not all changes were statistically significant. In contrast, the prevalence of hip fracture was stable or declined over time in all residential settings and all surveys, with the exception of NHATS. As expected, there was a higher prevalence of HIPAA-defined disability in community-based residential care compared to the prevalence in traditional housing, and there did not appear to be any meaningful trend across years and surveys. These comparisons are limited, however, due to the variation in how the surveys capture items used to construct this disability definition.
The prevalence of Alzheimer's disease and other dementias was somewhat lower than expected based on recent work (Langa et al., 2017). Langa et al. found that about 8.8% of the community-dwelling people 65 years and older had dementia in 2012, a decline from 2000. Our analysis indicated that while age-adjusted prevalence of Alzheimer's or other dementia grew over time in all settings and all data sources, the prevalence in traditional housing was lower than estimates identified in Langa et al. (2017).
5.1.4. Considerations of Sample Size
Small sample size likely resulted in a lack of power to detect statistically significant differences in health and functional characteristics over time among older adults residing in community-based residential care and nursing facilities. For example, there was a 3.4 percentage point difference in the percent of older adults in community-based residential care with no ADL/ADLs from 2008 to 2013 in the MCBS. This difference is notable, but the number of respondents in the community-based residential care was such that there was only 0.16 power to detect a statistically significant difference of this magnitude.
5.1.5. Considerations of Survey Differences
Each dataset has implications for estimating the characteristics and size of the residential care population. The MCBS, HRS, and NHATS all sample individuals living in the United States though their populations are slightly different. The HRS includes a nationally representative sample of community-dwelling Americans age 50 and older, while the MCBS and NHATS include representative samples of the Medicare population. The NHATS targets the alive and enrolled Medicare population from October of the year prior to the survey, whereas the MCBS includes multiple enrollment time frames to represent the ever-enrolled Medicare population of during the survey year. The NSLTCP, in contrast, samples licensed community-based RCFs.
The NSLTCP presents population estimates for community-based residential care but is limited in describing the characteristics of the resident population, as it does not capture key health characteristics and reports aggregated descriptions of the residents of the selected facilities. Other datasets, such as the MCBS and HRS, can be used to define community-based residential care based on what services are offered, regardless of licensure. The NHATS data show a larger community-based residential care population than the MCBS, NSLTCP, and HRS since the estimates are based on a broader definition of community-based residential care; a respondent can be identified as residing in a community-based residential care setting if they self-reported receiving group meals or help with medications. By contrast, the MCBS and HRS definitions required a collection of services to be offered. Our findings suggest that surveys that capture a mix LTSS services offered within a setting, in addition to type of residence, can reliably capture residential care estimates beyond assisted living facilities or facilities regulated by state agencies.
Researchers should consider differences in data collection strategies across surveys when determining the source to use for any analysis. We found health characteristics of older adults could vary significantly by data source. For example, the MCBS captures health characteristics for those in nursing facilities, and for many in community-based residential care, through administrative data such as the Minimum Data Set or medical records, which are completed by a provider. By contrast, the NHATS and HRS include self-reported information on health characteristics such as functional limitations. As such, the MCBS may reflect a more clinically accurate description of the nursing facility and community-based residential care populations.
Other differences in the size and trend of the residential care population by setting may be explained by methodological decisions specific to this analysis. For example, the MCBS estimate of the nursing facility population is likely an under-estimation of the population; by selecting a cross-sample for those enrolled and alive during September 1 of the survey year, we reduced the MCBS nursing facility sample by 268,433 and 220,014 weighted observations for 2008 and 2014 respectively. In addition, to produce comparable setting estimates to the MCBS and NHATS, we use the ACS 1-year estimates as a denominator for the HRS which resulted in larger frequencies in the HRS relative to the MCBS and NHATS, but similar percentages across settings.
5.2. Conclusion
Despite these differences, findings from each of these datasets present a consistent conclusion. As the population of older Americans continues to increase, there may be a growing role for providing services and supports at home, in particular for those with Alzheimer's disease and other dementia, non-Whites, and those who are single or divorced. The number of older adults living in community-based residential care settings is increasing, but the proportion of older adults in these settings has remained stable. Even so, the health and functional needs of those residents are increasing.
Furthermore, this research found a rise in older adults living in traditional housing despite evidence of increasing cognitive and functional limitations. The proportion of the population living in nursing facilities, however, continues to decline. Although the decline in nursing home use is reflective of a shift towards home and community-based care, further research is needed to better understand whether older adults can access all needed services at home, as well as institutional care when needed.
6. REFERENCES
Brown, J.R., & Finkelstein, A. (2011). Insuring long-term care in the United States. Journal of Economic Perspectives, 25(4), 119-142.
Caffrey, C., Sengupta, M., Park-Lee, E., Moss, A., Rosenoff, E., & Harris-Kojetin, L. (2012). Residents Living in Residential Care Facilities: United States, 2010. NCHS Data Brief No. 91. Hyattsville, MD: National Center for Health Statistics. Retrieved from https://www.cdc.gov/nchs/data/databriefs/db91.pdf.
Centers for Medicare & Medicaid Services (CMS). (2013). 2013 Cost and Use. Retrieved from https://www.cms.gov/Research-Statistics-Data-and-Systems/Research/MCBS/Codebooks-Items/2013_Cost_and_Use.
Courtney-Long, E.A., Carroll, D.D., Zhang, Q.C., Stevens, A.C., Griffin-Blake, S., Armour, B.S., & Campbell, V.A. (2015). Prevalence of disability and disability type among adults--United States, 2013. MMWR Morb Mortal Wkly Rep, 64(29), 777-783.
Degenholtz, H.B., Park, M., Kang, Y., & Nadash, P. (2016). Variations among Medicare beneficiaries living in different settings: Demographics, health status, and service use. Research on Aging, 38(5), 602-616.
Drabek, J., & Marton, W. (2015). Measuring the Need for Long-Term Services and Supports. U.S. Department of Health and Human Services, Office of the Assistant Secretary for Planning and Evaluation. Retrieved from https://aspe.hhs.gov/basic-report/measuring-need-long-term-services-and-supports-research-brief.
Eiken, S., Sredl, K., Saucier, P., & Burwell, B. (2015). Medicaid Long-Term Services and Supports Beneficiaries in 2011. Retrieved from https://www.medicaid.gov/medicaid/ltss/downloads/ltss-beneficiaries-rep….
Favreault, M., & Dey, J. (2016). Long-Term Services and Supports for Older Americans: Risks and Financing. U.S. Department of Health and Human Services, Office of the Assistant Secretary for Planning and Evaluation. Retrieved from https://aspe.hhs.gov/basic-report/long-term-services-and-supports-older-americans-risks-and-financing-research-brief.
Feng, Z., Fennell, M.L., Tyler, D.A., Clark, M., & Mor, V. (2011). Growth of racial and ethnic minorities in US nursing homes driven by demographics and possible disparities in options. Health Affairs, 30(7), 1358-1365. Retrieved from https://www.healthaffairs.org/doi/full/10.1377/hlthaff.2011.0126.
Freedman, V.A., & Spillman, B.C. (2014). The residential continuum from home to nursing home: Size, characteristics and unmet needs of older adults. Journals of Gerontology: Series B, 69(Suppl 1), S42-S50. doi.org/10.1093/geronb/gbu120.
Freedman, V.A., Spillman, B.C., Andreski, P.M., Cornman, J.C., Crimmins, E.M., Kramarow, E., Lubitz, J., Martin, L.G., Merkin, S.S., Schoeni, R.F., Seeman, T.E. & Waidmann, T.A. (2013). Trends in late-life activity limitations in the United States: An update from five national surveys. Demography, 50(2), 661-671.
Grabowski, D.C., Stevenson, D.G., & Cornell, P.Y. (2012). Assisted living expansion and the market for nursing home care. Health Services Research, 47(6), 2296.
Harris-Kojetin, L., Sengupta, M., Park-Lee, E., & Valverde, R. (2013). Long-term care services in the United States: 2013 overview. National Center for Health Statistics. Vital Health Stat, 3(37). Retrieved from https://www.cdc.gov/nchs/data/series/sr_03/sr03_037.pdf.
Harris-Kojetin, L., Sengupta, M., Park-Lee, E., Valverde, R., Caffrey, C., Rome, V. & Lendon, J. (2016). Long-term care providers and services users in the United States: Data from the National Study of Long-Term Care Providers, 2013-2014. National Center for Health Statistics. Vital Health Stat, 3(38).
Health and Retirement Study, public use dataset. (2008, 2014). Produced and distributed by the University of Michigan with funding from the National Institute on Aging (grant number NIA U01AG009740). Ann Arbor, MI.
Hebert, L.E., Weuve, J., Scherr, P.A., & Evans, D.A. (2013). Alzheimer disease in the United States (2010-2050) estimated using the 2010 Census. Neurology, 80(19), 1778-1783.
Keenan, T.A. (2010). Home and Community Preferences of the 45+ Population. AARP. Retrieved from https://assets.aarp.org/rgcenter/general/home-community-services-10.pdf.
Khatutsky, G., Ormond, C., Wiener, J.M., Greene, A.M., Johnson, R., Jessup, E.A., Vreeland, E., Sengupta, M., Caffrey, C., & Harris-Kojetin, L. (2016). Residential Care Facilities and Their Residents in 2010: A National Portrait. DHHS Publication No. 2016-1041. Hyattsville, MD: National Center for Health Statistics.
Langa, K.M., Larson, E.B., Crimmins, E.M., Faul, J.D., Levine, D.A., Kabeto, M.U., & Weir, D.R. (2017). A comparison of the prevalence of dementia in the United States in 2000 and 2012. JAMA Internal Medicine, 177(1), 51-58.
Montaquila, J., Freedman, V.A., Edwards, B., & Kasper, J.D. (2012). National Health and Aging Trends Study Round 1 Sample Design and Selection. NHATS Technical Paper #1. Baltimore, MD: Johns Hopkins University School of Public Health.
National Center for Health Statistics (NCHS). (2015). 2014 National Study of Long-Term Care Providers (NSLTCP) Residential Care Communities Survey: Restricted Data File. Data Description and Usage (Readme). Retrieved from https://www.cdc.gov/nchs/data/nsltcp/nsltcp_2014_rcc_readme_rdc_release.pdf.
National Study of Residential Care Facilities (NSRCF). (2010). Data Dictionary for the Resident Public-Use File: 2010 National Survey of Residential Care Facilities Data Dictionary Resident Public-Use File(Revised 6/14/2012). Retrieved from ftp://ftp.cdc.gov/pub/Health_Statistics/NCHS/Dataset_Documentation/NSRCF/2010/2010NSRCF_ResidentPublicUseFileDataDictionary.pdf.
RAND HRS Data Documentation, Version P. (2016). Produced by the RAND Center for the Study of Aging, with funding from the National Institute on Aging and the Social Security Administration. Santa Monica, CA.
Silver, B.C., Grabowski, D.C., Gozalo, P.L., Dosa, D., & Thomas, K.S. (2018). Increasing prevalence of assisted living as a substitute for privatepay longterm nursing care. Health Services Research, 53(6), 4906-4920.
Spillman, B.C., & Black, K.J. (2005). The Size of the Long-Term Care Population in Residential Care: A Review of Estimates and Methodology. Retrieved from https://aspe.hhs.gov/basic-report/size-long-term-care-population-residential-care-review-estimates-and-methodology.
Spillman, B.C., & Black, K.J. (2006). The Size and Characteristics of the Residential Care Population: Evidence from Three National Surveys. Retrieved from https://aspe.hhs.gov/basic-report/size-and-characteristics-residential-care-population-evidence-three-national-surveys.
Steffick, D.E. (2000). Documentation of Affective Functioning Measures in the Health and Retirement Study. Ann Arbor, MI: University of Michigan.
Stevenson, D.G., & Grabowski, D.C. (2010). Sizing up the market for assisted living. Health Affairs, 29(1), 35-43.
Thach, N., & Wiener, J. (2018). An Overview of Long-Term Services and Supports and Medicaid: Final Report. U.S. Department of Health and Human Services, Office of the Assistant Secretary for Planning and Evaluation. Research Triangle, NC: RTI International. Retrieved from https://aspe.hhs.gov/basic-report/overview-long-term-services-and-supports-and-medicaid-final-report. Accessed on 1 August 2019.
Travers, J., Hirschman, K., & Naylor, M. (2018). Long-term services and supports use (LTSS): Adapting a conceptual model to include older adults receiving LTSS. Innovation in Aging, 2(Suppl 1), 724. Retrieved from https://www.ncbi.nlm.nih.gov/pmc/articles/PMC6228226/.
U.S. Census Bureau. (2010). The Next Four Decades: The Older Population in the United States. Retrieved from http://www.census.gov/prod/2010pubs/p25-1138.pdf.
U.S. Census Bureau. (2014). Chapter 4: Sample design and selection. In ACS Design and Methodology, Version 2.0 (pp. 1-21). Retrieved from https://www2.census.gov/programs-surveys/acs/methodology/design_and_methodology/acs_design_methodology_ch04_2014.pdf.
Wiener, J.M. (2013). After CLASS: The Long-Term Care Commission's search for a solution. Health Affairs, 32(5), 831.
White House Conference on Aging. (2015). White House Conference on Aging Final Report. Retrieved from https://whitehouseconferenceonaging.gov/2015-WHCOA-Final-Report.pdf.
Wolff, J.L., Mulcahy, J., Huang, J., Roth, D.L., Covinsky, K., & Kasper, J.D. (2017). Family caregivers of older adults, 1999-2015: Trends in characteristics, circumstances, and role-related appraisal. Gerontologist.
Zimmerman, S., Sloane, P.D., & Reed, D. (2014). Dementia prevalence and care in assisted living. Health Affairs (Millwood), 33, 658-666. doi:10.1377/hlthaff.2013.1255.
APPENDIX A. ADDITIONAL TABLES
| EXHIBIT A-1. Data Source Description and Design | ||||
|---|---|---|---|---|
| HRS | MCBS | NHATS | NSLCP | |
| Year | 2002, 2008, 2014 | 2002, 2008, 2013 | 2011, 2015 | 2010, 2012, 2014 |
| Background and purpose | The HRS is a publicly available biennial, longitudinal panel survey that is nationally representative of Americans aged 50 and older. It provides policy makers with current information on the work and retirement, disability, physical and mental health, health services spending, housing, and financial patterns of the aging population. | The MCBS Cost and Use File is a nationally representative sample of the ever-enrolled institutionalized and non-institutionalized Medicare population. The MCBS is a longitudinal panel survey that uses a 3-stage probability sample of the Medicare population, and captures sociodemographic factors, health characteristics, health care utilization, and functioning among the Medicare population. | The NHATS is a nationally representative sample of the Medicare population and is administered annually. The purpose of the survey is to follow a representative cohort of adults 65 years and older over time, tracking their health, functional limitations, financial assets, home environment, employment, and demographics. The first wave of data was collected in 2011 from a stratified 3-stage sample of Medicare beneficiaries aged 65 and older, and was collected again in 2012, 2013, and 2014. | The NSLTCP began in 2012 and replaces the Centers for Disease Control and Prevention's NCHS's previous study of RCFs, the NSRCF. The NCHS conducts the NSLTCP biannually. These studies were designed to produce national estimates of residential care providers and their residents. The survey uses a stratified 2-stage probability sampling design. The first stage was the selection of RCFs. |
| Sample frame | Cross-section of US households from the March of the previous year using the ACS, with oversamples of African Americans, Hispanics, and Floridians. In 2010, the HRS expanded the minority sample by undertaking a new strategy for oversampling minorities. | Medicare enrollees as of January 1 of the previous survey year. It is then supplemented by 2 additional rounds of surveys in the fall of the survey year as well as the fall of the next year. | Cross-section of individual Medicare beneficiaries (age 65+), derived from the Medicare enrollment database, regardless of residential setting; the sample is drawn from the Medicare enrollment file in October of the preceding year. | Facilities eligible for the survey must have been licensed, registered, listed, certified, or otherwise regulated by the state; have 4 or more licensed, certified, or registered beds; have at least 1 resident currently living in the facility; and must provide room and board with at least 2 meals per day, around-the-clock on-site supervision, and help with personal care, such as bathing and dressing, or health-related services, such as medication management. |
| Weight construction | The HRS weights are post-stratified to represent the ACS so that they are representative of all US households, or of all non-institutional individuals in the US, as of March of the previous survey year. | The cross-sectional weights reflect the selection probability of each person included in the sample, adjusted for non-responses and post-stratification to control totals based on age, sex, race, region, and MSA. The weights inflate the total sample to the ever-enrolled Medicare population for the survey year. | The NHATS weights for 2011 are designed to represent Medicare beneficiaries 65 years and older as of September 30, 2010. Separate weights are included for the 2015 cohort to account for the replenishment of the sample. These weights are designed to represent Medicare beneficiaries 65 years and older as of September 30, 2014. | For sampled states, the sample weight reflects the probability of selection for each facility that was randomly selected. |
| Data collection | Using in-depth interviews with the SP or proxy respondents, the HRS collects detailed information related to demographics, health, income and wealth, employment, relationship status, and housing. Interviews are conducted with the same respondents each year, unless they die or refuse to participate. | The MCBS collects survey data in as many as 5 interviews per sampled person. People residing in the community receive a community survey. This survey collects demographic, health, and residential characteristics of the sampled person. For those residing in a long-term care facility, a facility questionnaire is delivered and collects similar individual and residential setting characteristics as the community interview. Health status information is collected during the fall of the survey year. | The NHATS data are collected through in-person interviews conducted in the respondents' homes or other residences. The information collected includes both interviewee responses and interviewer observation during the in-person interviews (SP interviews). The NHATS in-depth interview questions relate to health and daily living for older Americans, with specific topics covering social relationships, financial assets, health, home environment, mobility, ADLs, IADLs, employment, and demographics. The annual NHATS survey tracks participants as they age, following them as they move to other residences or care settings over time. For participants who live in nursing facilities, interviews are conducted with facility staff only (FQ interviews). | In-person interviews were conducted with residential care administrators, who provided information about the facility characteristics such as ownership, size, and services offered. As part of the NSRCF, facility staff also provided information about 3-6 randomly selected residents. In the NSLTCP, facility administrators provide aggregate information about characteristics of their residents, such as age, sex, race, and number residents needing assistance with ADLs. |
Housing Characteristics--Services Available
Depending on the type of setting in which they are living, people may have access to various types of supports and services, including assistance with ADLs, such as walking and bathing; assistance with IADLs, such as preparing meals or doing laundry; medication assistance; or provision of nursing care. Exhibit A-2 provides information on how the MCBS, the HRS, and the NHATS capture the availability of each service. For the MCBS, the exhibit lists services to which individuals have access or for which facilities provide assistance by each type of setting. For NHATS, the exhibit lists services for which residents received assistance. Services data were not available for the NSLTCP.
| EXHIBIT A-2. Services Available by Housing Setting and Data Source | ||||
|---|---|---|---|---|
| MCBS1 | HRS2 | NHATS3 | ||
| Traditional Housing and Community-Based Residential Care | Community-Based Residential Care (identified in facility interview) and Nursing Home | Community-Based Residential Care | Traditional Housing and Community-Based Residential Care | |
| Questionnaire phrasing | Do you have access to... | Does facility provide help w/... | Does the place you live offer help with... | In the last month, when {you/SP} __________, how often did {you/{he/she}} do this by {yourself/{himself/herself}} and without help? Would you say most times, sometimes, rarely, or never? |
| ADL services | Bathing help | Bathing help | Bathing help | |
| Eating help | Eating help | Eating help | ||
| Walking help | ||||
| Dressing help | Dressing help | |||
| Transferring help | ||||
| Toileting help | ||||
| IADL services | Meals | Meals | Meals | |
| Laundry | Laundry | |||
| Supervision of medications | Supervision of medications | Supervision of medications | ||
| Housekeeping | Housekeeping | |||
| Shopping or correspondence help | Shopping or correspondence help | |||
| Communication help | ||||
| Banking help | ||||
| Other services | Personal care services | |||
| Nursing or medical care | Nursing care | |||
| Emergency call button/checks on residents | ||||
| ||||
| EXHIBIT A-3. Demographic Characteristics of Individuals 65 and Older1 by their Residential Setting: Data over Time from 4 National Datasets (weighted percentages) | ||||||||||||
|---|---|---|---|---|---|---|---|---|---|---|---|---|
| HRS | MCBS | NHATS | NSLTCP | |||||||||
| 2002 | 2008 | 2014 | 2002 | 2008 | 2013 | 2011 | 2015 | 2010 | 2012 | 2014 | ||
| TRADITIONAL RESIDENCE | ||||||||||||
| Age | ||||||||||||
| 65-74 | 54.9% | 54.2% | 58.8% | 52.9% | 53.8% | 56.5% | 54.9% | 57.9% | --- | --- | --- | |
| 75-84 | 35.7% | 33.2% | 30.2% | 36.4% | 33.7% | 30.8% | 33.8% | 31.2% | --- | --- | --- | |
| 85 and older | 9.4% | 12.6% | 11.0% | 10.7% | 12.5% | 12.8% | 11.3% | 10.9% | --- | --- | --- | |
| Sex | ||||||||||||
| Male | 43.1% | 43.3% | 44.4% | 43.2% | 44.5% | 44.3% | 44.3% | 45.3% | --- | --- | --- | |
| Female | 59.9% | 56.7% | 55.6% | 56.8% | 55.5% | 55.7% | 55.7% | 54.7% | --- | --- | --- | |
| Race | ||||||||||||
| White | 88.5% | 87.8% | 86.1% | 88.5% | 87.0% | 85.1% | 80.0% | 77.6% | --- | --- | --- | |
| Black | --- | 8.6% | 9.0% | --- | 8.1% | 8.4% | 8.3% | 8.3% | --- | --- | --- | |
| Other2 | 11.5% | 3.5% | 4.8% | 13.5% | 4.9% | 6.5% | 10.5% | 11.1% | --- | --- | --- | |
| Missing | 0.0% | 0.0% | 0.1% | --- | --- | --- | 1.1% | 3.0% | --- | --- | --- | |
| Hispanic ethnicity | ||||||||||||
| Yes | --- | 7.3% | 7.9% | --- | 7.5% | 9.6% | 7.0% | 7.1% | --- | --- | --- | |
| No | --- | 92.7% | 92.1% | --- | 92.3% | 90.1% | 91.9% | 89.9% | --- | --- | --- | |
| Missing | --- | 0.0% | 0.0% | --- | --- | --- | 1.1% | 3.0% | --- | --- | --- | |
| Education | ||||||||||||
| High school or less | --- | 60.0% | 51.4% | --- | 60.7% | 52.8% | 48.7% | 40.3% | --- | --- | --- | |
| Some college or more | --- | 39.9% | 48.5% | --- | 38.9% | 46.9% | 50.1% | 56.0% | --- | --- | --- | |
| Missing | --- | 0.0% | 0.0% | --- | 0.4% | 0.3% | 1.2% | 3.7% | --- | --- | --- | |
| Marital status | ||||||||||||
| Married | 57.2% | 58.8% | 60.2% | 56.8% | 56.5% | 55.4% | 59.0% | 60.0% | --- | --- | --- | |
| Divorced/separated | --- | 10.5% | 12.3% | --- | 10.8% | 14.5% | 12.1% | 15.2% | --- | --- | --- | |
| Widowed | 30.9% | 27.9% | 22.9% | 32.0% | 29.8% | 26.0% | 25.6% | 21.4% | --- | --- | --- | |
| Never married | --- | 2.8% | 4.6% | --- | 2.8% | 4.0% | 3.3% | 3.4% | --- | --- | --- | |
| Other unmarried3 | 11.7% | --- | --- | --- | --- | --- | --- | --- | --- | --- | --- | |
| Missing | 0.2% | 0.0% | 0.0% | --- | 0.1% | 0.1% | 0.1% | 0.0% | --- | --- | --- | |
| Income | ||||||||||||
| At or below $15,000 | --- | 18.0% | 13.0% | --- | 17.8% | 13.7% | 21.2% | 15.9% | --- | --- | --- | |
| $15,001 and above | --- | 82.0% | 87.0% | --- | 82.2% | 86.3% | 78.9% | 84.0% | --- | --- | --- | |
| COMMUNITY-BASED RESIDENTIAL CARE | ||||||||||||
| Age | ||||||||||||
| 641 | --- | --- | --- | --- | --- | --- | --- | --- | 11.0% | 7.0% | 7.0% | |
| 65-74 | 19.5% | 14.6% | 10.4% | 11.3% | 12.4% | 17.3% | 18.6% | 16.3% | 9.0% | 10.0% | 10.0% | |
| 75-84 | 48.0% | 30.9% | 28.1% | 36.4% | 35.6% | 28.0% | 33.5% | 34.0% | 27.0% | 32.0% | 30.0% | |
| 85 and older | 32.5% | 54.5% | 61.5% | 52.3% | 52.0% | 54.7% | 47.9% | 49.6% | 54.0% | 51.0% | 53.0% | |
| Sex | ||||||||||||
| Male | 33.9% | 29.9% | 31.8% | 25.2% | 24.7% | 30.6% | 28.3% | 30.9% | 30.0% | 28.0% | 30.0% | |
| Female | 66.1% | 70.1% | 68.2% | 74.8% | 75.3% | 69.4% | 71.7% | 69.1% | 70.0% | 72.0% | 70.0% | |
| Race | ||||||||||||
| White | 91.1% | 97.0% | 97.2% | 96.4% | 93.2% | 92.1% | 88.6% | 83.1% | 94.0% | 87.0% | 84.0% | |
| Black | --- | 2.6% | 1.9% | --- | 5.1% | 4.7% | 5.4% | 6.1% | 4.0% | 4.0% | 4.0% | |
| Other2 | 9.0% | 0.4% | 1.0% | 3.6% | 1.7% | 3.2% | 5.5% | 7.3% | 2.0% | 19.0% | 12.0% | |
| Missing | 0.0% | 0.0% | 0.0% | --- | --- | --- | 0.6% | 3.5% | --- | --- | --- | |
| Hispanic ethnicity3 | ||||||||||||
| Yes | --- | 4.1% | 0.4% | --- | 3.9% | 4.8% | 2.6% | 2.6% | 3.0% | 2.0% | 3.0% | |
| No | --- | 95.9% | 99.6% | --- | 96.1% | 94.9% | 96.8% | 93.9% | 97.0% | 98.0% | 97.0% | |
| Missing | --- | 0.0% | 0.0% | --- | --- | 0.3% | 0.6% | 3.5% | --- | --- | --- | |
| Education | ||||||||||||
| High school or less | --- | 45.2% | 37.5% | --- | 51.3% | 51.2% | 49.5% | 42.5% | 59.0% | --- | --- | |
| Some college or more | --- | 54.8% | 62.5% | --- | 37.5% | 39.1% | 48.0% | 49.6% | 41.0% | --- | --- | |
| Missing | --- | 0.0% | 0.0% | --- | 11.2% | 9.7% | 2.5% | 7.9% | --- | --- | --- | |
| Marital status | ||||||||||||
| Married | 33.1% | 31.9% | 30.1% | 20.7% | 21.7% | 20.2% | 22.4% | 21.2% | 13.0% | --- | --- | |
| Divorced/separated | --- | 11.5% | 9.0% | --- | 8.5% | 14.5% | 14.0% | 14.8% | 10.0% | --- | --- | |
| Widowed | 55.4% | 52.2% | 55.5% | 60.1% | 58.5% | 53.0% | 52.5% | 55.3% | 62.0% | --- | --- | |
| Never married | --- | 4.5% | 5.4% | --- | 9.7% | 11.4% | 10.9% | 7.5% | 14.0% | --- | --- | |
| Other unmarried4 | 11.5% | --- | --- | --- | --- | --- | --- | --- | --- | --- | --- | |
| Missing | 0.0% | 0.0% | 0.0% | --- | 1.7% | 0.9% | 0.1% | 1.3% | 1.0% | --- | --- | |
| Income | ||||||||||||
| At or below $15,000 | --- | 20.0% | 16.7% | --- | 38.1% | 29.6% | 36.5% | 27.8% | --- | --- | --- | |
| $15,001 and above | --- | 80.0% | 83.3% | --- | 61.9% | 70.4% | 63.6% | 72.2% | --- | --- | --- | |
| NURSING FACILITY | ||||||||||||
| Age | ||||||||||||
| 65-74 | --- | --- | --- | 13.2% | 15.1% | 16.4% | 15.3% | 21.7% | --- | --- | --- | |
| 75-84 | --- | --- | --- | 37.9% | 32.8% | 26.4% | 33.0% | 30.1% | --- | --- | --- | |
| 85 and older | --- | --- | --- | 48.9% | 52.1% | 57.2% | 51.7% | 48.2% | --- | --- | --- | |
| Sex | ||||||||||||
| Male | --- | --- | --- | 29.1% | 28.0% | 27.6% | 27.0% | 26.5% | --- | --- | --- | |
| Female | --- | --- | --- | 70.9% | 72.0% | 72.5% | 73.0% | 73.5% | --- | --- | --- | |
| Race | ||||||||||||
| White | --- | --- | --- | 87.2% | 83.8% | 86.2% | 79.6% | 79.4% | --- | --- | --- | |
| Black | --- | --- | --- | --- | 13.1% | 9.9% | 12.0% | 12.1% | --- | --- | --- | |
| Other2 | --- | --- | --- | 12.8% | 3.1% | 4.1% | 7.2% | 6.5% | --- | --- | --- | |
| Missing | --- | --- | --- | --- | --- | --- | 1.2% | 2.0% | --- | --- | --- | |
| Hispanic ethnicity | ||||||||||||
| Yes | --- | --- | --- | --- | 6.4% | 8.0% | 4.4% | 3.3% | --- | --- | --- | |
| No | --- | --- | --- | --- | 93.1% | 91.7% | 94.4% | 94.7% | --- | --- | --- | |
| Missing | --- | --- | --- | --- | 0.6% | 0.3% | 1.2% | 2.0% | --- | --- | --- | |
| Education | ||||||||||||
| High school or less | --- | --- | --- | --- | 72.2% | 60.9% | --- | --- | --- | --- | --- | |
| Some college or more | --- | --- | --- | --- | 18.9% | 15.9% | --- | --- | --- | --- | --- | |
| Missing | --- | --- | --- | --- | 8.9% | 23.1% | --- | --- | --- | --- | --- | |
| Marital status | ||||||||||||
| Married | --- | --- | --- | 23.2% | 20.3% | 20.0% | --- | --- | --- | --- | --- | |
| Divorced/separated | --- | --- | --- | --- | 7.9% | 14.9% | --- | --- | --- | --- | --- | |
| Widowed | --- | --- | --- | 56.3% | 60.0% | 53.5% | --- | --- | --- | --- | --- | |
| Never married | --- | --- | --- | --- | 11.2% | 10.9% | --- | --- | --- | --- | --- | |
| Missing | --- | --- | --- | --- | 0.5% | 0.7% | --- | --- | --- | --- | --- | |
| Income | ||||||||||||
| At or below $15,000 | --- | --- | --- | --- | 39.4% | 41.2% | --- | --- | --- | --- | --- | |
| $15,001 and above | --- | --- | --- | --- | 60.6% | 58.8% | --- | --- | --- | --- | --- | |
--- = not applicable.
| ||||||||||||
| EXHIBIT A-4. Functional Status and Health Characteristics of Individuals 65 and Older1 by their Residential Setting: Data Over Time from 4 National Datasets (age-standardized, weighted percentages) | ||||||||||||
|---|---|---|---|---|---|---|---|---|---|---|---|---|
| HRS | MCBS | NHATS | NSLTCP | |||||||||
| 2002 | 2008 | 2014 | 2002 | 2008 | 2013 | 2011 | 2015 | 2010 | 2012 | 2014 | ||
| TRADITIONAL RESIDENCE | ||||||||||||
| Functional status | ||||||||||||
| No ADLs/IADLs | 84.6% | 74.3% | 74.2% | 82.5% | 70.9% | 67.6%** | 39.8% | 44.4%** | --- | --- | --- | |
| IADLs only | 7.3% | 6.1% | 6.1% | 8.8% | 4.1% | 3.6% | 55.0% | 50.9%** | --- | --- | --- | |
| 1-2 ADLs | 5.4% | 13.6% | 13.2% | 5.2% | 18.5% | 20.8%** | 3.8% | 3.4% | --- | --- | --- | |
| 3 or more ADLs | 2.8% | 6.0% | 6.3% | 3.2% | 6.5% | 8.0%** | 1.4% | 1.3% | --- | --- | --- | |
| Unknown | 0.0% | 0.1% | 0.1% | --- | --- | --- | --- | --- | --- | --- | --- | |
| General health | ||||||||||||
| Excellent/very good/good | 70.6% | 69.7% | 71.9%** | 78.0% | 79.4%* | 81.5%* | 75.2% | 77.4%* | --- | --- | --- | |
| Fair or poor | 29.3% | 30.3% | 28.0%** | 21.5% | 19.9%* | 18.1%* | 24.8% | 22.5%* | --- | --- | --- | |
| Unknown | 0.1% | 0.1% | 0.1% | 0.5% | 0.7% | 0.4% | --- | --- | --- | --- | --- | |
| Selected conditions | ||||||||||||
| Alzheimer's disease/other dementia2 | 2.3% | 5.1%** | 4.5%** | 3.2% | 4.4%** | 5.8%** | 3.7% | 4.0% | --- | --- | --- | |
| Diabetes | 18.1% | 21.9%** | 26.6%** | 19.5% | 24.6%** | 28.7%** | 23.6% | 26.4%* | --- | --- | --- | |
| Hip fracture | 1.2% | 1.2% | 1.1% | 3.4% | 3.2% | 3.2% | 3.8% | 2.4%* | --- | --- | --- | |
| Arthritis | --- | 66.9% | 70.0%** | --- | 60.4% | 62.1% | 53.4% | 56.5%* | --- | --- | --- | |
| Stroke | 9.0% | 10.6%** | 10.7%** | 16.2% | 10.7%** | 9.8%** | 9.6% | 5.9%* | --- | --- | --- | |
| Lung disease | 10.9% | 11.3% | 12.3%* | 14.1% | 16.9%** | 18.9%** | 15.4% | 17.1%* | --- | --- | --- | |
| Mental disorder/depression3 | 13.0% | 12.5% | 12.4% | 12.6% | 21.7%** | 23.8%** | --- | --- | --- | --- | --- | |
| Disability (HIPAA) | ||||||||||||
| No | --- | 86.2% | 89.1% | --- | 95.6% | 94.2% | 90.2% | 92.8% | --- | --- | --- | |
| Yes | --- | 13.8% | 11.0%** | --- | 4.4% | 5.8%** | 9.8% | 7.2%* | --- | --- | --- | |
| COMMUNITY-BASED RESIDENTIAL CARE | ||||||||||||
| Functional status | ||||||||||||
| No ADLs/IADLs | 66.4% | 52.0% | 51.8% | 39.2% | 23.1% | 26.5% | 19.1% | 18.2% | 26% | --- | --- | |
| IADLs only | 18.1% | 9.5% | 9.7% | 19.9% | 8.3% | 8.8% | 53.7% | 57.4% | --- | --- | --- | |
| 1-2 ADLs | 11.2% | 28.1% | 23.8% | 19.6% | 33.0% | 33.7% | 18.9% | 17.3% | 37% | --- | --- | |
| 3 or more ADLs | 4.3% | 10.4% | 14.7% | 19.7% | 35.5% | 31.1% | 8.4% | 7.0% | 37% | --- | --- | |
| General health | ||||||||||||
| Excellent/very good/good | 57.7% | 62.3% | 72.5%** | 67.3% | 60.9% | 63.3% | 70.1% | 68.3% | 58% | --- | --- | |
| Fair or poor | 42.3% | 37.7% | 27.5%** | 30.7% | 38.3% | 36.0% | 29.6% | 30.0% | 42% | --- | --- | |
| Unknown | 0.0% | 0.0% | 0.0% | 2.0% | 0.8% | 0.6% | 0.4% | 1.6% | 0% | --- | --- | |
| Selected conditions | ||||||||||||
| Alzheimer's disease/other dementia2 | 5.1% | 11.8% | 14.2%* | 25.3% | 25.0% | 28.3% | 16.2% | 23.1% | 42% | 40% | 40% | |
| Diabetes | 14.3% | 20.0% | 19.2% | 17.7% | 17.5% | 21.6% | 27.6% | 27.2% | 17% | --- | 17% | |
| Hip fracture | 1.1% | 0.8% | 0.6% | 8.0% | 6.8% | 4.5% | 9.7% | 11.8% | 2% | --- | --- | |
| Arthritis | --- | 77.4% | 75.3% | --- | 34.5% | 49.5%* | 59.9% | 60.8% | 27% | --- | --- | |
| Stroke | 16.2% | 25.3% | 19.0% | 13.9% | 11.0% | 15.1% | 16.9% | 15.1% | 11% | --- | --- | |
| Lung disease | 10.3% | 14.4% | 19.0% | 11.5% | 10.4% | 18.0% | 15.1% | 19.8% | --- | --- | --- | |
| Mental disorder/depression3 | 22.0% | 9.5%** | 12.3%** | 22.5% | 33.3%** | 35.5%** | --- | --- | 28% | 25% | 23% | |
| Disability (HIPAA) | ||||||||||||
| No | --- | 70.9% | 77.6% | --- | 57.2% | 58.4% | 67.3% | 64.7% | --- | --- | --- | |
| Yes | --- | 29.1% | 22.4% | --- | 42.8% | 41.6% | 32.7% | 35.2% | --- | --- | --- | |
| NURSING FACILITY | ||||||||||||
| Functional status | ||||||||||||
| No ADLs/IADLs | --- | --- | --- | 5.5% | 2.4% | 4.1% | --- | --- | --- | --- | --- | |
| IADLs only | --- | --- | --- | 9.3% | 1.8% | 1.2% | --- | --- | --- | --- | --- | |
| 1-2 ADLs | --- | --- | --- | 13.2% | 11.2% | 4.2%** | --- | --- | --- | --- | --- | |
| 3 or more ADLs | --- | --- | --- | 70.5% | 84.6% | 90.3%* | --- | --- | --- | --- | --- | |
| General health | ||||||||||||
| Excellent/very good/good | --- | --- | --- | 32.9% | 35.5% | 29.0% | --- | --- | --- | --- | --- | |
| Fair or poor | --- | --- | --- | 65.1% | 62.9% | 69.8% | --- | --- | --- | --- | --- | |
| Unknown | --- | --- | --- | 2.0% | 1.6% | 1.2% | --- | --- | --- | --- | --- | |
| Selected conditions | ||||||||||||
| Alzheimer's disease/other dementia | --- | --- | --- | 47.8% | 47.5% | 62.5%** | --- | --- | --- | --- | --- | |
| Diabetes | --- | --- | --- | 24.3% | 30.8%* | 33.9%** | --- | --- | --- | --- | --- | |
| Hip fracture | --- | --- | --- | 5.1% | 4.5% | 0.6% | --- | --- | --- | --- | --- | |
| Arthritis | --- | --- | --- | --- | 22.4% | 20.2% | --- | --- | --- | --- | --- | |
| Stroke | --- | --- | --- | 19.9% | 20.9% | 17.6% | --- | --- | --- | --- | --- | |
| Lung disease | --- | --- | --- | 12.3% | 14.5% | 18.7% | --- | --- | --- | --- | --- | |
| Mental disorder/depression3 | --- | --- | --- | 41.9% | 52.3%** | 48.7% | --- | --- | --- | --- | --- | |
| Disability (HIPAA) | ||||||||||||
| No | --- | --- | --- | --- | 6.2% | 5.0% | --- | --- | --- | --- | --- | |
| Yes | --- | --- | --- | --- | 93.8% | 95.0% | --- | --- | --- | --- | --- | |
--- = not applicable. * p0.05, ** p0.01.
| ||||||||||||
NOTES
-
The NSLTCP samples residential care providers, rather than individuals, and as such is not restricted to people age 65 years and older.
-
The National Study of Long-Term Care Providers (NSLTCP) samples residential care providers, rather than individuals, and as such is not restricted to people age 65 years and older.
-
The MCBS re-designed its data file format in 2014; data from this year are not available.
-
Spillman & Black (2006) re-weight the MCBS sample to Medicare control totals for September 2002 using information provided by the Centers for Medicare & Medicaid Services (CMS). We do not conduct a similar re-weighting technique. We discuss the limitations of this approach in Section 5.
-
The MCBS classifies a facility as a place with three or more beds and Medicare or Medicaid certified or state licensed as a nursing home or other long-term care facility, or providing supervision of medications or help with ADLs or IADLs, or providing 24-hour caregiver supervision. Under the MCBS definition of "facility," community-based settings should not have around-the-clock supervision or be licensed as a long-term care facility.
-
The MCBS Record Identification Code (RIC) 2 file also asks about difficulty with light/heavy housework, but we do not include here because these items are not captured for those residing in the facility (RIC 2F).
-
Definition includes assistance with at least two ADLs for a period of at least 90 days due to loss of functional capacity. Neither survey incorporates duration or identifies loss in capacity, so we limit the definition to having any ADL limitation.
-
The facility interview includes questions on bipolar disorder and schizophrenia. There are some people residing in community-based residential care who received the facility interview.
-
Please note that each exhibit includes a different percentage range on the y-axis.
-
NHATS has a series of dementia-related screening questions for interviewers to administer to respondents, but these questions differed from the definitions used by the other data sources. Accordingly, the analyses herein included only the single question regarding dementia diagnoses by a medical professional prior to the interview.
Analyses of Disability, Aging and Long Term Care Policy and Data
Reports were prepared under contract #HHSP233201600021I between HHS's ASPE/BHDAP and RTI International. For additional information about this subject, you can visit the BHDAP home page at https://aspe.hhs.gov/bhdap or contact the ASPE Project Officers at HHS/ASPE/BHDAP, Room 424E, H.H. Humphrey Building, 200 Independence Avenue, S.W., Washington, D.C. 20201; William.Haltermann@hhs.gov, William.Marton@hhs.gov, Helen.Lamont@hhs.gov.
Reports Available
Trends in the Use of Residential Settings among Older Adults Issue Brief
- HTML version: https://aspe.hhs.gov/basic-report/trends-use-residential-settings-among-older-adults-issue-brief
- PDF version: https://aspe.hhs.gov/pdf-report/trends-use-residential-settings-among-older-adults-issue-brief
Understanding the Characteristics of Older Adults in Different Residential Settings: Data Sources and Trends