
John Drabek and William Marton
Office of the Assistant Secretary for Planning and Evaluation
July 2015
Printer Friendly Version in PDF Format: http://aspe.hhs.gov/pdf-report/measuring-need-long-term-services-and-supports-research-brief (11 PDF pages)
| The aging of the population will lead to a significant increase in the number of people aged 65 and over who have disabilities and require assistance on a daily basis. As a range of stakeholders discuss policy options to address the need for daily assistance--long-term services and supports--it is useful to identify an accurate number of potential consumers, and to agree on that number. In that way, the costs and impacts of policy alternatives can be estimated and compared. Using data from the 2011 National Health and Aging Trends Study, we estimate that 5.7 million people age 65 and over meet the disability criteria established in the Health Insurance Portability and Accountability Act of 1996. These criteria require the need for help of another person in performing at least 2 of 5 activities of daily living for 90 days or more or the need for supervision due to severe cognitive impairment. We find that disability increases sharply with age, increasing from 6% of people ages 65-69 to 52% of those age 90 and over. Disability associated with dementia and nursing home residence is also strongly correlated with age. Age-specific disability varies by several important socio-demographic characteristics: women have much higher levels of disability at older ages regardless of residence, while higher educated persons living in the community and those living with a spouse only have lower levels. Disability is lowest for people living in homes or apartments, is higher in residential care communities, and is even higher in assisted living. |
Americans are living longer than ever before. Approximately 13 percent of the population was over age 65 in 2010, and demographers project this percentage to increase to 20 percent by 2050 (Federal Interagency Forum on Aging-Related Statistics, 2012). A greater number of people living to older ages will result in more people with chronic health conditions and disability. Of particular concern to individuals and families is how to access and pay for the long-term services and supports (LTSS) associated with aging and disability. LTSS encompasses a wide variety of devices and supportive services that assist persons in the performance of routine daily activities, such as eating, dressing, and bathing (Congressional Budget Office, 2013). This ASPE Research Brief estimates the number of older Americans with a disability based on a widely-used definition established by the Health Insurance Portability and Accountability Act (HIPAA) of 1996, and the most recent and comprehensive data available. The goal is to provide the public and policymakers with a context for considering changes to existing LTSS programs, as well as new service delivery and financing options.
Background
Researchers have devised measures of disability to quantify long-term care need. Most notably, Katz et al. (1963) identified a set of activities of daily living (ADLs) that include such critical everyday tasks as eating, dressing, bathing, transferring (the ability to get out of bed or a chair), and using the toilet. Difficulty or the inability to perform a number of these activities is indicative of a need for LTSS. ADL-type questions have been incorporated into the Census and many nationally-representative surveys to determine the number of persons with LTSS needs. However, estimates vary widely depending on which ADLs are included and how they are measured. In addition, ADLs only indirectly measure cognitive impairment. For example, a person may be able to perform personal care tasks such as eating or dressing, but may not be capable of taking their medicines, managing money, or going outside without supervision due to dementia. The impact of cognitive impairment has been measured by the need for help with instrumental activities of daily living (IADLs) related to higher order functioning (Lawton & Brody, 1969), and through tests of memory or executive function.
Different measures of disability also led to inconsistencies in determining eligibility for benefits under private long-term care insurance. The 1996 HIPAA resolved this problem by creating a clear definition of disability for tax-qualified long-term care insurance policies and criteria for determining whether a person is eligible for benefits. One of the outcomes of HIPAA was that its definition of chronic disability became more widely-used and ingrained in subsequent policies about LTSS. For example, the Community Living Assistance Services and Supports program, which was established by the Affordable Care Act in 2010 but subsequently repealed, used a version of the HIPAA disability criteria to determine benefit eligibility.
HIPAA's definition of disability is codified in Section 7702(B) of the Internal Revenue Code. A person is considered to be disabled if he/she has been certified by a licensed health care practitioner as:
-
Being unable to perform (without substantial assistance from another individual) at least two ADLs for a period of at least 90 days due to a loss of functional capacity; or
-
Requiring substantial supervision to protect such individual from threats to health and safety due to severe cognitive impairment.
The specific ADLs are: eating, toileting, transferring, bathing, dressing, and continence, and insurers have to include at least five of these ADLs for a policy to be tax-qualified. Section 7702(B) does not, however, include a definition of "severe cognitive impairment." The HIPAA criteria also do not identify specific services or locations in which the services must be provided. This enabled insurers to pay for care outside of nursing homes, to which many earlier policies had been limited. In fact, over time, care at home or in an assisted living facility has become quite popular with policyholders who receive benefits.
Data and Methods
Determining the number of older Americans with a chronic disability and in need of LTSS requires data at a level of detail comparable to the HIPAA criteria. The most complete source of national data is the National Health and Aging Trends Study (NHATS), a longitudinal study of approximately 8,000 Medicare beneficiaries age 65 and older, which has been conducted annually since 2011.1 Using Medicare enrollment information to create the sample ensures that the older adults are surveyed regardless of where they live, and the sample represents an estimated 96 percent of the 65+ population.
We took a two-part approach to estimating the number of older persons with a chronic disability. First, the NHATS sample was split into two mutually exclusive components: respondents who were residing in a nursing facility at the time of the interview, and those who were living in the community, mostly in traditional homes or apartments, or sometimes in non-institutional residential care settings. By definition, all persons who were living in a nursing facility were considered to be chronically disabled.2 For persons living in the community, a respondent was determined to be in need of LTSS if he/she required assistance with two or more of five ADLs and/or had severe cognitive impairment. An individual was categorized as needing assistance with ADLs if he/she answered affirmatively (or their proxy did) to two or more questions about whether they received assistance carrying out various activities over a specific period of time. The question wording for each of the ADLs (eating, toileting. transferring, bathing, dressing) is: "In the last month, did anyone ever help you…?" We also reduce the number reporting ADLs by limiting it to those who have used self-care or mobility assistance for at least the last three months.3
Severe cognitive impairment was determined if a NHATS respondent reported having a diagnosis of dementia or Alzheimer's disease; scored low on tests to evaluate memory (immediate and delayed ten-word recall) and orientation (date, month, year, and day of the week; naming the President and Vice President); or exhibited poor executive function (clock drawing test). Proxy respondents answered the questions on memory, temporal orientation, judgment and function if the sample person could not directly respond. For this analysis we classified those with probable dementia as meeting the HIPAA trigger.4
Findings
Figure 1 shows the percentage of people with a chronic disability by age. In 2011, about 5.7 million people (16 percent of the Medicare population) met the HIPAA disability criteria (over 13 percent living in the community and 3 percent in nursing homes). The prevalence of disability rises sharply with age, increasing from 6 percent of persons age 65-69 to 52 percent of those age 90 and over. The age-specific prevalence of nursing home residence also increases with age; less than 1 percent of persons age 65-69 live in a nursing home compared to 16 percent of those age 90 and over.
FIGURE 1. Percent of Elderly with a Chronic Disability in the Community (by Type of Disability) and in Nursing Homes

SOURCE: 2011 National Health and Aging Trends Study.
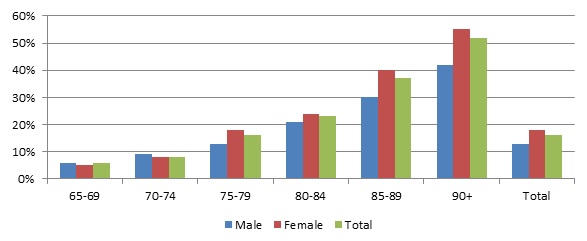
Figure 2 indicates that women have a higher prevalence of disability than men in the older age groups. Although 16 percent of the older population meets the HIPAA criteria, women are more likely to do so (18 percent) than men (13 percent). There are several reasons for this disparity. In the oldest group (age 90 and over), the longer life expectancy of women results in more very old women who are at the highest risk of both functional limitation and dementia. Also, the definition of disability (receiving help), which is partly dependent on the presence of caregivers, may confound the estimate.
FIGURE 2. Percent of Elderly with a Chronic Disability by Age Group and Gender
SOURCE: 2011 National Health and Aging Trends Study.
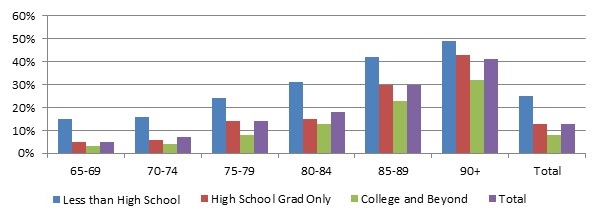
In NHATS, less demographic information is collected for nursing home residents than for the rest of the population. Figure 3 therefore shows the prevalence of chronic disability by education for those persons living outside of nursing facilities. Among this subset of the population, about 13 percent of older adults meet the HIPAA criteria, ranging from 25 percent of those who did not finish high school to only 8 percent of those with at least some college.5 The difference is especially great at younger ages. For example, below age 75, approximately 15 percent of those with less than a high school education are disabled compared to 3 percent of those with the highest level of education. Education likely influences disability in a number of ways. Education is correlated with income and those with higher incomes are less likely to have worked in physically-demanding jobs associated with disability, and are more likely to have health insurance and access to health care on a timely basis. Education is also associated with higher marriage rates, and those who are married tend to be in better health. People with education are also better consumers of health information and are more likely to use assistive technology (Cutler, 2001).
FIGURE 3. Percent of Elderly with a Chronic Disability by Education
SOURCE: 2011 National Health and Aging Trends Study (data refer to community residents only).
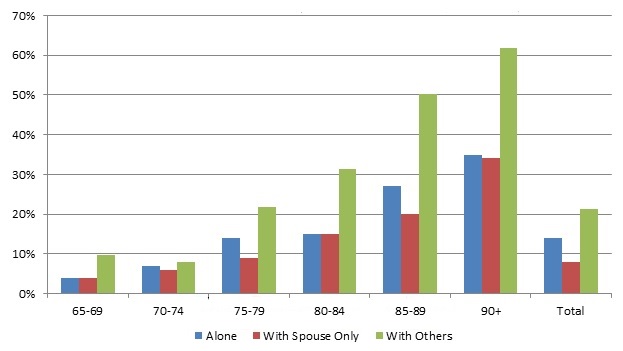
Figure 4 shows the age-specific prevalence of chronic disability by age among people living in the community. As Figure 4 indicates, the percent of older adults needing assistance is much higher among those living with others than among those living alone or with their spouse only. This is partly a reflection that those living with their spouses are younger and benefit from the lower mortality rates of those age groups. The category living "with others" includes people living with relatives or roommates, and also those living with caregivers such as their children. Nevertheless, about one-third of those age 90 and over who are living alone or with their spouse only, meet the HIPAA criteria, reflecting the higher risk of disability at advanced ages.
FIGURE 4. Percent of Elderly Needing LTSS by Living Arrangement
SOURCE: 2011 National Health and Aging Trends Study (data refer to community residents only).
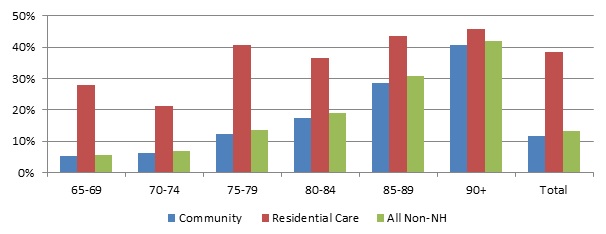
Figure 5 presents the distribution of chronic disability among the older population by residence and age. Over 36 million people, or 97 percent of older Americans, live outside of nursing homes. Most older adults (34 million) live in traditional community settings, such as a home or apartment. In recent years a number of alternative residential care settings have seen increased growth, offering the older adults more care options than in earlier years. About 2 million individuals live in settings that provide services to residents, especially social activities, meals, housekeeping, and transportation. People in these settings are more disabled than those living in traditional community settings (39 percent versus 12 percent), although the prevalence does not increase uniformly with age. Alternative residential care settings can be further divided into residential care (1.3 million) and assisted living (600,000).6 Assisted living places are typically licensed or certified by the state, and provide hands-on help with ADLs or supervision for those with cognitive impairment. Data do not permit further estimation of disability by age group, but those in assisted living facilities are much more similar in age and disability level to those in nursing homes than they are to those in other residential care (51 percent meet the HIPAA criteria versus 32 percent for those in other residential care).
FIGURE 5. Percent of Elderly with a Chronic Disability by Residence
SOURCE: 2011 National Health and Aging Trends Study (data refer to community residents only).
Conclusion
As policymakers and others consider options to improve the delivery and financing of LTSS, it is important to have a common definition of disability for evaluating alternatives. Without a common framework, estimates of the size and characteristics of the population with LTSS needs will be highly dependent on the definitions used and chosen measures. This will lead to widely varying estimates of the demand for services and associated costs. In this Brief, we used a definition of disability established by the HIPAA of 1996 and recent data from NHATS to determine the age-specific prevalence of disability in the older population. Approximately 5.7 million older adults meet the HIPAA disability criteria. Prevalence increases dramatically by age with over half of persons age 90 and older needing assistance with LTSS. Disability associated with dementia and nursing home residence is also strongly correlated with age. Age-specific disability varies by several important socio-demographic characteristics: women have much higher levels of disability at older ages regardless of residence, while higher educated people living in the community and those living with a spouse only, have lower levels. NHATS data were used to generate the age-specific prevalence of disability at a point in time, but much more can be done to better understand the course of disability among older Americans. For example, as the observation period of the NHATS study gets longer, it will be possible to examine the trajectory of chronic disability and LTSS use, as well as to describe cross-sectional prevalence.
Endnotes
-
For further information on the development of NHATS, questionnaires, and technical papers, see http://nhats.org/scripts/aboutNHATS.htm.
-
Studies of residents of nursing homes have demonstrated that residents typically need extensive assistance with ADLs and/or supervision due to cognitive impairment. See, for example, Table 3.3a in the CMS Nursing Home Data Compendium 2013 Edition at http://www.cms.gov/Medicare/Provider-Enrollment-and-Certification/CertificationandComplianc/downloads/nursinghomedatacompendium_508.pdf.
-
The HIPAA criteria refer to people with disability due to chronic illness. Temporary disability (e.g., recovery after a hospitalization) does not meet the criteria. We used the NHATS questions on help received during the last month regarding specific ADLs. We also used the overall on how long the help had been received for self-care and mobility needs in order to limit the sample to those who had received help for three months or more.
-
For further details on the development of the dementia measure see Kasper et al. (2013). For analysis related to NHATS respondents with dementia see Kasper et al. (2014).
-
The category college and beyond includes older adults who attended college, including those who did not receive degrees. It also includes people who received post-high school diplomas or certificates.
-
The 2010 National Survey of Residential Care Facilities, a provider-based survey of state-regulated residential care facilities with four or more beds and primarily serving adults indicates nearly 1 million beds serving about 650,000 residents age 65 or older (Park-Lee et al., 2011; Caffrey et al., 2012).
References
Caffrey C, Sengupta M, Park-Lee E, et al. (2012). Residents living in residential care facilities: United States, 2010. NCHS Data Brief, no 91. Hyattsville, MD: National Center for Health Statistics.
Congressional Budget Office (2013). Rising Demand for Long-Term Services and Supports for Elderly People. http://www.cbo.gov/sites/default/files/private/44363-LTC.pdf.
Cutler DM (2001). Declining disability among the elderly. Health Affairs, 20, 11-27, http://content.healthaffairs.org/content/20/6/11.full.
Federal Interagency Forum on Aging-Related Statistics (2012). Older Americans 2012: Key Indicators of Well-Being. Federal Interagency Forum on Aging-Related Statistics. Washington, DC: U.S. Government Printing Office.
Katz S, Ford AB, Moskowitz RW, Jackson BA, & Jaffe MW (1963). Studies of illness in the aged. The index of ADL: A standardized measure of biological and psychosocial function. Journal of the American Medical Association, 185, 914-919, doi:10.1001/jama.1963.03060120024016.
Kasper JD, Freedman VA, & Spillman B (2013). Classification of Persons by Dementia Status in the National Health and Aging Trends Study. Technical Paper #5. Baltimore, MD: Johns Hopkins University School of Public Health. http://nhats.org/scripts/TechnicalDementiaClass.htm.
Kasper JD, Freedman VA, & Spillman B (2014). Disability and Care Needs of Older Americans by Dementia Status: An Analysis of the 2011 National Health and Aging Trends Study. Washington, DC: Office of the Assistant Secretary for Planning and Evaluation. http://aspe.hhs.gov/daltcp/reports/2014/NHATS-DS.cfm.
Lawton MP, & Brody EM (1969). Assessment of older people: Self-maintaining and instrumental activities of daily living. The Gerontologist, 9(3), 179-186.
Park-Lee E, Caffrey C, Sengupta M, Moss AJ, Rosenoff E, & Harris-Kojetin LD. Residential care facilities: A key sector in the spectrum of long-term care providers in the United States. NCHS Data Brief, no 78. Hyattsville, MD: National Center for Health Statistics. 2011.
Appendix: Data Tables
TABLE A.1. Percent of Elderly Needing LTSS in the Community (by Type of Disability) and in Nursing Home
| Age | 2+ ADLs Only | Dementia Only | Both | Nursing Home | Total | Weighted Sample |
|---|---|---|---|---|---|---|
| 65-69 | 2% | 2% | 1% | 0% | 6% | 9,900,375 |
| 70-74 | 2% | 4% | 1% | 1% | 8% | 8,940,454 |
| 75-79 | 3% | 6% | 3% | 2% | 15% | 6,879,824 |
| 80-84 | 4% | 10% | 4% | 4% | 22% | 5,389,580 |
| 85-89 | 6% | 14% | 9% | 8% | 36% | 3,482,359 |
| 90+ | 5% | 15% | 15% | 16% | 52% | 1,793,274 |
| Total | 3% | 6% | 3% | 3% | 16% | 36,383,694 |
| SOURCE: 2011 National Health and Aging Trends Study. | ||||||
TABLE A.2. Percent of Elderly with a Chronic Disability by Age Group and Gender
| Age | Male | Female | Total | Weighted Sample |
|---|---|---|---|---|
| 65-69 | 6% | 5% | 6% | 9,900,375 |
| 70-74 | 9% | 7% | 8% | 8,940,454 |
| 75-79 | 13% | 17% | 15% | 6,879,824 |
| 80-84 | 20% | 24% | 22% | 5,389,580 |
| 85-89 | 30% | 40% | 36% | 3,482,359 |
| 90+ | 42% | 55% | 52% | 1,793,274 |
| Total | 13% | 18% | 16% | 36,383,694 |
| SOURCE: 2011 National Health and Aging Trends Study. | ||||
TABLE A.3. Percent of Elderly with a Chronic Disability by Education
| Age | Less Than High School | High School Grad Only | College & Beyond | Total | Weighted Sample |
|---|---|---|---|---|---|
| 65-69 | 14% | 5% | 3% | 5% | 9,758,666 |
| 70-74 | 15% | 6% | 4% | 7% | 8,701,590 |
| 75-79 | 25% | 14% | 8% | 14% | 6,650,968 |
| 80-84 | 32% | 15% | 14% | 19% | 5,123,975 |
| 85-89 | 41% | 32% | 23% | 31% | 3,166,057 |
| 90+ | 49% | 43% | 32% | 41% | 1,455,316 |
| Total | 25% | 13% | 8% | 13% | 34,860,000 |
| SOURCE: 2011 National Health and Aging Trends Study (data refer to community residents only). | |||||
TABLE A.4. Percent of Elderly Needing LTSS by Living Arrangement
| Age | Alone | With Spouse Only | With Others | Total | Weighted Sample |
|---|---|---|---|---|---|
| 65-69 | 3% | 4% | 10% | 5% | 9,843,847 |
| 70-74 | 7% | 6% | 8% | 7% | 8,762,450 |
| 75-79 | 15% | 9% | 22% | 14% | 6,702,455 |
| 80-84 | 15% | 15% | 32% | 19% | 5,144,785 |
| 85-89 | 27% | 20% | 50% | 31% | 3,210,198 |
| 90+ | 35% | 34% | 62% | 42% | 1,502,485 |
| Total | 15% | 8% | 22% | 13% | 35,170,000 |
| SOURCE: 2011 National Health and Aging Trends Study (data refer to community residents only). | |||||
TABLE A.5. Percent of Elderly with a Chronic Disability by Residence
| Age | Community | Residential Care | All Non- Nursing Home | Weighted Sample |
|---|---|---|---|---|
| 65-69 | 5% | 28% | 5% | 9,865,423 |
| 70-74 | 6% | 21% | 7% | 8,810,479 |
| 75-79 | 12% | 41% | 13% | 6,729,804 |
| 80-84 | 18% | 39% | 19% | 5,183,106 |
| 85-89 | 29% | 43% | 31% | 3,214,258 |
| 90+ | 41% | 46% | 42% | 1,502,485 |
| Total | 12% | 39% | 13% | 35,303,383 |
| SOURCE: 2011 National Health and Aging Trends Study (data refer to community residents only). | ||||
This Research Brief, authored by John Drabek and William Marton, estimates the number of older Americans with a disability based on a widely-used definition established by the Health Insurance Portability and Accountability Act of 1996, and other recently available data.
This Brief was prepared through intramural research by the U.S. Department of Health and Human Services, Office of the Assistant Secretary for Planning and Evaluation, Office of Disability, Aging and Long-Term Care Policy. For additional information about this subject, visit the DALTCP home page at http://aspe.hhs.gov/office_specific/daltcp.cfm or contact the authors at HHS/ASPE/DALTCP, Room 424E, H.H. Humphrey Building, 200 Independence Avenue, S.W., Washington, D.C. 20201, John.Drabek@hhs.gov or William.Marton@hhs.gov.