
Melissa Favreault
Urban Institute
Judith Dey
Office of the Assistant Secretary for Planning and Evaluation
Revised February 2016
Printer Friendly Version in PDF Format (17 PDF pages)
| Most Americans underestimate the risk of developing a disability and needing long-term services and supports (LTSS). Using microsimulation modeling, we estimate that about half (52%) of Americans turning 65 today will develop a disability serious enough to require LTSS, although most will need assistance for less than two years. About one in seven adults, however, will have a disability for more than five years. On average, an American turning 65 today will incur $138,000 in future LTSS costs, which could be financed by setting aside $70,000 today. Families will pay about half of the costs themselves out-of-pocket, with the rest covered by public programs and private insurance. While most people with LTSS needs will spend relatively little on their care, about one in six (17%) will spend at least $100,000 out-of-pocket for future LTSS. |
Long-term care services and supports (LTSS) includes a range of services and supports individuals may need to meet their health or personal needs over a long period of time.1 Most LTSS is not medical care, but rather assistance with the basic personal tasks of everyday life, sometimes called "Activities of Daily Living" (or ADLs) which include such everyday tasks as bathing, dressing, toileting and eating (Doty & Shipley, 2012).2 Many Americans prefer not to think about this need for assistance or who will provide it. They underestimate how likely it is they will need it and how much it will cost (Wiener et al., 2015; Kane, 2013; Tompson et al., 2013). Even if they correctly consider the chances of becoming disabled and needing daily help, many Americans mistakenly assume their health insurance covers these costs. However, health insurance does not cover LTSS costs, and Medicare, the major public insurance program for older Americans, does not cover most LTSS expenses (Centers for Medicare & Medicaid Services, 2015).3
While Medicaid provides LTSS to those with chronic disabling conditions (Komisar, 2013; Tompson et al., 2013),4 it is only available for individuals who meet income and other eligibility requirements (U.S. Department of Health & Human Services, 2015). A private market for LTSS insurance exists, but less than 8 percent of Americans have purchased it (Freundlich, 2014), in part due to high and rising premiums, and exit of insurers from the market (Scism, 2015). Sales figures from recent years suggest there has been stagnation, or even decline, in the market (Cohen, 2014). For some, the costs of LTSS are likely to outstrip retirement savings. Researchers at the Employee Benefit Research Institute found that projected LTSS expenses greatly contributed to projections of retirement deficits (VanDerhei, 2015).
As the United States population ages, a higher proportion of individuals will likely need and use LTSS. Most Americans who receive formal LTSS pay out-of-pocket. For those with longer spells, they may pay out-of-pocket until they qualify for Medicaid. Reliance on Medicaid for those that cannot afford the full costs of LTSS may result in increased federal and state spending for LTSS. According to projections produced by the Congressional Budget Office, due to population growth, LTSS expenses (including all formal care, Medicaid and other private and public sources of payment) could more than double from 1.3 percent of gross domestic product (GDP) in 2010 to 3 percent of GDP in 2050 if the rate of functional limitations among those age 65 and older remains constant (Congressional Budget Office, 2013).
This ASPE Research Brief presents information about the risk of needing care and associated costs to provide context for policymakers and others considering LTSS financing proposals. A microsimulation model is used to describe the future care needs for Americans. This model can predict what percentage of individuals will develop a disability, have LTSS needs, use paid LTSS, and among those that use paid LTSS, how much they use and for how long. It estimates care costs, and how they would be financed under current policies. Microsimulation modeling provides not only the average likelihood of these outcomes, but also describes the distribution of these needs and costs. Throughout the Brief we focus on LTSS needs resulting from a disability that meet the criteria set in the Health Insurance Portability and Accountability Act (HIPAA): a need for assistance with at least two ADLs5 that is expected to last at least 90 days or need for substantial supervision for health and safety threats due to severe cognitive impairment.
Methods
The results of this Brief are derived from analyses using the Urban Institute's DYNASIM3, a dynamic microsimulation model designed to analyze retirement and aging issues over time. Starting with a representative sample of individuals and families, the model "ages" the data year by year, simulating such demographic events as births, deaths, marriages and divorces, and such economic and health events as labor force participation, earnings, hours of work, disability onset and recovery, retirement, and use and costs of LTSS based on demographic and other characteristics of the population.6 As the model ages the population, it calibrates many key demographic and economic outcomes to the intermediate assumptions of the Social Security and Medicare Trustees' Reports (Board of Trustees, Federal Old-Age & Survivors Insurance & Federal Disability Insurance Trust Funds, 2014; Boards of Trustees, Federal Hospital Insurance & Federal Supplementary Medical Insurance Trust Funds, 2014). Data to inform the model are drawn from the Health and Retirement Survey (HRS), specifically in the areas of health, disability status (including limitations in ADLs and instrumental ADLs and cognitive impairment), LTSS use, and private LTSS insurance coverage.7
Current and past LTSS prices are set equal to average or median prices reported in the literature by state of residence, setting (home care, residential care, nursing home), and whether Medicaid is the payer (Genworth, 2014, 2015; Eljay, 2014; Fossett & Burke, 2010; Grabowski et al., 2004; Mollica, 2009; Ng et al., 2014).8 Importantly, these base projections incorporate the full cost of residential care, including room and board in addition to costs associated with meeting care needs. Also, the projections exclude services that are strictly post-acute. Both choices affect comparability with other estimates of LTSS expenses and payer mix. Additional details about the model's assumptions are available in Favreault and Johnson (2015).
Results
Figure 1 presents projections of the number of persons age 65 and older, including the number meeting HIPAA disability criteria from 2015 to 2065. As expected, given the aging population, the number with HIPAA-level disability is expected to grow from 6.3 million to almost 15.7 million.
| FIGURE 1. Total Population Aged 65 or Older (in thousands), Including Number of People Projected to Meet HIPAA Disability Criteria, 2015-2065 |
|---|
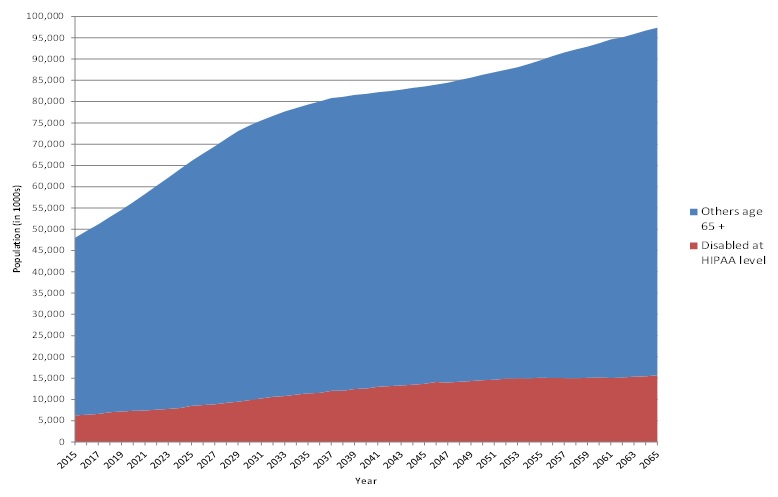 |
Table 1 displays expected LTSS needs from age 65 to death. It presents life expectancy and then the mean and distribution of the duration of disability for those turning 65 in 2015-2019.9 The typical person who is alive at age 65 can expected to live another 20.9 years. Fifty-two percent can anticipate having at least some needs for LTSS; 19 percent are expected to have needs that last less than a year, and about 14 percent are expected to have needs that extend beyond five years. It is important to bear in mind that estimates such as these are sensitive to one's definition of disability. Many people whose disabilities do not reach the HIPAA-level need and use LTSS. With a more expansive definition, for example one that includes those with one ADL limitation and/or multiple instrumental activities of daily living limitations, shares with LTSS needs can be significantly higher (Kemper, Komisar, & Alecxih, 2005/2006; Freedman & Spillman 2014).
| TABLE 1. Projected Need for LTSS for Persons Turning 65 in 2015-2019, by Gender, Income Quintile and Self-Reported Health Status at Age 65 | |||||||||
|---|---|---|---|---|---|---|---|---|---|
| Life Expectancy at Age 65 (full population) | Average Years of LTSS Need at HIPAA-Level (all) | Average Years of HIPAA-Level LTSS Need Given Any Need | Percent with Any LTSS Need at HIPAA-Level | Distribution for All | |||||
| None | 1 Year | 1.00-1.99Years | 2.00-4.99Years | >5 Years | |||||
| Gender | |||||||||
| Men | 19.6 | 1.5 | 3.2 | 46.7 | 53.3 | 18.4 | 7.4 | 11.1 | 9.8 |
| Women | 22.2 | 2.5 | 4.4 | 57.5 | 42.5 | 19.4 | 8.1 | 12.3 | 17.8 |
| Income Quintile at Age 65 | |||||||||
| Lowest | 19.5 | 2.7 | 4.8 | 55.3 | 44.7 | 17.6 | 7.1 | 11.7 | 18.9 |
| Second | 20.0 | 2.3 | 4.4 | 53.2 | 46.8 | 16.8 | 7.0 | 12.7 | 16.7 |
| Middle | 20.9 | 2.2 | 4.1 | 53.9 | 46.1 | 18.7 | 8.1 | 12.4 | 14.7 |
| Fourth | 21.2 | 1.8 | 3.6 | 49.7 | 50.3 | 19.5 | 7.4 | 10.6 | 12.2 |
| Highest | 22.2 | 1.5 | 3.0 | 51.1 | 48.9 | 20.7 | 8.7 | 11.6 | 10.1 |
| Health Status at Age 65 | |||||||||
| Excellent | 22.2 | 1.8 | 3.5 | 51.0 | 49.0 | 19.5 | 8.5 | 11.2 | 11.8 |
| Very good | 21.6 | 1.7 | 3.4 | 50.8 | 49.3 | 19.9 | 7.7 | 11.6 | 11.6 |
| Good | 21.0 | 2.1 | 4.1 | 52.5 | 47.5 | 18.9 | 7.3 | 11.7 | 14.6 |
| Fair/poor | 19.4 | 2.4 | 4.4 | 54.8 | 45.2 | 17.5 | 8.0 | 12.1 | 17.1 |
| Marital Status at Age 65 | |||||||||
| Married | 21.4 | 1.9 | 3.6 | 51.4 | 48.6 | 19.3 | 7.8 | 11.4 | 12.8 |
| Unmarried | 20.0 | 2.3 | 4.3 | 54.2 | 45.8 | 18.1 | 7.6 | 12.3 | 16.1 |
| Total | 20.9 | 2.0 | 3.9 | 52.3 | 47.7 | 18.9 | 7.8 | 11.7 | 13.9 |
The figures for average LTSS needs mask substantial variation by subpopulation. The average duration of disability is much higher for women than for men--about 2.5 years for all women as compared to 1.5 year for all men. Among women, 57 percent are likely to develop a chronic disability, and the share needing at least five years of care is nearly 18 percent. Similarly, the proportion needing at least five years of care is higher among those in the lowest income quintile at age 65 (19 percent),10 and among those reporting fair or poor health at age 65 (17 percent). Among those who ever develop a disability, the average duration increases to 4.4 years for women and 3.2 years for men, respectively.
Table 2 examines use of paid LTSS provided for a disability from age 65 onward measured in days. Of the average two years that an older adult will have a disability, they will receive paid care for about one year, and informal caregivers only, such as family and friends, will make up the difference.11 Again, patterns vary by a range of characteristics. For example, people who are unmarried at age 65 use more formal services than those who are married at age 65, an average of 1.2 years compared to 0.9 years. Those that have poorer health or lower-income levels use more formal services.
While on average, individuals will need one year of paid LTSS, 48 percent of individuals will not use paid, formal LTSS at all (measured in service days, where one year is 365 days of paid LTSS). Among those who need paid LTSS services, about half will need less than a year, and a little more than 10 percent will need five years or more.
| TABLE 2. Projected Use of Paid LTSS for Persons Turning 65 in 2015-2019, by Gender, Income Quintile, Self-Reported Health Status at Age 65, and Marital Status at Age 65 | |||||||
|---|---|---|---|---|---|---|---|
| Average Years with Formal LTSS Use | Percent with Any Formal, Paid LTSS Use (all) | Distribution for All | |||||
| None | 1 Year | 1.00-1.99Years | 2.00-4.99Years | >5 Years | |||
| Gender | |||||||
| Men | 0.7 | 42.0 | 58.0 | 22.2 | 8.5 | 8.0 | 3.4 |
| Women | 1.3 | 52.1 | 47.9 | 23.1 | 9.5 | 11.2 | 8.3 |
| Income Quintile at Age 65 | |||||||
| Lowest | 1.2 | 49.0 | 51.0 | 20.7 | 9.1 | 11.2 | 8.1 |
| Second | 1.2 | 48.1 | 52.0 | 21.1 | 8.7 | 11.0 | 7.3 |
| Middle | 1.1 | 48.7 | 51.3 | 22.5 | 9.7 | 9.6 | 6.8 |
| Fourth | 0.9 | 45.2 | 54.8 | 22.7 | 8.4 | 8.7 | 5.4 |
| Highest | 0.8 | 46.3 | 53.7 | 24.9 | 9.2 | 8.8 | 3.5 |
| Health Status at Age 65 | |||||||
| Excellent | 1.0 | 46.8 | 53.2 | 24.0 | 7.6 | 9.9 | 5.4 |
| Very good | 0.9 | 46.1 | 53.9 | 23.1 | 8.7 | 9.5 | 4.8 |
| Good | 1.1 | 47.1 | 52.9 | 22.1 | 8.4 | 10.0 | 6.6 |
| Fair/poor | 1.1 | 49.0 | 51.0 | 22.0 | 10.8 | 9.4 | 6.7 |
| Marital Status at Age 65 | |||||||
| Married | 0.9 | 45.8 | 54.2 | 23.2 | 8.6 | 8.9 | 5.1 |
| Unmarried | 1.2 | 50.0 | 50.0 | 21.5 | 9.9 | 11.2 | 7.5 |
| Total | 1.0 | 47.2 | 52.8 | 22.7 | 9.0 | 9.7 | 5.9 |
Table 3A and Table 3B present the average sum of expenditures that could be expected for LTSS from age 65 until death for the whole population and then for those with a HIPAA-level disability using paid LTSS. The table displays this projected sum of expenditures (from age 65 plus) by setting, and payer for those reaching age 65 over the next five years. This differs from the present discounted value (PDV), the amount that an individual would need to set aside at age 65 to pay for LTSS expenses.12
| TABLE 3A. Average Sum ($2015) of LTSS Expenditures from Age 65 through Death Projected for Adults Turning 65 in 2015-2019 | ||||||
|---|---|---|---|---|---|---|
| Payer | Total Expenditures | Community-Based (includes residential care) | Nursing Facility | |||
| Dollars | Percentage | Dollars | Percentage | Dollars | Percentage | |
| Public | $62,200 | 44.8% | $21,100 | 29.0% | $41,200 | 62.8% |
| Medicare | 13,700 | 9.9% | 6,600 | 9.1% | 7,200 | 11.0% |
| Medicaid | 47,400 | 34.3% | 14,100 | 19.4% | 33,300 | 51.0% |
| Other public | 1,100 | 0.6% | 400 | 0.5% | 700 | 0.8% |
| Private | $75,900 | 55.0% | $51,700 | 71.0% | $24,100 | 36.9% |
| Out-of-pocket | 72,200 | 52.3% | 49,600 | 68.1% | 22,500 | 34.5% |
| Private insurance | 3,700 | 2.7% | 2,100 | 2.9% | 1,600 | 2.5% |
| Total | $138,100 | 100.0% | $72,800 | 100.0% | $65,300 | 100.0% |
| SOURCE: Authors' tabulations from DYNASIM3, run id918. NOTES: Residential care is included in community-based, not nursing facilities. LTSS prices are state and setting-specific, based on Eljay (2014), Genworth (2015), and other sources. Nursing home and residential care prices are adjusted for wage inflation; home care prices grow with the average of wage and price inflation. | ||||||
Table 3A and Table 3B combines care that is received at home and that which is received in residential care into a single category of "community care," which is contrasted with institutional care, focusing on HIPAA-level of care.13 On average, individuals can expect to spend about $138,000 for LTSS (see Table 3A, or $70,000 in PDV as shown in Table A1). However, among those who ever use paid LTSS, the average cost will be about $266,000 (Table 3B or $134,000 in PDV as shown in Table A2).
| TABLE 3B. Average Sum ($2015) of Expenditures from Age 65 through Death Projected for Users of Paid, Formal LTSS Who Turn 65 in 2015-2019 | ||||||
|---|---|---|---|---|---|---|
| Payer | Total Expenditures | Community-Based (includes residential care) | Nursing Facility | |||
| Dollars | Percentage | Dollars | Percentage | Dollars | Percentage | |
| Public | $119,000 | 44.6% | $40,000 | 28.6% | $79,000 | 62.6% |
| Medicare | 26,000 | 9.8% | 12,000 | 8.6% | 14,000 | 11.1% |
| Medicaid | 91,000 | 34.2% | 27,000 | 19.3% | 64,000 | 50.8% |
| Other public | 2,000 | 0.6% | 1,000 | 0.7% | 1,000 | 0.6% |
| Private | $147,000 | 55.3% | $100,000 | 71.4% | $47,000 | 37.3% |
| Out-of-pocket | 140,000 | 52.6% | 96,000 | 68.6% | 44,000 | 34.9% |
| Private insurance | 7,000 | 2.6% | 4,000 | 2.9% | 3,000 | 2.4% |
| Total | $266,000 | 100.0% | $140,000 | 100.0% | $126,000 | 100.0% |
Out-of-pocket costs average $72,000. Among those who have out-of-pocket costs, these costs average $140,000. About three-fifths of individuals face no out-of-pocket costs.14 Looking at community and institutional expenses together, two predominant payers are Medicaid, comprising 34 percent and out-of-pocket payments, comprising 52 percent of the sum of total LTSS expenditures, respectively. Medicare is the next most important payer, followed by private insurance and other public programs. Payer predominance varies by setting. For example, Medicaid pays for 51 percent of the total for institutional settings. For community expenses, in contrast, out-of-pocket payments by families comprise the majority, about 68 percent.15
| TABLE 4A. Average Sum ($2015) of Expenditures from Age 65 through Death Projected for Men Turning Age 65 in 2015-2019 | ||||||
|---|---|---|---|---|---|---|
| Payer | Total Expenditures | Community-Based (includes residential care) | Nursing Facility | |||
| Dollars | Percentage | Dollars | Percentage | Dollars | Percentage | |
| Public | $38,200 | 41.9% | $14,600 | 29.4% | $23,500 | 56.6% |
| Medicare | 10,600 | 11.6% | 5,100 | 10.3% | 5,500 | 13.3% |
| Medicaid | 26,600 | 29.2% | 9,100 | 18.3% | 17,400 | 41.9% |
| Other public | 1,000 | 1.1% | 400 | 0.8% | 600 | 1.4% |
| Private | $52,900 | 58.1% | $35,000 | 70.6% | $18,000 | 43.4% |
| Out-of-pocket | 50,600 | 55.5% | 33,600 | 67.7% | 17,100 | 41.2% |
| Private insurance | 2,300 | 2.5% | 1,400 | 2.8% | 900 | 2.2% |
| Total | $91,100 | 100.0% | $49,600 | 100.0% | $41,500 | 100.0% |
Expected LTSS costs are higher for women than for men. Women's costs average $180,000 (Table 4B) compared to $90,000 for men (Table 4A). These could be financed by setting aside about $90,000 for women (Table A5) and about $47,000 for men (Table A3). However, when we focus on those with any LTSS expenditures, this average jumps to $320,000 for women and $194,000 for men (translating to $160,000 and 101,000, respectively, in present value terms as shown in Table A6 and Table A4).
| TABLE 4B. Average Sum ($2015) of Expenditures from Age 65 through Death Projected for Women Turning Age 65 in 2015-2019 | ||||||
|---|---|---|---|---|---|---|
| Payer | Total Expenditures | Community-Based (includes residential care) | Nursing Facility | |||
| Dollars | Percentage | Dollars | Percentage | Dollars | Percentage | |
| Public | $84,800 | 46.5% | $27,100 | 28.6% | $57,800 | 66.0% |
| Medicare | 16,700 | 9.2% | 7,900 | 8.4% | 8,800 | 10.0% |
| Medicaid | 67,000 | 36.8% | 18,800 | 19.9% | 48,200 | 55.0% |
| Other public | 1,100 | 0.6% | 400 | 0.4% | 800 | 0.9% |
| Private | $97,400 | 53.5% | $67,500 | 71.4% | $29,800 | 34.0% |
| Out-of-pocket | 92,400 | 50.7% | 64,800 | 68.5% | 27,500 | 31.4% |
| Private insurance | 5,000 | 2.7% | 2,700 | 2.9% | 2,300 | 2.6% |
| Total | $182,200 | 100.0% | $94,600 | 100.0% | $87,600 | 100.0% |
Table 5 presents the distribution associated with Table 3A's and Table 3B's sum of expected costs for those ages 65 and older in 2015-2019. Approximately 15.2 percent of individuals can expect their LTSS expenses from age 65 onward to amount to more than $250,000, while about 6 percent will have positive but low costs ($10,000). When looked at by payer source, a much smaller percentage (approximately 9 percent) will spend $250,000 or more on LTSS out-of-pocket.
| TABLE 5. Distribution of Sum ($2015) of LTSS Expenditures from Age 65 through Death Projected for Adults Turning 65 in 2015-2019 | ||||||||||||
|---|---|---|---|---|---|---|---|---|---|---|---|---|
| Payer | Distribution of Sum ($2015) of LTSS Expenditures (% of people) | |||||||||||
| Average Expend. | Percent of People withExpend. | 0 | $10,000 | $10,000- $24,999 | $25,000- $49,999 | $50,000- $74,999 | $75,000- $99,999 | $100,000- $149,999 | $150,000- $199,999 | $200,000- $249,999 | >$250,000 | |
| Public | $62,200 | |||||||||||
| Medicare | 13,700 | 47.2 | 52.8 | 24.4 | 14.6 | 5.8 | 1.5 | 0.5 | 0.3 | 0.1 | 0.0 | 0.0 |
| Medicaid | 47,400 | 18.4 | 81.6 | 0.7 | 0.9 | 2.1 | 2.0 | 1.9 | 2.2 | 1.5 | 1.2 | 6.0 |
| Other public | 1,100 | 7.2 | 92.8 | 5.2 | 1.3 | 0.2 | 0.1 | 0.1 | 0.1 | 0.1 | 0.1 | 0.0 |
| Private | $75,900 | |||||||||||
| Out-of-pocket | 72,200 | 37.3 | 62.7 | 4.7 | 4.0 | 4.3 | 3.8 | 3.2 | 4.2 | 2.4 | 2.0 | 8.6 |
| Private insurance | 3,700 | 4.2 | 95.8 | 0.3 | 0.8 | 0.9 | 0.7 | 0.4 | 0.5 | 0.2 | 0.1 | 0.2 |
| Total | $138,100 | 52.0 | 48.0 | 5.7 | 3.8 | 5.9 | 5.1 | 4.6 | 6.2 | 3.3 | 2.2 | 15.2 |
However, these figures mask differences by income. Lower-income individuals are more likely to have more of their costs covered by Medicaid and pay less on average out-of-pocket. Table 6A and Table 6B focus on Medicaid and family out-of-pocket expenses for those turning 65 in 2015-2019. The mean sum and the distribution of the sum are shown by income quintile at age 65. The DYNASIM projections suggest that although Medicaid does reach individuals at all points in the income distribution at age 65, it primarily serves those in the bottom two quintiles. For example, about 36 percent of people in the bottom income quintile at age 65 use Medicaid LTSS, compared to just 5 percent in the top quintile at that age. Those in upper income quintiles who use Medicaid are typically individuals who have survived until their mid- to late 90s, consistent with other research (DeNardi et al., 2013).16
| TABLE 6A. Mean and Distribution of Sum ($2015) of Lifetime Medicaid LTSS Expenditures Projected for Individuals Turning Age 65 in 2015-2019 | ||||||||||||
|---|---|---|---|---|---|---|---|---|---|---|---|---|
| Payer | Distribution of Sum ($2015) of Medicaid LTSS Expenditures (% of people) | |||||||||||
| AverageExpend. | Percent of People withExpend. | 0 | $10,000 | $10,000- $24,999 | $25,000- $49,999 | $50,000- $74,999 | $75,000- $99,999 | $100,000- $149,999 | $150,000- $199,999 | $200,000- $249,999 | >$250,000 | |
| Lowest | $82,000 | 35.8 | 64.2 | 2.0 | 2.1 | 4.4 | 4.1 | 4.3 | 3.1 | 2.9 | 2.7 | 10.3 |
| Second | 72,000 | 26.6 | 73.5 | 1.2 | 1.0 | 2.9 | 2.9 | 2.9 | 3.8 | 2.2 | 1.1 | 8.6 |
| Middle | 60,000 | 21.6 | 78.4 | 0.5 | 1.1 | 2.5 | 2.4 | 1.9 | 2.0 | 1.5 | 1.7 | 8.1 |
| Fourth | 37,000 | 13.7 | 86.3 | 0.3 | 0.7 | 1.5 | 1.5 | 0.9 | 2.0 | 1.4 | 0.9 | 4.6 |
| Highest | 13,000 | 5.5 | 94.5 | 0.3 | 0.1 | 0.5 | 0.3 | 0.8 | 0.9 | 0.5 | 0.3 | 1.7 |
| Total | $47,000 | 18.4 | 81.6 | 0.7 | 0.9 | 2.1 | 2.0 | 1.9 | 2.2 | 1.5 | 1.2 | 6.0 |
Family out-of-pocket expenditures, in contrast, are more concentrated in the higher quintiles. The average out-of-pocket LTSS expense in the top quintile is approximately $97,000 compared to closer to $45,000 in the bottom quintile. But again the mean obscures important distributional information. About 12 percent of people in the top income quintile at age 65 can expect out-of-pocket expenses in excess of a quarter million dollars.
| TABLE 6B. Mean and Distribution of Sum ($2015) of Lifetime Family Out-of-Pocket LTSS Expenditures Projected for Individuals Turning Age 65 in 2015-2019 | ||||||||||||
|---|---|---|---|---|---|---|---|---|---|---|---|---|
| Payer | Distribution of Sum ($2015) of Out-of-Pocket LTSS Expenditures (% of people) | |||||||||||
| AverageExpend. | Percent of People withExpend. | 0 | $10,000 | $10,000- $24,999 | $25,000- $49,999 | $50,000- $74,999 | $75,000- $99,999 | $100,000- $149,999 | $150,000- $199,999 | $200,000- $249,999 | >$250,000 | |
| Lowest | $45,000 | 28.9 | 71.1 | 4.6 | 3.7 | 4.5 | 2.6 | 2.4 | 2.8 | 2.2 | 0.9 | 5.2 |
| Second | 57,000 | 35.6 | 64.4 | 4.1 | 4.6 | 4.4 | 3.9 | 3.9 | 3.8 | 2.4 | 1.8 | 6.8 |
| Middle | 69,000 | 40.4 | 59.6 | 5.8 | 5.4 | 4.9 | 3.7 | 4.1 | 4.0 | 3.1 | 2.3 | 7.3 |
| Fourth | 85,000 | 39.0 | 61.0 | 3.3 | 3.3 | 4.8 | 4.2 | 3.3 | 5.2 | 2.4 | 2.3 | 10.2 |
| Highest | 97,000 | 41.1 | 58.9 | 6.0 | 3.6 | 3.4 | 4.2 | 2.7 | 4.9 | 2.3 | 2.5 | 11.7 |
| Total | $73,000 | 37.3 | 62.7 | 4.7 | 4.0 | 4.3 | 3.8 | 3.2 | 4.2 | 2.4 | 2.0 | 8.6 |
Conclusion
Many Americans who survive to age 65 can expect to need and use LTSS--our estimates suggest this will be true for approximately half the population. On average, the projected duration of LTSS need is two years, and the projected use of paid LTSS is one year. The average cost of this care is $138,000. However, a number of people can expect to need LTSS for many years and to have care costs that total hundreds of thousands of dollars. Even average long-term costs can be out of reach for many Americans without some kind of financing system in place. Medicaid is an important payer for LTSS, but because it serves only those who meet income and asset criteria, many families pay for LTSS out-of-pocket. Private LTSS insurance has only a modest reach, and it predominantly covers costs for those high in the income distribution. Similarly, other public expenditures (for example, including Veterans Administration care) only help to cover small shares of the population with long-term care needs. The results presented here highlight the need for better planning for LTSS to accommodate both average and catastrophic financial risks associated with chronic disability.
Endnotes
-
Long-Term Services and Supports is also sometimes called "long-term care".
-
Services may be provided in a person's home, in the community, or in residential facilities (e.g., nursing homes or assisted living facilities) (Office of the Assistant Secretary for Planning and Evaluation, 2012).
-
Most LTSS is not medical care, but rather help with basic personal tasks of everyday life. Medicare does not cover this LTSS (also called custodial care), if that is the only care needed. Most nursing home care is custodial care. Medicare does cover care in a LTSS hospital, skilled nursing care in a skilled nursing facility, eligible home health services, and hospice and respite care.
-
In a recent representative survey of Americans aged 40-70 conducted by GfK on behalf of ASPE, only 25 percent of respondents correctly identified Medicaid as the government program that pays the most for LTSS services in the United States.
-
The ADLs enumerated in the statute are eating, toileting, transferring, bathing, dressing, and continence.
-
DYNASIM's LTSS projections draw information from a wide range of cross-sectional and longitudinal sources, including the HRS, Medicare Current Beneficiary Study, and National Health and Aging Trends Survey.
-
One challenge is how to capture trends in LTSS outcomes. When there is a clear trend, such as the decline in mortality, DYNASIM3 follows the Trustees' assumptions. Otherwise, DYNASIM3 assumes that the underlying propensity to develop LTSS needs or use LTSS continues at current levels, but that the aggregate rates observed change as the composition of the population shifts. For example, as the population becomes better educated, more people in the population will experience the rates for more highly educated adults, but the rate for an adult with a certain level of education will not change.
-
DYNASIM varies LTSS prices somewhat based on income, so that some lower-income families use lower-cost providers--especially for home care--and some higher-income families--especially those covered by private LTSS insurance--use higher-cost providers.
-
Multiple cohorts are used to provide a larger enough sample size for subpopulation analysis.
-
Income quartile is based on income relative to poverty. This accounts for economies of scale for households with more than one person. It includes earnings, pensions, Social Security, Supplemental Security Income, and asset income (defined as the annuitized value of financial assets using a multivariate annuity function) for both oneself and, if married, one's spouse.
-
Use of informal services is substantial at both the HIPAA and non-HIPAA levels, while use of formal services is more concentrated at the HIPPA-level.
-
All age 65 plus cost projections are presented in constant 2015 dollars. Dollar amounts are rounded to the nearest $100 or $1000, depending on the metric, reflecting the inherent uncertainty surrounding the projections. Tables expressed in PDV are in the Appendix (Tables A1-A9). PDV is computed using the Social Security Trustees' ultimate real interest rate of 2.9 percent. (Because the Trustees assume long-range price growth to average 2.7 percent, this amounts to a nominal discount rate of about 5.6 percent in the long-run.)
-
Table 3A and Table 3B focuses on the HIPAA-level of need, with a few exceptions: nursing home care costs are counted regardless of disability status, residential care is included only if an individual reports difficulty with at least two ADLs or is severely cognitive impaired, home care costs are only included for those meeting HIPAA criteria.
-
This estimate represents an upper bound, as the model focuses only on major cost shares for the largest LTSS payers, and does not include all possible payers. This calculation also does not include premium payments or modest cost shares (larger Medicaid and Medicare cost shares are included).
-
As noted earlier, the relative share of costs borne by different payers is quite sensitive to whether and how residential care is incorporated in these projections. Some researchers prefer to exclude the housing component of residential care which is included in these estimates. Removing the housing component reduces out-of-pocket costs markedly (see Appendix Table A10).
-
This addresses the hypothesis that higher-income families frequently benefit from Medicaid LTSS programs (Warshawsky, 2014; for other empirical investigations of this hypothesis, see, for example Baird et al., 2014, and Wiener et al., 2013).
REFERENCES
Baird M, Hurd M, & Rohwedder S (2014). Medicaid Spend-Down: The Importance of Strategic Asset Transfers to Reach Medicaid Eligibility. Presentation. RAND.
Board of Trustees, Federal Old-Age and Survivors Insurance and Federal Disability Insurance Trust Funds (2014). 2014 Annual Report of the Board of Trustees of the Federal Old-Age and Survivors Insurance and Federal Disability Insurance Trust Funds. Washington, DC: Government Printing Office.
Boards of Trustees, Federal Hospital Insurance and Federal Supplementary Medical Insurance Trust Funds (2014). 2014 Annual Report of the Boards of Trustees of the Federal Hospital Insurance and Federal Supplementary Medical Insurance Trust Funds. Washington, DC.
Centers for Medicare & Medicaid Services (2015). Your Medicare Coverage: Long-Term Care. Baltimore, MD: U.S. Department of Health and Human Services, Centers for Medicare and Medicaid Services. http://www.medicare.gov/coverage/long-term-care.html (accessed April 29, 2015).
Cohen, M (2014). The Current State of the Long-Term Care Insurance Market. 14th Annual Intercompany Long-Term Care Insurance Conference. Orlando, FL.
Commission on Long-Term Care (2013). Report to the Congress. Washington, DC: U.S. Senate.
Congressional Budget Office (2013). Rising Demand for Long-Term Services and Supports for Elderly People. Washington, DC: Congressional Budget Office.
DeNardi M, French E, & Baily Jones J (2013). Medicaid Insurance in Old Age. Working Paper number 2012-2013. Chicago, IL: Federal Reserve Bank of Chicago.
Doty P, & Shipley S (2012). Long-Term Care Insurance Research Brief. ASPE Research Brief. Washington, DC: U.S. Department of Health and Human Services, Office of the Assistant Secretary for Planning and Evaluation. http://aspe.hhs.gov/daltcp/reports/2012/ltcinsRB.shtml.
Eljay (2014). A Report on Shortfalls in Medicaid Funding for Nursing Center Care. American Health Care Association.
Favreault M, & Johnson R (2015). Task 6: Projections of lifetime risk of long-term services and supports at ages 65 and older under current law from DYNASIM. Memorandum for ASPE produced under Contract Number HHSP23320095654WC, Task Order HHSP233370292T. Washington, DC: The Urban Institute.
Fossett J, & Burke C (2010). Medicaid Policy and Long-Term Care Spending: An Interactive View. Rockefeller Institute.
Freedman VA & Spillman BC (2014). Disability and care needs among older Americans. Milbank Quarterly, 92(3): 509-541.
Freundlich N (2014). Long-Term Care: What are the Issues? Princeton, NJ: Robert Wood Johnson Foundation.
Genworth (2014). 2014 Cost of Care Survey: Home Care Providers, Adult Day Health Care Facilities, Assisted Living Facilities and Nursing Homes. Richmond, VA: Genworth.
Genworth (2015). 2015 Cost of Care Survey: Home Care Providers, Adult Day Health Care Facilities, Assisted Living Facilities and Nursing Homes. Richmond, VA: Genworth.
Grabowski D, Feng Z, Intrator O, & Mor V (2004). Recent trends in state nursing home payment policies. Health Affairs.
Ho A, Collins S, Davis K, & Doty M (2005). A Look at Working-Age Caregivers' Roles, Health Concerns and Need for Support. Issue Brief. Washington, DC: Commonwealth Fund.
Kane J (2013). PBS Newshour: Americans Seriously Unprepared for Long-Term Care, Survey Finds. http://www.pbs.org/newshour/rundown/as-boomers-age-most-woefully-unprepared-for-long-term-care/ (accessed May 5, 2015).
Kaye HS, Harrington C, & LaPlant M (2010). Long-term care: Who gets it, who provides it, who pays, and how much? Health Affairs, 11-21.
Kemper P, Komisar HL, & Alecxih L (2005/2006). Long-term care over an uncertain future: What can current retirees expect? Inquiry, 42: 335-350.
Komisar H (2013). AARP Thinking Policy. http://blog.aarp.org/2013/08/22/medicare-does-not-pay-for-long-term-care/ (accessed April 29, 2015).
Mollica R (2009). State Medicaid Reimbursement Policies and Practices in Assisted Living. National Center for Assisted Living, American Health Care Association.
Murphy E (2015). Is Long-Term Care Insurance Right for Your Family? http://minnesota.cbslocal.com/2015/02/24/is-long-term-care-insurance-right-for-your-family/.
Ng T, Harrington C, Musumeci M, & Reaves E (2014). Medicaid Home and Community-Based Services Programs: 2010 Data Update. Menlo Park, CA: Kaiser Commission on Medicaid and the Uninsured.
Office of the Assistant Secretary for Planning & Evaluation (2012). Glossary of Terms. Washington, DC: U.S. Department of Health and Human Services, Office of the Assistant Secretary for Planning and Evaluation. http://aspe.hhs.gov/daltcp/diction.shtml (accessed May 1, 2015).
Scism L (2015). Long-term care insurance: Is it worth it? Wall Street Journal.
Tompson T, Benz J, Junius A, Nguyen K, & Lowell K (2013). Long-Term Care: Perceptions, Experiences and Attitudes among Americans 40 or Older. Research Highlights, Associated Press-NORC Center for Public Affairs Research.
U.S. Department of Health and Human Services (2015). LongTermCare.gov. http://longtermcare.gov/medicare-medicaid-more/medicaid/medicaid-eligibility/ (accessed May 1, 2015).
VanDerhei J (2015). Retirement Savings Shortfalls: Evidence from EBRI's Retirement Security Projection Model. Issue Brief, Employee Benefit Research Institute.
Warshawsky M (2014). Millionaires on Medicaid. Wall Street Journal.
Wiener J, Anderson W, Khatutsky G, Kaganova Y, & O'Keeffe J (2013). Medicaid Spend Down: New Estimates and Implications for Long-Term Services and Supports Financing Reform: Final Report. Research Triangle Park, NC: RTI International, prepared for the SCAN Foundation.
Wiener J, Khatutsky G, Thach N, & Greene A (2015). What Americans Think About Long-Term Care. ASPE Issue Brief. Research Triangle Park, NC: RTI, prepared for U.S. Department of Health and Human Services, Office of the Assistant Secretary for Planning and Evaluation.
Appendix: Projections of LTSS Expenditures Using Present Discounted Value
| TABLE A1. Average PDV ($2015) of Expenditures from Age 65 through Death Projected for Adults Turning 65 in 2015-2019 | ||||||
|---|---|---|---|---|---|---|
| Payer | Total Expenditures | Community-Based (includes residential care) | Nursing Facility | |||
| Dollars | Percentage | Dollars | Percentage | Dollars | Percentage | |
| Public | $31,500 | 45.3% | $11,200 | 30.4% | $20,400 | 62.6% |
| Medicare | 7,300 | 10.5% | 3,600 | 9.8% | 3,800 | 11.7% |
| Medicaid | 23,700 | 34.1% | 7,400 | 20.1% | 16,300 | 50.0% |
| Other public | 500 | 0.7% | 200 | 0.5% | 300 | 0.9% |
| Private | $38,000 | 54.7% | $25,700 | 69.6% | $12,200 | 37.4% |
| Out-of-pocket | 36,000 | 51.8% | 24,600 | 66.7% | 11,400 | 35.0% |
| Private insurance | 2,000 | 2.9% | 1,100 | 3.0% | 800 | 2.5% |
| Total | $69,500 | 100.0% | $36,900 | 100.0% | $32,600 | 100.0% |
| TABLE A2. Average PDV ($2015) of Expenditures from Age 65 through Death Projected for Adults who Use Paid, Formal LTSS and Turn Age 65 in 2015-2019 | ||||||
|---|---|---|---|---|---|---|
| Payer | Total Expenditures | Community-Based (includes residential care) | Nursing Facility | |||
| Dollars | Percentage | Dollars | Percentage | Dollars | Percentage | |
| Public | $60,100 | 45.0% | $21,000 | 29.6% | $39,100 | 62.3% |
| Medicare | 13,700 | 10.2% | 6,500 | 9.2% | 7,200 | 11.5% |
| Medicaid | 45,400 | 34.0% | 14,100 | 19.9% | 31,300 | 49.8% |
| Other public | 1,000 | 0.7% | 400 | 0.6% | 600 | 1.0% |
| Private | $73,600 | 55.0% | $49,900 | 70.4% | $23,700 | 37.7% |
| Out-of-pocket | 69,800 | 52.2% | 47,700 | 67.3% | 22,100 | 35.2% |
| Private insurance | 3,800 | 2.8% | 2,200 | 3.1% | 1,600 | 2.5% |
| Total | $133,700 | 100.0% | $70,900 | 100.0% | $62,800 | 100.0% |
| TABLE A3. Average PDV ($2015) of Expenditures from Age 65 through Death Projected for Men Turning 65 in 2015-2019 | ||||||
|---|---|---|---|---|---|---|
| Payer | Total Expenditures | Community-Based (includes residential care) | Nursing Facility | |||
| Dollars | Percentage | Dollars | Percentage | Dollars | Percentage | |
| Public | $20,200 | 42.6% | $7,800 | 30.6% | $12,400 | 57.0% |
| Medicare | 5,800 | 12.2% | 2,800 | 11.0% | 3,000 | 13.8% |
| Medicaid | 13,900 | 29.3% | 4,800 | 18.8% | 9,120 | 41.8% |
| Other public | 500 | 1.1% | 200 | 0.8% | 300 | 1.4% |
| Private | $27,200 | 57.4% | $17,700 | 69.4% | $9,400 | 43.1% |
| Out-of-pocket | 25,900 | 54.6% | 16,900 | 66.3% | 8,900 | 40.8% |
| Private insurance | 1,300 | 2.7% | 800 | 3.1% | 500 | 2.3% |
| Total | $47,400 | 100.0% | $25,500 | 100.0% | $21,800 | 100.0% |
| TABLE A4. Average PDV ($2015) of Expenditures from Age 65 through Death Projected for Men Who Use LTSS at the HIPAA-Level and Turn 65 in 2015-2019 | ||||||
|---|---|---|---|---|---|---|
| Payer | Total Expenditures | Community-Based (includes residential care) | Nursing Facility | |||
| Dollars | Percentage | Dollars | Percentage | Dollars | Percentage | |
| Public | $42,500 | 42.1% | $16,100 | 29.5% | $26,300 | 56.6% |
| Medicare | 11,900 | 11.8% | 5,600 | 10.3% | 6,300 | 13.5% |
| Medicaid | 29,500 | 29.2% | 10,100 | 18.5% | 19,400 | 41.7% |
| Other public | 1,100 | 1.1% | 400 | 0.7% | 600 | 1.3% |
| Private | $58,500 | 57.9% | $38,400 | 70.5% | $20,200 | 43.4% |
| Out-of-pocket | 55,900 | 55.3% | 36,700 | 67.3% | 19,200 | 41.3% |
| Private insurance | 2,600 | 2.6% | 1,700 | 3.1% | 1,000 | 2.2% |
| Total | $101,000 | 100.0% | $54,500 | 100.0% | $46,500 | 100.0% |
| TABLE A5. Average PDV ($2015) of Expenditures from Age 65 through Death Projected for Women Turning 65 in 2015-2019 | ||||||
|---|---|---|---|---|---|---|
| Payer | Total Expenditures | Community-Based (includes residential care) | Nursing Facility | |||
| Dollars | Percentage | Dollars | Percentage | Dollars | Percentage | |
| Public | $42,300 | 46.8% | $14,400 | 30.3% | $27,900 | 65.2% |
| Medicare | 8,800 | 9.7% | 4,300 | 9.1% | 4,500 | 10.5% |
| Medicaid | 32,900 | 36.4% | 9,900 | 20.8% | 23,000 | 53.7% |
| Other public | 600 | 0.7% | 200 | 0.4% | 400 | 0.9% |
| Private | $48,000 | 53.2% | $33,100 | 69.7% | $14,900 | 34.8% |
| Out-of-pocket | 45,300 | 50.2% | 31,600 | 66.5% | 13,700 | 32.0% |
| Private insurance | 2,700 | 3.0% | 1,500 | 3.2% | 1,200 | 2.8% |
| Total | $90,300 | 100.0% | $47,500 | 100.0% | $42,800 | 100.0% |
| TABLE A6. Average PDV ($2015) of Expenditures from Age 65 through Death Projected for Women Who Use LTSS at the HIPAA-Level and Turn 65 in 2015-2019 | ||||||
|---|---|---|---|---|---|---|
| Payer | Total Expenditures | Community-Based (includes residential care) | Nursing Facility | |||
| Dollars | Percentage | Dollars | Percentage | Dollars | Percentage | |
| Public | $73,800 | 46.4% | $24,800 | 29.6% | $49,000 | 65.1% |
| Medicare | 15,100 | 9.5% | 7,200 | 8.6% | 7,900 | 10.5% |
| Medicaid | 57,700 | 36.3% | 17,200 | 20.5% | 40,500 | 53.8% |
| Other public | 1,000 | 0.6% | 400 | 0.5% | 600 | 0.8% |
| Private | $85,200 | 53.6% | $58,900 | 70.4% | $26,300 | 34.9% |
| Out-of-pocket | 80,500 | 50.6% | 56,300 | 67.3% | 24,200 | 32.1% |
| Private insurance | 4,700 | 3.0% | 2,600 | 3.1% | 2,100 | 2.8% |
| Total | $159,000 | 100.0% | $83,700 | 100.0% | $75,300 | 100.0% |
| TABLE A7. Distribution of PDV ($2015) of LTSS Expenditures from Age 65 through Death Projected for Individuals Turning 65 in 2015-2019 | ||||||||||||
|---|---|---|---|---|---|---|---|---|---|---|---|---|
| Payer | Distribution of PDV ($2015) of LTSS Expenditures (% of people) | |||||||||||
| AverageExpend. | Percent of People withExpend. | 0 | $10,000 | $10,000- $24,999 | $25,000- $49,999 | $50,000- $74,999 | $75,000- $99,999 | $100,000- $149,999 | $150,000- $199,999 | $200,000- $249,999 | >$250,000 | |
| Public | $31,500 | |||||||||||
| Medicare | 7,300 | 47.2 | 52.8 | 24.4 | 14.6 | 5.8 | 1.5 | 0.5 | 0.3 | 0.1 | 0.0 | 0.0 |
| Medicaid | 23,700 | 18.4 | 81.6 | 1.2 | 2.0 | 4.2 | 2.1 | 1.5 | 2.2 | 1.4 | 1.1 | 2.7 |
| Other public | 500 | 7.2 | 92.8 | 6.3 | 0.4 | 0.2 | 0.1 | 0.1 | 0.0 | 0.0 | 0.0 | 0.0 |
| Private | $38,000 | |||||||||||
| Out-of-pocket | 36,000 | 37.3 | 62.7 | 7.3 | 5.2 | 6.9 | 4.1 | 3.0 | 3.4 | 2.2 | 1.2 | 3.9 |
| Private insurance | 2,000 | 4.2 | 95.8 | 0.8 | 1.1 | 1.1 | 0.6 | 0.3 | 0.2 | 0.1 | 0.0 | 0.1 |
| Total | $69,500 | 52.0 | 48.0 | 7.7 | 6.5 | 9.6 | 6.5 | 3.9 | 4.3 | 3.0 | 2.1 | 8.5 |
| TABLE A8. Mean and Distribution of PDV ($2015) of Lifetime Medicaid LTSS Expenditures Projected for Individuals Turning Age 65 in 2015-2019 | ||||||||||||
|---|---|---|---|---|---|---|---|---|---|---|---|---|
| Payer | Distribution of PDV ($2015) of Medicaid LTSS Expenditures (% of people) | |||||||||||
| AverageExpend. | Percent of People withExpend. | 0 | $10,000 | $10,000- $24,999 | $25,000- $49,999 | $50,000- $74,999 | $75,000- $99,999 | $100,000- $149,999 | $150,000- $199,999 | $200,000- $249,999 | >$250,000 | |
| Lowest | $43,700 | 35.8 | 64.2 | 2.9 | 4.2 | 8.2 | 3.5 | 2.8 | 4.8 | 2.2 | 1.5 | 5.7 |
| Second | 36,300 | 26.6 | 73.5 | 1.7 | 2.6 | 6.2 | 3.3 | 2.0 | 3.3 | 2.0 | 1.6 | 3.8 |
| Middle | 30,200 | 21.6 | 78.4 | 1.2 | 2.0 | 5.0 | 2.3 | 1.8 | 2.6 | 1.6 | 1.8 | 3.4 |
| Fourth | 17,000 | 13.7 | 86.3 | 0.6 | 1.6 | 2.9 | 1.9 | 1.3 | 1.4 | 1.6 | 0.7 | 1.7 |
| Highest | 5,900 | 5.5 | 94.5 | 0.4 | 0.6 | 1.4 | 0.7 | 0.6 | 0.5 | 0.3 | 0.4 | 0.6 |
| Total | $23,700 | 18.4 | 81.6 | 1.2 | 2.0 | 4.2 | 2.1 | 1.5 | 2.2 | 1.4 | 1.1 | 2.7 |
| TABLE A9. Mean and Distribution of PDV ($2015) of Lifetime Family Out-of-Pocket LTSS Expenditures Projected for Individuals Turning Age 65 in 2015-2019 | ||||||||||||
|---|---|---|---|---|---|---|---|---|---|---|---|---|
| Payer | Distribution of Sum ($2015) of Family LTSS Expenditures (% of people) | |||||||||||
| AverageExpend. | Percent of People withExpend. | 0 | $10,000 | $10,000- $24,999 | $25,000- $49,999 | $50,000- $74,999 | $75,000- $99,999 | $100,000- $149,999 | $150,000- $199,999 | $200,000- $249,999 | >$250,000 | |
| Lowest | $23,400 | 28.9 | 71.1 | 6.9 | 5.7 | 4.6 | 3.1 | 1.8 | 2.0 | 1.7 | 0.9 | 2.2 |
| Second | 30,000 | 35.6 | 64.4 | 7.3 | 4.6 | 7.4 | 5.0 | 2.2 | 3.5 | 2.0 | 0.8 | 2.8 |
| Middle | 35,100 | 40.4 | 59.6 | 9.0 | 6.3 | 7.5 | 4.1 | 3.7 | 3.2 | 1.4 | 1.4 | 3.7 |
| Fourth | 42,000 | 39.0 | 61.0 | 5.5 | 5.3 | 7.8 | 4.3 | 3.9 | 3.9 | 2.6 | 1.4 | 4.5 |
| Highest | 46,300 | 41.1 | 58.9 | 8.2 | 4.7 | 7.1 | 4.3 | 3.3 | 3.9 | 2.8 | 1.5 | 5.4 |
| Total | $36,500 | 37.3 | 62.7 | 7.3 | 5.2 | 6.9 | 4.1 | 3.0 | 3.4 | 2.2 | 1.2 | 3.9 |
| TABLE A10. Average Sum ($2015) of Expenditures from Age 65 through DeathProjected for Adults Who Turn 65 in 2015-2019, Using One-Third of Residential Care Projections | ||||||
|---|---|---|---|---|---|---|
| Payer | Total Expenditures | Community-Based (includes residential care) | Nursing Facility | |||
| Dollars | Percentage | Dollars | Percentage | Dollars | Percentage | |
| Public | $62,200 | 55.7% | $21,700 | 47.3% | $41,200 | 62.8% |
| Medicare | 13,700 | 12.3% | 6,600 | 14.4% | 7,200 | 11.0% |
| Medicaid | 47,400 | 42.6% | 14,700 | 32.0% | 33,300 | 51.0% |
| Other public | 1,100 | 0.8% | 400 | 0.9% | 700 | 0.8% |
| Private | $49,000 | 44.1% | $24,200 | 52.7% | $24,100 | 36.9% |
| Out-of-pocket | 45,300 | 40.7% | 24,000 | 52.3% | 22,500 | 34.5% |
| Private insurance | 3,700 | 3.3% | 200 | 0.4% | 1,600 | 2.5% |
| Total | $111,200 | 100.0% | $45,900 | 100.0% | $65,300 | 100.0% |
| NOTE: This table shows an alternative estimate to Table 3A in which only one-third of residential care costs are included, reflecting that some prefer to exclude the housing component of residential care. Using this approach, the out-of-pocket share declines markedly (from 53% to 40%), and shares to all other payers increase. | ||||||
This Research Brief, authored by Melissa Favreault (Urban Institute) and Judith Dey (Department of Health and Human Services), presents information about the risk of needing care and associated costs to provide content for policymakers and others considering long-term care financing proposals.
The authors gratefully acknowledge conceptual and modeling help from Owen Haaga, Paul Johnson, Richard Johnson, and Brenda Spillman. We also thank Chris Giese, Richard Johnson, Harriet Komisar, William Marton, Al Schmitz, Brenda Spillman, Anne Tumlinson, and Joshua Wiener for helpful comments on earlier drafts of the longer report on which this brief is based. We are also grateful to them and others in the LTSS research community for extensive conversations about specification issues. Many advisory panel members and attendees of seminars describing earlier versions of these projections helped to refine our work. This remains work in progress that will be updated regularly as new data become available. All errors are our own.
This Brief was prepared through intramural research by the U.S. Department of Health and Human Services, Office of the Assistant Secretary for Planning and Evaluation, Office of Disability, Aging and Long-Term Care Policy. For additional information about this subject, visit the DALTCP home page at http://aspe.hhs.gov/office_specific/daltcp.cfm or contact the author at HHS/ASPE/DALTCP, Room 424E, H.H. Humphrey Building, 200 Independence Avenue, S.W., Washington, D.C. 20201, Judith.Dey@hhs.gov.