
Transitions from Medicare-Only to Medicare-Medicaid Enrollee
Rosemary Borck, Carol V. Irvin and Wilfredo Lim
Mathematica Policy Research
January 2014
This report was prepared under contract #HHSP23320095642WC between the U.S. Department of Health and Human Services (HHS), Office of Disability, Aging and Long-Term Care Policy (DALTCP) and Mathematica Policy Research. For additional information about this subject, you can visit the DALTCP home page at http://aspe.hhs.gov/office_specific/daltcp.cfm or contact the ASPE Project Officers, Hakan Aykan and John Drabek, at HHS/ASPE/DALTCP, Room 424E, H.H. Humphrey Building, 200 Independence Avenue, S.W., Washington, D.C. 20201. Their e-mail addresses are: Hakan.Aykan@hhs.gov and John.Drabek@hhs.gov.
The opinions and views expressed in this report are those of the authors. They do not necessarily reflect the views of the Department of Health and Human Services, the contractor or any other funding organization.
TABLE OF CONTENTS
- BACKGROUND
- How Do People Qualify as MMEs?
- Characteristics of Transitions to Medicare-Medicaid Enrollment
- RESULTS
- Rates of Transition from Medicare-Only to Medicare-Medicaid Enrollment
- Long-Term Care Use and Transitions to Medicare-Medicaid Enrollment
- Study Limitations
- LIST OF FIGURES
- FIGURE 1: Percentage of Medicare-Only Beneficiaries Transitioning to Medicare-Medicaid Enrollment During 2009
- FIGURE 2: Percentage of Medicare-Only Beneficiaries Transitioning to Medicare-Medicaid Enrollment During 2009
- FIGURE 3: Percentage of New Medicare-Medicaid Enrollees by Medicaid Benefits Status and Age
- FIGURE 4: Percentage of New Medicare-Medicaid Enrollees Eligible for Full Medicaid Benefits in 2009, by State
- FIGURE 5: Percentage of Medicare-Only Beneficiaries Who Transitioned to Full-Benefit Medicare-Medicaid Enrollees in 2009, by January Residence Status
- FIGURE 6: Patterns of Nursing Home Use Among New Full-Benefit Medicare-Medicaid Enrollees in January and December 2009, by Age
- FIGURE 7: Percentage of New Medicare-Medicaid Enrollees Who Started the Year in the Community Using Long-Term Care Services Following Medicaid Eligibility, 2009
- FIGURE 8: Percentage of Medicare-Only Beneficiaries Who Moved from Community to Nursing Home Stays, and Also Who Transitioned to Full-Benefit Medicare-Medicaid Eligibility During 2009
- FIGURE 9: Percentage of New Full-Benefit Medicare-Medicaid Enrollees Residing in the Community Who Used HCBS Following Transition to Medicaid Eligibility in 2009, by Age
- FIGURE 10: Percentage of New Full-Benefit Medicare-Medicaid Enrollees Age 65 and Older Using HCBS Following Transition to Medicare-Medicaid Enrollment in 2009
ABSTRACT
Objective. A Medicare beneficiary's transition from Medicare-only coverage to Medicare-Medicaid enrollment (MME) often results from the combination of need for medical care not covered by Medicare and very low income and resources. The objectives of this study were to provide up-to-date national statistics on these transitions, learn more about the extent to which transitions are associated with long-term care (LTC) use, and examine variations in MME entry across states.
Key Outcomes. We assessed transitions from Medicare-only to MME status. We examined variations in transition rates by age group, use of LTC services, and across states.
Data and Methodology. We used the 2009 Medicare Master Beneficiary Summary File (MBSF) to identify all fee-for-service MMEs age 22 and older. For comparison purposes, we also used the Medicare 5 percent sample to develop a group of Medicare-only beneficiaries who did not transition to MME status during 2009. We linked MBSF data to data from the Chronic Conditions Warehouse Timeline File for 2009 and the Medicaid Analytic eXtract 2009. We used these data sources to identify the percentage of all Medicare-only beneficiaries in January who were enrolled as MMEs in December. We assessed how transition rates differed for two key subpopulations of Medicare-only beneficiaries, those living in nursing homes and those living in the community at the beginning of the year. Within these groups, we assessed differences in transition rates based on state and age and disability status.
Results. The transition from Medicare-only to the MME status is rare during the calendar year; only 2 percent of Medicare-only beneficiaries transitioned to MME status in 2009. Transition rates were higher for beneficiaries under age 65 and rates varied considerably across states. About two-thirds of new MMEs were eligible for full Medicaid benefits, including LTC services, whereas one-third were only eligible for Medicare cost-sharing benefits.
Transition rates were particularly high among Medicare beneficiaries who used LTC services, but these enrollees accounted for a minority of new MMEs. That is, while over half of Medicare beneficiaries who transitioned to dual status lived in the community and were not using LTC services at that time, among beneficiaries who were using such services, a high proportion transitioned to dual status. In addition, there were differences in the type of LTC services (nursing home vs. home and community-based services [HCBS]) used. Just over one-fourth (28 percent) of new full-benefit MMEs used nursing home services prior to or following their transition to MME status, and this pattern varied greatly with age: 53 percent of transitioning beneficiaries age 65 and older were using nursing home services at the time of transition, compared to only 6 percent for younger new MMEs. In addition to the 28 percent of new transitioners using nursing home services, another 11 percent of all transitioners (that is, about 15 percent of the new MMEs who were in the community following transition) used Medicaid-financed HCBS.
Results varied considerably across states--most notably the percentage of new MMEs in the older age group remaining in the community at the end of the year and the percentage of new MMEs who used HCBS in the first months of Medicaid eligibility.
Conclusions/Implications. Policymakers may want to consider whether recent efforts focused on care coordination and innovative care for MMEs with chronic diseases should be extended to individuals who appear likely to transition to MME status. This extra support might help them remain in the community and prevent unnecessary nursing home admissions and reliance on Medicaid. For the majority of community-residing MMEs who did not use HCBS following transition, the findings raise questions about how and when they became eligible for Medicaid and whether initiatives exist that would slow or prevent those with low income from spending down their resources. Policymakers may also want to consider how state programs and policies can be used to reduce preventable nursing home admissions and transitions to MME status. The state variations we found may reflect differences in population demographics and income and Medicaid eligibility rules, but they may also reflect differences in state policies and programs that help people who are frail or have disabling conditions access long-term services and supports.
ACRONYMS
The following acronyms are mentioned in this report.
| Acronyms | |
| CCW | Chronic Conditions Warehouse |
| CMS | Centers for Medicare and Medicaid Services |
| ESRD | End-Stage Renal Disease |
| FFS | Fee-For-Service |
| FPL | Federal Poverty Level |
| HCBS | Home and Community-Based Services |
| HMO | Health Maintenance Organization |
| LTC | Long-Term Care |
| LTSS | Long-Term Services and Supports |
| MAX | Medicaid Analytic eXtract |
| MBSF | Master Beneficiary Summary File |
| MME | Medicare-Medicaid Enrollee |
| SNF | Skilled Nursing Facility |
| SSI | Supplemental Security Income |
INTRODUCTION
Medicare-Medicaid enrollees (MMEs) are individuals age 65 and older and those under 65 with qualifying disabilities who are enrolled in both Medicare and Medicaid coverage.1 MMEs are among the most vulnerable people served by Medicare and Medicaid. More than half of MMEs have incomes below the federal poverty level (FPL), compared to about 8 percent of Medicare enrollees who are not dually eligible (CMS 2011). They are also more likely than other Medicare enrollees to be female, and belong to minority racial or ethnic groups (CMS 2013).
A Medicare beneficiary's transition from Medicare-only coverage to MME status frequently results from the combination of high need for medical care not covered by Medicare and very low income and resources. Of particular policy concern are transitions that occur after an individual has become dependent upon institutional care and impoverished when those outcomes could have been prevented by early access to community-based services and supports or other innovations in care for people with chronic conditions. Limited information is available, however, about the rates at which these transitions occur nationally and across states and how they vary by age and service utilization. For example, the need for long-term services and supports (LTSS) not covered by Medicare has previously been identified as an important factor in the transition of Medicare-only beneficiaries to MME status, but we are not aware of recent research that estimates the percentage of new MMEs whose transition to MME status is associated with LTSS use, nationally or across states. Such information is needed by policymakers who are interested in designing programs to reduce unnecessary impoverishment and reliance on Medicaid by Medicare beneficiaries.
These possible causes for transition from Medicare-only to MME raise important policy questions for policymakers:
-
To what extent are Medicare-only beneficiaries transitioning to MME to gain coverage for long-term care (LTC) services?
-
How many Medicare-only beneficiaries transition without needing LTSS, indicating that they needed Medicaid for other reasons--possibly the out of pocket cost of acute care?
-
Are there differences in transition rates across states? And, do these differences suggest that characteristics of state LTC programs influence the rate at which Medicare-only beneficiaries become eligible for Medicaid or remain in the community?
This report provides up-to-date statistics on the transition from Medicare-only coverage to MME status, presents new information about the extent to which transitions are associated with LTSS use, and assesses how the extent and nature of transitions to MME vary across states. It expands upon earlier research in several ways. We used national administrative data rather than the survey data used by many earlier researchers. Compared to survey data, these national data provide much larger samples, allow us to observe time paths of service utilization, and include detailed information on functional status. The data also allowed us to produced statistics for each state and identify variations in transition patterns across states.
In the following section, we provide an overview of the transition from Medicare-only coverage to MME status, including a brief summary of the relevant literature. Next, we describe the data and methods we used to assess transition rates in 2009. Then, we present findings on transition rates from Medicare-only beneficiary to MME in 2009, how these rates vary by age and state, and the relationship between institutional and community-based LTSS use and transitions to MME. In the final section, we discuss our findings and highlight their policy implications.
BACKGROUND
MMEs are among the costliest users of health care (MedPAC 2011). These enrollees are about 2.5 times more likely to have one or more chronic mental or cognitive conditions than Medicare-only beneficiaries, and have higher rates of many chronic physical conditions, such as diabetes, pulmonary disease, stroke, Alzheimer's disease, and congestive heart failure and other heart disease (Kasper, Watts, and Lyon 2010). They are also more likely to have multiple chronic conditions. In 2007, 42 percent of MMEs had three or more chronic conditions, compared to about 23 percent of Medicare-only beneficiaries. Correspondingly, average health care costs for MMEs are more than double those of other Medicare beneficiaries (Jacobson et al. 2012).
In 2011, the Centers for Medicare and Medicaid Services (CMS) estimated that there were about 10.2 million MMEs (CMS 2013). This number represents an increase of about 19 percent from the 8.6 million MMEs in 2006, and almost 10 percent over the 9.3 million MMEs in 2008 (Borck et al. 2012); a faster rate of growth than the overall population of Medicare beneficiaries (CMS 2013). Partly because the baby boom birth cohort has attained the age at which work disability is most likely to occur, the composition of the MME population has been changing in recent years.2 Enrollees under age 65 who qualify for Medicare on the basis of disability increasingly represent larger percentages of the MME population, growing from 37 percent of MMEs in 2006 to 41 percent in 2011 (CMS 2013).
How Do People Qualify as MMEs?
MMEs must meet the eligibility requirements of both Medicare and Medicaid. Generally, Medicare provides health insurance coverage for most individuals age 65 and older as well as people with disabilities under age 65 who have received Social Security disability or Railroad Retirement benefits for at least two years, or have End-Stage Renal Disease (ESRD) or amyotrophic lateral sclerosis.3 Medicare benefits are provided to these groups regardless of their income or assets. Medicare covers most acute care and clinical services for its enrollees, including inpatient and outpatient care, physician services, diagnostic and preventive care, and prescription drugs. There are, however, substantial out of pocket costs for Medicare beneficiaries, including premiums and cost-sharing payments, and some uncovered services, most notably LTSS including long-term nursing home care and personal care assistance services.
In contrast to Medicare, Medicaid is a means-tested program. Individuals who are age 65 and older or have disabilities qualify for Medicaid benefits only if they meet federal and state income and resource criteria. At a high level, Medicare beneficiaries become eligible for Medicaid through one of three ways: having low income and few resources, incurring high medical expenses, or requiring an institutional level of care. Specifically, in all states, Medicare beneficiaries with incomes below federal poverty thresholds4 are eligible for Medicaid coverage of Medicare premiums and cost-sharing. Some of these enrollees will be eligible only for this cost-sharing coverage and no other Medicaid benefits (called Medicare cost-sharing MMEs).5 Others will also be eligible for Medicaid benefits. In general, states extend Medicaid coverage to all individuals who receive Supplemental Security Income (SSI).6 States otherwise have discretion to set income and other eligibility criteria within broad federal guidelines.7 First, states may choose to establish Medicaid income and asset eligibility limits that are higher than the SSI limit and extend Medicaid coverage to additional individuals (called poverty-related expansions). Some states, for example, offer Medicaid coverage to individuals who are aged or have disabilities and incomes up to the FPL.8 Some states also set higher, separate Medicaid income eligibility levels (up to 300 percent of the SSI limit) to individuals who need an institutional level of care. Finally, states may extend Medicaid eligibility to higher income individuals whose high medical costs cause them to "spend down" to Medicaid eligibility (called Medically Needy programs).
Differences in Medicaid eligibility criteria across states may result in more individuals qualifying for Medicaid, and as MMEs, in states that adopt more generous eligibility standards. Higher financial eligibility standards for LTSS in some states may also result in higher rates of MME entry among individuals needing these services than in states with lower income standards. Differences in the relative size and composition of the MME population across states may also result from differences in the availability of Medicaid services and providers as well as socio-economic and demographic patterns across states (CMS 2011).
Characteristics of Transitions to Medicare-Medicaid Enrollment
The literature suggests that few Medicare beneficiaries transition to MME status during a year, but these estimates are dated and, in some cases, rely on survey data, which do not include people in institutional care. An early study based on survey data from 1997 to 2000 found that in a given year, between 1 percent and 2 percent of Medicare-only beneficiaries became MMEs (Stuart and Singhal 2006). A more recent study of administrative data in Maryland found that enrollees transitioning to MME status (new MMEs) accounted for about 14 percent of all MMEs in that state in 2008 (Johnson, Folkemer, and Stockwell 2012). New MMEs in Maryland who were enrolled in Medicare prior to their transition to MME accounted for just over half (56 percent) of new MMEs. About 17 percent of the Medicare-only beneficiaries transitioning to MME were Medicare recipients for two years or less before gaining Medicaid eligibility.
The available literature suggests several characteristics that may be associated with the transition from Medicare-only coverage to MME status, but provides limited information to policymakers on how to target interventions to reduce transitions to MME status that result from impoverishment due to use of costly LTSS. The likelihood of transitioning to MME status increases with age or as health declines, as measured by self-reported health status, the number of co-morbidities, and functional limitations (Pezzin and Kasper 2002; Shin and Moon 2005). Other characteristics linked to becoming MMEs include being female, having low educational attainment, living in the west and in rural areas and residing in a LTC facility (Stuart and Singhal 2006). The literature also suggests that state Medicaid policies and other program characteristics may contribute to the percentage of Medicare-only beneficiaries who transition to MME status. For example, state spending on home and community-based services (HCBS) on a per-user basis has been positively associated with the likelihood of becoming an MME (Pezzin and Kasper 2002).
A recent study of Medicare-only beneficiaries who transitioned to MME in Maryland in 2008 offers more detailed insights about the population of the new MMEs in the state that year. About half of those transitioning from Medicare-only to MME became eligible due to establishing eligibility for SSI benefits or because they had too few resources to cover institutional care costs (Johnson, Folkemer, and Stockwell 2012). About 31 percent of new MMEs used nursing facility services in the year prior to transition and almost half (48 percent) used inpatient services. This type of information provides policymakers with insights into the populations of Medicare beneficiaries who might be more likely to transition to MME status and the focus of interventions that could either delay the transition or hasten it if the person could benefit from earlier access to LTSS or other services in the community. The link between the high costs of nursing home care and transition to MME status has been documented, but other patterns may also exist. One possibility, for example, is that high prices of prescription drugs for chronic conditions or high costs related to inpatient hospitalizations may result in medical spending that causes an individual to become eligible for Medicaid.
Based on this literature, we identified a few key characteristics of Medicare beneficiaries and the environment in which they reside that appear to be linked to the likelihood of transition to MME status. These factors include:
-
Age: Medicare-only beneficiaries under age 65 (all of whom are eligible because of a disability or ESRD) and those age 65 and older are expected to have different patterns of transition to MME status.
-
Nursing home use: Medicare-only beneficiaries who use nursing home services during a year are expected to be higher rates of transition to MME status than those who do not.
-
HCBS use: Among Medicare-only beneficiaries who reside in the community the need for HCBS is expected to be related to the transition to MME status.
The relationship between each of these characteristics and the transition to MME status may be relevant for policymakers, as policy options likely vary with these characteristics of enrollees and their environments. In this analysis, we examine how each of these factors, and combinations of factors, were related to rates of transition to MME status in 2009, nationally and by state. In the next section, we describe the data sources we used and our methodology for examining national and state-level transition rates in 2009.
METHODS AND DATA
We combined data from multiple sources to examine enrollee characteristics and service utilization patterns that corresponded to transitions from Medicare-only eligibility to MME status. We used the 2009 Medicare Master Beneficiary Summary File (MBSF) to identify all individuals age 22 and older who were ever enrolled as MMEs in 2009.9 We used the Medicare 5 percent sample in the MBSF to estimate the size and characteristics of the population of Medicare-only beneficiaries in 2009. The MBSF includes summary demographic information about all Medicare beneficiaries, including date of birth, date of death, state of residence, monthly Medicare managed care enrollment, monthly Medicaid eligibility status, Medicaid benefits (including whether enrollees were eligible for Medicaid benefits or limited to Medicare cost-sharing coverage only), and original reason for Medicare eligibility (disability, aged, or ESRD). We excluded some subpopulations of enrollees from our analysis:
-
Enrollees covered by a comprehensive Medicare or Medicaid managed care plan during 2009 (including health maintenance organizations (HMOs)/health information organizations, Program of All-Inclusive Care for the Elderly, and managed LTC plans) because Medicare and Medicaid claims data required to assess service utilization are not generally available for these enrollees. This restriction excluded about 3 million enrollees, including about 2 million in Medicare HMOs, 600,000 in Medicaid HMOs, and about 400,000 in both.
-
Enrollees who became eligible for Medicare on the basis of ESRD, because these enrollees have unique pathways to Medicare and Medicaid-eligibility.10 This restriction excluded 225,449 enrollees.
After identifying our sample of enrollees, we linked MBSF data with other data sources to obtain additional information about the service utilization and demographic characteristics of these enrollees.
-
Chronic Conditions Warehouse (CCW) Timeline File 2009. This file, maintained by CMS, contains person-level service use information for all Medicare beneficiaries for each day during a year. For each beneficiary, nursing home records from the Minimum Data Set, the Outcome and Assessment Information Set, and other Medicare claims are analyzed hierarchically to assign each individual to a daily place of residence. We used the Timeline file to identify beneficiaries who had nursing home stays (including Medicare-financed skilled nursing facility (SNF) stays and other nursing home stays) during 2009. For this study, individuals who were not identified as receiving nursing home care on a given day were treated as community residents.
-
Medicaid Analytic eXtract (MAX) 2009. MAX data include person-level demographic, enrollment, and expenditure information for all Medicaid enrollees. We used MAX data to identify rates of HCBS use among new MMEs within two months of their transition to Medicaid eligibility. We defined HCBS users to include individuals enrolled in a Section 1915(c) waiver, which allow states to offer HCBS to targeted groups of Medicaid enrollees with demonstrated need for these services, or with Medicaid claims for HCBS, including services provided through a state plan and services provided under a waiver. At the time of this analysis, MAX 2009 data were available for 43 states; data for Hawaii, Idaho, Maine, Missouri, New Hampshire, Oklahoma, Utah, and Wisconsin were unavailable and these states were excluded from analyses of HCBS use.
RESULTS
Rates of Transition from Medicare-Only to Medicare- Medicaid Enrollment
Consistent with previous research, we found that only a small percentage of Medicare-only beneficiaries became MMEs nationwide in 2009. Only about 2 percent (or about 629,000) of the 29 million Medicare-only beneficiaries in January were enrolled as MMEs in December (Figure 1). These new MMEs represent just under 10 percent of the 6.5 million fee-for-service (FFS) beneficiaries in our study population who were enrolled as MMEs at any time in 2009.11 This low national rate masks relatively higher rates of transition to MME status for Medicare beneficiaries under age 65 (Figure 1). About 7 percent of January Medicare-only beneficiaries under age 65 were MMEs by December (representing 350,245 new MMEs). By comparison, only about 1 percent of January Medicare-only beneficiaries age 65 and older were enrolled as MMEs in December (278,407 new MMEs).
FIGURE 1. Percentage of Medicare-Only Beneficiaries Transitioning to Medicare-Medicaid Enrollment During 2009
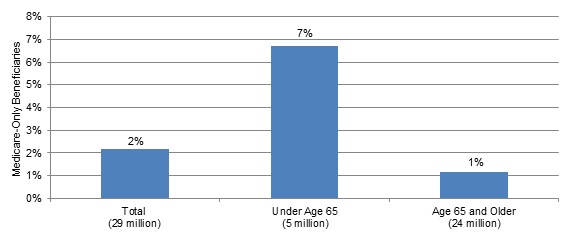
SOURCE: MBSF, 2009.
NOTES: Includes all 50 states and the District of Columbia. Age determined as of January 2009. New MMEs include enrollees eligible for full Medicaid benefits as well as enrollees receiving Medicare cost-sharing only.
Examination of transition rates by state reveals notable variation in 2009, from just less than 1 percent in Arizona12 to 5 percent in the District of Columbia (Figure 2). This variation occurred for both age groups, but was somewhat greater for individuals under age 65. For the latter group, the transition rate ranged from 2 percent in Arizona to 22 percent in the District of Columbia--an eleven-fold difference. Transition rates for aged Medicare enrollees ranged from 0.4 percent in Arizona to 2.7 percent in Maine, a seven-fold difference.13 These wide ranges likely reflect demographic differences across states as well as differences that could be affected by policy, including differences in Medicaid eligibility criteria and characteristics of the health care delivery system.
FIGURE 2. Percentage of Medicare-Only Beneficiaries Transitioning to Medicare-Medicaid Enrollment During 2009
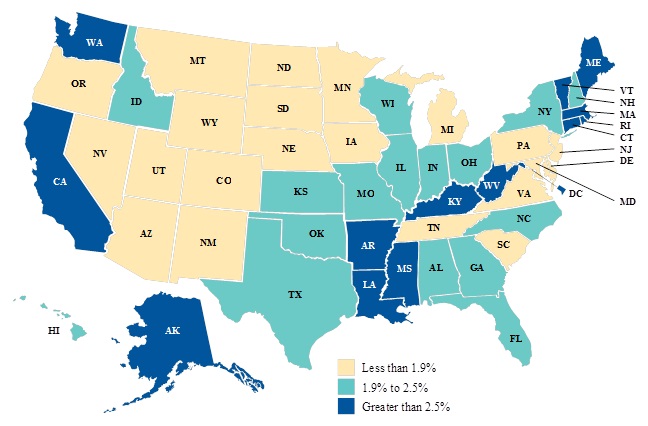
SOURCE: MBSF, 2009.
NOTE: New MMEs include enrollees eligible for full Medicaid benefits as well as enrollees receiving Medicare cost-sharing only.
Medicaid Benefits of New Medicare-Medicaid Enrollees
Nationally, about two-thirds of new MMEs (67 percent) were eligible for Medicaid-covered services, including LTSS (referred to hereafter as full-benefit MMEs) (Figure 3). These MMEs are of particular policy interest for states. Medicare-only beneficiaries age 65 and older were somewhat more likely to transition as full-benefit MMEs than those under age 65. The remaining one-third of new MMEs were eligible only for premium and copayment support (called Medicare cost-sharing), meaning that a sizeable portion of the new MME population was not eligible for any service not covered by Medicare.14 Reported Medicaid expenditures for Medicare cost-sharing MMEs often amounted to less than $1,000 per year of enrollment in 2009.15
FIGURE 3. Percentage of New Medicare-Medicaid Enrollees by Medicaid Benefits Status and Age
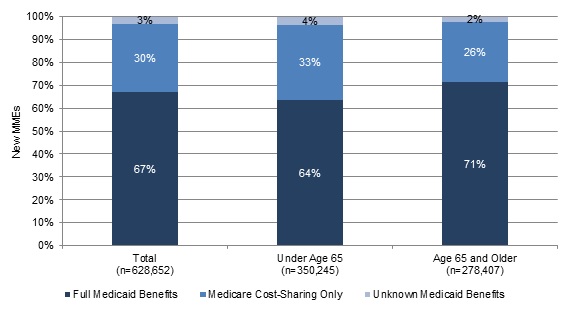
SOURCE: MBSF, 2009.
NOTE: Includes all 50 states and the District of Columbia. Age determined as of January 1, 2009.
Full-benefit MMEs represented varying proportions of the new MME population across states in 2009, from less than 20 percent of new MMEs in New Mexico and Tennessee to over 90 percent in Alaska and California (Figure 4). As with variation in overall MME transition rates, these variations likely result from different Medicaid income and other eligibility policies across states as well as differences in the socio-economic characteristics of Medicare-only beneficiaries.
FIGURE 4. Percentage of New Medicare-Medicaid Enrollees Eligible for Full Medicaid Benefits in 2009, by State
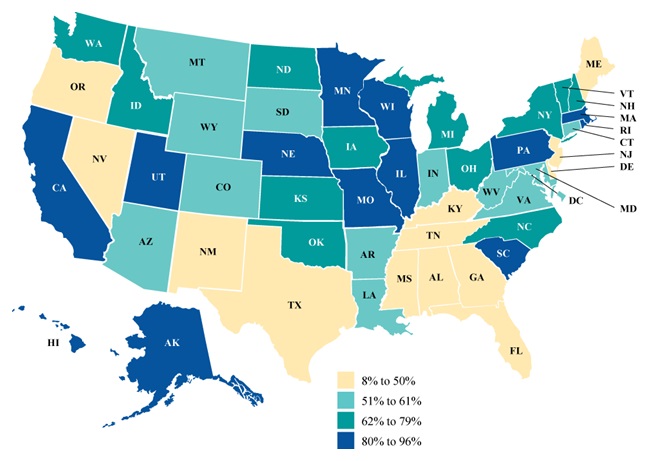
SOURCE: MBSF, 2009.
Long-Term Care Use and Transitions to Medicare-Medicaid Enrollment
In this section, we present statistics that reflect the role that LTSS use plays in the transition to full-benefit MME. First, we consider transition rates among Medicare-only beneficiaries who started the year in nursing home care. Second, we assess transition rates among Medicare-only beneficiaries who were living in the community at the start of the year. Because only full-benefit MMEs are eligible for Medicaid-financed LTSS, this analysis focuses on the population of 421,411 new full-benefit MMEs in 2009. In this analysis, we consider LTSS use of individuals 65 and older separately from that of individuals under age 65 as previous research has found that the two populations have distinct patterns of LTSS use, with older LTSS users more likely to receive care in institutions (Watts, Lawton, and Young 2011).16
Transitions to Medicare-Medicaid Enrollment Among Medicare Beneficiaries in Nursing Home Care
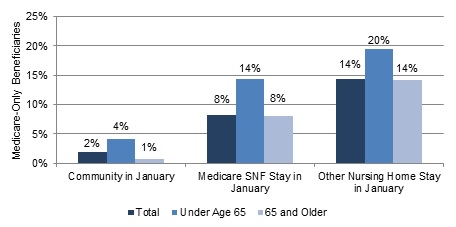
Transition rates were relatively high for the minority of Medicare-only beneficiaries who used nursing home services in 2009. Medicare-only beneficiaries who started 2009 in a nursing home, including those with Medicare SNF and private pay nursing home stays, had higher rates of transition to MME status than individuals who started the year residing in the community (8 percent and 14 percent, respectively, compared to 2 percent of community-residing enrollees, Figure 5).
FIGURE 5. Percentage of Medicare-only Beneficiaries Who Transitioned to Full-Benefit Medicare-Medicaid Enrollees in 2009, by January Residence Status
SOURCES: MBSF, 2009; CCW Timeline File, 2009.
NOTES: Includes all 50 states and the District of Columbia. Age determined as of January 2009. New MMEs include enrollees eligible for Medicaid benefits. Residence status is based on residence during January 2009. Individuals with any nursing home stays (Medicare SNF or other nursing home stays) in January are identified as residing in a nursing home during the month. All other enrollees are identified as living in the community during the month.
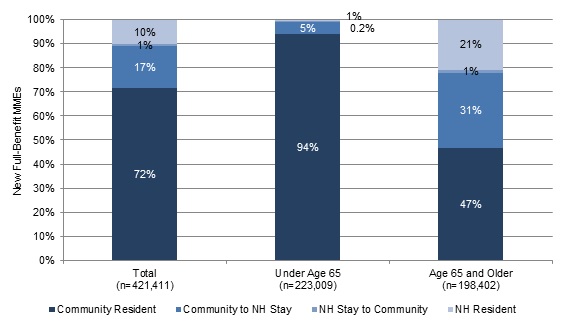
Moreover, very few of the new MMEs who were in nursing home care in January had left this care by the end of the year. As Figure 6 shows, only about 1 percent of new MMEs started the year as nursing home residents in January and moved to the community by December. Nursing home stays are generally very expensive, averaging just over $83,000 per person-year of care in 2010 (Reaves and Young 2013). These stays also signal notable functional decline for an individual. Given the expense of this care and the low rate of transition back to the community, it is not surprising that Medicare-only beneficiaries who lived in these facilities at the beginning of the year had higher rates of transition to MME status than those who did not, especially among those whose stay in January was not covered by Medicare.17
FIGURE 6. Patterns of Nursing Home Use Among New Full-Benefit Medicare-Medicaid Enrollees in January and December 2009, by Age
SOURCES: MBSF, 2009; CCW Timeline File, 2009.
NOTES: Includes all 50 states and the District of Columbia. Age determined as of January 2009. New MMEs include enrollees eligible for Medicaid benefits. Residence status is based on residence during January and December 2009. Individuals with any nursing home stays (Medicare SNF or other nursing home stays) are identified as residing in a nursing home during the month. All other enrollees are identified as living in the community during the month.
Transitions to Medicare-Medicaid Enrollment Among Medicare Beneficiaries Residing in the Community
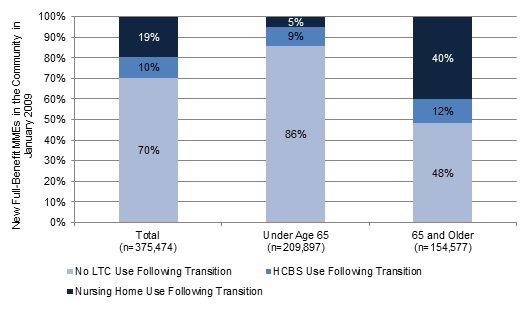
Most new MMEs (about 89 percent) started 2009 living in the community, prior to the transition to MME status (Figure 6). Pathways to Medicaid eligibility within this population of new MMEs were likely more varied than pathways among new MMEs who started the year in nursing home care. We identified three patterns in transitions for Medicare-only beneficiaries who started the year in the community and then transitioned to MME status, including two that relate to LTC needs (Figure 7):
-
Transition to MME status following a move from the community to nursing home care (about 19 percent of new MMEs who were in the community in January 2009).
-
Residence in the community with Medicaid-financed HCBS use following transition (about 10 percent of new MMEs who were in the community in January 2009).18
-
Residence in the community with no nursing home or Medicaid-financed HCBS use (about 70 percent of new MMEs who were in the community in January 2009).
FIGURE 7. Percentage of New Medicare-Medicaid Enrollees Who Started the Year in the Community Using Long-Term Care Services Following Medicaid Eligibility, 2009
SOURCES: MBSF, 2009; CCW Timeline File, 2009.
NOTES: Includes all 50 states and the District of Columbia. Age determined as of January 2009. New MMEs include enrollees eligible for Medicaid benefits. Includes enrollees who resided in the community in January 2009 and had transitioned to MME status in December 2009.
Transition from Community to Nursing Home Use
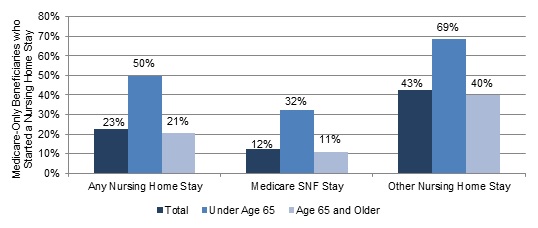
Transitions from the community to a nursing home in 2009 appeared to be closely associated with the transition to MME status. Medicare-only beneficiaries who started the year in the community and then transitioned to nursing home care had even higher transition rates than beneficiaries who started the year in a nursing home.19 Nationally, relatively few Medicare-only beneficiaries moved from the community to a nursing home in 2009 (about 325,000 individuals), but among those who made this move, about 23 percent became MMEs; ranging from 12 percent of enrollees with Medicare SNF stays to 43 percent of enrollees with private pay and other nursing home stays (Figure 8). This population was composed primarily of individuals age 65 and older. Within the new MME population about 31 percent of new MMEs age 65 and older moved from the community to a nursing home stay in 2009, compared to only about 5 percent of new MMEs under age 65 (Figure 6). As Figure 8 shows, however, those individuals under age 65 who did move to nursing home care were especially likely to become MMEs, 50 percent overall and 69 percent of those who started a nursing home stay that was not financed by Medicare.
FIGURE 8. Percentage of Medicare-Only Beneficiaries Who Moved from Community to Nursing Home Stays, and Also Who Transitioned to Full-Benefit Medicare-Medicaid Eligibility During 2009
SOURCES: MBSF, 2009; CCW Timeline File, 2009.
NOTES: Includes all 50 states and the District of Columbia. Age determined as of January 2009. New MMEs include enrollees eligible for Medicaid benefits. Includes enrollees who resided in the community in January 2009 and had either a Medicare-financed or another nursing home stay in December 2009.
The percentage of new MMEs age 65 and older who moved from the community to a nursing home stay during the year varied considerably across states, from 5 percent in Alaska to 38 percent in Pennsylvania (data not shown).20 This variation suggests that state factors may influence the likelihood of moving from the community to a nursing home and then to MME status.
HCBS Use Following MME Transition
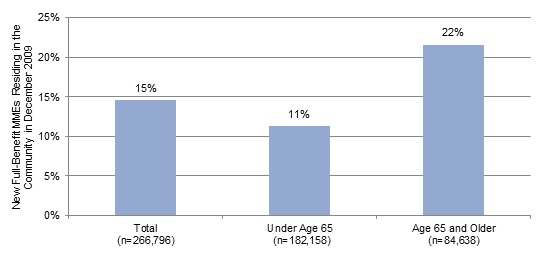
Although they remained in the community, some new MMEs may have become Medicaid-eligible to obtain LTSS. About 10 percent of all new MMEs who started the year living in the community used HCBS within two months of gaining Medicaid eligibility (Figure 7).21Figure 9 examines HCBS use among a subset of these enrollees, the population of new MMEs who remained in the community following their transition to MME status in the 43 states with available MAX data for 2009. Among these enrollees, rates of HCBS use were slightly higher (15 percent used HCBS), and particularly higher for new MMEs age 65 and older (22 percent).
FIGURE 9. Percentage of New Full-Benefit Medicare-Medicaid Enrollees Residing in the Community Who Used HCBS Following Transition to Medicaid Eligibility in 2009, by Age
SOURCES: MBSF, 2009; CCW Timeline File, 2009; MAX, 2009.
NOTES: Includes 43 states with MAX 2009 data available as of April 2, 2013. MAX eligibility or claims data for 8 states (Hawaii, Idaho, Maine, Missouri, New Hampshire, Oklahoma, Utah, and Wisconsin) were unavailable. New MMEs include enrollees eligible for Medicaid benefits. HCBS use includes services utilized in the month of transition to Medicaid eligibility or in the following month. HCBS use includes services provided under a waiver or through the state plan. Community residents include enrollees with no nursing home stays during the month.
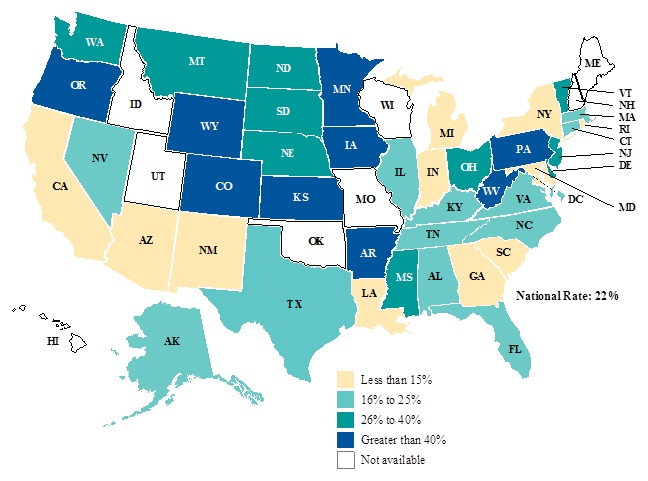
The percentage of new MMEs age 65 and older using HCBS upon transition to Medicaid eligibility varied considerably across states, from less than 15 percent of new MMEs in 12 states to more than 50 percent in Iowa, Kansas, Oregon, and Wyoming (Figure 10).22 This variation may be related to the availability of Medicaid-covered HCBS across states (e.g., whether state offers HCBS waiver services, number of enrollees these programs can serve, existence of and length of waiting lists for services), as well as other factors related to the state's LTC system and socio-economic and cultural characteristics of the state.
FIGURE 10. Percentage of New Full-Benefit Medicare-Medicaid Enrollees Age 65 and Older Using HCBS Following Transition to Medicare-Medicaid Enrollment in 2009
SOURCES: MBSF, 2009; CCW Timeline File, 2009; MAX, 2009.
NOTES: Includes 43 states with MAX 2009 data available as of April 2, 2013. MAX eligibility or claims data for 8 states (Hawaii, Idaho, Maine, Missouri, New Hampshire, Oklahoma, Utah, and Wisconsin) were unavailable. Age determined as of January 2009. New MMEs include enrollees eligible for Medicaid benefits. HCBS use includes services utilized in the month of transition to Medicaid eligibility or in the following month. HCBS include services provided under a waiver or the state plan.
Community-Residing New MMEs without Medicaid-financed Long-Term Care
Although there were some clear relationships between LTSS use and transition to MME status, the majority (about 70 percent) of new MMEs who started the year living in the community had no nursing home or Medicaid-financed HCBS use prior to or following their transition to MME status (Figure 7). This pattern was particularly common among new MMEs under age 65, 86 percent of whom used no LTSS in 2009.
Moreover, although new MMEs age 65 and older were more likely than younger MMEs to use nursing home care or HCBS following their transition to MME, it is important to note that almost half (48 percent) of these MMEs also remained in the community all year and did not use LTSS (Figure 7). Whereas the percentage of new MMEs under age 65 who remained in the community following MME transition was relatively consistent across states, there was considerable variation in the percentage of aged new MMEs remaining in the community in December, from less than 25 percent of new MMEs in Alabama and Kentucky to over 90 percent in Alaska with states distributed throughout this range (data not shown).
Study Limitations
Some limitations of this study should be kept in mind when interpreting the results. First, the administrative data we used to draw comparisons across states, including the MBSF and the MAX files, had limitations in 2009 that reduce the representativeness and comparability of the results across states. Most notably, at a national level, the data do not include reliable service utilization records for managed care enrollees in most states. For that reason, we excluded managed care enrollees from our analyses and focused exclusively on FFS enrollees. Nationally, relatively few MMEs were enrolled in Medicaid or Medicare managed care that provided LTSS in 2009, so in some states with higher managed care penetration among individuals who are aged or eligible on the basis of disability, these exclusions may mean that state-level results are not representative of the entire MME population. Moreover, states independently collect and report Medicaid enrollment and expenditure information to CMS, with one result that data from nine states were unavailable at the time of this analysis. Due to differences in their data reporting systems and capabilities, MAX data contain some state-specific anomalous and possibly incomplete data elements. Researchers who are interested in more detailed results for a specific state should review MAX data anomalies.23
A second limitation is that, like any descriptive analysis, the results are exploratory and may be more useful for raising questions about transitions to MME status than for answering them. In general, we are able to identify some patterns in transition rates by age, state, and LTSS use. In some cases our findings quantify relationships that are predicted by earlier research, for example that nursing home use is associated with Medicaid eligibility. In other cases, our findings raise questions about relationships that have been studied less frequently. For example, our findings about the large number of new MMEs who did not use LTSS in 2009 raise questions about why they entered.
Finally, by examining only one year, it was not possible to observe trends over time in the observed transition patterns, at the national or state levels. In some states, 2009 may have been a unique year due to the effects of program or policy changes and acute fiscal distress following the recession. Transition rates in these states may be atypical. Moreover, transition rates may be affected by changing state demographics over time. Thus, we cannot determine whether the transition rates and service utilization patterns we found are increasing or declining over time.
CONCLUSIONS AND POLICY IMPLICATIONS
This study indicates that while overall few Medicare-only beneficiaries transition to MME status during the year, the transition rate to MME differs for two key subpopulations of Medicare beneficiaries--those who start the year in nursing home care and those who reside in the community. Within these populations, transition rates differ by age (under 65 and 65 and older) and also across states.
This study confirmed previous research that suggested nursing home use was an important factor for the transition to MME status. About 28 percent of all new full-benefit MMEs used nursing home services, prior to or following their transition to MME status in 2009. Rates of nursing home use were higher among those age 65 and older (53 percent of these enrollees) and lower among MMEs under age 65 (6 percent). Rates of transition to MME status were particularly high among those enrollees who had nursing home stays that were not covered by the Medicare SNF benefit and for enrollees who newly transitioned from the community to a nursing home. This relationship between institutional residence and MME status is consistent with research that indicates that most Medicare beneficiaries in nursing home care are MMEs. In 2008, about 73 percent of all Medicare enrollees in LTC facilities were MMEs; about 13 percent of all MMEs lived in a LTC facility, including nursing homes and mental health facilities, compared to about 1 percent of Medicare enrollees who were not eligible for Medicaid (Jacobson et al. 2012).
If it is assumed that the transition from Medicare-only status to MME following a nursing home stay frequently involves the impoverishment of the enrollee or a change in functional status, the particularly high transition rate among Medicare beneficiaries who moved from the community to a nursing home in 2009 suggests the importance of timely identification and prevention of those new nursing home admissions that may be avoidable. For these enrollees, a recent decline in functional status or loss of community supports may have led to the need for expensive nursing home services, which, in turn, led to the decline in assets (and spending of income) that made them financially eligible for Medicaid LTSS. Moreover, the variation across states in the percentage of Medicare beneficiaries moving from the community to a nursing home in 2009 suggests that state factors, such as socio-demographic differences across states as well as differences in community resources and in eligibility requirements for Medicaid-financed LTSS, may influence the likelihood of moving from the community to a nursing home and then to MME status. In addition, state policies and programs may influence the size and composition of the Medicare-only population in each state, which makes state variation in transition rates difficult to interpret. For example, the availability of community-based LTSS, the extent to which a state focuses resources on HCBS rather than nursing homes, and variations in financial eligibility criteria for HCBS as well as socio-economic and cultural characteristics in a state may be factors in the percentage of individuals who transition to MME status or the percentage who move from the community to a nursing home stay.
For Medicare beneficiaries who enter a nursing home, policymakers may want to consider whether recent efforts focused on care coordination and innovative care for chronic diseases, such as the Independence at Home program, should be tailored to Medicare beneficiaries who appear likely to transition to MME status (pre-MMEs). While programs would need to develop an approach to identifying pre-MMEs, this extra support may mean that these Medicare beneficiaries are more likely to remain in the community. For those who require LTSS, this identification could result in an earlier transition to MME status and an earlier link to community-based LTSS, which may help divert them from nursing homes. More research is needed to determine the cost implications of such an approach, but a program that could either prevent or postpone nursing home entry by at least a year would only be cost effective if the services needed to maintain someone's health and safety in the community were no more costly than the foregone nursing home care. To enable these programs to target pre-MMEs, additional research is needed about the characteristics of pre-MMEs and their health status, Social Security benefit amounts, and service utilization patterns and the relationship between the transition to MME status and their financial and functional status. A forthcoming companion study by Lim et al. (2013) uses quantitative analyses to test the relationship between factors such as age, LTSS use, and state program effects.
Although the path to Medicaid eligibility for the new MMEs who used nursing home services is relatively well-known, less is known about the new MMEs who did not use nursing home services--the majority of new MMEs in 2009. Most new MMEs resided in the community in 2009 and did not use nursing home services prior to or following their transition to MME status--that is, most did not become eligible for Medicaid because nursing home care impoverished them. The majority of all new MMEs in 2009 resided in the community following the transition to MME status, including almost all new MMEs under age 65, meaning that the growing population of MMEs under age 65 is using pathways to Medicaid eligibility that are not related to nursing home care.
We found evidence that the need for LTSS may have played a role in the transition to MME status for some new MMEs who remained in the community. About 15 percent of the new MMEs who remained in the community following MME transition used HCBS in the first months of Medicaid eligibility. For these enrollees, it is possible that the transition to MME and access to HCBS helped to divert them from nursing home care.
For the majority of community-residing MMEs who did not use HCBS following transition, these findings raise questions about the key pathways to Medicaid eligibility for this group. For example, are there particular service use patterns, such as emergency room use or hospitalizations, which predict transitions to MME for these enrollees? The forthcoming work by Lim et al. (2013) investigates this question. Or, are there costs that do not appear in administrative data, such as out of pocket payments for personal assistance and homemaker services or other, non-medical costs that help to explain these enrollees' depletion of resources and transitions to Medicaid eligibility? Alternatively, do the results for community-residing MMEs whose Medicare eligibility is based on disability reflect declines in their earnings that are not made up by cash benefits and the depletion of assets leading to eligibility for SSI benefits? Such information could help policymakers identify target groups in the Medicare-only population for innovations that will reduce MME entry that is related to preventable impoverishment or functional declines.
Lastly, many of the national results varied considerably across states in 2009, suggesting that policymakers may want to consider how state programs and policies can be used to reduce preventable nursing home admissions. In particular, the percentages of new MMEs in the older age group remaining in the community at the end of the year and the percentages of new MMEs who used HCBS in the first months of Medicaid eligibility differed across states and may reflect differences in population demographics and income and Medicaid eligibility rules, but they may also reflect differences in state Medicaid policies and programs that help people who are frail or have disabling conditions access LTSS earlier. For example, rates of HCBS use and community residence may be higher in some states due to LTC systems that encourage use of these services by offering enrollees opportunities to direct their HCBS (for example, including tools and programs to facilitate choice) and the ease of access to services. It is plausible that in these states transition rates to MME status may be higher because more Medicare beneficiaries are attracted to these services and supports.
REFERENCES
Borck, R., A. Dodd, A. Zlatinov, S. Verghese, and R. Malsberger. Medicaid Analytic eXtract 2008 Chartbook. Washington, DC: CMS, 2012. Available at: http://www.cms.gov/Research-Statistics-Data-and-Systems/Computer-Data-and-Systems/MedicaidDataSourcesGenInfo/MAX_Chartbooks.html.
Centers for Medicare and Medicaid Services. "Data Analysis Brief: Medicare-Medicaid Enrollment from 2006 to 2011." Prepared by the Medicare-Medicaid Coordination Office. February 2013. Available at: http://www.cms.gov/Medicare-Medicaid-Coordination/Medicare-and-Medicaid-Coordination/Medicare-Medicaid-Coordination-Office/Downloads/Dual_Enrollment_2006-2011_Final_Document.pdf.
Centers for Medicare and Medicaid Services. 2011. "Medicare-Medicaid Enrollee Profile: National Summary." Available at: http://www.integratedcareresourcecenter.com/PDFs/National_Summary_Final.pdf.
Jacobson, G., T. Neuman, A. Damico, and B. Lyons. "Kaiser Family Foundation Program on Medicare Policy: The Role of Medicare for the People Dually Eligible for Medicare and Medicaid." April 2012. Available at: http://www.kff.org/medicare/upload/8138-02.pdf.
Johnson, K., D. Folkemer, and I. Stockwell. "New Medicare-Medicaid Enrollees in Maryland: Demographic and Programmatic Characteristics." Baltimore, MD: The Hilltop Institute, UMBC, February 9, 2012.
Kasper, J., M. O'Malley Watts, and B. Lyons. "Chronic Disease and Co-Morbidity Among Dual Eligibles: Implications for Patterns of Medicaid and Medicare Service Use and Spending." Kaiser Commission on Medicaid and the Uninsured, Kaiser Family Foundation. July 2010. Available at: http://www.kff.org/medicaid/upload/8081.pdf.
Lim, W., C. Irvin, and R. Borck. "Factors Predicting Transitions from Medicare-Only to Medicare-Medicaid Enrollee Status." Mathematica Policy Research. Report submitted to the U.S. Department of Health and Human Services, Assistant Secretary for Planning and Evaluation. Forthcoming 2013.
Medicare Payment Advisory Commission. "A Data Book: Health Care Spending and the Medicare Program." June 2011. Available at: http://www.medpac.gov/documents/Jun11DataBookEntireReport.pdf.
Pezzin, L.E., and J.D. Kasper. "Medicaid Enrollment among Elderly Medicare Beneficiaries: Individual Determinants, Effects of State Policy, and Impact on Service Use." Health Services Research, 37:4, August 2002.
Reaves, E. and K. Young. "Medicaid's Role in Meeting the Long-Term Care Needs of America's Seniors: Policy Brief." Kaiser Commission on Medicaid and the Uninsured. January 2013. Available at: http://www.kff.org/medicaid/upload/8403.pdf.
Shin, J., and S. Moon. "Utilization of Home Healthcare Service by Medicare-Medicaid Dual Eligibles." Annals of Economics and Finance, 6:89-104, 2005.
Stuart, B., and P. Singhal. "The Stability of Medicaid Coverage for Low-Income Dually Eligible Medicare Beneficiaries." Menlo Park, CA: Kaiser Family Foundation Policy Brief, Publication #7512. 2006.
Watts, M.O., E. Lawton, and K. Young. "Medicaid's Long-Term Care Users: Spending Patterns Across Institutional and Community-Based Settings. Issue Paper." Kaiser Commission on Medicaid and the Uninsured. October 2011. Available at: http://www.kff.org/medicaid/upload/7576-02.pdf.
NOTES
-
These enrollees are also commonly called dual eligibles.
-
The Census Bureau defines the baby boom generation as people born in 1946-1964. These individuals would have been 45-63 years old in 2009, the year focused on in this study.
-
Social Security beneficiaries are primarily workers with disabling conditions, but also include disabled adult children or widows of other Social Security beneficiaries.
-
A few states--including Connecticut, the District of Columbia, and Maine--have income limits above the federal requirements for the Medicare Savings Program because they use more generous income disregards. States may also set differing asset limits for Medicare Savings Program participants.
-
The proportion of MMEs eligible only for cost-sharing has increased at a particularly fast rate from 2006 to 2011, growing from about 21 percent to about 27 percent of all MMEs during that period (CMS 2013).
-
Section 209(b) of the Social Security Amendments of 1972 permits states to use more restrictive eligibility requirements than those of the SSI program. These requirements cannot be more restrictive than those in place in the state's Medicaid plan as of January 1, 1972. In 2009, there were 11 Section 209(b) states: Connecticut, Hawaii, Illinois, Indiana, Minnesota, Missouri, North Dakota, New Hampshire, Ohio, Oklahoma, and Virginia.
-
For more detailed information about pathways to Medicaid eligibility for individuals who are aged or have a disability see Kaiser Family Foundation (2010).
-
In 2009, the FPL was equivalent to an annual income of $10,830 for an individual or $14,570 for a couple.
-
We wanted to focus the study on adults to eliminate some of the complexities associated with the differences in Medicaid eligibility rules between children and adults. Some Medicaid eligibility policies consider beneficiaries under the age of 21 as children. To establish a sample that would be uniformly treated as adults across all categories of Medicaid beneficiaries, we selected age 22 as the cut off for this study.
-
Inclusion of the ESRD subgroup would have required obtaining information from additional data sources and it was not clear that the benefits of including this group would outweigh the additional costs of analyzing them or that we would have sufficient samples to conduct state-level analyses. Nevertheless, the exclusion of this group suggests further research will be necessary to understand whether this group has more or less similar rates of transition into MME.
-
Counts of MMEs exclude enrollees with ESRD and enrollees who were covered by Medicare or Medicaid comprehensive managed care plans.
-
Six states (Arizona, Hawaii, Minnesota, Oregon, Tennessee, and Texas) enrolled more than 20 percent of MMEs in Medicaid managed care plans. High managed care penetration among aged and disabled Medicare and Medicaid enrollees in these states may mean that the individuals left in FFS coverage likely are not representative of older adults and people with disabilities covered by Medicaid in the state.
-
Some new MMEs were first eligible for Medicaid and then later gained Medicare coverage. States with lower rates of transition from Medicare-only to MME status may have relatively more new MMEs who were enrolled in Medicaid first.
-
The population of cost-sharing MMEs includes only the MMEs whose Medicaid coverage was limited to Medicare cost-sharing. MMEs who were eligible for Medicaid-covered services, including individuals who were only eligible for LTC coverage are included in the population of full-benefit MMEs.
-
Average Medicaid expenditures per Medicare cost-sharing enrollee are reported in the state-specific MAX 2009 validation tables.
-
In a separate analysis, we found that very small percentages of new MMEs who were eligible for Medicare cost-sharing only used LTC services, institutional or HCBS, at the start or end of 2009 (data not shown). Thus, when new MMEs who are eligible only for Medicare cost-sharing are included in the analysis, the percentage of MME transitions related to LTC use is lower.
-
Medicare SNF coverage is limited to 100 days following a hospital stay. Medicare beneficiaries who require additional nursing facility care or need nursing home care that does not follow an inpatient stay would fall into the category of other nursing home stays. Given the limit on Medicare coverage for nursing home care, the other nursing home stays are generally longer, and likely to require greater resources from private coverage or out of pocket.
-
This statistic likely underestimates rates of HCBS use nationally in 2009, because MAX data on HCBS use were unavailable for seven states in this analysis.
-
One explanation for this is that the Medicare-only beneficiaries in nursing home care in January include those who entered nursing home care earlier and did not enter MME status, but exclude those who entered this care earlier and did become MMEs. They are the accumulated stock of Medicare-only nursing home residents. Those who newly enter nursing homes after January are a flow of new entrants--including both those who will enter MME and those who will not.
-
By comparison, there was little variation across states among enrollees under age 65, with few of these enrollees in any state moving from the community to a nursing home during the year.
-
This analysis is limited to the 43 states with MAX 2009 data available at the time of this analysis.
-
Total HCBS use may be undercounted in states that enroll MMEs in managed care programs that cover LTSS. These enrollees are excluded from the FFS population in this study.
-
MAX anomaly tables for each year of MAX data are available for download at: http://medicaid.gov/Medicaid-CHIP-Program-Information/By-Topics/Data-and-Systems/MAX/MAX-General-Information.html.
CENTER OF EXCELLENCE IN RESEARCH ON DISABILITY SERVICES AND CARE COORDINATION AND INTEGRATION (CERDS)
REPORTS AVAILABLE
- Abstracted List of Tasks and Reports
- HTML http://aspe.hhs.gov/daltcp/reports/2014/CERDS.shtml
- PDF http://aspe.hhs.gov/daltcp/reports/2014/CERDS.pdf
--- --- --- --- ---
- Association between NCQA Patient-Centered Medical Home Recognition for Primary Care Practices and Quality of Care for Children with Disabilities and Special Health Care Needs
- HTML http://aspe.hhs.gov/daltcp/reports/2014/ChildDisV3.shtml
- PDF http://aspe.hhs.gov/daltcp/reports/2014/ChildDisV3.pdf
- Children with Disabilities and Special Health Care Needs in NCQA-Recognized Patient-Centered Medical Homes: Health Care Utilization, Provider Perspectives and Parental Expectations Executive Summary
- HTML http://aspe.hhs.gov/daltcp/reports/2014/ChildDisES.shtml
- PDF http://aspe.hhs.gov/daltcp/reports/2014/ChildDisES.pdf
- Descriptive Study of Three Disability Competent Managed Care Plans for Medicaid Enrollees
- Executive Summary http://aspe.hhs.gov/daltcp/reports/2014/3MCPlanses.shtml
- HTML http://aspe.hhs.gov/daltcp/reports/2014/3MCPlans.shtml
- PDF http://aspe.hhs.gov/daltcp/reports/2014/3MCPlans.pdf
- Effect of PACE on Costs, Nursing Home Admissions, and Mortality: 2006-2011
- Executive Summary http://aspe.hhs.gov/daltcp/reports/2014/PACEeffectes.shtml
- HTML http://aspe.hhs.gov/daltcp/reports/2014/PACEeffect.shtml
- PDF http://aspe.hhs.gov/daltcp/reports/2014/PACEeffect.pdf
- Effectiveness of Alternative Ways of Implementing Care Management Components in Medicare D-SNPs: The Brand New Day Study
- Executive Summary http://aspe.hhs.gov/daltcp/reports/2014/OrthoV2s.shtml
- HTML http://aspe.hhs.gov/daltcp/reports/2014/OrthoV2.shtml
- PDF http://aspe.hhs.gov/daltcp/reports/2014/OrthoV2.pdf
- Effectiveness of Alternative Ways of Implementing Care Management Components in Medicare D-SNPs: The Care Wisconsin and Gateway Study
- Executive Summary http://aspe.hhs.gov/daltcp/reports/2014/OrthoV1es.shtml
- HTML http://aspe.hhs.gov/daltcp/reports/2014/OrthoV1.shtml
- PDF http://aspe.hhs.gov/daltcp/reports/2014/OrthoV1.pdf
- Evaluating PACE: A Review of the Literature
- Executive Summary http://aspe.hhs.gov/daltcp/reports/2014/PACELitReves.shtml
- HTML http://aspe.hhs.gov/daltcp/reports/2014/PACELitRev.shtml
- PDF http://aspe.hhs.gov/daltcp/reports/2014/PACELitRev.pdf
- Factors Predicting Transitions from Medicare-Only to Medicare-Medicaid Enrollee Status
- HTML http://aspe.hhs.gov/daltcp/reports/2014/MMTransV2.shtml
- PDF http://aspe.hhs.gov/daltcp/reports/2014/MMTransV2.shtml
- Identifying Medicare Beneficiaries with Disabilities: Improving on Claims-Based Algorithms
- Executive Summary http://aspe.hhs.gov/daltcp/reports/2014/algorithmes.shtml
- HTML http://aspe.hhs.gov/daltcp/reports/2014/algorithm.shtml
- PDF http://aspe.hhs.gov/daltcp/reports/2014/algorithm.pdf
- Impacts of Waiting Periods for Home and Community-Based Services on Consumers and Medicaid Long-Term Care Costs in Iowa
- HTML http://aspe.hhs.gov/daltcp/reports/2014/IAWaitPd.shtml
- PDF http://aspe.hhs.gov/daltcp/reports/2014/IAWaitPd.pdf
- Integrating Physical Health Care in Behavioral Health Agencies in Rural Pennsylvania
- Executive Summary http://aspe.hhs.gov/daltcp/reports/2014/ruralPAes.shtml
- HTML http://aspe.hhs.gov/daltcp/reports/2014/ruralPA.shtml
- PDF http://aspe.hhs.gov/daltcp/reports/2014/ruralPA.pdf
- Non-Elderly Disabled Category 2 Housing Choice Voucher Program: An Implementation and Impact Analysis
- Executive Summary http://aspe.hhs.gov/daltcp/reports/2014/Cat2Housinges.shtml
- HTML http://aspe.hhs.gov/daltcp/reports/2014/Cat2Housing.shtml
- PDF http://aspe.hhs.gov/daltcp/reports/2014/Cat2Housing.pdf
- Parent Perspectives on Care Received at Patient-Centered Medical Homes for Their Children with Special Health Care Needs
- Executive Summary http://aspe.hhs.gov/daltcp/reports/2014/ChildDisV2es.shtml
- HTML http://aspe.hhs.gov/daltcp/reports/2014/ChildDisV2.shtml
- PDF http://aspe.hhs.gov/daltcp/reports/2014/ChildDisV2.pdf
- Physician Perspectives on the Influence of Medical Home Recognition on Practice Transformation and Care Quality for Children with Special Health Care Needs
- HTML http://aspe.hhs.gov/daltcp/reports/2014/ChildDisV1.shtml
- PDF http://aspe.hhs.gov/daltcp/reports/2014/ChildDisV1.pdf
- Strategies for Integrating and Coordinating Care for Behavioral Health Populations: Case Studies of Four States
- Executive Summary http://aspe.hhs.gov/daltcp/reports/2014/4CaseStudes.shtml
- HTML http://aspe.hhs.gov/daltcp/reports/2014/4CaseStud.shtml
- PDF http://aspe.hhs.gov/daltcp/reports/2014/4CaseStud.pdf
- Transitions from Medicare-Only to Medicare-Medicaid Enrollment
- HTML http://aspe.hhs.gov/daltcp/reports/2014/MMTransV1.shtml
- PDF http://aspe.hhs.gov/daltcp/reports/2014/MMTransV1.pdf
To obtain a printed copy of this report, send the full report title and your mailing information to:
U.S. Department of Health and Human ServicesOffice of Disability, Aging and Long-Term Care PolicyRoom 424E, H.H. Humphrey Building200 Independence Avenue, S.W.Washington, D.C. 20201FAX: 202-401-7733Email: webmaster.DALTCP@hhs.gov
RETURN TO:
Office of Disability, Aging and Long-Term Care Policy (DALTCP) Home [http://aspe.hhs.gov/office_specific/daltcp.cfm]Assistant Secretary for Planning and Evaluation (ASPE) Home [http://aspe.hhs.gov]U.S. Department of Health and Human Services (HHS) Home [http://www.hhs.gov]
Last Updated: 08/06/2014