
January 2014
This report was prepared under contract #HHSP23320095642WC between the U.S. Department of Health and Human Services (HHS), Office of Disability, Aging and Long-Term Care Policy (DALTCP) and Mathematica Policy Research. For additional information about this subject, you can visit the DALTCP home page at http://aspe.hhs.gov/office_specific/daltcp.cfm or contact the ASPE Project Officers, Hakan Aykan and Pamela Doty, at HHS/ASPE/DALTCP, Room 424E, H.H. Humphrey Building, 200 Independence Avenue, S.W., Washington, D.C. 20201. Their e-mail addresses are: Hakan.Aykan@hhs.gov and Pamela.Doty@hhs.gov.
The opinions and views expressed in this report are those of the authors. They do not necessarily reflect the views of the Department of Health and Human Services, the contractor or any other funding organization.
TABLE OF CONTENTS
- I. INTRODUCTION
- III. METHODS
- A. Study Population
- B. Design for Estimating Effects of Wait Times
- C. Study Outcomes
- D. Consumer Characteristics
- E. Definition of High Risk
- F. Statistical Analyses
- IV. RESULTS
- A. Wait Times
- B. Applicant Characteristics
- C. Receipt of Waiver Services
- D. Impacts on Institutionalization Risk
- E. Impacts on Hospitalization Risk
- F. Impacts on Medicaid Long-Term Care Costs
- V. DISCUSSION
- A. Summary of Findings
- B. Limitations
- C. Policy Implications
- APPENDICES
- APPENDIX A: SUPPLEMENTARY TABLES
- LIST OF FIGURES
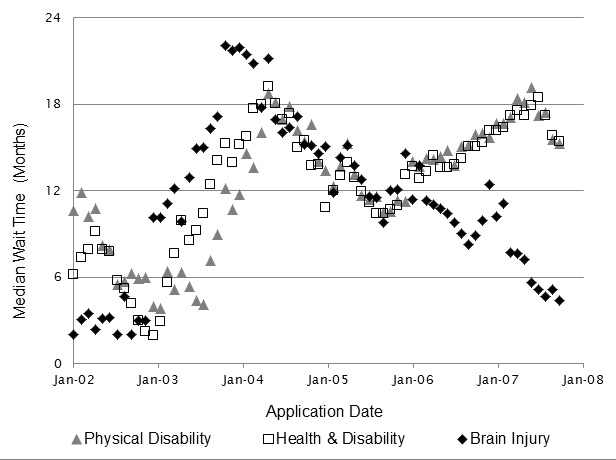
- FIGURE IV.1: Median Wait Time for Each Waiver Application Cohort, by Application Date
- LIST OF TABLES
- TABLE IV.1: Applicant Characteristics At or Near the Time of Waiver Application, by Wait Period Group and Waiver
- TABLE IV.2: Regression-Adjusted Risk of Ever Having a Long-Term Nursing Home Stay Within Three Years of Waiver Application Among Applicants Facing Short Versus Long Wait Times at Application
- TABLE IV.3: Regression-Adjusted Annualized Hospitalization Rates over the Three Years After Waiver Application Among Applicants Facing Short Versus Long Wait Times at Application
- TABLE IV.4: Regression-Adjusted Medicaid Long-Term Care Costs in the Three Years After Waiver Application Among Applicants Facing Short Versus Long Wait Times at Application
- TABLE A.1: Regression-Adjusted Odds Ratio for Risk of Ever Having a Long-Term Nursing Home Stay Within 36 Months After Application, by Wait Group, Among All High-Risk Applicants from 2002 through 2007
- TABLE A.2: Number of Applicants in Research Sample Who Applied to One or Multiple Waivers from January 1, 2002, through September 30, 2007
- TABLE A.3: Regression-Adjusted Odds Ratio for Risk of Ever Having a Long-Term Nursing Home Stay Within 36 Months After Application, by Wait Cohorts, Among High-Risk Applications for Any of the Three Waivers
- TABLE A.4: Regression-Adjusted Odds Ratio for Risk of Ever Having a Long-Term Nursing Home Stay Within 12-36 Months After Application, by Wait Group, Among High-Risk Applications for Any of the Three Waivers
- TABLE A.5: Regression-Adjusted Odds Ratio for Risk of Ever Having a Long-Term Nursing Home Stay Within 36 Months After Application, by Wait Group, Among High-Risk Applications in 2002 and 2003
- TABLE A.6: Receipt of Waiver Services, by Wait Period Group and Risk Level
- TABLE A.7: Frequently Used Waiver Services Among Waiver Enrollees
ACKNOWLEDGMENTS
The authors would like to thank the many people who contributed to this report. We thank the staff at Iowa Medicaid Enterprise, including Brian Wines, Deborah Johnson, Mark McMahon, and Jennifer Vermeer, who took time from their busy schedules to provide us with data and to describe Iowa's Home and Community-Based Services waiver programs. We also wish to thank the ASPE staff who reviewed this report and/or the design report: Pam Doty, Hakan Aykan, Peter Kemper, and Allison Cuellar. Among Mathematica staff, we thank Joe Mastrianni, Bart Baker, Mark Flick, and Shinu Verghese who collected and analyzed claims data; Sharon Clark who carefully produced the report; and Betty Teller, who edited the report.
ABSTRACT
Context: People with disabilities who apply for home and community-based services (HCBS) offered under capped Medicaid 1915(c) waivers on a first-come, first-served basis often must wait a long time for services to become available. Little is known about how such delays affect consumers and Medicaid costs.
Objective: To assess the effects of waiting periods for waiver services in Iowa on risk of long-term nursing home stays and hospitalization, and on Medicaid long-term care costs.
Study Design: A quasi-experimental design that takes advantage of the variation in wait times that occurred for waiver programs in Iowa from 2002 to 2007. The study sample includes non-elderly, community-dwelling adult applicants (n = 5,254) to one of three waiver programs from 2002 to 2007: Health and Disability (H&D), Physical Disability (PD) and Brain Injury (BI). All applicants were assigned a wait time based on the median wait among consumers who applied in the same month and eventually enrolled. Outcomes up to three years after application were compared among those facing short (less than six months) versus long (over six months) wait times, adjusting for applicants' characteristics at the time of application.
Key Outcomes: Long-term (90 days or more) nursing home stays, hospitalizations (all cause and potentially preventable), and Medicaid expenditures on long-term care services (community-based and institutional).
Data: Records from Iowa Medicaid on applicants for the waivers, including when they applied and how long they had to wait to receive the services, linked to Medicare and Medicaid claims from 2001 to 2010. All outcomes and applicant characteristics were constructed from the claims.
Results: Across the three waivers, consumers who applied when wait times were less than six months were 25 percent less likely to have ever had a long-term nursing home stay within three years of application than those who applied when wait times were longer (p = 0.07). This difference was larger among older applicants (those over age 40 for the BI waiver, and over age 55 for the other two waivers), who accounted for 42 percent of applicants and were at higher-risk of entering an institution than younger applicants. Among these older applicants, those with short wait times (versus long) had a 48 percent lower risk of having a long-term nursing home stay in the three years after application and had lower average Medicaid spending on long-term stays of $111 per person per month. These lower expenditures on nursing home care more than offset the higher expenditures on HCBS incurred by those in the short wait time group, which were a consequence of quicker access to (and therefore longer receipt of) waiver services. Among the younger waiver applicants, shorter wait time was not associated with the probability of having a long-term nursing home stay after application for two of the three waiver groups (H&D and PD waivers). However, among applicants to the BI waiver, those with short wait times were less likely to have a long-term nursing stay than those with longer waits for both younger and older applicants. Rates of hospitalizations (all cause and potentially preventable) were high among the study population, but did not differ between those with short and long waits.
Conclusions/Implications: Short wait times appear to substantially reduce the risk of long-term nursing home use among waiver applicants, with effects concentrated among older applicants to the PD and H&D waivers and among all BI waiver applicants. These findings support the value, both to consumers and Iowa Medicaid, of prioritizing waiting lists based on a patient's risk of institutionalization at the time of application, rather than solely on a first-come, first-served basis. The findings of lower long-term nursing home use for the short-wait group for both the younger (lower-risk) and older (higher-risk) subgroups among beneficiaries applying for the BI waiver, who received substantially greater amounts of HCBS than the other two waiver groups, suggest that the favorable effects of having a short wait time for services also depends on the amount of services that an individual needs. Thus, the amount of care needed should also be a factor in prioritizing waiting lists for services, if that can be determined at the time of application.
ACRONYMS
The following acronyms are mentioned in this report and/or appendices.
| Acronyms | |
| ADL | Activity of Daily Living |
| BI waiver | Brain Injury Waiver |
| CDAC | Consumer-Directed Attendant Care |
| CDPS | Chronic Illness and Disability Payment System |
| FPL | Federal Poverty Level |
| H&D waiver | Health and Disability Waiver |
| HCBS | Home and Community-Based Services |
| HHA | Home Health Aide |
| IADL | Instrumental Activity of Daily Living |
| ID waiver | Intellectual Disability Waiver |
| MAX | Medicaid Analytic eXtract |
| PACE | Program of All-Inclusive Care for the Elderly |
| PBPM | Per Beneficiary Per Month |
| PD waiver | Physical Disability waiver |
| QI | Quality Indicator |
| SAF | Standard Analytic File |
| SSI | Supplemental Security Income |
I. INTRODUCTION
Most states provide home and community-based services (HCBS) to targeted groups of Medicaid consumers with disabilities through 1915(c) waivers. The purpose of these waivers is to enable consumers whose disabilities strongly limit their daily functioning to live independently in the community rather than needing to enter a nursing home or other institution. Unlike traditional Medicaid benefits, which must be made available equally to all Medicaid enrollees, states can use 1915(c) waivers to target HCBS to specific populations and can cap the total number of people receiving these services. Over the past 15 years, the number of people served under waivers has grown by about 6 percent each year, with 3.3 million served in 2009 (Ng et al. 2012). However, in most states, demand has outpaced the supply of waiver slots. In 2011, 38 states had waiting lists for one or more of their waivers. The number of people on waiting lists grew by 17 percent in 2010 and 19 percent in 2011, with a little over half a million people on waiting lists in 2011. Nationally, the average wait time for receiving waiver services is currently about two years (Ng et al. 2012).
Despite the prevalence and growth of waiting lists, little is known about their effects on consumers and on Medicaid expenditures. Long wait times could increase an applicant's risk of entering a nursing home or of being hospitalized; this would harm consumers and could potentially increase total Medicaid spending, if increased institutional or hospital costs more than offset increased HCBS spending. Policymakers would benefit from evidence on the effects of waiting periods so that they can make informed decisions about the benefits and costs of reducing them and/or prioritizing waiting lists based on consumer need or risk of institutionalization. This study aims to help fill this gap by addressing the following two research questions: (1) Do long wait times increase the risk of long-term nursing home stays and hospitalizations as well as total Medicaid long-term care expenditures? and (2) Are effects larger for applicants who are at higher-risk of entering a nursing home soon after they apply for waiver services?
We investigate these research questions among non-elderly adult applicants to three waivers in Iowa: Health and Disability (H&D), Physical Disability (PD), and Brain Injury (BI). As of August 2012, 4,655 consumers were enrolled in these three waivers and an additional 3,152 were on waiting lists.1 We selected Iowa and these waivers because: (1) data were available from the state Medicaid office on who applied to the waivers and when; and (2) waiting periods for the services ranged from 3 to 25 months over the past decade, allowing us to examine the effects of variation in wait times on outcomes.
All three waivers in this study serve consumers enrolled in Iowa Medicaid2 who are less than 65 years old3 and have a disability that limits their daily functioning enough to qualify them to live in a nursing facility or other institution. The PD waiver is further restricted to those who are over 18, have a physical disability as their impairment, are able to direct their service provider, and are not eligible for the Intellectual Disability (ID) waiver. H&D waiver enrollees must have an income that does not exceed 300 percent of the Supplemental Security Income (SSI) threshold in Iowa but (for applicants over age 25) is above 100 percent of SSI. BI applicants must have a qualifying brain injury.
When a consumer enrolls in one of these waivers, an Iowa case manager--working with the consumer (and caregivers, as applicable)--decides which specific waiver services and the amounts of those services to authorize for the individual. The waivers vary in the services they cover and the maximum monthly spending permitted. All three waivers provide personal care services for assistance with activities of daily living (ADLs, for example, bathing) and instrumental activities of daily living (IADLS, for example, meal preparation), emergency responses services, and home and vehicle modifications. The H&D waiver also provides meals, homemaker services, and respite (among other services), whereas the BI waiver also provides supported community living and supported employment services. The maximum monthly dollar value of HCBS that a consumer can currently receive under each waiver is $2,868 for the BI waiver; between $922 and $3,267 for the H&D waiver, depending on the level of care for which the consumer qualifies;4 and $672 for the PD waiver.
The waiting lists in Iowa are first-come, first-served, meaning that individuals are put on the list based on the order in which they apply. Unlike some other states, Iowa Medicaid does not screen individuals for eligibility when they first apply for a waiver. Rather, the state performs a full eligibility assessment at the time a waiver slot becomes available to an applicant.5 Some HCBS may be available to consumers while they are on the waiting list. The Iowa Department of Human Services reimburses consumers partially or completely (depending on income) for personal care that they purchase privately, up to a maximum of $480 per month. Consumers who are enrolled in Medicaid while on the waiting list may access: (1) home health aide (HHA) services provided on an intermittent basis through the Medicaid state plan;6 and/or (2) other HCBS waivers that have shorter or no waiting periods. However, unlike some states, Iowa Medicaid does not provide personal care as a standard state plan benefit.
II. BACKGROUND AND HYPOTHESES
Although we know of no other studies that have specifically examined the effects of waiting periods for Medicaid HCBS, there is a broader literature on the effects of HCBS on costs and service use. Several large evaluations of programs in the 1970s and 1980s found that increased access to HCBS lowered rates of institutionalization for some participants and that the most well-targeted programs produced the largest decrease in nursing home admissions (Weissert et al. 1988). Those same studies found no consistent effect on inpatient hospital use among HCBS program participants, despite high overall rates of hospital admission among this group. More recent studies have found a correlation between states with broader access to Medicaid HCBS and lower rates of potentially avoidable hospitalizations (Konetzka et al. 2012; Walsh et al. 2010), but the evidence is unclear as to whether access to HCBS is the cause of lower admission rates in these states.
Because the per-capita costs for long-term services and supports are lower when provided in the community than in an institution, HCBS programs were initially expected to lower overall spending on long-term care. However, several studies have shown that because of poor targeting, expanding access to HCBS tends to increase overall spending, with most program participants unlikely to have incurred significant institutional long-term care costs in the absence of these services (Doty 2000; Grabowski 2006; Weissert et al. 1988). A small number of studies found that increased spending on Medicaid HCBS waiver programs reduced total long-term care spending compared to projected statewide long-term care costs (Grabowski 2006; Kaye 2012). However, the methods used in these studies limit their ability to draw causal conclusions about the effects of HCBS waiver programs on costs.
Our hypotheses for this study draw from the literature cited above:
-
Nursing home entry. We hypothesize that a shorter wait time for HCBS waiver services will decrease the risk of nursing home entry. Faster access to supportive services should help waiver applicants at high-risk of institutionalization have their functional needs met without entering a nursing home.
-
Acute care hospital stays. We hypothesize that a shorter wait time may either increase or decrease the rate of hospitalization. Access to HCBS could decrease hospitalizations, for example, by providing assistance with ADLs and IADLs that reduces the risk of falls, pressure ulcers, dehydration, and inadequate nutrition, or by home care workers helping consumers follow medical regimens (for example, taking medications) and attend medical appointments that could reduce the risk of hospitalizations for ambulatory care-sensitive conditions. However, individuals in nursing homes may have faster access to medical care and more intensive monitoring of chronic medical conditions, which could catch problems early and prevent hospital admissions that would have occurred had the beneficiary been living in the community. If long wait times for HCBS waivers cause more people to enter nursing homes, the wait times could therefore reduce hospitalization rates.
-
Long-term care costs. We hypothesize that shorter wait times may cause long-term care costs to either rise or fall. Although the reduced likelihood of nursing home entry should decrease long-term care costs for some applicants, shorter wait times will also increase the total time that all applicants receive HCBS and, hence, increase total spending on waiver services.
-
Variation in impacts. We hypothesize that these effects may vary by type of waiver, as each targetsa different population facing different risks, provides a different set of services, and has a different monthly cap on spending. Additionally, we hypothesize that within each waiver, faster access to HCBS will have a larger impact on beneficiaries at higher-risk of long-term nursing home use.
III. METHODS
A. Study Population
The study includes community-dwelling adults age 18 or older who applied to the BI, H&D, or PD waivers between January 2002 and September 2007. We started by identifying the 9,066 unique applications for each of these three waivers during that time period. We then limited those applications to the 7,219 where the applicants were enrolled in Medicaid at the time of or within three months of application.7 Additionally, we excluded 471 applications where the applicant had no months of observable acute care claims data in the 36 months following waiver application8 and 322 applications where the applicant was in the middle of a long-term care stay (defined as a stay of 90 days or longer in a nursing facility) at the time of application.9 This yielded a total of 6,426 applications across the three waivers, submitted by 5,254 unique applicants (21 percent of applicants submitted more than one application10). Among those who submitted more than one application, 90 percent submitted multiple applications on the same day (for example, they applied to both the PD and H&D waiver on the same day). For these applicants, we selected for our analysis just the application with the shortest wait at the time of application, since the effective wait time for an individual is the shortest amount of time he or she needs to wait to get into any waiver applied for. For the 10 percent of cases in which a person submitted multiple applications on different days, we selected the earliest application for analysis. The final study population includes 5,254 unique applicants (with one application each), 785 of whom applied for the BI waiver, 2,287 for the PD waiver, and 2,182 for the H&D waiver.
B. Design for Estimating Effects of Wait Times
Our analysis is quasi-experimental, exploiting the variation in wait time for a waiver slot opening over the six-year period. We used administrative waiting list data received from the Iowa Medicaid agency to: (1) identify individuals who applied for one of the three waivers between January 1, 2002, and September 30, 2007; and (2) for those who enrolled in a waiver, the time they waited from the date of application to the date they were first authorized to begin receiving waiver services.11 Over this period, wait times gradually increased as demand for slots outpaced supply, but with periodic dips due to state decisions to allocate funds to decrease waiting lists. All applicants were assigned the median wait time for applicants from the same month who ultimately enrolled in the waiver. Applicants who did not enroll in the waiver were retained in the analysis, as longer wait times were correlated with a lower likelihood of waiver enrollment that might be driven by important outcomes such as entry into a long-term care facility, or mortality.12 We compared outcomes for up to 36 months after application for groups of applicants who faced different median wait times when they applied. Since wait times were largely determined by state policies, they should be exogenous to a consumer's individual characteristics (see Section IV for confirmation that applicants in different wait groups have similar observed pre-application characteristics). This suggests that the groups may be similar on unmeasured characteristics as well, and that comparisons of outcomes between individuals who face different wait times should reasonably approximate the effects of wait times, not differences between the applicants.
In examining outcomes, we initially grouped applicants into those with a median wait time of less than 6 months, 6-12 months, 12-18 months, 18-24 months, and longer than 24 months. We chose to treat wait times as categorical rather than continuous because we expected the relationship between wait times and the outcomes we were measuring might not be linear. In fact, we found no difference in the impacts on institutionalization risk (our primary outcome) between any of the groups with a median wait time longer than six months (see Appendix Table A.3). Our final analysis grouped all applicants into those facing less than a six-month median wait and those facing longer than a six-month median wait.
C. Study Outcomes
For each applicant, we measured three major outcomes in the first 36 months after waiver application: (1) the annualized rate of acute care hospitalizations; (2) whether the applicant ever had a long-term nursing home stay (defined as a stay of 90 days or more); and (3) the average monthly Medicaid long-term care costs, including both HCBS and all costs associated with long-term nursing home stays.13 Each outcome was created using Medicaid and Medicare enrollment and claims data drawn from the 2002-2010 Medicaid Analytic eXtract (MAX) files and Medicare Standard Analytic Files (SAF). Complete claims data were available through September 30, 2010; as a result, everyone in the sample (applicants through September 30, 2007) potentially could be followed up for at least 36 months. We selected a 36-month follow-up period to allow time for substantial risk of institutional care to develop among applicants, but the effects of wait times on institutionalization risk were similar during the 12 and 24 months following application (see Appendix Table A.4).
For Medicaid enrollees who were not dually eligible for Medicare, we used the MAX inpatient file to count the total number of acute care inpatient stays and the number of potentially preventable stays in each month. For dually eligible Medicaid enrollees, we used the inpatient SAF to measure inpatient stays.14 We flagged as potentially preventable all stays that met the criteria for the HCBS Quality Indicators (QIs) (Schultz et al. 2012), as well as stays for constipation, seizures, and weight loss developed by Walsh et al. (2010) in their study of preventable hospitalizations among the institutionalized and HCBS waiver populations. Following the HCBS QI methodology, we considered all same-day readmissions to the same or another hospital to be transfers and counted them as an extension of the original stay rather than as a new stay. Hospitalization rates were only measured in months during which acute care claims were observable: non-dually eligible applicants must have been eligible for full Medicaid benefits and not enrolled in a Medicaid HMO or Program of All-Inclusive Care for the Elderly (PACE) plan, and dually eligible applicants must have been enrolled in Medicare Part A and Part B and not enrolled in a Medicare Advantage plan.
Consistent with the current Money Follows the Person definition, we defined long-term nursing home stays as stays of longer than 90 days in a long-term care facility, measured using the MAX long-term care file for both dually and non-dually eligible enrollees.15 Costs associated with long-term institutional stays were measured by summing the Medicaid payment amount on all long-term care claims associated with a long-term care stay, including those costs incurred in the first 90 days of the stay. HCBS were measured using the MAX other services file, which includes all non-institutional claims. HHA services covered under the state plan were identified through the revenue code 571, and all HCBS covered under one of the three waivers were identified using a list of procedure codes provided by the Iowa Medicaid agency.16 Costs associated with HCBS were measured by summing the Medicaid payments on all HHA and waiver services claims. Long-term nursing home stays and monthly long-term care costs were only measured in months during which long-term care claims were observable; applicants (regardless of dual status) must have been enrolled in Medicaid and not in a Medicaid HMO or PACE plan.
D. Consumer Characteristics
We analyzed the MAX and Medicare enrollment and claims files to develop a list of consumer characteristics at or near the time of application that were used to: (1) describe the populations; (2) divide consumers into higher- and lower-risk categories based on age at application; and (3) control for measurable differences in the impact estimates between consumers facing short versus long median wait times at application. Beneficiary demographic characteristics and dually eligible status were drawn from the MAX person summary file. Residence in an urban or rural county was measured by merging on the Rural/Urban Continuum Code (in 2003) from the Area Resource File to the Federal Information Processing Standard County Code for the consumer's county of residence at the time of application. Each applicant's relative health status was measured by running the Chronic Illness and Disability Payment System (CDPS) grouper on all available Medicaid and Medicare claims in the 12-month window prior to waiver application (Kronick et al. 2000). For applicants who were not enrolled in Medicaid for the full year before application, the CDPS grouper was run on claims covering the applicant's first 12 months on Medicaid.17 Flags were created for each medium-cost or higher disease category in the CDPS for which the applicant met the criteria, and an overall illness-severity score was created by applying the concurrent CDPS weights for the disabled adult population.
E. Definition of High-Risk
Within each waiver, a person's age at application was highly correlated with his or her risk of having a long-term nursing home stay within 36 months after application. We therefore defined a high-risk group based on age for each waiver: older than age 55 for the H&D and PD waivers, which serve individuals up to age 65, and older than age 40 for the BI waiver, which tends to enroll younger consumers.18 These risk groups accounted for 43 percent of the H&D waiver applicants, 36 percent of the PD waiver applicants, and 54 percent of the BI waiver applicants. Across all three waivers, those in the high-risk group were 92 percent more likely (13.8 versus 7.2 percent) to enter an institution within 36 months than those in the lower-risk group (the complement to the high-risk group).
F. Statistical Analyses
To estimate the effects of wait times, we regressedthe study outcomes on a binary variable for whether the applicant had a short expected wait time (less than six months), the covariates listed above, and the year of application.19 The estimated coefficient for the binary wait variable is the estimate of the effect of wait times on outcomes, controlling for the covariates and application year.
We ran four separate sets of regressions, once for each of the three waivers and one that pooled the applications for all three waivers. Each set of regressions was also run separately for all applicants and for the higher-risk and lower-risk applicants. The specific form of the regression and the weights assigned to each observation depended on the outcome. For the binary outcome of whether the applicant ever had a long-term nursing home stay within 36 months of application, we used a logistic regression. To account for censoring from not being able to observe outcomes for all applicants in all months, sample members for whom a nursing home stay was not observed were given a weight proportional to the fraction of the follow-up period that their outcomes were observable, and cases for which a stay was observed were given a weight of one (because the outcome was not censored). For all other outcomes (hospitalizations and Medicaid costs), we used a multivariate ordinary least squares regression. Observations were weighted by the number of months that an applicant's outcomes were observable over the 36 months after application.
To focus on the effects of wait times, results are presented as predicted means as if all of the applicants in the sample had faced short wait times and long wait times. These means were calculated by: (1) using the regression model results to predict the outcome for each applicant as if he or she had a short wait time, and again as if the applicant had a long wait time; and (2) averaging those individual estimates across all applicants to get predicted mean outcomes as if all applicants had a short or long wait time.
IV. RESULTS
A. Wait Times
Applicants to the BI, H&D, and PD waivers faced varying wait times to enroll in the waivers, depending on when they applied (Figure IV.1). The median time spent on a waiting list generally lengthened between 2002 and 2004 (from less than 3 months to over 18 months) as demand increased faster than the supply of waiver slots, but an infusion of state funding in 2004 caused a notable drop in wait time. The wait time for the BI waiver was particularly volatile over time, in part because it had fewer applicants and slots than the H&D and PD waivers.
FIGURE IV.1. Median Wait Time for Each Waiver Application Cohort, by Application Date
B. Applicant Characteristics
The applicants across all three waivers had multiple and severe chronic conditions, with an average CDPS score ranging from 1.92 to 3.24 (depending on the waiver), indicating that their expected acute care Medicaid costs were 2-3 times the average of beneficiaries with disabilities in Medicaid generally (who have an average score of 1.00) (Table IV.1). Between 50 percent and 70 percent of applicants were also enrolled in Medicare due to disability at the time they applied for the waiver.20 The applicants to the H&D waivers and the PD waivers were similar on many measured characteristics (including age, gender, and medical conditions), whereas the BI waiver applicants were generally younger, more likely to be male, and had fewer medical conditions. Reflecting the demographics of Iowa, more than 92 percent of applicants were non-Hispanic White.
| Brain Injury Waiver | Physical Disability Waiver | Health and Disability Waiver | ||||
| Short-Wait Group | Long-Wait Group | Short-Wait Group | Long-Wait Group | Short-Wait Group | Long-Wait Group | |
NOTES: The short-wait group includes applicants in cohorts with a wait time of six months or less. The long-wait group includes applicants in cohorts with a wait time of over six months. Applicants who were not enrolled in Medicaid at or within three months of waiver application are excluded from this table. Recent treatment for each condition was measured using the CDPS classifications, and includes those with medium-cost or higher conditions.
|
||||||
| Percentage of applicants | ||||||
| Under age 45 | 57 | 54 | 31 | 29 | 24 | 22 |
| Ages 45 to 54 | 28 | 29 | 33 | 31 | 30 | 31 |
| Ages 55 to 59 | 10 | 11 | 18 | 22 | 18 | 20 |
| Age 60 or older | 6 | 5 | 19 | 19 | 28 | 27 |
| Non-Hispanic White | 94 | 96 | 95 | 92 | 96 | 95 |
| Non-Hispanic Black | 5 | 4 | 5 | 7 | 4 | 4 |
| Hispanic | 1 | <1 | <1 | 1 | 1 | 1 |
| Male | 58 | 62 | 31 | 37 | 44 | 47 |
| Female | 42 | 38 | 69 | 63 | 56 | 53 |
| Dually eligible for Medicare | 45 | 55a | 50 | 47 | 63 | 70a |
| Recently treated for: | ||||||
| Pulmonary condition | 14 | 15 | 25 | 23 | 26 | 26 |
| Psychiatric condition | 14 | 16 | 10 | 16a | 16 | 15 |
| Nervous system condition | 17 | 14 | 30 | 18b | 18 | 15 |
| Skeletal condition | 12 | 11 | 19 | 18 | 19 | 18 |
| Infectious disease | 13 | 11 | 21 | 20 | 22 | 23 |
| Diabetes | 7 | 7 | 22 | 24 | 25 | 25 |
| Gastrointestinal condition | 6 | 8 | 14 | 11 | 17 | 14 |
| Cardiac condition | 6 | 7 | 26 | 24 | 28 | 29 |
| Cancer | 5 | 6 | 10 | 8 | 11 | 12 |
| Skin condition | 1 | 4 | 12 | 7b | 7 | 7 |
| Renal condition | 2 | 3 | 12 | 13 | 12 | 15 |
| Developmental disability | 1 | 1 | <1 | <1 | <1 | <1 |
| Average CDPS score of applicant | 1.92 | 2.04 | 3.11 | 2.98 | 3.16 | 3.24 |
In each of the three waivers, the characteristics of applicants were similar for those in application cohorts facinga short (less than six months) or a long (more than six months) waiting period at application. There were five statistically significant differences between the long-wait and short-wait groups across the three waivers, which is close to the 3-4 that would be expected by chance alone among the 69 comparisons made if all characteristics were independent of each other (at the p < 0.05 threshold). The five differences that were statistically significant were not particularly large and did not systematically favor one group over the other in terms of the risk of institutionalization or hospitalization.21 These results suggest that the a priori risk of hospitalization or institutionalization was similar for the short-wait and long-wait groups.
C. Receipt of Waiver Services
As expected, applicants who faced short wait times were much more likely to enroll in the waiver and to receive waivers services for more months during the 36 months after application than were those facing long wait times. Overall, about two-thirds of applicants in the short-wait group enrolled in the waiver within 36 months of application, compared with just 42 percent of applicants in the long-wait group (Appendix Table A.6). Driven at least in part by their higher enrollment rates, as well as by the longer period of time they were eligible for services once enrolled, applicants in the short-wait group received HCBS waiver services for an average of 13.1 out of the 36 months immediately following application, compared with only 6.0 months among the long-wait group. Once enrolled, participants in each waiver received a different mix of services, reflecting the different populations served by each waiver. Enrollees in the BI waiver received an average of $1,650 in HCBS each month, with most spending going toward supported community living ($815), consumer-directed attendant care (CDAC; $367), and case management ($227) (Appendix Table A.7). In contrast, enrollees in the H&D and PD waivers averaged $561 and $428 in HCBS per month, with the majority of spending for those groups going towards CDAC.22
D. Impacts on Institutionalization Risk
Across all three waivers, applicants who faced a short wait time had a smaller regression-adjusted risk of ever having a long-term nursing home stay within 36 months of application (7.6 percent) than those who faced a long wait time (10.1 percent), and this difference was statistically significant (p = 0.07; Table IV.2). These effects were concentrated among the 42 percent of applicants who were at higher-risk of nursing home use because of their age at the time of application. Among these applicants, those facing a short wait time had a 7.2 percent risk of having a long-term nursing home stay within 36 months versus 13.9 percent for those facing a long wait time (a 6.7 percentage point, or 48 percent, reduction in risk; p = 0.01). Estimated effects for the low-risk applicants were essentially zero and statistically insignificant.
| Applicant Risk Level | Mean (Predicteda) Percentage of Applicants Ever Having a Long-Term Nursing Home Stay Within Three Years of Application, Among Applicants for the Following Waivers (sample size) | |||||||||||||||
| Brain Injury | Physical Disability | Health and Disability | Any of the Three Waivers | |||||||||||||
| Long-Wait | Short-Wait | Diff. | p-Value | Long-Wait | Short-Wait | Diff. | p-Value | Long-Wait | Short-Wait | Diff. | p-Value | Long-Wait | Short-Wait | Diff. | p-Value | |
NOTE: The sample includes applications between January 1, 2002, and September 30, 2007, with outcomes measured through September 30, 2010. An applicant's wait is short if the median time that all applicants who applied in the same month (and enrolled) waited from their date of application to the date they started receiving waiver services was six months or less. A long wait time is more than six months.
|
||||||||||||||||
| All applicants | 10.4%(564) | 5.5%(221) | -4.9% | 0.04 | 8.6%(2,053) | 6.2%(234) | -2.4% | 0.27 | 11.5%(1,896) | 10.6%(286) | -0.9% | 0.74 | 10.1%(4,513) | 7.6%(741) | -2.5% | 0.07 |
| Higher-riskb | 12.4%(306) | 6.7%(114) | -5.7% | 0.12 | 11.5%(743) | 2.3%(74) | -9.2% | 0.02 | 16.6%(827) | 12.2%(120) | -4.4% | 0.34 | 13.9%(1,876) | 7.2%(308) | -6.7% | 0.01 |
| Lower-riskb | 9.2%(258) | 3.3%(107) | -5.9% | 0.07 | 6.9%(1,310) | 9.5%(160) | 2.6% | 0.37 | 7.5%(1,069) | 9.4%(166) | 1.9% | 0.50 | 7.4%(2,637) | 7.6%(433) | 0.2% | 0.90 |
The results for the individual waivers indicate that short wait times decreased the 36-month risk of long-term nursing home use among all BI waiver applicants, not just those who were at higher-risk. Short wait times reduced the 36-month risk for all applicants from 10.4 percent to 5.5 percent, a 4.9 percentage point (or 47 percent) reduction in risk (p = 0.04). The percentage point reductions were similar for the high-risk and low-risk applicants (5.7 percent and 5.9 percent, respectively), although only the difference for the lower-risk group was statistically significant (p = 0.07). The lack of significant effects for the higher-risk group is likely due to the lower statistical power to detect effects with the smaller sample sizes that result when the BI waiver sample is split into the two subgroups.
In contrast to the BI waiver, the effects for the PD waiver applicants were clearly concentrated among higher-risk applicants. For these applicants, short wait times reduced the 36-month risk of having a long-term nursing home stay from 11.5 percent to 2.3 percent, a 9.2 percentage point (or 80 percent) reduction in risk (p = 0.02). Shorter wait times had no measureable effect for the lower-risk applicants (a point estimate of 2.6 percentage point increase in risk for the short wait time group, p = 0.37). The point estimates for the impacts for the H&D waiver also suggest that impacts may be stronger for higher-risk applicants, but none of these differences were statistically significant (p > 0.34).
E. Impacts on Hospitalization Rates
Overall, waiver applicants had an average of 0.9 acute care hospital stays per year, about one-third of which were potentially avoidable (Table IV.3). This hospitalization rate is much higher than both the nationwide average of 0.1 stays per year among all United States residents and 0.3 stays among Medicare beneficiaries (Weir et al. 2011; Centers for Disease Control and Prevention 2013). Applicants to the H&D and PD waivers had more than twice as many stays on average than BI waiver applicants; within each waiver, hospital stays were more frequent among the high-risk group compared with the low-risk group. However, wait time had no significant effect on hospitalizations overall or in any subgroup.
| Type of Hospitalization | Mean (Predicteda) Annualized Hospitalization Rates (#/person/year) Among Applicants for the Following Waivers | |||||||||||||||
| Brain Injury | Physical Disability | Health and Disability | Any of the Three Waivers | |||||||||||||
| Long-Wait | Short-Wait | Diff. | p-Value | Long-Wait | Short-Wait | Diff. | p-Value | Long-Wait | Short-Wait | Diff. | p-Value | Long-Wait | Short-Wait | Diff. | p-Value | |
NOTE: The sample includes applications between January 1, 2002, and September 30, 2007, with outcomes measured through September 30, 2010. An applicant's wait is short if the median time that all applicants who applied in the same month (and enrolled) waited from their date of application to the date they started receiving waiver services was six months or less. A long wait time is more than six months.
|
||||||||||||||||
| All Applicants | ||||||||||||||||
| Any | 0.38 | 0.47 | 0.09 | 0.14 | 0.99 | 0.88 | -0.11 | 0.31 | 1.05 | 1.05 | 0.00 | 0.99 | 0.93 | 0.91 | -0.02 | 0.74 |
| Potentially preventableb | 0.11 | 0.11 | 0.00 | 0.87 | 0.30 | 0.27 | -0.03 | 0.52 | 0.32 | 0.25 | -0.06 | 0.20 | 0.28 | 0.25 | -0.04 | 0.22 |
| Higher-Risk Applicantsc | ||||||||||||||||
| Any | 0.49 | 0.65 | 0.16 | 0.10 | 1.03 | 1.01 | -0.02 | 0.90 | 1.12 | 1.14 | 0.01 | 0.92 | 0.97 | 1.02 | 0.05 | 0.57 |
| Potentially preventable | 0.13 | 0.15 | 0.03 | 0.45 | 0.32 | 0.28 | -0.04 | 0.65 | 0.35 | 0.31 | -0.04 | 0.58 | 0.30 | 0.27 | -0.02 | 0.58 |
| Lower-Risk Applicantsc | ||||||||||||||||
| Any | 0.26 | 0.27 | 0.01 | 0.89 | 0.97 | 0.82 | -0.15 | 0.25 | 1.00 | 0.97 | -0.03 | 0.84 | 0.90 | 0.82 | -0.07 | 0.33 |
| Potentially preventable | 0.08 | 0.08 | 0.01 | 0.88 | 0.30 | 0.27 | -0.03 | 0.69 | 0.30 | 0.22 | -0.08 | 0.23 | 0.27 | 0.22 | -0.05 | 0.23 |
F. Impacts on Medicaid Long-Term Care Costs
Table IV.4 shows estimated impacts of wait times on Medicaid long-term care costs. Among all applicants to any of the three waivers, short wait times:
-
Increased the average monthly Medicaid costs for waiver services within the 36 months after application (by an estimated $122 per beneficiary per month (PBPM), p < 0.01). This is expected; it reflects the increased costs arising from quicker access to HCBS and, therefore, more months during which HCBS were received.
-
Decreased spending in other waivers23 by an estimated $52 (p = 0.02), an effect that was driven by $134 PBPM lower spending on other waivers among the BI waiver applicants (p = 0.03). These data indicate that, when faced with long wait times for the BI waiver, some consumers with brain injuries enrolled in a different waiver for which they were also qualified. For example, BI waiver applicants may have a physical disability or long-term health condition that qualifies them for the PD or H&D waivers.
-
Decreased Medicaid costs for long-term nursing home stays. The point estimates show that the short-wait group had $56 PBPM less in spending in institutional care ($104 versus $160); this difference was statistically significant (p = 0.09).
As with the impact on risk of long-term nursing home stays, impacts of waiting time on the costs of long-term nursing home stays were concentrated among higher-risk applicants. For these applicants, short wait times decreased long-term nursing home costs by an estimated $111 PBPM (p = 0.01) which, when combined with savings on other waiver services ($58, p = 0.01), fully offset the increased costs in HCBS provided through the waiver ($146 PBPM, p < 0.01). As a result, the short wait times for the high-risk applicants decreased the risk of long-term nursing home stays without increasing total Medicaid spending on long-term care services (p = 0.67).
| Medicaid Long-Term Care Category | Mean (Predicteda) Monthly Medicaid Long-Term Care Costs (#/person/month) Among Applicants for the Following Waivers | |||||||||||||||
| Brain Injury | Physical Disability | Health and Disability | Any of the Three Waivers | |||||||||||||
| Long-Wait | Short-Wait | Diff. | p-Value | Long-Wait | Short-Wait | Diff. | p-Value | Long-Wait | Short-Wait | Diff. | p-Value | Long-Wait | Short-Wait | Diff. | p-Value | |
NOTE: The sample includes applications between January 1, 2002, and September 30, 2007, with outcomes measured through September 30, 2010. An applicant's wait is short if the median time that all applicants who applied in the same month (and enrolled) waited from their date of application to the date they started receiving waiver services was six months or less. A long wait time is more than six months.
|
||||||||||||||||
| All Applicants | ||||||||||||||||
| HCBS costs | ||||||||||||||||
| Application waiverb | 475 | 721 | 247 | <0.01 | 102 | 144 | 42 | <0.01 | 137 | 242 | 105 | <0.01 | 174 | 297 | 122 | <0.01 |
| Other waiver(s)c | 289 | 155 | -134 | 0.03 | 118 | 89 | -28 | 0.39 | 108 | 104 | -4 | 0.91 | 139 | 87 | -52 | 0.02 |
| State plan HHA | 33 | 32 | -1 | 0.92 | 46 | 63 | 16 | 0.29 | 35 | 18 | -17 | 0.08 | 40 | 40 | 0 | 0.98 |
| Long-term nursing home stay costs | 236 | 104 | -132 | 0.09 | 152 | 128 | -24 | 0.70 | 143 | 109 | -34 | 0.38 | 160 | 104 | -56 | 0.09 |
| Total | 1,032 | 1,012 | -20 | 0.84 | 418 | 425 | 6 | 0.93 | 424 | 473 | 50 | 0.33 | 514 | 527 | 14 | 0.73 |
| Higher-Risk Applicantsd | ||||||||||||||||
| HCBS costs | ||||||||||||||||
| Application waiver | 467 | 756 | 289 | <0.01 | 86 | 144 | 58 | <0.01 | 113 | 157 | 44 | 0.02 | 171 | 318 | 146 | <0.01 |
| Other waiver(s) | 236 | 121 | -115 | 0.08 | 110 | 103 | -7 | 0.85 | 68 | 74 | 6 | 0.78 | 118 | 60 | -58 | 0.01 |
| State plan HHA | 38 | 32 | -6 | 0.73 | 35 | 37 | 2 | 0.94 | 27 | 29 | 2 | 0.85 | 32 | 35 | 2 | 0.80 |
| Long-term nursing home stay costs | 215 | 139 | -76 | 0.33 | 197 | 45e | -152 | 0.03 | 199 | 105 | -94 | 0.15 | 180 | 69 | -111 | 0.01 |
| Total | 955 | 1,048 | 93 | 0.44 | 428 | 329 | -99 | 0.19 | 407 | 365 | -42 | 0.53 | 502 | 481 | -20 | 0.67 |
| Lower-Risk Applicantsd | ||||||||||||||||
| HCBS costs | ||||||||||||||||
| Application waiver | 510 | 642 | 132 | 0.14 | 111 | 145 | 34 | 0.02 | 156 | 297 | 141 | <0.01 | 177 | 279 | 101 | <0.01 |
| Other waiver(s) | 356 | 186 | -170 | 0.13 | 121 | 82 | -39 | 0.40 | 137 | 134 | -3 | 0.96 | 153 | 113 | -39 | 0.25 |
| State plan HHA | 28 | 30 | 2 | 0.90 | 53 | 74 | 21 | 0.31 | 41 | 10 | -31 | 0.04 | 45 | 44 | -1 | 0.90 |
| Long-term nursing home stay costs | 258 | 55 | -203 | 0.15 | 161 | 197 | 37 | 0.68 | 100 | 114 | 14 | 0.77 | 147 | 118 | -29 | 0.56 |
| Total | 1,151 | 913 | -238 | 0.19 | 446 | 498 | 52 | 0.60 | 435 | 555 | 120 | 0.10 | 522 | 554 | 32 | 0.59 |
Turning to the results for the individual waivers, short wait times increased HCBS costs the most for the BI waiver (by $247 PBPM, p < 0.01) versus $42 for the PD waiver and $105 for the H&D waivers. These results are consistent with the fact that the breadth of services and the maximum cap on expenditures are much higher for the BI waiver than for the other two waivers. However, consistent with the results for long-term nursing home stays, the BI waiver was the only one for which short wait times decreased institutional costs for all applicants (by $132 PBPM, p = 0.09). The decrease in costs of long-term nursing home stays for the short-wait group, combined with decreased spending on other waivers (of $134 PBPM, p = 0.03), fully offset the increased HCBS spending through the BI waiver. For the PD waiver, short wait times decreased costs for long-term nursing home stays by $152 PBPM for the higher-risk applicants (p = 0.03) but not for all applicants (p = 0.70). The nursing home costs among the short-wait group were not significantly lower than the long-wait group among H&D waiver applicants, either for all enrollees or for the high-risk enrollees (although the point estimate for the high-risk enrollees is large, at $94 PBPM in savings, p = 0.15).
Across the three waivers, Medicaid spending on HHA services provided through the state plan was generally low (around $30-$40 PBPM) compared to HCBS spending through the waivers. The short-wait group did not show any consistent pattern of lower (or higher) spending on HHA services compared to the long-wait group for each waiver individually or combined across the three waivers.
V. DISCUSSION
A. Summary of Findings
We found that non-elderly adults who applied to the BI, H&D, and PD waivers when wait times for services were shorter than six months were 25 percent less likely to have ever had a long-term nursing home stay in the three years after applications than those who applied when waiting lists were longer. This difference was larger among older applicants (over age 55 for the PD and H&D waivers, and age 40 for the BI waiver), who accounted for 42 percent of all applicants and had substantially higher-risk of nursing home use. Among these older applicants, those with short wait times (less than six months) versus longer wait times were 48 percent less likely to ever have a long-term nursing home stay within three years of application, and had lower average Medicaid expenditures on long-term nursing home stays ($111 lower per person per month). This decrease in expenditures on long-term nursing home care was larger than the increase in expenditures on HCBS ($88 per person per month). As a result, among the older, higher-risk applicants, average total Medicaid long-term care spending was not higher for those with short wait times than for those with longer wait times, despite their quicker access to HCBS.
The analysis of individual waivers shows an important difference between applicants to the BI waiver and applicants to the PD or H&D waivers. For all three of these waivers, younger applicants (those age 55 and under for PD and H&D waivers, and those age 40 and under for the BI waiver) were substantially less likely to have a long-term nursing home stay within three years of application than older applicants. Younger adults who applied to the PD or H&D waivers when wait times were less than six months were just as likely to have a long-term nursing home stay within three years of application as those with longer wait times. In contrast, the younger applicants for the BI waiver were 64 percent less likely to have a long-term nursing home stay over that same period if they had a short versus a long wait time. We believe this difference is due to the much greater amount of services needed by BI waiver applicants of all ages than applicants to the other waivers, as indicated by the differences in amounts that waiver enrollees actually received.
B. Limitations
This study has several limitations. First, we are limited to outcomes than can be observed in claims, which means we did not assess the effects of waiting period on several important outcomes, including consumer satisfaction and caregiver burden. However, it seems logical that quicker access to HCBS would almost certainly improve both of these outcomes. Second, because this study focuses on non-elderly adults with mainly physical disabilities in Iowa, the findings may not be generalizable to other states (with different demographics and Medicaid benefits) or to other populations (for example, elderly, children, or those with intellectual or developmental disabilities). Third, although various specifications were tested and the populations appear similar on measured characteristics, it is possible that applicants in the short-wait and long-wait groups were different in unobserved ways and that these differences could be responsible for some or all of the estimated differences in long-term nursing home use.
Fourth, although this study captures Medicaid spending on the largest components of cost and the ones most likely to be affected by earlier access to HCBS--long-term care services and use of hospital services--we did not measure Medicaid or Medicare spending (for those dually enrolled in Medicaid and Medicare) in other cost categories that might have been affected. For example, we cannot say whether Medicare expenditures on skilled nursing home facilities, emergency department visits, or hospital stays are different for those with short versus longer wait times. Finally, the effects of wait times may be different if examined over a longer time period than the 36 months available in this study. For example, short wait times may decrease lifetime institutional costs even more than measured in this study if differences in institutionalization rates persist beyond 36 months.
C. Policy Implications
Faced with budget constraints, many Medicaid agencies throughout the country have not increased the number of waiver slots as quickly as demand for these services has increased, raising questions about how to allocate limited slots. Currently, about two-thirds of waiver programs nationally use some method for prioritizing who receives a waiver slot, although this can range from narrow approaches that set aside a small number of slots for those currently in a nursing home to much broader approaches that assign all applicants different levels of priority based on their assessed need at application (Ng et al. 2012). The remaining third of waiver programs serve patients on a first-come, first-served basis, as Iowa has done for the three waivers in this study.
The results from this study highlight the potential value of prioritizing waiting lists based on both the amount of HCBS needed and the risk of entering an institution soon after application. In this study, diagnoses (brain injury) and age at application (over age 55) were useful and readily available indicators (in claims) for identifying populations who appear to benefit most from quicker access to HCBS. However, diagnoses and age are likely only rough proxies for other variables, like extent of functional limitations and whether a person has a caregiver at home, that more directly influence an applicant's need for HCBS and the risk of entering a nursing home if he or she does not receive these services. Policymakers may find that it is more appropriate to prioritize waiting lists based on a more refined assessment of patient need and risk than was possible in this study.
In 2011, prompted by a Centers for Medicare and Medicaid Services requirement to ensure that applicants from all counties have equal access to slots for the ID waiver, Iowa Medicaid redesigned its ID waiver program, including switching from a first-come, first-served waiting list to one based on the assessed need and risk of consumers at the time of application (Iowa Department of Human Services 2011). This assessment considers factors like whether the applicant's caregiver recently died or if the applicant recently lost his or her home, in determining who has greatest need for waiver services, and prioritizes slots based on this need. The results from this study suggest that, in the absence of sufficient funds to eliminate waiting lists altogether, employing a similar needs-based and risk-based strategy for Iowa's other waivers could be an effective use of limited resources. This study provides some insight into the likely effects on several important outcomes of prioritizing high-risk patients on waiting lists. When setting policies on how to allocate limited waiver slots, however, policymakers will need to factor into their decisions many considerations, including stronger measures of the amount of services applicants initially need and their risk of entering a nursing home, as well as changes in those factors after application.
REFERENCES
Centers for Disease Control and Prevention, National Center for Health Statistics. "Hospital inpatient Medicare admissions (per 1,000 beneficiaries)." Health Indicators Warehouse. Available at http://www.healthindicators.gov/Indicators/Hospital-inpatient-Medicare-admissions-per-1000-beneficiaries_2001/Profile/Data.
Doty, Pamela. "Cost-Effectiveness of Home and Community-Based Long-Term Care Services." June 2000. U.S. Department of Health and Human Services, Office of the Assistant Secretary of Planning and Evaluation, Office of Disability, Aging and Long-Term Care Policy. Available at http://aspe.hhs.gov/daltcp/reports/2000/costeff.htm.
Grabowski, David. "The Cost-Effectiveness of Noninstitutional Long-Term Care Services: Review and Synthesis of the Most Recent Evidence." Medical Care Research and Review, vol. 63, no. 3, February 2006, pp. 3-28.
Iowa Department of Human Services. "Informational Letter No.1072."2011. Available at http://www.ime.state.ia.us/docs/1072_HCBSWaiverSlotsWaitingListsforIndividualswithIntellectualDisabilities.pdf. Accessed May 6, 2013.
Kaye, H. Stephen. "Gradual Rebalancing of Medicaid Long-Term Services and Supports Saves Money and Serves More People, Statistical Model Shows." Health Affairs vol. 31, no. 6, 2012, pp. 1195-1203.
Konetzka, R. Tamara, Sarita L. Karon, and D.E.B. Potter. "Users of Medicaid Home and Community-Based Services Are Especially Vulnerable to Costly Avoidable Hospital Admissions." Health Affairs, vol. 31, no. 6, 2012, pp. 1167-1175.
Kronick, R., Todd Gilmer, Tony Dreyfus, and Lora Lee. "Improving Health-Based Payments for Medicaid Beneficiaries: CDPS." Health Care Financing Review, vol. 21, no. 3, spring 2000, pp. 29-64.
Ng, T., C. Harrington, M. Musumeci, and E. Reaves. "Medicaid Home and Community-Based Service Programs: 2009 Data Update." Washington, DC: Kaiser Commission on Medicaid and the Uninsured, December 2012.
Schultz, Ellen, Sheryl M. Davies, and Kathryn M. McDonald."Development of Quality Indicators for Home and Community-Based Services Population: Technical Report." June 2012. Available at http://www.qualityindicators.ahrq.gov/Downloads/Resources/Publications/2....
Walsh, Edith G., Marc Freiman, Susan Haber, Arnold Bragg, Joseph Ouslander, and Joshua M. Wiener. "Cost Drivers for Dually Eligible Beneficiaries: Potentially Avoidable Hospitalizations from Nursing Facility, Skilled Nursing Facility, and Home and Community-Based Services Waiver Programs." August 2010. RTI International.
Weir, L.M., A. Pfuntner, J. Maeda, E. Stranges, K. Ryan, P. Jagadish, B. Collins Sharp, and A. Elixhauser. HCUP Facts and Figures: Statistics on Hospital-Based Care in the United States, 2009. Rockville, MD: Agency for Healthcare Research and Quality, 2011.
Weissert, William G., Cynthia Matthews Cready, and James E. Pawelak. "The Past and Future of Home- and Community-Based Long-Term Care." The Milbank Quarterly, vol. 66, no. 2, 1988, pp. 309-88.
Wysocki, Andrea, Mary Butler, Robert L. Kane, Rosalie Kane, Tetyana Shippee, and Francois Sainfort. "Long-Term Care for Older Adults: A Review of Home and Community-Based Services Versus Institutional Care." Comparative Effectiveness Review No. 81. AHRQ Publication No. 12(13)-EHC134-EF. Rockville, MD: Agency for Healthcare Research and Quality, 2012.
APPENDIX A. SUPPLEMENTARY TABLES
| Sample Size | Odds Ratio for Ever Having a Long-Term Nursing Home Stay (short vs. long-wait)b | p-Value for Odds Ratioc | |
| Short-Waita | Long-Waita | ||
NOTES: Outcomes are measured through September 30, 2010, among high-risk applications from January 1, 2002, through September 30, 2007, for any of the three waivers (N = 3,092): BI, H&D, and PD. High-risk means that the applicant was older than age 40 at the time of application for the BI waiver, or over age 55 for the other two waivers. Although the main analyses limit the sample to those enrolled in Medicaid within three months of waiver application (since most outcomes are only observable in our data set if a person has Medicaid claims), this regression includes all applicants, regardless of if and when they enrolled in Medicaid. The outcome, which can be defined for all applicants, is whether Iowa Medicaid ever paid for a long-term institutional stay within three years of waiver application (for those who never enrolled in Iowa Medicaid, the variable is set to zero, not missing). For the sample members who did enroll in Medicaid within three months, weights are applied as specified in Table A.4. For those who did not enroll in Medicaid within three months, an application was given a weight of one divided by the number of applications (one, two, or three) the applicant submitted to the three waivers from January 1, 2002, through September 30, 2007.
|
|||
| 387 | 2,705 | 0.601 | 0.04 |
| Waiver for Which Applicant Applied | Number of Applicants | Number of Applications |
| Total | 5,254 | 6,426 |
| H&D only | 1,651 | 1,651 |
| PD only | 1,847 | 1,847 |
| BI only | 653 | 653 |
| H&D and PD | 850 | 1,700 |
| H&D and BI | 91 | 182 |
| PD and BI | 93 | 186 |
| All three waivers | 69 | 207 |
| Wait Cohort (months)a | Number of Applicants in this Wait Cohort | Odds Ratio for Ever Having a Long-Term Nursing Home Stay(relative to 0-6 month wait cohort)b | p-Value for Odds Ratioc | p-Value for Test That Odds Ratios Are Different Across Wait Groupsd |
NOTE: Outcomes are measured through September 30, 2010, among high-risk applications from January 1, 2002, through September 30, 2007, for any of the three waivers (N = 2,699): BI, H&D, and PD. High-risk means that the applicant was older than age 40 at the time of application for the BI waiver, or over age 55 for the other two waivers. The odds ratios are estimated for each wait cohort by including a dummy variable for each wait cohort in the logistic regression. Because the 0-6 month wait period is the omitted category, the coefficient on each of the wait cohorts gives the odds ratio for the risk of ever having a long-term nursing home stay in that wait group compared to the 0-6 month wait group. Sample members for whom a nursing home stay was not observed were given a weight proportional to the fraction of the follow-up period that their outcomes were observable, and cases for which a stay was observed were given a weight of one. Weights were then adjusted to account for the same person applying to more than one waiver during the identification period (January 1, 2002, and September 30, 2007): an observation's weight was divided in two if the applicant applied to two of the three waivers, and divided by three if he or she applied to all three.
|
||||
| 6-12 | 692 | 2.079 | 0.01 | 0.35 |
| 12-18 | 1,478 | 1.620 | 0.11 | |
| 18-24 | 183 | 1.469 | 0.36 | |
| Months Since Application | Sample Size | Odds Ratio for Ever Having a Long-Term Nursing Home Stay(short vs. long-wait)b | p-Value for Odds Ratioc | |
| Short-Waita | Long-Waita | |||
NOTE: Outcomes are measured through September 30, 2010. The sample includes high-risk applications that were submitted to any of the three waivers (BI, H&D, and PD) between January 1, 2002, and September 30, 2009 (for the 12-month follow-up), September 30, 2008 (for the 24-month follow-up), and September 30, 2007 (for the 36-month follow-up). High-risk means that the applicant was older than age 40 at the time of application for the BI waiver, or over age 55 for the other two waivers. Sample members for whom a nursing home stay was not observed were given a weight proportional to the fraction of the follow-up period that their outcomes were observable, and cases for which a stay was observed were given a weight of one. Weights were then adjusted to account for the same person applying to more than one waiver during the identification period (January 1, 2002, and September 30, 2009 (or 2008 or 2007)): an observation's weight was divided in two if the applicant applied to two of the three waivers, and divided by three if they applied to all three.
|
||||
| 12 | 340 | 3,780 | 0.497 | 0.04 |
| 24 | 342 | 3,014 | 0.501 | 0.02 |
| 36 | 346 | 2,353 | 0.538 | 0.02 |
| Sample Size | Odds Ratio for Ever Having a Long-Term Nursing Home Stay(short vs. long-wait)b | p-Value for Odds Ratioc | |
| Short-Waita | Long-Waita | ||
NOTES: Outcomes are measured through December 30, 2006, among high-risk applications from January 1, 2002, through December 31, 2003, for any of the three waivers: BI, H&D, and PD. High-risk means that the applicant was older than age 40 at the time of application for the BI waiver, or over age 55 for the other two waivers. Sample members for whom a nursing home stay was not observed were given a weight proportional to the fraction of the follow-up period that their outcomes were observable, and cases for which a stay was observed were given a weight of one. Weights were then adjusted to account for the same person applying to more than one waiver during the identification period (January 1, 2002, and September 30, 2007): an observation's weight was divided in two if the applicant applied to two of the three waivers, and divided by three if he or she applied to all three.
|
|||
| 284 | 457 | 0.382 | 0.01 |
| All Applicants | Higher-Risk Applicants | |||
| Short-Wait Group | Long-Wait Group | Short-Wait Group | Long-Wait Group | |
NOTE: The short-wait group includes applicants in cohorts with a wait time of six months or less. The long-wait group includes applicants in cohorts with a wait time of over six months. Higher-risk applicants include applicants to the H&D or PD waiver who were older than age 55 at the time of application and applicants to the BI waiver who were older than 40 at application.
|
||||
| All Waivers | ||||
| Percentage who enroll in waiver within three years of waiver application | 65% | 42% | 67% | 41% |
| Mean number of months that waiver services were received over three years after waiver applicationa | 13.1 | 6.0 | 12.6 | 5.6 |
| BI Waiver | ||||
| Percentage who enroll in waiver within three years of waiver application | 69% | 50% | 72% | 48% |
| Mean number of months that waiver services were received over three years after waiver application | 15.4 | 7.8 | 16.0 | 7.7 |
| H&D Waiver | ||||
| Percentage who enroll in waiver within three years of waiver application | 65% | 42% | 68% | 41% |
| Mean number of months that waiver services were received over three years after waiver application | 12.0 | 5.9 | 11.0 | 5.4 |
| PD Waiver | ||||
| Percentage who enroll in waiver within three years of waiver application | 53% | 36% | 49% | 32% |
| Mean number of months that waiver services were received over three years after waiver application | 10.0 | 4.9 | 7.6 | 4.2 |
| Brain Injury Waiver | Health and Disability Waiver | Physical Disability Waiver | ||||
| Percent Ever Using Service | Average Spending per Montha | Percent Ever Using Service | Average Spending per Month | Percent Ever Using Service | Average Spending per Month | |
NOTES: A dash ("--") indicates a service not included as a benefit under the waiver program.
|
||||||
| Any Waiver Service | 100 | $1,650 | 98 | $561 | 96 | $428 |
| Specific Waiver Services | ||||||
| Supported community living | 69 | $815 | -- | -- | -- | -- |
| CDAC | 43 | $367 | 56 | $341 | 79 | $349 |
| Case management | 97 | $227 | 6 | $2 | 7 | $6 |
| Adult day care | 14 | $56 | 4 | $2 | -- | -- |
| Prevocational and supported employment | 23 | $42 | -- | -- | -- | -- |
| Consumer choices option | 10 | $40 | 3 | $15 | 3 | $8 |
| Respite | 16 | $32 | 3 | $6 | -- | -- |
| Transportation | 27 | $29 | -- | -- | 11 | $6 |
| Home and vehicle modification | 19 | $17 | 31 | $25 | 27 | $30 |
| Personal emergency response | 23 | $6 | 54 | $13 | 50 | $12 |
| Specialized medical equipment | 17 | $6 | -- | -- | 16 | $3 |
| Meals and nutrition counseling | -- | -- | 58 | $81 | -- | -- |
| Chore and homemaker services | -- | -- | 40 | $64 | -- | -- |
NOTES
-
As of August 2012, 1,254 consumers were enrolled in the BI waiver, with 418 on the waiting list; 2,512 were enrolled in the H&D waiver, with 1,153 on the waiting list; and 889 were enrolled in the PD waiver, with 1,581 on the waiting list. http://www.ime.state.ia.us/docs/MonthlySlotAndWaitingList.pdf, accessed April 2, 2013.
-
The income and asset eligibility ceilings are higher for consumers who qualify for full Medicaid benefits due to their enrollment in an HCBS waiver than for those who qualify through other means. Specifically, persons in Iowa who are aged, blind, or disabled (as determined by the Social Security Administration) are eligible to enroll in Iowa Medicaid if their income is 75 percent of the federal poverty level (FPL) for an individual and 83 percent for a couple, and their assets are less than $2,000 and $3,000 (for individuals and couples, respectively). Income and asset requirements for the same person to enroll in Medicaid if he or she enters a nursing home or enrolls in an HCBS waiver are much less restrictive: the applicant's income can be up to 300 percent of FPL and he or she can have home equity up to $500,000.
-
Iowa has a separate waiver for elderly consumers (over age 65), which we excluded from the analysis because there was no waiting list for this waiver during our study period. Further, to facilitate Institutional Review Board approval for the study, we excluded children and applicants for the ID waiver (which did have substantial waiting periods during our study period).
-
The monthly cap is $922 if consumers need a nursing home level of care, $2,684 if they need a skilled nursing level of care, and $3,267 if they need a level of care that would be typical of an intermediate care facility for the intellectually disabled. See http://www.dhs.state.ia.us/uploads/Home%20and%20Community%20Based%20Waiver%20Program%20Comparison%20Chart%201-2013.doc%20(2).pdf, accessed April 2, 2013.
-
As a result, some applicants on waiting lists do not meet the functional or other eligibility criteria for the waiver.
-
HHA services must be part of a written care plan ordered by a physician. Generally, "intermittent service" means services for a consumer who has a medically predictable recurring need that does not exceed 2-3 visits per week for 2-3 hours at a time. However, HHA services provided 4-7 days per week, not to exceed 28 hours per week, are allowed when ordered by a physician. See http://www.dhs.state.ia.us/policyanalysis/PolicyManualPages/Manual_Documents/Provman/hhserv.pdf, accessed April 11, 2013.
-
One concern is that this sample definition could bias the results if it means that applicants whose income or assets are too high to be eligible for Medicaid through regular channels, but low enough to meet the criteria for the HCBS waivers, enter Medicaid (and therefore our sample) through waivers soon after application when the waiting periods are short, but not when they are long. As a sensitivity test, we also assessed impacts of wait times on ever having a long-term nursing home stay funded by Iowa Medicaid within 36 months of application among all applicants, regardless of if or when they enrolled in Medicaid (assigning an outcome of zero, rather than missing, to those who never enrolled in Medicaid). The results are similar to those presented in the main text (see Appendix Table A.1).
-
Diagnostic information on physician and hospital claims at or near the time of application used to create baseline control variables, as well as data on the number of hospitalizations over the 36-month outcome period, were not available for Medicaid enrollees who were dually eligible for Medicare and were continuously enrolled in a Medicare Advantage plan, or for non-dually eligible Medicaid enrollees who were continuously enrolled in a comprehensive Medicaid managed care plan. Thus, these individuals were excluded from the analysis.
-
We excluded these applicants because one of the main outcome measures for this study is whether applicants ever entered an institution for a long-term stay after application, which could not be measured among this group. Re-specifying the outcome to examine whether short wait times increased the probability of transitioning from an institution back into the community was outside the scope of this study and would have had low statistical power due to the relatively small number of people in an institution at the time of application.
-
Twenty-one percent, or 1,103 applicants, applied for two of the waivers between 2002 and 2007. The vast majority of these individuals applied for both the PD and H&D waivers, which generally target the same population at different income levels. One percent, or 69 applicants, applied for all three waivers between 2002 and 2007. See Appendix Table A.2.
-
This wait time is comprised of two parts: (1) the wait from the date of application to the date a waiver slot became available (which varied over time); and (2) the wait from when a slot became available to when Iowa Medicaid first authorized an individual to begin receiving waiver services (which was typically 1-2 months).
-
Since Iowa provided access to waiver slots on a first-come, first-served basis, the median wait time of waiver enrollees who applied in the same month is a reasonable proxy for the length of time that applicants who did not enroll had to wait before a slot became available. Within each cohort of monthly applicants, wait times for those who entered the waiver were tightly clustered. We tested an alternative specification that used the minimum wait time among entrants in each monthly application cohort; this did not substantially change the wait time for the vast majority of monthly cohorts, but in a very small number of cohorts resulted in an unreasonably short wait time that is likely due to data errors in the administrative waiting list data.
-
Although measuring effects of wait times on total Medicaid and Medicare spending was outside the scope of this project, our analysis should capture most important effects on Medicaid costs because long-term services account for the majority of Medicaid expenditures among adult Medicaid beneficiaries with disabilities (for example, long-term services and supports accounted for 73 percent of all Medicaid and Medicare expenditures among dually eligible enrollees in 2008, see http://www.kff.org/medicaid/upload/7846-03.pdf). Furthermore, since wait times had no effect on hospitalization rates, wait times are unlikely to significantly affect total Medicare costs, since hospitalizations and related post-acute care account for the largest share of Medicare expenditures.
-
Medicare is the primary payer for acute care services for dually eligible Medicaid enrollees, and the MAX data generally include "crossover claims," which represent Medicaid's coverage of beneficiary cost-sharing for these services. In order to not double-count inpatient hospital stays among dually eligible applicants, we ignored crossover claims and relied solely on the Medicare data to measure hospitalization rates among the dually eligible.
-
Over 99 percent of the long-term institutional stays observed among waiver applicants were in nursing facilities, and fewer than 1 percent occurred in psychiatric hospitals or intermediate care facilities. In this report, we refer to long-term institutional stays as "long-term nursing home stays" and the costs associated with long-term institutional stays as costs for long-term nursing home stays, although all types of institutional stays were included in measuring whether an applicant had a long-term stay in the 36 months after application and in measuring the associated long-term stay costs.
-
Our data set has one record per person based on a specific application to one of the three waivers. In cases where a person applied to more than one waiver, it is possible that he or she eventually enrolled in a waiver that is different from the one we selected for the applicant's record (using the decision rule described in Section III.A). In such cases, we separated out the waiver costs provided through the waiver we selected for that applicant.
-
The CDPS is a diagnosis-based risk-adjustment system developed to adjust capitation rates for Medicaid enrollees in managed care plans (Kronick et al. 2000). Using diagnosis codes on medical claims, it assigns Medicaid beneficiaries to different cost levels (none, very low, low, medium, high, very high, and extra high) within each of 19 different illness or disability categories. Payment weights can be applied to the results to find a risk-adjusted payment score that can be used to adjust capitation payments.
-
Because consumers older than 65 are not eligible for these three waivers, consumers in the high-risk group are not older than 65 at the time of application.
-
Year of application was coded as a continuous variable equal to the number of years since 2000. Since most of the variation in short versus long wait times occurred in 2002 and 2003, we also ran a sensitivity test that was limited to applications in those years. This avoids the need for comparing institutionalization risks from applications separated by several years. The results are very similar to the main results presented in the text (see Appendix Table A.5).
-
Since all applicants were under 65 years old at the time of waiver application, they would not qualify for Medicare due to age.
-
The only notable difference between the wait groups is that applicants to the H&D and BI waivers with short wait times were moderately less likely to be dually eligible for Medicare than those with long wait times.
-
The fact that average spending is similar in the H&D and PD waivers suggest that these two waivers deliver more comparable levels of service than the monthly spending caps imply (the cap for the PD waiver is $687, whereas the cap for the H&D waiver is between $922 and $3,267, depending on the level of care for which a consumer qualifies).
-
"Other waivers" means waivers other than the one that the consumer applied for in the record we selected for this applicant. See Section III.A for our decision rule for selecting a single application for observation in cases where a person applied to more than one waiver.
CENTER OF EXCELLENCE IN RESEARCH ON DISABILITY SERVICES AND CARE COORDINATION AND INTEGRATION (CERDS)
REPORTS AVAILABLE
- Abstracted List of Tasks and Reports
- HTML http://aspe.hhs.gov/daltcp/reports/2014/CERDS.shtml
- PDF http://aspe.hhs.gov/daltcp/reports/2014/CERDS.pdf
--- --- --- --- ---
- Association between NCQA Patient-Centered Medical Home Recognition for Primary Care Practices and Quality of Care for Children with Disabilities and Special Health Care Needs
- HTML http://aspe.hhs.gov/daltcp/reports/2014/ChildDisV3.shtml
- PDF http://aspe.hhs.gov/daltcp/reports/2014/ChildDisV3.pdf
- Children with Disabilities and Special Health Care Needs in NCQA-Recognized Patient-Centered Medical Homes: Health Care Utilization, Provider Perspectives and Parental Expectations Executive Summary
- HTML http://aspe.hhs.gov/daltcp/reports/2014/ChildDisES.shtml
- PDF http://aspe.hhs.gov/daltcp/reports/2014/ChildDisES.pdf
- Descriptive Study of Three Disability Competent Managed Care Plans for Medicaid Enrollees
- Executive Summary http://aspe.hhs.gov/daltcp/reports/2014/3MCPlanses.shtml
- HTML http://aspe.hhs.gov/daltcp/reports/2014/3MCPlans.shtml
- PDF http://aspe.hhs.gov/daltcp/reports/2014/3MCPlans.pdf
- Effect of PACE on Costs, Nursing Home Admissions, and Mortality: 2006-2011
- Executive Summary http://aspe.hhs.gov/daltcp/reports/2014/PACEeffectes.shtml
- HTML http://aspe.hhs.gov/daltcp/reports/2014/PACEeffect.shtml
- PDF http://aspe.hhs.gov/daltcp/reports/2014/PACEeffect.pdf
- Effectiveness of Alternative Ways of Implementing Care Management Components in Medicare D-SNPs: The Brand New Day Study
- Executive Summary http://aspe.hhs.gov/daltcp/reports/2014/OrthoV2s.shtml
- HTML http://aspe.hhs.gov/daltcp/reports/2014/OrthoV2.shtml
- PDF http://aspe.hhs.gov/daltcp/reports/2014/OrthoV2.pdf
- Effectiveness of Alternative Ways of Implementing Care Management Components in Medicare D-SNPs: The Care Wisconsin and Gateway Study
- Executive Summary http://aspe.hhs.gov/daltcp/reports/2014/OrthoV1es.shtml
- HTML http://aspe.hhs.gov/daltcp/reports/2014/OrthoV1.shtml
- PDF http://aspe.hhs.gov/daltcp/reports/2014/OrthoV1.pdf
- Evaluating PACE: A Review of the Literature
- Executive Summary http://aspe.hhs.gov/daltcp/reports/2014/PACELitReves.shtml
- HTML http://aspe.hhs.gov/daltcp/reports/2014/PACELitRev.shtml
- PDF http://aspe.hhs.gov/daltcp/reports/2014/PACELitRev.pdf
- Factors Predicting Transitions from Medicare-Only to Medicare-Medicaid Enrollee Status
- HTML http://aspe.hhs.gov/daltcp/reports/2014/MMTransV2.shtml
- PDF http://aspe.hhs.gov/daltcp/reports/2014/MMTransV2.shtml
- Identifying Medicare Beneficiaries with Disabilities: Improving on Claims-Based Algorithms
- Executive Summary http://aspe.hhs.gov/daltcp/reports/2014/algorithmes.shtml
- HTML http://aspe.hhs.gov/daltcp/reports/2014/algorithm.shtml
- PDF http://aspe.hhs.gov/daltcp/reports/2014/algorithm.pdf
- Impacts of Waiting Periods for Home and Community-Based Services on Consumers and Medicaid Long-Term Care Costs in Iowa
- HTML http://aspe.hhs.gov/daltcp/reports/2014/IAWaitPd.shtml
- PDF http://aspe.hhs.gov/daltcp/reports/2014/IAWaitPd.pdf
- Integrating Physical Health Care in Behavioral Health Agencies in Rural Pennsylvania
- Executive Summary http://aspe.hhs.gov/daltcp/reports/2014/ruralPAes.shtml
- HTML http://aspe.hhs.gov/daltcp/reports/2014/ruralPA.shtml
- PDF http://aspe.hhs.gov/daltcp/reports/2014/ruralPA.pdf
- Non-Elderly Disabled Category 2 Housing Choice Voucher Program: An Implementation and Impact Analysis
- Executive Summary http://aspe.hhs.gov/daltcp/reports/2014/Cat2Housinges.shtml
- HTML http://aspe.hhs.gov/daltcp/reports/2014/Cat2Housing.shtml
- PDF http://aspe.hhs.gov/daltcp/reports/2014/Cat2Housing.pdf
- Parent Perspectives on Care Received at Patient-Centered Medical Homes for Their Children with Special Health Care Needs
- Executive Summary http://aspe.hhs.gov/daltcp/reports/2014/ChildDisV2es.shtml
- HTML http://aspe.hhs.gov/daltcp/reports/2014/ChildDisV2.shtml
- PDF http://aspe.hhs.gov/daltcp/reports/2014/ChildDisV2.pdf
- Physician Perspectives on the Influence of Medical Home Recognition on Practice Transformation and Care Quality for Children with Special Health Care Needs
- HTML http://aspe.hhs.gov/daltcp/reports/2014/ChildDisV1.shtml
- PDF http://aspe.hhs.gov/daltcp/reports/2014/ChildDisV1.pdf
- Strategies for Integrating and Coordinating Care for Behavioral Health Populations: Case Studies of Four States
- Executive Summary http://aspe.hhs.gov/daltcp/reports/2014/4CaseStudes.shtml
- HTML http://aspe.hhs.gov/daltcp/reports/2014/4CaseStud.shtml
- PDF http://aspe.hhs.gov/daltcp/reports/2014/4CaseStud.pdf
- Transitions from Medicare-Only to Medicare-Medicaid Enrollment
- HTML http://aspe.hhs.gov/daltcp/reports/2014/MMTransV1.shtml
- PDF http://aspe.hhs.gov/daltcp/reports/2014/MMTransV1.pdf
To obtain a printed copy of this report, send the full report title and your mailing information to:
U.S. Department of Health and Human ServicesOffice of Disability, Aging and Long-Term Care PolicyRoom 424E, H.H. Humphrey Building200 Independence Avenue, S.W.Washington, D.C. 20201FAX: 202-401-7733Email: webmaster.DALTCP@hhs.gov
RETURN TO:
Office of Disability, Aging and Long-Term Care Policy (DALTCP) Home [http://aspe.hhs.gov/office_specific/daltcp.cfm]Assistant Secretary for Planning and Evaluation (ASPE) Home [http://aspe.hhs.gov]U.S. Department of Health and Human Services (HHS) Home [http://www.hhs.gov]
Last Updated: 05/05/2014