
Effectiveness of Alternative Ways of Implementing Care Management Components in Medicare D-SNPs: The Brand New Day Study
Jelena Zurovac, Randy Brown, Bob Schmitz and Richard Chapman
Mathematica Policy Research
January 2014
Printer Friendly Version in PDF Format: http://aspe.hhs.gov/daltcp/reports/2014/OrthoV2.pdf (72 PDF pages)Free PDF Reader: http://get.adobe.com/reader/ 
This report was prepared under contract #HHSP23320095642WC between the U.S. Department of Health and Human Services (HHS), Office of Disability, Aging and Long-Term Care Policy (DALTCP) and Mathematica Policy Research. For additional information about this subject, you can visit the DALTCP home page at http://aspe.hhs.gov/office_specific/daltcp.cfm or contact the ASPE Project Officer, Hakan Aykan, at HHS/ASPE/DALTCP, Room 424E, H.H. Humphrey Building, 200 Independence Avenue, S.W., Washington, D.C. 20201. His e-mail address is: Hakan.Aykan@hhs.gov.
The opinions and views expressed in this report are those of the authors. They do not necessarily reflect the views of the Department of Health and Human Services, the contractor or any other funding organization.
TABLE OF CONTENTS
I. INTRODUCTION
A. Background
B. About the Participants
C. Roadmap to the Report
A. Description of Intervention Components
B. Hypotheses
III. STUDY DESIGN AND ANALYSIS METHODS
A. Study Design
B. Data
C. Impact Analysis Methods
D. Implementation Analysis Methods
IV. STUDY FINDINGS
A. Quantitative Impact Analysis Findings
A. Fidelity Analysis Using Tracking Tool Data
B. Implementation Analysis: Care Managers' Feedback on Implementation Challenges
VI. DISCUSSION AND CONCLUSIONS
A. Interpretation of Impact Analysis Findings
B. Limitations
C. Conclusions
D. Implications for Policy and Practice
APPENDICES
APPENDIX A: Interventions, Randomization, and Intervention Assignments
APPENDIX B: Regression Analysis Results
LIST OF FIGURES
FIGURE IV.1: Number of Inpatient Admissions per Member per Year by Life Coach One Year Before the Study, Adjusted for Member Risk
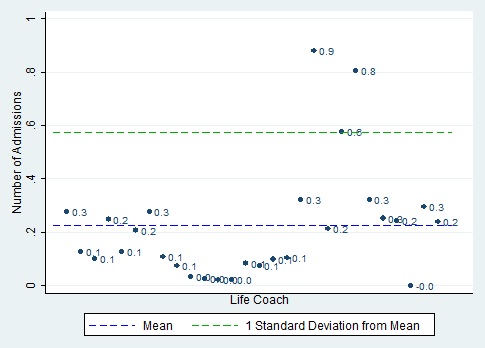
FIGURE IV.2: Number of Inpatient Psychiatric Admissions per Member per Year by Life Coach One Year Before the Study, Adjusted for Member Risk
FIGURE IV.3: Number of ER Visits per Member per Year by Life Coach One Year Before the Study, Adjusted for Member Risk
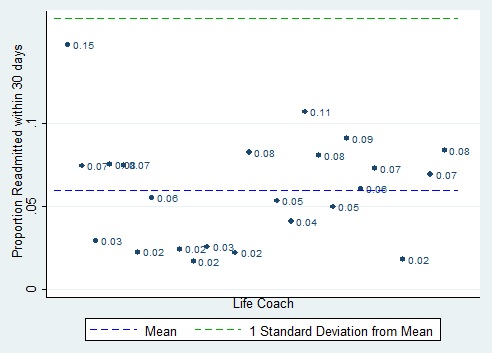
FIGURE IV.4: Proportion of Members Readmitted for Any Reason per Year by Life Coach One Year Before the Study, Adjusted for Member Risk
LIST OF TABLES
TABLE II.1: List of Intervention Components and Options Tested as Part of the Study
TABLE III.1: Key Outcomes Analyzed in the Study
TABLE III.2: Construction of Frequency and Fidelity Implementation Measures
TABLE IV.1: Demographic Characteristics of Study Participants
TABLE IV.2: Use of Inpatient and ER Services at Baseline and Follow-Up
TABLE IV.3: Average Outcomes at 12-Month Follow-up for Members Assigned to Enhanced or Routine Care
TABLE V.1: Percentage of Members Assigned to an Option Who Received or Refused That Option at Least Once, Using Six Months of Data and One year of Data
TABLE V.2: Number of Times an Option Was Provided to Members Assigned to That Option
TABLE V.3: Percentage of Members Who Received Each Option at Least as Often as Assigned
TABLE A.1: Care Manager Random Assignments to Intervention Component Combinations
TABLE A.2: Proportion of Members Assigned to Option B for Each Intervention Component
TABLE B.1: Heckman-Hotz Analysis: Effect of Components on Baseline Outcomes
TABLE B.2: Effects of Components on Number of Inpatient Admissions, Number of Psychiatric Inpatient Admissions, Number of ER Visits, and Likelihood of Readmission at Follow-Up
ABSTRACT
Objective: Test which of two alternative ways of implementing each of 11 components of care management lead to better health outcomes in the Brand New Day plan, a Medicare special needs plan (SNP) for dual eligibles with severe mental illness. The tested alternatives were routine care (services routinely provided before the study) and enhanced care (more intensive versions of the services) in provision of routine contacts, depression screening, member coaching, medication and chronic disease management (DM), and care transitions management.
Study Design and Data: An experimental design approach rarely used in health research--efficient orthogonal design--was used to assign each of 28 participating life coaches to implement a different, pre-selected combination of routine or enhanced care for each of 11 components, for a one-year period to the plan members whose care they manage (a total of 1,422 members; average caseload=51). The plan's claims data were used to measure members' service use and chronic conditions; enrollment files provided data on demographics. Fidelity to assigned component options was assessed using data from tracking tool sheets that the plan required the life coaches to fill out after each encounter and through discussions with care management staff.
Key Outcomes: Health outcomes examined were: (1) the number of inpatient admissions; (2) the number of psychiatric inpatient admissions; (3) the incidence of readmission within 30 days of discharge; and (4) the number of emergency room (ER) visits. Fidelity outcomes were: (1) the proportion of members receiving the assigned option at least once; (2) the annualized number of times each component or option was provided per member; and (3) the proportion of members receiving the option at least as often as assigned.
Analysis Methods: Regression analysis was used to estimate differences in outcomes between members receiving routine and enhanced care. All four outcomes were analyzed over the 1-6, 7-12, and the full 1-12 month follow-up periods for all the members. Readmissions were analyzed for hospitalized members over the 1-12 month follow-up. Fidelity to assignments was analyzed using tracking tool data and interpreted in light of qualitative analysis of discussions with plan staff.
Select Results: Over the full year of follow-up: (1) those assigned to more frequent depression screening had 41 percent fewer ER visits; and (2) hospitalized members assigned to receive DM education had 50 percent lower readmission rates. Medication review was also associated with fewer ER visits among all members over months 1-6. However, we found an equal number of instances of statistically significant differences in outcomes in which those assigned to the enhanced version experienced worse outcomes than those assigned to routine care. Furthermore, the number of significant differences was about what would be expected by chance for the 110 comparisons (three outcomes were analyzed for 11 components for all members over three periods and one outcome for 11 components for hospitalized members). Thus, it is unclear whether these represent true effects or differences due to chance. Fidelity analysis showed that few members in both the enhanced and routine care groups received at least the minimum number of services specified in the study protocol, likely reflecting various barriers to implementation.
Conclusions: The most important benefit of an orthogonal design study, as we have seen from the reaction of the participating plan, might be the clarity it provides regarding how interventions are expected to be delivered. When routine care is not well defined or when the way routine care is implemented differs across care managers, this structure itself can help standardize the care management intervention, leading to less variation in implementation across care managers. Further, in our study fidelity analysis allowed participating plans to assess the degree to which components were carried out as specified, which can help the plan identify barriers that case managers face to implementing care management as planned, and the areas on which to focus their quality improvement efforts. The orthogonal design approach also encourages organizations to create a culture of learning by providing participants with a rigorous approach for testing out their new ideas. To ensure the findings from the orthogonal design are true effects with actionable implications, studies need to have enough care operational units (for example, care managers) to provide adequate power to detect modest size effects.
ACRONYMS
The following acronyms are mentioned in this report and/or appendices.
| C-SNP | SNP serving beneficiaries with chronic conditions |
| CMS | Centers for Medicare and Medicaid Services |
| COPD | Chronic Obstructive Pulmonary Disease |
| D-SNP | SNP serving dual eligible |
| DM | Disease Management |
| ER | Emergency Room |
| HEDIS | Healthcare Effectiveness Data and Information Set |
| I-SNP | SNP serving beneficiaries in nursing homes |
| LVN | Licensed Vocational Nurse |
| PCP | Primary Care Physician |
| PHQ | Patient Health Questionnaire |
| PHQ-2 | PHQ Two-Question Instrument |
| PHQ-9 | PHQ Nine-Question Instrument |
| SNP | Special Needs Plan |
| SPMI | Severe and Persistent Mental Illness |
| UM | Utilization Management |
EXECUTIVE SUMMARY
Introduction
Evidence on best practices in care management for chronically ill Medicare beneficiaries offers few clear guidelines about what works best. Given the wide variation both within and across plans in how special needs plan (SNP) services are provided, it becomes important to identify how best to implement or improve intervention. In this study, we sought to understand which of two alternative ways of implementing each of several components of care management lead to better health outcomes in Brand New Day SNP. We used an efficient orthogonal design that allowed us to simultaneously compare effectiveness of alternative approaches to implementing 11 components of care management services. Efficient orthogonal designs have been used extensively in manufacturing, and in some health care organizations, but not in published health care evaluations. Such designs enable the testing of multi-component interventions and various ways of deploying each component, offering great potential as a tool for continuous improvement in health care quality.
This study compares key patient outcomes at Brand New Day, a Medicare SNP for dual eligibles with severe mental illness, under two alternatives--routine care (services routinely provided at the plan before the study) and enhanced care (more frequent or more intensive services)--for each of 11 care components. The tested components included frequency-of-routine contacts; depression screening frequency, use of depression screening instruments, and mode of referral to specialists; member education and coaching strategies; medication and chronic disease management (DM); and management of care transitions, including frequency of follow-up and use of protocols and tools.
Study Design and Analysis Methods
Randomization, Outcomes, and Data
The study participants were: (1) care managers (referred to as "life coaches") in Brand New Day, who implemented the interventions; and (2) the 1,422 dually eligible noninstitutionalized members with severe and persistent mental illness who comprised these life coaches' caseloads. We randomly assigned each of the 28 life coaches to implement a different, pre-selected combination of alternatives (routine care or enhanced care) for each of 11 components, over a one-year period. The life coaches implemented the same intervention components for all of their members. Although we randomly assigned the life coaches, several other types of care management staff assigned to care for a given life coach's members also provided the components, including clinical directors, field intervention nurses (field nurses), and primary care physicians (PCPs).
For each component we analyzed whether members assigned to the enhanced care variant experienced different outcomes than those assigned to the routine care variant. Outcomes examined included: (1) the number of inpatient admissions for any reason; (2) the number of psychiatric inpatient admissions; (3) the incidence of readmission within 30 days of discharge (for those with a hospital admission); and (4) the number of emergency room (ER) visits. The program period spanned from July 1, 2011, through June 30, 2012. We received approval for the study from the New England Institutional Review Board. U.S. Office of Management and Budget approval was not required because Mathematica did no primary data collection.
To analyze the effectiveness of enhanced versus routine care, we used two sources of secondary data obtained from the plan: (1) de-identified claims data on members' service use and chronic conditions; and (2) de-identified data on members' demographic characteristics and risk level, as assessed by the plan. For the implementation analysis, we used data collected by the plan via tracking tools to assess the care managers' fidelity to their assigned component options. Care management staff were instructed to use the tracking tool form after each contact with the members to record which components were provided. We also conducted discussions with care management staff to understand how faithfully the components were implemented and any barriers they encountered.
Impact and Implementation Analysis Methods
We used regression analysis to compare the outcomes for members receiving routine care to the outcomes for members receiving enhanced care, controlling for any pre-intervention differences between the two groups in members' and care managers' characteristics. All four outcomes were analyzed over these follow-up periods after program start up on July 1, 2011 for all members: 1-6 months, 7-12 months; and the full 12 month period. Analyses of effects of components on readmissions were done for hospitalized members only over the full 12 month follow-up period. Regression analyses controlled for member characteristics observed over the two-year baseline period (July 1, 2009, to June 30, 2011).
Implementation analysis is particularly important because a finding from regression analyses that routine and enhanced care options for a given component are equally effective in terms of observed health outcomes might be incorrect if such care was not fully implemented. We used the tracking tool data to assess the fidelity to assignments by examining: (1) the proportion of members receiving the assigned option at least once; (2) the annualized number of times each component or option was provided per member; and (3) the proportion of members receiving the option at least as often as assigned. We supplemented these data with telephone discussions with care management staff in July through November 2012 (between a few weeks and four months after the intervention period ended, but before the analysis results were produced. These discussions provided information on their views on why enhanced care may have been more effective than routine care for some components but not for others, and to identify implementation facilitators and barriers.
Study Findings and Discussion
Descriptive Results
The population of members in the study was composed mostly of middle-age adults, included more men than women, and was largely Caucasian. Members primarily lived in urban areas. During both the baseline and follow-up years, approximately a quarter of members were hospitalized; also, members experienced slightly over one ER visit per member per year.
Findings
Outcomes for patients whose care managers were assigned to the enhanced version were not significantly different from those for patients with care managers assigned to the routine version for most of the 11 care components. However, there were a few exceptions:
-
Requiring more frequent depression screening using a particular instrument was associated with approximately 41 percent fewer ER visits over the full year of follow-up. Although the number of screenings per member per year was low, staff screened over three times as many members assigned to enhanced care (25.5 percent versus 7.9 percent) and conducted nearly four times as many screenings per member per year (0.59 versus 0.15). Further, the difference on this outcome for the year was driven by the difference in the first six months of the study, a finding that is not surprising because fidelity analysis showed that most screenings were performed in the first six months of the study.
-
Members assigned to frequent depression screenings with an instrument also had 53 percent more short-term readmissions after a hospital discharge than members assigned to less frequent screening. This finding is difficult to explain; we did not expect this component to affect readmissions in either direction.
-
Assigning life coaches to reinforce DM education during routine contacts was associated with approximately 50 percent lower likelihood of readmissions over the full year of follow-up (for hospitalized members). Even though care managers liked this component, some staff were uncomfortable addressing medical issues, indicating a need for additional training or use of medical staff.
-
Assigning field nurses to conduct follow-up visits after a discharge from a hospital for medical (nonpsychiatric) discharge was associated with a significantly higher short-term hospital readmission rate than routine care. However, very few field nurses actually provided such care.
-
Results for outcomes measured over the periods of 1-6 months and 7-12 months were generally similar to those for the full period, suggesting that most of the enhanced options neither influenced outcomes early on but then dissipated, nor that they took several months to take effect. One exception is that full medication review was associated with fewer ER visits over the 1-6 month (but not the 7-12 month) periods.
Some findings of no difference in outcomes may be attributable to a failure to implement the enhanced care option in a manner that sufficiently distinguished it from the routine care option. For example, although the teachback method was qualitatively more intensive, the fidelity analysis showed that life coaches used it less often than routine practices, indicating that members assigned to teachback might have received less coaching (a similar finding was observed in our companion study of two other SNPs; see Zurovac et al. 2013). Also, care managers performed many medication reviews to compensate for PCPs performing very few. And, even though the brownbag medication review performed by life coaches did not improve outcomes, plan staff saw it as highly effective. A clinical director noted that brownbag review prompted some members to engage their PCPs.
Care management staff reported several important lessons learned from the study implementation. Life coaches and clinical directors said that efforts to better integrate medical and psychiatric care were very helpful to members; they want to see more such efforts in the future. This feedback is consistent with the estimated outcome differences: two of the three enhanced care components that had better outcomes addressed members' medical needs: reinforcement of DM education and medication review (conducted by life coaches as part of routine contacts). Two components aimed to increase the engagement of field nurses, but due to very large caseloads, these nurses' involvement in the study was very limited. Life coaches and clinical directors reported that they want the plan to hire more field nurses and that they need easier access to them, indicating a need for additional integration of medical services.
Limitations
Several limitations in the study should be noted. Because only 28 life coaches participated in the study, only large differences in outcomes between routine and enhanced care options (38-64 percent of the mean outcome) were likely to be detected.
Given that we performed many comparisons between enhanced and routine care, it is possible that some findings resulted from chance. The number of significant differences was about what would be expected by chance for the 110 comparisons (three outcomes were analyzed for 11 components for all members for three periods and one outcome for 11 components for hospitalized members). Thus, it is unclear whether these represent true effects or chance differences. A joint test of whether all enhanced versus routine care differences were zero could not be rejected, indicating that even the few statistically significant observed differences may have been due to chance rather than to the interventions. This also indicates that as a group, enhanced components did not have a different effect on measured outcomes than routine practices.
The findings from the implementation analysis of the tracking data may be flawed by incomplete reporting by the care management staff on their activities. The tracking tool data showed provision of few components in the second half of the study; it is unclear whether that was due to: (1) the plan not providing complete tracking sheets for that period; and/or (2) plan staff providing fewer study components during the second half of the study. In the last few months of the study, the plan incorporated the tracking tool as part of the electronic care management system, which made it easier for staff; however, not all staff had access to the system and multiple organizational changes caused the study (and the recording of provided services) to be somewhat neglected during that period, which most likely explains gaps in the tracking tool data.
For several components, the enhanced care option was not implemented in a manner that distinguished it sufficiently from the routine care option because it was not implemented consistently or fully or because routine care was more intensive when delivered than specified by the participating plans. However, this is not a limitation, but rather, an important finding that can inform plans of the need to identify barriers that care managers face to implementing planned intervention components and seek ways to overcome them. The analyses in this report took an "intent-to-treat" approach in which component effects are computed by comparing outcomes of those assigned to the two options, regardless of whether or how thoroughly the options were actually delivered. Standard supervisory measures continued to test the components in a "real-world" environment with the currently available resources, rather than in a strictly controlled setting.
Implications for Policy and Practice
The study illustrates the potential of orthogonal design for improving the effectiveness and efficiency of care management programs, if enough observational units such as care managers are available. Orthogonal design combines the rigor of experimental design with the ability to produce rapid results on the effectiveness of multiple enhancements to routine practices in a single experiment. It accommodates planned testing of alternative approaches to multi-component interventions and permits practitioners and researchers to tailor interventions to the target population and test enhancements to routine care. Given that orthogonal design tests combinations of routine and enhanced care, there is no traditional control group; all members receive each component of care, but delivered in a different way or intensity level. Further, the designs can be created to ensure that every member receives the enhanced version of one or more of the components. In addition, orthogonal studies are attractive because the care management staff who implement the interventions all are engaged in testing new variations, because each care manager implements some enhanced care and some routine care options.
An important benefit of an orthogonal design study, as we have seen from the reaction of the participating plan, is increased clarity for care managers on how the plan expects them to deliver the various components of the intervention. Rather than implementing a broad model of care, care managers are told precisely how they are expected to implement each of the components of care management being tested. When routine care is not well defined or the way routine care is implemented differs across care managers, this structure itself can help standardize the care management intervention, leading to less variation in implementation across care managers. Further, fidelity analysis allows the plan to assess the degree to which components were carried out as specified, which can help the plan identify the areas of care management to focus on in their quality improvement efforts. The orthogonal design approach also encourages organizations to create a culture of learning, by providing participants with a rigorous approach for testing out their new ideas.
However, the study also identifies some important difficulties with conducting orthogonal design studies in health care organizations. The types of variations in how care coordination is delivered studied here are likely to generate only moderate size effects on hospitalizations or ER use. To have adequate statistical power to detect such effects, a sizeable number of care manager units are needed, because the variance of these outcomes across care managers is large. Without adequate power, statistically insignificant differences in outcomes between enhanced and routine versions of a care component cannot be taken as valid evidence that the routine (and typically less expensive) version of the intervention is just as effective as the enhanced version. Although the number of care managers (28) participating in this study exceeds the number used in some studies in other fields, it was not sufficient for this study, due to the large random variation in hospitalization rates across care managers.
The study also identifies how hard it can be to change the behavior of even dedicated health professionals. For each of the components, both the enhanced and routine care groups received the assigned component less often than specified in the study. Very few members received at least the minimum number of services (for example, contacts, post-discharge visits, screenings) as specified in the study protocol, and an even smaller percentage of members assigned to enhanced care received services at least as often as assigned. Even though these findings may have been due in part to under-reporting of services provided (evident in care managers submitting few tracking sheets in the second part of the study), it suggests there are various barriers to implementing the interventions that should be addressed. Some of the barriers reported by care management staff include high caseloads, difficulty keeping track of whether and when each member of their caseload had received each of the assigned intervention components, and multiple organizational changes occurring concurrently with the study that divert care managers' attention. This qualitative investigation of these barriers to implementation is just as important for learning as estimation of the effects of the various enhancements.
I. INTRODUCTION
Special needs plans (SNPs) were established in 2003 as part of the Medicare Prescription Drug, Improvement, and Modernization Act, with the goal of improving care for high-risk target populations of Medicare beneficiaries. There are three types of SNPs: (1) D-SNPs serving dual eligibles (those enrolled in both Medicare and Medicaid); (2) C-SNPs serving beneficiaries with chronic conditions; and (3) I-SNPs serving beneficiaries residing in nursing homes (Health Net 2012). SNPs' enrollment has more than doubled since 2006, with most members located in D-SNPs (Gold et al. 2011).
SNPs contract with the Centers for Medicare and Medicaid Services (CMS) to provide all covered Medicare services to beneficiaries with special needs in return for a monthly risk-adjusted capitation payment. Thus, SNPs have the incentive to engage in care management to help plan members reduce their need for expensive services, especially hospitalizations and emergency room (ER) visits (Grabowski 2009). SNPs are allowed to target enrollment to groups with distinct care needs and to build a critical mass of beneficiaries with certain conditions, which allows them to tailor interventions to those members and conditions and helps them reduce hospitalizations and institutionalizations (CMS 2012). D-SNPs use the flexibility of capitated payments to provide a mix of services and typically offered coordination activities, including assistance with care transitions, medication reconciliation, patient education, and patient assessment with respect to risk for hospitalization or nursing home placement (Schmitz et al. 2008; Medicare Payment Advisory Commission 2011).
A. Background
In a recent systematic review of complete models of care coordination programs, Au et al. (2011) determined that "no firm conclusions can be drawn at this time regarding what works best for whom in care coordination for adults with disabilities." The authors found only three high quality studies that identified effective programs. The first of these programs was Senior Care Options, an integrated Medicare and Medicaid managed care program for the elderly in Massachusetts that coordinated medical services, behavioral health services, prescription drugs, and long-term support services. This program produced a significant reduction in the rate of nursing home entry (JEN Associates 2008). The second was the Alzheimer's Disease Coordinated Care for San Diego Seniors Program, a guideline-based care management intervention for dementia featuring case management software and care recommendations provided to caregivers by care managers. This program achieved improvement in patient-reported health-related quality of life (Vickrey et al. 2006). In the third program, a treatment team for adults with severe and persistent mental illness (SPMI) provided care management and access to a range of mental health and substance abuse services. This program achieved reductions in psychiatric inpatient admissions and hospital days (Mangrum 2006). The above mentioned program targeted clients with co-occurring SPMI and substance use disorders. The dual-diagnosis treatment teams provided care coordination and access to a range of mental health and substance abuse services, including psychiatric services, individual therapy, and specialized groups tailored to client issues. Referring to the reviewed literature as a whole, the authors concluded that "information on specific features of [the] programs was frequently incomplete, or the features themselves were inadequately documented" (Au et al. 2011).
Even after rigorous evaluation methods (such as randomized trials) find a given intervention effective, programs often do not produce comparably favorable results when the intervention is repeated in other settings (due in part to differences in how the intervention was implemented). For example, in the last decade, several models of transitional care have been shown to be effective in reducing readmission rates (Naylor et al. 1999; Coleman et al. 2006; Jack et al. 2009). However, less is known about how best to implement the various components. For instance, evidence shows that post-discharge follow-up helps reduce readmission rates, but there is little information about how quickly this follow-up visit needs to occur, how many times, and which protocols to use. Mahoney (2010) notes that the success of multi-component interventions depends on the particular, detailed features of the intervention, the methods used to engage patients and providers, and the target population for the intervention components, and illustrates this with findings from fall prevention studies.
SNPs vary greatly in their design and in the scope of services provided (Medicare Payment Advisory Commission 2011) due to the unique and varied needs of the beneficiaries and the diverse environment in which services are provided. Because great variation exists in how SNP services are provided, it is important to identify the most effective ways to implement various intervention components.
Current evidence on best practices in care management for chronically ill Medicare beneficiaries offers some guidelines, but the results are suggestive, not conclusive, and may not be applicable to people with disabilities. Brown et al. (2012) showed that in randomized clinical trials, among 11 Medicare care coordination demonstration programs for beneficiaries with chronic illnesses, four decreased inpatient admissions in a high-risk subset of enrollees. The four programs that were successful in reducing hospitalizations differed from the seven unsuccessful programs on six key dimensions: (1) supplementing telephone calls to patients with frequent in-person meetings; (2) having an established relationship or opportunities for interaction with their patients' primary care providers; (3) acting as a communications hub for the providers seen by the patient; (4) delivering evidence-based education to patients, using motivational interviewing techniques or other proven behavior change approaches; (5) providing strong medication management, with more reliable sources of information about medications than simply patient self-reports; and (6) providing timely and comprehensive transitional care after hospitalizations. Although these features were found to be correlated with success, the authors were unable to ascertain the causal effects of intervention components because each program developed its own model.
The key to designing the most effective--and the most cost-effective--package of care management services is to understand these building blocks and how to implement them. Efficient orthogonal designs that test the different ways of deploying each component of an intervention can be used to explore the best ways to operationalize complex interventions.
B. About the Participants
Participants in the study included care management staff at Brand New Day D-SNP and their noninstitutionalized members with SPMI.1 To become Brand New Day members, patients must be enrolled in Medicare Part A and Part B, diagnosed with chronic and disabling mental health conditions, and reside in Kern, Los Angeles, Orange, Riverside, or San Bernardino County in California. Brand New Day provides traditional Medicare benefits, such as coverage for inpatient hospital care, doctor office visits, and outpatient services (Brand New Day 2013). In addition to these benefits, members are assigned a personal services coordinator (referred to by the plan as a life coach), who is generally a social worker or licensed vocational nurse (LVN) responsible for managing care, appointments, and medications. Care management services are provided by care management teams comprised of life coaches; clinical directors, most of whom are licensed clinical social workers; and field intervention nurses (field nurses), who are LVNs. Care management teams provide care management services such as regular contact, medication reviews, and depression screening. The plan collaborates with psychiatrists and primary care physicians (PCPs) to help integrate medical and psychiatric care. The plan also provides other benefits such as bus passes and assistance with various life issues.
C. Roadmap to the Report
In Section II, we review intervention components tested as part of the study. In Section III, we describe the study design and analysis methods. We present results from a quantitative impact analysis in Section IV, and in Section V we present the results of the implementation analysis. Finally, in Section VI, we discuss our findings and conclusions.
II. INTERVENTION COMPONENTS
The intervention components selected for the study were developed in close collaboration with Brand New Day. The aim of this collaboration was to select components that were grounded in research, were considered clinically meaningful, had the potential to improve outcomes for members served by SNPs, were of interest to the plan, and were feasible to implement. We engaged in weekly calls to seek feedback from the plan staff about how best to define the details of each tested alternative and how to instruct the care management staff to implement each alternative. We used an iterative process to synthesize the comments and concerns from the plan. This collaborative process yielded the final list of components to test.
Ultimately, we identified 11 intervention components with two alternatives for each, one representing routine care at the plan and another representing enhanced care. Although we started with a long list of interventions, conversations with Brand New Day revealed interest in the following key areas of care management: (1) routine contacts; (2) depression screening; (3) member coaching and education; (4) medication management; (5) integration of psychiatric and medical care; and (6) management of care transitions from hospital to home and ER to home. Several types of care management staff were asked to participate in the study, including life coaches, clinical directors, field nurses, PCPs, and psychiatrists.
Before the start of the study, we provided participating care management staff with short documents that outlined their assignments (their combination of options). We also provided them with an implementation guide that included general information about the study, such as study objectives, motivation, and outcomes analyzed as part of the study, and a detailed description of the two tested options for each of 11 intervention components. We conducted several training sessions for the care management staff during which we discussed the intervention components and the use of intervention tracking sheets, and answered care managers' questions.
A. Description of Intervention Components
We tested two alternatives for implementing 11 components of care management. Option a approximates routine care, whereas Option b represents some enhancement over routine care. The tested options constitute how and not whether care management is provided. For ethical reasons, we did not test any options that would require a member to receive less care than he or she would have received in the absence of the study. Rather, we tested the way care of a given service is routinely provided at Brand New Day ("routine care") against an enhanced version of that service. In addition, care management staff participating in the study were instructed not to withhold a service that they believed a member needed to receive. For example, if a given member was to receive four routine contacts during the study according to her risk level, but her life coach believed that she needed additional contacts, the life coach was instructed to provide more contacts. In other words, both routine and enhanced care options provided guidance for the minimum service that needed to be provided, but care management staff continued to use their clinical judgment to determine when to provide services beyond the specified minimum. In Table II.1, we present a brief description of both tested options and the routine practices.
| TABLE II.1. List of Intervention Components and Options Tested as Part of the Study | |
| Intervention | Variants |
| 1. Life coaches conduct more frequent routine contacts |
|
| 2. Staff use simpler depression screening instrument |
|
| 3. Clinical director conducts depression screening every 2 months |
|
| 4. Life coaches use teachback method while educating membersa |
|
| 5. Life coaches reinforce DM topics covered in group classes |
|
| 6. Staff involve field nurse in management of complex cases |
|
| 7. PCP performs a detailed medication review every 4 months |
|
| 8. Clinical director follows up twice after psychiatric discharges |
|
| 9. Field nurse always follows up after a medical discharge |
|
| 10. Clinical director follows up after ER visit |
|
| 11. Life coaches provide brownbag medication review |
|
| NOTES: Option a generally describes the routine care at the plan, whereas Option b represents an enhanced care strategy. a.Teachback is a coaching method that requires members to confirm understanding by repeating back instructions. | |
For the 11 components, we studied options such as how often the component is provided and which procedures or protocols are used for implementing it. The components we examined include routine contacts with patients, depression screening, member education and coaching, medication review, and management of care transitions. For example, for the care transitions component, we tested the effectiveness of including field nurses as-needed during follow-up after a medical discharge versus an enhanced option that requires that field nurses are always involved with members during follow-up. See Appendix A for a detailed description of each of these intervention components.
B. Hypotheses
We expected that more frequent routine contacts and medication reviews with members would help care management staff identify and address developing health concerns and could therefore reduce the need for hospital and psychiatric inpatient admissions and ER visits. While some intervention components were expected to have greater impacts on one of these three outcomes than the others, each component had the potential to affect all of the outcomes. Even readmissions could be affected by most of the interventions, through increases in patients' knowledge of their condition and their enhanced access to information through their care manager.
III. STUDY DESIGN AND ANALYSIS METHODS
A. Study Design
1. Efficient Orthogonal Design
In this study, we simultaneously tested the comparative effectiveness of alternative ways of implementing multiple intervention components, using an efficient orthogonal design. This design is well-suited for evaluating and refining care management models for three reasons: (1) it allows the plan to specify the variation in how key components of the model are implemented, whereas such variation would otherwise occur haphazardly; (2) it can produce rigorous results about the effectiveness of several components of care management in a single study; and (3) if adequately powered, it allows evaluators to assess directly whether more resource-intensive components yield sufficient improvement in outcomes to warrant the investment. Compared with a traditional randomized control trial, orthogonal design allowed us to test several intervention components with fewer implementers.
We used a two-level efficient orthogonal design method in which we tested two alternatives for each intervention component: routine care (Option a) and enhanced care (Option b). We then used an algorithm to generate a specific set of combinations of a's and b's that constitute an orthogonal design for the number of intervention components to be tested. Combinations of different component options include sequences such as aabaa, bbaaa, ababa, and so on. Life coaches were each randomly assigned to specified specific combinations of options.
Due to the random assignment of care management staff to combinations of component options, the relative effect of Option a versus Option b for any intervention component can be estimated by simply comparing the mean outcomes for the patients of care management staff assigned to a to the mean for patients whose care managers were assigned to b. If no difference in outcomes is found between routine and enhanced care options for a given component, this finding is still very meaningful if the study has adequate statistical power. If intervention components were implemented as intended, a finding of "no difference" in outcomes for members who were assigned to receive Option a versus Option b indicates that the more intensive component did not show an improvement in outcomes over the less intensive component. A finding of "no difference" is an important one because it indicates that it may not be fruitful to adopt a more expensive option. However, a finding of no difference in outcomes between routine and enhanced care options might also happen if: (1) the routine care option was not defined in a way that made it sufficiently different from the enhanced care option; and/or (2) the routine care option was not different from the enhanced care option as implemented.
The standard methods of computing statistical power for clustered designs in randomized controlled trials can be used to compute power for orthogonal designs. (See Zurovac and Brown [2012] and Zurovac et al. [2013] for an overview of orthogonal design methodology.) In clustered designs in which care management staff are assigned to implement a given set of components for all of their members, power depends predominantly on the number of care management staff (and not the number of members) involved in the study. In this study, we have limited power to detect differences between the two tested options because only 28 life coaches participated in the study. The precise power depends heavily on the variance in outcomes across care managers. We offer a more detailed discussion of when the finding of no difference can occur as well as a discussion of power in Section IV (Results) and Section VI (Discussion and Conclusions).
The key feature of these designs that ensures that the estimates are unbiased is orthogonality, meaning that the assigned combinations are independent of one another. In practice, this means that: (1) half of the care managers are assigned to Option a and half to Option b for each of the 11 components being tested; and (2) of the care management staff assigned to Option a of Component 1, half are assigned to Option a and half to Option b for Component 2 and so on for all possible pairs of components. However, in efficient orthogonal designs, the effects of any single intervention component cannot be distinguished from the effects of some interactions of other components. The extent of such potential confounding depends on the number of care management staff in the study relative to the number of components being tested. Because we used an efficient design (which means that the number of intervention components tested was large relative to the number of care management staff), we were unable to estimate the interaction effects between components.2 However, the number of care management staff engaged in the study was sufficient to ensure that main effects of any component are confounded only with three-level and higher-order interactions of other components. The analyses in this report took an "intent-to-treat" approach in which component effects are computed by comparing outcomes of those assigned to the two options, regardless of whether or how thoroughly the options were actually delivered.
2. Randomization
In this study, 28 life coaches were randomly assigned to implement a pre-specified combination of Option a or Option b for the 11 intervention components (see Appendix A for more details on random assignment of interventions to each life coach). For example, the life coach designated number 1 was assigned the following combination: abbbaaababb. The combination contains 11 letters (denoting the option assigned for each of the 11 components. The 28 combinations of component options used in this study, which are designed to satisfy the orthogonality principle described above, are in Appendix A, Table A.1.
Although we randomly assigned life coaches to each of 11 intervention components, several types of care management staff assigned to care for a given life coach's members provided the intervention components, including life coaches themselves, clinical directors, field nurses, PCPs, and psychiatrists. Staff continued to provide the intervention components they normally provide. For example, clinical directors were assigned to provide two follow-ups after a psychiatric discharge because they have the experience needed for effective follow-up. For a given life coach, if that life coach was assigned Component 8b (two follow-ups post-discharge), all members served by that life coach appeared on the clinical directors' list of members to receive two follow-ups from the clinical director.
B. Data
We used several data sources in this evaluation: administrative plan data, tracking tool data, and information obtained from discussions with care management staff. All member-level data sources were de-identified and contained only "mock" identifiers so that the members' data could be linked to life coaches and intervention component assignments.
For the impact analysis, we used two sources of secondary data obtained from the plan: (1) deidentified claims data on members' service use and chronic conditions; and (2) de-identified data on members' demographic characteristics and risk level as assessed by the plan. We received final action claims for physician services and hospital use and dropped denied claims and laboratory claims from the construction of all variables. Laboratory claims were dropped because they were not needed for the construction of the analyzed outcomes or explanatory variables. It was important not to use laboratory diagnosis codes in the construction of chronic condition flags because these codes only denote what the laboratory tested, not whether a diagnosis was made.
We obtained one year of follow-up data that coincided with the period of implementation of the intervention components, July 1, 2011, through June 30, 2012. We also obtained two years of baseline data, covering the period July 1, 2009, through June 30, 2011.
For the implementation analysis, we used data collected by the plan (using tracking tool sheets) to assess the fidelity to assigned component options, and we conducted discussions with care management staff in order to understand how the intervention components were implemented. The tracking tools were designed to obtain information about provision of assigned components and options. In Section III.D, we further describe implementation analysis methods.
C. Impact Analysis Methods
1. Outcomes
We tested for differences in the utilization between members receiving routine care (Option a) and those receiving enhanced care (Option b). For the sample as a whole, we examined impacts on the following four outcomes: (1) number of inpatient admissions for any reason; (2) number of psychiatric inpatient admissions; (3) whether there was a readmission within 30 days of discharge; and (4) number of ER visits. We examined impacts on readmissions for members hospitalized at least once during the follow-up, since members who were not hospitalized cannot be readmitted. We examined impacts of intervention components on outcomes over the 1-6, 7-12, and the full 1-12 month follow-up periods for all members. The program period spanned from July 1, 2011, through June 30, 2012. Analyses of effects of components on readmissions were done for hospitalized members over the 1-12 month follow-up. Details for construction of each outcome are listed in Table III.1.
| TABLE III.1. Key Outcomes Analyzed in the Study | |
| Description of Outcome | Details of Construction |
| Annualized number of ER visits | We identified ER visits based on the place of service, procedure, and diagnosis codes per HEDIS 2012 specifications. ER visits that occur on the same day as any hospital or skilled nursing home admission are not counted. |
| Annualized number of inpatient admissions | We counted all inpatient admissions, including medical admissions, chemical dependency, and mental health admissions. We incorporated chemical dependency admissions at hospitals, residential substance abuse facilities, and comprehensive inpatient rehabilitation facilities. |
| Annualized number of inpatient psychiatric admissions | We counted all inpatient admissions for psychiatric or chemical dependency reasons at hospitals, residential substance abuse facilities, and comprehensive inpatient rehabilitation facilities. |
| Readmission based on any admission (whether readmitted for any reason following any inpatient admission) | Every admission is considered to be an index admission. Every readmission is also an index admission. Every index admission is assigned at most 1 readmission. |
| NOTES: Number of ER visits, number of inpatient admissions, and number of inpatient psychiatric admissions were annualized, that is, for the few members who were enrolled a portion of the 12 month study period, the continuous outcomes were multiplied by 12 divided by the number of months enrolled. | |
2. Analyses
Before engaging in the analysis of impacts of enhanced care Option b over routine care Option a for each intervention component, we ran a test similar to a Heckman-Hotz test and graphed regression-adjusted mean outcomes for each life coach. In the results section, we show a brief descriptive analysis, including: (1) proportion of members who were randomly assigned to each component option; (2) demographic characteristics of members enrolled in the study; and (3) use of hospital, psychiatric hospital, and ER services of enrolled members at baseline and at follow-up periods. For all statistical tests, we used a 5 percent level of significance; however, we also flag estimates that are statistically significant at the 10 percent level.
Heckman-Hotz Test. To assess whether the randomization was successful in ensuring the similarity of life coaches at baseline, we ran a test similar to the Heckman-Hotz test in which we used regression analysis to assess whether outcomes (inpatient admissions and ER visits) measured one year before the study differed for those later assigned to routine care or to the enhanced care intervention option for each intervention component studied. As the intervention had not yet begun during that period, there should be no meaningful difference between the a and b groups in outcomes measured before the study. The regressions adjusted for all available member-level characteristics, including demographics (age, gender, race, rural or urban residence), chronic conditions, and mental conditions, as well as for outcomes measured two years before the study, from July 1, 2009, until June 30, 2010.
Homogeneity Test. Homogeneity is particularly important for efficient orthogonal designs because these designs often include relatively few observations (that is, life coaches), so the results are particularly susceptible to outliers. Orthogonal designs assume that the implementers have relatively homogenous outcomes before the study; therefore, we assessed the similarity in outcomes for each life coach by computing regression-adjusted mean outcomes for each life coach. The outcomes were measured during the second year of the baseline period, from July 1, 2010, through June 30, 2011. Because the effects of differences among life coaches in outcomes might be due to differences between their members, we use regression to adjust for all available member-level characteristics, including demographics (age, gender, race, rural or urban residence), chronic conditions, and mental conditions. Member-level observations were weighted by the inverse of the number of months enrolled in the plan.
Regression Analysis. To test whether routine care (Option a) or enhanced care (Option b) of each component reduced the use of hospital and ER services, we used the follow-up data to compare the mean outcome over all members for life coaches that provided Option a to the mean for members of those who provided Option b. In doing so, we used regression analysis with member-level data to achieve greater precision in estimates of intervention component effects and to control for any pre-intervention differences in member and life coach characteristics. The regressions produced robust Huber-White standard errors, which are robust to heteroskedasticity. We did not adjust for clustering because the estimated standard errors were more conservative without the adjustment. Member-level observations were weighted by the inverse of the number of months enrolled in the plan, which means that more weight was given to observations for members who were enrolled in the plan longer and thus had a greater exposure to the studied intervention components.
D. Implementation Analysis Methods
To improve understanding of the impact analysis results, it is important to document how the components were implemented and to evaluate fidelity to the planned intervention. Discussions with participating care management staff were held in July through November 2012 (between a few weeks and four months after the intervention period ended, but before the analysis results were produced), to help explain why certain components were effective and others were not and to identify facilitators and barriers to implementation of any component options that were not implemented as planned. This is particularly important because a finding that routine care (Option a) and enhanced care (Option b) were equally effective for a component might lead us to conclude that the more expensive of the two options did not have the potential to improve outcomes. However, if Option b was not actually implemented fully, or as fully as Option a, such an inference may be incorrect. We know only that as implemented, Option b was no more effective.
1. Analysis of Tracking Tool Data
Care management staff used a paper tracking tool to help assess the fidelity to assigned intervention components. Care management completed the tracking tool form after each contact with the members and recorded which components were provided. The tracking tool contained "bubbles," much like Scantron-style forms, that care management staff filled out to identify the component option provided during each encounter with the member. Plan staff transmitted de-identified data to Mathematica.
We analyzed the frequency with which intervention components were delivered and the fidelity to assignments by examining the following three measures: (1) proportion of members who received the assigned option at least once; (2) annualized number of times each intervention component or option was provided per member; and (3) proportion of members who received the option at least as often as assigned. In Table III.2, we provide the details for construction of each of these measures. We also examined the percentage of members who refused a given component or option at least once. We analyzed the means for these three measures for the entire sample of members.
| TABLE III.2. Construction of Frequency and Fidelity Implementation Measures | |||
| Measure Description | Construction Details | Computed for the Following Components or Options | Analysis Displayed in: |
| Percentage of members who received a component or option at least once | Number of members who received a component or option at least once divided by the number of members in the study | For all components | Table V.1 |
| Annualized number of times assigned option was provided per member | Number of times option provided (annualized) divided by the number of members assigned to receive that option | For all components; measure is the most meaningful for components where frequency differs between Option a and Option b | Table V.2 |
| Percentage of members who received each option at least as many times as assigned | Percentage of times option provided to those assigned to that option divided by the number of members assigned to receive the option | For Components 1, 3, 7, 8, 9, 10, and 11 (cannot be computed for options for which there is no assigned frequency or because a and b do not differ in frequency) | Table V.3 |
2. Discussions with Care Management Staff
Following the final day of implementation of the study, we conducted discussions with Brand New Day care management staff and plan leaders in order to understand how the intervention components were implemented and which facilitators and barriers they faced. The secondary objective was to improve our understanding about how care management is usually delivered, apart from the study intervention components.
Although conversations were informal, we used a set of discussion questions to guide our discussions with the plan staff. In advance of discussions, we presented the staff at the plans with the list of questions.
We solicited staff input on challenges to implementing specific intervention components and staff feedback on how intervention components may be used in the future. We asked how intervention components could be improved, what challenges were posed by each component, and what leaders thought about adopting study components in the future. We asked about challenges to implementing the study in general. In terms of the study's effect on care management staff workloads, we asked whether organizational changes affected implementation and solicited their thoughts on future participation in similar studies. Finally, we asked about standard practices at each plan and how they differed from study components. We inquired whether standard practices changed during the study and how the organization alters care management activities based on member risk levels. To fill our gaps in understanding how care management is delivered, we inquired about which services are provided and how and inquired about the roles and responsibilities of care management staff.
IV. STUDY FINDINGS
A. Quantitative Impact Analysis Findings
1. Descriptive Statistics
We identified 1,422 eligible Brand New Day SNP members as the study population at the time the study commenced on July 1, 2011. The 1,422 members enrolled in the study were already being served by 28 life coaches, six clinical directors, six field nurses, and several PCPs and psychiatrists. The population as a whole was mostly composed of middle-age adults, more men than women, and was largely Caucasian; further, members primarily lived in urban areas. Use of hospital, psychiatric hospital, and ER services was high at both baseline and follow-up, but in line with the needs of this high-risk population.
As shown in Table IV.1, nearly 55 percent of the study population was between the ages of 45 and 64, and nearly 60 percent was male. Approximately 68 percent identified as Caucasian and 14 percent as African American. Many members--slightly more than 11 percent--associated with Hispanic ethnicity. Members were concentrated in urban areas (82 percent). Seventy-eight percent of members were enrolled in the plan for the entire baseline year whereas more recent enrollees were more likely to have been enrolled for between six and 11 months (14 percent) rather than for five or fewer months (8 percent) at the time the study began. Because Brand New Day serves a population with SPMI, it is not surprising that the study population had a high incidence of mental health conditions, especially schizophrenia and other psychotic disorders (76 percent), bipolar disorder (54 percent), depressive disorders (40 percent), and anxiety disorders (23 percent). Over 42 percent of members used tobacco products. Furthermore, the population had a high incidence of chronic health conditions, including chronic obstructive pulmonary disease (COPD) (25 percent) and diabetes (21.5 percent).
During the year before the study (baseline), 23 percent of members experienced an inpatient admission, 37 percent had an ER visit during the year, and 6 percent experienced a readmission within 30 days of hospital discharge for any reason (Table IV.2). Very few members (approximately 2 percent) experienced a readmission following an admission for medical reasons. These readmission rates are markedly lower than the Medicare fee-for-service average of 20 percent. At both baseline and follow-up, Brand New Day members experienced slightly over one ER visit per member per year, substantially higher than the average for all Medicare beneficiaries in fee-for-service nationally. The proportion of readmitted members was largely unchanged between baseline and follow-up for readmissions following both medical and all-type discharges. These outcomes were slightly more prevalent during the follow-up year than during the baseline period.
| TABLE IV.1. Demographic Characteristics of Study Participants (percentages) | |
| Variable Label | Mean |
| Age | |
| Under 35 | 17.8 |
| 35-44 | 21.5 |
| 45-54 | 37.6 |
| 55-64 | 17.2 |
| Over 65 | 5.9 |
| Gender | |
| Male | 59.9 |
| Female | 40.1 |
| Race/Ethnicity | |
| Caucasian | 67.9 |
| African American | 14.0 |
| Hispanic | 11.3 |
| Asian | 4.4 |
| Other or missing | 2.3 |
| Member Location | |
| Urban | 81.7 |
| Rural | 9.1 |
| Suburban | 6.7 |
| Missing | 2.5 |
| Chronic Conditions | |
| COPD | 25.3 |
| Diabetes | 21.5 |
| Rheumatoid or osteo-arthritis | 11.9 |
| Chronic kidney disease | 6.6 |
| Heart failure | 5.1 |
| Glaucoma | 4.4 |
| Cataracts | 2.9 |
| Alzheimer's and related conditions | 1.6 |
| Osteoporosis | 1.6 |
| Stroke | 1.3 |
| Other | 0.6 |
| Mental Conditions | |
| Schizophrenia and other psychotic disorders | 76.2 |
| Bipolar disorder | 53.8 |
| Depressive disorders | 39.7 |
| Anxiety disorders | 23.2 |
| Personality disorders | 3.9 |
| Post-traumatic stress disorder | 3.4 |
| Conduct disorders and hyperkinetic syndrome | 2.0 |
| Tobacco Use | 42.3 |
| Number of Months Enrolled in Plan During Baseline Year | |
| 5 months or fewer | 8.3 |
| Between 6 and 11 months | 13.7 |
| Entire baseline year | 78.0 |
| Number of Members Enrolled in Study | 1,422 |
The proportion of all members assigned to receive the enhanced care option was generally close to 50 percent for each option. In Appendix A, Table A.2, we provide the complete distribution.
| TABLE IV.2. Use of Inpatient and ER Services at Baseline and Follow-Up(means) | ||
| Outcomes | Mean (baseline) | Mean (follow-up) |
| Outcomes at Baseline (1 year before study) | ||
| Proportion of members with an inpatient admission | 0.23 | 0.24 |
| Number of inpatient admissions | 0.43 | 0.48 |
| Proportion of members with an inpatient psychiatric admission | 0.12 | 0.13 |
| Number of inpatient psychiatric admissions | 0.20 | 0.24 |
| Proportion of members with an ER visit | 0.37 | 0.40 |
| Number of ER visits | 1.02 | 1.15 |
| Proportion of members with a 30-day medical readmission | 0.02 | 0.02 |
| Proportion of members with a 30-day all-type readmission | 0.06 | 0.07 |
| Number of Members Enrolled in the Study | 1,422 | |
2. Homogeneity of Life Coaches
Because orthogonal designs assume that implementers have relatively homogeneous outcomes before the study, we assessed the similarity in outcomes among life coaches by computing regression-adjusted mean outcomes for each life coach. We graphically show the mean outcomes for each life coach in Figures IV.1 through IV.4 for the number of inpatient admissions, psychiatric inpatient admissions, ER visits, and proportion of members with readmissions following any admission.
| FIGURE IV.1. Number of Inpatient Admissions per Member per Year by Life Coach One Year Before the Study, Adjusted for Member Risk |
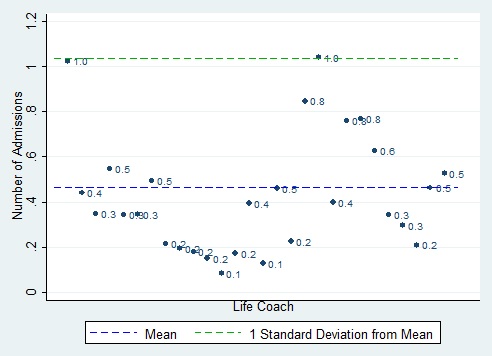 |
At baseline, the members had an average of 0.43 inpatient admissions, marked with a blue-dotted line in Figure IV.1. One standard deviation from the mean is marked with a green-dotted line. Overall, there were only two life coaches with inpatient admission means that differed by one standard deviation or more from the overall mean. However, the variation was quite large, ranging from 0.1 admissions per member per year, to 1.0 admissions per member per year.
| FIGURE IV.2. Number of Inpatient Psychiatric Admissions per Member per Year by Life Coach One Year Before the Study, Adjusted for Member Risk |
 |
| FIGURE IV.3. Number of ER Visits per Member per Year by Life Coach One Year Before the Study, Adjusted for Member Risk |
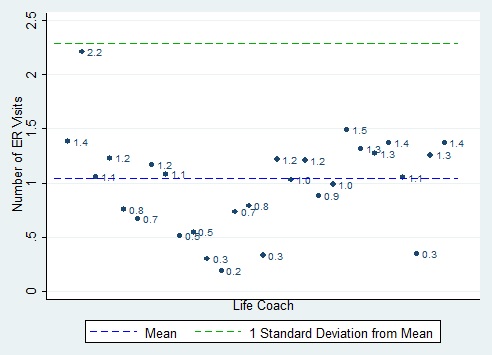 |
We observed a similar pattern for the number of inpatient psychiatric admissions (Figure IV.2), where two outliers lie above one standard deviation from the mean, with 0.8 and 0.9 psychiatric admissions. We observed one outlier for the number of ER visits (Figure IV.3) and proportion of members readmitted for any reason (Figure IV.4). To account for the sizable differences in baseline outcomes across life coaches, the regression analyses in which we analyzed the relative effectiveness of enhanced care and routine care options controlled for life coach-level average outcomes at baseline.
| FIGURE IV.4. Proportion of Members Readmitted for Any Reason per Year by Life Coach One Year Before the Study, Adjusted for Member Risk |
 |
These graphs show that variation in outcomes across care managers was large. Although the number of life coaches participating in the study (28) exceeds the number used in some studies in other fields, it did not provide sufficient power for this study, due to the large variation in outcomes across life coaches. Without adequate power, statistically insignificant differences in outcomes between enhanced and routine versions cannot be taken as valid evidence that the routine (a typically less expensive) version of the intervention is just as effective as the enhanced version.
3. Heckman-Hotz Test Results
We ran a test similar to the Heckman-Hotz test in which we assessed whether outcomes measured one year before the study (between July 1, 2009, and June 30, 2011) differed between members assigned to routine and enhanced care options for each studied intervention component. Given that the intervention had not yet begun during that period, there should be no meaningful difference in outcomes between the routine and enhanced care groups. Indeed, we observed no statistically significant baseline differences in outcomes between those whose life coaches were assigned to routine versus enhanced care during the study period, for any component or outcome. Detailed regression results are shown in Appendix B, Table B.1.
4. Regression Analysis Results Assessed Over the Full Year of Follow-Up: Summary
We found few statistically significant differences in outcomes between routine and enhanced care options. In Table IV.3, we show the predicted means at follow-up obtained from a regression analysis in which outcomes were analyzed as a function of the intervention components, controlling for member characteristics. We consider as evidence of effects only those results that are statistically significant at the 0.05 level, given the number of tests we are conducting, but also flag results that meet the 10 percent level of significance, as suggestive of possible effects. In Appendix B, Table B.2, we present detailed regression analysis results.
| TABLE IV.3. Average Outcomes at 12-Month Follow-up for Members Assigned to Enhanced or Routine Care(predicted means) | ||||
| Components and Outcomes | Enhanced Care (Option b) | Routine Care (Option a) | Difference (Option b- Option a) | p-Value (from regression) |
| More Frequent Depression Screening with an Instrument (Component 3) | ||||
| Any 30-day all-type readmission | 0.364 | 0.217 | 0.147** | 0.024 |
| Number of hospitalized members assigned to each option | 154 | 166 | ||
| Number of ER visits | 0.918 | 1.388 | -0.470** | 0.023 |
| Number of members assigned to each option | 709 | 713 | ||
| DM Topics Reinforced by Life Coaches During Routine Contacts (Component 5) | ||||
| Any 30-day all-type readmission | 0.214 | 0.350 | -0.136** | 0.022 |
| Number of hospitalized members assigned to each option | 147 | 173 | ||
| Involvement of Field Nurse in Management of Complex Cases (Component 6) | ||||
| Any 30-day all-type readmission | 0.322 | 0.238 | 0.084* | 0.152 |
| Number of hospitalized members assigned to each option | 190 | 130 | ||
| Number of all-type admissions | 0.530 | 0.419 | 0.111* | 0.084 |
| Number of members assigned to each option | 793 | 629 | ||
| Full Medication Review by PCP (Component 7) | ||||
| Number of psychiatric admissions | 0.277 | 0.193 | 0.084* | 0.097 |
| Number of ER visits | 1.002 | 1.342 | -0.340* | 0.063 |
| Number of members assigned to each option | 788 | 634 | ||
| Field Nurse Always Follows up After Medical Discharges (Component 9) | ||||
| Any 30-day all-type readmission | 0.367 | 0.223 | 0.145** | 0.024 |
| Number of hospitalized members assigned to each option | 145 | 175 | ||
| Number of psychiatric admissions | 0.196 | 0.285 | -0.090* | 0.068 |
| Number of members assigned to each option | 722 | 700 | ||
| NOTES: The table shows only those components for which one of the two options produced significantly different outcomes at the 10% level. P-values for the difference between routine and enhanced care are calculated as part of the regression analysis. See Appendix B, Table B.2 for the complete regression analysis results. * Significantly different from zero at the 10% level.** Significantly different from zero at the 5% level. *** Significantly different from zero at the 1% level. | ||||
The results presented in this section refer to the effectiveness of options as assigned; in other words, these results do not take into account that some options were not always provided as assigned. In Section V.A, we analyze the fidelity to intervention components by using tracking tool data and discuss implementation in light of the feedback received from care management staff. In Section VI, we briefly outline the impact analysis findings and interpret them based on the results of tracking tool analyses and findings from our conversations with care management staff.
We found a statistically significant difference at the 5 percent level in outcomes between the routine care and enhanced care options for two components over the full year of follow-up. We found fewer ER visits on average for members who were assigned to receive more frequent depression screenings with an instrument than the existing standard. The likelihood of 30-day readmissions was lower for hospitalized members assigned to receive reinforcement of disease management (DM) topics by life coaches. Sensitivity analysis showed that results did not change materially if any single life coach assigned to provide intervention components was dropped from the analysis. (Results not shown.) Below, we discuss the findings by component in more detail.
5. Regression Analysis Results over the Full Year of Follow-Up for Each Component
For the following components, we found statistically significant differences in one or more outcomes between enhanced and routine care options, using a 5 percent significance level.
Depression Screening Tools and Depression Screening Strategy (Components 2 and 3). Members assigned to receive depression screenings every two months with an instrument had fewer ER visits on average than those assigned to screenings without an instrument and without a minimum required frequency. During the follow-up year, members whose clinical directors conducted more frequent screenings with an instrument had an average of 0.92 ER visits, whereas those assigned to routine care experienced 1.39 visits, nearly a 41 percent difference (p=0.02). The findings suggest that by instituting more frequent screenings for depression using a proven instrument, the plan could reduce ER visits substantially. In contrast to this favorable finding, however, members assigned to frequent screenings with an instrument were 15 percentage points more likely to be readmitted to a hospital within 30 days of discharge than members assigned to less frequent screening.
DM Topics Addressed by Life Coaches During Routine Contacts (Component 5). Members whose life coaches were assigned to reinforce DM topics during routine contacts had a lower likelihood of readmission within 30 days of discharge. Approximately 21.4 percent of members assigned to discuss DM topics during routine contacts (versus approximately 35 percent of members assigned to routine care) were readmitted within 30 days of discharge (p=0.02). This finding suggests that the plan could reduce substantially (by nearly 40 percent) the proportion of discharges with a short-term readmission by requiring life coaches to address DM during regular contacts. Receiving DM education from life coaches during routine contacts was no better than routine care in terms of all-type and psychiatric inpatient admissions and the number of ER visits.
Field Nurse Always Follows Up After Medical Discharges (Component 9). Contrary to expectations, a follow-up by a field nurse after medical discharge was associated with a much higher rate of all-type readmissions (p=0.02). However, because field nurses had very limited involvement in the study, and the number of patients with medical discharges qualifying them for this analysis was small, this finding is likely to be an anomaly.
The other nine intervention components were not associated with statistically significant differences in any of the four outcomes, at the 5 percent significance level. Thus, our results suggest that either none of the following enhanced components influenced outcomes, or if they did, the effects were too small to be detected:
-
Staff use simpler depression screening instrument than routinely used.
-
Clinical director conducts depression screening every two months instead of every four months.
-
Life coaches use teachback method while educating members instead of just own judgment.
-
Life coaches reinforce DM topics covered in group classes vs. no reinforcement.
-
Staff involve field nurse in management of complex cases always instead of "as-needed".
-
PCP performs a detailed medication review every four months instead of no PCP involvement.
-
Clinical director follows up twice after psychiatric discharges instead of life coach follow-up.
-
Clinical director follows up after ER visit vs. follow-up by other staff.
-
Life coaches provide brownbag medication review vs. no routine medication review.
6. Regression Analysis Results at First and Second Six-Month Follow-Up
Our estimates of the effect of components on all members over the first and the second six-months of the follow-up year suggested that in one case, the enhanced options may have influenced outcomes early on but then dissipated. (Detailed results not shown.) At the first six-month follow-up, members assigned to depression screenings every two months with an instrument had many fewer ER visits on average than those assigned to routine care, a highly statistically significant finding. There was no such effect at the second sixmonth follow-up. Similarly, at the first (but not the second) six-month follow-up, members assigned to receive a full medication review every four months by their PCP had fewer ER visits than those assigned to receive medication reviews per routine practice. For the full year follow-up period, this relationship was statistically significant only at the 10 percent level. On the other hand, we found that follow-up by a field nurse after any medical discharge was associated with fewer psychiatric admissions only for the 7-12 month interval during the follow-up period. Again, we saw this effect for the sample as a whole, but it was significant only at the 10 percent level.
V. IMPLEMENTATION ANALYSIS
A. Fidelity Analysis Using Tracking Tool Data
To assess whether the assigned components were implemented as planned, we analyzed fidelity to interventions quantitatively by using tracking tool information and conducting qualitative discussions with plan staff. The analysis focused on identifying discrepancies between what was assigned and what was actually provided, for both routine and enhanced care.
We analyzed the fidelity to assignments by using: (1) the percentage of members who received the assigned option at least once (Table V.1); (2) the annualized number of times each option was provided per member per year (Table V.2); and (3) the percentage of members who received a given option at least as often as assigned (Table V.3). We also computed the percentage of members who refused a given component or option at least once (Table V.1). We tracked refusals only for depression screening, reinforcement of DM topics, post-discharge followup, and brownbag medication reviews. We discuss results in detail for the one-year followup. Because care management staff recorded provision of few components after month six, we discuss that separately at the end of this section.
Following the final day of implementation, we conducted discussions with care management staff and plan leaders, with the goal of understanding how the components were implemented and identifying the facilitators and barriers to implementation experienced by the staff. We reached four life coaches and four clinical directors. Although we reached few life coaches, clinical directors relayed life coaches' feedback and provided their own perspectives.
1. Frequency-of-Routine Contacts (Component 1)
Analysis of Tracking Tool Data. Patients whose care manager was assigned to deliver enhanced (more frequent) contacts were more likely to receive at least one contact during the year than were those assigned to routine contacts. Care management staff contacted 63.5 percent of members assigned to routine care (fewer required contacts) and 72.6 percent of members assigned to enhanced care (more required contacts) (Table V.1). However, the finding that many (one-third to one-quarter) of the patients were never contacted during the year is disturbing. On average, staff contacted moderate-risk and high-risk members far less often than specified in the study protocol and low-risk members more often than required, suggesting care managers did not know patients' risk status, or did not adhere to the differential guidelines for the risk groups, regardless of whether they were assigned to the enhanced or routine option. Members of all risk levels assigned to enhanced care received more contacts per member per year than those assigned to routine care; however, the difference was not as large as specified in the study protocol. Even though enhanced care did not require a higher minimum number of contacts than routine care specified for high-risk members, staff contacted high-risk members in the enhanced care group substantially more often than those in the routine care group, 11.7 versus 7.4 times per member per year (Table V.2). Again, however, the number of contacts was far less than specified--approximately 9.7 percent of members assigned to routine care were contacted at least as often as assigned, compared to 11.6 percent of those assigned to enhanced care (Table V.3).
Summary of Conversations with Plan Staff. Life coaches and plan leaders believed that more frequent contacts were useful; however, life coaches experienced some difficulties in making frequent contacts because of already high caseloads. Two clinical directors reported that some members (especially those with paranoia) questioned why they were contacted so frequently. According to one clinical director, additional contacts with moderate-risk members prompted life coaches to learn more about these members and subsequently identify some as high-risk.
2. Depression Screening Frequency and Instrument (Components 2 and 3)
Analysis of Tracking Tool Data. Care management staff assigned to conduct depression screening every other month screened over three times as many members as staff assigned to asneeded screening without an instrument (25.5 percent versus 7.9 percent, respectively) and conducted more screenings per member per year (0.59 versus 0.15, respectively) (Table V.1 and Table V.2). However, the number of screenings fell short of the assigned frequency. No members assigned to receive screenings with an instrument every other month were screened that often (Table V.3). Nearly twice as many members were screened with the Patient Health Questionnaire two-question instrument (PHQ-2) compared to the longer instrument (Zung), 19.7 percent versus 10 percent, respectively (Table V.1), suggesting that the shorter instrument does promote considerably greater use, even though the proportion screened was far less than 100 percent.
Summary of Conversations with Plan Staff. Clinical directors believed that depression screening was important. Several staff reported difficulties with screening because of members' discomfort with questions and hesitation if screening was performed over the telephone.3 Some staff assigned to enhanced care stated that twice monthly screening was too frequent.4 Clinical directors pointed to the need to engage life coaches in response to high caseloads. One clinical director did not feel comfortable with screening and did not screen her members. Care management staff had mixed opinions about the instruments. Several clinical directors felt that PHQ-2 was sufficient; one did not.
| TABLE V.1. Percentage of Members Assigned to an Option Who Received or Refused That Option at Least Once, Using Six Months of Data and One Year of Data(percentage) | ||
| Fidelity Measure | At First 6 months | At 1 Year |
| Frequency-of-Routine Contacts (Component 1) | ||
| Percentage of members assigned to routine care who were contacted | 60.6 | 63.5 |
| Percentage of members assigned to more frequent contact who were contacted | 72.0 | 72.6 |
| Use of Depression Screening Instruments (Component 2) | ||
| Percentage of members screened with Zung | 9.4 | 10.0 |
| Percentage of members screened with PHQ-2 | 17.3 | 19.7 |
| Depression Screening Frequency (Component 3) | ||
| Percentage of members screened (if assigned to as-needed screening) | 7.4 | 7.9 |
| Percentage of members screened (if assigned every other month with an instrument) | 24.7 | 25.5 |
| Percentage of members screened with a tool whose results were sent to their psychiatrist | 17.2 | 17.6 |
| Percentage of members who refused screening | 0.2 | 0.2 |
| Method Used for Member Education (Component 4) | ||
| Percentage of members for whom routine practice was used | 28.0 | 29.5 |
| Percentage of members for whom teachback method was used | 28.9 | 33.4 |
| Life Coaches Reinforce DM Education (Component 5) | ||
| Percentage of members who received DM education reinforcement under routine care | 0.0 | 0.0 |
| Percentage of members who received DM education reinforcement under enhanced care | 6.9 | 8.8 |
| Percentage of members who refused | 0.5 | 0.7 |
| Involvement of Field Nurse in Management of Complex Cases (Component 6) | ||
| Percentage of members assigned to routine care who received a field nurse visit | 0.0 | 0.0 |
| Percentage of members assigned to enhanced care who received a field nurse visit | 0.0 | 0.0 |
| Frequency of Medication Review (Component 7) | ||
| Percentage of members assigned to medication review from any care management team member who received 1 | 5.5 | 9.1 |
| Percentage of members assigned to medication review from PCP who received 1 | 4.9 | 5.0 |
| Percentage of members assigned to medication review from PCP who received review from any team member | 11.8 | 13.3 |
| Follow-Up After Psychiatric Discharge (Component 8) | ||
| Percentage of discharged members assigned to 1 follow-up who received at least 1 from any team member | 20.0 | 19.1 |
| Percentage of discharged members assigned to 2 follow-ups who received at least 1 from any team member | 14.0 | 15.2 |
| Percentage of discharged members who refused follow-up | 0.6 | 0.6 |
| Field Nurse Follows Up After Medical Discharge (Component 9) | ||
| Percentage of discharged members assigned to as-needed follow-up who received 1 | 0.0 | 0.0 |
| Percentage of discharged members assigned to mandatory follow-up who received 1 | 0.0 | 0.0 |
| Clinical Director Follows Up After ER Visit (Component 10) | ||
| Percentage of members with at least 1 ER visit who received follow-up without protocol | 1.1 | 0.8 |
| Percentage of members with at least 1 ER visit who received follow-up with protocol | 3.1 | 2.5 |
| Life Coaches Provide Brownbag Medication Review (Component 11) | ||
| Percentage of members with 4 or more prescriptions who were not assigned brownbag review and attended 1 | n.a. | 0.0 |
| Percentage of members with 4 or more prescriptions who were assigned brownbag review and attended 1 | 26.5 | 24.6 |
| Percentage of members with 4 or more prescriptions who refused brownbag review | 0.9 | 1.9 |
| NOTES: The table shows the proportion of members assigned to each option who received that option at least once. For each component, the first option is routine care, and the second is enhanced care.n.a. = not applicable; no members whose life coaches were assigned not to provide brownbag reviews had 4 or more medications in the first 6 months. | ||
3. Method Used for Member Education (Component 4)
Analysis of Tracking Tool Data. The proportion of members receiving the teachback method was slightly higher than the proportion receiving routine coaching methods, 33.4 percent versus 29.5 percent (Table V.1). However, the teachback method was used only 1.6 times per member per year compared to routine coaching methods, which were used 2.4 times per member per year (Table V.2).
Summary of Conversations with Plan Staff. Life coaches assigned to use the teachback method found that it worked well for most members. One life coach said that some members with personality disorders and intellectual disabilities became defensive when asked to repeat instructions. Two clinical directors reported that staff were using teachback with some members even before the study, especially with developmentally delayed members or those with psychoses.
4. Life Coaches Reinforce DM Education (Component 5)
Analysis of Tracking Tool Data. Approximately 8.8 percent of members assigned to receive reinforcement of DM topics during routine contacts actually received it (Table V.1). Plan staff reported that approximately 15 percent of members attended educational classes, which means that about half received one-on-one reinforcement of DM topics.
Summary of Conversations with Plan Staff. One clinical director reported that life coaches and members felt that life coaches addressing DM topics covered in groups was very helpful; members also responded positively. One clinical director said that life coaches were not trained to address members' medical issues and were uncomfortable discussing medical topics. It is possible that these staff did not receive the training other staff received from the head field nurse.
5. Involvement of Field Nurses in Management of Complex Cases (Component 6)
Analysis of Tracking Tool Data. No visits by field nurses were recorded for members assigned to either routine or enhanced care (Table V.1), although life coaches reported some, very limited, involvement of field nurses.
Summary of Conversations with Plan Staff. Although life coaches, clinical directors, and members believed that the involvement of field nurses in care for high-risk and moderate-risk members was helpful, they noted that it frequently took a long time to involve field nurses. Several staff noted that field nurses carried heavy caseloads and were therefore unable to respond quickly to requests for involvement. One clinical director assigned to enhanced care reported that she worked more closely with the field nurse because of the study.
| TABLE V.2. Number of Times an Option Was Provided to Members Assigned to That Option(per member per year or per member per six months) | ||
| Fidelity Measure | At First 6 months | At 1 Year |
| Frequency-of-Routine Contacts (Component 1) | ||
| Number of contacts (low-risk members assigned to 4 contacts per year) | 5.0 | 6.5 |
| Number of contacts (low-risk members assigned to 6 contacts per year) | 6.9 | 8.8 |
| Number of contacts (moderate-risk members assigned to 48 contacts per year) | 5.6 | 7.4 |
| Number of contacts (moderate-risk members assigned to 96 contacts per year) | 7.7 | 10.0 |
| Number of contacts (high-risk members assigned to a, 192 contacts per year) | 6.6 | 7.4 |
| Number of contacts (high-risk members assigned to b, 192 contacts per year) | 12.5 | 11.7 |
| Use of Depression Screening Instruments (Component 2) | ||
| Number of times member screened with Zung | 0.13 | 0.19 |
| Number of times member screened with PHQ-2 | 0.29 | 0.45 |
| Depression Screening Frequency and Use of Screening Tool (Component 3) | ||
| Number of times member screened (if assigned as-needed screening without tool) | 0.12 | 0.15 |
| Number of times member screened (if assigned 6 screenings per year with tool) | 0.41 | 0.59 |
| Number of times member screening results sent to member's psychiatrist | 0.20 | 0.22 |
| Method Used for Member Education (Component 4) | ||
| Number of times routine practice was used | 2.0 | 2.4 |
| Number of times teachback method was used | 1.1 | 1.6 |
| Life Coaches Reinforce DM Education (Component 5) | ||
| Number of times members received education | 0.12 | 0.17 |
| Involvement of Field Nurses in Management of Complex Cases (Component 6) | ||
| Number of times members assigned to routine care received field nurse visit | 0.00 | 0.00 |
| Number of times members assigned to enhanced care received field nurse visit | 0.00 | 0.00 |
| Frequency of Medication Review (Component 7) | ||
| Number of times members assigned to receive medication review from any care management team member received review | 0.08 | 0.14 |
| Number of times PCP performed medication review (for members assigned to 3 per year) | 0.11 | 0.11 |
| Number of times members assigned to receive medication review from PCP received review from any care management team member | 0.19 | 0.25 |
| Follow-Up After Psychiatric Discharge (Component 8) | ||
| Number of times any team member followed up if assigned to do so once | 0.29 | 0.28 |
| Number of times any team member followed up if assigned to do so twice | 0.48 | 0.58 |
| Field Nurse Follows Up After Medical Discharge (Component 9) | ||
| Number of times followed up if assigned to as-needed field nurse follow-up | 0.00 | 0.00 |
| Number of times followed up if assigned to mandatory field nurse follow-up | 0.00 | 0.00 |
| Clinical Director Follows Up After ER Visit (Component 10) | ||
| Number of times followed up with members with at least 1 ER visit (if assigned to follow-up without protocol and if received few notifications) | 0.01 | 0.01 |
| Number of times followed up with members with at least 1 ER visit (if assigned to follow-up with protocol and if received more notifications) | 0.04 | 0.03 |
| Life Coaches Provide Brownbag Medication Review (Component 11) | ||
| Number of times provided medication review (for those not assigned to receive 1) | n.a. | 0.00 |
| Number of times provided medication review (for those assigned to 4 per year) | 0.54 | 0.61 |
| NOTES: For each intervention component, the first option is routine care, and the second is enhanced care.n.a. = not applicable. | ||
6. Frequency of Medication Review (Component 7)
Analysis of Tracking Tool Data. Only 5 percent of members assigned to medication reviews by PCPs received a review compared to 9.1 percent of members assigned to receive reviews from any care management team member. However, 13.3 percent of members assigned to receive medication reviews from the PCP received a review from any member of the care management team (Table V.1). The number of reviews per member per year fell far short of the assigned frequency (Table V.2); only 2 percent of members received a medication review every four months (Table V.3).
Summary of Conversations with Plan Staff. Plan staff reported that PCPs did not want to participate in Component 7, except for those who were used to collaborating with the plan. One clinical director attributed PCPs' lack of participation to the lack of financial incentives.
| TABLE V.3. Percentage of Members Who Received Each Option at Least as Often as Assigned(mean) | ||
| Fidelity Measure | At First 6 months | At 1 Year |
| Frequency-of-Routine Contacts (Component 1) | ||
| Percentage of members assigned to routine care who were contacted at least as often as assigned | 13.6 | 9.7 |
| Percentage of members assigned to enhanced care who were contacted at least as often as assigned | 17.9 | 11.6 |
| Depression Screening Frequency (Component 3) | ||
| Percentage of members assigned to bimonthly screening who were screened at least that often | 0.0 | 0.0 |
| Frequency of Medication Review (Component 7) | ||
| Percentage of members who received PCP medication review at least every 4 months | 3.2 | 1.8 |
| Percentage of members who received medication review from any member of care management staff at least once every 4 months | 3.9 | 2.3 |
| Follow-Up After Psychiatric Discharge (Component 8) | ||
| Percentage of discharged members assigned to 1 follow-up who received at least 1 | 10.9 | 7.9 |
| Percentage of discharged members assigned to 2 follow-ups who received at least 2 | 2.0 | 2.5 |
| Field Nurse Follows-Up After Medical Discharge (Component 9) | ||
| Percentage of discharged members assigned to follow-up after every discharge who received at least 1 | 0.0 | 0.0 |
| Clinical Director Follows Up After ER Visit (Component 10) | ||
| Percentage of discharged members assigned to follow-up without protocol who received 1 | 0.0 | 0.0 |
| Percentage of discharged members assigned to follow-up with protocol who received 1 | 2.1 | 1.4 |
| Life Coaches Provide Brownbag Medication Review (Component 11) | ||
| Percentage of members with 4 or more prescriptions who received medication review at least 4 times per year | 3.9 | 2.1 |
| NOTES: For each intervention component, the first option is routine care, and the second is enhanced care. | ||
7. Follow-Up After Psychiatric Discharge (Component 8)
Analysis of Tracking Tool Data. Care management staff assigned to the enhanced component (two follow-up visits after discharge) were less likely to receive a follow-up visit (15.2 percent) than those assigned to routine care (one follow-up visit; 19.1 percent). Clinical directors assigned to provide two follow-ups did provided twice as many follow-ups as those assigned to one: 0.58 versus 0.28 follow-ups per member per discharge (Table V.2). Nearly 8 percent of members assigned to one follow-up received at least one; 2.5 percent of members assigned to receive at least two follow-ups received at least two (Table V.3).
Summary of Conversations with Plan Staff. One clinical director expressed the belief that members appreciated having someone check in with them after discharge although she noted that she was not always able to conduct a second follow-up. Another clinical director arranged for an appointment with a psychiatrist instead of conducting the second follow-up.
8. Field Nurse Follows Up After Medical Discharges (Component 9)
Analysis of Tracking Tool Data. Field nurses did not submit any tracking sheets to indicate that they provided follow-ups for members assigned either mandatory or as-needed follow-ups (Table V.1).
Summary of Conversations with Plan Staff. Clinical directors and members felt that field nurses' involvement would be very useful, and actually did occur some times, despite the lack of tracking sheet data to support that. One clinical director said that it sometimes took up to a week following discharge to process a request for involvement of a field nurse and that she would have preferred to have easier access to field nurses, for example, to be able to call field nurses directly.
9. Clinical Director Follows Up After ER Visit (Component 10)
Analysis of Tracking Tool Data. Mandatory notification about ER discharges increased the proportion of members who received a follow-up after an ER: 2.5 percent of members who had at least one ER visit received at least one follow-up, compared to 1 percent of members in the routine group who received at least one follow-up. Routine care involved outdated notifications and did not require follow-up (Table V.1). However, these were still small proportions; and even fewer members received a follow-up after every ER visit--1.4 percent of the enhanced care group and no members assigned to routine care (Table V.3).
Summary of Conversations with Plan Staff. Staff indicated that they were often unable to follow up with members because they were not always notified of ER visits, likely because the plan was usually unaware of ER visits. ERs only occasionally call the plan's Utilization Management (UM) department to notify the plan of an ER visit, often to ensure coverage of an ER visit. Given that these calls are made infrequently and only by some ERs, the information on ER visits is incomplete. In addition, it appeared that, even when data were available to the plan, care management staff were not always notified.
10. Brownbag Medication Review (Component 11)
Analysis of Tracking Tool Data. Approximately 24.6 percent of members assigned to receive a brownbag review attended one (Table V.1). These members received approximately 0.61 reviews per member per year, well below the assigned frequency of four reviews per member per year (Table V.2). Approximately 2.1 percent of members received at least four reviews per year (Table V.3).
Summary of Conversations with Plan Staff. Staff found brownbag reviews very useful.5 One clinical director described the reviews as an "eye opener" and gave an example of a member who "became a new man [after the medications were adjusted]." Another director received feedback from PCPs that, after the introduction of Component 11, members brought in their medications more often. Clinical directors believed that brownbag reviews should be integrated into the plan's regular care. Brownbag medication reviews presented some challenges in terms of scheduling6 and tailoring reviews to fit the needs of all members.7 One clinical director noted that brownbag reviews could be improved by providing care management staff with a printout of prescribed medications. Two staff members felt that brownbag reviews were beyond the scope of their duties and that clinical staff might be better qualified to conduct the reviews. They also found that they had to report on brownbag reviews orally because psychiatrists did not want extra paperwork.
11. Fidelity Analysis Results at Six-Month Follow-Up Differ from Results at One-Year Follow-Up
In Table V.1, Table V.2, and Table V.3, we show that the plans delivered most intervention components in the first six months of the study. For example, care management staff contacted 72 percent of members in the first six months of the study and only 0.6 percent more in the following six months, for a total of 72.6 percent per year. However, several interventions continued during months 7-12; for example, the plan provided medication reviews (Component 7) to nearly twice as many members in the latter period (9.1 percent versus 5.5 percent of members) (Table V.1).
B. Implementation Analysis: Care Managers' Feedback on Implementation Challenges
Clinical directors and life coaches also provided feedback on study implementation. We asked about implementation challenges in general, such as the effect of the study on workloads and the influence of organizational changes on study implementation.
1. Lessons Learned
Care management staff reported several important lessons from the study implementation: (1) they support efforts to integrate medical and psychiatric care; (2) they want greater field nurse involvement; and (3) they want the plan to test new interventions.
Life coaches and clinical directors believed that efforts for better integrating medical and psychiatric care were very helpful to members, and want to see more of such efforts in the future. However, staff reported that life coaches did not always feel comfortable addressing members' medical health issues, which indicates a need for additional training or involvement of other medical staff.
Life coaches and clinical directors reported that they want to involve more field nurses and want easier access to field nurses. Life coaches and clinical directors appreciated field nurse involvement in the medical care of members and believed that integration of medical and psychiatric care was useful. However, they reported that too few field nurses were available and that it often took a long time to involve them. One clinical director stated that easier access to field nurse services, such as the ability to call field nurses directly, would improve care.
It would be useful to test the provision of new components rather than versions of routinely provided services. One life coach stated that some enhanced care options were similar to regular care and merely increased the staff's workload.
2. Feedback About Study Implementation
Care management staff stated that organizational changes, limited staff resources, and upper management's lack of awareness of study details posed barriers to implementation. One plan leader noted higher-than-expected human resource costs associated with study implementation, especially with the collection of paper-based tracking sheets.
Organizational changes impeded study implementation. One life coach noted that organizational changes in fall and winter (changes in leadership, contracting out medical care, staff changes, and geographic reorganization) adversely affected implementation. It is possible that, as a result of such changes, the study was somewhat neglected during that time. One clinical director reported that a part of her assigned region changed approximately 8-9 months after the outset of the study. One clinical director experienced difficulty in training new staff because they were simultaneously taking on cases and learning study components.
Limited staff resources posed a barrier to implementation. Two clinical directors with large caseloads and a small number of support staff were unable to implement fully all of the enhanced care components. One director pointed out that one field nurse is assigned a caseload of several hundred members. One clinical director stated that a seasoned life coach was randomly assigned to implement routine care options only, whereas a junior life coach was randomly assigned to the enhanced option for all components and may have been overwhelmed by the additional workload.
Upper management was supportive but should have been better informed and more closely involved in the study. One clinical director stated that implementation would have been easier if plan leaders participated in study training and had a better understanding of studied components. Clinical directors reported that they needed more support early in the study. However, two clinical directors indicated that upper management was highly supportive of the study.
A comprehensive list of members participating in the study would make it easier to track study responsibilities. One clinical director stated that a single comprehensive list of all members included in the study would have made it easier to track which component options should be provided to members.
VI. DISCUSSION AND CONCLUSIONS
A. Interpretation of Impact Analysis Findings
1. Results Showing Significant Differences in Outcomes
Over the full year of follow-up, more frequent depression screening with an instrument (enhanced care) was associated with 41 percent fewer ER visits (p=0.02) compared with as-needed screening without an instrument. Although the number of screenings per member per year was low, staff screened over three times as many members assigned to enhanced care (25.5 percent versus 7.9 percent) and conducted more screenings per member per year (0.59 versus 0.15). Further, the effect of more frequent depression screening was driven by the effect on outcomes in the first six months of the study, a finding that is not surprising because fidelity analysis showed that most screenings were performed in the first six months of the study. Although clinical directors believed depression screening was important, staff experienced difficulties with screening, indicating that training in depression screening may be needed. It is also important to note, however, that members assigned to frequent screenings with an instrument were significantly more likely to have a readmission within 30 days after a hospital discharge than members assigned to less frequent screening. This finding is difficult to explain, although it could indicate be due to the screening identifying a need for a readmission. It is more likely that this is a statistical anomaly due in part to small sample size--only about 150 patients in each group (enhanced and routine care) had a hospital discharge and therefore were at risk of a readmission.
Over the full year of follow-up, reinforcement of DM education during regular contacts was associated with a 49.6 percent lower likelihood of readmission (p=0.01) among previously hospitalized members compared with no reinforcement. Fidelity analysis and conversations with plan staff indicated that about half of members assigned to receive one-on-one education in fact received it. The one-on-one education component earned high praise, although some staff felt uncomfortable addressing medical topics, indicating the possible need for additional training; alternatively, the plan should consider hiring medical staff for one-on-one education. DM education delivered by life coaches during routine contacts was no better than routine care for all members in terms of medical and psychiatric admissions and the number of ER visits.
Assignment to follow-up by a field nurse after medical discharge was associated with a 15 percentage point higher likelihood of having a 30-day readmission (p=0.02) compared to routine care (p=0.02). However, because field nurses had very limited involvement in the study--none reported providing such a follow-up--this difference is almost certainly a chance difference, obtained on the small number of patients experiencing a medical discharge.
Results for outcomes measured over the 1-6 and 7-12 month periods were generally similar to those for the full period, suggesting that most of the enhanced options neither influenced outcomes early on but then dissipated, nor that they took several months to take effect. The exceptions are listed below.
A full medication review by the PCP was associated with fewer ER visits among all members at the first (but not the second) six-month follow-up. Although few members received a medication review, more members in the enhanced care group received one compared to the routine care group, 13.3 percent versus 9.1 percent. Plan staff reported that the reason for few reviews was that PCPs most often did not want to participate. In addition, the fidelity analysis shows that plan staff compensated and provided some medication reviews on their own; only 5 percent of members received one from the PCP and 13.3 percent from any member of the care management staff.
Follow-up by a field nurse after any medical discharge was associated with fewer psychiatric admissions at the second six-month follow-up. We saw this relationship for the sample as a whole, but it was significant only at the 10 percent level. However, conversations with plan staff indicated that there was very limited involvement of field nurses (field nurses did not submit any tracking sheets, so the number of patients who actually received such a visit is unknown, but certainly small). This finding, therefore, is almost certainly a statistical fluke rather than an effect of the enhanced component. Conversations with plan staff indicate that field nurses' services are much-needed and that the plan should hire more field nurses.
2. Results Showing No Significant Differences in Outcomes
Over the full year follow-up, we found no statistically significant difference in any outcomes between enhanced care and routine care for the following tested options: greater frequency-of-routine contacts (component #1), use of a simpler depression screening instrument (#2), use of the teachback method while educating and coaching members (#4), mandatory involvement of field nurses in management of complex cases (#6), follow-up twice versus once performed by clinical director after psychiatric discharge (#7), full medication review by the PCP (#8), follow-up after an ER visit performed by clinical director (#10), and brownbag medication review performed by a life coach (#11). We observed no difference in the number of inpatient admissions between routine and enhanced care options for any implemented component.
Although it may seem disheartening that many enhanced care options did not affect the outcomes of interest, a finding of no difference is meaningful because it can guide improvements in program efficiency. If intervention components were implemented as intended, a finding of no difference in outcomes for members who received routine and enhanced care indicates that the more intensive alternative did not improve outcomes over the less intensive option--at least not by enough to be detectable with the number of care managers and patients involved in the study. Such a finding suggests that it may not be not worth the extra cost of adopting the more expensive option. However, a finding of no difference in outcomes between routine and enhanced care options might have also been attributable to any one of the following reasons.
-
The enhanced care option may not have been specified in a way that distinguished it markedly from routine care. However, this does not appear to have been a problem for this study.
-
The enhanced care option may not have been implemented in a manner that distinguished it sufficiently from the routine care option because it was not implemented consistently or fully. Similarly, the routine care option may have been delivered more intensively. As fidelity analysis showed, most interventions were not implemented consistently or anywhere close to fully. Below are some examples where it was likely that incomplete implementation was the likely reason for findings of no difference.
- Although members assigned to receive enhanced care received more contacts (Component 1) than those assigned to routine care, the number of contacts fell far short of the assigned frequency for those at medium or higher risk of adverse outcomes.
- Members assigned to teachback method as part of Component 4 received less coaching overall than members assigned to routine care. Although a similar proportion of members in enhanced versus routine care received coaching, routine coaching was provided more times per member.
- Because field nurses' involvement was very limited (Component 6), routine and enhanced care were essentially equivalent.
-
Effects of some components that apply to only a subset of members are even more difficult to detect than effects of components that apply to all members.
- For care transitions components (Components 8 and 9), only hospitalized members were eligible; therefore, the power to detect effects for these interventions is even lower. For the component requiring two follow-ups post psychiatric discharge, only 13 percent of members had a psychiatric stay. Given that this component was rarely implemented (only 20 percent of those eligible received the interventions), it is not surprising that no impacts of enhanced care were detected. Similarly, for Component 10 (follow-up after an ER visit), only members who visited the ER were eligible.
3. Despite No Significant Differences in Outcomes, Care Managers Viewed Several Enhanced Care Options as Useful or as Otherwise Showing Promise
Use of the simpler depression screening instrument was not associated with different (better or worse) utilization outcomes; however, those assigned to use the simpler instrument did screen more members. However, it is possible that PHQ-2 was not as sensitive in detecting depressive symptoms as the longer PHQ-9, as suggested by some staff. More importantly, a substantial fraction of members did not undergo any screening at all, regardless of which instrument was the required protocol.
Field nurses' involvement in management of complex cases (Component 6) was very limited due to their already existing high caseloads, it was therefore not associated with improved outcomes. However, conversations with plan staff indicated that field nurses' services are much-needed and that the plan should hire more field nurses.
Requiring a mandatory medication brownbag review for all members who take four or more medications did not improve these members' outcomes; however, staff felt that this component was very useful and should be integrated into routine care at the plan. The review helped staff identify various issues with members' medications. The highly positive feedback from plan staff is in marked contrast to the finding of no difference in outcomes. One reason for the finding of no difference might be due to the low power overall to detect impacts, unless they were quite large (38-64 percent of the mean for routine care). A second reason is that brownbag review was only provided to one-fourth of those who should have received it. A third reason may be that the component might need improvement in order to produce impacts; care managers suggested that the logistics of how the intervention is provided could be improved (for example, by making lists of members' medications available to life coaches) and that additional staff training is needed. It is possible that the brownbag review had an effect on intermediate outcomes such as fewer side effects and improved symptoms. In the absence of access to data on these intermediate outcomes, we were unable to discern quantitatively whether such effects occurred. However, conversations with care managers do suggest that conclusion.
B. Limitations
The main limitation of this study is the limited power to detect differences between the component options. With 28 life coaches participating in the study, true differences between routine and enhanced care options would have had to be quite large (38-64 percent of the mean outcome) for it to have been highly likely to observe statistically significant differences in our sample. The problem was exacerbated by the fact that a large proportion of the sample members never received some of the intervention components, or received only a partial "dose" relative to what was intended. Thus, for several components, enhanced care was not implemented in a manner that distinguished it markedly from routine care.
Of the many (110) comparisons conducted between enhanced and routine care (for three outcomes over three periods for each of the 11 components, and over one period for the fourth outcome), the small number of statistically significant differences (9) was slightly less than would be expected to occur by chance for tests at the 10 percent significance level. Furthermore, half of the statistically significant differences were in the expected direction and half in the opposite direction. A joint test of whether all enhanced versus routine care differences were zero could not be rejected, indicating that some and perhaps all of the observed differences were likely to be due to chance rather than to the interventions. This indicates that as a group, enhanced components did not have a different effect on measured outcomes than routine practices.
The findings from the implementation analysis of the tracking data may be flawed by incomplete reporting by the care management staff on their activities. Few components were recorded in tracking tool data as being provided in the second half of the study because: (1) staff did not record all of the services they provided for that period and some tracking data were lost, and (2) care management staff provided fewer study components during that time. It is unclear to what extent the low provision of services is due to either of these two reasons. In the last few months of the study, the plan incorporated the tracking tool as part of the electronic care management system, which made it easier for staff; however, not all staff had access to the system; further, multiple organizational changes caused the study (and the recording of provided services) to be somewhat neglected during that period, which most likely explains gaps in the tracking tool data. Furthermore, we learned from conversations with plan staff that some tracking tool data were lost as a consequence of changes to tracking systems. Paper tracking tool sheets were used from July 1, 2011, until approximately January 1, 2012, when care management staff started recording provision of components electronically. Transition to yet another electronic system took place in mid-April 2012.
For several components, the enhanced care option was not implemented in a manner that distinguished it sufficiently from the routine care option because it was not implemented consistently or fully or because routine care was more intensive as delivered compared to routine care guidelines. This is however, less a limitation than an important finding that can inform plans of important barriers that prevent staff from fully implementing planned interventions. The analyses in this report took an "intent-to-treat" approach in which component effects are computed by comparing outcomes of those assigned to the two options, regardless of whether or how thoroughly the options were actually delivered. The study did not include overzealous monitoring to make certain that the assigned interventions are implemented, because such oversight was not planned to be introduced into the ongoing programs at the two plans. Rather, standard supervisory measures continued to test the components in a "real-world" environment with the currently available resources, rather than in a strictly controlled setting.
C. Conclusions
In this study, we find no evidence that enhanced versions of several care management practices are not associated with markedly lower rates of hospitalization, hospital readmissions, or ER use. However, there were a few exceptions. Three enhanced care options were associated with lower rates of at least one of the studied outcomes: (1) more frequent depression screening by clinical director with an instrument; (2) reinforcement of DM education during routine contacts; and (3) full medication review by the PCP. More frequent depression screening with an instrument (enhanced care) was associated with fewer ER visits. Reinforcement of DM education during routine contacts was associated with a lower likelihood of readmission. Care managers liked both these components very much, although some staff felt uncomfortable addressing medical issues, indicating a possible need for additional training or using medical staff for these tasks. Care management staff performed many medication reviews to compensate for PCPs performing very few. Even though the brownbag medication review performed by life coaches did not improve outcomes, plan staff saw it as highly effective. A clinical director noted that brownbag review prompted some members to engage their PCPs.
The enhanced components may have led to better outcomes had they been implemented more faithfully; few members received the study components. For eight of 11 components, 25 percent or fewer members received the assigned component. Few components were recorded to have been provided in the second half of the study partly because organizational changes impeded study implementation and the submission of tracking tool information. However, few components were provided even in the first six months, the period in which we believe the data well captured the provided interventions. Feedback from care managers indicated that caseloads were too large to provide as many components as specified in the study protocol, and this applied to both routine and enhanced versions of the intervention components.
Care management staff reported several important lessons from the study implementation. Life coaches and clinical directors believed that efforts at better integrating medical and psychiatric care were very helpful to members; they want to see more such efforts in the future. Such feedback is in line with the effectiveness findings: two out of three components for which an enhanced care option improved outcomes addressed members' medical needs--reinforcement of DM education and medication review. Two components attempted to increase the engagement of field nurses; however, due to very high caseloads, field nurses' involvement in the study was very limited. Life coaches and clinical directors reported that they want the plan to hire more field nurses and that they need easier access to field nurses, indicating a need for additional integration of medical services.
Care management staff might need more training in depression screening and the teachback method. Some life coaches and other staff not licensed in mental health were uncomfortable with depression screening. Some staff experienced difficulty in using the teachback method with members with certain diagnoses (personality disorders and intellectual disabilities). This means that these components might need to be tailored to the unique needs of members with particular diagnoses. In addition, guidance on the minimum number of routine contacts should consider members with unique needs. For example, some members with paranoia were anxious when life coaches contacted them more often than usual.
D. Implications for Policy and Practice
When implementing an orthogonal design study, it is important to ensure adequate power to detect differences between tested options. In clustered designs (such as the one we used in this study) in which care managers are assigned to implement a given set of components for all their members, power depends predominantly on the number of care managers. Further, if given outcomes are analyzed for a subset of members (such as hospitalized members), the power to detect impacts is even lower.
Although it is important to analyze the fidelity to assigned alternatives in order to interpret the results of their effectiveness, it is also important not to enforce fidelity during the study unless enforcement is intended to be a part of the intervention on an ongoing basis (if interventions are incorporated into routine practices). One criticism of traditional randomized trials is that interventions are studied in highly controlled rather than in real-world settings. Effectiveness of an intervention should be studied in the way it would be implemented, should it be found to be successful. So, if care managers do not implement a given alternative during the study, it would not be likely to do so were it to become the assigned routine care. The fidelity and effectiveness results should be interpreted in light of feedback received from the implementers. It is possible that a given component was ineffective and implemented rarely simply because training was insufficient, as it might have been the case with the components that addressed members' medical needs. Uncovering the barriers to implementation is a key aspect to these studies.
An important benefit of an orthogonal design study, as we have seen from the reaction of the participating plan, might be the increased clarity about intended interventions that it provides. Rather than implementing a broad model of care with little explicit direction, care managers are told precisely how they are expected to implement each of the components of care management that are being tested. When routine care is not well defined or when the way routine care is implemented differs markedly across care managers, this structure of an experimental design study itself can help standardize the care management intervention, leading to less variation in implementation across managers. Further, fidelity analysis allows participating plans to identify areas of care management on which to focus their quality improvement efforts. The orthogonal design approach also encourages organizations to create a culture of learning by providing participants with a rigorous approach for testing out their new ideas.
However, the study also identifies some important difficulties with conducting orthogonal design studies in health care organizations. The types of variations in how care coordination is delivered studied here are likely to generate only moderate size effects on hospitalizations or ER use. To have adequate statistical power to detect such effects, a sizeable number of care manager units are needed, because the variance of these outcomes across care managers is large. Without adequate power, statistically insignificant differences in outcomes between enhanced and routine versions of a care component cannot be taken as valid evidence that the routine (and typically less expensive) version of the intervention is just as effective as the enhanced version. Although the number of care managers (28) participating in this study exceeds the number used in several other studies, it was not sufficient for this study, due to the large variation in the key outcomes across care managers.
The study also illustrates how hard it can be to change the behavior of even dedicated health professionals. For each of the components, both enhanced and routine care groups received the assigned intervention components far less often than specified in the study. Very few members received at least the minimum number of services, reflecting various barriers. Some of the barriers reported by care management staff include high caseloads, difficulty tracking which component options to provide to each member (only the life coaches provided the same intervention components to all of their patients), and multiple organizational changes. This qualitative investigation of barriers to implementation is just as important for improving care as is determining the effects of various enhancements.
REFERENCES
Au, M., S. Simon, A. Chen, E. Rich, S. Croake, C. Stone Valenzano, S. Ansell, D. Lipson, and G. Gimm. "Systematic Review of Original Studies of Care Coordination Programs for Adults with Disabilities." Washington, DC: Mathematica Policy Research, 2011.
Brand New Day Health Maintenance Organization Special Needs Plan. "2012 Summary of Benefits." Available at http://www.brandnewdayhmo.com/pdf/2012/2012%20Summary%20of%20Benefits.pdf. Accessed January 7, 2013.
Brown, R.S., D. Peikes, G. Peterson, J. Schore, and C.M. Razafindrakoto. "Six Features of Medicare Coordinated Care Demonstration Programs That Cut Hospital Admissions of High-Risk Patients." Health Affairs, vol. 31, no. 6, June 2012, pp. 1156-1166.
Coleman, E.A., C. Parry, S. Chalmers, and S. Min. "The Care Transitions Intervention." Archives of Internal Medicine, vol. 166, no. 17, 2006, pp. 1822-1828.
Centers for Medicare and Medicaid Services. "Special Needs Plan-Fact Sheet and Data Summary." n.d. Available at: http://www.cms.gov/Medicare/Health-Plans/SpecialNeedsPlans/downloads/FSNPFACT.pdf. Accessed January 28, 2013.
Gold, M., G. Jacobson, A. Damico, and T. Neuman. "Special Needs Plans: Availability and Enrollment." Washington, DC: Kaiser Family Foundation, September 2011.
Grabowski, D.C. "Special Needs Plans and the Coordination of Benefits and Services For Dual Eligibles." Health Affairs, vol. 28, no. 1, January/February 2009, pp. 136-146.
Health Net. "Special Needs Plans (SNP) Model of Care." Available at: https://www.healthnet.com/static/provider/unprotected/pdfs/national/snp_model_of_care_training.pdf. Accessed December 17, 2012.
Healthcare Effectiveness Data and Information Set. "Volume 2: Technical Specifications for Health Plans." Washington, DC: National Committee for Quality Assurance, 2011.
Jack, B.W., V.K. Chetty, D. Anthony, J.L. Greenwald, G.M. Sanchez, A.E. Johnson, S.R. Forsythe, J.K. O'Donnell, M.K. Paasche-Orlow, C. Manasseh, S. Martin, and L. Culpepper. "A Reengineered Hospital Discharge Program to Decrease Rehospitalization: A Randomized Trial." Annals of Internal Medicine, vol. 150, 2009, pp. 178-187.
JEN Associates. "MassHealth Senior Care Options Program Evaluation: Pre-SCO Enrollment Period CY2004 and Post-SCO Enrollment Period CY2005 Nursing Home Entry Rate and Frailty Level Comparisons." 2008.
Mahoney, J.E. "Why Multifactorial Fall-Prevention Interventions May Not Work: Comment on 'Multifactorial Intervention to Reduce Falls in Older People at High Risk of Recurrent Falls.'" Archives of Internal Medicine, vol. 170, no. 13, 2010, p. 1117.
Mangrum, Laurel F., Richard T. Spence, and Molly Lopez. "Integrated Versus Parallel Treatment of Co-Occurring Psychiatric and Substance use Disorders." Journal of Substance Abuse Treatment, vol. 30, no. 1, pp. 79-84.
Medicare Payment Advisory Commission. "Report to the Congress: Medicare and the Health Care Delivery System." Washington, DC: Medicare Payment Advisory Commission, June 2011.
Miller, F.G., and E.J. Emanuel. "Quality-Improvement Research and Informed Consent." New England Journal of Medicine, vol. 358, no. 8, 2008, pp. 765-767.
National Health Policy Group. "SNP Alliance." Available at http://www.nhpg.org/about-us/snp-alliance.aspx. Accessed December 26, 2012.
Naylor, M.D., D. Brooten, R. Campbell, B.S. Jacobson, M.D. Mezey, M.V. Pauly, and J.S. Schwartz. "Comprehensive Discharge Planning and Home Follow-Up of Hospitalized Elders: A Randomized Clinical Trial." Journal of the American Medical Association, vol. 281, no. 7, 1999, pp. 613-620.
Peikes, D., A. Chen, J. Schore, and R. Brown. "Effects of Care Coordination on Hospitalization, Quality of Care, and Health Care Expenditures Among Medicare Beneficiaries." Journal of the American Medical Association, vol. 301, no. 6, 2009, pp. 603-618.
Schmitz, R., A. Merrill, J. Schore, R. Shapiro, and J. Verdier. "Evaluation of Medicare Advantage Special Needs Plans Summary Report." Cambridge, MA: Mathematica Policy Research, 2008.
Vickrey, B.G., B.S. Mittman, K.I. Connor, M.L. Pearson, R.D. Della Penna, T.G. Ganiats, R.W. Demonte Jr, J. Chodosh, X. Cui, S. Vassar, N. Duan, and M. Lee. "The Effect of a Disease Management Intervention on Quality and Outcomes of Dementia Care: A Randomized, Controlled Trial." Annals of Internal Medicine, vol. 145, no. 10, 2006, pp. 713-726.
Wagner, E.H., B.T. Austin, C. Davis, M. Hindmarsh, J. Schaefer, and A. Bonomi. "Improving Chronic Illness Care: Translating Evidence Into Action." Health Affairs, vol. 20, November 2001, pp. 664-678.
Zurovac, J., and R. Brown. "Orthogonal Design: A Powerful Method for Comparative Effectiveness Research with Multiple Interventions." Issue Brief. Washington, DC: Center on Health Care Effectiveness, April 2012.
Zurovac, J., D. Peikes, A. Zutshi, and R. Brown. "Efficient Orthogonal Designs: A Powerful Method to Study and Refine Medical Home Models." In Strategies to Ensure HITECH Supports the Patient-Centered Medical Home, edited by L. Moreno, D. Peikes, and A. Krilla. AHRQ Publication No. 11-0013. Rockville, MD: Agency for Healthcare Research and Quality, March 2013.
APPENDIX A. INTERVENTIONS, RANDOMIZATION, AND INTERVENTION ASSIGNMENTS
We randomly assigned each of 28 life coaches to implement a different, pre-selected combination of alternatives (routine care or enhanced care) for each of 11 components, for a one-year period. However, at Brand New Day, several types of care management staff besides the life coaches provided the intervention components, including clinical directors, field intervention nurses (field nurses), PCPs, and psychiatrists. Services that were routinely provided by life coaches before the study continued to be provided by these staff. For example, clinical directors were assigned to provide two follow-ups after a psychiatric discharge because they have the experience necessary to provide an effective follow-up. Clinical directors whose members were in the enhanced care group were provided lists of members who should receive each component option. For a given life coach, if that life coach was assigned, say, Component 8b (two follow-ups post-discharge), all members served by that life coach appeared on the clinical directors' list of members who were to receive two follow-ups.
The 11 intervention components tested included the following:
Frequency-of-Routine Contact (Component 1). An integral component of care management services are routine contacts between the life coach and member, during which the life coach assesses the members' health; helps the member manage his or her medications, appointments, and other health care needs; and coaches and educates the member. To explore whether more frequent routine contacts might improve member outcomes, the enhanced care option increased the minimum frequency of contact (Table II.1). Given that frequency of contact depends on members' needs, we stratified the minimum frequency based on the member risk, which was related to the member's service use and the number of chronic conditions. For example, low-risk members are routinely contacted once every three months, moderate-risk members once per week, and high-risk members at least four times per week. As part of the enhanced care option, we asked life coaches to contact low-risk members every other month and moderate-risk members twice per week. The enhanced care option did not include a higher minimum number of contacts for high-risk members. Plan updates member's risk information. Life coaches were instructed to contact members based on the most current information available.
Depression Screening Tools and Depression Screening Strategy (Components 2 and 3). Depression is often found in populations with SPMI, and its symptoms may decrease members' ability to address health care concerns. As part of Component 2, we examined whether use of a shorter versus longer depression screening instrument produces better outcomes. Patients of life coaches assigned to routine care were to be screened for depression by clinical directors with the 20-question Zung tool, as per routine practice, whereas those assigned to enhanced care would be screened with the two-question PHQ-2 instrument. Although enhanced care for Component 2 calls for use of an instrument with fewer questions as compared to routine practices, we hypothesized that it might allow life coaches to screen more members. In Component 3, we investigated whether screening for depression more frequently and for more members improved health outcomes. Under routine care, clinical directors were asked to screen some members without an instrument during visits and to screen those with a previous diagnosis of depression. Clinical directors were asked to conduct depression screenings with an instrument for all members of life coaches assigned to enhanced care and to do so every two months; in addition, clinical directors were asked to send a letter to members' psychiatrists informing them of screening results.
Method Used to Coach and Educate Members (Component 4). We investigated whether using the teachback method to instruct and coach members resulted in better health outcomes than relying on clinical judgment. Life coaches assigned to enhanced care used the teachback method, which requires members to confirm understanding by repeating back instructions. The teachback method was developed by clinicians at the Iowa Health System as a test of how well a given concept is explained and understood. This method is intended to help service providers identify explanations and communication strategies most commonly understood by patients. It is recommended that care managers plan how to teachback information. The instructions should be clarified and repeated until the member is be able to correctly describe what they are going to do in their own words. Instructions about how to implement the teachback method were adapted from http://www.nchealthliteracy.org. Under routine care, life coaches assessed members' understanding of instructions and coaching by using routine practices.
DM Topics Addressed by Life Coaches during Routine Contacts (Component 5). We investigated whether reinforcing DM topics addressed as part of educational groups during routine contacts (enhanced care) produced better health outcomes than not covering DM topics during routine contacts. During routine contacts, life coaches discussed and reinforced what members were learning about DM topics covered as part of these groups, with a focus on four topics: diabetes, COPD, hypertension, and weight management. To inform life coaches which topics were relevant for each member, we asked the plan to notify life coaches every three months as to which educational groups their members attended.
Involvement of field nurses in management of complex cases (Component 6). The routine practice at the plan is for field nurses to provide care to complex cases, for example, members with multiple chronic conditions or those using devices. Brand New Day designates such cases as "red flag" cases; we refer to the cases as "high-risk." We investigated whether a mandatory involvement of field nurses in the care of both high-risk and moderate-risk cases resulted in better health outcomes than involving field nurses only on as-needed basis for high-risk cases only. Field nurses were asked to make at least one visit to complex case members to assess their needs and to make recommendations for additional medical services as-needed.
Full Medication Review by PCP (Component 7). Medication reviews can identify inadequate or inappropriate treatments before they present complications or harm members. The reviews are intended to help identify issues with improper dosage, identify new or previously missed interactions, and help providers address adherence issues with members. In Component 7, we investigated whether regular medication reviews conducted by members' PCPs improved members' outcomes. Care management staff at the plan were asked to reach out to PCPs and direct them to perform detailed medication reviews at least once every four months during the course of the study. In this context, PCPs may be either physicians specializing in primary care or psychiatrists. Under routine care, care management staff performed medication reviews as-needed; the reviews included going over medications with members in person.
Clinical Director Follows up Twice After Psychiatric Admissions (Component 8). Three intervention components addressed the management of care transitions, widely recognized as a particularly vulnerable time for members with chronic conditions. Post-discharge follow-up with a member is an essential component of transitional care (Naylor et al. 1999; Coleman et al. 2006; Jack et al. 2009). The goal of post-discharge follow-up is to ensure that processes are in place to enable a successful recovery. For example, it is important that members understand their discharge instructions, make appointments with their PCPs, and take proper medications in prescribed doses. Care management staff are well positioned to ensure that members make a smooth transition to home from the hospital, a skilled nursing facility, or a rehabilitation facility. Intervention Component 8 explored whether more frequent contacts in the days following psychiatric discharge and closer involvement by a licensed mental health professional helped reduce readmissions. Under routine care, life coaches made contact with members at some time during inpatient admissions, usually when members stabilized, and clinical directors conducted in-person assessments and provided instructions to members during visits at the plan on the day of discharge. The licensed mental health practitioner continued to be involved as-needed after conducting the post-discharge follow-up. In most cases, the licensed mental health practitioner was the clinical director or another licensed mental health practitioner if the clinical director was not licensed. The enhanced option required the clinical director to perform an additional follow-up within one week of discharge. The plan care manual used in routine practice asks clinical directors to schedule additional follow-ups as-needed, whereas the enhanced care option made additional follow-ups mandatory. Further, enhanced care called for the continued involvement of the licensed mental health professional for two months post-discharge to ensure that a member is stabilized before returning to the life coach's care.
Field Nurse Always Follows Up After Medical Discharges (Component 9). We investigated whether including field nurses in follow-up after a medical inpatient admission would reduce readmissions and ER visits. For purposes of this component, inpatient facilities included hospitals, SNFs, rehabilitation facilities, or detoxification facilities where members were admitted for nonpsychiatric visits. Under routine care, field nurses were involved in post-discharge follow-ups on an as-needed basis. Under enhanced care, field nurses were asked to collaborate in every discharge with life coaches, make at least one post-discharge follow-up visit to assess members' needs, and make recommendations for additional medical services as-needed.
Follow-ups with Members after ER Visit for Any Reason (Component 10). Under routine care, plan informed care management staff of ER visits every three months by using claims data that was up to 60 days old. Generally, clinical directors and field nurses would only follow-up with members post-discharge from the ER if they had more recent information. (For example, they might hear about members' ER visits from hospitalists with whom they had relationships.) Under enhanced care, the plan notified clinical directors of ER visits on a weekly basis by drawing on information from claims data and, when available, information from the plan's UM Department. UM data were up to one week old and were based on calls from ER staff who would contact the plan to confirm members' eligibility or to obtain authorizations for more extensive procedures. For ER visits for psychiatric reasons, the clinical director was asked to follow up with a member and ensured that the member stabilized. If the ER visit was for nonpsychiatric reasons, the field nurse was asked to follow up with the member. For all ER follow-ups, care management staff used a structured follow-up procedure developed by a clinical staff member at the plan.
Brownbag Medication Review (Component 11). A brownbag medication review is a method for assessing which substances a member is regularly consuming. During the brownbag reviews, members were instructed to bring ("in a bag") all prescription medications, over-the-counter medications, vitamins, herbs, homeopathic medications, and any other supplements that he or she was taking. We investigated whether brownbag medication reviews with eligible members reduced ER visits and hospital and psychiatric admissions. Under routine care, care management staff did not conduct brownbag medication reviews. Under enhanced care, life coaches or other care management staff were asked to perform brownbag medication reviews four times during the study for all members who were taking more than four prescriptions. Care management staff recorded the names of medications and substances, how often the member takes them and why, for how long, and who prescribed or told the member to take them. Upon completing the brownbag medication review, care management staff were asked to send a letter with the results of the review to the treating psychiatrist. The list of members who had more than four prescriptions was updated approximately six months into the study.
We used a two-level efficient orthogonal design method in which we tested two alternatives for each intervention component: routine care (Option a) and enhanced care (Option b). We then used an algorithm to generate a specific set of combinations of a's and b's that constitute an orthogonal design for the number of intervention components to be tested. Combinations of different component options include sequences such as aabaa, bbaaa, ababa, and so on.
Life coaches were randomly assigned to a specific combination of options. For example, the life coach designated number 1 was assigned the following combination: abbbaaababb. The combination contains 11 letters (denoting 11 options), one for each intervention component. The randomly assigned combinations of component options can be found in Table A.1. The analyses in this report took an "intent-to-treat" approach, in which component effects are computed by comparing outcomes of those assigned to the two options, regardless of whether or how thoroughly the options were actually delivered.
This study was designed using the Plackett-Burman 12 experimental design with a foldover. Plackett-Burman is an efficient orthogonal design, meaning the number of intervention components tested was large relative to the number of life coaches. The major limitation of this design is that it is of resolution III, meaning any component's main effects are confounded with all two-component interactions that don't involve that component. For example, the main effect for Component 1 might be confounded with Components 2 and 3, Components 3 and 5, and so on. In order to mediate this problem and at the same time take advantage of the efficiency of the design, we utilized a complete foldover. This means that the assignment of component options for life coaches 13-24 was the mirror-image of assignments for life coaches 1-12. The mirror-image effect can be seen in Table A.1 below, as assignment 13 offers the opposite options as assignment 1. The foldover design doubled the number of "runs" for each component option and changed the design to resolution IV. As a result, confounding remained only for three-way or higher-order interactions, which are more reasonably thought of as negligible than two-component interactions. Because 28 life coaches participated in the study, we randomly assigned the remaining four life coaches (number 25-28) to one of the combinations assigned to the first 24 life coaches.
| TABLE A.1. Care Manager Random Assignments to Intervention Component Combinations | ||||||||||||
| Care Manager | 1 | 2 | 3 | 4 | 5 | 6 | 7 | 8 | 9 | 10 | 11 | Assignment |
| 1 | a | a | b | a | a | a | b | b | b | a | b | 1 |
| 2 | b | a | a | b | a | a | a | b | b | b | a | 2 |
| 3 | a | b | a | a | b | a | a | a | b | b | b | 3 |
| 4 | b | a | b | a | a | b | a | a | a | b | b | 4 |
| 5 | b | b | a | b | a | a | b | a | a | a | b | 5 |
| 6 | b | b | b | a | b | a | a | b | a | a | a | 6 |
| 7 | a | b | b | b | a | b | a | a | b | a | a | 7 |
| 8 | a | a | b | b | b | a | b | a | a | b | a | 8 |
| 9 | a | a | a | b | b | b | a | b | a | a | b | 9 |
| 10 | b | a | a | a | b | b | b | a | b | a | a | 10 |
| 11 | a | b | a | a | a | b | b | b | a | b | a | 11 |
| 12 | b | b | b | b | b | b | b | b | b | b | b | 12 |
| 13 | b | b | a | b | b | b | a | a | a | b | a | 13 |
| 14 | a | b | b | a | b | b | b | a | a | a | b | 14 |
| 15 | b | a | b | b | a | b | b | b | a | a | a | 15 |
| 16 | a | b | a | b | b | a | b | b | b | a | a | 16 |
| 17 | a | a | b | a | b | b | a | b | b | b | a | 17 |
| 18 | a | a | a | b | a | b | b | a | b | b | b | 18 |
| 19 | b | a | a | a | b | a | b | b | a | b | b | 19 |
| 20 | b | b | a | a | a | b | a | b | b | a | b | 20 |
| 21 | b | b | b | a | a | a | b | a | b | b | a | 21 |
| 22 | a | b | b | b | a | a | a | b | a | b | b | 22 |
| 23 | b | a | b | b | b | a | a | a | b | a | b | 23 |
| 24 | a | a | a | a | a | a | a | a | a | a | a | 24 |
| 25 | b | a | a | a | b | b | b | a | b | a | a | 10 |
| 26 | b | b | b | b | b | b | b | b | b | b | b | 12 |
| 27 | a | a | a | b | a | b | b | a | b | b | b | 18 |
| 28 | a | b | b | b | a | a | a | b | a | b | b | 22 |
| TABLE A.2. Proportion of Members Assigned to Option B for Each Intervention Component | |
| Intervention Component | Mean |
| Int #1: Life coaches conduct more frequent routine contacts | 51.4 |
| Int #2: Use longer depression screening instrument | 51.5 |
| Int #3: Clinical director conducts depression screening every 2 months | 49.9 |
| Int #4: Life coaches use teachback method while educating members | 52.3 |
| Int #5: Life coaches reinforce DM topics covered in group classes | 48.7 |
| Int #6: Staff involve field nurse in management of complex cases | 55.8 |
| Int #7: PCP performs a detailed medication review every 4 months | 55.4 |
| Int #8: Clinical director follows up twice after psych admissions | 45.9 |
| Int #9: Field nurse always follows up after medical discharges | 50.8 |
| Int #10: Clinical director follows up after ER visit | 53.3 |
| Int #11: Life coaches provide brownbag medication review | 51.9 |
| Number of Members Enrolled in the Study | 1,422 |
APPENDIX B. REGRESSION ANALYSIS RESULTS
| TABLE B.1. Heckman-Hotz Analysis: Effect of Components on Baseline Outcomes | ||||
| Variables | Number of Admissions 1 Year Before Study | Number of Psychiatric Admissions 1 Year Before Study | Number of ER Visits 1 Year Before Study | Any 30-Day Readmission 1 Year Before Study |
| Coefficient (p-Value) | Coefficient (p-Value) | Coefficient (p-Value) | Coefficient (p-Value) | |
| Components | ||||
| Int #1: Life coaches conduct more frequent routine contacts | -0.020(0.812) | 0.014(0.806) | -0.226(0.107) | 0.078(0.191) |
| Int #2: Staff use of longer depression screening instrument | -0.022(0.779) | 0.005(0.929) | -0.132(0.391) | 0.034(0.639) |
| Int #3: Clinical director conducts depression screening every 2 months | -0.073(0.368) | -0.020(0.773) | 0.045(0.864) | -0.038(0.554) |
| Int #4: Life coaches use teachback method while educating members | -0.119(0.156) | -0.033(0.622) | -0.187(0.512) | 0.044(0.499) |
| Int #5: Life coaches reinforce DM topics covered in group classes | -0.093(0.262) | -0.100*(0.086) | -0.033(0.855) | -0.036(0.550) |
| Int #6: Staff involve field nurse in management of complex cases | -0.051(0.486) | -0.007(0.884) | -0.119(0.557) | -0.118**(0.042) |
| Int #7: PCP performs a detailed medication review every 4 months | 0.071(0.343) | 0.051(0.369) | 0.070(0.645) | 0.045(0.501) |
| Int #8: Clinical director follows up twice after psych admissions | 0.060(0.480) | 0.044(0.498) | -0.054(0.773) | 0.021(0.725) |
| Int #9: Field nurse always follows up after medical discharges | 0.033(0.679) | 0.036(0.528) | 0.046(0.817) | 0.035(0.565) |
| Int #10: Clinical director follows up after ER visit | 0.022(0.813) | -0.035(0.595) | 0.064(0.748) | 0.071(0.268) |
| Int #11: Life coaches provide brownbag medication review | -0.038(0.681) | 0.019(0.766) | -0.202(0.236) | -0.052(0.391) |
| Age | ||||
| 35-44 | -0.214(0.105) | -0.168(0.107) | 0.269(0.444) | -0.024(0.792) |
| 45-55 | -0.151(0.231) | -0.210**(0.036) | -0.269(0.126) | -0.007(0.931) |
| 55-64 | -0.038(0.780) | -0.245***(0.010) | -0.241(0.266) | 0.123(0.202) |
| Over 65 | 0.099(0.705) | -0.285***(0.004) | -0.385*(0.089) | 0.230*(0.084) |
| Gender | ||||
| Male | 0.100(0.125) | 0.112***(0.006) | -0.056(0.780) | 0.144**(0.012) |
| Race/Ethnicity | ||||
| African American | -0.196**(0.016) | -0.086(0.106) | 0.157(0.346) | 0.082(0.444) |
| Other or missing | 0.090(0.725) | -0.242(0.225) | -0.414(0.231) | 0.192(0.335) |
| Asian | 0.031(0.819) | 0.093(0.358) | -0.304(0.144) | 0.293*(0.092) |
| Hispanic | -0.213***(0.007) | -0.076(0.248) | -0.373*(0.059) | -0.091(0.380) |
| Member Location | ||||
| Rural | 0.035(0.800) | -0.035(0.693) | 0.076(0.775) | -0.046(0.656) |
| Suburban | -0.002(0.991) | -0.115(0.137) | 0.894(0.376) | -0.182**(0.026) |
| Missing | -0.150(0.270) | -0.227***(0.000) | 0.238(0.533) | -0.080(0.608) |
| Chronic Conditions | ||||
| Alzheimer's and related conditions | 0.363(0.475) | -0.063(0.563) | -0.720(0.121) | 0.149(0.559) |
| Cataracts | -0.439***(0.001) | -0.081(0.187) | -0.758**(0.015) | -0.647***(0.001) |
| Chronic kidney disease | 0.149(0.488) | -0.039(0.586) | -0.156(0.618) | -0.130(0.320) |
| COPD | 0.018(0.864) | -0.056(0.388) | -0.141(0.650) | 0.060(0.489) |
| Depression | 0.001(0.992) | 0.064(0.397) | 0.371*(0.069) | -0.036(0.662) |
| Diabetes | 0.146(0.162) | 0.033(0.613) | 0.062(0.758) | 0.069(0.356) |
| Glaucoma | -0.194(0.116) | -0.137**(0.042) | -0.721*(0.060) | -0.255**(0.030) |
| Heart failure | 0.090(0.686) | -0.069(0.549) | 1.069**(0.033) | -0.121(0.314) |
| Osteoporosis | -0.282(0.148) | 0.151(0.229) | -1.090(0.152) | -0.098(0.472) |
| Rheumatoid or osteo-arthritis | 0.012(0.927) | -0.068(0.272) | 1.855*(0.090) | -0.074(0.456) |
| Stroke | 0.212(0.707) | -0.177(0.202) | 2.39**(0.049) | 0.068(0.789) |
| Other | 0.175(0.717) | 0.294(0.330) | -0.636(0.588) | 0.042(0.848) |
| Number of Months Enrolled in Plan During Baseline Year | ||||
| 5 months or less | 0.840***(0.000) | 0.643***(0.000) | 0.932**(0.031) | 0.297**(0.036) |
| Between 6 and 11 months | 0.608***(0.000) | 0.382***(0.000) | 0.966***(0.000) | 0.219**(0.038) |
| Mental Conditions | ||||
| Anxiety disorders | 0.104(0.470) | -0.052(0.540) | 0.719(0.228) | 0.044(0.651) |
| Bipolar disorder | 0.257***(0.007) | 0.125**(0.013) | 0.090(0.773) | 0.120*(0.087) |
| Conduct disorders and hyperkinetic syndrome | -0.106(0.762) | 0.097(0.726) | -0.801(0.237) | 0.054(0.806) |
| Depressive disorders | 0.126(0.295) | 0.089(0.255) | 0.094(0.662) | 0.049(0.582) |
| Personality disorders | 0.101(0.641) | 0.171(0.262) | 0.599(0.300) | 0.177(0.228) |
| Post-traumatic stress disorder | 0.587(0.352) | 0.102(0.648) | 0.886(0.390) | -0.010(0.955) |
| Schizophrenia and other psychotic disorders | 0.208**(0.019) | 0.196***(0.000) | 0.001(0.998) | 0.116*(0.093) |
| Tobacco Use | 0.230**(0.035) | 0.186**(0.042) | 0.704*(0.087) | 0.093(0.234) |
| Average life coach-level outcome 2 years before study | 0.950***(0.000) | 0.952***(0.001) | 0.711***(0.000) | 1.622**(0.013) |
| Constant | -0.209(0.314) | -0.161(0.165) | 0.081(0.807) | -0.263(0.116) |
| Number of Observations | 1,422 | 1,422 | 1,422 | 295 |
| R-squared | 0.098 | 0.091 | 0.098 | 0.206 |
| * Significantly different from zero at the 10% level. ** Significantly different from zero at the 5% level. *** Significantly different from zero at the 1% level. | ||||
| TABLE B.2. Effects of Components on Number of Inpatient Admissions, Number of Psychiatric Inpatient Admissions, Number of ER Visits, and Likelihood of Readmission at Follow-Up | ||||
| Variables | Number of Admissions | Number of Psychiatric Admissions | Number of ER Visits | Any 30-Day All-Type Readmission |
| Coefficient (p-Value) | Coefficient (p-Value) | Coefficient (p-Value) | Coefficient (p-Value) | |
| Components | ||||
| Int #1: Life coaches conduct more frequent routine contacts | 0.096(0.158) | 0.027(0.568) | 0.104(0.503) | 0.058(0.367) |
| Int #2: Use longer depression screening instrument | 0.013(0.850) | -0.032(0.574) | 0.124(0.457) | 0.125(0.053) |
| Int #3: Clinical director conducts depression screening every 2 months | 0.069(0.381) | 0.049(0.390) | -0.470**(0.023) | 0.147**(0.024) |
| Int #4: Life coaches use teachback method while educating members | 0.042(0.595) | 0.068(0.186) | 0.204(0.339) | 0.033(0.631) |
| Int #5: Life coaches reinforce DM topics covered in group classes | -0.074(0.317) | -0.012(0.818) | 0.060(0.712) | -0.136**(0.022) |
| Int #6: Staff involve field nurse in management of complex cases | 0.111*(0.084) | 0.058(0.211) | 0.228(0.205) | 0.084(0.152) |
| Int #7: PCP performs a detailed medication review every 4 months | 0.038(0.611) | 0.083*(0.097) | -0.341*(0.063) | -0.060(0.351) |
| Int #8: Clinical director follows up twice after psych admissions | 0.091(0.213) | 0.057(0.290) | 0.065(0.738) | 0.036(0.601) |
| Int #9: Field nurse always follows up after medical discharges | -0.071(0.331) | -0.088*(0.068) | -0.103(0.619) | 0.145**(0.024) |
| Int #10: Clinical director follows up after ER visit | -0.008(0.906) | -0.024(0.601) | -0.067(0.704) | -0.083(0.174) |
| Int #11: Life coaches provide brownbag medication review | -0.077(0.318) | -0.073(0.193) | 0.093(0.575) | 0.047(0.444) |
| Outcomes at Baseline | ||||
| Average life coach-level outcome 1 year before study | 0.477***(0.002) | 0.377**(0.027) | 0.507***(0.006) | 0.653(0.403) |
| Patient-level outcome 1 year before study | 0.089(0.117) | 0.172**(0.012) | 0.444**(0.041) | 0.376**(0.029) |
| Patient-level outcome 3 months before study | 0.112(0.168) | 0.013(0.916) | 0.105(0.382) | 0.121(0.278) |
| Age | ||||
| 35-44 | -0.064(0.567) | 0.011(0.900) | 0.207(0.489) | 0.030(0.728) |
| 45-54 | -0.123(0.171) | -0.084(0.200) | 0.057(0.778) | 0.071(0.393) |
| 55-64 | -0.214**(0.036) | -0.143**(0.043) | -0.280(0.153) | -0.002(0.985) |
| Over 65 | -0.314**(0.033) | -0.178**(0.021) | -0.007(0.983) | -0.093(0.480) |
| Gender | ||||
| Male | -0.000(0.997) | 0.045(0.324) | -0.126(0.361) | -0.005(0.925) |
| Race/Ethnicity | ||||
| African American | -0.068(0.422) | 0.013(0.855) | -0.232(0.157) | -0.091(0.255) |
| Other or missing | -0.119(0.630) | -0.088(0.645) | 0.589(0.607) | -0.062(0.719) |
| Asian | -0.103(0.515) | -0.028(0.839) | -0.024(0.940) | 0.153(0.406) |
| Hispanic | -0.115(0.183) | -0.021(0.740) | -0.054(0.727) | -0.111(0.188) |
| Location | ||||
| Rural | -0.053(0.627) | 0.049(0.557) | -0.350(0.224) | 0.312***(0.007) |
| Suburban | -0.042(0.799) | 0.018(0.899) | -0.143(0.671) | -0.015(0.905) |
| Missing | 0.035(0.869) | -0.069(0.425) | -0.144(0.594) | 0.082(0.636) |
| Chronic Conditions | ||||
| Alzheimers and related conditions | 0.154(0.597) | 0.160(0.391) | -0.592(0.177) | -0.064(0.665) |
| Cataracts | -0.293***(0.005) | -0.134*(0.054) | 0.027(0.899) | 0.006(0.969) |
| Chronic kidney disease | 0.438**(0.011) | 0.080(0.406) | 0.029(0.945) | 0.103(0.215) |
| COPD | 0.134(0.140) | 0.048(0.483) | 0.219(0.275) | -0.002(0.980) |
| Diabetes | 0.104(0.202) | 0.001(0.991) | 0.138(0.447) | -0.055(0.331) |
| Glaucoma | -0.096(0.495) | -0.090(0.134) | -0.532**(0.050) | -0.095(0.383) |
| Heart failure | 0.230(0.184) | -0.104(0.152) | -0.265(0.368) | 0.005(0.960) |
| Osteoporosis | -0.359*(0.057) | 0.018(0.863) | -0.708(0.130) | -0.143(0.210) |
| Rheumatoid or osteo-arthritis | 0.191(0.141) | -0.023(0.745) | 0.631(0.188) | -0.100(0.178) |
| Stroke | -0.224(0.425) | -0.274***(0.002) | -0.677(0.196) | 0.762(0.501) |
| Other | 0.075(0.837) | -0.259***(0.006) | 0.086(0.927) | -0.520***(0.001) |
| Mental Conditions | ||||
| Anxiety disorders | 0.042(0.669) | 0.034(0.615) | 0.617***(0.010) | -0.083(0.175) |
| Bipolar disorder | 0.119*(0.073) | 0.085*(0.097) | 0.088(0.676) | 0.090(0.121) |
| Conduct disorders and hyperkinetic syndrome | -0.024(0.918) | 0.140(0.488) | -0.386(0.250) | -0.084(0.531) |
| Depressive disorders | 0.191**(0.015) | 0.111*(0.054) | 0.222(0.119) | 0.077(0.189) |
| Personality disorders | 0.487*(0.068) | 0.132(0.424) | -0.179(0.720) | 0.077(0.488) |
| Post-traumatic stress disorder | -0.258(0.134) | -0.105(0.280) | -0.063(0.905) | -0.151(0.209) |
| Schizophrenia and other psychotic disorders | 0.219***(0.005) | 0.189***(0.001) | 0.446**(0.028) | 0.019(0.806) |
| Tobacco Use | 0.194***(0.004) | 0.194***(0.000) | 0.129(0.535) | 0.092(0.132) |
| Constant | -0.361*(0.053) | -0.254*(0.065) | -0.557(0.226) | -0.095(0.534) |
| Number of Months Enrolled in Plan During Baseline Year | ||||
| 5 months or less | 0.212(0.237) | 0.168(0.206) | 0.433(0.318) | 0.105(0.272) |
| Between 6 and 11 months | 0.259**(0.310) | 0.047(0.599) | 0.098(0.610) | -0.025(0.684) |
| Number of Observations | 1,422 | 1,422 | 1,422 | 320 |
| R-squared | 0.191 | 0.161 | 0.357 | 0.256 |
| * Significantly different from zero at the 10% level. ** Significantly different from zero at the 5% level. *** Significantly different from zero at the 1% level. | ||||
NOTES
-
For the recruitment of the SNPs for the study, we sought the help of Rich Bringewatt, the leader of the SNP Alliance, an organization that represents the needs and interests of SNPs and the members they serve (National Health Policy Group 2012). We are very thankful for Rich's engagement in the recruitment of the SNPs. The SNP Alliance introduced our study to plans serving dual eligibles that may be interested in participating, provided their contact information, and facilitated the communication with the leadership of the interested plans. After an in-person meeting in October 2010 and several more conversations with plan leaders, we secured a commitment to participate from three SNPs: Brand New Day, the plan described in this report, as well as Care Wisconsin and Gateway, two SNPs serving general populations with disabilities, described in a separate report.
-
We used Plackett-Burman 12 design with a foldover. The design matrix and additional technical details are in Appendix A.
-
Several clinical directors reported that, although PHQ-2 was easy to use because of its brevity, it did not detect depressive symptoms. One clinical director disagreed, noting that PHQ-2 opened the door to a discussion. One clinical director found members objecting to personal questions on the Zung, such as those about sexual activity.
-
One clinical director recommended screenings every six months, whereas another suggested that screenings should occur during appointments with psychiatrists, which are scheduled for every 2-3 months.
-
Brownbag reviews revealed that many members kept medications for years and obtained them from several sources (providers and friends and family) and that members were not a reliable source of accurate medication lists.
-
Scheduling reviews was sometimes difficult because some members inconsistently attended appointments.
-
Staff stated that it was difficult to conduct reviews with members with addictions, members noncompliant with medications, and members in crises.
CENTER OF EXCELLENCE IN RESEARCH ON DISABILITY SERVICES AND CARE COORDINATION AND INTEGRATION (CERDS)
REPORTS AVAILABLE
Abstracted List of Tasks and Reports
HTML http://aspe.hhs.gov/daltcp/reports/2014/CERDS.shtml
PDF http://aspe.hhs.gov/daltcp/reports/2014/CERDS.pdf
--- --- --- --- ---
Association between NCQA Patient-Centered Medical Home Recognition for Primary Care Practices and Quality of Care for Children with Disabilities and Special Health Care Needs
HTML http://aspe.hhs.gov/daltcp/reports/2014/ChildDisV3.shtml
PDF http://aspe.hhs.gov/daltcp/reports/2014/ChildDisV3.pdf
Children with Disabilities and Special Health Care Needs in NCQA-Recognized Patient-Centered Medical Homes: Health Care Utilization, Provider Perspectives and Parental Expectations Executive Summary
HTML http://aspe.hhs.gov/daltcp/reports/2014/ChildDisES.shtml
PDF http://aspe.hhs.gov/daltcp/reports/2014/ChildDisES.pdf
Descriptive Study of Three Disability Competent Managed Care Plans for Medicaid Enrollees
Executive Summary http://aspe.hhs.gov/daltcp/reports/2014/3MCPlanses.shtml
HTML http://aspe.hhs.gov/daltcp/reports/2014/3MCPlans.shtml
PDF http://aspe.hhs.gov/daltcp/reports/2014/3MCPlans.pdf
Effect of PACE on Costs, Nursing Home Admissions, and Mortality: 2006-2011
Executive Summary http://aspe.hhs.gov/daltcp/reports/2014/PACEeffectes.shtml
HTML http://aspe.hhs.gov/daltcp/reports/2014/PACEeffect.shtml
PDF http://aspe.hhs.gov/daltcp/reports/2014/PACEeffect.pdf
Effectiveness of Alternative Ways of Implementing Care Management Components in Medicare D-SNPs: The Brand New Day Study
Executive Summary http://aspe.hhs.gov/daltcp/reports/2014/OrthoV2s.shtml
HTML http://aspe.hhs.gov/daltcp/reports/2014/OrthoV2.shtml
PDF http://aspe.hhs.gov/daltcp/reports/2014/OrthoV2.pdf
Effectiveness of Alternative Ways of Implementing Care Management Components in Medicare D-SNPs: The Care Wisconsin and Gateway Study
Executive Summary http://aspe.hhs.gov/daltcp/reports/2014/OrthoV1es.shtml
HTML http://aspe.hhs.gov/daltcp/reports/2014/OrthoV1.shtml
PDF http://aspe.hhs.gov/daltcp/reports/2014/OrthoV1.pdf
Evaluating PACE: A Review of the Literature
Executive Summary http://aspe.hhs.gov/daltcp/reports/2014/PACELitReves.shtml
HTML http://aspe.hhs.gov/daltcp/reports/2014/PACELitRev.shtml
PDF http://aspe.hhs.gov/daltcp/reports/2014/PACELitRev.pdf
Factors Predicting Transitions from Medicare-Only to Medicare-Medicaid Enrollee Status
HTML http://aspe.hhs.gov/daltcp/reports/2014/MMTransV2.shtml
PDF http://aspe.hhs.gov/daltcp/reports/2014/MMTransV2.shtml
Identifying Medicare Beneficiaries with Disabilities: Improving on Claims-Based Algorithms
Executive Summary http://aspe.hhs.gov/daltcp/reports/2014/algorithmes.shtml
HTML http://aspe.hhs.gov/daltcp/reports/2014/algorithm.shtml
PDF http://aspe.hhs.gov/daltcp/reports/2014/algorithm.pdf
Impacts of Waiting Periods for Home and Community-Based Services on Consumers and Medicaid Long-Term Care Costs in Iowa
HTML http://aspe.hhs.gov/daltcp/reports/2014/IAWaitPd.shtml
PDF http://aspe.hhs.gov/daltcp/reports/2014/IAWaitPd.pdf
Integrating Physical Health Care in Behavioral Health Agencies in Rural Pennsylvania
Executive Summary http://aspe.hhs.gov/daltcp/reports/2014/ruralPAes.shtml
HTML http://aspe.hhs.gov/daltcp/reports/2014/ruralPA.shtml
PDF http://aspe.hhs.gov/daltcp/reports/2014/ruralPA.pdf
Non-Elderly Disabled Category 2 Housing Choice Voucher Program: An Implementation and Impact Analysis
Executive Summary http://aspe.hhs.gov/daltcp/reports/2014/Cat2Housinges.shtml
HTML http://aspe.hhs.gov/daltcp/reports/2014/Cat2Housing.shtml
PDF http://aspe.hhs.gov/daltcp/reports/2014/Cat2Housing.pdf
Parent Perspectives on Care Received at Patient-Centered Medical Homes for Their Children with Special Health Care Needs
Executive Summary http://aspe.hhs.gov/daltcp/reports/2014/ChildDisV2es.shtml
HTML http://aspe.hhs.gov/daltcp/reports/2014/ChildDisV2.shtml
PDF http://aspe.hhs.gov/daltcp/reports/2014/ChildDisV2.pdf
Physician Perspectives on the Influence of Medical Home Recognition on Practice Transformation and Care Quality for Children with Special Health Care Needs
HTML http://aspe.hhs.gov/daltcp/reports/2014/ChildDisV1.shtml
PDF http://aspe.hhs.gov/daltcp/reports/2014/ChildDisV1.pdf
Strategies for Integrating and Coordinating Care for Behavioral Health Populations: Case Studies of Four States
Executive Summary http://aspe.hhs.gov/daltcp/reports/2014/4CaseStudes.shtml
HTML http://aspe.hhs.gov/daltcp/reports/2014/4CaseStud.shtml
PDF http://aspe.hhs.gov/daltcp/reports/2014/4CaseStud.pdf
Transitions from Medicare-Only to Medicare-Medicaid Enrollment
HTML http://aspe.hhs.gov/daltcp/reports/2014/MMTransV1.shtml
PDF http://aspe.hhs.gov/daltcp/reports/2014/MMTransV1.pdf
To obtain a printed copy of this report, send the full report title and your mailing information to:
U.S. Department of Health and Human ServicesOffice of Disability, Aging and Long-Term Care PolicyRoom 424E, H.H. Humphrey Building200 Independence Avenue, S.W.Washington, D.C. 20201FAX: 202-401-7733Email: webmaster.DALTCP@hhs.gov
RETURN TO:
Office of Disability, Aging and Long-Term Care Policy (DALTCP) Home [http://aspe.hhs.gov/office_specific/daltcp.cfm]Assistant Secretary for Planning and Evaluation (ASPE) Home [http://aspe.hhs.gov]U.S. Department of Health and Human Services (HHS) Home [http://www.hhs.gov]
Last Updated: 09/03/2014