
Printer Friendly Version in PDF Format (52 PDF pages)
ABSTRACT
To assess the financial impact on families of LTSS needs and the potential for families to set aside funds to cover future LTSS spending, this brief examines later-life household wealth before and after disability onset. We followed over time a large sample of older adults who did not have any functional limitations at baseline, comparing the distribution and composition of household wealth for those who did and did not develop severe disabilities, experience extended nursing home stays, and receive Medicaid-financed nursing home care.
DISCLAIMER: The opinions and views expressed in this report are those of the authors. They do not necessarily reflect the views of the Department of Health and Human Services, the contractor or any other funding organization.
|
Many older adults face financial challenges. Retirement typically results in a drop in income, and perhaps a lower standard of living. At the same time, the need for health (and possibly long-term care) services increases, often due to disability. Social programs reduce poverty among older adults. Social Security and Supplemental Security Income provide income support, while Medicare and Medicaid provide health and long-term care services. Despite these programs, life can be precarious for many older adults. Social Security, which is the major or only source of income for most older Americans, depends on prior earned income and work history. Medicare does not cover all services, and significant copayments are charged for most that are covered. Medicaid is severely means-tested, and eligibility and benefits vary extensively across states. Disability does not appear to occur randomly, and the ability of the elderly to obtain and finance care appears to be more limited for those who actually develop disabilities. People may wish to save as a means to handle retirement expenses, but those with low incomes and significant family responsibilities may have difficulty accumulating any meaningful savings. Without savings those with long-term care needs may rely on informal care by family and friends, but Medicaid is likely to be their only recourse if they require formal (paid) services. For those with some savings, perhaps including home equity, the question becomes how to access formal services if they are needed. Depending on what services are required (e.g., 24/7 care in a nursing home or assisted living facility or variable amounts of home help) and for how long, the cost of paid care varies considerably. Nursing home care is the most expensive, but even less expensive home care may be unaffordable if elders are spending all of their monthly income on basic living expenses, and need to preserve sufficient savings to cover home repairs and other contingencies. Pre-funding, with or without some form of collective risk sharing, might lessen the likelihood of being unable to afford care in the community--which most people would choose if they could. Access to community care also reduces the risk of long-stay nursing home care and spending down to Medicaid. However, those who live long enough are likely to need the higher level of care that nursing homes provide. Tax-preferred savings vehicles for long-term care are one option for pre-funding, but they would limits savings that could be used for other purposes. Pre-funding with risk sharing decreases the amount each individual seeking protection must contribute, and provides more coverage for those who actually use services. One method of sharing risk is through voluntary purchase of private long-term care insurance (LTCI), but that is available only to those who are healthy enough to pass underwriting. Alternatively, tax-funded government-sponsored programs can provide universal protection, but only if participation is mandatory. Because comprehensive coverage that protects against all long-term care risk is prohibitively expensive, the challenge is to determine what portion of the risk could be covered by public or private insurance, and what portion would remain an out-of-pocket liability. This project provides information on the risk of disability in relation to wealth in order to better understand the cost and impact of possible policy options. To assess the financial impact on families of long-term services and supports (LTSS) needs and the potential for families to set aside funds to cover future LTSS spending, this report examines later-life household wealth before and after disability onset. We followed over time a large sample of older adults who did not have any functional limitations at baseline, comparing the distribution and composition of household wealth for those who did and did not develop severe disabilities, experience extended nursing home stays, and receive Medicaid-financed nursing home care. Our results, based on more recent survey data and longer observation periods than previous studies, show that household wealth and home equity fell sharply when older adults developed severe disabilities or received nursing home care. Older adults with extended nursing home stays and those who received Medicaid-financing nursing home care had substantially less wealth than those who did not enter a nursing home many years before they began receiving care, suggesting that proposed policies designed to encourage people to pre-fund future LTSS expenses may have limited impact because they will be unable to target those with the highest expenses. |
Background
The prospect of becoming disabled and needing LTSS is perhaps the most significant risk facing older Americans. Favreault and Dey (2015) estimate that about one-half of today's 65-year-olds will eventually need substantial amounts of LTSS, and one in seven will need help for five or more years. Most will receive informal help from family and friends (Wolff et al. 2016), but increasing numbers of older Americans will receive home care from paid helpers, and many will end up in nursing homes (Johnson, Toohey, and Weiner 2006).
However, the percentage of older Americans residing in nursing homes at a given time has declined. Nursing home use grew rapidly in the 1960s, 1970s, and early 1980s. The number of nursing home residents grew much more slowly after 1985, peaked at 1.6 million in 1997-1999, and then fell to 1.4 million in 2004 (National Center for Health Statistics 2005), despite 20 percent growth between 1985 and 2004 in the number of Americans ages 65-85 and 80 percent growth in the numbers of "oldest-old" Americans living beyond age 85. As of 2013, the number of Americans residing in nursing homes remained at 1.4 million (Harris-Kojetin et al. 2013).
Nevertheless, nursing home care remains a common feature of later-life. Analyses of Health and Retirement Study (HRS) data indicate that 27 percent of Americans ages 50 and older who died between 1992 and 2006 were residing in nursing homes at death. Their average length of stay prior to death was a little more than one year (13.7 months), but their median length of stay was only five months (Kelly et al. 2010). One-half of nursing home residents in the highest net-worth quartile of net worth spent no more than three months in a nursing home, whereas one-half of residents in the lowest net-worth quartile spent at least nine months in a nursing home.
At the same time, residency in assisted living and other forms of elder housing with services has soared since the early 1990s, exceeding the reduction in nursing home use (Spillman and Black 2006; Spillman, Liu, and McGilliard 2002). In 2011, 5.5 percent of the United States population ages 65 and older who were not living in nursing homes resided in such alternative residential elder care settings (Freedman and Spillman 2014). These residential care settings are less "institutional" in character and cost less, on average, than nursing home care, but many of these options--especially those most likely to offer high levels of service that can substitute for nursing home care--cater predominantly or exclusively to private payers. According to Greene et al. (2013), only about 19 percent of residents in elder care facilities other than nursing homes had Medicaid as a payer source. As Waidmann and Thomas (2003) note, even when these facilities accept Medicaid payment, Medicaid will cover only "service" costs, not room and board charges, creating financial difficulties for lower-income residents. Waidmann and Thomas found that, after they controlled for health-related factors, high-income people are significantly less likely to enter nursing homes than lower-income people, suggesting that high-need individuals who do not rely on Medicaid may be better able to find nursing home alternatives, such as assisted living and home care. Their finding may also indicate that higher-income elders have less need for the high level of care that nursing homes can provide.
Many older adults who have some LTSS needs but do not need round-the-clock care remain at home and rely on unpaid caregivers, typically spouses and adult children, especially daughters. Paid home care is available, but it is not especially common. In the 2004 National Long-Term Care Survey, only about one-third of chronically disabled elders living in the community had received any paid home care during the preceding week.1 Disabled elders who relied exclusively on paid home care were generally less disabled and received fewer total hours of home care than those who relied on informal care only or a combination of formal and informal care.
LTSS provided in residential care settings, especially in nursing homes, is quite expensive. Estimates from a 2015 survey of private pay residential care facilities found that the median cost was about $80,000 for a semi-private room in a nursing home and about $43,000 for a private room in an assisted living facility (Genworth 2015). Medicare covers only short-term, post-hospital skilled nursing facility stays (averaging 21 days) and does not cover assisted living care at all (although Medicare certified home health agencies are permitted to provide Medicare home health services to assisted living residents).
Paid home care is generally less expensive than residential LTSS primarily because people can control how much they receive and rarely use it every day or round-the-clock. The median cost of home care agency aide services is $20 an hour (Genworth 2015). This hourly cost results in an expected annual cost of about $42,000 for care recipients who receive 40 hours of aide services per week, only slightly less than the average cost of assisted living residential care. However, most users of paid aide services receive much less care from home care agency aides because they rely heavily on unpaid caregivers.
Somewhat paradoxically, however, the out-of-pocket cost of paid home care is often less affordable than residential LTSS because residential care charges cover housing, food, and other basic living expenses that home care users must pay separately. Moreover, people can generally afford to use home equity to pay for LTSS when they move into nursing homes or assisted living residences. However, tapping into home equity to pay for care is problematic when people remain in their homes. Using liquid savings to help pay for home care is also often difficult because homeowners must reserve some savings to cover contingencies such as expensive home repairs that may arise.
Private LTCI pay-outs provide reasonably comprehensive coverage for residential care, covering about 80 percent of daily nursing home costs and almost all assisted living costs (Doty et al. 2010). They also paid for almost all in-home services that claimants used. This should make private LTCI very attractive to those who can afford to pay the premiums. But LTCI market penetration has reached only 11 percent of the older population (Johnson 2016). Moreover, the market has been shrinking, especially since the 2007 financial crisis, because the combination of low interest rates paid on investments (the major source of profit for insurers) and higher than anticipated pay-outs to claimants with lifetime coverage forced long-term care insurers to raise premiums substantially (Cohen 2016). Consumer surveys indicate that people are reluctant to purchase LTCI for several reasons: they under-estimate future LTSS costs, erroneously believe that Medicare or standard health insurance will cover much of their expenses, do not trust insurance companies, and--the reason most often cited--judge premiums to be too high (Associated Press-NORC Center for Public Affairs Research 2015; Brown, Goda, and McGarry 2012; Wiener et al. 2015).
An important drawback of voluntarily purchased private LTCI is that the danger of adverse selection requires insurers to subject applicants to medical underwriting. About 20 percent of applicants are rejected, a figure that does not include those who did not even apply for coverage because they expected to be turned down on the basis of their medical histories (Doty and Shipley 2012). In recent years, private insurers have increasingly tightened underwriting requirements (Skloff 2015). Although this helps insure the solvency of private LTCI, it denies coverage to those most likely to need LTSS.
Medicaid is the single largest source of funding for formal LTSS. Although exact estimates vary, Medicaid currently pays more than $100 billion a year for LTSS, covering 40-60 percent of the nation's LTSS costs (Congressional Budget Office 2013; Kaiser Family Foundation 2013; O'Shaughnessy 2014). According to a recent study, Medicaid covers about two-thirds of nursing home residents ages 65 and older (Spillman and Waidmann 2015). Many older people with LTSS needs transition on to Medicaid as they spend their savings on LTSS expenses, although estimates of the frequency of such transitions vary. Wiener et al. (2013) found that over a ten-year period 10 percent of people ages 50 and older who were not initially on Medicaid transitioned on to the program. However, half of newly covered older adults did not receive any LTSS, so their transition cannot be attributed to high LTSS costs. Spillman and Waidmann (2015) estimate that 5 percent of people ages 65 and older who were not on Medicaid in 2004 transitioned on to Medicaid by 2008, with half of transitions occurring among people living in the community, not in nursing homes.
Estimates of the lifetime risk of receiving Medicaid payments for nursing home care after age 65 based on HRS data found significant differences by age, sex, race, and educational attainment (Johnson forthcoming). For example, the likelihood of receiving any Medicaid-funded nursing home care after age 65 was 29 percent for elders without high school diplomas, 17 percent for those whose highest degree was a high school diploma, and 7 percent for those with college degrees. The likelihood of having a Medicaid-financed nursing home stay of 90 days or more was lower and also varied by educational level: 20 percent for elders who did not graduate from high school, 13 percent for those with high school diplomas only, and 5 percent for college graduates.
Relatively few public resources are devoted to home care, however. According to unpublished estimates from the 2004 NLTCS, only 23 percent of chronically disabled elders relying exclusively on formal care received any publicly-funded services and only 12 percent received Medicaid-funded home and community-based services (HCBS).2 Of those receiving a combination of formal and informal services, 66 percent received no publicly-funded services and 10 percent received Medicaid-funded HCBS.
Medicaid's predominant role in financing LTSS has raised concerns about the program's sustainability as the population ages and Medicaid expenditures grow. The Commission on Long-Term Care (2013), for example, suggested that long-term care financing should be reformed because the baby boomers' LTSS needs will severely strain Medicaid. The program's reliance on a combination of federal and state funding adds to its financial uncertainty. Complaints from state policymakers about the budgetary burden of Medicaid intensified during the 2007-2009 Great Recession and its aftermath as high unemployment raised demand for Medicaid-funded medical care and reduced tax revenues. Complicating matters, most state constitutions prohibit deficit financing. In contrast to Medicaid medical services, demand for Medicaid-funded LTSS is driven more predictably by disability rates and the growth of the older population. However, because states are not required to provide Medicaid LTSS benefits other than nursing home care, these benefits could be dropped or cutback during recessions. In fact, states have been permitted to establish waiting lists for HCBS funded under 1915(c) waivers. Nevertheless, it appears that few states reduced spending on HCBS during the Great Recession and many continued efforts to increase the percentage of Medicaid LTSS spending going toward HCBS.
Not all health economists agree that the baby boomers' LTSS needs will undermine Medicaid. Kronick and Rousseau (2007), for example, projected that population aging will only modestly raise Medicaid costs and that growth in government revenues will be large enough to sustain Medicaid cost increases and substantial spending growth on other services. The Congressional Budget Office (2015) projects that total Medicaid spending as a share of gross domestic product will rise modestly between 2015 and 2040, from 2.2 percent to 2.9 percent. Moreover, the share of Medicaid expenditures going to LTSS fell from 50 percent in 1982 to less than one-third in 2012, even as the population aged. The LTSS share declined because very costly state institutions for the intellectually developmentally disabled closed, technology-driven medical cost inflation outstripped LTSS cost inflation, and Medicaid expanded to cover additional nonelderly populations such as children (State Children's Health Insurance Program) and the low-income medically uninsured (2010 Affordable Care Act).
Arguably, however, what sets elderly Medicaid LTSS users apart from other Medicaid beneficiaries in the minds of many proponents of LTSS financing reform is the possibility that some of them could have avoided relying on Medicaid for LTSS if they had planned ahead. Indeed, because some Medicaid LTSS users do not come from the ranks of the lifetime poor, some analysts have expressed concern that wealthy, high-income elders may have qualified for Medicaid-financed LTSS through "artificial impoverishment" by transferring assets to their children (Borella, De Nardi, and French 2016; Warshawsky 2014).
Federal law requires states to delay Medicaid eligibility for applicants who transferred significant assets over the previous five years, but it's not clear how often those penalties are imposed (Government Accountability Office 2005). An Urban Institute study of asset transfers from elders to children based on longitudinal analyses of HRS data found that the largest dollar amounts transferred to children occurring prior to nursing home use were made by elders who paid privately for their entire subsequent nursing home stays (Waidman and Liu 2006). The study also concluded that the most aggressive enforcement of asset-transfer prohibitions and penalties would yield Medicaid savings of only 1 percent (not counting the costs of enforcement). Baird, Hurd, and Rohwedder (2014) found that older people who expected to enter a nursing home were more likely to transfer wealth to their children than older people who did not expect to enter a nursing home. However, the financial amounts transferred were relatively small, and the observed relationship between asset transfers and nursing home entry disappeared after 2005, when Congress extended the required look-back period for asset transfers from three years to five years. Moreover, Wiener et al. (2013) found that survey respondents who eventually qualified for Medicaid were only about half as likely to transfer assets to their children as respondents who did not qualify for Medicaid.
States are required to recover Medicaid LTSS expenses from the estates of deceased recipients aged 55 and older after any surviving spouses have died (U.S. Department of Health and Human Services 2005), and homes are not exempt, perhaps reducing incentives for older adults to hold much of their wealth in home equity. One recent study, in fact, found that older adults were about a third less likely to own their homes at death after states adopted estate recovery programs (Greenhalgh-Stanley 2012). Most states have been able to recover only a small portion of their Medicaid LTSS expenditures (Wood and Klem 2007), although this may be because the home had previously been sold and equity value used to pay privately for nursing home care. It is impractical for long-stay nursing home residents on Medicaid to retain their homes because Medicaid does not leave nursing home residents with enough personal financial resources to pay property taxes, homeowner's insurance, or meet other financial obligations of homeownership.
Many older adults who develop LTSS needs experience financial hardship. Older adults with health problems tend to have less wealth than healthier older adults, and wealth tends to fall when people develop health problems (Poterba, Venti, and Wise 2010). One study, for example, found that over a nine-year period median household wealth grew 20 percent for married people ages 70 and older who did not receive nursing home care, but fell 21 percent for their counterparts who received nursing home care; for single people who received nursing home care, median household wealth fell 74 percent (Johnson, Mermin, and Uccello 2006). Venti and Wise (2004) found that home equity does not decline much at older ages, except when homeowners become widowed or enter a nursing home.
Policymakers and advocates have tried for decades to improve the way LTSS is financed, in order to protect people from catastrophic expenses, make it easier to obtain paid help at home, and reduce Medicaid LTSS spending. Earlier unsuccessful efforts include the U.S. Bipartisan Commission on Comprehensive Health Care (1990), also known as the Pepper Commission after its first chair, Rep. Claude Pepper (D-FL), the Clinton Administration's 1993 health reform plan (Wiener, Estes, Goldenson, and Goldberg 2001), and the 2010 Affordable Care Act, which included the never-implemented Community Living Assistance Services and Supports Act that would have created a national program of voluntary LTCI. More recently, the Bipartisan Policy Center (2016) and the Long-Term Care Financing Collaborative (2016) have proposed LTSS financing reforms that combine public insurance for catastrophic LTSS costs with initiatives to promote private LTCI coverage for other LTSS expenses to encourage families to pre-fund some of their future expenses. To assess these proposals, we need better information about household wealth trajectories before and after disability onset.
Data
Our data come from the HRS, a longitudinal survey of older Americans conducted by the Survey Research Center at the University of Michigan. The HRS began interviewing a sample of 12,652 respondents in 1992, consisting of adults ages 51-61 and their spouses, with follow-up interviews in 1994 and 1996. In 1993, it began interviewing another sample of 8,222 respondents, consisting of adults age 70 and older and their spouses, with a follow-up interview in 1995. In 1998, the HRS merged the two samples and added new samples of respondents ages 51-56 and ages 67-74, so that the 1998 sampling frame consisted of adults ages 51 and older. HRS respondents have been interviewed every other year since 1998, and the survey adds a new sample of respondents ages 51-56 every six years (most recently in 2010). Our study uses survey responses through 2012, the most recent year with finalized data.
All respondents live in the community, not in nursing homes, when first interviewed, but the HRS follows them into nursing homes as necessary. Proxy responses are solicited from spouses and other close relatives when respondents are living in nursing homes or otherwise unable to respond themselves. The HRS also collects information from next of kin after respondents die, providing information about disability and care received in the last months of life.
The HRS collects detailed information on household wealth and disability status. Our total household wealth measure consists of housing wealth, financial wealth, and other household wealth. Housing wealth includes the value of first and second homes, net of any housing debt (including outstanding mortgages, home loans, and home equity lines of credit).3 Financial wealth includes the value of employer sponsored retirement accounts; Individual Retirement Accounts (IRAs); Keoghs; stocks; mutual funds; investment trusts; bonds; bond funds; certificates of deposit (CDs); government savings bonds; treasury bills; checking, savings, and money market accounts; and other savings, net of nonhousing debt. Other household wealth includes the net value of businesses, vehicles, and real estate (except for primary and secondary residences). We used imputed wealth values when respondents did not report complete information.4 Our analysis adjusted the measures of household wealth for differences in household size. For married adults, whose resources must cover two spouses, we divided household wealth by 1.41--the square root of 2. We did not divide by two because married couples generally have lower living expenses than two single adults living alone (Citro and Michael 1995). We report household wealth in inflation-adjusted 2015 dollars (based on changes in the consumer price index).
Each wave the HRS asks respondents about functional limitations. We classified respondents as having a limitation if they reported any difficulty because of a physical, mental, emotional, or memory problem with activities of daily living (ADLs) or instrumental activities of daily living (IADLs). ADLs include getting in and out of bed, dressing, walking across a room, bathing or showering, eating, and using the toilet. IADLs include using a map, preparing a hot meal, shopping for groceries, making a phone call, and taking medication. The HRS asks respondents to consider only limitations expected to last at least three months. We classified respondents who reported that they did not engage in a particular IADL, such as preparing hot meals, as having a limitation only if they said that they did not perform that activity because of a health problem. Survey questions about ADLs and IADLs differed in 1992, 1993, and 1994 from later waves, so our analysis of disability onset began with the 1995 wave.
The HRS also asks respondents about nursing home care, including how many nights they spent in a nursing home over the past two years or since the previous wave and whether Medicaid covered any of the costs. Because many older people receive nursing home care in the last months of their life, we also used data from exit interviews for deceased respondents. We identified respondents who ever received at least 90 days of nursing home care between two interview waves (or between their last full interview and their death), to distinguish longer-term residents from shorter-term residents who most likely entered a nursing home for rehabilitative care and may not need long-term care.5 We also identified respondents who received Medicaid-financed nursing home care, regardless of length of stay.
Methods
We examined how total household wealth and its components vary by disability status, receipt of nursing home care, and receipt of Medicaid-financed nursing home care. We compared wealth at different points of the distribution--the 10th, 25th, 50th, 75th,and 90th percentiles--as well as the mean value.6 The analysis considered respondents' own disability status and care receipt as well as the status of their spouse, because spousal care needs may reflect and influence household wealth levels as much as own care needs. Much of the analysis focused on severe disabilities, which we defined as the presence of two or more ADL limitations, the standard set by the Health Insurance Portability and Accountability Act for receiving tax-free benefits from a LTCI policy. Results are summarized graphically in the body of the report; full results are available in the Appendix.
| TABLE 1. Presence of Own or Spousal Disabilities by Age and Marital Status, 2012 (%) (adults living in the community) |
||||
|---|---|---|---|---|
| Own | Own or Spouse | |||
| Any ADL or IADL Limitations |
Two or More ADL Limitations |
Any ADL or IADL Limitations |
Two or More ADL Limitations |
|
| All | ||||
| 65 and older | 28 | 10 | 38 | 14 |
| 65-74 | 22 | 7 | 32 | 11 |
| 75-84 | 31 | 11 | 41 | 15 |
| 85 and older | 49 | 23 | 55 | 27 |
| Unmarried | ||||
| 65 and older | 36 | 14 | 36 | 14 |
| 65-74 | 28 | 10 | 28 | 10 |
| 75-84 | 37 | 13 | 37 | 13 |
| 85 and older | 53 | 27 | 53 | 27 |
| Married | ||||
| 65 and older | 23 | 7 | 39 | 14 |
| 65-74 | 19 | 5 | 34 | 11 |
| 75-84 | 27 | 9 | 45 | 17 |
| 85 and older | 41 | 17 | 61 | 29 |
| SOURCE: Author's computations from the 2012 HRS. NOTES: Estimates were based on a sample of 10,296 respondents ages 65 and older and living in the community in 2012. The analysis classified respondents as having an ADL limitation if they reported any difficulty dressing, walking across a room, bathing or showering, eating, getting in or out of bed, or using the toilet. IADL limitations included difficulty using a map, preparing a hot meal, shopping for groceries, making a phone call, and taking medication. Only limitations expected to last at least 3 months that resulted from health or memory problems were considered. |
||||
We first compared household wealth for a sample of 10,296 adults ages 65 and older living in the community in 2012 with and without disabilities. Overall, 28 percent of our sample reported at least one ADL or IADL limitation, and 10 percent reported two or more ADL limitations (Table 1). Disability rates increase with age, and are higher among unmarried adults than married adults. For example, 23 percent of adults ages 85 and older reported two or more ADL limitations, including 17 percent of married adults and 27 percent of unmarried adults. Disability was more common at older ages when we factored in spousal limitations. For example, 14 percent of adults ages 65 or older living in the community reported two or more ADL limitations or have a spouse who reported two or more ADL limitations.
To see whether older adults who eventually developed disabilities had limited wealth even before disability onset, we also created a sample of adults with no disabilities at the beginning of the HRS survey, and compared wealth for those who ever reported disabilities and those who did not. We created two samples: one included 3,081 adults ages 51-59 in 1992 who did not report any ADL or IADL limitations or work-related disabilities that year and the other included 2,459 adults ages 70-75 who did not report any ADL or IADL limitations that year. We followed each respondent until 2012 or until they died or dropped out of the survey for other reasons. In 2012, the younger sample ranged from ages 71-79, while the older sample ranged from ages 89-94. For the older sample, we also examined how wealth varies by later receipt of extended nursing home care and Medicaid-financed nursing home care.7
For some comparisons, we further restricted the sample to adults who did not report any disabilities for several years, to investigate wealth differences long before disability onset. We restricted the younger sample to respondents who did not report any ADL or IADL limitations before the 2004 interview and thus did not have any disabilities for at least ten years after the baseline interview.8 We restricted the older sample to respondents who did not report any ADL or IADL limitations before the 2002 interview and thus did not have any disabilities for at least seven years after the baseline interview.
Finally, to trace wealth trajectories before and after disability onset and nursing home entry, we estimated ordinary least squares regressions of total household wealth and housing wealth on two samples of HRS respondents. One sample pooled 26,763 observations from 1992 to 2012 on respondents ages 51-59 in 1992 who did not report any work disabilities or any ADL or IADL limitations in 1992 and whose spouse (if married) did not report any disabilities or limitations in 1992. The second sample pooled 14,718 observations from 1993 to 2012 on respondents ages 70-75 in 1993 who did not report any ADL or IADL limitations in 1993 and whose spouse (if married) did not report any limitations in 1993. Because housing and total household wealth distributions are skewed, the regressions used the natural logarithm of total household wealth and housing wealth as dependent variables.9
One set of regressions, estimated for both age groups, included an indicator for the onset of two or more ADL limitations by respondents or their spouse and indicators for each wave preceding disability onset and each wave following onset. The coefficients for these indicators, when properly transformed, show at each wave how wealth for respondents who developed disabilities (or whose spouse developed disabilities) compares, in percentage terms, with wealth for respondents who never developed disabilities.10 The regressions also controlled for age and year, which both affect wealth levels. For example, household wealth generally decreases as older people age, and housing and stock market crashes reduced wealth in the later 2000s. Alternative model specifications added controls for sex, education, marital status, and race and ethnicity.
For the older sample, we also estimated two alternative sets of regressions. Instead of including indicators for the onset of two or more ADL limitations, the first alternative included indicators for the first wave in which a respondent or spouse received 90 or more days of nursing home, and the second alternative included indicators for the first wave in which a respondent or spouse received Medicaid-financed nursing home care.
Wealth of Older Adults with Disabilities
Older adults with disabilities had much less wealth than older adults without disabilities. In 2012, median total household wealth for community-dwelling adults ages 65 and older was $94,200 (in 2015 inflation-adjusted dollars) for those who had two more ADL limitations or whose spouse had two or more ADL limitations, $130,600 for those who had at least one ADL or IADL limitation or whose spouse had at least one limitation, and $263,200 for those who had no limitations and whose spouse (if married) had no limitations (Figure 1). Twenty-five percent of older adults who had two or more ADL limitations or whose spouse had two or more ADL limitations had less than $15,000 in total household wealth (the 25th percentile of the distribution), and 12 percent had no household wealth at all (Table A-1). Patterns were similar when we considered only a respondent's disability status, ignoring spousal disability (Table A-1).
Unmarried older adults with disabilities held even less wealth. Median total household wealth was only $47,500 for unmarried older adults with two or more ADL limitations, and a quarter had less than $500 in wealth (Table A-1).
| FIGURE 1. Total Household Wealth of Adults Ages 65 and Older by Disability Status, 2012 (adjusted for household size, 2015 constant dollars) |
|---|
 |
| SOURCE: Author's estimates from the 2012 HRS. NOTES: Estimates were rounded to the nearest $100 and based on a sample of 10,296 respondents ages 65 and older and living in the community in 2012. Total household wealth included the value of housing, other real estate, businesses, vehicles, and financial assets, net of debt. The analysis classifies respondents as having a limitation if they or their spouse reported any difficulty with an ADL or IADL. ADL limitations included dressing, walking across a room, bathing or showering, eating, getting in or out of bed, or using the toilet. IADL limitations included difficulty using a map, preparing a hot meal, shopping for groceries, making a phone call, and taking medication. Only limitations expected to last at least 3 months that resulted from health or memory problems were considered. |
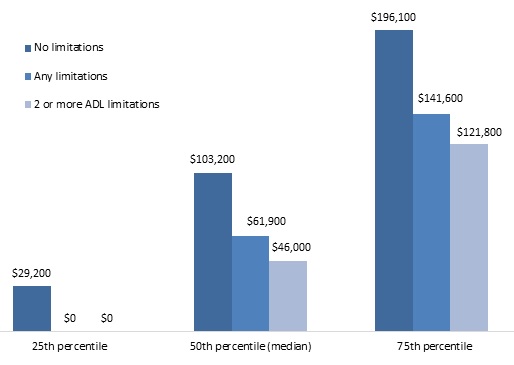
Overall, housing wealth accounted for 29 percent of the wealth held by adults age 65 and older, yet most older adults with disabilities had little housing equity that they could use to finance their care.11 In 2012, median housing wealth was only $46,000 for adults with two or more ADL limitations or whose spouse had two or more ADL limitations (Figure 2), only a quarter had more than $121,800 (as indicated by the 75th percentile), and 32 percent had no home equity at all (Table A-2). Housing wealth is even lower among unmarried older adults with disabilities, as 51 percent of single adults ages 65 and older with two or more ADL limitations reported having no home equity in 2012 (Table A-3). By contrast, median housing wealth was $103,200 for adults who did not report any limitations and whose spouse (if married) did not report any limitations, and a quarter held more than $196,100 in home equity.
| FIGURE 2. Housing Wealth of Adults Ages 65 and Older by Disability Status, 2012 (adjusted for household size, 2015 constant dollars) |
|---|
 |
| SOURCE: Author's estimates from the 2012 HRS. NOTES: Estimates were rounded to the nearest $100 and based on a sample of 10,296 respondents ages 65 and older and living in the community in 2012. Housing wealth included the value of first and second homes, net of any housing debt (including outstanding mortgages, home loans, and home equity lines of credit). The analysis classifies respondents as having a limitation if they or their spouse reported any difficulty with an ADL or IADL. ADL limitations include dressing, walking across a room, bathing or showering, eating, getting in or out of bed, or using the toilet. IADL limitations included difficulty using a map, preparing a hot meal, shopping for groceries, making a phone call, and taking medication. Only limitations expected to last at least 3 months that resulted from health or memory problems were considered. |
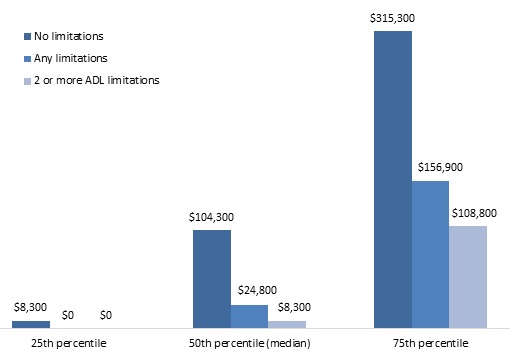
Financial wealth holdings at older ages varied even more dramatically by disability status. Median 2012 financial wealth was $8,300 for adults ages 65 and older with two or more ADL limitations or whose spouse had two or more ADL limitations and $104,300 for their counterparts with no limitations (Figure 3). Thirty-one percent of older adults with two or more ADL limitations held no financial assets, compared with 14 percent for those with no limitations (Table A-2). Half of unmarried older adults with two or more ADL limitations held less than $1,000 in financial wealth in 2012 (Table A-3).
| FIGURE 3. Financial Wealth of Adults Ages 65 and Older by Disability Status, 2012 (adjusted for household size, 2015 constant dollars) |
|---|
 |
| SOURCE: Author's estimates from the 2012 HRS. NOTES: Estimates were rounded to the nearest $100 and based on a sample of 10,296 respondents ages 65 and older and living in the community in 2012. Financial wealth included the value of employer sponsored retirement accounts; IRAs; Keoghs; stocks; mutual funds; investment trusts; bonds; bond funds; CDs; government savings bonds; treasury bills; checking, savings, and money market accounts; and other savings, net of nonhousing debt. The analysis classified respondents as having a limitation if they or their spouse reported any difficulty with an ADL or IADL. ADL limitations included dressing, walking across a room, bathing or showering, eating, getting in or out of bed, or using the toilet. IADL limitations included difficulty using a map, preparing a hot meal, shopping for groceries, making a phone call, and taking medication. Only limitations expected to last at least 3 months that resulted from health or memory problems were considered. |
Household Wealth Before Disability Onset
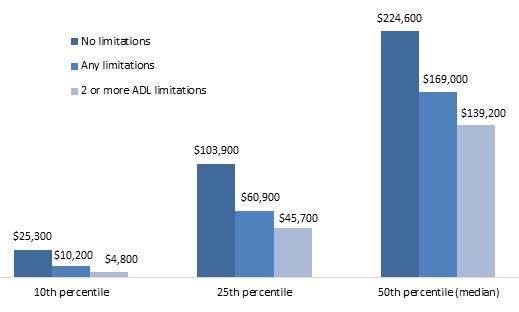
Although many older adults with disabilities spend some of their financial resources on LTSS, reducing their wealth holdings, they generally have less wealth even before they developed disabilities than older adults who never developed disabilities. Among adults ages 51-59 in 1992 with no limitations or work-related disabilities at that time and whose spouse (if married) did not have not have any disabilities or limitations, median 1992 total household wealth was $139,200 (in 2015 inflation-adjusted dollars) for those who ever reported two or more ADL limitations by 2012 (or whose spouse ever reported two or more ADL limitations), when they were ages 71-79 (Figure 4). By contrast, median wealth was $224,600--61 percent higher--for those who never reported any limitations over the next 20 years. One-quarter of those who eventually developed two or more ADL limitations held less than $45,700 in 1992, and one-tenth held less than $4,800.
| FIGURE 4. Total 1992 Household Wealth of Adults Ages 51-59 with No Limitations in 1992, by Disability Status over the Next 20 Years (adjusted for household size, 2015 constant dollars) |
|---|
 |
| SOURCE: Author's estimates from the 1992-2012 waves of the HRS. NOTES: Estimates were rounded to the nearest $100 and based on a sample of respondents ages 51-59 in 1992 who did not report any limitations or work-related disabilities at that time and whose spouse (if married) did not report any limitations or disabilities. Total household wealth included the value of housing, other real estate, businesses, vehicles, and financial assets, net of debt. The analysis classified respondents as having a limitation if they or their spouse reported any difficulty with an ADL or IADL. ADL limitations included dressing, walking across a room, bathing or showering, eating, getting in or out of bed, or using the toilet. IADL limitations included difficulty using a map, preparing a hot meal, shopping for groceries, making a phone call, and taking medication. Only limitations expected to last at least 3 months that resulted from health or memory problems were considered. |
Wealth differences between adults who developed disabilities over the next 20 years and those who did not were most pronounced for financial holdings, although they also existed for home equity. For example, median 1992 financial wealth was $20,900 for adults ages 51-59 who eventually developed two or more ADL limitations, compared with $59,700--nearly three times as much--for those who never reported any limitations (Table A-5). Median housing wealth was $64,500 for those who developed at least two ADL limitations by 2012, compared with $91,900 for those who never reported any limitations. Nearly half (49 percent) of unmarried adults in their 50s who reported two or more ADL limitations by their 70s did not hold any home equity when they were in their 50s (Table A-6).
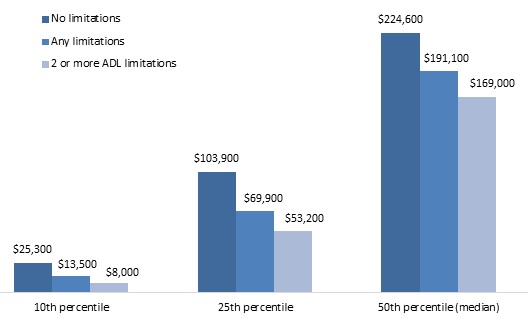
These disability-related wealth shortfalls among adults in their 50s were evident at least ten years before they developed any disabilities. Among adults ages 51-59 in 1992 with no work-related disabilities at that time and no limitations until at least 2002 and whose spouse (if married) did not have any work-related disabilities in 1992 or any limitations until at least 2002, median 1992 total household wealth was $169,000 (in 2015 inflation-adjusted dollars) for those who ever reported two or more ADL limitations between 2004 and 2012 (or whose spouse ever reported two or more ADL limitations), only 75 percent of much as median 1992 total household wealth for those who never reported any limitations by 2012 (Figure 5). Adults who reported two or more ADL limitations between 2004 and 2014 had significantly less housing wealth and especially financial wealth than those who did not report any limitations through 2012, and they were nearly twice as likely to report no home equity (20 percent versus 11 percent) (Table A-8).
| FIGURE 5. Total 1992 Household Wealth of Adults Ages 51-59 with No Limitations from 1992 to 2002, by Disability Status through 2012 (adjusted for household size, 2015 constant dollars) |
|---|
 |
| SOURCE: Author's estimates from the 1992-2012 waves of the HRS. NOTES: Estimates were rounded to the nearest $100 and based on a sample of respondents ages 51-59 in 1992 who did not report any work-related disabilities at that time or any limitations before the 2004 interview and whose spouse (if married) did not report any work-related disabilities at that time or any limitations before the 2004 interview. Total household wealth included the value of housing, other real estate, businesses, vehicles, and financial assets, net of debt. The analysis classified respondents as having a limitation if they or their spouse reported any difficulty with an ADL or IADL. ADL limitations included dressing, walking across a room, bathing or showering, eating, getting in or out of bed, or using the toilet. IADL limitations included difficulty using a map, preparing a hot meal, shopping for groceries, making a phone call, and taking medication. Only limitations expected to last at least 3 months that resulted from health or memory problems were considered. |
Household Wealth at Ages 70-75
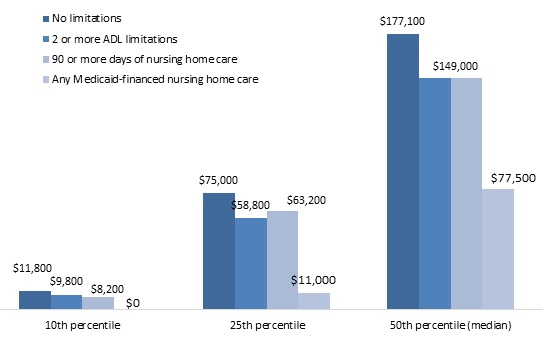
Differences in household wealth between people without disabilities who later developed disabilities and their counterparts who did not develop disabilities were less pronounced for people in their early 70s than for people in their 50s. Among adults ages 70-75 in 1993 with no limitations and whose spouse (if married) did not have any limitations, median 1993 total household wealth was $149,000 (in 2015 inflation-adjusted dollars) for those who ever reported two or more ADL limitations by 2012 (or whose spouse ever reported two or more ADL limitations), when they are ages 89-94 (Figure 6). By comparison, 1993 median total household wealth was $177,100--only 19 percent more--for those who never reported any limitations over the next 19 years (and whose spouse never reported any). One-quarter of those who eventually developed two or more ADL limitations held less than $58,800, and one-tenth held less than $9,800, but those near the bottom of the wealth distribution who never developed any limitations did not have much more. Our finding that the relationship between health status and wealth was smaller for people who developed disabilities after age 75 than for people who developed disabilities earlier is consistent with other evidence that socioeconomic differentials in mortality and health status decline as people at advanced ages grow older (Laditka and Laditka 2015; Sautter, Thomas, Dupre, and George 2012).
| FIGURE 6. Total 1993 Household Wealth of Adults Ages 70-75 with No Limitations in 1993, by Disability Status over the Next 19 years (adjusted for household size, 2015 constant dollars) |
|---|
 |
| SOURCE: Author's estimates from the 1993-2012 waves of the HRS. NOTES: Estimates were rounded to the nearest $100 and based on a sample of respondents ages 70-75 in 1993 who did not report any limitations at that time and whose spouse (if married) did not report any limitations. Total household wealth included the value of housing, other real estate, businesses, vehicles, and financial assets, net of debt. The analysis classified respondents as having a limitation if they or their spouse reported any difficulty with an ADL or IADL. ADL limitations included dressing, walking across a room, bathing or showering, eating, getting in or out of bed, or using the toilet. IADL limitations included difficulty using a map, preparing a hot meal, shopping for groceries, making a phone call, and taking medication. Only limitations expected to last at least 3 months that resulted from health or memory problems were considered. |
Differences in 1993 wealth levels between people ages 70-75 who ever received at least 90 days of nursing home care by 2012 and those who never developed any ADL or IADL limitations were also relatively small. However, median 1993 total household wealth was only $77,500 for those who ever received any Medicaid-financed nursing home care, less than half as much as the median wealth for those who never developed any limitations. One-quarter of adults who received Medicaid-financed nursing home care by ages 89-94 had less than $11,000 in total household wealth in 1993, and one-tenth had no household wealth. Only one-quarter of those who eventually received Medicaid-financed nursing home care had total household wealth in excess of $137,800 (Table A-10).
| FIGURE 7. Total 1993 Household Wealth of Adults Ages 70-75 with No Limitations from 1993 to 2000, by Disability Status through 2012 (adjusted for household size, 2015 constant dollars) |
|---|
 |
| SOURCE: Author's estimates from the 1993-2012 waves of the HRS. NOTES: Estimates were rounded to the nearest $100 and based on a sample of respondents ages 70-75 in 1993 who did not report any limitations before the 2002 interview and whose spouse (if married) did not report any limitations before the 2002 interview. Total household wealth included the value of housing, other real estate, businesses, vehicles, and financial assets, net of debt. The analysis classified respondents as having a limitation if they or their spouse reports any difficulty with an ADL or IADL. ADL limitations included dressing, walking across a room, bathing or showering, eating, getting in or out of bed, or using the toilet. IADL limitations included difficulty using a map, preparing a hot meal, shopping for groceries, making a phone call, and taking medication. Only limitations expected to last at least 3 months that resulted from health or memory problems were considered. |
Patterns were similar for the components of household wealth. There was little difference in housing wealth, financial wealth, or other household wealth at ages 70-75 between people who developed two or more ADL limitations over the next 19 years or ever received at least 90 days of nursing home care and those who never developed any limitations. People who ever received Medicaid-financed nursing home care, however, had less housing wealth and much less financial wealth and other wealth than those who never developed any limitations (Table A-10). Median 1993 housing wealth was only 60 percent as high for those who later received Medicaid-financed nursing home care as those who never developed any limitations, and median 1993 financial wealth was only 10 percent as high. Thirty-two percent of adults who later received Medicaid-financed nursing home care had no housing equity at ages 70-75.
The wealth shortfalls for people who eventually received Medicaid-financed nursing home care arose at least seven years before they developed any ADL or IADL limitations. Among a sample of adults ages 70-75 who did not develop any limitations until at least 2000 and whose spouse (if married) did not develop any limitations until then, median 1993 total household wealth was $79,600 for those who received Medicaid-financed nursing home care by 2012 (Figure 7), less than half as much as median total household wealth for those who never developed any limitations by 2012. One-quarter had less than $11,000 at least seven years before they developed any limitations, and only one-quarter had more than $155,700 (Table A-12). Thirty-six percent of adults who later received Medicaid-financed nursing home care had no housing equity at least seven years before they developed any limitations, and one-half had less than $4,100 in financial assets.
Wealth Differences Before and After Disability Onset
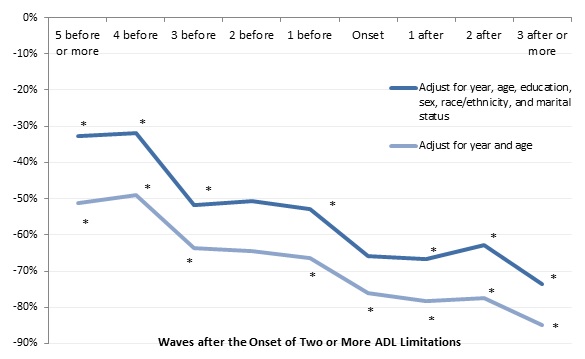
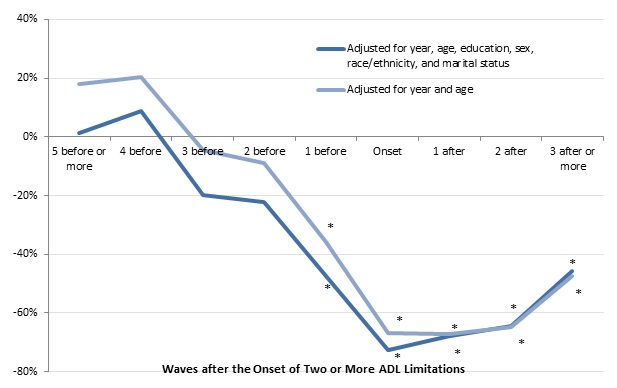
Adults who developed serious disabilities in their 50s, 60s, and 70s had much less wealth before and after disability onset than those who did not develop serious disabilities. Following a sample of adults from 1992 to 2012 who were ages 51-59 in 1992 with no limitations at that time and controlling for only age and year, we found that those who developed two or more ADL limitations by 2012 had 51 percent less total household wealth five or more waves before disability onset than those who never developed two or more ADL limitations (Figure 8). They had 64 percent less total household wealth three waves before disability onset, 76 percent less wealth at disability onset, and 85 percent less wealth three or more waves after disability onset.12
Wealth differences were smaller but still large when we added controls for education, sex, race and ethnicity, and marital status. With those additional controls, adults who developed two or more ADL limitations in their 50s, 60s, or 70s had 33 percent less wealth five or more waves before disability onset than those who never developed two or more ADL limitations, 52 percent less wealth three waves before onset, 66 percent less wealth at onset, and 74 percent less wealth three or more waves after onset. Because HRS respondents are generally interviewed about every two years, these results indicate that wealth shortfalls emerged at least ten years before disability onset for people who developed severe disabilities in their 50s, 60s, and 70s, and lasted at least six years after onset.
| FIGURE 8. Relationship between the Onset of 2 or More ADL Limitations and Total Household Wealth for Adults Ages 51-59 in 1992 (adjusted for household size, 2015 constant dollars) |
|---|
 |
| SOURCE: Author's estimates from the 1992-2012 waves of the HRS. NOTES: Estimates came from a regression of the natural log of total household wealth on a sample of adults ages 51-59 in 1992 who did not report any ADL or IADL limitations at that time and were reinterviewed about once every 2 years through 2012 (or until they died or otherwise dropped out of the survey). The chart shows the percentage difference in total household wealth between adults who reported 2 or more ADL limitations by 2012 and those who never reported 2 or more ADL limitations. Total household wealth included the value of housing, other real estate, businesses, vehicles, and financial assets, net of debt. The analysis classified respondents as having a limitation if they or their spouse reported any difficulty with at least 2 of the following ADLs: dressing, walking across a room, bathing or showering, eating, getting in or out of bed, or using the toilet. Only limitations expected to last at least 3 months that resulted from health or memory problems were considered. The sample included 26,763 observations. * Significantly different from zero (p < 0.05). |
Housing wealth follows a similar trajectory for adults who develop serious disabilities in their 50s, 60s, and 70s. Compared with adults who never developed two or more ADL limitations, those with two or more ADL limitations had 37 percent less housing wealth five or more waves before disability onset, 54 percent less housing wealth three waves before onset, 56 percent less housing wealth when they first reported severe disabilities, and 75 percent less housing wealth three or more waves after onset, after we controlled for year, age, education, sex, race and ethnicity, and marital status (Figure 9).
| FIGURE 9. Relationship between the Onset of 2 or More ADL Limitations and Housing Wealth for Adults 51-59 in 1992 (adjusted for household size, 2015 constant dollars) |
|---|
 |
| SOURCE: Author's estimates from the 1992-2012 waves of the HRS. NOTES: Estimates came from a regression of the natural log of total household wealth on a sample of adults ages 51-59 in 1992 who did not report any ADL or IADL limitations at that time and were reinterviewed about once every 2 years through 2012 (or until they died or otherwise dropped out of the survey). The chart shows the percentage difference in total household wealth between adults who reported 2 or more ADL limitations by 2012 and those who never reported 2 or more ADL limitations. Total household wealth included the value of housing, other real estate, businesses, vehicles, and financial assets, net of debt. The analysis classified respondents as having a limitation if they or their spouse reported any difficulty with at least 2 of the following ADLs: dressing, walking across a room, bathing or showering, eating, getting in or out of bed, or using the toilet. Only limitations expected to last at least 3 months that resulted from health or memory problems were considered. The sample included 26,763 observations. * Significantly different from zero (p < 0.05). |
Trajectories of total household wealth and housing wealth differed substantially by demographic characteristics. For example, adults ages 51-79 who did not complete high school had 75 percent less total household wealth and 76 percent less housing wealth than high school graduates who did not obtain a bachelor's degree (Table A-13).13 Adults with a bachelor's degree had about twice as much total household wealth as those with only a high school diploma. Compared with nonHispanic Whites, African Americans had 80 percent less total household wealth and Hispanics had 79 percent less. Wealth was also lower for unmarred adults than their married counterparts. Both total household wealth and housing wealth peaked, in inflation-adjusted dollars, in 2006, just before the crash in the housing and stock markets.
Wealth Differences among Adults Ages 70-75 at Baseline
| FIGURE 10. Relationship between the Onset of 2 or More ADL Limitations and Total Household Wealth for Adults Age 70-75 in 1993 (adjusted for household size, 2015 constant dollars) |
|---|
 |
| SOURCE: Author's estimates from the 1993-2012 waves of the HRS. NOTES: Estimates came from a regression of the natural log of housing wealth on a sample of adults ages 70-75 in 1993 who did not report any ADL or IADL limitations at that time and were reinterviewed about once every 2 years through 2012 (or until they died or otherwise dropped out of the survey). The chart shows the percentage difference in housing wealth between adults who reported 2 or more ADL limitations by 2012 and those who never reported 2 or more ADL limitation. Housing wealth included the value of first and second homes, net of any housing debt (including outstanding mortgages, home loans, and home equity lines of credit). The analysis classified respondents as having a limitation if they or their spouse reported any difficulty with at least 2 of the following ADLs: dressing, walking across a room, bathing or showering, eating, getting in or out of bed, or using the toilet. Only limitations expected to last at least 3 months that resulted from health or memory problems were considered. The sample included 14,718 observations. * Significantly different from zero (p < 0.05). |
Wealth trajectory differences between those who developed serious disabilities and those who did not were less dramatic when disabilities did not arise until very advanced ages. When we followed a sample of adults from 1993 to 2012 who were ages 70-75 in 1993 and did not have any limitations at that time, we found no significant differences in total household wealth more than one wave before disability onset between those who subsequently developed two or more ADL limitations (or had a spouse who developed such limitations) and those who did not (Figure 10). However, we found that adults who developed two or more ADL limitations had 34 percent less total household wealth one wave (or two years) before disability onset than those who never developed two or more ADL limitations, after controlling for year, age, education, sex, race and ethnicity, and marital status. Those who developed disabilities had 58 percent less wealth when disabilities were first reported, and wealth did not fall further behind the levels for older people without disabilities in following waves. The wealth trajectories are similar when we controlled for only year and age, suggesting that only a small portion of the difference in wealth changes for those who developed disabilities and those who did not can be explained by differences between the two groups in education, sex, race and ethnicity, or marital status.
| FIGURE 11. Relationship between the Onset of 2 or More ADL Limitations and Housing Wealth for Adults Ages 70-75 in 1993 (adjusted for household size, 2015 constant dollars) |
|---|
 |
| SOURCE: Author's estimates from the 1993-2012 waves of the HRS. NOTES: Estimates came from a regression of the natural log of housing wealth on a sample of adults ages 70-75 in 1993 who did not report any ADL or IADL limitations at that time and were reinterviewed about once every 2 years through 2012 (or until they died or otherwise dropped out of the survey). The chart shows the percentage difference in total household wealth between adults who reported 2 or more ADL limitations by 2012 and those who never reported 2 or more ADL limitations. Housing wealth included the value of first and second homes, net of any housing debt (including outstanding mortgages, home loans, and home equity lines of credit). The analysis classified respondents as having a limitation if they or their spouse reported any difficulty with at least 2 of the following ADLS: dressing, walking across a room, bathing or showering, eating, getting in or out of bed, or using the toilet. Only limitations expected to last at least 3 months that resulted from health or memory problems were considered. The sample included 14,718 observations. * Significantly different from zero (p < 0.05). |
As with total household wealth, significant differences in housing wealth by serious disability emerged in our older sample only one wave (or two years) before disability onset. At that time, those who developed two or more ADL limitations had 47 percent less housing wealth than those who never developed two or more ADL limitations, when demographic characteristics were held constant (Figure 11). At the wave when respondents first reported two or more ADL limitations, those with serious disabilities had 72 percent less wealth than those who did not. The shortfall narrowed after disability onset, when housing wealth fell somewhat more for those who never reported serious disabilities than those who did.
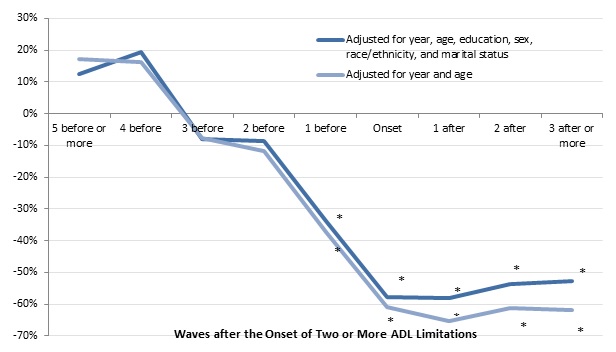
People who resided in nursing homes for at least 90 days after their early 70s had much less wealth than those who did not. Focusing on results that controlled for demographic characteristics, we found that long-term nursing home residents had 28 percent less total household wealth three waves before they entered a nursing home than those who never spent 90 or more days in a nursing home (Figure 12). They had 58 percent less wealth one wave before entry and 86 percent less wealth at the wave they entered, but their wealth did not subsequently fall further behind the level for those who never spent 90 or more days in a nursing home. We found no significant wealth differences between recipients of extended nursing home care more than three waves, or six years, before nursing home entry.
| FIGURE 12. Relationship between Nursing Home Entry and Total Household Wealth for Adults Ages 70-75 in 1993 (adjusted for household size, 2015 constant dollars) |
|---|
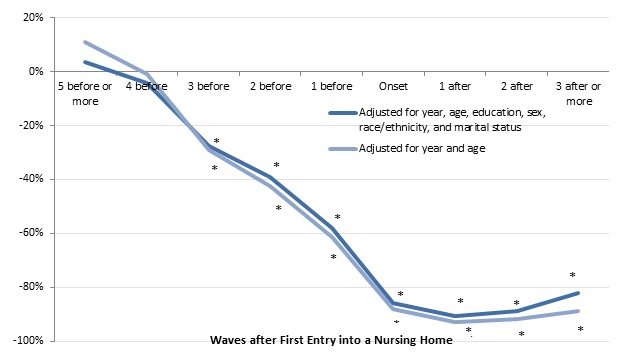 |
| SOURCE: Author's estimates from the 1993-2012 waves of the HRS. NOTES: Estimates came from a regression of the natural log of total household wealth on a sample of adults ages 70-75 in 1993 who did not report any ADL or IADL limitations at that time and were reinterviewed about once every 2 years through 2012 (or until they died or otherwise dropped out of the survey). The chart shows the percentage difference in total household wealth between adults who entered a nursing home by 2012 and those who never entered a nursing home. Total household wealth included the value of housing, other real estate, businesses, vehicles, and financial assets, net of debt. The analysis classified respondents as entering a nursing home if they or their spouse (if married) spent at least 90-days in a nursing home during a 2-year period. The sample included 14,718 observations. * Significantly different from zero (p < 0.05). |
Housing wealth shortfalls for long-term nursing home residents in the three waves before nursing home entry were more pronounced than for total household wealth. When demographic characteristics were held constant, recipients of extended nursing home care had 44 percent less housing wealth three waves before entry than those who did not spend at least 90 days in a nursing home, 77 percent less housing wealth one wave before entry, and 96 percent less housing wealth at the entry wave (Figure 13). As with total household wealth, housing wealth was not significantly lower more than three waves before entry for older people who became long-term nursing home residents than for nonresidents, and the shortfall in housing wealth shrunk somewhat after entry as nonresidents' housing wealth fell relatively rapidly.
| FIGURE 13. Relationship between Nursing Home Entry and Housing Wealth for Adults Ages 70-75 in 1993 (adjusted for household size, 2015 constant dollars) |
|---|
 |
| SOURCE: Author's estimates from the 1993-2012 waves of the HRS. NOTES: Estimates came from a regression of the natural log of total household wealth on a sample of adults ages 70-75 in 1993 who did not report any ADL or IADL limitations at that time and were reinterviewed about once every 2 years through 2012 (or until they died or otherwise dropped out of the survey). The chart shows the percentage difference in total household wealth between adults who entered a nursing home by 2012 and those who never entered a nursing home. Housing wealth included the value of first and second homes, net of any housing debt (including outstanding mortgages, home loans, and home equity lines of credit). The analysis classified respondents as entering a nursing home if they or their spouse (if married) spent at least 90-days in a nursing home during a 2-year period. The sample included 14,718 observations. * Significantly different from zero (p < 0.05). |
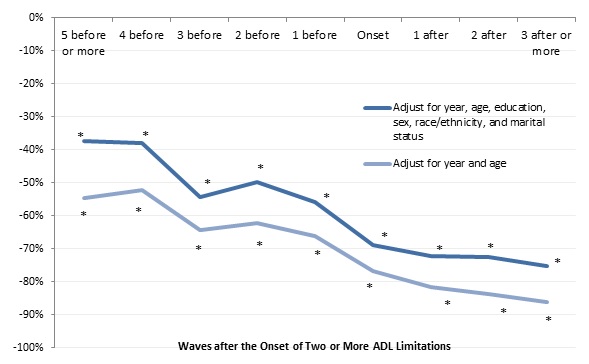
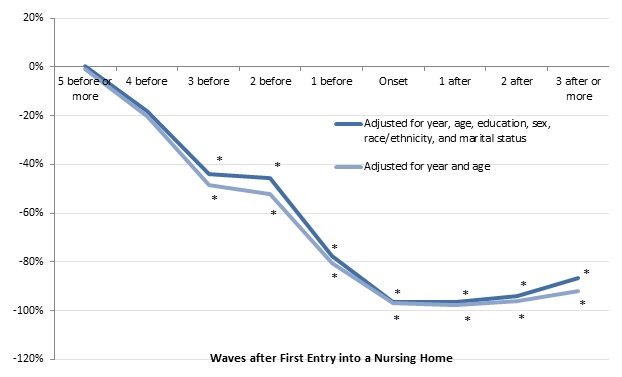
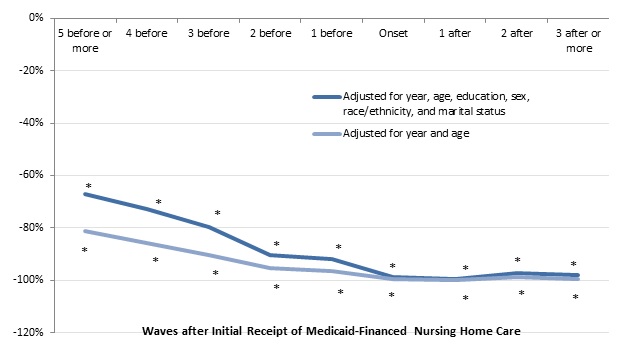
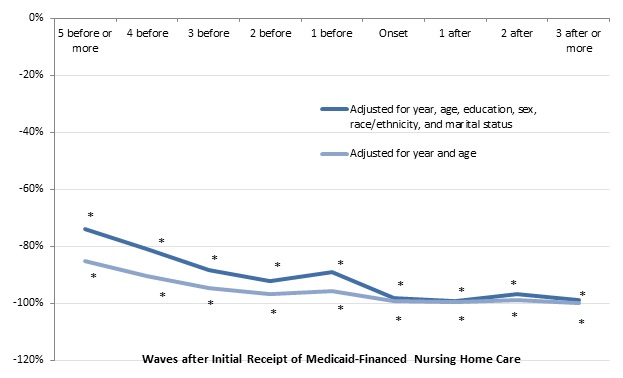
Older adults who received Medicaid-financed nursing home care had much less wealth at least ten years before they entered a nursing home than people who never received Medicaid-financed nursing home care. After adjusting for demographic characteristics, we found that older adults who received nursing home care paid at least partly by Medicaid had 67 percent less total household wealth five or more waves before they entered a nursing home than people who never received nursing home care at least partly paid by Medicaid (Figure 14). They had 80 percent less total household wealth three waves before nursing home entry, 92 percent less wealth one wave before entry, and 99 percent less wealth at the entry wave. Shortfalls in housing wealth were even more dramatic, with those receiving Medicaid-financed nursing home having 74 percent less housing wealth five or more waves before nursing home entry and 88 percent less housing wealth three waves before entry (Figure 15).
| FIGURE 14. Relationship between the Initial Receipt of Medicaid-Financed Nursing Home Care and Total Household Wealth for Adults Age 70-75 in 1993 (adjusted for household size, 2015 constant dollars) |
|---|
 |
| SOURCE: Author's estimates from the 1993-2012 waves of the HRS. NOTES: Estimates came from a regression of the natural log of total household wealth on a sample of adults ages 70-75 in 1993 who did not report any ADL or IADL limitations at that time and were reinterviewed about once every 2 years through 2012 (or until they died or otherwise dropped out of the survey). The chart shows the percentage difference in total household wealth between adults who received Medicaid-financed nursing home care by 2012 and those who did not. Total household wealth included the value of housing, other real estate, businesses, vehicles, and financial assets, net of debt. The sample included 14,718 observations. * Significantly different from zero (p < 0.05). |
Total household wealth and housing wealth for adults ages 70-94 varied significantly with demographic characteristics as well as with disability status and nursing home care. For example, when we controlled for other factors, we found that African Americans had 65 percent less housing wealth than nonHispanic Whites and Hispanics had 73 percent less (Table A-14). Racial and ethnic differences were even sharper for total household wealth. The wealth shortfalls for African Americans and Hispanics were larger in this longitudinal sample of respondents ages 70-75 in 1993 than in our younger sample of respondents ages 51-59 in 1992. Wealth declined at advanced ages as respondents grew older, with total household wealth falling 6 percent per year and housing wealth falling 23 percent per year. Unmarried people and people with limited education had less wealth than married people and better-educated people.
| FIGURE 15. Relationship between the Initial Receipt of Medicaid-Financed Nursing Home Care and Housing Wealth for Adults Ages 70-75 in 1993 (adjusted for household size, 2015 constant dollars) |
|---|
 |
| SOURCE: Author's estimates from the 1993-2012 waves of the HRS. NOTES: Estimates came from a regression of the natural log of housing wealth on a sample of adults ages 70-75 in 1993 who did not report any ADL or IADL limitations at that time and were reinterviewed about once every 2 years through 2012 (or until they died or otherwise dropped out of the survey). The chart shows the percentage difference in total household wealth between adults who received Medicaid-financed nursing home care by 2012 and those who did not. Housing wealth included the value of first and second homes, net of any housing debt (including outstanding mortgages, home loans, and home equity lines of credit). The sample includes 14,718 observations. * Significantly different from zero (p < 0.05). |
Conclusions
Household wealth plummets when older adults or their spouses develop severe disabilities or enter nursing homes. Adults ages 51-59 who developed severe disabilities over the next two decades had 66 percent less total household wealth and 69 percent less housing wealth within two years of first developing those disabilities than their counterparts who did not develop severe disabilities. These wealth differences arose long before serious disabilities began. At least ten years before these adults with severe disabilities first reported any ADL or IADL limitations, they had 33 percent less total household wealth and 37 percent less housing wealth than those who never developed severe disabilities. However, people who did not develop severe disabilities until their 80s and 90s--when such health problems are much more common--did not experience wealth shortfalls until about two years before their disabilities emerged, although their wealth then fell sharply.
Extended nursing home stays significantly deplete household wealth. People who spent at least 90 days in a nursing home had 86 percent less total household wealth and 96 percent less housing wealth within two years of entry than their counterparts who did not experience extended nursing home care. Wealth shortfalls for people with extended nursing home stays were evident six years before nursing home entry, but not any earlier.
Observed wealth declines several years before nursing home entry might reflect high out-of-pocket LTSS and medical costs that were incurred before the receipt of nursing home care. This finding might also reflect wealth differences between people who enter nursing homes at very advanced ages. Respondents in our sample observed ten years before the receipt of nursing home care would have entered nursing homes after age 80 and more likely after age 85. These respondents may have had more wealth than those who entered at earlier ages. In addition, the observed wealth declines might reflect asset transfers by people who expected to enter nursing homes and hoped to qualify for Medicaid. However, older people who received Medicaid-financed nursing care had 67 percent less total household wealth and 74 percent less housing wealth ten or more years before nursing home entry than people who did not receive nursing home care paid by Medicaid. This result suggests that most people receiving Medicaid-financed nursing home care had little wealth over the decade before Medicaid began paying for their nursing home care, and perhaps for much of their lives. An important caveat, however, is that our Medicaid coverage measure was based on respondent self-reports, which may not be very accurate. More research is needed to better understand the wealth trajectories of older adults who eventually receive Medicaid-financed nursing home care.
Because few people have private insurance that covers LTSS and Medicaid--the only public program that pays much LTSS spending--covers only people with virtually no financial resources, many people deplete nearly all of their wealth when they receive extended nursing home care. However, many people with extended nursing home stays and nearly everyone who receives Medicaid-financed nursing home care had only limited resources for many years before they became severely disabled. For example, one-half of people who experienced a Medicaid-financed nursing home stay after ages 77-82 had less than $79,600 in total household wealth at ages 70-75, and one-quarter had less than $11,000. These resource levels cannot fund much nursing home care, which now typically costs about $80,000 a year (Genworth 2015). It also helps explain why those who relied on Medicaid to finance nursing home care, especially those who rapidly "spent-down" to Medicaid after they entered a nursing home, had limited ability to choose alternatives such as assisted living or paid home care. More research is needed to determine whether many people with Medicaid-financed nursing home care had resources earlier in their lifetime that they could have set aside to cover future LTSS expenses.
Endnotes
-
The estimates in this paragraph are based on unpublished estimates from Brenda Spillman at the Urban Institute.
-
Brenda Spillman provided the unpublished estimates reported in this paragraph.
-
Information about the value of second homes is not available in the 1993, 1994, and 1995 waves, because of problems with the way the HRS collected the data in those years.
-
We used Urban Institute imputations of missing retirement account values, which are based on hotdeck techniques. Our other wealth measures are based on RAND's imputations. See RAND (2015) for more information.
-
In our sample, 45 percent of respondents ages 70-75 in 1993 who ever reported receiving nursing home care by 2012 never spent more than 90 days in a nursing home.
-
A given percentile of a distribution indicates the share of the sample with values below that amount. For example, by definition 10 percent of a sample have values that fall below the 10th percentile; 75 percent of a sample have values below the 75th percentile, while 25 percent have values above the 75th percentile. The 50th percentile is also known as the median.
-
We did not compare wealth by eventual nursing home residence for the younger sample, because the number of younger respondents ever receiving nursing home care was too small for meaningful comparisons.
-
Some respondents could have developed disabilities as soon as 2002, immediately after that year's interview.
-
We set the natural logarithm of wealth equal to zero when the level of wealth was zero or negative.
-
We computed the percentage difference at a given wave before or after onset by subtracting 1 from the exponential of the coefficient for that wave indicator.
-
The estimated share of wealth from home equity was based on computations of statistics reported in Table A-2.
-
Respondents remained in the sample after disability onset until 2012, until they died, or until they stopped responding to the survey for other reasons, even if they recovered from their disability.
-
For indicator variables, we calculated the percentage difference by subtracting 1 from the exponential of the coefficient for that variable reported in the appendix table.
References
Associated Press-NORC Center for Affairs Research. 2015. Long-Term Care in America: Americans' Outlook and Planning for Future Care. http://www.longtermcarepoll.org/PDFs/LTC%202015/AP-NORC-Long-Term%20Care%20in%20America%202015_FINAL.pdf.
Baird, Matthew, Michael Hurd, and Susann Rohwedder. 2014. Medicaid Spend-down: The Importance of Strategic Asset Transfers to Reach Medicaid Eligibility. http://www.netspar.nl/files/Evenementen/2014-06-19%20ipw/papers/062%20rohwedder.pdf.
Bipartisan Policy Center. 2016. Initial Recommendations to Improve the Financing of Long-Term Care. Washington, DC: Bipartisan Policy Center. http://bipartisanpolicy.org/library/long-term-care-financing-recommendations/.
Borella, Margherita, Mariacristina De Nardi, and Eric French. 2016. "Rich, Poor, Singles, and Couples. Who Receives Medicaid in Old Age and Why?" NBER Working Paper 21873. Cambridge, MA: National Bureau of Economic Research. http://www.nber.org/papers/w21873.pdf.
Brown, Jeffrey R., Gopi Shah Goda, and Kathleen McGarry. 2012. "Long-Term Care Insurance Demand Limited by Beliefs about Needs, Concerns about Insurers, and Care Available from Family." Health Affairs, 31(6): 1294-1302.
Citro, Constance F., and Robert T. Michael (editors). 1995. Measuring Poverty: A New Approach. Washington, DC: National Academy Press.
Cohen, Marc A. 2016. "The State of the Long-Term Care Insurance Market." In The State of Long-Term Care Insurance: The Market, :Challenges, and Future Innovations, 2-29. Kansas City, MO: National Association of Insurance Commissioners. http://www.naic.org/documents/cipr_current_study_160519_ltc_insurance.pdf.
Commission on Long-Term Care. 2013. Report to the Congress. http://ltccommission.lmp01.lucidus.net/wp-content/uploads/2013/12/Commi….
Congressional Budget Office. 2013. Rising Demand for Long-Term Services and Supports for Elderly People. Washington, DC: Congressional Budget Office. https://www.cbo.gov/sites/default/files/private/113th-congress-2013-2014/reports/44363-LTC.pdf.
Congressional Budget Office. 2015. The 2015 Long-Term Budget Outlook. Washington, DC: Congressional Budget Office. https://www.cbo.gov/sites/default/files/private/114th-congress-2015-2016/reports/50250-LongTermBudgetOutlook-4.pdf.
Doty, Pamela and Samuel Shipley. 2012. Long-Term Care Insurance Research Brief. Washington, DC: Office of the Assistant Secretary for Planning and Evaluation, U.S. Department of Health and Human Services. https://aspe.hhs.gov/basic-report/long-term-care-insurance-research-brief-0.
Doty, Pamela, Marc Cohen, Jessica Miller, and Xiaomei Shi. 2010. "Private Long-Term Care Insurance: Value to Claimants and Implications for Long-Term Care Financing." The Gerontologist, 50(5): 615-622. http://gerontologist.oxfordjournals.org/content/50/5/613.full.pdf+html.
Favreault, Melissa, and Judith Dey. 2015. Long-Term Services and Supports for Older Americans: Risks and Financing. Washington, DC: Office of the Assistant Secretary for Planning and Evaluation, U.S. Department of Health and Human Services. https://aspe.hhs.gov/basic-report/long-term-services-and-supports-older-americans-risks-and-financing-research-brief.
Freedman, Vicki A., and Brenda C. Spillman. 2014. "The Residential Continuum from Home to Nursing Home: Size, Characteristics, and Unmet Needs of Older Adults." Journals of Gerontology, Series B (Psychological Sciences and Social Sciences), 69B(S1). Supplemental Issue: Findings from the 1st Round of the National Health and Aging Trends Study (NHATS) S42-S49.
Genworth. 2015. Genworth 2015 Cost of Care Survey. Richmond, VA: Genworth Financial, Inc. https://www.genworth.com/dam/Americas/US/PDFs/Consumer/corporate/130568_040115_gnw.pdf.
Government Accountability Office. 2005. Medicaid: Transfers of Assets by Elderly Individuals to Obtain Long-Term Care Coverage. GAO-05-968. Washington, DC: U.S. Government Accountability Office. http://www.gao.gov/products/GAO-05-968.
Greene, Angela, Joshua M. Wiener, Galina Khatutsky, Ruby Johnson, and Janet O'Keeffe. 2013. Medicaid in Residential Care. Washington, DC: Office of the Assistant Secretary for Planning and Evaluation, U.S. Department of Health and Human Services. https://aspe.hhs.gov/report/medicaid-residential-care.
Greenhalgh-Stanley, Nadia. 2012. "Medicaid and the Housing and Asset Decisions of the Elderly: Evidence from Estate Recovery Programs." Journal of Urban Economics, 72(2-3): 210-24.
Harris-Kojetin, L., M. Sengupta, E. Park-Lee, and R. Valverde. 2013. "Long-Term Care Services in the United States: 2013 Overview." National Health Care Statistics Reports, no 1. Hyattsville, MD: National Center for Health Statistics.
Johnson, Richard W. Forthcoming. The Lifetime Risk of Receiving Long-Term Services and Supports. Washington, DC: Office of the Assistant Secretary for Planning and Evaluation, U.S. Department of Health and Human Services.
Johnson, Richard W. 2016. Who Is Covered by Private Long-Term Care Insurance? Washington, DC: Urban Institute. http://www.urban.org/research/publication/who-covered-private-long-term-care-insurance.
Johnson, Richard W., Gordon B. T. Mermin, and Cori E. Uccello. 2006. When the Nest Egg Cracks: Financial Consequences of Health Problems, Marital Status Changes, and Job Layoffs at Older Ages. Washington, DC: Urban Institute. http://www.urban.org/research/publication/when-nest-egg-cracks.
Johnson, Richard W., Desmond Toohey, and Joshua M. Wiener. 2007. Meeting the Long-Term Care Needs of the Baby Boomers: How Changing Families Will Affect Paid Helpers and Institutions. Washington, DC: Urban Institute. http://www.urban.org/research/publication/meeting-long-term-care-needs-baby-boomers.
Kaiser Family Foundation. 2013. Medicaid and its Role in State/Federal Budgets and Health Reform. Menlo Park, CA: Kaiser Family Foundation. https://kaiserfamilyfoundation.files.wordpress.com/2013/04/8162-03.pdf.
Kelly, Anne, Jessamyn Connel-Price, Kenneth Covinsky, Irena Stijacic Cenzer, Anna Chang, W. John Boscardin, and Alexander K. Smith. 2010. "Length of Stay for Older Adults Residing in Nursing Homes at the End of Life." Journal of the American Geriatric Society, 58(9): 1701-06.
Kronick, Richard, and David Rousseau. 2007. "Is Medicaid Sustainable? Spending Projections for the Program's Second Forty Years." Health Affairs, 26(2): 271-287. http://content.healthaffairs.org/content/26/2/w271.abstract.
Laditka, James N., and Sarah B. Laditka. 2015. "Associations of Educational Attainment with Disability and Life Expectancy by Race and Gender in the United States: A Longitudinal Analysis of the Panel Study of Income Dynamics." Journal of Aging and Health, doi:10.1177/0898264315620590.
Long-Term Care Financing Collaborative. 2016. A Consensus Framework for Long-Term Care Financing Reform. http://www.convergencepolicy.org/wp-content/uploads/2016/02/LTCFC-FINAL-REPORT-Feb-2016.pdf.
National Center for Health Statistics. 2005. Number of Nursing Homes, Beds, Current Residents, and Discharges: United States, Selected Years 1973-2004. http://www.cdc.gov/nchs/nnhs/nursing_home_trends.htm.
O'Shaughnessy, Carol V. 2014. National Spending for Long-Term Services and Supports (LTSS), 2012. Washington, DC: National Health Policy Forum. http://www.nhpf.org/library/the-basics/Basics_LTSS_03-27-14.pdf.
Poterba, James M., Steven F. Venti, and David A. Wise. 2010. "The Asset Cost of Poor Health." NBER Working Paper 16389. Cambridge, MA: National Bureau of Economic Research. http://www.nber.org/papers/w16389.pdf.
RAND. 2015. RAND HRS Data Documentation, Version O. Santa Monica, CA: RAND. http://hrsonline.isr.umich.edu/modules/meta/rand/randhrso/randhrs_O.pdf.
Sautter, Jessica M., Patricia A. Thomas, Matthew E. Dupre, and Linda K. George. 2012. "Socioeconomic Status and the Black-White Mortality Crossover." American Journal of Public Health, 102(8): 1566-71.
Skloff, Aaron. 2015. Long-Term Care Insurance Decline Rates. Skloff Financial Group. http://www.skloff.com/long-term-care-insurance-decline-rates-long-term-care-university-031515/.
Spillman, Brenda C., and Kirsten J. Black. 2006. The Size and Characteristics of the Residential Care Population: Evidence from Three National Surveys. Washington, DC: Office of the Assistant Secretary for Planning and Evaluation, U.S. Department of Health and Human Services. https://aspe.hhs.gov/basic-report/size-and-characteristics-residential-care-population-evidence-three-national-surveys.
Spillman, Brenda C., Korbin Liu, and Carey McGilliard. 2002. Trends in Residential Long-Term Care: Use of Nursing Homes and Assisted Living and Characteristics of Facilities and Residents. Washington, DC: Office of the Assistant Secretary for Planning and Evaluation, U.S. Department of Health and Human Services. https://aspe.hhs.gov/basic-report/trends-residential-long-term-care-use-nursing-homes-and-assisted-living-and-characteristics-facilities-and-residents.
Spillman, Brenda, and Timothy Waidmann. 2015. Beyond Spend-Down: The Prevalence and Process of Transitions to Medicaid. Washington, DC: Office of the Assistant Secretary for Planning and Evaluation, U.S. Department of Health and Human Services. https://aspe.hhs.gov/report/beyond-spend-down-prevalence-and-process-transitions-medicaid.
U.S. Bipartisan Commission on Comprehensive Health Care. 1990. A Call for Action: Final Report. Washington, DC: Government Printing Office.
U.S. Department of Health and Human Services. 2005. Medicaid Estate Recovery. Washington, DC: Office of the Assistant Secretary for Planning and Evaluation, U.S. Department of Health and Human Services. https://aspe.hhs.gov/basic-report/medicaid-estate-recovery.
Venti, Steven F., and David A. Wise. 2004. "Aging and Housing Equity: Another Look." In Perspectives on the Economics of Aging, edited by David A. Wise (127-80). Chicago, IL: University of Chicago Press.
Waidmann, Timothy, and Korbin Liu. 2006. Asset Transfer and Nursing Home Use: Empirical Evidence and Policy Significance. Washington, DC: Urban Institute. http://www.kff.org/medicaid/upload/7487.pdf.
Waidmann, Timothy, and Seema Thomas. 2003. Estimates of Risk of Long-Term Care: Assisted Living and Nursing Home Facilities. Washington, DC: Urban Institute.
Warshawky, Mark. 2014. "Millionaires on Medicaid." Wall Street Journal. http://www.wsj.com/articles/SB10001424052702304325004579297052950416982.
Wiener Joshua M., Caroll L. Estes, Susan M. Goldenson, and Sheryl C. Goldberg. 2001. "What Happened to Long-Term Care in the Health Reform Debate of 1993-1994? Lessons for the Future." Milbank Quarterly, 79(2): 207-51.
Wiener, Joshua M., Wayne L. Anderson, Galina Khatutsky, Yevgeniya Kaganova, and Janet O'Keeffe. 2013. Medicaid Spend Down: New Estimates and Implications for Long-Term Services and Supports Financing Reform. Washington, DC: RTI International. http://www.thescanfoundation.org/rti-international-medicaid-spend-down-new-estimates-and-implications-long-term-services-and-supports.
Wiener, Joshua M., Galine Khatutsky, Nga Thach, Angela M. Greene, Benjamin Allaire, Derek Brown, Helen Lamont, William Marton, and Samuel Shipley. 2015. Findings from the Survey of Long-Term Care Awareness and Planning. Washington, DC: Office of the Assistant Secretary for Planning and Evaluation, U.S. Department of Health and Human Services. https://aspe.hhs.gov/basic-report/findings-survey-long-term-care-awareness-and-planning-research-brief.
Wolff, Jennifer L., Brenda C. Spillman, Vicki A. Freedman, and Judith D. Kasper. 2016. "A National Profile of Family and Unpaid Caregivers Who Assist Older Adults with Health Care Activities." JAMA Internal Medicine, doi:10.1001/jamainternmed.2015.7664.
Wood, Erica F., and Ellen M. Klem. 2007. Protections in Medicaid Estate Recovery: Findings, Promising Practices, and Model Notices. Washington, DC: AARP. http://www.aarp.org/health/medicare-insurance/info-2007/2007_07_medicaid.html.
Appendix
| TABLE A-1. Total Household Wealth by Disability and Marital Status, Adults Ages 65 and Older, 2012 (adjusted for household size, 2015 constant dollars) |
||||||
|---|---|---|---|---|---|---|
| Own or Spouse's Disability | Own Disability Only | |||||
| No Limitations | Any Limitations | Two or More ADL Limitations |
No Limitations | Any Limitations | Two or More ADL Limitations |
|
| All | ||||||
| 10th percentile | 11,400 | 200 | 0 | 12,600 | 0 | 0 |
| 25th percentile | 89,800 | 32,800 | 15,000 | 86,000 | 20,600 | 5,200 |
| 50th percentile | 263,200 | 130,600 | 94,200 | 255,000 | 108,400 | 77,400 |
| 75th percentile | 621,300 | 373,000 | 300,400 | 610,100 | 330,300 | 252,900 |
| 90th percentile | 1,248,200 | 841,300 | 677,200 | 1,221,100 | 787,300 | 670,800 |
| Mean | 562,900 | 340,200 | 265,400 | 546,600 | 305,800 | 242,200 |
| No wealth (%) | 5 | 9 | 12 | 5 | 11 | 14 |
| N | 6,105 | 4,191 | 1,570 | 7,152 | 3,144 | 1,113 |
| Unmarried | ||||||
| 10th percentile | 800 | 0 | 0 | 800 | 0 | 0 |
| 25th percentile | 36,800 | 3,100 | 500 | 36,800 | 3,100 | 500 |
| 50th percentile | 167,500 | 72,300 | 47,500 | 167,500 | 72,300 | 47,500 |
| 75th percentile | 454,200 | 230,700 | 176,500 | 454,200 | 230,700 | 176,500 |
| 90th percentile | 980,700 | 635,900 | 645,200 | 980,700 | 635,900 | 645,200 |
| Mean | 429,100 | 232,300 | 214,500 | 429,100 | 232,300 | 214,500 |
| No wealth (%) | 8 | 16 | 20 | 8 | 16 | 20 |
| N | 2,539 | 1,598 | 614 | 2,539 | 1,598 | 614 |
| Married | ||||||
| 10th percentile | 51,500 | 13,900 | 1,700 | 40,100 | 9,300 | 2,900 |
| 25th percentile | 156,200 | 62,000 | 43,900 | 129,900 | 56,200 | 43,100 |
| 50th percentile | 344,500 | 179,600 | 138,700 | 310,400 | 168,300 | 131,800 |
| 75th percentile | 730,000 | 455,500 | 349,800 | 690,600 | 430,700 | 345,300 |
| 90th percentile | 1,401,800 | 961,200 | 732,900 | 1,324,900 | 926,300 | 709,500 |
| Mean | 660,200 | 409,600 | 301,900 | 613,900 | 387,200 | 281,100 |
| No wealth (%) | 2 | 5 | 6 | 3 | 5 | 6 |
| N | 3,566 | 2,593 | 956 | 4,613 | 1,546 | 499 |
| SOURCE: Author's computations from the 2012 HRS. NOTES: Estimates were rounded to the nearest $100 and based on a sample of 10,296 respondents ages 65 and older and living in the community in 2012. The analysis classified respondents as having an ADL limitation if they reported any difficulty dressing, walking across a room, bathing or showering, eating, getting in or out of bed, or using the toilet. IADL limitations included difficulty using a map, preparing a hot meal, shopping for groceries, making a phone call, and taking medication. Only limitations expected to last at least 3 months that resulted from health or memory problems were considered. |
||||||
| TABLE A-2. Components of Household Wealth by Disability Status, Adults Ages 65 and Older, 2012 (adjusted for household size, 2015 constant dollars) |
||||||
|---|---|---|---|---|---|---|
| Own or Spouse's Disability | Own Disability Only | |||||
| No Limitations | Any Limitations | Two or More ADL Limitations |
No Limitations | Any Limitations | Two or More ADL Limitations |
|
| Housing wealth | ||||||
| 10th percentile | 0 | 0 | 0 | 0 | 0 | 0 |
| 25th percentile | 29,200 | 0 | 0 | 31,000 | 0 | 0 |
| 50th percentile | 103,200 | 61,900 | 46,000 | 100,000 | 51,600 | 34,300 |
| 75th percentile | 196,100 | 141,600 | 121,800 | 189,800 | 129,000 | 109,500 |
| 90th percentile | 340,700 | 255,500 | 237,400 | 335,500 | 244,500 | 237,200 |
| Mean | 161,100 | 106,800 | 89,500 | 157,400 | 97,600 | 83,700 |
| No home equity (%) | 18 | 26 | 32 | 17 | 31 | 37 |
| Financial wealth | ||||||
| 10th percentile | 0 | -400 | -1,100 | 0 | -500 | -1,000 |
| 25th percentile | 8,300 | 0 | 0 | 7,300 | 0 | 0 |
| 50th percentile | 104,300 | 24,800 | 8,300 | 97,800 | 16,400 | 4,100 |
| 75th percentile | 315,300 | 156,900 | 108,800 | 309,500 | 134,500 | 98,500 |
| 90th percentile | 711,700 | 470,700 | 370,000 | 683,400 | 440,200 | 343,800 |
| Mean | 295,700 | 175,000 | 126,300 | 285,500 | 159,700 | 120,000 |
| No home equity (%) | 14 | 24 | 31 | 14 | 27 | 34 |
| Other household wealth | ||||||
| 10th percentile | 0 | 0 | 0 | 0 | 0 | 0 |
| 25th percentile | 3,700 | 300 | 0 | 3,700 | 0 | 0 |
| 50th percentile | 11,000 | 5,200 | 2,900 | 11,000 | 3,700 | 1,500 |
| 75th percentile | 29,200 | 18,200 | 12,400 | 29,200 | 14,600 | 9,500 |
| 90th percentile | 203,400 | 93,400 | 75,200 | 196,100 | 80,300 | 47,400 |
| Mean | 106,200 | 58,500 | 49,500 | 103,700 | 48,600 | 38,500 |
| No home equity (%) | 10 | 21 | 29 | 9 | 26 | 36 |
| N | 6,105 | 4,191 | 1,570 | 7,152 | 3,144 | 1,113 |
| SOURCE: Author's computations from the 2012 HRS. NOTES: Estimates were rounded to the nearest $100 and based on a sample of 10,296 respondents ages 65 and older and living in the community in 2012. Housing wealth included the value of first and second homes, net of any housing debt (including outstanding mortgages, home loans, and home equity lines of credit). Financial wealth included the value of employer sponsored retirement accounts; IRAs; Keoghs; stocks; mutual funds; investment trusts; bonds; bond funds; CDs; government savings bonds; treasury bills; checking, savings, and money market accounts;, and other savings, net of nonhousing debt. Other household wealth included the net value of businesses, vehicles, and real estate (except for primary and secondary residences). See the note to Table A-1 for information about how limitations were defined. |
||||||
| TABLE A-3. Components of Household Wealth by Disability and Marital Status, Adults Ages 65 and Older, 2012 (adjusted for household size, 2015 constant dollars) |
||||||
|---|---|---|---|---|---|---|
| Unmarried | Married | |||||
| No Limitations | Any Limitations | Two or More ADL Limitations |
No Limitations | Any Limitations | Two or More ADL Limitations |
|
| Housing wealth | ||||||
| 10th percentile | 0 | 0 | 0 | 8,800 | 0 | 0 |
| 25th percentile | 0 | 0 | 0 | 56,200 | 29,200 | 13,100 |
| 50th percentile | 72,300 | 17,600 | 0 | 116,100 | 73,700 | 65,000 |
| 75th percentile | 175,500 | 103,200 | 87,700 | 211,700 | 164,200 | 142,100 |
| 90th percentile | 309,700 | 206,500 | 206,500 | 365,000 | 292,000 | 255,500 |
| Mean | 141,400 | 76,500 | 71,000 | 175,500 | 126,300 | 102,900 |
| No home equity (%) | 30 | 45 | 51 | 9 | 14 | 18 |
| Financial wealth | ||||||
| 10th percentile | 0 | -600 | -1,000 | 200 | 0 | -1,200 |
| 25th percentile | 500 | 0 | 0 | 33,600 | 1,500 | 0 |
| 50th percentile | 38,800 | 4,200 | 1,000 | 147,500 | 46,700 | 25,500 |
| 75th percentile | 201,300 | 87,700 | 66,000 | 396,400 | 221,200 | 140,200 |
| 90th percentile | 536,800 | 338,600 | 292,600 | 852,600 | 528,900 | 408,800 |
| Mean | 217,300 | 128,200 | 116,700 | 352,600 | 205,100 | 133,300 |
| No home equity (%) | 20 | 32 | 38 | 9 | 19 | 26 |
| Other household wealth | ||||||
| 10th percentile | 0 | 0 | 0 | 2,200 | 0 | 0 |
| 25th percentile | 1,000 | 0 | 0 | 7,300 | 2,900 | 1,500 |
| 50th percentile | 5,200 | 1,000 | 0 | 14,600 | 8,800 | 5,800 |
| 75th percentile | 15,500 | 6,200 | 4,100 | 43,800 | 27,000 | 21,900 |
| 90th percentile | 77,400 | 23,700 | 20,600 | 281,000 | 138,700 | 87,600 |
| Mean | 70,400 | 27,600 | 26,900 | 132,200 | 78,300 | 65,800 |
| No home equity (%) | 19 | 41 | 51 | 3.4 | 9 | 14 |
| N | 2,539 | 1,598 | 614 | 3,566 | 2,593 | 956 |
| SOURCE: Author's computations from the 2012 HRS. NOTES: Estimates were rounded to the nearest $100 and based on a sample of 10,296 respondents ages 65 and older and living in the community in 2012. For married adults, disability status referred to a respondent's or spouse's limitations. See the note to Table A-1 for information about how limitations were defined and the note to Table A-2 for information about how household wealth was defined. |
||||||
| TABLE A-4. Total 1992 Household Wealth by Future Disability Status, Adults Ages 51-59 with No Limitations in 1992 (adjusted for household size, 2015 constant dollars) |
||||||
|---|---|---|---|---|---|---|
| Own or Spouse's Disability | Own Disability Only | |||||
| No Limitations | Any Limitations | Two or More ADL Limitations |
No Limitations | Any Limitations | Two or More ADL Limitations |
|
| All | ||||||
| 10th percentile | 25,300 | 10,200 | 4,800 | 28,100 | 8,400 | 2,600 |
| 25th percentile | 103,900 | 60,900 | 45,700 | 102,500 | 54,400 | 30,400 |
| 50th percentile | 224,600 | 169,000 | 139,200 | 219,800 | 141,600 | 116,600 |
| 75th percentile | 485,000 | 383,500 | 368,300 | 464,700 | 333,300 | 324,400 |
| 90th percentile | 1,052,000 | 695,600 | 666,600 | 931,800 | 659,400 | 623,300 |
| Mean | 504,200 | 325,900 | 277,300 | 457,600 | 299,100 | 256,900 |
| No wealth (%) | 3 | 5 | 7 | 3 | 5 | 8 |
| N | 1,600 | 1,481 | 477 | 2,624 | 1,512 | 430 |
| Unmarried in 1992 | ||||||
| 10th percentile | 1,700 | 0 | 0 | 1,700 | 0 | 0 |
| 25th percentile | 35,800 | 12,700 | 6,300 | 34,600 | 11,000 | 5,100 |
| 50th percentile | 138,500 | 84,500 | 53,200 | 136,800 | 74,300 | 40,200 |
| 75th percentile | 359,800 | 225,500 | 149,300 | 347,200 | 214,500 | 136,000 |
| 90th percentile | 800,700 | 435,900 | 422,300 | 800,700 | 435,500 | 429,100 |
| Mean | 398,200 | 187,900 | 140,700 | 388,100 | 182,400 | 139,500 |
| No wealth (%) | 8 | 11 | 16 | 8 | 12 | 18 |
| N | 461 | 364 | 132 | 493 | 332 | 117 |
| Married in 1992 | ||||||
| 10th percentile | 60,000 | 27,800 | 19,900 | 47,300 | 20,800 | 9,600 |
| 25th percentile | 134,400 | 87,400 | 70,500 | 118,300 | 71,600 | 59,700 |
| 50th percentile | 252,100 | 200,800 | 189,900 | 235,300 | 166,900 | 150,500 |
| 75th percentile | 548,300 | 408,500 | 406,100 | 488,600 | 367,900 | 363,700 |
| 90th percentile | 1,153,500 | 778,900 | 770,200 | 974,800 | 728,000 | 709,000 |
| Mean | 547,900 | 368,900 | 329,900 | 473,900 | 331,500 | 302,800 |
| No wealth (%) | 1 | 2 | 3 | 2 | 3 | 4 |
| N | 1,139 | 1,117 | 345 | 2,131 | 1,180 | 313 |
| SOURCE: Author's computations from the 1992-2012 waves of the HRS. NOTES: The table compares 1992 household wealth for people who developed disabilities over the next 20 years and those who did not. Estimates were rounded to the nearest $100 and based on a sample of respondents ages 51-59 in 1992 who did not report any ADL or IADL limitations or work-related disabilities at that time. Analyses that considered a spouse's limitations were further restricted to respondents whose 1992 spouse did not report any ADL or IADL limitations or work-related disabilities at that time. See the note to Table A-1 for information about how limitations were defined. |
||||||
| TABLE A-5. Components of 1992 Household Wealth by Future Disability Status, Adults Ages 51-59 with No Limitations in 1992 (adjusted for household size, 2015 constant dollars) |
||||||
|---|---|---|---|---|---|---|
| Own or Spouse's Disability | Own Disability Only | |||||
| No Limitations | Any Limitations | Two or More ADL Limitations |
No Limitations | Any Limitations | Two or More ADL Limitations |
|
| Housing wealth | ||||||
| 10th percentile | 0 | 0 | 0 | 0 | 0 | 0 |
| 25th percentile | 31,100 | 23,900 | 15,500 | 35,800 | 23,900 | 0 |
| 50th percentile | 91,900 | 73,500 | 64,500 | 89,600 | 65,700 | 53,800 |
| 75th percentile | 167,200 | 144,500 | 137,400 | 160,700 | 137,400 | 119,500 |
| 90th percentile | 301,000 | 238,900 | 232,900 | 286,500 | 238,900 | 228,100 |
| Mean | 137,700 | 111,900 | 97,400 | 129,500 | 104,900 | 88,100 |
| No home equity (%) | 16 | 17 | 21 | 14 | 18 | 25 |
| Financial wealth | ||||||
| 10th percentile | 0 | 0 | -300 | 0 | -500 | -1,300 |
| 25th percentile | 11,800 | 3,600 | 1,200 | 11,800 | 1,700 | 100 |
| 50th percentile | 59,700 | 36,100 | 20,900 | 59,100 | 27,400 | 13,700 |
| 75th percentile | 181,600 | 118,300 | 107,800 | 171,500 | 105,100 | 100,600 |
| 90th percentile | 405,000 | 267,600 | 249,700 | 370,300 | 240,900 | 240,900 |
| Mean | 181,700 | 104,900 | 84,100 | 164,700 | 98,800 | 81,300 |
| No home equity (%) | 11 | 16 | 20 | 11 | 19 | 25 |
| Other household wealth | ||||||
| 10th percentile | 2,500 | 1,200 | 200 | 3,400 | 1,200 | 0 |
| 25th percentile | 8,400 | 6,000 | 5,100 | 9,000 | 6,000 | 3,600 |
| 50th percentile | 23,900 | 15,500 | 14,300 | 23,700 | 14,300 | 11,900 |
| 75th percentile | 82,400 | 53,000 | 45,600 | 77,600 | 45,400 | 33,800 |
| 90th percentile | 322,500 | 256,800 | 246,100 | 322,500 | 194,400 | 157,700 |
| Mean | 184,800 | 109,100 | 95,800 | 163,400 | 95,400 | 87,500 |
| No home equity (%) | 4 | 6 | 9 | 3 | 6 | 10 |
| N | 1,600 | 1,481 | 477 | 2,624 | 1,512 | 430 |
| SOURCE: Author's computations from the 1992-2012 waves of the HRS. NOTES: The table compares 1992 household wealth for people who developed disabilities over the next 20 years and those who did not. Estimates were rounded to the nearest $100 and based on a sample of respondents ages 51-59 in 1992 who did not report any ADL or IADL limitations or work-related disabilities at that time. Analyses that considered a spouse's limitations were further restricted to respondents whose 1992 spouse did not report any ADL or IADL limitations or work-related disabilities at that time. See the note to Table A-1 for information about how limitations were defined and the note to Table A-2 for information about how household wealth was defined. |
||||||
| TABLE A-6. Components of 1992 Household Wealth by 1992 Marital Status and Future Disability Status, Adults Ages 51-59 with No Limitations in 1992 (adjusted for household size, 2015 constant dollars) |
||||||
|---|---|---|---|---|---|---|
| Unmarried | Married | |||||
| No Limitations | Any Limitations | Two or More ADL Limitations |
No Limitations | Any Limitations | Two or More ADL Limitations |
|
| Housing wealth | ||||||
| 10th percentile | 0 | 0 | 0 | 11,900 | 0 | 0 |
| 25th percentile | 0 | 0 | 0 | 52,600 | 41,800 | 37,000 |
| 50th percentile | 50,700 | 25,300 | 8,400 | 96,800 | 83,600 | 77,600 |
| 75th percentile | 135,100 | 101,400 | 84,500 | 179,200 | 155,300 | 157,700 |
| 90th percentile | 253,400 | 219,600 | 177,400 | 333,300 | 246,100 | 238,900 |
| Mean | 108,200 | 76,700 | 57,800 | 149,500 | 122,300 | 111,700 |
| No home equity (%) | 35 | 42 | 49 | 8 | 10 | 12 |
| Financial wealth | ||||||
| 10th percentile | -1,000 | -500 | -300 | 2,400 | 0 | 0 |
| 25th percentile | 1,400 | 0 | 0 | 18,200 | 7,800 | 2,400 |
| 50th percentile | 30,400 | 11,800 | 5,900 | 70,500 | 47,800 | 31,100 |
| 75th percentile | 118,300 | 67,600 | 50,300 | 200,400 | 135,600 | 122,800 |
| 90th percentile | 312,500 | 151,200 | 143,600 | 426,800 | 288,100 | 270,000 |
| Mean | 146,800 | 59,700 | 52,600 | 193,900 | 118,800 | 96,200 |
| No home equity (%) | 22 | 27 | 33 | 6 | 13 | 15 |
| Other household wealth | ||||||
| 10th percentile | 0 | 0 | 0 | 6,000 | 3,100 | 3,000 |
| 25th percentile | 3,400 | 1,400 | 0 | 11,900 | 9,600 | 8,400 |
| 50th percentile | 11,800 | 6,900 | 6,900 | 27,500 | 19,100 | 19,100 |
| 75th percentile | 37,200 | 17,700 | 15,200 | 99,100 | 71,300 | 100,300 |
| 90th percentile | 185,800 | 67,600 | 33,800 | 388,200 | 290,500 | 346,400 |
| Mean | 133,100 | 46,000 | 29,100 | 204,500 | 127,800 | 122,000 |
| No home equity (%) | 10 | 19 | 24 | 2 | 2 | 3 |
| N | 493 | 332 | 117 | 1,139 | 1,117 | 345 |
| SOURCE: Author's computations from the 1992-2012 waves of the HRS. NOTES: The table compares 1992 household wealth for people who developed disabilities over the next 20 years and those who did not. Estimates were rounded to the nearest $100 and based on a sample of 10,294 respondents ages 65 and older and living in the community in 2012. For married adults, disability status refers to a respondent's or spouse's limitations, and tabulations were further restricted to respondents whose 1992 spouse did not report any ADL or IADL limitations or work-related disabilities at that time. See the note to Table A-1 for information about how limitations were defined and the note to Table A-2 for information about how household wealth was defined. |
||||||
| TABLE A-7. Total 1992 Household Wealth by Future Disability Status, Adults Ages 51-59 in 1992 with No Limitations from 1992 to 2002 (adjusted for household size, 2015 constant dollars) |
||||||
|---|---|---|---|---|---|---|
| Own or Spouse's Disability | Own Disability Only | |||||
| No Limitations | Any Limitations | Two or More ADL Limitations |
No Limitations | Any Limitations | Two or More ADL Limitations |
|
| All | ||||||
| 10th percentile | 25,300 | 13,500 | 8,000 | 28,100 | 15,300 | 5,100 |
| 25th percentile | 103,900 | 69,900 | 53,200 | 102,500 | 65,400 | 48,400 |
| 50th percentile | 224,600 | 191,100 | 169,000 | 219,800 | 160,100 | 138,600 |
| 75th percentile | 485,000 | 401,400 | 384,600 | 464,700 | 382,900 | 368,300 |
| 90th percentile | 1,052,000 | 737,000 | 770,200 | 931,800 | 734,800 | 695,600 |
| Mean | 504,200 | 349,000 | 340,400 | 457,600 | 325,200 | 270,700 |
| No home equity (%) | 3 | 4 | 6 | 3 | 4 | 6 |
| N | 1,600 | 574 | 173 | 2,624 | 657 | 182 |
| Unmarried in 1992 | ||||||
| 10th percentile | 1,700 | 0 | 0 | 1,700 | 0 | 0 |
| 25th percentile | 35,800 | 15,500 | 11,000 | 34,600 | 15,500 | 8,400 |
| 50th percentile | 138,500 | 92,900 | 57,400 | 136,800 | 88,700 | 71,600 |
| 75th percentile | 359,800 | 235,700 | 149,300 | 347,200 | 234,700 | 161,100 |
| 90th percentile | 800,700 | 462,500 | 368,300 | 800,700 | 462,500 | 368,300 |
| Mean | 398,200 | 225,200 | 167,700 | 388,100 | 217,200 | 180,900 |
| No home equity (%) | 8 | 11 | 15 | 8 | 11 | 17 |
| N | 461 | 151 | 59 | 493 | 136 | 51 |
| Married in 1992 | ||||||
| 10th percentile | 60,000 | 41,000 | 35,200 | 47,300 | 34,900 | 14,300 |
| 25th percentile | 134,400 | 99,900 | 95,100 | 118,300 | 76,900 | 68,100 |
| 50th percentile | 252,100 | 226,400 | 250,900 | 235,300 | 189,900 | 187,500 |
| 75th percentile | 548,300 | 453,900 | 474,200 | 488,600 | 405,000 | 408,500 |
| 90th percentile | 1,153,500 | 803,900 | 1,094,200 | 974,800 | 788,600 | 702,400 |
| Mean | 1,100 | 400 | 100 | 2,100 | 500 | 100 |
| No home equity (%) | 1 | 2 | 2 | 2 | 2 | 1 |
| N | 1,139 | 423 | 114 | 2,131 | 521 | 131 |
| SOURCE: Author's computations from the 1992-2012 waves of the HRS. NOTES: The table compares 1992 household wealth for people who developed disabilities between 2002 and 2012 and those who did not. Estimates were rounded to the nearest $100 and based on a sample of respondents ages 51-59 in 1992 who did not report any work-related disabilities at that time or any ADL or IADL limitations before the 2004 interview. Analyses that considered a spouse's limitations were further restricted to respondents whose spouse did not report any work-related disabilities in 1992 or any ADL or IADL limitations before the 2004 interview. See the note to Table A-1 for definitions. |
||||||
| TABLE A-8. Components of 1992 Household Wealth by Future Disability Status, Adults Ages 51-59 in 1992 with No Limitations from 1992 to 2002 (adjusted for household size, 2015 constant dollars) |
||||||
|---|---|---|---|---|---|---|
| Own or Spouse's Disability | Own Disability Only | |||||
| No Limitations | Any Limitations | Two or More ADL Limitations |
No Limitations | Any Limitations | Two or More ADL Limitations |
|
| Housing wealth | ||||||
| 10th percentile | 0 | 0 | 0 | 0 | 0 | 0 |
| 25th percentile | 31,100 | 26,300 | 23,900 | 35,800 | 25,100 | 13,100 |
| 50th percentile | 91,900 | 83,600 | 72,900 | 89,600 | 68,100 | 59,700 |
| 75th percentile | 167,200 | 152,900 | 152,900 | 160,700 | 143,600 | 143,300 |
| 90th percentile | 301,000 | 274,700 | 290,300 | 286,500 | 262,800 | 235,300 |
| Mean | 137,700 | 122,800 | 114,500 | 129,500 | 113,400 | 100,500 |
| No home equity (%) | 11 | 14 | 20 | 11 | 16 | 19 |
| Financial wealth | ||||||
| 10th percentile | 0 | 0 | 0 | 0 | 0 | 0 |
| 25th percentile | 11,800 | 6,000 | 2,300 | 11,800 | 3,000 | 1,200 |
| 50th percentile | 59,700 | 43,000 | 22,700 | 59,100 | 32,300 | 27,400 |
| 75th percentile | 181,600 | 130,800 | 103,900 | 171,500 | 118,300 | 118,300 |
| 90th percentile | 405,000 | 264,600 | 270,000 | 370,300 | 261,600 | 267,600 |
| Mean | 181,700 | 111,300 | 93,300 | 164,700 | 105,400 | 84,900 |
| No home equity (%) | 4 | 6 | 9 | 3 | 5 | 8 |
| Other household wealth | ||||||
| 10th percentile | 2,500 | 1,800 | 600 | 3,400 | 1,700 | 600 |
| 25th percentile | 8,400 | 8,400 | 6,000 | 9,000 | 6,900 | 5,100 |
| 50th percentile | 23,900 | 17,900 | 17,900 | 23,700 | 16,700 | 13,500 |
| 75th percentile | 82,400 | 57,300 | 71,700 | 77,600 | 59,700 | 42,400 |
| 90th percentile | 322,500 | 280,700 | 390,100 | 322,500 | 280,700 | 207,900 |
| Mean | 184,800 | 115,000 | 132,600 | 163,400 | 106,400 | 85,200 |
| No home equity (%) | 16 | 17 | 18 | 14 | 16 | 21 |
| N | 1,600 | 574 | 173 | 2,624 | 657 | 182 |
| SOURCE: Author's computations from the 1992-2012 waves of the HRS. NOTES: The table compares 1992 household wealth for people who developed disabilities between 2002 and 2012 and those who did not. Estimates were rounded to the nearest $100 and based on a sample of respondents ages 51-59 in 1992 who did not report any work-related disabilities at that time or any ADL or IADL limitations before the 2004 interview. Analyses that considered a spouse's limitations were further restricted to respondents whose spouse did not report any work-related disabilities in 1992 or any ADL or IADL limitations before the 2004 interview. See the note to Table A-1 for information about how limitations were defined and the note to Table A-2 for information about how household wealth was defined. |
||||||
| TABLE A-9. Components of 1992 Household Wealth by 1992 Marital Status and Future Disability Status, Adults Ages 51-59 in 1992 with No Limitations from 1992 to 2002 (adjusted for household size, 2015 constant dollars) |
||||||
|---|---|---|---|---|---|---|
| Unmarried | Married | |||||
| No Limitations | Any Limitations | Two or More ADL Limitations |
No Limitations | Any Limitations | Two or More ADL Limitations |
|
| Housing wealth | ||||||
| 10th percentile | 0 | 0 | 0 | 11,900 | 3,600 | 19,100 |
| 25th percentile | 0 | 0 | 0 | 52,600 | 47,800 | 47,800 |
| 50th percentile | 50,700 | 25,300 | 21,100 | 96,800 | 93,200 | 89,600 |
| 75th percentile | 135,100 | 118,300 | 126,700 | 179,200 | 156,500 | 179,200 |
| 90th percentile | 253,400 | 226,400 | 219,600 | 333,300 | 290,300 | 304,600 |
| Mean | 108,200 | 83,900 | 71,600 | 149,500 | 136,000 | 137,500 |
| No home equity (%) | 22 | 25 | 32 | 6 | 10 | 12 |
| Financial wealth | ||||||
| 10th percentile | -1,000 | 0 | -300 | 2,400 | 0 | 0 |
| 25th percentile | 1,400 | 200 | 0 | 18,200 | 12,600 | 4,200 |
| 50th percentile | 30,400 | 15,200 | 6,400 | 70,500 | 57,600 | 40,900 |
| 75th percentile | 118,300 | 76,000 | 59,100 | 200,400 | 161,300 | 133,800 |
| 90th percentile | 312,500 | 208,800 | 208,800 | 426,800 | 284,300 | 270,400 |
| Mean | 146,800 | 70,100 | 60,000 | 193,900 | 125,700 | 113,600 |
| No home equity (%) | 10 | 19 | 24 | 2 | 2 | 3 |
| Other household wealth | ||||||
| 10th percentile | 0 | 0 | 0 | 6,000 | 3,600 | 3,000 |
| 25th percentile | 3,400 | 1,700 | 1,000 | 11,900 | 10,800 | 9,000 |
| 50th percentile | 11,800 | 8,400 | 8,400 | 27,500 | 21,500 | 23,900 |
| 75th percentile | 37,200 | 22,000 | 15,200 | 99,100 | 71,700 | 137,400 |
| 90th percentile | 185,800 | 80,200 | 33,800 | 388,200 | 379,900 | 583,000 |
| Mean | 133,100 | 63,200 | 49,300 | 204,500 | 129,000 | 176,700 |
| No home equity (%) | 35 | 43 | 46 | 8 | 9 | 6 |
| N | 493 | 136 | 51 | 1,139 | 423 | 114 |
| SOURCE: Author's computations from the 1992-2012 waves of the HRS. NOTES: The table compares 1992 household wealth for people who developed disabilities between 2002 and 2012 and those who did not. Estimates were rounded to the nearest $100 and based on a sample of 10,294 respondents ages 65 and older and living in the community in 2012. For married adults, disability status refers to a respondent's or spouse's limitations, and tabulations were further restricted to respondents whose spouse did not report any work-related disabilities in 1992 or any ADL or IADL limitations before the 2004 interview. See the note to Table A-1 for information about how limitations were defined and the note to Table A-2 for information about how household wealth was defined. |
||||||
| TABLE A-10. Components of 1993 Household Wealth by Future Disability Status and Nursing Home Care, Adults Ages 70-75 with No Limitations in 1993 (adjusted for household size, 2015 constant dollars) |
|||||
|---|---|---|---|---|---|
| No Limitations | Any Limitations | Two or More ADL Limitations |
90 or More Days of Nursing Home Care |
Ever Receive Medicaid-Financed Nursing Home Care |
|
| Total household wealth | |||||
| 10th percentile | 11,800 | 11,000 | 9,800 | 8,200 | 0 |
| 25th percentile | 75,000 | 67,900 | 58,800 | 63,200 | 11,000 |
| 50th percentile | 177,100 | 164,800 | 149,000 | 149,000 | 77,500 |
| 75th percentile | 355,900 | 363,000 | 345,400 | 311,900 | 137,800 |
| 90th percentile | 673,600 | 717,100 | 704,500 | 613,500 | 251,100 |
| Mean | 316,600 | 302,800 | 295,300 | 260,000 | 127,200 |
| Housing wealth | |||||
| 10th percentile | 0 | 0 | 0 | 0 | 0 |
| 25th percentile | 33,600 | 37,800 | 31,200 | 28,300 | 0 |
| 50th percentile | 84,800 | 82,600 | 84,800 | 79,200 | 50,900 |
| 75th percentile | 160,700 | 141,400 | 139,400 | 135,700 | 101,700 |
| 90th percentile | 248,400 | 226,200 | 226,200 | 226,200 | 160,700 |
| Mean | 117,500 | 115,700 | 115,900 | 105,500 | 71,600 |
| No home equity (%) | 17 | 17 | 18 | 20 | 32 |
| Financial wealth | |||||
| 10th percentile | 0 | 0 | 0 | 0 | -100 |
| 25th percentile | 3,000 | 2,300 | 1,500 | 2,100 | 0 |
| 50th percentile | 30,500 | 29,000 | 25,300 | 23,200 | 2,900 |
| 75th percentile | 128,200 | 112,600 | 105,500 | 98,100 | 27,900 |
| 90th percentile | 313,200 | 280,500 | 252,800 | 232,000 | 65,000 |
| Mean | 114,000 | 102,100 | 96,600 | 88,200 | 37,500 |
| Other household wealth | |||||
| 10th percentile | 0 | 500 | 300 | 0 | 0 |
| 25th percentile | 4,100 | 4,300 | 3,800 | 3,400 | 300 |
| 50th percentile | 13,000 | 13,000 | 12,200 | 10,700 | 4,800 |
| 75th percentile | 33,900 | 42,100 | 36,500 | 27,700 | 13,000 |
| 90th percentile | 168,100 | 234,600 | 246,000 | 156,600 | 24,100 |
| Mean | 85,100 | 85,000 | 82,800 | 66,200 | 18,000 |
| N | 761 | 1,669 | 1,023 | 600 | 274 |
| SOURCE: Author's computations from the 1993-2012 waves of the HRS. NOTES: The table compares 1993 household wealth for people who developed disabilities or received nursing home care by 2012 and those who did not. Estimates were rounded to the nearest $100 and based on a sample of respondents ages 70-75 in 1993 who did not report any ADL or IADL limitations at that time and whose spouse (if married) did not report any limitations. For married adults, disability status refers to a respondent's or spouse's limitations, and tabulations were future restricted to respondents whose spouse did not report any ADL or IADL limitations in 1993. |
|||||
| TABLE A-11. Components of 1993 Household Wealth by Future Disability Status and Nursing Home Care, Adults Ages 70-75 with No Limitations in 1993 (adjusted for household size, 2015 constant dollars) |
|||||
|---|---|---|---|---|---|
| No Limitations | Any Limitations | Two or More ADL Limitations |
90 or More Days of Nursing Home Care |
Ever Receive Medicaid-Financed Nursing Home Care |
|
| Total household wealth | |||||
| 10th percentile | 18,100 | 8,200 | 8,200 | 6,100 | 0 |
| 25th percentile | 80,400 | 58,900 | 53,600 | 58,800 | 8,200 |
| 50th percentile | 188,500 | 154,700 | 138,000 | 142,200 | 72,100 |
| 75th percentile | 378,900 | 337,900 | 324,800 | 296,100 | 137,800 |
| 90th percentile | 724,900 | 698,600 | 643,800 | 555,600 | 241,500 |
| Mean | 323,400 | 293,000 | 274,200 | 251,600 | 119,100 |
| Housing wealth | |||||
| 10th percentile | 0 | 0 | 0 | 0 | 0 |
| 25th percentile | 39,600 | 31,200 | 27,700 | 27,700 | 0 |
| 50th percentile | 84,800 | 82,000 | 82,000 | 79,200 | 47,500 |
| 75th percentile | 158,300 | 141,400 | 139,400 | 135,700 | 101,700 |
| 90th percentile | 246,000 | 226,200 | 226,200 | 226,200 | 155,800 |
| Mean | 117,600 | 115,000 | 111,500 | 104,900 | 68,900 |
| No home equity (%) | 15 | 19 | 20 | 21 | 34 |
| Financial wealth | |||||
| 10th percentile | 0 | 0 | 0 | 0 | 0 |
| 25th percentile | 4,200 | 1,700 | 1,200 | 1,700 | 0 |
| 50th percentile | 34,800 | 26,700 | 21,900 | 18,900 | 2,500 |
| 75th percentile | 133,400 | 103,300 | 86,600 | 82,000 | 27,800 |
| 90th percentile | 330,000 | 257,500 | 232,000 | 220,900 | 57,400 |
| Mean | 116,600 | 97,000 | 91,400 | 83,900 | 34,900 |
| Other household wealth | |||||
| 10th percentile | 1,000 | 0 | 0 | 0 | 0 |
| 25th percentile | 5,600 | 3,500 | 3,300 | 3,300 | 100 |
| 50th percentile | 14,800 | 11,600 | 10,900 | 9,800 | 4,100 |
| 75th percentile | 41,000 | 36,100 | 27,900 | 24,600 | 12,300 |
| 90th percentile | 199,200 | 216,700 | 187,600 | 119,700 | 23,000 |
| Mean | 89,200 | 81,000 | 71,400 | 62,800 | 15,300 |
| N | 1,051 | 1,408 | 815 | 549 | 254 |
| SOURCE: Author's computations from the 1993-2012 waves of the HRS. NOTES: The table compares 1993 household wealth for people who developed disabilities or received nursing home care by 2012 and those who did not. Estimates were rounded to the nearest $100 and based on a sample of respondents ages 70-75 in 1993 who did not report any ADL or IADL limitations at that time. For married adults, disability status refers to a respondent's or spouse's limitations, and tabulations were further restricted to respondents whose spouse did not report any ADL or IADL limitations in 1993. See the notes to Table A-1 and Table A-2 for additional information. |
|||||
| TABLE A-12. Components of 1993 Household Wealth by Future Disability Status and Nursing Home Care, Adults Ages 70-75 with No Limitations from 1993 to 2000 (adjusted for household size, 2015 constant dollars) |
|||||
|---|---|---|---|---|---|
| No Limitations | Any Limitations | Two or More ADL Limitations |
90 or More Days of Nursing Home Care |
Ever Receive Medicaid-Financed Nursing Home Care |
|
| Total household wealth | |||||
| 10th percentile | 11,800 | 11,000 | 10,200 | 4,800 | 0 |
| 25th percentile | 75,000 | 72,200 | 72,100 | 66,100 | 11,000 |
| 50th percentile | 177,100 | 180,400 | 172,900 | 152,700 | 79,600 |
| 75th percentile | 355,900 | 401,900 | 405,500 | 314,900 | 155,700 |
| 90th percentile | 673,600 | 713,300 | 815,900 | 643,700 | 366,200 |
| Mean | 316,600 | 308,100 | 314,200 | 262,100 | 181,400 |
| Housing wealth | |||||
| 10th percentile | 0 | 0 | 0 | 0 | 0 |
| 25th percentile | 33,600 | 28,300 | 23,200 | 9,800 | 0 |
| 50th percentile | 84,800 | 82,000 | 84,800 | 73,800 | 55,400 |
| 75th percentile | 160,700 | 147,600 | 147,600 | 142,700 | 113,100 |
| 90th percentile | 248,400 | 242,800 | 243,100 | 226,200 | 224,700 |
| Mean | 117,500 | 111,600 | 112,300 | 102,000 | 81,600 |
| No home equity (%) | 17 | 20 | 23 | 25 | 36 |
| Financial wealth | |||||
| 10th percentile | 0 | 0 | 0 | 0 | -100 |
| 25th percentile | 3,000 | 4,600 | 3,000 | 3,400 | 0 |
| 50th percentile | 30,500 | 31,500 | 31,300 | 29,500 | 4,100 |
| 75th percentile | 128,200 | 122,900 | 122,900 | 98,600 | 40,200 |
| 90th percentile | 313,200 | 279,500 | 266,500 | 222,900 | 98,600 |
| Mean | 114,000 | 104,400 | 101,700 | 94,400 | 65,600 |
| Other household wealth | |||||
| 10th percentile | 0 | 0 | 0 | 0 | 0 |
| 25th percentile | 4,100 | 3,700 | 3,300 | 3,300 | 0 |
| 50th percentile | 13,000 | 13,100 | 13,100 | 12,900 | 5,800 |
| 75th percentile | 33,900 | 54,600 | 59,000 | 27,900 | 16,100 |
| 90th percentile | 168,100 | 253,700 | 299,500 | 167,300 | 42,100 |
| Mean | 85,100 | 92,100 | 100,200 | 65,700 | 34,100 |
| N | 761 | 515 | 301 | 255 | 97 |
| SOURCE: Author's computations from the 1993-2012 waves of the HRS. NOTES: The table compares 1993 household wealth for people who developed disabilities or received nursing home care between 2000 and 2012 and those who did not. Estimates were rounded to the nearest $100 and based on a sample of respondents ages 70-75 in 1993 who did not report any ADL or IADL limitations from the 1993-2000 interviews, and whose spouse (if married) did not report any limitations during that period. |
|||||
| TABLE A-13. Estimates of the Relationship between the Onset of Two or More ADL Limitations and Household Wealth for Adults Ages 51-59 in 1992 | ||||||||
|---|---|---|---|---|---|---|---|---|
| Total Household Wealth | Housing Wealth | |||||||
| Coef. | S.E. | Coef. | S.E. | Coef. | S.E. | Coef. | S.E. | |
| Waves before Disability Onset | ||||||||
| 5 | -0.717** | 0.090 | -0.396** | 0.079 | -0.788** | 0.131 | -0.467** | 0.120 |
| 4 | -0.673** | 0.154 | -0.383** | 0.137 | -0.740** | 0.226 | -0.479* | 0.208 |
| 3 | -1.014** | 0.144 | -0.727** | 0.128 | -1.028** | 0.211 | -0.787** | 0.194 |
| 2 | -1.035** | 0.140 | -0.705** | 0.124 | -0.972** | 0.204 | -0.689** | 0.188 |
| 1 | -1.089** | 0.139 | -0.754** | 0.124 | -1.087** | 0.204 | -0.818** | 0.187 |
| Disability Onset | -1.428** | 0.134 | -1.076** | 0.119 | -1.462** | 0.195 | -1.173** | 0.180 |
| Waves after Onset | ||||||||
| 1 | -1.530** | 0.151 | -1.098** | 0.134 | -1.701** | 0.220 | -1.284** | 0.203 |
| 2 | -1.493** | 0.175 | -0.989** | 0.155 | -1.813** | 0.256 | -1.297** | 0.235 |
| 3 | -1.900** | 0.111 | -1.335** | 0.099 | -1.986** | 0.163 | -1.392** | 0.150 |
| Age | 0.001 | 0.007 | 0.007 | 0.006 | 0.003 | 0.010 | 0.009 | 0.009 |
| Female | 0.052 | 0.033 | 0.308** | 0.050 | ||||
| Education | ||||||||
| Did not complete high school | -1.379** | 0.046 | -1.419** | 0.069 | ||||
| [Ref: High school graduate] | ||||||||
| Bachelor's degree | 0.737** | 0.049 | 0.683** | 0.075 | ||||
| Postgraduate degree | 0.862** | 0.052 | 0.879** | 0.079 | ||||
| Race and ethnicity | ||||||||
| [Ref: NonHispanic White] | ||||||||
| African American | -1.608** | 0.046 | -1.354** | 0.069 | ||||
| Hispanic | -1.574** | 0.067 | -1.768** | 0.102 | ||||
| Other race | -0.840** | 0.118 | -1.382** | 0.179 | ||||
| Marital Status | ||||||||
| [Ref: Married] | ||||||||
| Divorced or separated | -1.694** | 0.046 | -2.967** | 0.071 | ||||
| Widowed | -0.990** | 0.054 | -1.735** | 0.082 | ||||
| Never married | -1.733** | 0.080 | -2.938** | 0.122 | ||||
| Year | ||||||||
| 1992 | -0.385* | 0.163 | -0.235 | 0.145 | -0.407 | 0.238 | -0.311 | 0.219 |
| 1994 | -0.144 | 0.153 | -0.037 | 0.136 | -0.298 | 0.223 | -0.243 | 0.206 |
| 1996 | -0.129 | 0.142 | -0.045 | 0.126 | -0.250 | 0.208 | -0.214 | 0.192 |
| 1998 | -0.050 | 0.133 | 0.024 | 0.118 | 0.026 | 0.194 | 0.061 | 0.179 |
| 2000 | 0.108 | 0.124 | 0.153 | 0.110 | 0.161 | 0.181 | 0.167 | 0.167 |
| 2002 | 0.097 | 0.115 | 0.132 | 0.102 | 0.256 | 0.167 | 0.257 | 0.154 |
| 2004 | 0.138 | 0.107 | 0.169 | 0.095 | 0.373* | 0.157 | 0.367* | 0.145 |
| 2006 | 0.234* | 0.102 | 0.240** | 0.090 | 0.544** | 0.149 | 0.527** | 0.137 |
| 2008 | 0.081 | 0.098 | 0.091 | 0.086 | 0.383** | 0.142 | 0.373** | 0.131 |
| 2010 | -0.034 | 0.095 | -0.025 | 0.084 | 0.178 | 0.139 | 0.173 | 0.128 |
| [Ref: 2012] | ||||||||
| Intercept | 11.827** | 0.520 | 12.168** | 0.465 | 9.723** | 0.760 | 10.271** | 0.706 |
| Adjusted R-Squared | 0.027 | 0.238 | 0.017 | 0.169 | ||||
| SOURCE: Author's computations from the 1992-2012 waves of the HRS. NOTES: Estimates came from ordinary least squares regressions of the natural logarithm of total household wealth and the natural logarithm of housing wealth. We estimated the regressions on a pooled sample of 26,763 observations from 1992 to 2012 on respondents ages 51-59 in 1992 who did not report any work disabilities or any ADL or IADL limitations in 1992 and whose spouse (if married) did not report any disabilities or limitations in 1992. Total household wealth included the value of housing, other real estate, businesses, vehicles, and financial assets, net of debt. Housing wealth included the value of first and second homes, net of any housing debt (including outstanding mortgages, home loans, and home equity lines of credit). Both measures were adjusted for household size and expressed in constant 2015 dollars. The analysis classified respondents as having 2 or more ADL limitations if they or their spouse reported any difficulty with at least 2 of the following activities: dressing, walking across a room, bathing or showering, eating, getting in or out of bed, or using the toilet. Only limitations expected to last at least 3 months that resulted from health or memory problems were considered. Coef.=coefficient; S.E. = standard error. * 0.01 < p < 0.05. ** p < 0.01. |
||||||||
| TABLE A-14. Estimates of the Relationship between the Onset of Two or More ADL Limitations and Household Wealth for Adults Ages 70-75 in 1993 | ||||||||
|---|---|---|---|---|---|---|---|---|
| Total Household Wealth | Housing Wealth | |||||||
| Coef. | S.E. | Coef. | S.E. | Coef. | S.E. | Coef. | S.E. | |
| Waves before Disability Onset | ||||||||
| 5 | 0.159 | 0.101 | 0.119 | 0.089 | 0.166 | 0.160 | 0.014 | 0.150 |
| 4 | 0.150 | 0.139 | 0.177 | 0.122 | 0.186 | 0.220 | 0.083 | 0.206 |
| 3 | -0.080 | 0.128 | -0.083 | 0.113 | -0.047 | 0.202 | -0.221 | 0.190 |
| 2 | -0.127 | 0.117 | -0.091 | 0.102 | -0.095 | 0.184 | -0.252 | 0.172 |
| 1 | -0.467** | 0.107 | -0.415** | 0.095 | -0.442** | 0.169 | -0.642** | 0.159 |
| Disability Onset | -0.940** | 0.106 | -0.858** | 0.094 | -1.099** | 0.167 | -1.290** | 0.158 |
| Waves after Onset | ||||||||
| 1 | -1.058** | 0.126 | -0.866** | 0.111 | -1.117** | 0.199 | -1.138** | 0.187 |
| 2 | -0.950** | 0.149 | -0.766** | 0.131 | -1.041** | 0.235 | -1.031** | 0.221 |
| 3 | -0.963** | 0.114 | -0.748** | 0.100 | -0.641** | 0.180 | -0.614** | 0.169 |
| Age | -0.089** | 0.015 | -0.060** | 0.013 | -0.294** | 0.024 | -0.231** | 0.022 |
| Female | 0.268** | 0.051 | 0.167 | 0.086 | ||||
| Education | ||||||||
| Did not complete high school | -1.229** | 0.055 | -0.938** | 0.092 | ||||
| [Ref: High school graduate] | ||||||||
| Some college | 0.547** | 0.156 | 0.875** | 0.263 | ||||
| Bachelor's degree | 0.822** | 0.078 | 0.723** | 0.132 | ||||
| Postgraduate degree | 1.004** | 0.098 | 1.094** | 0.164 | ||||
| Race and ethnicity | ||||||||
| [Ref: NonHispanic White] | ||||||||
| African American | -2.169** | 0.075 | -1.057** | 0.127 | ||||
| Hispanic | -2.068** | 0.107 | -1.298** | 0.179 | ||||
| Other race | -3.523** | 0.213 | -3.497** | 0.358 | ||||
| Marital Status | ||||||||
| [Ref: Married] | ||||||||
| Divorced or separated | -2.317** | 0.103 | -4.505** | 0.174 | ||||
| Widowed | -0.838** | 0.055 | -1.909** | 0.092 | ||||
| Never married | -2.133** | 0.145 | -5.014** | 0.245 | ||||
| Year | ||||||||
| 1993 | -1.530** | 0.314 | -1.141** | 0.277 | -2.990** | 0.495 | -2.471** | 0.465 |
| 1995 | -1.144** | 0.290 | -0.829** | 0.255 | -2.445** | 0.457 | -2.030** | 0.429 |
| 1998 | -0.867** | 0.262 | -0.605** | 0.231 | -1.752** | 0.413 | -1.403** | 0.388 |
| 2000 | -0.603* | 0.239 | -0.402 | 0.210 | -1.247** | 0.377 | -0.983** | 0.354 |
| 2002 | -0.399 | 0.217 | -0.276 | 0.191 | -0.872* | 0.343 | -0.709* | 0.322 |
| 2004 | -0.244 | 0.201 | -0.132 | 0.177 | -0.519 | 0.317 | -0.374 | 0.298 |
| 2006 | -0.170 | 0.189 | -0.091 | 0.166 | -0.231 | 0.298 | -0.134 | 0.279 |
| 2008 | 0.082 | 0.182 | 0.133 | 0.159 | -0.052 | 0.287 | 0.002 | 0.268 |
| 2010 | 0.060 | 0.184 | 0.073 | 0.162 | 0.489 | 0.291 | 0.512 | 0.272 |
| [Ref: 2012] | ||||||||
| Intercept | 19.148** | 1.363 | 17.923** | 1.204 | 33.635** | 2.149 | 30.015** | 2.027 |
| Adjusted R-squared | 0.0198 | 0.246 | 0.035 | 0.154 | ||||
| SOURCE: Author's computations from the 1993-2012 waves of the HRS. NOTES: Estimates came from ordinary least squares regressions of the natural logarithm of total household wealth and the natural logarithm of housing wealth. We estimated the regressions on a pooled sample of 14,717 observations from 1993 to 2012 on respondents ages 70-75 in 1993 who did not report any ADL or IADL limitations in 1993 and whose spouse (if married) did not report any disabilities or limitations in 1993. Total household wealth included the value of housing, other real estate, businesses, vehicles, and financial assets, net of debt. Housing wealth included the value of first and second homes, net of any housing debt (including outstanding mortgages, home loans, and home equity lines of credit). Both measures were adjusted for household size and expressed in constant 2015 dollars. The analysis classified respondents as having 2 or more ADL limitations if they or their spouse reported any difficulty with at least 2 of the following activities: dressing, walking across a room, bathing or showering, eating, getting in or out of bed, or using the toilet. Only limitations expected to last at least 3 months that resulted from health or memory problems were considered. Coef.=coefficient; S.E. = standard error. * 0.01 < p < 0.05. ** p < 0.01. |
||||||||
| TABLE A-15. Estimates of the Relationship between Nursing Home Entry and Household Wealth for Adults Ages 70-75 in 1993 | ||||||||
|---|---|---|---|---|---|---|---|---|
| Total Household Wealth | Housing Wealth | |||||||
| Coef. | S.E. | Coef. | S.E. | Coef. | S.E. | Coef. | S.E. | |
| Waves before Disability Onset | ||||||||
| 5 | 0.102 | 0.096 | 0.034 | 0.084 | -0.011 | 0.150 | 0.002 | 0.142 |
| 4 | -0.010 | 0.150 | -0.044 | 0.131 | -0.228 | 0.235 | -0.201 | 0.221 |
| 3 | -0.343* | 0.143 | -0.323** | 0.125 | -0.666** | 0.224 | -0.577** | 0.211 |
| 2 | -0.549** | 0.139 | -0.497** | 0.122 | -0.740** | 0.219 | -0.609** | 0.205 |
| 1 | -0.951** | 0.140 | -0.864** | 0.123 | -1.628** | 0.220 | -1.491** | 0.206 |
| Disability Onset | -2.138** | 0.156 | -1.962** | 0.137 | -3.541** | 0.245 | -3.319** | 0.230 |
| Waves after Onset | ||||||||
| 1 | -2.663** | 0.210 | -2.352** | 0.184 | -3.765** | 0.330 | -3.385** | 0.310 |
| 2 | -2.503** | 0.286 | -2.201** | 0.251 | -3.224** | 0.450 | -2.856** | 0.423 |
| 3 | -2.197** | 0.257 | -1.712** | 0.226 | -2.507** | 0.405 | -2.015** | 0.381 |
| Age | -0.075** | 0.015 | -0.051** | 0.013 | -0.267** | 0.023 | -0.215** | 0.022 |
| Female | 0.266** | 0.051 | 0.173* | 0.085 | ||||
| Education | ||||||||
| Did not complete high school | -1.266** | 0.054 | -0.986** | 0.091 | ||||
| [Ref: High school graduate] | ||||||||
| Some college | 0.529** | 0.155 | 0.843** | 0.261 | ||||
| Bachelor's degree | 0.781** | 0.078 | 0.647** | 0.131 | ||||
| Postgraduate degree | 0.962** | 0.097 | 1.020** | 0.163 | ||||
| Race and ethnicity | ||||||||
| [Ref: NonHispanic White] | ||||||||
| African American | -2.175** | 0.074 | -1.066** | 0.125 | ||||
| Hispanic | -2.159** | 0.106 | -1.440** | 0.178 | ||||
| Other race | -3.490** | 0.211 | -3.468** | 0.355 | ||||
| Marital Status | ||||||||
| [Ref: Married] | ||||||||
| Divorced or separated | -2.263** | 0.102 | -4.427** | 0.172 | ||||
| Widowed | -0.738** | 0.054 | -1.753** | 0.090 | ||||
| Never married | -1.982** | 0.144 | -4.791** | 0.242 | ||||
| Year | ||||||||
| 1993 | -1.374** | 0.310 | -1.029** | 0.273 | -2.854** | 0.488 | -2.445** | 0.459 |
| 1995 | -1.056** | 0.286 | -0.777** | 0.252 | -2.396** | 0.450 | -2.086** | 0.423 |
| 1998 | -0.838** | 0.259 | -0.597** | 0.228 | -1.772** | 0.408 | -1.508** | 0.383 |
| 2000 | -0.616** | 0.237 | -0.425* | 0.208 | -1.321** | 0.372 | -1.127** | 0.350 |
| 2002 | -0.442* | 0.216 | -0.320 | 0.189 | -0.964** | 0.339 | -0.857** | 0.319 |
| 2004 | -0.276 | 0.200 | -0.164 | 0.176 | -0.568 | 0.315 | -0.472 | 0.296 |
| 2006 | -0.191 | 0.188 | -0.113 | 0.165 | -0.257 | 0.296 | -0.202 | 0.278 |
| 2008 | 0.069 | 0.181 | 0.123 | 0.159 | -0.049 | 0.285 | -0.024 | 0.267 |
| 2010 | 0.071 | 0.183 | 0.082 | 0.160 | 0.531 | 0.288 | 0.535* | 0.270 |
| [Ref: 2012] | ||||||||
| Intercept | 18.007** | 1.354 | 17.135** | 1.194 | 31.579** | 2.130 | 28.799** | 2.010 |
| Adjusted R-squared | 0.036 | 0.260 | 0.056 | 0.170 | ||||
| SOURCE: Author's computations from the 1993-2012 waves of the HRS. NOTES: Estimates came from ordinary least squares regressions of the natural logarithm of total household wealth and the natural logarithm of housing wealth. We estimated the regressions on a pooled sample of 14,717 observations from 1993 to 2012 on respondents ages 70-75 in 1993 who did not report any ADL or IADL limitations in 1993 and whose spouse (if married) did not report any limitations in 1993. Total household wealth included the value of housing, other real estate, businesses, vehicles, and financial assets, net of debt. Housing wealth included the value of first and second homes, net of any housing debt (including outstanding mortgages, home loans, and home equity lines of credit). Both measures were adjusted for household size and expressed in constant 2015 dollars. The analysis considered only nursing home care that lasted at least 90 days. Coef.=coefficient; S.E. = standard error. * 0.01 < p < 0.05. ** p < 0.01. |
||||||||
| TABLE A-16. Estimates of the Relationship between the Initial Receipt of Medicaid-Financed Nursing Home Care and Household Wealth for Adults Ages 70-75 in 1993 | ||||||||
|---|---|---|---|---|---|---|---|---|
| Total Household Wealth | Housing Wealth | |||||||
| Coef. | S.E. | Coef. | S.E. | Coef. | S.E. | Coef. | S.E. | |
| Waves before Disability Onset | ||||||||
| 5 | -1.683** | 0.133 | -1.114** | 0.119 | -1.922** | 0.216 | -1.349** | 0.205 |
| 4 | -1.949** | 0.213 | -1.306** | 0.190 | -2.344** | 0.347 | -1.658** | 0.329 |
| 3 | -2.324** | 0.204 | -1.591** | 0.182 | -2.964** | 0.332 | -2.150** | 0.315 |
| 2 | -3.102** | 0.199 | -2.342** | 0.177 | -3.412** | 0.323 | -2.577** | 0.307 |
| 1 | -3.331** | 0.200 | -2.537** | 0.178 | -3.153** | 0.325 | -2.217** | 0.308 |
| Disability Onset | -5.257** | 0.225 | -4.397** | 0.201 | -4.891** | 0.366 | -3.960** | 0.347 |
| Waves after Onset | ||||||||
| 1 | -6.518** | 0.320 | -5.465** | 0.285 | -6.221** | 0.520 | -5.150** | 0.493 |
| 2 | -4.520** | 0.479 | -3.575** | 0.427 | -4.473** | 0.779 | -3.416** | 0.738 |
| 3 | -5.989** | 0.565 | -4.007** | 0.504 | -6.277** | 0.919 | -4.478** | 0.872 |
| Age | -0.071** | 0.014 | -0.056** | 0.013 | -0.276** | 0.023 | -0.231** | 0.022 |
| Female | 0.145** | 0.049 | 0.051 | 0.085 | ||||
| Education | ||||||||
| Did not complete high school | -1.101** | 0.053 | -0.811** | 0.091 | ||||
| [Ref: High school graduate] | ||||||||
| Some college | 0.414** | 0.150 | 0.760** | 0.260 | ||||
| Bachelor's degree | 0.721** | 0.075 | 0.621** | 0.130 | ||||
| Postgraduate degree | 0.895** | 0.094 | 0.983** | 0.163 | ||||
| Race and ethnicity | ||||||||
| [Ref: NonHispanic White] | ||||||||
| African American | -2.031** | 0.072 | -0.934** | 0.125 | ||||
| Hispanic | -2.102** | 0.103 | -1.348** | 0.177 | ||||
| Other race | -3.484** | 0.205 | -3.443** | 0.354 | ||||
| Marital Status | ||||||||
| [Ref: Married] | ||||||||
| Divorced or separated | -2.162** | 0.099 | -4.317** | 0.171 | ||||
| Widowed | -0.678** | 0.052 | -1.709** | 0.090 | ||||
| Never married | -1.796** | 0.140 | -4.660** | 0.242 | ||||
| Year | ||||||||
| 1993 | -1.024** | 0.296 | -0.871** | 0.264 | -2.470** | 0.481 | -2.223** | 0.457 |
| 1995 | -0.716** | 0.273 | -0.612* | 0.243 | -2.017** | 0.444 | -1.857** | 0.421 |
| 1998 | -0.515* | 0.247 | -0.433* | 0.220 | -1.409** | 0.402 | -1.283** | 0.381 |
| 2000 | -0.298 | 0.225 | -0.250 | 0.201 | -0.961** | 0.367 | -0.892* | 0.347 |
| 2002 | -0.151 | 0.205 | -0.151 | 0.183 | -0.627 | 0.334 | -0.628* | 0.316 |
| 2004 | -0.016 | 0.191 | -0.012 | 0.170 | -0.276 | 0.310 | -0.279 | 0.293 |
| 2006 | -0.006 | 0.179 | -0.009 | 0.159 | -0.048 | 0.291 | -0.066 | 0.275 |
| 2008 | 0.239 | 0.173 | 0.225 | 0.154 | 0.101 | 0.281 | 0.058 | 0.266 |
| 2010 | 0.204 | 0.175 | 0.170 | 0.156 | 0.612* | 0.284 | 0.570* | 0.269 |
| [Ref: 2012] | ||||||||
| Intercept | 17.568** | 1.293 | 17.303** | 1.158 | 32.011** | 2.103 | 29.715 | 2.002 |
| Adjusted R-squared | 0.118 | 0.302 | 0.075 | 0.173 | ||||
| SOURCE: Author's computations from the 1992-2012 waves of the HRS. NOTES: Estimates came from ordinary least squares regressions of the natural logarithm of total household wealth and the natural logarithm of housing wealth. We estimated the regressions on a pooled sample of 14,717 observations from 1993 to 2012 on respondents ages 70-75 in 1993 who did not report any work disabilities or any ADL or IADL limitations in 1993 and whose spouse (if married) did not report any disabilities or limitations in 1993. Total household wealth included the value of housing, other real estate, businesses, vehicles, and financial assets, net of debt. Housing wealth included the value of first and second homes, net of any housing debt (including outstanding mortgages, home loans, and home equity lines of credit). Both measures were adjusted for household size and expressed in constant 2015 dollars. Coef.=coefficient; S.E. = standard error. * 0.01 < p < 0.05. ** p < 0.01. |
||||||||
ABOUT THE AUTHOR:
Richard W. Johnson is a senior fellow in the Income and Benefits Policy Center at the Urban Institute, where he directs the Program on Retirement Policy. His current research focuses on older Americans' employment and retirement decisions, LTSS for older adults with disabilities, and state and local pensions. Recent studies have examined job loss at older ages, occupational change after age 50, and the impact of the 2007-2009 recession and its aftermath on older workers and future retirement incomes. He earned his AB from Princeton University and his PhD from the University of Pennsylvania, both in economics.
Where Do People with Disabilities Live?
This report was prepared under contract #HHSP23320100025W1 between the U.S. Department of Health and Human Services (HHS), Office of Disability, Aging and Long-Term Care Policy (DALTCP) and the Urban Institute. For additional information about this subject, you can visit the DALTCP home page at http://aspe.hhs.gov/office-disability-aging-and-long-term-care-policy-daltcp or contact the ASPE Project Officers, John Drabek and Pamela Doty, at HHS/ASPE/DALTCP, Room 424E, H.H. Humphrey Building, 200 Independence Avenue, S.W., Washington, D.C. 20201; John.Drabek@hhs.gov, Pamela.Doty@hhs.gov.
Reports Available
How Much Nursing Home Care Can Home Equity Finance?
- HTML: https://aspe.hhs.gov/basic-report/how-much-nursing-home-care-can-home-equity-finance
- PDF: https://aspe.hhs.gov/pdf-report/how-much-nursing-home-care-can-home-equity-finance
Later-Life Household Wealth Before and After Disability Onset
- HTML: https://aspe.hhs.gov/basic-report/later-life-household-wealth-and-after-disability-onset
- PDF: https://aspe.hhs.gov/pdf-report/later-life-household-wealth-and-after-disability-onset
Older Adults' Living Expenses and the Adequacy of Income Allowances for Medicaid Home and Community-Based Services