
Stephan Lindner
Urban Institute
Printer Friendly Version in PDF Format (39 PDF pages)
ABSTRACT
Older adults who have income and assets have choices should they need long-term services and supports (LTSS). In this paper we estimate the extent to which older adults could potentially use home equity to help pay for nursing home care. By estimating the relationship between home equity and care costs, we provide an upper bound on how much assistance with LTSS home equity might purchase. Using a large sample of older adults from the American Community Survey in 2011, we compare their estimated level of home equity to the cost of nursing home care in their area. We find that the typical (median) older adult is able to purchase just over half a year of care in a private room. However, the median conceals a great deal of variation. For example, 28% of older adults are renters and therefore have no home equity to help pay for LTSS. In addition, those at greatest risk of needing LTSS, such as those age 85 and older, and those with one or more functional limitations, have lower ability to finance LTSS through home equity primarily because they have low rates of homeownership. High home equity levels--and a correspondingly high number of nursing home days that it could finance--are concentrated in a limited number of states and metropolitan areas such as Washington, California, Illinois, Massachusetts or the District of Columbia. By contrast, those living in states and metropolitan areas in the rustbelt and that were hit hard by the recession have low home equity values to spend on nursing home care.
DISCLAIMER: The opinions and views expressed in this report are those of the authors. They do not necessarily reflect the views of the Department of Health and Human Services, the contractor or any other funding organization.
| Older adults who have income and assets have choices should they need long-term services and supports (LTSS). In this paper we estimate the extent to which older adults could potentially use home equity to help pay for nursing home care. By estimating the relationship between home equity and care costs, we provide an upper bound on how much assistance with LTSS home equity might purchase. Using a large sample of older adults from the American Community Survey (ACS) in 2011, we compare their estimated level of home equity to the cost of nursing home care in their area. We find that the typical (median) older adult is able to purchase just over half a year of care in a private room. However, the median conceals a great deal of variation. For example, 28 percent of older adults are renters and therefore have no home equity to help pay for LTSS. In addition, those at greatest risk of needing LTSS, such as those age 85 and older, and those with one or more functional limitations, have lower ability to finance LTSS through home equity primarily because they have low rates of homeownership. High home equity levels--and a correspondingly high number of nursing home days that it could finance--are concentrated in a limited number of states and metropolitan areas such as the District of Columbia, Hawaii and California. By contrast, those living in states and metropolitan areas in the rustbelt and that were hit hard by the recession have low home equity values to spend on nursing home care. For these and other reasons, our estimate may overstate the amount of nursing home care that older adults most likely to use nursing home care could finance via home equity. |
Introduction
One of the most important risks that older people in the United States face is the possibility of becoming disabled and no longer able to live independently. Many elders with a disability continue to reside at home alone or with family and rely exclusively on unpaid help, primarily from family caregivers, for the entirety or some part of the duration of their need for long-term care services and supports (LTSS). At higher disability levels, their likelihood of receiving supplemental paid care increases.1 Using the Urban Institute's Dynamic Simulation of Income Model, Favreault and Dey (2015) estimated that about half (52 percent) of Americans turning 65 today will require high-level LTSS, either paid or unpaid, at some point before they die.2 Many may under-estimate this risk.3 Most will need assistance for less than two years. Among those who ever use paid LTSS, at home or in a nursing home or other residential care facility, about half will receive it for less than a year, whereas a little more than 10 percent will receive it for five years or more. Women have LTSS needs of longer duration compared to men and lower-income elders also tend to need LTSS for longer periods compared to higher-income elders. Unmarried and low-income elders use more paid LTSS relative to married and higher-income elders.
The types and amounts of personal or family financial resources--income, savings, home equity, insurance4--that older persons can draw upon to pay out-of-pocket for LTSS depend not only on their differential income or wealth but also on the type of LTSS they use. Most older adults prefer to remain at home. Elders living at home may need to use much if not all of their monthly income to cover basic living expenses. If they are homeowners, they will likely wish to continue to live in the home, which limits their ability to use their home equity to pay for LTSS. Although a reverse equity mortgage or other home equity line of credit could potentially access some home equity to pay for home and community-based services (HCBS), that amount will likely fall considerably short of the full equity value.
Some older adults move to a residential care setting where they can obtain LTSS when needed. Because such assisted living is typically more expensive than living at home, they may need all of their income and some of their assets to pay for care. If homeowners with no spouse or other family members who need to reside in the home decide to move into an assisted living facility, using home equity--most often by selling the home--to help finance the cost of such care becomes a viable option or, in some cases, a necessity.5
When older adults need more care than can be provided at home or at an assisted living facility, they may move to a nursing home. Although for most this is the least preferred LTSS setting, it is necessary in some situations. Again, using home equity to help finance the cost of such care may be required. Because nursing home care is very expensive, all assets, including home equity, may be used if the stay is long enough. Besides the loss of funds, using home equity to pay for care will make it difficult to return to the community, should functioning improve.
This study examines the distribution of home equity and nursing home costs across individuals and geographic areas to shed light on the potential for home equity to finance LTSS needs.6 Similarly to other studies in this area (e.g., Davidoff 2010), we use conservative, stylized assumptions regarding the amount of equity accessible to homeowners, largely ignoring issues of how and at what cost equity would be accessed. Our results thus represent what is likely a best case scenario for leveraging home equity. At the national level, we investigate how many days of nursing home care older people at different percentiles in the housing equity distribution nominally could finance with home equity. We then explore geographic variation in housing equity and nursing home costs.
It is important to recognize that homeownership and home equity levels vary widely across the population, making it difficult to generalize the extent to which home equity could be used to pay for care. For instance, people with disabilities report much lower home values than people without disabilities (Johnson 2013). Moreover, home equity, housing costs, and LTSS costs vary dramatically across geographic regions within the United States. For example, the cost of nursing home care ranged from less than $200 to more than $400 per day in a nursing home in 2011 (MetLife 2011). Although it might be expected that geographic areas with home values under the national average would also have residential elder care costs lower than the national average, this is not always the case. For example, West Virginia has lower home equity values and higher nursing home costs compared to the national averages. It is also important to bear in mind that our analysis does not adjust for the likelihood of using paid LTSS in various settings, which varies by disability status, marital status, and income/wealth, although as we have seen, the probability of using high-cost LTSS and paying out-of-pocket for all or some of this care varies greatly according to such factors.
Data and Methods
We use the 2011 ACS to obtain home values in various geographic areas. We select people age 65 years of older who do not live in group quarters. The sample has 490,782 adults and includes both homeowners and renters. The ACS asks about ownership and home value at the household level, not the individual level. Renters have zero home equity. We assign ownership to either the head or the spouse of the head of the household. We assign half the home value to the head and half to the spouse if they live together; otherwise, we assign the full home value to the head.7 Although this allocation provides a useful way to compare couples with older adults who live alone, it has limitations. If one spouse is institutionalized, there often is no way to access the home equity without changing the housing arrangement of the spouse that remains in the community. This also applies to children or other caregivers who reside with the person who enters the institution.
We further reduce home values by 8 percent to account for transaction costs (e.g., real estate broker fees, moving expenses).8 Clearly, the decision to use house equity as a financing tool for nursing home care is much more complicated than we assume here. For instance, it might be difficult for homeowners to put their house on the market at a short notice, especially after onset of a serious disability. Because of such complications, we see our analysis as producing estimates that likely overstate the potential for equity financing. We return to possible caveats at the end of this study.
The ACS asks respondents if they have a mortgage on their home, but it does not inquire about the outstanding mortgage value. We therefore impute mortgage values for ACS respondents reporting a mortgage using data from the 2010 wave of the Health and Retirement Study (HRS).9 We then subtract the imputed mortgages from home value to obtain net equity.
We next match the ACS to MetLife's 2011 market survey of long-term care costs (MetLife 2011). MetLife divides the United States into metropolitan areas and "Rest of State" areas (i.e., nonmetropolitan areas not included among the state's metropolitan areas). MetLife conducts telephone interviews for at least ten nursing homes or 15 percent of nursing homes in each area, for a total sample of 2,003 nursing homes.10
The MetLife survey includes 83 metropolitan areas whereas the ACS has 284 metropolitan areas.11 In most cases we are able to match a metropolitan area in the MetLife survey to a metropolitan area in the ACS. Most metropolitan areas are in just one state, but some extend over several states (e.g., District of Columbia or Kansas City). Most of these matches are straightforward because the metropolitan area names in the two surveys are identical or nearly identical.12
We use the matched estimates to calculate the number of days of nursing home care that a person's home value could pay for by dividing net home equity by local nursing home costs.13 We then calculate averages and percentile values separately for home equity, nursing home costs, and days of nursing home care that a person's net equity could pay for. We first calculate these statistics at the national level and then repeat them for each state and each metropolitan/nonmetropolitan area. We use ACS person weights for all of our calculations.
Sample Description
The average age of adults in the sample is 75 years (see Table 1). The majority are female and married. Blacks and Hispanics constitute 8.5 percent and about 7 percent of the sample, respectively. Although it is common for the elderly to be homeowners who have paid off their mortgage, more than one in four older adults do not own a home and more than one-third of homeowners still hold a mortgage. For homeowners with a mortgage, mortgage values are often substantial relative to home values, accounting on average for more than half of home values according to our imputations. The median home value net of mortgage debt is about $74,000 and the spread between the 25th and 75th percentile of home values is $100,000. Nursing home costs are distributed more evenly, and costs for semi-private rooms are somewhat lower than costs for private rooms. These statistics suggest that variation in home value is likely to be a more dominant factor than variation in nursing home costs in determining how much nursing home care home equity can finance.
The lower part of Table 1 shows how nursing home costs, housing values, homeownership rates, mortgage status and mortgage values as a fraction of home values vary across states and metropolitan/nonmetropolitan areas.14 Nursing home costs are essentially equally distributed at the state and metropolitan/nonmetropolitan area level as compared to the individual level because these costs only vary at the geographic level. The spread in homeownership between the 25th and 75th percentile is about 6.5 percentage points at the state level and 9 percentage points at the metropolitan/nonmetropolitan area level. Variation in home values is still substantial at the state and metropolitan/nonmetropolitan level, albeit not as large as at the individual level.
Nationwide Estimates
Table 2 presents the distribution of the population age 65 or older by of days of nursing home care that could be financed by net home equity using estimated local nursing home costs for private rooms.15 Twenty-five percent of the population has no equity or insufficient equity to pay for any care. Those at the 50th percentile could pay for about seven months of care, those at or above the 75th percentile could pay for more than a year of care, and those at or above the 90th percentile could pay for more than two years of care. The table also highlights how skewed the distribution is: adults in the 99th and 99.9th percentile can afford almost eight years and more than 21 years of care, respectively.16
Looking across the various subgroups, the number of days that could be financed by net home equity tends to be somewhat lower for those age 85 or older at lower percentile values but not at higher percentile values. At the 50th percentile, those who are age 85 or older could finance about three months less care than those who are younger. Homeownership for the oldest age group is much lower than for other age groups, contributing to this discrepancy. Married couples can finance more days of nursing home care at lower levels of the distribution than unmarried older adults but the reverse is true for higher values of the home equity distribution. Lower homeownership for nonmarried people appears to contribute much to this discrepancy. People with one or at least two functional limitations,17 African Americans, and especially Hispanics can purchase substantially fewer days of care. For these groups, we also observe lower homeownership rates as compared to the whole sample.
Among homeowners (shown in the lower panel of Table 2), the median number of days that net equity could finance is about one year, similar to the expected duration of nursing home use in remaining life at age 65. Differences between subgroups and the main sample are smaller because of low homeownership rates among these subgroups. For instance, the median value for African American homeowners is 226 days, still less than the 329 days for all homeowners, but a smaller gap between African Americans and nonHispanic Whites than we find for the full population including renters. Furthermore, people age 85 or older who are homeowners can purchase more days of nursing home care at all percentile values than younger homeowners. However, this oldest group of people has a relatively lower rate of homeownership.
Table 3 shows corresponding results using nursing home costs for semi-private rooms. Not surprisingly, choosing a semi-private room would increase the number of days that net home equity could finance, but the benefits are greatest at the upper end of the distribution, where choice of a semi-private room may be less likely. For instance, homeowners at the 90th percentile could pay for a little more than three years of care, about five months more than for a private room, while those at the 25th percentile could pay for about 6.5 months of care, less than a month more than when assuming a private room.
Estimates for States
Figure 1 displays the geographic distribution of median nursing home days that homeowners could finance with their home equity (Table A-2 shows corresponding numbers). The figure suggests a correlation between housing markets and nursing home days. In "rustbelt" states such as Michigan, people can finance fewer days of nursing home care than in states with strong housing markets, for example on the west coast and in the mid-Atlantic region. States with strong declines in home values such as Nevada or Florida also appear to rank toward the bottom of the nursing home days distribution.
Table 4 shows nursing home days, nursing home costs, home values and homeownership rates across states, focusing on the five states with the lowest and highest median days of nursing home care that net equity could finance (Table A-1 and Table A-2 show corresponding statistics for all states). The table shows a wide gap between states: median days that could be financed by net equity ranges from between 122 and 146 in the five lowest states to more than twice that in the five states at the top of the distribution. Comparing nursing home costs and home values (first and second columns), with the exception of Alaska, low per-person home values rather than high nursing home costs are the primary reason why people can buy relatively little nursing home care with their housing wealth in states like New York, West Virginia and Florida. The last column of the table, which shows homeownership rates, reveals that low percentages of people owning a home explain some of these low values, especially for New York.
Looking at the bottom part of the table, nursing home days for homeowners are higher for states at the top and bottom of the distribution compared to nursing home days for all older adults, with values especially high for the top five states. Because of such differences in homeownership across states, some states (like Alaska and West Virginia) appear in both parts of the tables but others do not. For instance, New York is among the bottom five of all states when all older adults are included but not among homeowners because of the low percentage of homeowners in the Empire State. Similarly, California and the District of Columbia are among the top five states for homeowners but not for all older adults because of their lower homeownership rates.
In Figure 2, we show the relationship between median net home equity and median days of potential nursing home care for homeowners across all states (see Table A-2 for corresponding numbers). Binary regression results indicate that a $1,000 increase in net home equity is associated with the ability to purchase slightly more than two days of additional nursing home care.18
Table 4 suggests that homeownership tends to be low in states with high net home equity. Figure 3 illustrates this relationship by displaying median home values for older homeowners and homeownership rates for all states (Table A-1 shows corresponding numbers for all states). The figure displays states with a higher number of homeowners in the sample using proportionately larger circles. A $1,000 higher home value is associated with slightly more than a 0.1 percent lower homeownership percentage, suggesting that high home values can be a barrier to acquiring a home in the first place.
Taken together, our analysis at the state level shows that the ability to use home equity to finance nursing home care differs markedly across states. Homeowners in states with high home values can potentially leverage their home value to finance more nursing home care if needed. However, higher home values also may act as a barrier to obtaining a home in the first place because homeownership rates are lower in states with high home values than in states with low home values.
Estimates for Metropolitan and NonMetropolitan Areas
So far we have looked at variation in home value and nursing home costs at the state level, but the MetLife survey also allows us to further examine metropolitan and nonmetropolitan areas (called "Rest of the State" areas in the MetLife survey).
Table 5 presents estimates for a few of these areas, focusing again on those with the highest and lowest number of nursing home days that median home values could finance (see Table A-3 and Table A-4 for corresponding statistics for all areas). Metropolitan areas are prevalent at both the top and the bottom of the distribution. At the bottom of the distribution are metropolitan areas located in the rustbelt (e.g., Rochester, New York) or hit hard by the decline in the housing market (e.g., Las Vegas, Nevada). Miami even has a median home value of zero because fewer than 50 percent of older adults own a house or report positive home equity in that area.19 By contrast, metropolitan and nonmetropolitan areas at the top of the distribution have high per-person home values ranging from $70,000 to over $250,000.
For homeowners, the contrast between areas at the top and the bottom of the distribution is even more marked. Median days of nursing home that could be financed by home equity ranges from 175 days to 200 days at the bottom of the distribution but exceeds 650 days at the top of the distribution. All of the top five areas are metropolitan areas with very high home values.20
It is also noteworthy that metropolitan areas dominate both the top and the bottom of the distribution of median nursing home days. At the bottom, rustbelt cities such as Pittsburgh and metropolitan areas such as Las Vegas have been hit hard by a declining housing market. At the top, metropolitan areas such as the District of Columbia or San Diego are characterized by a high demand for houses due to a strong influx of people.
Another reason why nonmetropolitan areas are typically not found at the top or bottom of the distribution is that they often comprise a large part of a state. These areas are often very diverse in terms of housing values. For instance, for Florida the MetLife survey distinguishes between just three metropolitan areas (Jacksonville, Miami, and Orlando). Obviously, the rest of Florida is still both rural and urban, with a median net per capita home value of $61,000--lower than Jacksonville and Miami but higher than Orlando.
Caveats
Our analyses use a stylized set of assumptions to help inform policymakers about the extent to which home equity could finance needs for LTSS for older people in the United States, using nursing home care costs as the metric. We do not examine costs for receiving care at home or the cost of increasingly common residence in alternative supportive settings, either of which might be financed through access to home equity. Our analytic approach does not consider other potential financing sources, and implicitly assumes that individuals do not need to tap their home equity to meet other pressing expenses and does not consider other potential financing sources. For example, we assume in effect that individuals can finance their out-of-pocket expenses for health services other than LTSS through a combination of income and nonhome wealth. For any given individual or family, using home equity may or may not be feasible. Needs for LTSS often develop quickly and unexpectedly; houses can take a long time to sell, especially in depressed home markets and at certain points in the year or in the business cycle. For these reasons, many people facing a nursing home stay are likely to have lower financial resources at hand from selling their home than our estimates suggest. Moreover, for married couples, selling the home may not be a viable option when one spouse enters a nursing home.
Measurement of housing values may also be a problem, as some research suggests that survey respondents may misstate home values, and they may do so systematically. For instance, Benítez-Silva et al. (2010) find that people in the HRS overstate home values by an average of 6-10 percent and report a higher expected selling price if they bought their property during economic booms. Davidoff (2004) reports that older homeowners spend less on routine home maintenance than younger homeowners, suggesting that houses of older homeowners might be less valuable.
Ehrlich (2013) compares the ACS to the house price index of the Federal Housing Finance Administration, which includes all transactions in the housing market. His analysis reveals that homeowners systematically under-estimate the value of their house in areas with increasing house values (e.g., Hawaii) but over-estimate the value of their house in areas with decreasing house values (e.g., Michigan). These patterns would imply that the distribution of days in a nursing home that home equity could finance may have an even larger variance than reported here. Kingkade (2013) similarly compares ACS reports to CoreLogic data on tax information, and finds variation in estimated accuracy of reports by individual and household characteristics. Woodward, Wilson, and Chestnut (2007) conducted another related ACS validation study.
Aside from these measurement issues, how long one will need to stay in a nursing home is highly uncertain. Some may only need temporary care to hasten recovery from an acute illness or a serious injury, which would be covered in all or part by Medicare for the population age 65 or older we examine, or to provide respite for a caregiver providing care at home. Others can expect to spend years in a nursing home. Brown and Finkelstein (2007), summarizing studies in this area, report an average duration of nursing home stay of about one year but also find that between 10 percent and 20 percent of all nursing home patients spend more than five years in a nursing home.
On the other hand, some aspects of our analyses may lead us to understate the home equity resources available to finance LTSS for part of the population. For example, sensitivity analyses using HRS data suggest that net home equity estimates in that dataset are modestly higher than in the ACS. Figure A-1 plots the bottom 98 percentiles of net home equity in the two surveys. Although the patterns are broadly similar, values from the HRS are modestly higher in the middle of the distribution.21 We also did not include information about second homes, as the ACS does not include this information. Data from the 2010 wave of the HRS suggest that almost 15 percent of those ages 65 and older own a second home, with a median equity of $70,000 among these owners. These owners tend to have equity in their first home substantially above the median, so we hypothesize that those in higher percentiles of the distribution are more affected by this omission than those in lower percentiles of the distribution who are likely to have fewer alternatives to home equity for financing care.
Our analysis has also focused on nursing home costs and does not include estimates for other types of care arrangements especially residential care or care in other types of assisted living facilities. A comparison of assisted living costs to nursing home costs shows that nursing home costs are on average about double assisted living costs. However, reliance on the MetLife data on average monthly assisted living costs may understate the cost of assisted living relative to nursing home care. This is because nursing home rates are more likely to include all or almost all services, whereas it is more typical in assisted living facilities to bill extra for certain services only if and when they are actually used. Areas with higher nursing home costs also have higher assisted living costs but the latter increase more modestly. Overall, these differences suggest that residential care/assisted living may be an attractive alternative to nursing home care for those people with disabilities who need some assistance but not at the level offered by nursing homes.
A final limitation of the analyses is that we examine individuals at a single point in time. We therefore cannot make any inferences about the dynamics surrounding disability onset and housing choices. We cannot observe persons in our sample who already have sold their homes to relocate to community-based supportive settings or accessed equity to pay for LTSS at home through mechanisms such as home equity lines of credit or reverse mortgages. Further analyses using longitudinal data are needed to understand these dynamics.
Conclusion
Many older adults meet their LTSS needs through the help of family and friends, supplementing such help with paid care when necessary. For example, in 2011, 95 percent of disabled older Americans not residing in nursing homes reported receiving such unpaid help and one-third of them relied exclusively on unpaid family and friends (Spillman et al. 2014). However, those with low incomes and assets and those who need care for an extended period may require additional help. Medicaid provides nursing home care and some HCBS in all states. However, this help is strictly means-tested.22 Older adults must have little income and few assets, as well as be sufficiently disabled, to qualify for such help. Most persons who qualify for Medicaid have few financial resources in the first place. However, Weiner and colleagues (2013) estimated that about 13 percent of Americans not enrolled in Medicaid at age 65 or older in the mid-1990s had "spent-down" and become Medicaid eligible within the following decade because their medical and/or LTSS costs exceeded their Medicare coverage and ability to pay privately.23 Once eligible for nursing home care, Medicaid residents are permitted to retain only a small personal needs allowance, which varies by state but is rarely greater than $50 per month.
Medicaid beneficiaries residing in the community may be required to contribute toward the cost of their HCBS or other Medicaid–covered services if they have income other than public cash assistance that exceeds the Federal Poverty Level. Elderly and disabled individuals who qualify for Medicaid HCBS at higher-income levels may retain all or some of their income to pay basic community living expenses; these amounts vary by state. The extent to which these monthly maintenance allowances are sufficient to cover community living costs is addressed in a separate Urban Institute brief (Johnson and Lindner 2016). The income and asset thresholds for Medicaid eligibility vary by marital status and other criteria. For example, older single adults typically qualify for Medicaid (and Supplemental Security Income [SSI]) if their income is less than $733 per month (in 2015) and the value of their assets is not greater than $2,000. In some states, older adults needing a nursing home level of care may have incomes up to 300 percent of SSI (about $2,200 per month). For married couples, Medicaid eligibility depends on whether one or both spouses enroll in Medicaid. If both are enrolled then the income and asset limits for a couple are slightly higher than for a single adult. If only one spouse receives Medicaid LTSS (either through a nursing home or a Medicaid HCBS waiver), then the nonMedicaid spouse may retain more income and assets, with the amounts depending on state and federal Medicaid rules. The most common sources of income for older adults with LTSS needs are Social Security and payments from defined-benefit pension plans. Regardless of marital status, no type of income is exempt when determining Medicaid eligibility.
For many older adults their home equity is their main asset. Before applying for Medicaid, some elders who owned a home may have already sold it, perhaps to move to a more convenient rental unit in the community or to help pay for assisted living or nursing home care. If a Medicaid applicant does own a home that is their "principal residence," most states consider it an exempt asset (also termed a noncountable resource) in determining Medicaid eligibility. This often occurs because a Medicaid beneficiary living "at home" needs a home to live in. A Medicaid beneficiary's home has traditionally been treated as an exempt asset even in the case of a nursing home resident so long as he or she states an "intent to return." Until ten years ago, no upper limit was placed on the home equity value of an applicant's home considered to be an exempt asset. However, the 2005 Deficit Reduction Act set a limit which is adjusted annually for inflation. As of 2015, under federal law, the applicant's equity value in a principal residence up to of $552,000 may be exempted, with states having the option of raising this limit to $828,000. Critics of Medicaid eligibility rules often interpret these rules as permanently exempting home equity assets.24 This is not accurate because since 1993 federal Medicaid law requires states to implement estate recovery programs to offset LTSS expenditures made on behalf of Medicaid beneficiaries age 55 and older (and, at state option, estate recovery can be expanded to include Medicaid expenditures for other services and/or on behalf of younger beneficiaries). At a minimum, federal law requires mandatory estate recovery against assets that pass through probate, but states may elect to expand the definition of estates subject to recovery and many have done so. Some states have aggressive estate recovery programs, others less so (see, for example, statistics in Wood and Klem 2007; Thomson/Medstat 2005a, 2005b).
Our analyses suggest that the ability of older adults in the United States to use their homes to finance nursing home care varies widely, both by geography and by other key characteristics. Those at the top of the housing wealth distribution may have significant capacity to use net equity to finance lengthy spells of care and also may have significant other resources to draw upon. However, about a quarter of older Americans have no home equity. Those at the median have sufficient equity to cover less than a year of care--substantially less if they are African American, Hispanic, or already experiencing functional limitations. These findings underscore the importance of developing LTSS financing policies that recognize the divergent economic circumstances of older Americans.
In our stylized exercise, we have not considered a common case, where those needing LTSS prefer to remain at home and may need to access home equity over a long period to pay for services and maintain community residence (see related discussion in Johnson and Lindner 2015). Previous research has explored home equity as a resource for either pre-funding care through purchase of long-term care insurance (LTCI) or other pre-funding vehicles, or to pay directly for care. A concern, however, is the generally high transaction costs and wide variation on the amount of equity that could be accessed through reverse mortgages, as well as the inefficiency of layering of transaction costs for access to equity and pre-funding vehicles (Spillman and Murtaugh 2007). Policies to reduce costs and raise limits on the amount of equity that can be accessed almost certainly would be needed if housing equity is to make an important contribution to increased pre-funding of LTSS or to direct payment for expenses for LTSS among persons with more modest means.
Endnotes
-
Higher-level disability is defined as need for assistance with at least two activities of daily living (that is, requiring human help with personal care tasks) that is expected to last for at least 90 days or need for supervision due to severe cognitive impairment. Activities of daily living include tasks such as bathing, dressing, transferring from bed to chair, toileting, managing incontinence, and eating.
-
Several other studies have estimated similar risks (Brown and Warshawsky 2013; Stallard 2011). Other literature estimates probability of needing nursing home care specifically. Several studies suggest that a 65-year-old adult has about a 40 percent chance of eventually entering a nursing home, with an average duration of about one year (Kemper and Murtaugh 1991; Spillman and Lubitz 2002; Kemper, Komisar, and Alexcih 2005). One recent study suggests the risk may be higher (Friedberg et al. 2014). Hurd et al. (2013), using the HRS, report a higher lifetime risk of entering nursing home care than these previous studies. Specifically, they estimate that a 50-year-old has more than a 50 percent chance of receiving nursing home care before death. They speculate that recall bias and the use of multiple data sources may contribute to underreporting of nursing home stays in earlier studies. One challenge with the HRS data Hurd et al. use is that they do not enable one to readily differentiate strictly post-acute stays from custodial stays.
-
For discussion of perceived probabilities of nursing home use, see, for example Wiener, Khatutsky, Thach, Greene, Allaire, Brown, Lamont, Marton, and Shipley (2015). Many similarly under-estimate the financial risk of having to pay out-of-pocket for paid LTSS, especially because surveys show that many mistakenly believe that Medicare coverage is available and are unaware that Medicaid, the main source of public funding for nursing home care beyond short, post-hospital stays and for in-home aide services, is strictly means-tested (see, for example, Associated Press-NORC 2016; Brown, Goda, and McGarry 2012).
-
Johnson and Park (2011) estimate that about 10.7 percent of those ages 55 and older have LTCI, and that these individuals are disproportionately higher-income. LifePlans (2012) similarly documents a strong relationship between income and wealth and purchase of LTCI. Brown and Finkelstein (2007) discuss reasons why private LTCI is not prevalent.
-
A recent survey conducted among a representative sample of Americans aged 40-70 asked how they would be willing to access LTSS if they needed it. About 44 percent of respondents reported that they would be very or somewhat willing to use value in their home to pay for LTSS if they were to become disabled (Wiener, Khatutsky, Thach, Greene, Allaire, Brown, Lamont, Marton, and Shipley 2015). Thus, over half the survey respondents (none of whom were seeking to access paid LTSS at the time) expressed reluctance to use home equity to pay for LTSS. Low-income homeowners were significantly less willing to do so, compared to those with higher incomes and savings.
-
An earlier study by Houser (2012) made comparable calculations relating nursing home and home care costs to incomes rather than housing wealth.
-
Our assumption about splitting home equity recognizes that equity and the physical home itself may be needed to support a spouse, who ultimately also may need LTSS. Of course, in many couples a spouse with no or fewer significant health limitations may provide care to a disabled spouse that reduces his or her need for paid care in the community or institutional care, at least for some period of time. Also, it is important to bear in mind spousal protections that exist under current law, for example in the Medicaid program, that affect individuals' incentives to leverage home equity.
-
This assumption is geared toward accounting for the fact that one's home is typically not as liquid as most financial assets. We start with a value of 8 percent because standard brokerage fees often average from 5 percent to 6 percent (e.g., U.S. Department of Justice 2007), and the typical seller will have significant additional costs beyond this fee. Magnitudes of transaction costs are likely to vary significantly among households and across housing markets. The size of the transaction costs may also differ significantly based on the mechanism used to finance potential LTSS, for example a straight sale of the home compared to a reverse mortgage or home equity line of credit (for a discussion of transaction costs in reverse mortgages, see for example, U.S. Government Accountability Office 2009, which notes that transaction costs as a percentage of the mortgage vary based on the duration of the mortgage). Further, the timing of needs for LTSS is often very uncertain; this may add to transaction costs in some circumstances (i.e., one may need to pay double housing costs during transitional phases).
-
Specifically, we use the HRS to regress the square root of mortgage values for first and second mortgages on the primary home on the log of home values, its squared term, and other characteristics. We then use estimated coefficients to calculate expected mortgage values for each person reporting a mortgage in the ACS. We restrict the sample for the HRS regression to homeowners 65 years or older with a mortgage. Other covariates in the model include: age, log of total household income and its square term, total mortgage payment, and indicators for race/ethnicity, nativity, highest educational achievement, marital status, gender, employment status, and Census region. We experimented with other functional forms (e.g., using the log of mortgage values) and other variables (e.g., a squared term for age and a disability indicator) and chose from among these different specifications based on how well the variables predicted mortgage values and the overall explanatory power of the model (i.e., R-squared). Imputed mortgage values do not differ strongly across various functional form specifications.
-
Genworth (2015) provides similar data.
-
For determining metropolitan area in the 2011 ACS, we use the variable "metarea".
-
Although most metropolitan area matches are unproblematic, a few complications emerge. First, 11 areas in the ACS have multiple states. For instance, the metropolitan areas "Kansas City" includes people residing both in Missouri and in Kansas. For such cases, we have matched all of these households to the corresponding MetLife metropolitan area (Kansas City, Missouri in this case). Second, some MetLife metropolitan areas do not have an ACS metropolitan area with the same or similar name. Of these, we could assign five areas to larger metropolitan area close by that the ACS includes. For instance, the "Des Plaines Area" in Illinois is part of Chicago. Three MetLife metropolitan areas could not be matched to any metropolitan area in the ACS. These are: Bridgewater Area (New Jersey), Rapid City Area (South Dakota) and Charleston Area (West Virginia).
-
We use nursing home costs at the metropolitan and nonmetropolitan area level when such areas exist and state averages for states where the MetLife survey does not include any metropolitan areas (these are Alaska, Vermont and Wyoming) and for states where there is no match between MetLife and ACS metropolitan areas (these are New Jersey, South Dakota and West Virginia). For New Jersey, the MetLife survey has two metropolitan areas. We match the Cherry Hill Area to Philadelphia, Pennsylvania/New Jersey in the ACS and could not determine a match for the Bridgewater Area. For South Dakota, the MetLife survey has one metropolitan area (Rapid City Area) but the ACS has none. Similarly, for West Virginia, the MetLife survey but not the ACS includes one metropolitan area (Charleston Area).
-
For these statistics, we first calculate median values of nursing home costs and net home value and percentages of homeownership and mortgage status by state or metropolitan/nonmetropolitan area and then report averages and percentiles of these aggregates. Averages of homeownership rates and mortgage status are identical at the individual and state level because we use person weights in all calculations. Corresponding values at the metropolitan/nonmetropolitan area level differ slightly because not all states or areas are included at this level.
-
We start using costs for a private room, given that most older adults live relatively independently (i.e., alone or with just a spouse); movement to a semi-private arrangement represents a significant change in circumstances. We subsequently demonstrate the sensitivity of our estimates to this choice by showing values using estimated costs for semi-private rooms.
-
For this and all subsequent tables, we do not present averages because the distributions of nursing home days and home values are highly right-skewed (i.e., because a small number of people have very expensive homes, the mean ratio poorly represents the typical older adult's situation).
-
The disabilities that ACS respondents report that we use here include the following: (1) self-care difficulty (difficulties dressing/bathing); (2) independent living difficulty (difficulties doing errands alone); (3) ambulatory difficulty (difficulties walking of climbing stairs); (4) cognitive difficulty (difficulties learning, remembering, or concentrating); and (5) vision or hearing difficulty (difficulties/inability to hear or see).
-
The positive relationship between home equity and nursing home days is very similar for the 25th and 75th percentile values.
-
The homeownership rate in Miami is 50.2 percent but the median home value is zero because a few homeowners report zero house equity.
-
The District of Columbia is among these top five areas because we treat the District both as a state for the state-level analysis and as a metropolitan area in this part of the analysis. State-level estimates for the District only include people living within city limits whereas metropolitan area estimates include people in the larger metropolitan area (e.g., Silver Spring, Maryland), which explains the different estimates for the District in Table 4 and Table 5.
-
Further sensitivity analyses reveal that the match between the ACS and HRS vary by population subgroup. For example, distributions for married people line up nearly exactly, but distributions for single people are less similar.
-
For additional detail on Medicaid eligibility and cost sharing, see, for example, O'Keeffe, Saucier, Jackson, Cooper, McKenney, Crisp, and Moseley (2010).
-
Spillman and Waidmann (2015) similarly estimate four-year Medicaid transition probabilities for the Medicare-eligible population living in the community. They estimate a transition rate of roughly 5 percent, which appears broadly consistent with the estimates from Weiner and colleagues (2013). They further find that nursing home admission and low-income and assets are the most significant predictors of Medicaid enrollment. Other literature on related issues surrounding Medicaid eligibility includes Baird, Hurd, and Rohwedder (2014) and Greenhalgh-Stanley (2012).
-
For example, Warshawsky (2014) maintains that the Medicaid eligibility rules are so lax that they can allow "millionaires" to enroll.
References
Associated Press-NORC Center for Public Affairs Research. 2015. Long-term Care in America: Americans' Outlook and Planning for Future Care. Chicago, IL.
Baird, Matthew, Michael Hurd, and Susann Rohwedder. 2014. Medicaid Spend-down: The Importance of Strategic Asset Transfers to Reach Medicaid Eligibility. http://www.netspar.nl/files/Evenementen/2014-06-19%20ipw/papers/062%20rohwedder.pdf.
Benítez-Silva, Hugo, Eren Selcuk, Frank Heiland, and Sergi Jiménez-Martín. 2010. How Well do Individuals Predict the Selling Prices of their Homes? SUNY-Stony Brook.
Brown, Jason, and Mark Warshawsky. 2013. "The Life Care Annuity: A New Empirical Examination of an Insurance Innovation That Addresses Problems in the Markets for Life Annuities and Long-Term Care Insurance." Journal of Risk and Insurance, 80(3): 677-703.
Brown, Jeffrey R., and Amy Finkelstein. 2007. "Why is the Market for Long-Term Care Insurance so Small?" Journal of Public Economics, 91(10): 1967-1991.
Brown, Jeffrey R., Gopi Shah Goda, and Kathleen McGarry. 2012. "Long-Term Care Insurance Demand Limited By Beliefs About Needs, Concerns About Insurers, and Care Available from Family." Health Affairs, 31(6): 1294-1302.
Davidoff, Thomas. 2004. "Maintenance and the Home Equity of the Elderly." Fisher Center for Real Estate and Urban Economics, Paper No. 03-288.
Davidoff, Thomas. 2010. "Home Equity Commitment and Long-Term Care Insurance Demand." Journal of Public Economics, 94(1-2): 44-49.
Ehrlich, Gabriel. 2013. Price and Time to Sale Dynamics in the Housing Market: the Role of Incomplete Information. Washington, DC: Congressional Budget Office.
Favreault, Melissa, and Judith Dey. 2015. Long-Term Services and Supports for Older Americans: Risks and Financing Research Brief. Washington, DC: Office of the Assistant Secretary for Planning and Evaluation, U.S. Department of Health and Human Services. https://aspe.hhs.gov/basic-report/long-term-services-and-supports-older-americans-risks-and-financing-research-brief.
Friedberg, Leora, Wei Sun, Anthony Webb, Wenliang Hou, and Zhenyu Li. 2014. "New Evidence on the Risk of Requiring Long-Term Care." Working Paper No. 2014-12. Center for Retirement Research at Boston College.
Genworth. 2015. Genworth 2015 Cost of Care Survey: Home Care Providers, Adult Day Health Care Facilities, Assisted Living Facilities and Nursing Homes.
Greenhalgh-Stanley, Nadia. 2012. "Medicaid and the Housing and Asset Decisions of the Elderly: Evidence from Estate Recovery Programs." Journal of Urban Economics, 72(2-3): 210-24.
Houser, Ari. 2012. A New Way of Looking at Private Pay Affordability of Long-Term Services and Supports. AARP Public Policy Institute.
Hurd, Michael, Pierre-Carl Michaud, and Susann Rohwedder. 2013. "The Lifetime Risk of Nursing Home Use." In David A. Wise, ed., Discoveries in the Economics of Aging, Chicago, IL: University of Chicago Press.
Johnson, Richard W. 2013. "Income and Wealth of Older Adults Needing Long-Term Services and Support." Statement before the Commission on Long-Term Care.
Johnson, Richard W., and Stephan Lindner. 2016. "Older Adults' Living Expenses and the Adequacy of Income Allowances for Medicaid Home- and Community-Based Services." Washington, DC: Office of the Assistant Secretary for Planning and Evaluation, U.S. Department of Health and Human Services. https://aspe.hhs.gov/basic-report/older-adults-living-expenses-and-adequacy-income-allowances-medicaid-home-and-community-based-services
Johnson, Richard W., and Janice S. Park. 2011. "Who Purchases Long-Term Care Insurance?" Older Americans' Economic Security, No. 29. Washington, DC: Urban Institute.
Kingkade, W. Ward. 2013. "Self-Assessed Housing Values in the American Community Survey: An Exploratory Analysis Using Linked Real Estate Records." Paper presented at the Annual Joint Statistical Meetings, August 3-8, Montreal.
LifePlans. 2012. Who Buys Long-Term Care Insurance in 2010-2011? A Twenty-Year Study of Buyers and Non-Buyers (in the Individual Market). Washington DC: America's Health Insurance Plans.
MetLife. 2011. Market Survey of Long-Term Care Costs: The 2011 MetLife Market Survey of Nursing Home, Assisted Living, Adult Day Services, and Home Care Costs. New York, NY.
O'Keeffe, Janet, Paul Saucier, Beth Jackson, Robin Cooper, Ernest McKenney, Suzanne Crisp, and Charles Moseley. 2010. Understanding Medicaid Home and Community Services: A Primer 2010 Edition. Washington, DC: Office of the Assistant Secretary for Planning and Evaluation, U.S. Department of Health and Human Services. https://aspe.hhs.gov/report/understanding-medicaid-home-and-community-services-primer-2010-edition.
Spillman, Brenda C., and Christopher M. Murtaugh. 2007. Simulation Modeling on Life Care Annuity: Final Report. Washington, DC: Office of the Assistant Secretary for Planning and Evaluation, U.S. Department of Health and Human Services. https://aspe.hhs.gov/basic-report/simulation-modeling-life-care-annuity-final-report.
Spillman, Brenda C., Jennifer Wolff, Vicki Freedman, and Judith Kasper. 2014. Informal Caregiving for Older Americans: An Analysis of the 2011 National Health and Aging Trends Survey. Washington, DC: Office of the Assistant Secretary for Planning and Evaluation, U.S. Department of Health and Human Services. https://aspe.hhs.gov/report/informal-caregiving-older-americans-analysis-2011-national-study-caregiving.
Spillman, Brenda C., and Timothy Waidmann. 2015. Beyond Spend-down: The Prevalence and Process of Transitions to Medicaid. Washington, DC: Office of the Assistant Secretary for Planning and Evaluation, U.S. Department of Health and Human Services. https://aspe.hhs.gov/report/beyond-spend-down-prevalence-and-process-transitions-medicaid.
Stallard, Eric. 2011. "Estimates of the Incidence, Prevalence, Duration, Intensity and Cost of Chronic Disability among the U.S. Elderly." North American Actuarial Journal, 15(1): 32-58.
Thomson/Medstat. 2005a. Medicaid Liens and Estate Recovery in Massachusetts: Policy Brief. Washington, DC: Office of the Assistant Secretary for Planning and Evaluation, U.S. Department of Health and Human Services. https://aspe.hhs.gov/basic-report/medicaid-liens-and-estate-recovery-massachusetts.
Thomson/Medstat. 2005b. Medicaid Estate Recovery Collections: Policy Brief. Washington, DC: Office of the Assistant Secretary for Planning and Evaluation, U.S. Department of Health and Human Services. https://aspe.hhs.gov/report/medicaid-estate-recovery-collections.
U.S. Department of Justice and Federal Trade Commission. 2007. Competition in the Real Estate Brokerage Industry.
U.S. Government Accountability Office. 2009. Reverse Mortgages: Product Complexity and Consumer Protection Issues Underscore Need for Improved Controls over Counseling for Borrowers. http://www.gao.gov/assets/300/291790.pdf.
Warshawsky, Mark. 2014. "Millionaires on Medicaid." Wall Street Journal. http://online.wsj.com/news/articles/SB10001424052702304325004579297052950416982.
Wiener, Joshua M., Wayne L. Anderson, Galina Khatutsky, Yevgeniya Kaganova, Janet O'Keeffe, Anne Tumlinson, Eric Hammelman, and Elana Stair. 2013. Medicaid Spend Down: New Estimates and Implications for Long-Term Services and Supports Financing. http://www.rti.org/pubs/tsf_ltc-financing_medicaid-spend-down-implications_wiener-tumlinson_3-20-13_0.pdf.
Wiener, Joshua M., Galina Khatutsky, Nga Thach, Angela M. Greene, Benjamin Allaire, Derek Brown, Helen Lamont, William Marton, and Samuel Shipley. 2015. Findings from the Survey of Long-Term Care Awareness and Planning Research Brief. Washington, DC: Office of the Assistant Secretary for Planning and Evaluation, U.S. Department of Health and Human Services. https://aspe.hhs.gov/basic-report/findings-survey-long-term-care-awareness-and-planning-research-brief.
Wood, Erica F., and Ellen M. Klem. 2007. "Protections in Medicaid Estate Recovery: Findings, Promising Practices, and Model Notices." No. 2007-07. Washington, DC: AARP.
Woodward, Jeanne, Ellen Wilson, and John Chestnut. 2007. Evaluation Report Covering Property Value. 2006 American Community Survey Test Report H.7. Washington, DC: Bureau of the Census.
Figures and Tables
| FIGURE 1. Geographic Distribution of Days of Private Room Nursing Home Care that Home Equity Could Finance for Homeowners |
|---|
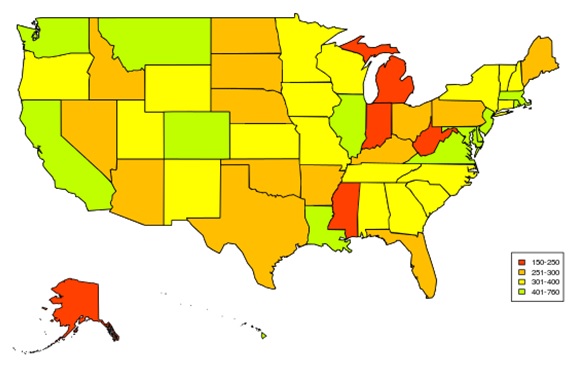 |
| SOURCE: Authors' calculations from 2011 ACS matched to MetLife (2011). NOTES: The figure displays the geographic distribution of days in nursing home paid for homeowners at the state level using median home values. Darker colors indicate fewer days of care. |
| FIGURE 2. Median Net Home Equity and Median Days of Private Room Nursing Home Care that Home Equity Could Finance for Homeowners, by States |
|---|
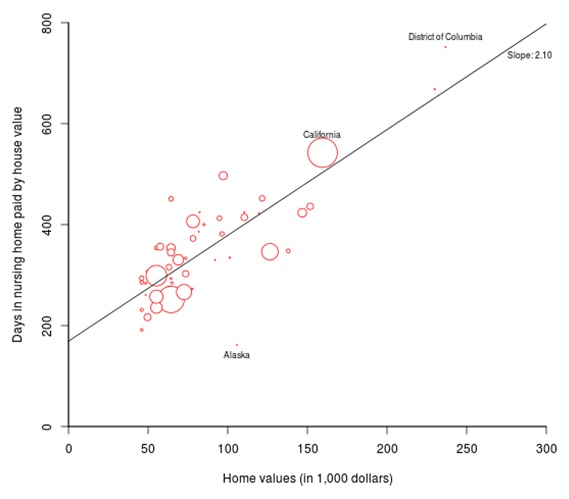 |
| SOURCE: Authors' calculations from 2011 ACS matched to MetLife (2011). NOTES: The figure displays median net home equity for homeowners and days in nursing home that could be financed by the net home equity, adjusted for transaction costs, for each state. Circle sizes are proportionate to the weighted number of homeowners in the sample that live in the respective state. |
| FIGURE 3. Median Net Home Equity and Homeownership Rates by States |
|---|
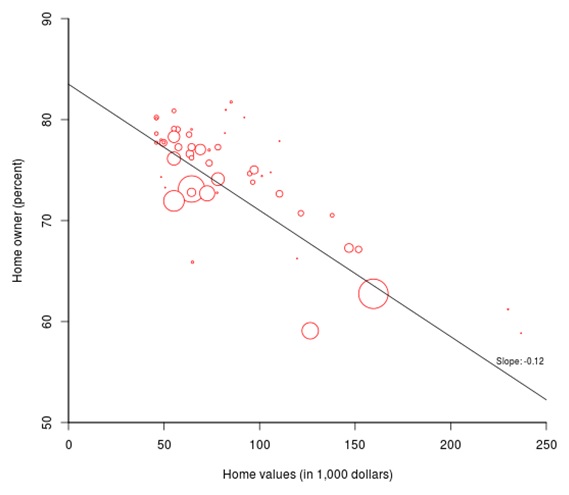 |
| SOURCE: Authors' calculations from 2011 ACS matched to MetLife (2011). NOTES: The figure displays median net home equity, adjusted for transaction costs, for homeowners and homeownership for each state. Circle sizes are proportionate to the weighted number of homeowners in the sample that live in the respective state. Vertical axis does not start at zero. |
| TABLE 1. Descriptive Statistics for Older Adults in the Sample | ||||
|---|---|---|---|---|
| Mean | 25th Percentile | Median | 75th Percentile | |
| Distribution at the Individual Level | ||||
| Age (years) | 74.7 | 68.0 | 73.0 | 80.0 |
| Male (percent) | 43.7 | |||
| Black (percent) | 8.5 | |||
| Hispanic (percent) | 7.2 | |||
| Married (percent) | 54.1 | |||
| Nursing home costs, private room (dollars) | 245.0 | 195.0 | 235.0 | 272.0 |
| Nursing home costs, semi-private room (dollars) | 215.6 | 176.0 | 205.0 | 240.0 |
| Homeownership (percent) | 72.4 | |||
| Per capita home value of homeowners prior to mortgage imputation (dollars) | 144,285 | 51,520 | 92,000 | 165,600 |
| Net per capita home equity of homeowners (dollars) | 122,114 | 38,783 | 73,794 | 138,000 |
| Homeowner with mortgage (percent) | 34.8 | |||
| Mortgage relative to home value among mortgage holders (percent) | 58.9 | 38.4 | 45.9 | 55.3 |
| Distribution at the State Level | ||||
| Nursing home costs, private room (dollars) | 245.3 | 195.0 | 235.0 | 272.0 |
| Nursing home costs, semi-private room (dollars) | 217.7 | 176.0 | 209.0 | 226.0 |
| Homeownership (percent) | 72.4 | 70.7 | 73.1 | 77.3 |
| Per capita home value of homeowners prior to mortgage imputation (dollars) | 104,543 | 69,000 | 82,800 | 138,000 |
| Net per capita home equity of homeowners (dollars) | 83,954 | 55,200 | 64,400 | 109,940 |
| Homeowners with a mortgage (percent) | 34.8 | 29.4 | 35.6 | 38.1 |
| Mortgage relative to home value among mortgage holders (percent) | 58.9 | 55.3 | 61.2 | 65.9 |
| Distribution at the Metropolitan/NonMetropolitan Area Level | ||||
| Nursing home costs, private room (dollars) | 244.4 | 194.0 | 235.0 | 272.0 |
| Nursing home costs, semi-private room (dollars) | 214.6 | 173.0 | 205.0 | 229.0 |
| Homeownership (percent) | 72.2 | 69.5 | 75.0 | 78.3 |
| Per capita home value of homeowners prior to mortgage imputation (dollars) | 106,895 | 69,000 | 78,200 | 125,120 |
| Net per capita home equity of homeowners (dollars) | 86,957 | 55,200 | 65,285 | 100,934 |
| Homeowners with a mortgage (percent) | 34.9 | 28.4 | 34.5 | 39.9 |
| Mortgage relative to home value among mortgage holders (percent) | 59.4 | 53.7 | 58.8 | 65.2 |
| SOURCE: Authors' calculations from 2011 ACS matched to MetLife (2011) using 2010 HRS data to impute mortgage values for those who report holding a mortgage. The sample includes all adults age 65 or older. Per capita home equity values are reduced to account for potential transaction costs. See text for further information on sample selection. Statistics at the state and metropolitan/nonmetropolitan area level are obtained by first calculating median values of nursing home costs and net home equity and percentages of homeownership and mortgage status by state or metropolitan/nonmetropolitan area and then reporting averages and percentiles of these aggregates. Averages of homeownership and mortgage status are identical at the individual and state level because we use person weights for all calculations. Corresponding values at the metropolitan/nonmetropolitan area level differ slightly because not all states are included at this level. Mortgage relative to home value is calculated by dividing mortgage values by home value for homeowners who report having a mortgage. | ||||
| TABLE 2. Nationwide Distribution of Days of Private Room Nursing Home Care that Net Home Equity Could Finance for Older Adults | ||||||||||||
|---|---|---|---|---|---|---|---|---|---|---|---|---|
| Age Groups | Married | Functional Limitations | Race | |||||||||
| 65+ | 65-74 | 75-84 | 85+ | Yes | No | Zero | One | Two or More | White, NonHisp | Black, NonHisp | Hispanic | |
| All Older Adults | ||||||||||||
| 10th percentile | 0 | 0 | 0 | 0 | 0 | 0 | 0 | 0 | 0 | 0 | 0 | 0 |
| 25th percentile | 0 | 1 | 0 | 0 | 109 | 0 | 45 | 0 | 0 | 32 | 0 | 0 |
| 50th percentile | 208 | 214 | 220 | 116 | 255 | 59 | 255 | 182 | 39 | 245 | 55 | 0 |
| 75th percentile | 460 | 453 | 475 | 451 | 456 | 468 | 507 | 420 | 309 | 495 | 256 | 249 |
| 90th percentile | 828 | 807 | 846 | 872 | 757 | 909 | 896 | 755 | 637 | 873 | 506 | 550 |
| 95th percentile | 1,186 | 1,162 | 1,196 | 1,258 | 1,078 | 1,299 | 1,278 | 1,076 | 930 | 1,247 | 744 | 823 |
| 99th percentile | 2,853 | 2,908 | 2,788 | 2,845 | 2,888 | 2,844 | 3,158 | 2,401 | 2,208 | 3,069 | 1,545 | 1,691 |
| 99.9th percentile | 7,741 | 7,208 | 7,943 | 8,930 | 5,866 | 9,500 | 7,741 | 7,475 | 7,741 | 7,855 | 6,354 | 5,123 |
| At leat 1 year n.h. (%) | 32.5 | 32.1 | 33.9 | 30.5 | 34.1 | 30.5 | 36.9 | 29.2 | 21.1 | 35.9 | 16.6 | 17.3 |
| At least 3 years n.h (%) | 5.8 | 5.6 | 6.1 | 6.5 | 4.9 | 7.0 | 6.8 | 4.8 | 3.7 | 6.5 | 2.2 | 2.9 |
| Homeownership | 72.4 | 76.1 | 72.1 | 56.4 | 88.1 | 53.8 | 78.7 | 71.1 | 53.3 | 77.7 | 56.3 | 48.3 |
| Sample size | 490,326 | 271,101 | 159,543 | 59,682 | 276,804 | 213,522 | 313,335 | 84,013 | 92,978 | 396,631 | 40,353 | 30,413 |
| Older Homeowners Only | ||||||||||||
| 10th percentile | 82 | 76 | 88 | 105 | 80 | 87 | 91 | 69 | 64 | 88 | 49 | 62 |
| 25th percentile | 174 | 163 | 185 | 218 | 162 | 216 | 185 | 157 | 146 | 182 | 112 | 135 |
| 50th percentile | 329 | 309 | 346 | 400 | 294 | 432 | 345 | 303 | 289 | 340 | 226 | 260 |
| 75th percentile | 581 | 545 | 600 | 706 | 490 | 763 | 601 | 535 | 521 | 593 | 416 | 478 |
| 90th percentile | 973 | 929 | 999 | 1,184 | 812 | 1,260 | 1,011 | 909 | 910 | 995 | 708 | 834 |
| 95th percentile | 1,394 | 1,314 | 1,420 | 1,664 | 1,151 | 1,762 | 1,444 | 1,258 | 1,299 | 1,421 | 968 | 1,184 |
| 99th percentile | 3,452 | 3,407 | 3,382 | 3,996 | 3,107 | 4,059 | 3,651 | 2,926 | 3,119 | 3,623 | 2,147 | 2,493 |
| 99.9th percentile | 8,446 | 7,783 | 8,718 | 9,916 | 5,992 | 9,916 | 8,085 | 8,478 | 8,930 | 8,478 | 8,045 | 7,360 |
| At leat 1 year n.h. (%) | 44.9 | 42.2 | 47.0 | 54.0 | 38.7 | 56.8 | 46.9 | 41.1 | 39.6 | 46.3 | 29.6 | 35.9 |
| At least 3 years n.h (%) | 8.1 | 7.3 | 8.4 | 11.5 | 5.5 | 13.0 | 8.6 | 6.8 | 7.0 | 8.4 | 3.9 | 6.0 |
| Sample size | 380,652 | 218,588 | 123,628 | 38,436 | 250,133 | 130,519 | 259,310 | 64,110 | 57,232 | 324,436 | 25,412 | 17,537 |
| SOURCE: Authors' calculations from 2011 ACS matched to MetLife (2011) using 2010 HRS to impute mortgage values for those who report holding a mortgage. The sample includes all adults age 65 or older. Home equity values are reduced to account for potential transaction costs. See text for further information. | ||||||||||||
| TABLE 3. Nationwide Distribution of Days of Semi-Private Room Nursing Home Care that Net Home Equity Could Finance for Older Adults | ||||||||||||
|---|---|---|---|---|---|---|---|---|---|---|---|---|
| Age Groups | Married | Functional Limitations | Race | |||||||||
| 65+ | 65-74 | 75-84 | 85+ | Yes | No | Zero | One | Two or More | White, NonHisp | Black, NonHisp | Hispanic | |
| All Older Adults | ||||||||||||
| 10th percentile | 0 | 0 | 0 | 0 | 0 | 0 | 0 | 0 | 0 | 0 | 0 | 0 |
| 25th percentile | 0 | 1 | 0 | 0 | 125 | 0 | 52 | 0 | 0 | 36 | 0 | 0 |
| 50th percentile | 237 | 243 | 250 | 130 | 289 | 67 | 288 | 207 | 45 | 277 | 61 | 0 |
| 75th percentile | 523 | 513 | 539 | 509 | 519 | 529 | 579 | 480 | 354 | 561 | 288 | 310 |
| 90th percentile | 944 | 920 | 968 | 997 | 879 | 1,038 | 1,025 | 872 | 721 | 1,003 | 574 | 661 |
| 95th percentile | 1,361 | 1,328 | 1,383 | 1,445 | 1,249 | 1,496 | 1,481 | 1,246 | 1,078 | 1,438 | 848 | 997 |
| 99th percentile | 3,339 | 3,353 | 3,288 | 3,368 | 3,307 | 3,366 | 3,665 | 2,843 | 2,584 | 3,590 | 1,761 | 2,058 |
| 99.9th percentile | 9,115 | 8,639 | 9,259 | 10,288 | 6,793 | 10,976 | 9,259 | 8,926 | 8,976 | 9,259 | 7,635 | 6,043 |
| At leat 1 year n.h. (%) | 36.9 | 36.7 | 38.4 | 33.9 | 39.9 | 33.3 | 41.8 | 33.6 | 24.2 | 40.7 | 19.5 | 21.3 |
| At least 3 years n.h (%) | 7.6 | 7.3 | 8.0 | 8.4 | 6.5 | 9.0 | 8.8 | 6.4 | 4.9 | 8.4 | 2.8 | 4.2 |
| Homeownership | 72.4 | 76.1 | 72.1 | 56.4 | 88.1 | 53.8 | 78.7 | 71.1 | 53.3 | 77.7 | 56.3 | 48.3 |
| Sample size | 490,326 | 271,101 | 159,543 | 59,682 | 276,804 | 213,522 | 313,335 | 84,013 | 92,978 | 396,631 | 40,353 | 30,413 |
| Older Homeowners Only | ||||||||||||
| 10th percentile | 93 | 87 | 100 | 119 | 91 | 99 | 103 | 79 | 72 | 100 | 54 | 76 |
| 25th percentile | 198 | 186 | 212 | 245 | 184 | 244 | 212 | 180 | 166 | 207 | 126 | 170 |
| 50th percentile | 374 | 352 | 392 | 452 | 333 | 489 | 390 | 345 | 329 | 383 | 254 | 322 |
| 75th percentile | 660 | 627 | 683 | 802 | 561 | 871 | 685 | 617 | 601 | 673 | 465 | 584 |
| 90th percentile | 1,122 | 1,072 | 1,146 | 1,353 | 931 | 1,438 | 1,164 | 1,044 | 1,045 | 1,140 | 793 | 1,010 |
| 95th percentile | 1,608 | 1,540 | 1,643 | 1,981 | 1,321 | 2,039 | 1,683 | 1,448 | 1,500 | 1,643 | 1,085 | 1,438 |
| 99th percentile | 4,051 | 4,013 | 3,948 | 4,577 | 3,547 | 4,718 | 4,220 | 3,414 | 3,625 | 4,182 | 2,352 | 2,992 |
| 99.9th percentile | 9,695 | 9,275 | 9,841 | 12,085 | 7,461 | 12,085 | 9,480 | 9,595 | 9,963 | 9,726 | 8,908 | 9,440 |
| At leat 1 year n.h. (%) | 51.0 | 48.3 | 53.3 | 60.0 | 45.3 | 62.0 | 53.1 | 47.2 | 45.5 | 52.3 | 34.6 | 44.2 |
| At least 3 years n.h (%) | 10.6 | 9.6 | 11.0 | 14.9 | 7.4 | 16.7 | 11.2 | 9.0 | 9.2 | 10.9 | 4.9 | 8.7 |
| Sample size | 380,652 | 218,588 | 123,628 | 38,436 | 250,133 | 130,519 | 259,310 | 64,110 | 57,232 | 324,436 | 25,412 | 17,537 |
| SOURCE: Authors' calculations from 2011 ACS matched to MetLife (2011) using 2010 HRS to impute mortgage values. The sample includes all adults age 65 or older. Home equity values are reduced to account for potential transaction costs for those who report holding a mortgage. See text for further information. | ||||||||||||
| TABLE 4. States with Lowest and Highest Days of Private Room Nursing Home Care that Net Home Equity Could Finance | ||||
|---|---|---|---|---|
| Area | Days in Nursing Home | Daily Cost of Nursing Home ($) | Per Capita Net Home Equity ($) | Home-Ownership (%) |
| All Older Adults | ||||
| Five lowest states | ||||
| New York | 122 | 387 | 41,448 | 59.1 |
| Alaska | 122 | 655 | 79,918 | 74.8 |
| Nevada | 123 | 215 | 27,600 | 65.9 |
| West Virginia | 143 | 240 | 34,417 | 80.1 |
| Florida | 146 | 253 | 37,238 | 73.1 |
| Five highest states | ||||
| Montana | 308 | 194 | 59,800 | 81.0 |
| Hawaii | 317 | 326 | 114,604 | 61.2 |
| Utah | 332 | 230 | 69,374 | 81.7 |
| Delaware | 337 | 260 | 87,400 | 77.9 |
| Virginia | 362 | 190 | 69,000 | 75.0 |
| Older Homeowners Only | ||||
| Five lowest states | ||||
| Alaska | 156 | 655 | 102,111 | 74.8 |
| West Virginia | 192 | 240 | 46,000 | 80.1 |
| Indiana | 212 | 237 | 47,840 | 77.7 |
| Mississippi | 231 | 199 | 46,000 | 77.7 |
| Michigan | 235 | 235 | 54,249 | 78.3 |
| Five highest states | ||||
| Louisiana | 444 | 141 | 64,400 | 76.2 |
| Virginia | 484 | 190 | 95,037 | 75.0 |
| California | 538 | 272 | 156,737 | 62.8 |
| Hawaii | 668 | 326 | 230,000 | 61.2 |
| District of Columbia | 739 | 315 | 232,823 | 58.8 |
| SOURCE: Authors' calculations from 2011 ACS matched to MetLife (2011) using 2010 HRS to impute mortgage values for those who report holding a mortgage. The sample includes all adults age 65 or older. Per capita home equity values are reduced to account for potential transaction costs. See text for further information. All statistics are medians | ||||
| TABLE 5. Metropolitan and NonMetropolitan Areas with Lowest and Highest Days of Private Room Nursing Home Care that Net Home Equity Could Finance | ||||
|---|---|---|---|---|
| Area | Days in Nursing Home | Daily Cost of Nursing Home ($) | Per Capita Net Home Equity ($) | Home-Ownership (%) |
| All Older Adults | ||||
| Five lowest areas | ||||
| Florida: Miami | 0 | 306 | 0 | 50.2 |
| Nevada: Las Vegas | 106 | 215 | 22,857 | 62.0 |
| Florida: Orlando | 110 | 256 | 28,038 | 69.9 |
| New York: Rochester | 132 | 344 | 45,483 | 74.6 |
| New York except New York City, Rochester and Syracuse | 135 | 340 | 46,000 | 75.1 |
| Five highest areas | ||||
| Minnesota: Rochester Area | 369 | 187 | 69,000 | 81.5 |
| District of Columbia | 404 | 276 | 101,302 | 58.8 |
| Hawaii: Honolulu | 422 | 326 | 137,540 | 60.8 |
| Rhode Island except Providence | 458 | 276 | 126,500 | 77.7 |
| Connecticut: Stamford Area | 595 | 425 | 253,000 | 74.8 |
| Older Homeowners Only | ||||
| Five lowest areas | ||||
| New York: Syracuse | 173 | 329 | 57,040 | 74.8 |
| New York: Rochester | 174 | 344 | 59,800 | 74.6 |
| Pennsylvania: Pittsburgh | 191 | 301 | 57,500 | 74.4 |
| Indiana except Fort Wayne and Indianapolis | 194 | 237 | 46,000 | 80.0 |
| New York except New York City, Rochester and Syracuse | 203 | 340 | 69,000 | 75.1 |
| Five highest areas | ||||
| California: San Diego | 655 | 271 | 177,462 | 64.3 |
| District of Columbia | 667 | 276 | 169,554 | 58.8 |
| Hawaii: Honolulu | 803 | 326 | 261,740 | 60.8 |
| California: Los Angeles | 822 | 250 | 205,551 | 56.2 |
| Connecticut: Stamford Area | 839 | 425 | 356,500 | 74.8 |
| SOURCE: Authors' calculations from 2011 ACS matched to MetLife (2011) using 2010 HRS to impute mortgage values for those who report holding a mortgage. The sample includes all adults age 65 or older. Per capita home equity values are reduced to account for potential transaction costs. See text for further information. All statistics are medians. | ||||
Appendix
| FIGURE A-1. Comparison of Distributions of Per Capita Net Home Equity in the ACS and HRS, 2010: People Age 65 and Older |
|---|
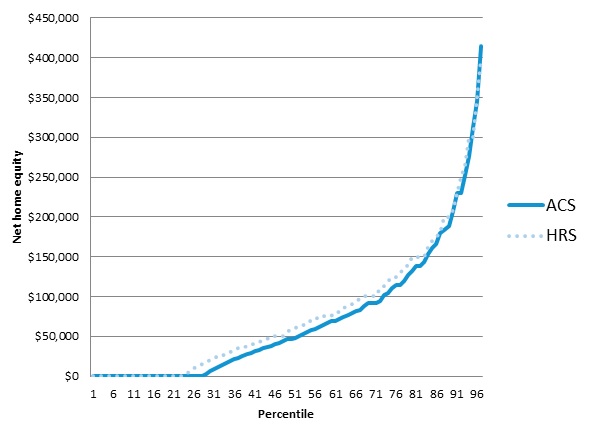 |
| SOURCE: Authors' calculations from ACS and HRS. Per capita home equity values are reduced to account for potential transaction costs (see text). |
| TABLE A-1. Median Days of Private Room Nursing Home Care that Net Home Equity Could Finance, by States for All Older Adults | ||||
|---|---|---|---|---|
| Area | Days in Nursing Home | Daily Cost of Nursing Home ($) | Per Capita Net Home Equity ($) | Home-Ownership (%) |
| Alabama | 230 | 180 | 41,400 | 79.0 |
| Alaska | 122 | 655 | 79,918 | 74.8 |
| Arizona | 174 | 228 | 40,182 | 76.6 |
| Arkansas | 218 | 161 | 35,810 | 78.6 |
| California | 210 | 272 | 61,194 | 62.8 |
| Colorado | 302 | 235 | 69,000 | 74.7 |
| Connecticut | 236 | 370 | 92,000 | 70.5 |
| Delaware | 337 | 260 | 87,400 | 77.9 |
| District of Columbia | 256 | 315 | 80,500 | 58.8 |
| Florida | 146 | 253 | 37,328 | 73.1 |
| Georgia | 220 | 195 | 38,212 | 72.8 |
| Hawaii | 317 | 326 | 114,604 | 61.2 |
| Idaho | 221 | 204 | 46,000 | 79.0 |
| Illinois | 264 | 198 | 49,642 | 74.1 |
| Indiana | 163 | 237 | 37,235 | 77.7 |
| Iowa | 271 | 153 | 42,208 | 80.9 |
| Kansas | 225 | 161 | 36,800 | 77.7 |
| Kentucky | 193 | 195 | 40,340 | 79.1 |
| Louisiana | 294 | 141 | 41,400 | 76.2 |
| Maine | 176 | 270 | 48,707 | 72.8 |
| Maryland | 302 | 285 | 82,800 | 70.7 |
| Massachusetts | 264 | 356 | 92,000 | 67.2 |
| Michigan | 172 | 235 | 38,771 | 78.3 |
| Minnesota | 270 | 216 | 57,316 | 77.3 |
| Mississippi | 176 | 199 | 34,500 | 77.7 |
| Missouri | 247 | 157 | 41,400 | 77.3 |
| Montana | 308 | 194 | 59,800 | 81.0 |
| Nebraska | 218 | 162 | 36,800 | 78.0 |
| Nevada | 123 | 215 | 27,600 | 65.9 |
| New Hampshire | 255 | 299 | 77,560 | 74.4 |
| New Jersey | 283 | 387 | 92,000 | 67.3 |
| New Mexico | 217 | 212 | 46,823 | 77.0 |
| New York | 122 | 387 | 41,448 | 59.1 |
| North Carolina | 227 | 195 | 46,000 | 77.0 |
| North Dakota | 160 | 172 | 27,600 | 73.3 |
| Ohio | 183 | 219 | 40,391 | 76.2 |
| Oklahoma | 220 | 183 | 36,800 | 80.2 |
| Oregon | 258 | 256 | 65,320 | 73.8 |
| Pennsylvania | 178 | 285 | 46,000 | 72.7 |
| Rhode Island | 256 | 288 | 73,600 | 66.2 |
| South Carolina | 229 | 191 | 45,080 | 78.5 |
| South Dakota | 175 | 186 | 32,478 | 74.3 |
| Tennessee | 247 | 186 | 46,000 | 77.3 |
| Texas | 190 | 190 | 34,500 | 72.0 |
| Utah | 332 | 230 | 69,374 | 81.7 |
| Vermont | 264 | 279 | 73,600 | 80.2 |
| Virginia | 362 | 190 | 69,000 | 75.0 |
| Washington | 275 | 269 | 71,300 | 72.7 |
| West Virginia | 143 | 240 | 34,417 | 80.1 |
| Wisconsin | 229 | 228 | 54,883 | 75.7 |
| Wyoming | 278 | 212 | 59,012 | 78.7 |
| SOURCE: Authors' calculations from 2011 ACS matched to MetLife (2011) using 2010 HRS to impute mortgage values for those who report holding a mortgage. The sample includes all adults age 65 or older. Per capita home equity values are reduced to account for potential transaction costs. See text for further information. | ||||
| TABLE A-2. Median Days of Private Room Nursing Home Care that Net Home Equity Could Finance, by States for Older Homeowners | |||
|---|---|---|---|
| Area | Days in Nursing Home | Daily Cost of Nursing Home ($) | Per Capita Net Home Equity ($) |
| Alabama | 307 | 180 | 55,295 |
| Alaska | 156 | 655 | 102,111 |
| Arizona | 266 | 228 | 61,856 |
| Arkansas | 286 | 161 | 46,000 |
| California | 538 | 272 | 156,737 |
| Colorado | 413 | 235 | 93,066 |
| Connecticut | 342 | 370 | 136,179 |
| Delaware | 414 | 260 | 107,014 |
| District of Columbia | 739 | 315 | 232,823 |
| Florida | 246 | 253 | 62,944 |
| Georgia | 354 | 166 | 62,187 |
| Hawaii | 668 | 326 | 230,000 |
| Idaho | 292 | 204 | 64,061 |
| Illinois | 398 | 198 | 76,411 |
| Indiana | 212 | 237 | 47,840 |
| Iowa | 350 | 153 | 55,200 |
| Kansas | 299 | 161 | 47,840 |
| Kentucky | 257 | 195 | 54,954 |
| Louisiana | 444 | 141 | 64,400 |
| Maine | 272 | 270 | 74,520 |
| Maryland | 438 | 285 | 119,600 |
| Massachusetts | 425 | 356 | 149,500 |
| Michigan | 235 | 235 | 54,249 |
| Minnesota | 362 | 216 | 77,348 |
| Mississippi | 231 | 199 | 46,000 |
| Missouri | 346 | 157 | 56,908 |
| Montana | 417 | 194 | 80,500 |
| Nebraska | 284 | 162 | 46,000 |
| Nevada | 278 | 215 | 63,621 |
| New Hampshire | 323 | 299 | 97,980 |
| New Jersey | 418 | 387 | 144,900 |
| New Mexico | 326 | 212 | 73,012 |
| New York | 343 | 387 | 126,040 |
| North Carolina | 330 | 195 | 68,080 |
| North Dakota | 273 | 172 | 46,875 |
| Ohio | 252 | 211 | 55,200 |
| Oklahoma | 288 | 183 | 46,000 |
| Oregon | 379 | 256 | 94,951 |
| Pennsylvania | 266 | 285 | 71,472 |
| Rhode Island | 417 | 288 | 118,086 |
| South Carolina | 313 | 191 | 62,100 |
| South Dakota | 253 | 186 | 47,002 |
| Tennessee | 341 | 186 | 64,400 |
| Texas | 291 | 190 | 55,200 |
| Utah | 392 | 230 | 84,262 |
| Vermont | 330 | 279 | 92,000 |
| Virginia | 484 | 190 | 95,037 |
| Washington | 411 | 252 | 109,940 |
| West Virginia | 192 | 240 | 46,000 |
| Wisconsin | 303 | 228 | 73,155 |
| Wyoming | 380 | 212 | 80,500 |
| SOURCE: Authors' calculations from 2011 ACS matched to MetLife (2011) using 2010 HRS to impute mortgage values for those who report holding a mortgage. The sample includes all adults age 65 or older. Per capita home equity values are reduced to account for potential transaction costs. See text for further information. | |||
| TABLE A-3. Median Days of Private Room Nursing Home Care that Net Home Equity Could Finance, by Metropolitan and NonMetropolitan Areas for All Older Adults | ||||
|---|---|---|---|---|
| Area | Days in Nursing Home | Daily Cost of Nursing Home ($) | Per Capita Net Home Equity ($) | Home-Ownership (%) |
| Alabama: Birmingham | 274 | 185 | 50,600 | 79.0 |
| Alabama: Montgomery | 194 | 202 | 39,163 | 76.3 |
| Alabama except Birmingham and Montgomery | 225 | 180 | 40,480 | 79.3 |
| Arizona: Phoenix | 175 | 223 | 39,100 | 74.3 |
| Arizona: Tucson | 178 | 259 | 46,000 | 75.2 |
| Arizona except Phoenix and Tucson | 168 | 228 | 38,392 | 81.4 |
| Arkansas: Little Rock | 272 | 169 | 46,000 | 80.8 |
| Arkansas except Little Rock | 209 | 161 | 33,729 | 78.1 |
| California: Los Angeles | 246 | 250 | 61,485 | 56.2 |
| California: San Diego | 325 | 271 | 88,199 | 64.3 |
| California: San Francisco | 196 | 485 | 95,147 | 62.3 |
| California except Los Angeles, San Diego and San Francisco | 188 | 272 | 51,060 | 67.6 |
| Colorado: Colorado Springs | 267 | 225 | 60,048 | 76.0 |
| Colorado: Denver | 305 | 235 | 71,765 | 70.8 |
| Colorado except Colorado Springs/Denver | 309 | 223 | 69,000 | 78.6 |
| Connecticut: Hartford | 187 | 410 | 76,487 | 68.5 |
| Connecticut: Stamford Area | 595 | 425 | 253,000 | 74.8 |
| Connecticut except Hartford Stamford | 238 | 370 | 87,917 | 70.5 |
| Delaware: Wilmington | 340 | 257 | 87,400 | 75.8 |
| Delaware except Wilmington | 329 | 260 | 85,478 | 80.0 |
| District of Columbia | 404 | 315 | 101,302 | 58.8 |
| Florida: Jacksonville | 217 | 212 | 46,000 | 71.8 |
| Florida: Miami | 0 | 306 | 0 | 50.2 |
| Florida: Orlando | 110 | 256 | 28,038 | 69.9 |
| Florida except Jacksonville, Miami and Orlando | 164 | 253 | 41,400 | 76.8 |
| Georgia: Atlanta | 201 | 195 | 39,100 | 68.7 |
| Georgia except Atlanta | 222 | 166 | 36,900 | 75.8 |
| Hawaii: Honolulu | 422 | 326 | 137,540 | 60.8 |
| Hawaii except Honolulu | 195 | 413 | 80,500 | 62.1 |
| Idaho: Boise | 156 | 236 | 36,800 | 77.1 |
| Idaho except Boise | 243 | 204 | 49,595 | 79.9 |
| Illinois: Chicago | 323 | 198 | 63,940 | 69.9 |
| Illinois: Peoria | 230 | 240 | 55,200 | 84.2 |
| Illinois except Chicago and Peoria | 211 | 174 | 36,800 | 80.6 |
| Indiana: Fort Wayne | 196 | 235 | 46,000 | 80.8 |
| Indiana: Indianapolis | 161 | 229 | 36,800 | 74.4 |
| Indiana except Fort Wayne and Indianapolis | 155 | 237 | 36,800 | 80.0 |
| Iowa: Des Moines | 217 | 195 | 42,262 | 75.6 |
| Iowa except Des Moines | 276 | 153 | 42,208 | 81.5 |
| Kansas: Wichita | 186 | 177 | 32,959 | 74.3 |
| Kansas except Wichita | 200 | 161 | 32,200 | 79.7 |
| Kentucky: Lexington | 341 | 216 | 73,600 | 78.6 |
| Kentucky: Louisville | 193 | 240 | 46,267 | 74.6 |
| Kentucky except Lexington and Louisville | 189 | 195 | 36,800 | 80.0 |
| Louisiana: Baton Rouge | 331 | 153 | 50,600 | 80.4 |
| Louisiana: Shreveport Area | 254 | 145 | 36,800 | 79.5 |
| Louisiana except Baton Rouge and Shreveport Area | 294 | 141 | 41,400 | 75.1 |
| Maine: Southern Maine | 180 | 297 | 53,594 | 64.5 |
| Maine except Southern Maine | 176 | 270 | 47,617 | 74.4 |
| Maryland: Baltimore | 276 | 285 | 78,692 | 69.5 |
| Maryland except Baltimore | 290 | 258 | 74,765 | 71.8 |
| Massachusetts: Boston | 305 | 356 | 108,560 | 65.7 |
| Massachusetts: Worcester | 210 | 333 | 69,898 | 63.1 |
| Massachusetts except Boston and Worcester | 232 | 357 | 82,800 | 70.6 |
| Michigan: Detroit | 178 | 198 | 35,243 | 75.2 |
| Michigan: Grand Rapids | 168 | 273 | 46,000 | 77.9 |
| Michigan except Detroit, Grand Rapids | 170 | 235 | 40,020 | 80.9 |
| Minnesota: Minneapolis/Saint Paul | 309 | 216 | 66,700 | 73.7 |
| Minnesota: Rochester Area | 369 | 187 | 69,000 | 81.5 |
| Minnesota except Minneapolis, Saint Paul and Rochester | 232 | 206 | 47,840 | 80.9 |
| Mississippi: Jackson | 198 | 186 | 36,800 | 74.6 |
| Mississippi except Jackson | 173 | 199 | 34,500 | 78.4 |
| Missouri: Kansas City | 286 | 157 | 44,890 | 74.5 |
| Missouri: Saint Louis | 279 | 186 | 51,981 | 77.6 |
| Missouri except Kansas City, Saint Louis | 237 | 149 | 35,276 | 78.9 |
| Montana: Billings | 304 | 193 | 58,628 | 80.2 |
| Montana except Billings | 313 | 194 | 60,750 | 81.1 |
| Nebraska: Omaha | 213 | 211 | 44,932 | 75.6 |
| Nebraska except Omaha | 221 | 162 | 35,880 | 79.0 |
| Nevada: Las Vegas | 106 | 215 | 22,857 | 62.0 |
| Nevada except Las Vegas | 169 | 248 | 41,815 | 74.1 |
| New Hampshire: Manchester | 163 | 330 | 53,836 | 58.7 |
| New Hampshire except Manchester | 263 | 299 | 78,583 | 75.6 |
| New Mexico: Albuquerque | 244 | 226 | 55,200 | 72.7 |
| New Mexico except Albuquerque | 217 | 212 | 46,000 | 79.7 |
| New York: New York | 155 | 387 | 59,800 | 52.8 |
| New York: Rochester | 132 | 344 | 45,483 | 74.6 |
| New York: Syracuse | 135 | 329 | 44,540 | 74.8 |
| New York except New York, Rochester and Syracuse | 135 | 340 | 46,000 | 75.1 |
| North Carolina: Charlotte | 201 | 228 | 45,914 | 75.3 |
| North Carolina: Raleigh/Durham | 224 | 242 | 54,280 | 73.8 |
| North Carolina except Charlotte and Raleigh/Durham | 236 | 195 | 46,000 | 78.1 |
| North Dakota: Fargo Area | 188 | 182 | 34,127 | 67.5 |
| North Dakota except Fargo Area | 160 | 172 | 27,600 | 74.3 |
| Ohio: Cincinnati | 178 | 233 | 41,400 | 73.8 |
| Ohio: Cleveland | 178 | 241 | 42,909 | 73.9 |
| Ohio: Columbus | 191 | 219 | 41,849 | 71.5 |
| Ohio except Cincinnati, Cleveland and Columbus | 185 | 211 | 38,985 | 78.3 |
| Oklahoma: Oklahoma City | 198 | 209 | 41,400 | 74.3 |
| Oklahoma: Tulsa | 223 | 183 | 40,823 | 79.5 |
| Oklahoma except Oklahoma City and Tulsa | 230 | 150 | 34,500 | 82.8 |
| Oregon: Eugene | 242 | 257 | 62,237 | 74.5 |
| Oregon: Portland | 297 | 243 | 72,201 | 69.4 |
| Oregon except Eugene and Portland | 244 | 256 | 62,560 | 77.1 |
| Pennsylvania: Philadelphia | 242 | 285 | 69,000 | 68.9 |
| Pennsylvania: Pittsburgh | 138 | 301 | 41,400 | 74.4 |
| Pennsylvania: Scranton | 175 | 236 | 41,400 | 71.4 |
| Pennsylvania except Philadelphia, Pittsburgh and Scranton | 178 | 259 | 46,000 | 75.0 |
| Rhode Island: Providence | 222 | 288 | 64,023 | 62.6 |
| Rhode Island except Providence | 458 | 276 | 126,500 | 77.7 |
| South Carolina: Charleston | 296 | 194 | 57,488 | 77.3 |
| South Carolina: Columbia | 199 | 210 | 41,850 | 77.0 |
| South Carolina except Charleston and Columbia | 229 | 191 | 43,700 | 78.9 |
| Tennessee: Memphis | 183 | 191 | 34,966 | 66.9 |
| Tennessee: Nashville | 285 | 200 | 57,006 | 74.4 |
| Tennessee except Memphis, Nashville | 247 | 186 | 46,000 | 79.9 |
| Texas: Austin | 311 | 203 | 63,209 | 71.4 |
| Texas: Dallas/Fort Worth | 202 | 190 | 38,317 | 69.5 |
| Texas: Houston | 172 | 198 | 34,079 | 66.7 |
| Texas except Austin, Dallas/Fort Worth and Houston | 182 | 177 | 32,200 | 74.7 |
| Utah: Salt Lake City | 313 | 230 | 71,986 | 79.3 |
| Utah except Salt Lake City | 343 | 201 | 69,000 | 84.8 |
| Virginia: Richmond Area | 305 | 211 | 64,400 | 71.0 |
| Virginia except Richmond Area | 334 | 190 | 63,480 | 75.7 |
| Washington: Seattle | 323 | 285 | 92,000 | 67.4 |
| Washington: Spokane | 205 | 269 | 55,200 | 74.4 |
| Washington except Seattle and Spokane | 274 | 252 | 69,000 | 75.7 |
| Wisconsin: Madison Area | 321 | 251 | 80,500 | 80.4 |
| Wisconsin: Milwaukee | 218 | 274 | 59,800 | 67.1 |
| Wisconsin except Madison Area and Milwaukee | 222 | 228 | 50,600 | 78.4 |
| SOURCE: Authors' calculations from 2011 ACS matched to MetLife (2011) using 2010 HRS to impute mortgage values for those who report holding a mortgage. The sample includes all adults age 65 or older. Per capita home equity values are reduced to account for potential transaction costs. The following states have no metropolitan area in MetLife (2011): Alaska, Vermont and Wyoming. The following states have metropolitan areas in MetLife (2011) but no corresponding metropolitan areas in the ACS: New Jersey, South Dakota and West Virginia. These states are not displayed in the table. | ||||
| TABLE A-4. Median Days of Private Room Nursing home Care that Net Home Equity Could Finance, by Metropolitan and NonMetropolitan Areas for Homeowners | |||
|---|---|---|---|
| Area | Days in Nursing Home | Daily Cost of Nursing Home ($) | Per Capita Net Home Equity ($) |
| Alabama: Birmingham | 373 | 185 | 69,000 |
| Alabama: Montgomery | 285 | 202 | 57,500 |
| Alabama except Birmingham and Montgomery | 299 | 180 | 53,750 |
| Arizona: Phoenix | 289 | 223 | 64,400 |
| Arizona: Tucson | 284 | 259 | 73,600 |
| Arizona except Phoenix and Tucson | 238 | 228 | 54,306 |
| Arkansas: Little Rock | 381 | 169 | 64,400 |
| Arkansas except Little Rock | 286 | 161 | 46,000 |
| California: Los Angeles | 822 | 250 | 205,551 |
| California: San Diego | 655 | 271 | 177,462 |
| California: San Francisco | 474 | 485 | 230,000 |
| California except Los Angeles, San Diego and San Francisco | 389 | 272 | 105,800 |
| Colorado: Colorado Springs | 368 | 225 | 82,800 |
| Colorado: Denver | 470 | 235 | 110,400 |
| Colorado except Colorado Springs and Denver | 411 | 223 | 91,598 |
| Connecticut: Hartford | 280 | 410 | 115,000 |
| Connecticut: Stamford Area | 839 | 425 | 356,500 |
| Connecticut except Hartford and Stamford Area | 336 | 370 | 124,200 |
| Delaware: Wilmington | 447 | 257 | 115,000 |
| Delaware except Wilmington | 389 | 260 | 101,200 |
| District of Columbia | 667 | 315 | 169,554 |
| Florida: Jacksonville | 325 | 212 | 69,000 |
| Florida: Miami | 263 | 306 | 80,500 |
| Florida: Orlando | 216 | 256 | 55,194 |
| Florida except Jacksonville, Miami and Orlando | 241 | 253 | 60,905 |
| Georgia: Atlanta | 354 | 195 | 69,000 |
| Georgia except Atlanta | 344 | 166 | 57,142 |
| Hawaii: Honolulu | 803 | 326 | 261,740 |
| Hawaii except Honolulu | 404 | 413 | 166,980 |
| Idaho: Boise | 234 | 236 | 55,200 |
| Idaho except Boise | 338 | 204 | 69,000 |
| Illinois: Chicago | 488 | 198 | 96,600 |
| Illinois: Peoria | 268 | 240 | 64,400 |
| Illinois except Chicago and Peoria | 264 | 174 | 46,000 |
| Indiana: Fort Wayne | 232 | 235 | 54,610 |
| Indiana: Indianapolis | 241 | 229 | 55,200 |
| Indiana except Fort Wayne and Indianapolis | 194 | 237 | 46,000 |
| Iowa: Des Moines | 315 | 195 | 61,381 |
| Iowa except Des Moines | 361 | 153 | 55,200 |
| Kansas: Wichita | 286 | 177 | 50,600 |
| Kansas except Wichita | 271 | 161 | 43,700 |
| Kentucky: Lexington | 394 | 216 | 85,100 |
| Kentucky: Louisville | 279 | 240 | 66,994 |
| Kentucky except Lexington and Louisville | 236 | 195 | 46,000 |
| Louisiana: Baton Rouge | 362 | 153 | 52,440 |
| Louisiana: Shreveport Area | 457 | 145 | 64,400 |
| Louisiana except Baton Rouge and Shreveport Area | 310 | 141 | 92,000 |
| Maine: Southern Maine | 451 | 297 | 69,000 |
| Maine except Southern Maine | 256 | 270 | 69,000 |
| Maryland: Baltimore | 404 | 285 | 115,000 |
| Maryland except Baltimore | 389 | 258 | 100,459 |
| Massachusetts: Boston | 487 | 356 | 173,510 |
| Massachusetts: Worcester | 345 | 333 | 115,000 |
| Massachusetts except Boston and Worcester | 348 | 357 | 124,200 |
| Michigan: Detroit | 267 | 198 | 52,900 |
| Michigan: Grand Rapids | 227 | 273 | 62,100 |
| Michigan except Detroit and Grand Rapids | 224 | 235 | 52,529 |
| Minnesota: Minneapolis/Saint Paul | 414 | 216 | 89,517 |
| Minnesota: Rochester Area | 430 | 187 | 80,500 |
| Minnesota except Minneapolis/Saint Paul and Rochester | 313 | 206 | 64,400 |
| Mississippi: Jackson | 325 | 186 | 60,444 |
| Mississippi except Jackson | 231 | 199 | 46,000 |
| Missouri: Kansas City | 396 | 157 | 62,100 |
| Missouri: Saint Louis | 371 | 186 | 69,000 |
| Missouri except Kansas City and Saint Louis | 309 | 149 | 46,000 |
| Montana: Billings | 381 | 193 | 73,600 |
| Montana except Billings | 427 | 194 | 82,800 |
| Nebraska: Omaha | 270 | 211 | 56,929 |
| Nebraska except Omaha | 284 | 162 | 46,000 |
| Nevada: Las Vegas | 278 | 215 | 59,721 |
| Nevada except Las Vegas | 284 | 248 | 70,480 |
| New Hampshire: Manchester | 293 | 330 | 96,600 |
| New Hampshire except Manchester | 328 | 299 | 97,980 |
| New Mexico: Albuquerque | 361 | 226 | 81,683 |
| New Mexico except Albuquerque | 325 | 212 | 69,000 |
| New York: New York | 526 | 387 | 203,477 |
| New York: Rochester | 174 | 344 | 59,800 |
| New York: Syracuse | 173 | 329 | 57,040 |
| New York except New York, Rochester and Syracuse | 203 | 340 | 69,000 |
| North Carolina: Charlotte | 302 | 228 | 68,760 |
| North Carolina: Raleigh/Durham | 331 | 242 | 80,030 |
| North Carolina except Charlotte and Raleigh/Durham | 330 | 195 | 64,400 |
| North Dakota: Fargo Area | 379 | 182 | 69,000 |
| North Dakota except Fargo Area | 267 | 172 | 46,000 |
| Ohio: Cincinnati | 266 | 233 | 61,894 |
| Ohio: Cleveland | 256 | 241 | 61,640 |
| Ohio: Columbus | 291 | 219 | 63,707 |
| Ohio except Cincinnati, Cleveland and Columbus | 240 | 211 | 50,600 |
| Oklahoma: Oklahoma City | 275 | 209 | 57,500 |
| Oklahoma: Tulsa | 302 | 183 | 55,200 |
| Oklahoma except Oklahoma City and Tulsa | 293 | 150 | 43,924 |
| Oregon: Eugene | 358 | 257 | 92,000 |
| Oregon: Portland | 470 | 243 | 114,329 |
| Oregon except Eugene and Portland | 327 | 256 | 83,720 |
| Pennsylvania: Philadelphia | 381 | 285 | 108,668 |
| Pennsylvania: Pittsburgh | 191 | 301 | 57,500 |
| Pennsylvania: Scranton | 253 | 236 | 59,800 |
| Pennsylvania except Philadelphia, Pittsburgh and Scranton | 266 | 259 | 69,000 |
| Rhode Island: Providence | 383 | 288 | 110,400 |
| Rhode Island except Providence | 582 | 276 | 160,540 |
| South Carolina: Charleston | 448 | 194 | 86,940 |
| South Carolina: Columbia | 288 | 210 | 60,547 |
| South Carolina except Charleston and Columbia | 303 | 191 | 57,960 |
| Tennessee: Memphis | 335 | 191 | 63,908 |
| Tennessee: Nashville | 381 | 200 | 76,210 |
| Tennessee except Memphis and Nashville | 322 | 186 | 59,800 |
| Texas: Austin | 449 | 203 | 91,080 |
| Texas: Dallas/Fort Worth | 315 | 190 | 59,800 |
| Texas: Houston | 302 | 198 | 59,800 |
| Texas except Austin, Dallas/Fort Worth and Houston | 260 | 177 | 46,000 |
| Utah: Salt Lake City | 393 | 230 | 90,439 |
| Utah except Salt Lake City | 392 | 201 | 78,728 |
| Virginia: Richmond Area | 436 | 211 | 92,000 |
| Virginia except Richmond Area | 436 | 190 | 82,800 |
| Washington: Seattle | 516 | 285 | 147,200 |
| Washington: Spokane | 279 | 269 | 74,980 |
| Washington except Seattle and Spokane | 370 | 252 | 93,164 |
| Wisconsin: Madison Area | 367 | 251 | 92,000 |
| Wisconsin: Milwaukee | 326 | 274 | 89,358 |
| Wisconsin except Madison Area and Milwaukee | 293 | 228 | 66,700 |
| SOURCE: Authors' calculations from 2011 ACS matched to MetLife (2011) using 2010 HRS to impute mortgage values for those who report holding a mortgage. The sample includes all adults age 65 or older. Per capita home equity values are reduced to account for potential transaction costs.The following states have no metropolitan area in MetLife (2011): Alaska, Vermont and Wyoming. The following states have metropolitan areas in MetLife (2011) but no corresponding metropolitan areas in the ACS: New Jersey, South Dakota and West Virginia. These states are not displayed in the table. | |||
ABOUT THE AUTHOR:
Stephan Lindner a research associate in the Income and Benefits Policy Center at the Urban Institute and a senior research association in the Center for Health Systems Effectiveness at the Oregon Health and Science University (OHSU). His research examines social insurance and welfare programs--in particular, Social Security Disability Insurance, Supplemental Security Income, and unemployment insurance. He is interested in how economic circumstances, income sources, and program characteristics influence program participation for displaced and disabled workers. More recently, he has examined efforts to improve cardiovascular disease prevention in primary care clinics. He earned his M.A. and Ph.D. in economics from the University of Michigan.
The author thanks John Drabek and Pamela Doty of ASPE and Melissa Favreault, Richard Johnson, and Brenda Spillman of the Urban Institute for comments on earlier drafts. Melissa Favreault also provided support with the HRS data analyses.
Where Do People with Disabilities Live?
This report was prepared under contract #HHSP23320100025W1 between the U.S. Department of Health and Human Services (HHS), Office of Disability, Aging and Long-Term Care Policy (DALTCP) and the Urban Institute. For additional information about this subject, you can visit the DALTCP home page at http://aspe.hhs.gov/office-disability-aging-and-long-term-care-policy-daltcp or contact the ASPE Project Officers, John Drabek and Pamela Doty, at HHS/ASPE/DALTCP, Room 424E, H.H. Humphrey Building, 200 Independence Avenue, S.W., Washington, D.C. 20201; John.Drabek@hhs.gov, Pamela.Doty@hhs.gov.
Reports Available
How Much Nursing Home Care Can Home Equity Finance?
- HTML: https://aspe.hhs.gov/basic-report/how-much-nursing-home-care-can-home-equity-finance
- PDF: https://aspe.hhs.gov/pdf-report/how-much-nursing-home-care-can-home-equity-finance
Later-Life Household Wealth Before and After Disability Onset
- HTML: https://aspe.hhs.gov/basic-report/later-life-household-wealth-and-after-disability-onset
- PDF: https://aspe.hhs.gov/pdf-report/later-life-household-wealth-and-after-disability-onset
Older Adults' Living Expenses and the Adequacy of Income Allowances for Medicaid Home and Community-Based Services