
Effectiveness of Alternative Ways of Implementing Care Management Components in Medicare D-SNPs: The Care Wisconsin and Gateway Study
Jelena Zurovac, Randy Brown, Bob Schmitz and Richard Chapman
Mathematica Policy Research
January 2014
Printer Friendly Version in PDF Format: http://aspe.hhs.gov/daltcp/reports/2014/OrthoV1.pdf (80 PDF pages)Free PDF Reader: http://get.adobe.com/reader/ 
This report was prepared under contract #HHSP23320095642WC between the U.S. Department of Health and Human Services (HHS), Office of Disability, Aging and Long-Term Care Policy (DALTCP) and Mathematica Policy Research. For additional information about this subject, you can visit the DALTCP home page at http://aspe.hhs.gov/office_specific/daltcp.cfm or contact the ASPE Project Officer, Hakan Aykan, at HHS/ASPE/DALTCP, Room 424E, H.H. Humphrey Building, 200 Independence Avenue, S.W., Washington, D.C. 20201. His e-mail address is: Hakan.Aykan@hhs.gov.
The opinions and views expressed in this report are those of the authors. They do not necessarily reflect the views of the Department of Health and Human Services, the contractor or any other funding organization.
TABLE OF CONTENTS
- I. INTRODUCTION
- A. Background
- B. About the Participants
- C. Roadmap to the Report
- II. INTERVENTION COMPONENTS
- A. Description of Intervention Components
- B. Hypotheses
- III. STUDY DESIGN AND ANALYSIS METHODS
- A. Study Design
- B. Data
- C. Impact Analysis Methods
- D. Implementation Analysis Methods
- IV. STUDY FINDINGS
- A. Quantitative Impact Analysis Findings
- V. IMPLEMENTATION ANALYSIS
- A. Fidelity Analysis Using Tracking Tool Data
- B. Implementation Analysis: Care Managers' Feedback on Implementation Challenges
- VI. DISCUSSION AND CONCLUSIONS
- A. Interpretation of Impact Analysis Findings
- B. Limitations
- C. Conclusions
- D. Implications for Policy and Practice
- APPENDICES
- APPENDIX A: Intervention Components and Routine Care at Participating Plans
- APPENDIX B: Randomization and Intervention Assignments
- APPENDIX C: Regression Analysis Results
- APPENDIX D: Additional Feedback From Care Managers
- LIST OF FIGURES
- FIGURE IV.1: Number of Inpatient Admissions per Member per Year by Care Manager One Year Before the Study, Adjusted for Member Risk
- FIGURE IV.2: Proportion of Members Readmitted per Year by Care Manager One Year Before the Study, Adjusted for Member Risk
- FIGURE IV.3: Number of ER Visits per Member per Year by Care Manager One Year Before the Study, Adjusted for Member Risk
- LIST OF TABLES
- TABLE II.1: List of Intervention Components and Options Tested as Part of Study
- TABLE II.2: Intervention Components and Targeted Outcomes
- TABLE III.1: Key Outcomes Analyzed in the Study
- TABLE III.2: Construction of Frequency and Fidelity Implementation Measures
- TABLE IV.1: Demographic Characteristics of Study Participants
- TABLE IV.2: Use of Hospital and ER Services at Baseline and Follow-up
- TABLE IV.3: Average Outcomes at Follow-up for Members Assigned to Enhanced or Routine Care
- TABLE V.1: Percentage of Members Assigned to an Option Who Received or Refused That Option at Least Once
- TABLE V.2: Number of Times an Option Was Provided to Members Assigned to That Option
- TABLE V.3: Percentage of Members Who Received Each Option at Least as Often as Assigned
- TABLE A1: Intervention Components and Routine Care at Participating Plans
- TABLE B1: Care Manager Random Assignments to Intervention Component Combinations
- TABLE B2: Proportion of Members Assigned to Enhanced Care for Each Intervention Component
- TABLE C1: Heckman-Hotz Analysis: Effect of Components on Baseline Outcomes
- TABLE C2: Effects of Components on Number of Hospital Admissions, Number of ER Visits, and Likelihood of Readmission
ABSTRACT
Objective: Test which of two alternative ways of implementing each of ten components of care management lead to better health outcomes in two participating special needs plans. The tested alternatives were routine care (services routinely provided before the study) or enhanced care (more intensive versions of the services) in provision of routine contacts, falls-risk screening, depression screening, member coaching, and care transitions management.
Study Design and Data: An experimental design approach rarely used in health research--efficient orthogonal design--was used to assign each of 24 participating care teams to implement a different, pre-selected combination of routine or enhanced care for each of ten components, for a one-year period to the plan members whose care they manage (a total of 1,562 members). The plans' claims data were used to measure members' service use and chronic conditions; enrollment files provided data on demographics. Fidelity to assigned component options was assessed using data from plan-administered tracking tool sheets filled out by care managers after each encounter and through discussions with care management staff.
Key Outcomes: Health outcomes assessed were: (1) the number of inpatient admissions; (2) the incidence of readmission within 30 days of any discharge (including those for mental health problems) and within 30 days of a discharge from a stay for treatment of physical problems only; and (3) the number of emergency room (ER) visits. Fidelity outcomes were: (1) the proportion of members receiving the assigned option at least once; (2) the annualized number of times each component or option was provided per member; and (3) the proportion of members receiving the option at least as often as assigned.
Analysis Methods: Regression analysis was used to estimate differences in outcomes between members receiving routine and enhanced care. All three outcomes were analyzed over the 1-6, 7-12, and the full 1-12 month follow-up periods for all members. Readmissions were analyzed for hospitalized members over the 1-12 month follow-up. Fidelity to assignments was analyzed using tracking tool data and interpreted in light of qualitative analysis of discussions with plan staff.
Select Results: Over the full year of follow-up: (1) those assigned to more frequent contacts and medication reviews had 16 percent fewer ER visits; and (2) those assigned to use of the teachback method had 15 percent more ER visits. Fidelity analysis showed that few members in both the enhanced and routine care groups received at least the minimum number of services specified in the study protocol, likely reflecting various barriers to implementation. Furthermore, the number of significant differences was about what would be expected by chance for the 80 comparisons (two outcomes were analyzed for ten components for all members over three periods and two outcomes for ten components for hospitalized members). Thus, these few significant differences may be simply due to chance.
Conclusions: The study findings suggest that only one of the interventions tested (more frequent routine contacts and medication review) appeared to have led to improved outcomes, but the lack of consistency of favorable findings across outcomes for this intervention, and the anomalous finding for the teachback method, make even this finding suspect. Three factors likely contributed to this paucity of significant results: (1) weak interventions; (2) limited implementation of the intended interventions; and (3) inadequate statistical power. However, despite the absence of significant differences in outcomes between enhanced and standard versions of intervention components, the programs did learn some important lessons. In some ways, the most important benefit of an orthogonal design study, as we have seen from the reaction of the participating plans, might be the clarification of expectations about interventions that it provides, rather than whether the enhancements produce better outcomes. When routine care is not well defined or when the way routine care is implemented differs across care managers, the clarity provided by the study can help standardize the care management intervention, leading to less variation in implementation across managers. Further, in our study, analysis of the fidelity to the intervention allowed participating plans to assess the degree to which components were carried out as specified, which can help the plan identify which areas of care management to focus on in their quality improvement efforts. The orthogonal design approach also encourages organizations to create a culture of learning by providing participants with a rigorous approach for testing out their new ideas. To maximize learning from orthogonal design studies, effort should be put into defining intervention changes that are expected to have a high likelihood of improving key outcomes, and to getting buy-in from the operational units to ensure that the planned interventions are faithfully implemented. To ensure the findings from the orthogonal design are true effects with actionable implications, studies need to have enough operational units (for example, care managers) to provide adequate power to detect modest size effects.
ACRONYMS
The following acronyms are mentioned in this report and/or appendices.
| ACCESS | Alzheimer's Disease Coordinated Care for San Diego Seniors |
| C-SNP | SNP serving beneficiaries with chronic conditions |
| CMS | Centers for Medicare and Medicaid Services |
| COPD | Chronic Obstructive Pulmonary Disease |
| CTM | Case Transitions Measures |
| D-SNP | SNP serving dual eligibles |
| ER | Emergency Room |
| HEDIS | Healthcare Effectiveness Data and Information Set |
| HIV | Human Immunodeficiency Virus |
| I-SNP | SNP serving beneficiaries in nursing homes |
| PCP | Primary Care Physician |
| PHQ | Patient Health Questionnaire |
| PHQ-2 | PHQ Two-Question Instrument |
| PHQ-9 | PHQ Nine-Question Instrument |
| SNP | Special Needs Plan |
| SPMI | Severe and Persistent Mental Illness |
| UM | Utilization Management |
EXECUTIVE SUMMARY
Introduction
Evidence on best practices in care management for chronically ill Medicare beneficiaries offers few clear guidelines about what works best. Given the wide variation both within and across plans in how special needs plan (SNP) services are provided, it becomes important to identify how best to implement or improve intervention components rather than testing only the overall effectiveness of SNPs in general. In this study, we sought to understand which of two alternative ways of implementing each of several components of care management lead to better health outcomes in the two participating SNPs. We used an efficient orthogonal design that allowed us to simultaneously compare effectiveness of alternative approaches to implementing ten components of care management services. Efficient orthogonal designs have been used extensively in manufacturing, and in some health care organizations, but not in published health care evaluations. Such designs enable the testing of multi-component interventions and various ways of deploying each component, offering great potential as a tool for continuous improvement in health care quality.
We tested two alternatives--routine care (services routinely provided at the plans before the study) and enhanced care (more frequent or more intensive versions of the services)--for each of ten care components. The tested components included frequency-of-routine contacts; falls-risk screening frequency and referral to fall prevention programs; depression screening frequency, use of depression screening instruments, and mode of referral; member education and coaching strategies; and management of care transitions, including frequency of follow-up and use of protocols and tools.
Study Design and Analysis Methods
Randomization, Outcomes, and Data
The participants were: (1) care managers in Care Wisconsin and Gateway (in Pennsylvania) plans who implemented the interventions; and (2) the 1,562 dually eligible noninstitutionalized members with disabilities or frail elderly who comprised these care managers' caseloads. We randomly assigned each of the 24 care teams/care managers in the study (17 from Care Wisconsin and seven from Gateway) to implement a different, pre-selected combination of alternatives (routine care or enhanced care) for each of ten components, for one year. The care managers implemented the same intervention components for all of their members.
For each component, we analyzed whether members assigned to the enhanced care variant experienced different outcomes than those assigned to the routine care variant. Outcomes examined included: (1) the number of inpatient admissions for any reason; (2) the incidence of readmission within 30 days of any discharge (i.e., including those for mental health problems) and within 30 days of a discharge from medical stays only; and (3) the number of emergency room (ER) visits. We focused on readmissions for members hospitalized at least once during the follow-up because members who were not hospitalized cannot be readmitted. The program ran from May 16, 2011, through May 15, 2012, and we measured impacts over this period. We received approval for the study from the New England Institutional Review Board. U.S. Office of Management and Budget approval was not required because Mathematica did no primary data collection.
To analyze the effectiveness of enhanced versus routine care, we used two sources of secondary data obtained from the participating plans: (1) de-identified claims data on members' service use and chronic conditions; and (2) de-identified data on members' demographic characteristics and risk level, as assessed by each plan. For the implementation analysis, we used data collected by participating plans via tracking tools to assess the care managers' fidelity to their assigned component options. We also conducted discussions with care management staff to understand how faithfully the components were implemented.
Impact and Implementation Analysis Methods
We used regression analysis to compare the outcomes for members receiving routine care to the outcomes for members receiving enhanced care, controlling for any pre-intervention differences between the two groups in members' and care managers' characteristics. All four outcomes were analyzed over these follow-up periods for all members: 1-6 months; 7-12 months; and the full 1-12 month period. Analyses of effects of components on readmissions were done for hospitalized members over the 1-12 month follow-up. Regression analyses controlled for member characteristics observed over the two-year baseline period (May 16, 2009, to May 15, 2011).
Implementation analysis is particularly important because a finding from regression analyses that routine and enhanced care options were equally effective in terms of observed health outcomes for a given component might be incorrect if such care was not fully implemented. If such analysis suggests that some planned intervention enhancements were not well-implemented, further assessment should be done to identify the barriers to implementation of those interventions. In June through August 2012 (between one and three months after the intervention period ended, but before the analysis results were produced), we held discussions with care management staff to get their views on why enhanced care may have been more effective than routine care for some components but not for others, and to identify implementation facilitators and barriers. Care managers were instructed to use the tracking tool form after each contact with the members to record which components were provided. Using this information, we assessed the fidelity to assignments by examining: (1) the proportion of members receiving the assigned option at least once; (2) the annualized number of times each component or option was provided per member; and (3) the proportion of members receiving the option at least as often as assigned.
Study Findings and Discussion
Descriptive Results
The population of members in the study was composed of older adults, included more women than men, and was largely Caucasian. The proportions living in rural versus urban areas were about equal. Gateway members were younger, less likely to be newly enrolled in the plan, and less healthy than Care Wisconsin members. Use of hospital and ER services was high at both baseline and follow-up--47 percent of members were hospitalized during baseline and 43 percent were hospitalized during the follow-up period.
Findings
Even though outcomes were similar for those whose care managers were assigned to the enhanced version as for those assigned to the routine version for most of the ten care components, there were a few exceptions:
-
Requiring a higher minimum frequency of contacts and medication reviews was associated with 16 percent fewer ER visits at the full year of follow-up. Members assigned to enhanced care received slightly more contacts and many more medication reviews (38 percent) than members assigned to routine care. Care managers remarked that they had difficulties maintaining the more frequent contact rates due to already high caseloads.
-
Surprisingly, patients of care coordinators assigned to use the enhanced ("teachback") coaching method had 15 percent more ER visits than the routine coaching method at the full year of follow-up, a finding possibly attributable to care managers' lack of familiarity with the teachback method. Fidelity analysis showed that care managers assigned to teachback provided less coaching to their patients, in terms of the percentage of patients who received any coaching and the number of times they received coaching. The effect on ER visits dissipated in the second six-month follow-up, which might be due to care managers improving their teachback skills over time.
-
Results for outcomes measured over the periods of 1-6 months and 7-12 months were similar to those for the full period, suggesting that most of the enhanced options neither influenced outcomes early on but then dissipated, nor that they took several months to take effect. One exception is that assigning members to more frequent falls-risk screenings with an instrument was associated with a greater likelihood of readmission following a medical discharge as compared to those assigned to routine care; at the second six-month follow-up, the finding was reversed. These findings are most likely chance variation in when these readmissions occurred rather than real effects of opposite signs.
Some findings of no difference in outcomes may be attributable to a failure to implement the enhanced care option in a manner that sufficiently distinguished it from the routine care option. For example, although the teachback method was qualitatively more intensive, the fidelity analysis showed that the enhanced and routine care groups received approximately the same number of post-discharge follow-ups, consistent with care managers reporting having difficulties conducting the second follow-up because calls were time consuming and members difficult to reach. Although post-discharge follow-up with an instrument and a checklist was qualitatively more intensive and reported as useful by care managers because it provided structure, care managers assigned to the instrument/checklist performed fewer follow-ups, so it is not surprising that we observed similar outcomes for routine and enhanced care groups on this component.
Despite the findings that outcomes were not better for the enhanced version of most of the components tested, the participating plans have nonetheless decided to adopt some of these enhancements. The plans' decisions to adopt these enhancements were made before the results on relative effectiveness of enhancements were available to them, and were therefore based solely on their experience with the options. Care management staff reported several important lessons learned from the study implementation. We found that both plans' care managers and leaders believed that use of the teachback method was a useful and appealing innovation; the two plans intend to train all care managers in the method before requiring its routine use. In addition, Care Wisconsin plans to implement the Patient Health Questionnaire Nine-Question Instrument for depression screening because it was shorter than the tools used at the plan before the study and because community clinicians were familiar with it. Care Wisconsin is considering training care managers in falls-risk assessment. Care Wisconsin has also developed a post-discharge tool similar to one used in the study and is considering adoption of a second post-discharge follow-up because of positive feedback from care managers and because both these enhancements are believed to be helpful to members. Gateway noted that the study introduced more structure in routine contacts, falls-risk screening, and care transitions management, which it considers to be valuable and intends to continue. In addition, the plan intends to train care managers in depression screening. For both plans, the study highlighted the need to track the services delivered by care managers.
Limitations
Several limitations in the study should be noted. Because only 24 care managers/teams participated in the study, only large differences in outcomes between routine and enhanced care options (22-32 percent of the mean outcome) were likely to be detected. Moreover, to obtain even this number of care managers, it was necessary to "pool" care managers from the two plans and estimate a single effect. We estimated intervention effects under the assumption that these effects were equal for the two plans after controlling for patient characteristics and plan-level differences in mean outcomes.
Members in the Gateway plan were not enrolled in care management for the full (one year) duration of the study, since members who reach their goals "graduate" from the program and cease to receive care management services. On average, members receive care management for 4-5 months. Therefore, it may have been even more difficult to detect differences between the tested options because 30 percent of the sample did not receive the interventions for long. Further, it is possible that exposure to intervention components for one year was not long enough for the measured outcomes to change, due to time required to learn how to implement a change in care management protocols effectively and for opportunities for preventing a hospitalization to arise. However, because we are analyzing a high-risk population and types of services that should show results relatively quickly, one year should be long enough for effects to be observed, if they are ever going to exist.
Given that we performed many comparisons between enhanced and routine care, it is possible that some findings resulted from chance. The number of significant differences was about what would be expected by chance for the 80 comparisons (two outcomes were analyzed for ten components for all members for three periods and two outcomes for ten components for hospitalized members). A joint test of whether all enhanced versus routine care differences were zero could not be rejected, indicating that even the few statistically significant observed differences may have been due to chance rather than to the interventions. This indicates that as a group, enhanced components did not have a different effect on measured outcomes than routine practices. While this could be viewed as routine care being just as effective as the tested enhancements, the lack of significant findings may also be due to insufficient statistical power to detect what may have been modest-size favorable effects. Only impacts of 22-32 percent or larger were detectable with 80 percent power.
The findings from the implementation analysis of the tracking data may be flawed by incomplete reporting by the care management staff on their activities. Care managers at both plans experienced some difficulties integrating tracking sheets into day-to-day activities, which indicates that future studies should consider other ways to track fidelity, such as via electronic health records. In the related Brand New Day orthogonal design study that we conducted (reported elsewhere), the plan collected such information as part of the electronic health record.
Another major limitation was that for five of the components, the care actually delivered by care coordinators assigned to the enhanced care option did not differ meaningfully from the care delivered to those assigned to routine care. Thus, it is not possible to determine whether these intended enhancements of a given component would be more effective from the routine care. For two of the components, at least part of the reason for failure to deliver the assigned intervention appeared to be a lack of explicit, unambiguous descriptions of how the enhanced care was to be delivered. For example, conversations with care mangers revealed that there was confusion about how often to review a care plan (Component 6) and what is involved in a plan review, which is an important finding for the participating plans. The multiplicity of routine care practices and a lack of understanding of what is involved in these practices illustrate that sharp differences between studied options can be difficult to specify and explain to care coordinators.
For the other three components for which the enhanced care option was not implemented in a manner that distinguished it sufficiently from the routine care option, the problem was either that the enhancement was not implemented consistently or fully, or that routine care was more intensive when delivered than specified by the participating plans. However, while this situation makes it impossible to evaluate the effectiveness of the planned enhancement, it should be viewed less as a limitation than as an important finding that can inform the plans of needs to standardize routine care practices, and an opportunity to learn why planned enhancements were not enacted. The analyses in this report took an "intent-to-treat" approach in which component effects are computed by comparing outcomes of those assigned to the two options, regardless of whether or how thoroughly the options were actually delivered. Standard supervisory measures at the two plans were continued throughout the study, so that the components were tested in a "real-world" environment with the currently available resources, rather than in a strictly controlled setting. Follow-up discussions with care coordinators revealed several reasons for the lack of full implementation of the enhanced variants, such as high caseloads, difficulty tracking which components they had already provided to a given patient, and multiple organizational changes occurring during the study period that were unrelated to the study.
Implications for Policy and Practice
The study illustrates the potential of orthogonal design for improving the effectiveness and efficiency of care management programs if enough observational units, such, as care managers, are available. Orthogonal design combines the rigor of experimental design with the ability to produce rapid results on the effectiveness of several components in a single experiment. It accommodates planned testing of alternative approaches to multi-component interventions and permits practitioners and researchers to tailor interventions to the target population and test enhancements to routine care. Given that orthogonal design tests combinations of routine and enhanced care, there is no traditional control group; all members receive each component of care (e.g., screening), but some receive it in a different style or intensity than had previously been used. Further, orthogonal studies are attractive because the care managers who implement the interventions all are engaged in testing new variations because each care manager implements some enhanced care and some routine care options. Care manager engagement is greatly enhanced if they are included in the development of the enhancements to be tested; this should always be a feature of orthogonal design studies of care management.
An important benefit of an orthogonal design study, as we have seen from the reaction of the participating plans, is enhanced clarity of expectations about how interventions are to be provided. Rather than implementing a broad model of care, care managers are told precisely how they are expected to implement each of the components of care management being tested. When routine care is not well defined or the way routine care is implemented differs across care managers, as is often the case, this structure itself can help standardize the care management intervention, leading to less variation in implementation across managers. Further, fidelity analysis allows participating plans to assess the degree to which components were carried out as specified, which can help the plan identify the areas of care management to focus on in their quality improvement efforts. While efforts to standardize care management interventions can be done without orthogonal design studies, conducting such a study forces plans to re-examine their processes of care and protocols, and can uncover unknown areas of confusion or misinterpretation concerning routine care and operations. The orthogonal design approach also encourages organizations to create a culture of learning by providing participants with a rigorous approach for testing out their new ideas.
This study also identifies some important difficulties with conducting orthogonal design studies in health care organizations. The types of variations in how care coordination is delivered studied here are likely to generate only moderate size effects on hospitalizations or ER use--that is, they are not strikingly different ways of delivering care coordination, but rather relatively minor twists. Furthermore, some of the interventions can only affect subsets of the enrollees (e.g., those with depression, those with a hospital admission), so the expected effect calculated over all enrollees is attenuated. To have adequate statistical power to detect such modest expected effects, a sizeable number of care coordinator units are needed because the variance of these outcomes across care coordinators is large. Without adequate power, statistically insignificant differences in outcomes between enhanced and routine versions of a care component cannot be taken as valid evidence that the routine (and typically less expensive) version of the intervention is just as effective as the enhanced version. Although the number of care coordinators (24) participating in this study exceeds the number used in some studies in other fields, it was not sufficient for this study due to the large variation in hospitalization rates and other key outcomes across coordinators.
The study also identifies how hard it can be to change the behavior of even dedicated health professionals. For each of the components, both the enhanced and routine care groups received the assigned component less often than specified in the study. Very few members received at least the minimum number of services (for example, contacts, post-discharge visits, screenings) as specified in the study protocol, and an even smaller percentage of members assigned to enhanced care received services at least as often as assigned. Even though this finding may have been due in part to under-reporting of services provided, the gap is so large that it seems likely that many patients did not receive the full complement of intended services, reflecting various barriers. The qualitative investigation of barriers to implementation is just as important for learning as estimation of the effects of the various enhancements.
I. INTRODUCTION
Special needs plans (SNPs) were established in 2003 as part of the Medicare Prescription Drug, Improvement, and Modernization Act, with the goal of improving care for high-risk target populations of Medicare beneficiaries. There are three types of SNPs: (1) D-SNPs serving dual eligibles (those enrolled in both Medicare and Medicaid); (2) C-SNPs serving beneficiaries with chronic conditions; and (3) I-SNPs serving beneficiaries residing in nursing homes (Health Net 2012). SNPs enrollment has more than doubled since 2006, with most members located in D-SNPs (Gold et al. 2011).
SNPs contract with the Centers for Medicare and Medicaid Services (CMS) to provide all covered Medicare services to beneficiaries with special needs in return for a monthly risk-adjusted capitation payment. Thus, SNPs have the incentive to engage in care management to help plan members reduce their need for expensive services, especially hospitalizations and emergency room (ER) visits (Grabowski 2009). SNPs are allowed to target enrollment to groups with distinct care needs and build a critical mass of beneficiaries with certain conditions, which allows them to tailor interventions to those members and conditions and helps them reduce hospitalizations and institutionalizations (CMS 2012). DSNPs use the flexibility of capitated payments to provide a mix of services and typically offered coordination activities, including assistance with care transitions, medication reconciliation, patient education, and patient assessment with respect to risk for hospitalization or nursing home placement (Schmitz et al. 2008; Medicare Payment Advisory Commission 2011).
A. Background
In a recent systematic review of complete models of care coordination programs, Au et al. (2011) determined that "no firm conclusions can be drawn at this time regarding what works best for whom in care coordination for adults with disabilities." In reviewing studies completed through 2010, the authors found only three high quality studies that identified effective programs. The first of these programs was Senior Care Options, an integrated Medicare and Medicaid managed care program for the elderly in Massachusetts that coordinated medical services, behavioral health services, prescription drugs, and long-term support services. This program produced a significant reduction in the rate of nursing home entry (Jen Associates 2008). The second was the Disease Coordinated Care for San Diego Seniors (ACCESS) Program, a guideline-based care management intervention for dementia featuring case management software and care recommendations provided to caregivers by care managers. This program achieved improvement in patient-reported health-related quality of life (Vickrey et al. 2006). In the third program, a treatment team for adults with severe and persistent mental illness (SPMI) provided care management and access to a range of mental health and substance abuse services. This program achieved reductions in psychiatric inpatient admissions and hospital days (Mangrum 2006). The above mentioned program targeted clients with co-occurring SPMI and substance use disorders. The dual-diagnosis treatment teams provided care coordination and access to a range of mental health and substance abuse services, including psychiatric services, individual therapy, and specialized groups tailored to client issues. Referring to the reviewed literature as a whole, the authors concluded that "information on specific features of [the] programs was frequently incomplete, or the features themselves were inadequately documented" (Au et al. 2011).
Even after rigorous evaluation methods (such as randomized trials) find a given intervention effective, programs often do not produce comparably favorable results when the intervention is repeated in other settings (due in part to differences in how the intervention was implemented). For example, in the last decade, several models of transitional care have been shown to be effective in reducing readmission rates (Naylor et al. 1999; Coleman et al. 2006; Jack et al. 2009). However, less is known about how best to implement the various components. For instance, evidence shows that post-discharge follow-up helps reduce readmission rates, but there is little information about how quickly this follow-up visit needs to occur, how many times, and which protocols to use. Mahoney (2010) notes that the success of multi-component interventions depends on the features of the intervention, the methods used to engage patients and providers, and the target population for the intervention components, and illustrates this with findings from fall prevention studies.
SNPs vary greatly in their design and in the scope of services provided (Medicare Payment Advisory Commission 2011) due to the unique and varied needs of the beneficiaries and the diverse environment in which services are provided. Because great variation exists in how SNP services are provided, it is important to identify the effective intervention components, rather than focus on the effectiveness of an entire model of care.
Current evidence on best practices in care management for chronically ill Medicare beneficiaries offers some guidelines, but the results are suggestive, not conclusive, and may not be applicable to people with disabilities. Brown et al. (2012) showed that in randomized clinical trials, among 11 Medicare care coordination demonstration programs for beneficiaries with chronic illnesses, four decreased inpatient admissions in a high-risk subset of enrollees. The four programs that were successful in reducing hospitalizations differed from the seven unsuccessful programs on six key dimensions: (1) supplementing telephone calls to patients with frequent in-person meetings; (2) having an established relationship or opportunities for interaction with their patients' primary care providers; (3) acting as a communications hub for the providers seen by the patient; (4) delivering evidence-based education to patients, using motivational interviewing techniques or other proven behavior change approaches; (5) providing strong medication management, with more reliable sources of information about medications than simply patient self-reports; and (6) providing timely and comprehensive transitional care after hospitalizations. Although these features were found to be correlated with success, the authors were unable to ascertain the causal effects of intervention components because each program developed its own model. The key to designing the most effective--and the most cost-effective--package of care coordination services is to understand these building blocks and how to implement them. Efficient orthogonal designs that test the different ways of deploying each component of an intervention can be used to explore the best ways to operationalize complex interventions.
B. About the Participants
Participants in the study included care management staff and their noninstitutionalized members enrolled in two D-SNPs serving a general population with disabilities: (1) Care Wisconsin in Wisconsin; and (2) Gateway Health Plan in Pennsylvania.1 Participants in the study were all members enrolled in care management at the two plans. Because there was such a small number of participating care managers at each individual plan, we randomized and analyzed the pooled set of care managers at the two plans--24 in total. Together, these 24 care coordinators served 1,562 patients that were included in this study.
Gateway Health Plan is a large managed care organization that serves more than 305,000 Pennsylvanians. Gateway is a coordinated care plan with a Medicare contract and a contract with the Pennsylvania Medicaid program, serving members who quality for C-SNPs and D-SNPs (Gateway Health Plan 2012a). Gateway's D-SNP is one of the largest plans serving dually eligible members in the nation, with approximately 33,000 members across Pennsylvania (Gateway Health Plan 2012b). Assessments performed at intake separate members into two groups. Those considered lower risk receive services such as mailings, automated telephone calls, and outreach calls to ensure uptake of preventive health services, whereas several hundred high-risk members are served by seven care managers (five nurses and two social workers). Only these high-risk members receive care management services and are therefore a part of our study. During the study period, high-risk members were defined as those with the following diagnoses: (1) certain types of cancer; (2) head trauma; (3) chronic obstructive pulmonary disease (COPD); (4) HIV; and (5) head injury or paralysis. At the time of the start of the study, about 700 members were enrolled in the care management program; therefore, the caseload was about 100 members per care manager. Care managers provide telephonic care management to the high-risk members, as well as services such as regular contact, depression screening, and review of members' care plans. All members are assigned needs-based goals; those who achieve their goals "graduate" from the program and cease to receive care management services. The average member receives care management for 4-5 months before exiting the care management program.
Care Wisconsin is a nonprofit care management organization providing services for low-income, frail elders and adults with developmental or physical disabilities; it specializes in the integration of health and long-term care services (Care Wisconsin 2013). Through two programs, Family Care and Partnership, the plan serves more than 4,800 members across ten counties in the south-central region of Wisconsin, and has more than 340 full-time and part-time employees. At the start of the study, care management was provided both by phone and in person as part of the Partnership program. The care management services included assessments, goal setting and review of care plans, regular contacts with members, screenings for the risk of falls and depression, and assistance with the transitions between care settings. Each member receives care management services from an interdisciplinary team each made up of a nurse practitioner, a registered nurse, a social worker with a master's degree, and a service coordinator. The 1,200 members enrolled in Care Wisconsin receive care management services and are served by 17 care teams, with each team assigned approximately 80 members.2 Members received medical services from the nurse practitioner in collaboration with the member's primary care physician (PCP) and primary care clinic.
C. Roadmap to the Report
In Section II, we review intervention components tested as part of the study. In Section III, we describe the study design and analysis methods. We present results from a quantitative impact analysis in Section IV, and in Section V we present the results of the implementation analysis. Finally, in Section VI, we discuss our findings and conclusions.
II. INTERVENTION COMPONENTS
The intervention components selected for the study were developed in close collaboration with participating plans. The aim of this collaboration was to select components that were grounded in research, were considered clinically meaningful, had the potential to improve outcomes for members served by SNPs, were of interest to the plans, and were feasible to implement. In addition to the in-person meeting held in October 2010 at the National Health Policy Group offices (home of the SNP Alliance) in Washington, DC, we engaged in weekly calls to seek feedback from the plans about how best to define the details of each tested alternative and how to instruct the care managers to implement each alternative. We used an iterative process to synthesize the comments and concerns from plans. This collaborative process yielded the final list of components to test.
Ultimately, we identified ten intervention components with two alternatives for each, one representing routine care at the plans and another representing enhanced care. Although we started with a long list of interventions, conversations with participating plans revealed interest in the following key areas of care management: (1) routine contacts; (2) screenings for depression and the risk of falls; (3) review of the member's care plan; (4) member coaching and education; and (5) management of care transitions from hospital to home.
Before the start of the study, we provided participating care managers with short documents that outlined their assignments (their combination of options). We also provided them with an implementation guide that included general information about the study such as study objectives, motivation, and outcomes analyzed as part of the study, and a detailed description of the two tested options for each of ten intervention components. We conducted several training sessions for the care managers during which we discussed the intervention components and the use of intervention tracking sheets, and answered care managers' questions.
A. Description of Intervention Components
We tested two alternatives for implementing the ten components of care management. Option a approximates routine care at the two plans, whereas Option b represents some enhancement over routine care. Because routine care differed somewhat between the two plans, the study protocol specified what routine care should be for the duration of the study. The tested options constitute how and not whether care management is provided. For ethical reasons, we did not test any options that would require a member to receive less care than he or she would have received in the absence of the study. Rather, we tested what approximates routine care against an enhanced version of a given service. In addition, care managers participating in the study were instructed not to withhold a service that they believed a member needed to receive. For example, if a given member was to receive a minimum of four routine contacts during the study according to her risk level, but her care manager believed that she needed additional contacts, the care manager was instructed to provide more contacts. In other words, both routine and enhanced care options provided guidance for the minimum service that needed to be provided, but care management staff continued to use their clinical judgment to provide services beyond the specified minimum. In Table II.1, we present a brief description of both tested options, and in Appendix A, Table A.1, we provide a more detailed description of routine practices. This description includes what we learned about routine practices both before the study, but also after the study, during conversations with plan staff. Below is a description of the enhanced care options for each intervention.
For the ten components, we studied options such as how often the component is provided, and which procedures or protocols are used for implementing it. The components we examined include routine contacts with members, screening for the risk of falls and referral to fall prevention programs, depression screening and referral, member education and coaching, and management of care transitions. For example, for the care transitions component, we tested the effectiveness of contacting members within three business days after discharge from an inpatient setting, versus an enhanced option that adds an additional contact within seven days of the first follow-up. Components are numbered from 1 to 11, skipping 8. Component 8 was a "dummy" component (one that was not specified or implemented). We were interested to see whether this dummy component would be found to be associated with as significant difference in outcomes, since no such difference should occur. Inclusion of this component in the analysis does not affect the estimates of impact of other components.
Frequency-of-Routine Contacts and Medication Reviews (Component 1). An integral component of care management services is routine contacts between the care manager and member, during which the care manager assesses the member's health; helps the member manage his or her medications, appointments, and other health care needs; and coaches and educates the member. To explore whether more frequent routine contacts and medication review might improve member outcomes, enhanced care increased the required minimum frequency of contact and medication review (Table II.1). Because the actual frequency of contact depends on members' needs, the minimum frequency specified was determined by the member's risk, which was assessed using data on the member's recent use of hospital and ER services and the number of chronic conditions they had. Plans update member's risk information on a quarterly basis. Care managers were instructed to use the most current information available at any time to determine whether a patient was high-risk or low-risk, which in turn determined the required minimum frequency-of-routine contacts they were to receive. For example, low-risk members are supposed to be routinely contacted at least once every three months at the two participating plans. As part of enhanced care Option b, we tested whether requiring contacts and medication review at least once every two months would improve member outcomes. Because Care Wisconsin provides some in-person contact, this intervention addressed overall frequency, taking into account both in-person and telephonic contact. Because additional in-person contacts are very resource intensive, the additional contacts introduced as part of the enhanced care option were intended to be mainly done over the telephone. Gateway provides all care management services telephonically.
| TABLE II.1. List of Intervention Components and Options Tested as Part of the Study | |
| Intervention Component | Options |
| 1. Frequency-of-routine contacts and frequency of medication review |
|
| 2. Falls-risk screening |
|
| 3. Fall prevention referral |
|
| 4. Depression screening tools |
|
| 5. Depression screening frequency and referral |
|
| 6. Frequency of care plan review |
|
| 7. Coaching about health care needs |
|
| 8. Dummy intervention | |
| 9. Frequency of member contact after discharge |
|
| 10. Informing the PCP of member discharge |
|
| 11. Follow-up with member post-discharge |
|
NOTES: Option a generally describes the routine care that is supposed to be provided at the 2 plans, whereas Option b represents an enhanced care strategy. Component 8 was not specified or implemented. This was used as a sensitivity test, to see whether there are differences in outcomes between patients of care managers assigned to Option A of this "dummy" component compared to those assigned to Option B. No such difference should be observed, since the 2 groups of care managers are simply randomly selected groups. Its inclusion in the analysis does not affect the estimates of impact of other components.
| |
Screening for the Risk of Falls (Components 2 and 3). Many dual eligibles and members with chronic disabilities are at high-risk of falls that may decrease mobility, reduce socialization, and increase fear of future falls (Mahoney 2010). In enhanced care of Component 2, care managers were assigned to screen all members three times during the study, using a screening tool each time. The screening tool assessed risk based on 12 dimensions: dizziness/fainting, balance problems, sensory problems, medication risk, cognitive problems, environmental hazard concerns, gait and mobility problems, endurance problems/weakness, pain/joint problems, general risks, falls history, and medical problems. Upon administering the screening tool either in person or over the phone care managers were instructed to score it according to guidelines provided. As part of the routine care, care managers implemented screening for the risk of falls as-needed and did not use a formal screening tool. As part of Component 3, care managers were instructed to refer members at a moderate or high-risk of falls to a fall prevention program. Under routine care, care managers referred members identified as high-risk to available fall prevention programs, whereas under care managers assigned to enhanced care sent members an educational letter in addition to making referrals. The letters informed members of their level of falls-risk and included a pamphlet that outlined several common causes of falls, and illustrated some strategies for members to follow to help reduce the risk of falls.
Screening for Depression (Components 4 and 5). Depression is often found in chronically ill or disabled populations, and its symptoms may decrease members' ability to address health care concerns. As part of Component 4, we examined whether use of a longer versus shorter depression screening tool produced better outcomes. Care managers assigned to routine care screened members for depression using the two-question Patient Health Questionnaire Two-Question Instrument (PHQ-2) tool, whereas those assigned to enhanced care used the Patient Health Questionnaire Nine-Question Instrument (PHQ-9). We hypothesized that use of a shorter instrument might allow care managers to screen more members. In Component 5, we investigated whether screening for depression more frequently and sending a letter with screening results to members' PCPs improved health outcomes. Under routine care, care managers conducted depression screenings at least once every six months, whereas care managers under Option b conducted depression screenings at least once every three months. Under enhanced care, care managers also sent a letter encouraging mental health follow-up to the primary care providers of members who screened positive for depression. The letters informed providers that their members had screened positive and included the score from the PHQ-2 or PHQ-9. All members screened positive for depression using any tool were referred for mental health intervention as per routine care.
Frequency of Review of Care Plan (Component 6). Care managers maintain care plans customized to each member, containing medical histories, health goals, and other items relevant to care management. The purpose of care plan reviews is to update health information and add, remove, or reorient goals, including personal experience goals, based on members' progress and emerging needs. Intervention Component 6 explored whether more frequent care plan reviews improved members' health outcomes. Care managers assigned to routine care reviewed care plans as-needed or per current protocol, which was described by the two plans prior to the start of the study as being less frequently than the enhanced care option (b) requiring review at least once per quarter.
Method Used to Coach and Educate Members (Component 7). We investigated whether assigning care managers to use the teachback method to instruct and coach members resulted in better health outcomes than relying on care managers' personal communication approach. Care managers assigned to Option b used the teachback method, which requires members to confirm understanding by repeating back instructions. The teachback method was developed by clinicians at the Iowa Health System as a test of how well a given concept is explained and understood. This method is intended to help service providers identify explanations and communication strategies most commonly understood by patients. The instructions should be clarified and repeated until the member is be able to correctly describe what they are going to do in their own words. Instructions about how to implement the teachback method were adapted from http://www.nchealthliteracy.org. Under routine care, care managers continued to assess members' understanding of instructions and coaching in the same way they had done so in the past.
Number of Post-Discharge Follow-Ups (Component 9) and Informing the PCP of Discharge (Component 10). Three intervention components addressed the management of care transitions, widely recognized as a particularly vulnerable time for members with chronic conditions. Care managers are well positioned to ensure members make a smooth transition to home from the hospital, a skilled nursing facility, or a rehabilitation facility. Intervention Component 9 explored whether more frequent contacts in the days following discharge helped reduce readmissions. Under enhanced care, care managers contacted members within 2-3 business days post-discharge and again within seven days of the first follow-up. Under routine care, care managers contacted members within three business days post-discharge. For both options, post-discharge follow-up could be conducted via telephone or in person and included a medication review. Because primary care providers often do not learn about a member's hospitalization in a timely manner, Component 10 explored whether outcomes improved if members' primary care providers were informed of a discharge both by letter and by telephone compared to being informed by letter alone. Routine care only required care managers to send written notification. Under enhanced care, care managers informed members' primary care provider of discharge by letter and also either spoke directly to office staff or left a voicemail message.
Formal Post-Discharge Follow-Up (Component 11). Post-discharge follow-up with a member is an essential component of transitional care (Naylor et al. 1999; Coleman et al. 2006; Jack et al. 2009). The goal of post-discharge follow-up is to ensure that there are processes in place to enable a successful recovery. For example, it is important that members understand their discharge instructions, make appointments with their PCPs, and take proper medications in proper doses. Intervention Component 11 was designed to test whether members who receive structured follow-up are less likely to be readmitted compared to those who receive informal follow-up. Care managers assigned to enhanced care used a structured checklist in conjunction with the CTM-3 instrument to guide their follow-up interviews with members. We adopted CTM-3 from Eric Coleman's Care Transitions Intervention (Coleman et al. 2006). The CTM-3 asks members if hospital staff took their preferences into account when planning for discharge, if the members have a good understanding of their post-discharge health management responsibilities, and if they understand the purpose for taking each of their medications. Care managers were asked to administer the CTM-3 before the checklist to learn of members' familiarity with post-discharge instructions, including prescribed medications and home activities. The structured checklist was intended to guide the care manager to cover the key topics, including medication management, medical care follow-up, and red flags (such as potential adverse drug reactions). Care managers randomized to enhanced care also engaged in a brief group discussion with their colleagues and supervisor about how to: (1) get the most out of each item on the checklist; (2) activate and engage the member; and (3) leave room for open-ended questions and active listening outside the structure of the checklist. Care managers assigned to routine care were asked to rely upon their routine follow-up strategies without using the checklist.
Note that several of the components tested are related to each other, which could result in interactive effects that could reduce or enhance first order effects. For example, we tested two fall prevention intervention components, two depression screening components, and three post-discharge components. The orthogonal design ensures that the estimates of the first order effects are unbiased--that is, half of the care managers assigned to Option a of Component 4, for example, are assigned to Option a of Component 5, while the other half are assigned to Option b for Component 5. In some designs, the multiple components in a single area may make it more difficult to detect these first order effects, if interactive effects of the two components either offset or enhance the impacts. However, the number of care managers engaged in the study was sufficient to ensure that main effects of any component are confounded only with three-level and higher-order interactions of other components. We discuss this further in Section III. We also addressed this concern by testing for whether the effects of related components were jointly equal to zero. None of these tests indicated that these multiple components addressed to a particular aspect of care coordination were masking important effects.
B. Hypotheses
We expected that more frequent routine contacts and medication reviews with members would help care managers identify and address developing health concerns, and could therefore reduce inpatient admissions and ER visits. We expected more frequent and structured screening for the risk of falls was targeted at reducing ER use and possibly some admissions. We expected frequent and more formal depression screening of all members would allow care managers to identify members with a reduced capacity to address health care needs due to depressive symptoms. Identifying depressive symptoms might help prevent health care crises and reduce ER visits and readmissions. We also anticipated that a more frequent review of care plans would allow care managers to identify gaps in provided care, which might reduce use of hospital and ER services. Use of the teachback method was aimed at improving understanding of instructions and self-management, with a goal of reducing unnecessary readmissions and ER visits (Table II.2).
| TABLE II.2. Intervention Components and Targeted Outcomes | |
| Intervention Component | Targeted Outcome (reduction expected in) |
| More frequent routine contacts (Component 1b) | Admissions and ER visits |
| More frequent screening for the risk of falls with an instrument (Components 2b and 3b) | ER visits and possibly admissions |
| Screening for depression (Components 4b and 5b) | ER visits and readmissions |
| More frequent review of care plan (Component 6b) | ER visits and admissions |
| Teachback method for coaching members (Component 7b) | ER visits and readmissions |
| 2 (versus 1) post-discharge follow-ups (Component 9b) and informing the PCP of discharge (Component 10b) and use of instrument and a protocol to follow-up with member post-discharge (Component 11b) | Readmissions and possibly ER visits |
Care transitions intervention components were aimed primarily at reducing readmissions, although they also might affect ER visits that occur soon after discharge from an inpatient setting. Two post-discharge follow-ups (rather than one) and keeping members' PCPs apprised of members' discharge may help to ensure that members understand discharge instructions, take proper medications at proper doses, and receive needed care, which in turn may reduce readmissions.
III. STUDY DESIGN AND ANALYSIS METHODS
A. Study Design
1. Efficient Orthogonal Design
In this study, we simultaneously tested the comparative effectiveness of alternative ways of implementing multiple intervention components, using an efficient orthogonal design. This design is well-suited for evaluating and refining care management models for three reasons: (1) it allows the plan to specify the variation in how key components of the model are implemented, whereas such variation would otherwise occur haphazardly; (2) it can produce rigorous results about the effectiveness of several components of care management in a single study; and (3) if adequately powered, it allows evaluators to assess directly whether more resource-intensive components yield sufficient improvement in outcomes to warrant the investment. Compared with a traditional randomized control trial, orthogonal design allowed us to test several intervention components with fewer implementers.
We used a two-level efficient orthogonal design method in which we tested two alternatives for each intervention component: routine care (Option a) and enhanced care (Option b). We then used an algorithm to generate a specific set of combinations of a's and b's that constitute an orthogonal design for the number of intervention components to be tested. Combinations of different component options include sequences such as aabaa, bbaaa, ababa, and so on. Care managers were each randomly assigned to a specific combination of options.
Due to the random assignment of care managers to combinations of component options, the relative effect of Option a versus Option b for any intervention component can be estimated by simply comparing the mean outcomes for care managers assigned to a to the mean for those assigned to b. If no difference in outcomes is found between routine and enhanced care options for a given component, this finding is still very meaningful if the study has adequate statistical power. If intervention components were implemented as intended, a finding of "no difference" in outcomes for members who were assigned to receive Option a versus Option b indicates that the more intensive component did not show an improvement in outcomes over the less intensive component. A finding of "no difference" is an important one because it indicates that it may not be fruitful to adopt a more expensive option. However, a finding of no difference in outcomes between routine and enhanced care options might also happen if: (1) the routine care option was not sufficiently different from the enhanced care option specified by design at the outset of the study; and/or (2) the routine care option was not different from the enhanced care option as implemented.
The standard methods of computing statistical power for clustered designs in randomized controlled trials can be used to compute power for orthogonal designs. (See Zurovac and Brown [2012] and Zurovac et al. [2013] for an overview of orthogonal design methodology.) In clustered designs in which care managers are assigned to implement a given set of components for all of their members, power depends predominantly on the number of care managers (and not the number of members) involved in the study. In this study, we have limited power to detect differences between the two tested options--22-32 percent of the mean--because only 24 care managers participated in the study. The precise power depends heavily on the variance in outcomes across care coordinators. We offer a more detailed discussion of when the finding of no difference can occur as well as a discussion of power in Section IV (Study Findings) and Section VI (Discussion and Conclusions).
The key feature of these designs that ensures that the estimates are unbiased is orthogonality, meaning that the assigned combinations are independent of one another. In practice, this means that: (1) half of the care coordinators are assigned to Option a and half to Option b for each of the ten components being tested; and (2) of the care management staff assigned to Option a of Component 1, half are assigned to Option a and half to Option b for Component 2 and so on for all possible pairs of components. However, in efficient orthogonal designs, the effects of any single intervention component cannot be distinguished from the effects of some interactions of other components. The extent of such potential confounding depends on the number of care managers in the study relative to the number of components being tested. Because we used an efficient design (which means that the number of intervention components tested was large relative to the number of care managers), we were unable to estimate the interaction effects between components.3 However, the number of care managers engaged in the study was sufficient to ensure that main effects of any component are confounded only with three-level and higher-order interactions of other components. The analyses in this report took an "intent-to-treat" approach in which component effects are computed by comparing outcomes of those assigned to the two options, regardless of whether or how thoroughly the options were actually delivered.
2. Randomization
In this study, 24 care managers were randomly assigned to implement a pre-specified combination of Options a or b for the ten intervention components (see Appendix B for more details on random assignment of interventions to each care manager). For example, care manager number 1 was assigned the combination aabaaabbbab. The combination contains 11 letters (denoting 11 options), one for each intervention component. The randomly assigned combinations of component options are in Appendix B, Table B.1.
B. Data
We used several data sources in this evaluation: administrative plan data, tracking tool data, and information obtained from discussions with care management staff. All member-level data sources were de-identified and contained only "mock" identifiers so that the members' data could be linked to care managers and intervention component assignments.
For the impact analysis, we used two sources of secondary data obtained from the participating plans: (1) de-identified claims data on members' service use and chronic conditions; and (2) de-identified data on members' demographic characteristics and risk level as assessed by each plan. We received final action claims for physician services and hospital use and dropped denied claims and laboratory claims from the construction of all variables. Laboratory claims were dropped because they were not needed for the construction of the analyzed outcomes or explanatory variables. It was important not to use laboratory diagnosis codes in the construction of chronic condition flags because these codes only denote what the laboratory tested, not whether a diagnosis was made.
We obtained one year of follow-up data that coincided with the period of implementation of the intervention components, May 16, 2011, through May 15, 2012. We also obtained two years of baseline data, covering the period May 16, 2009, through May 15, 2011. Data from the two plans were analyzed in the aggregate.
For the implementation analysis: we used data collected by the participating plans (using tracking tool sheets) to assess the fidelity to assigned component options and we conducted discussions with care management staff in order to understand how the intervention components were implemented. The tracking tools were designed to obtain information about provision of assigned components and options. In Section III.D, we further describe implementation analysis methods.
C. Impact Analysis Methods
1. Outcomes
We tested for differences in service utilization between members receiving routine care (Option a) and those receiving enhanced care (Option b). For the sample as a whole, we examined impacts on the following three outcomes: (1) number of inpatient admissions for any reason; (2) whether there was a readmission within 30 days of discharge (from medical stays and from any stay); and (3) number of ER visits. We examined impacts on readmissions for members hospitalized at least once during the follow-up, since members who were not hospitalized cannot be readmitted. We examined impacts of intervention components on outcomes over the 1-6, 7-12, and the full 1-12 month follow-up periods for all members. The program period spanned from May 16, 2011, through May 15, 2012. Details for construction of each outcome are listed in Table III.1 below.
| TABLE III.1. Key Outcomes Analyzed in the Study | |
| Description of Outcome | Details of Construction |
| Annualized number of ER visits | We identified ER visits based on the place of service, procedure and diagnosis codes, following HEDIS 2012 specifications. ER visits that occur on the same day as an admission to a hospital or skilled nursing home admission are not counted. |
| Annualized number of inpatient admissions | We counted all inpatient admissions, including medical admissions, chemical dependency, and mental health admissions. We incorporated chemical dependency admissions at hospitals, residential substance abuse facilities, and comprehensive inpatient rehabilitation facilities. |
| Readmission based on any admission (whether readmitted for any reason following any inpatient admission) | Every admission is considered to be an index admission. Every readmission is also an index admission. Every index admission is assigned 1 readmission at most. |
| Medical readmission (whether readmitted for medical reasons following an inpatient medical visit) | Constructed in the same manner as readmission based on any admission, except that both index admissions and readmissions are for medical reasons only. Chemical dependency, mental health, substance abuse, and rehabilitation admissions are not considered. |
| NOTES: Number of ER visits and number of inpatient admissions were annualized; that is, for the few members who were enrolled for a portion of the 12-month study period, the continuous outcomes were multiplied by 12 divided by the number of months enrolled. | |
2. Analyses
Before engaging in the analysis of impacts of enhanced care Option b over routine care Option a for each intervention component, we ran a test similar to a Heckman-Hotz test and graphed regression-adjusted mean outcomes for each care manager. In the results section, we show a brief descriptive analysis, including: (1) proportion of members who were randomized to each component option; (2) demographic characteristics of members enrolled in the study; and (3) use of hospital and ER services of enrolled members at baseline and at follow-up periods. Although we report results significant at the 10 percent level, we do not discuss or interpret these results in detail because they likely reflect noise in the data. For all statistical tests, we used a 5 percent level of significance.
Heckman-Hotz Test. To assess whether the randomization was successful in ensuring the similarity of care managers at baseline, we ran a test similar to the Heckman-Hotz test in which we used regression analysis to assess whether outcomes (inpatient admissions and ER visits) measured one year before the study differed for those later assigned to routine care or to the enhanced care intervention option for each intervention component studied. As the intervention had not yet begun during that period, there should be no meaningful difference between the a and b groups in outcomes measured before the study. The regressions adjusted for all available member-level characteristics, including demographics (age, gender, race, rural or urban residence), chronic conditions, and mental conditions, as well as for outcomes measured two years before the study, from May 16, 2009, until May 16, 2010.
Homogeneity Test. Homogeneity is particularly important for efficient orthogonal designs because these designs often include relatively few observations (that is, care managers), so the results are particularly susceptible to outliers. Orthogonal designs assume that the implementers have relatively homogenous outcomes before the study; therefore, we assessed the similarity in outcomes for each care manager by computing regression-adjusted mean outcomes for each care manager. The outcomes were measured during the second year of the baseline period, from May 16, 2010, through May 16, 2011. Because the effects of differences among care managers in outcomes might be removed by regressors controlling for the measured differences between their members, we adjusted for all available member-level characteristics, including demographics (age, gender, race, rural or urban residence), chronic conditions, and mental conditions. Member-level observations were weighted by the inverse of the number of months enrolled in the plan.
Regression Analysis. To test whether routine care (Option a) or enhanced care (Option b) of each component reduced the use of hospital and ER services, we used the follow-up data to compare the mean outcome over all members for care managers who provided Option a to the mean for members of those who provided Option b. In doing so, we used regression analysis with member-level data to achieve greater precision in estimates of intervention component effects and to control for any pre-intervention differences in member and care manager characteristics. The regressions produced robust Huber-White standard errors, which are robust to heteroskedasticity. We did not adjust for clustering because the estimated standard errors were more conservative without the adjustment. Member-level observations were weighted by the inverse of the number of months enrolled in the plan, which means that more weight was given to observations for members who were enrolled in the plan longer and thus had a greater exposure to the studied intervention components.
D. Implementation Analysis Methods
To improve understanding of the impact analysis results, it is important to document how the components were implemented and to evaluate fidelity to the planned intervention. Discussions with participating care management staff were held in June-August 2012 (between one and three months after the intervention period ended, but before the analysis results were produced), to help explain why certain components were effective and others were not and to identify facilitators and barriers to implementation of any component options that were not implemented as planned. This is particularly important because a finding that routine care (Option a) and enhanced care (Option b) were equally effective for a component might lead us to conclude that the less expensive of the two options is just as effective as the more expensive one. However, if routine and enhanced care were not actually implemented fully, such an inference may be incorrect.
1. Analysis of Tracking Tool Data
Care Wisconsin plan helped design a paper tracking tool to help assess the fidelity to assigned intervention components. Care managers completed the tracking tool form after each contact with the members and recorded which components were provided. The tracking tool contained "bubbles," much like Scantron-style forms that care managers filled out to identify the component option provided during encounters. Plan staff transmitted de-identified data to Mathematica.
We analyzed the frequency with which intervention components were delivered and the fidelity to assignments by examining the following three measures: (1) proportion of members who received the assigned option at least once; (2) annualized number of times each intervention component or option was provided per member; and (3) proportion of members who received the option at least as often as assigned. In Table III.2, we provide the details for construction of each of these measures. We also examined the percentage of members who refused a given component or option at least once. We analyzed the means for these three measures for the entire sample of members as well as individually for each plan.
| TABLE III.2. Construction of Frequency and Fidelity Implementation Measures | |||
| Measure Description | Construction Details | Computed for the Following Components or Options | Analysis Displayed In |
| Proportion of members who received a component or option at least once | Number of members who received a component or option at least once divided by the number of members in the study | For all components | Table V.1 |
| Annualized number of times the assigned option provided per member | Number of times the option was provided (annualized) divided by the number of members assigned to receive that option | For all components. Measure is the most meaningful for components where frequency differs between Options a and b | Table V.2 |
| Proportion of members who received each option at least as many times as assigned | Percentage of times the option was provided to those assigned to that option divided by the number of members assigned to receive that option | For components: 1, 2b, 4, 5, 6b, 9, 10, and 11 (Cannot be computed for 3 and 7 because there is no assigned frequency or because a and b do not differ in frequency) | Table V.3 |
2. Discussions with Care Managers
Following the final day of implementation of the study, we conducted discussions with Gateway and Care Wisconsin care managers, care managers' supervisors, and plan leaders in order to understand how the components were implemented and which facilitators and barriers they faced. The secondary objective was to improve our understanding about how care management is usually delivered at each plan, apart from the study intervention components.
Although conversations were informal, we used a set of discussion questions to guide our discussions with the plan staff. In advance of discussions, we presented the staff at the plans with the list of questions. The questions covered five broad topics: (1) care management services at the plan; (2) the health care policy environment and how it affected the care management program during the study period; (3) study components; (4) challenges to implementing the study in general; and (5) standard practices at each plan and how they differed from study components.
We asked the care manager supervisors and plan leaders whether federal guidance or policy changes may have affected the care management program during the study period. We solicited staff input on challenges to implementing specific intervention components, and staff feedback on how intervention components may be used in the future. We asked how intervention components could be improved, what challenges were posed by each component, and what leaders thought about adopting study components in the future. We asked about challenges to implementing the study in general. In terms of the study's effect on care manager workloads, we asked whether organizational changes affected implementation, and solicited their thoughts on future participation in similar studies. Finally, we asked about standard practices at each plan and how they differed from study components. We inquired whether standard practices changed during the study and how the organization alters care management activities based on member risk levels. To fill our gaps in understanding how care management is delivered, we inquired about which services are provided and how and inquired about the roles and responsibilities of care managers. We also asked whether the study received organizational support, which aspects of the study were easy or difficult to implement, and how organizational changes affected implementation.
IV. STUDY FINDINGS
A. Quantitative Impact Analysis Findings
1. Descriptive Statistics
We identified 1,562 dually eligible SNP members as the study population at the time the study commenced, on May 16, 2011. Care Wisconsin had 956 members in the study, served by 17 teams of care managers, whereas the 606 members at Gateway were served by seven care managers. The population as a whole was composed of older adults, contained more women than men, and was largely Caucasian; further, about the same proportion lived in rural and urban areas. Use of hospital and ER services was high both at baseline and follow-up, consistent with the high-need study population of dual eligibles with special needs.
As shown in Table IV.1, 56 percent of the study population was over the age of 64, and nearly 71 percent were female. About three-quarters identified as Caucasian and 15 percent as African American. Members were similarly allocated between rural (46 percent) or urban (40 percent) areas. Nearly 85 percent of participating members had been enrolled in a SNP for the entire baseline year; the more recent enrollees were evenly split between those enrolled for five or fewer months and those enrolled for between six and 11 months. As expected, the study population had a high incidence of chronic conditions, especially diabetes (43 percent), depression (35 percent), heart failure (27 percent), and COPD (25 percent). During the year before the study (baseline), 47 percent of members experienced an inpatient admission, 55 percent had an ER visit, and 14 percent experienced a readmission within 30 days of hospital discharge (Table IV.2).
Gateway members enrolled in the study were younger, less likely to be newly enrolled, and less healthy than those at Care Wisconsin. As seen in Table IV.1, 39 percent of Gateway members were over the age of 64, compared to 66 percent of Care Wisconsin members. As might be expected of Care Wisconsin's older population, members there displayed higher incidence of Alzheimer's and cataracts than did Gateway members. These descriptive data showed that Gateway provides care management to a very high-risk population: its population was more likely to have all other chronic conditions we identified using claims data, including COPD, depression, and diabetes. Due to differences in member characteristics, the effects of alternative options may have differed by plan. Although we could not estimate the effects of alternative options for each plan individually, we controlled in regression analyses for which plan the observation came from. We estimated intervention effects under the assumption that these effects were equal for the two plans after controlling for patient characteristics and plan. Furthermore, Gateway members were more likely to have psychiatric health conditions, including depressive disorders, but much less likely to have Alzheimer's. Outcomes at baseline (Table IV.2) are largely in line with this assessment, as Gateway members averaged more than double the number of ER visits and inpatient admissions and had 2.5 times more readmissions to a hospital within 30 days of discharge.
| TABLE IV.1. Demographic Characteristics of Study Participants(percentages) | |||
| Member Characteristics | Both Plans | Care Wisconsin | Gateway |
| Age | |||
| Under 46 | 11.0 | 7.1 | 17.2 |
| 46-64 | 33.3 | 26.6 | 43.9 |
| 65-74 | 21.3 | 21.4 | 21.1 |
| 75-84 | 20.1 | 24.5 | 13.2 |
| Over 85 | 14.3 | 20.4 | 4.6 |
| Gender | |||
| Male | 29.5 | 30.1 | 28.6 |
| Female | 70.5 | 69.9 | 71.5 |
| Race/Ethnicity | |||
| Caucasian | 76.5 | 80.0 | 71.0 |
| African American | 15.0 | 12.7 | 18.7 |
| Hispanic | 3.7 | 2.5 | 5.6 |
| Asian | 1.4 | 2.2 | 0.2 |
| Other or missing | 7.1 | 5.1 | 10.2 |
| Member Location | |||
| Rural | 46.4 | 50.3 | 40.1 |
| Urban | 39.7 | 39.6 | 39.8 |
| Suburban | 9.5 | 4.5 | 17.3 |
| Missing | 4.5 | 5.5 | 2.8 |
| Chronic Conditions | |||
| Diabetes | 43.4 | 39.0 | 50.3 |
| Heart failure | 26.7 | 23.1 | 32.3 |
| Chronic kidney disease | 25.6 | 24.6 | 27.2 |
| COPD | 24.5 | 14.4 | 40.3 |
| Rheumatoid or osteo-arthritis | 20.7 | 12.6 | 33.7 |
| Alzheimer's and related conditions | 16.7 | 24.1 | 5.1 |
| Cataracts | 12.6 | 14.6 | 9.2 |
| Osteoporosis | 10.7 | 8.7 | 13.9 |
| Glaucoma | 9.8 | 9.9 | 9.6 |
| Stroke | 4.3 | 2.8 | 6.6 |
| Other | 9.7 | 6.0 | 15.5 |
| Mental Conditions | |||
| Depressive disorders | 36.2 | 27.4 | 50.0 |
| Anxiety disorders | 20.7 | 12.6 | 33.5 |
| Bipolar disorder | 10.9 | 4.8 | 20.5 |
| Schizophrenia and other psychotic disorders | 8.6 | 8.1 | 9.4 |
| Post-traumatic stress disorder | 4.0 | 2.5 | 6.3 |
| Conduct disorders and hyperkinetic syndrome | 1.3 | 0.6 | 2.5 |
| Personality disorders | 2.8 | 1.2 | 5.3 |
| Tobacco Use | 19.6 | 8.9 | 36.5 |
| Number of Months Enrolled in Plan During Baseline Year | |||
| Entire baseline year | 84.9 | 80.9 | 91.1 |
| 5 months or less | 7.9 | 11.2 | 2.6 |
| 6-11 months | 7.2 | 7.9 | 6.3 |
| Number of Members Enrolled in the Study | 1,562 | 956 | 606 |
At follow-up, across both plans, members experienced nearly one inpatient admission and 1.8 ER visits per member per year. Approximately 12 percent experienced a 30-day readmission following a medical discharge, and 13 percent experienced a 30-day readmission following discharge for any reason. Medical and all-type readmissions rates at follow-up remained similar to baseline rates. The means at follow-up are similar to those at baseline, overall and for each plan, as is the difference between the two plans.
| TABLE IV.2. Use of Hospital and ER Services at Baseline and Follow-up(means) | ||||||
| Outcome | Both Plans (baseline) | Both Plans (follow-up) | Care Wisconsin (baseline) | Care Wisconsin (follow-up) | Gateway (baseline) | Gateway (follow-up) |
| Outcomes at Baseline (1 year before study) | ||||||
| Proportion of members with an admission | 0.47 | 0.43 | 0.37 | 0.37 | 0.63 | 0.53 |
| Number of admissions | 1.07 | 0.95 | 0.68 | 0.70 | 1.64 | 1.33 |
| Proportion of members with an ER visit | 0.55 | 0.56 | 0.47 | 0.50 | 0.68 | 0.66 |
| Number of ER visits | 1.72 | 1.81 | 1.18 | 1.20 | 2.52 | 2.76 |
| Proportion of members with a 30-day medical readmission | 0.13 | 0.12 | 0.08 | 0.09 | 0.20 | 0.17 |
| Proportion of members with a 30-day readmission | 0.14 | 0.13 | 0.09 | 0.09 | 0.22 | 0.20 |
| Number of Members Enrolled in the Study | 1,562 | 956 | 606 | |||
2. Homogeneity of Care Managers
Because orthogonal designs assume that implementers have relatively homogeneous outcomes before the study, we assessed the similarity in outcomes for the care managers by computing regression-adjusted mean outcomes for each of them. We graphically show mean outcomes for each care manager in Figure IV.1, Figure IV.2 and Figure IV.3 for the number of inpatient admissions, ER visits, and proportion of members with medical readmissions (readmission for any reason following a medical admission).
At baseline, the members had an average of 1.07 inpatient admissions, marked with a blue-dotted line in Figure IV.1. One standard deviation of the mean is marked with a green-dotted line. Overall, there were few outliers for member outcomes across care managers. To account for the few differences that we identified, the regression analyses in which we analyzed the relative effectiveness of enhanced care and routine care options controlled for care manager-level average outcomes at baseline.
| FIGURE IV.1. Number of Inpatient Admissions per Member per Year by Care Manager One Year Before the Study, Adjusted for Member Risk |
 |
| FIGURE IV.2. Proportion of Members Readmitted per Year by Care Manager (for any reason) One Year Before the Study, Adjusted for Member Risk |
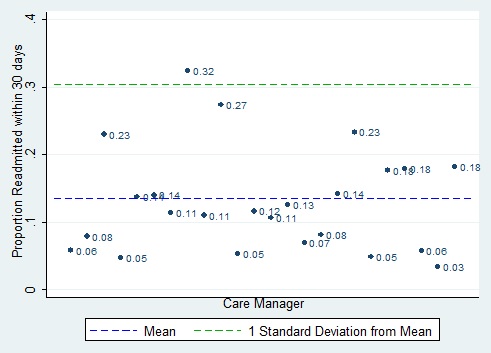 |
Many observations were close to the mean and were not as dispersed as one would expect if the underlying distribution were normal. There was one outlier that may be of concern, with an average of 2.6 admissions per member--double the mean for the group overall. However, that care manager, like other care managers whose members had many admissions, was from Gateway, such that differences seen in the graph below are mostly due to differences between the two plans rather than to differences between individual care managers. In other words, the care manager with 2.6 admissions per member does not stand out among the Gateway care managers as much as he or she does from the Care Wisconsin care managers. Thus, controlling for which plan a care manager comes from should account for this disparity. A similar pattern is observed for proportion of members with medical readmissions (Figure IV.2) and proportion of members with any readmissions (not shown). Number of ER visits shows a less divergent pattern among the care managers (Figure IV.3.)
| FIGURE IV.3. Number of ER Visits per Member per Year by Care Manager One Year Before the Study, Adjusted for Member Risk |
 |
These graphs show that variation in outcomes across care managers was large. Although the number of care coordinators (24) participating in this study exceeds the number used in some studies in other fields, it did not provide sufficient power for this study, due to the large variation in hospitalization rates across coordinators. Without adequate power, statistically insignificant differences in outcomes between enhanced and routine versions of a care component cannot be taken as valid evidence that the routine (and typically less expensive) version of the intervention is just as effective as the enhanced version.
3. Heckman-Hotz Test Results
We ran a test similar to the Heckman-Hotz test in which we assessed whether outcomes measured one year before the study (between May 16, 2010, and May 15, 2011) differed between members assigned to routine and enhanced care options for each studied intervention component. Given that the intervention had not yet begun during that period, there should be no meaningful difference in outcomes between the routine and enhanced care groups. With few exceptions, the results suggest no pre-existing differences in outcomes between routine and enhanced care groups. The number of inpatient admissions differed at the 5 percent level of significance between members assigned to routine and enhanced care in Component 1, frequency of contacts. For readmissions following admissions for any reason, no component was associated with statistically significantly different outcomes. Detailed regression results are shown in Appendix C, Table C.1.
4. Regression Analysis Results: Summary
We found few statistically significant differences between routine and enhanced care options. In Table IV.3, we show the predicted means at follow-up obtained from a regression analysis in which outcomes were analyzed as a function of the intervention components, controlling for member characteristics. Table IV.3 shows only results significant at the 10 percent or higher level of significance, but we focus only on results significant at the 5 percent level. In Appendix C, Table C.2, we present detailed regression analysis results.
| TABLE IV.3. Average Outcomes at Follow-up for Members Assigned to Enhanced or Routine Care(predicted means) | ||||
| Components and Outcomes | Enhanced Care (Option b) | Routine Care (Option a) | Difference (Option b - Option a) | p-Value (from regression) |
| Frequency-of-Routine Contacts and Medication Reviews (Component 1) | ||||
| Any 30-day medical readmission | 0.32 | 0.24 | 0.08* | 0.059 |
| Number of hospitalized members assigned to each option | 330 | 319 | ||
| Number of ER visits | 1.66 | 1.95 | -0.29** | 0.030 |
| Number of members assigned to each option | 773 | 790 | ||
| Frequency of Care Plan Review (Component 6) | ||||
| Any 30-day medical readmission | 0.25 | 0.32 | -0.07** | 0.079 |
| Number of hospitalized members assigned to each option | 336 | 313 | ||
| Method Used to Coach and Educate Members (Component 7) | ||||
| Number of ER visits | 1.94 | 1.67 | 0.27** | 0.045 |
| Number of members assigned to each option | 776 | 786 | ||
| NOTES: The table shows only those components for which 1 of the 2 options produced significantly different outcomes (at the 10% level). P-values for the difference between routine and enhanced care are calculated as part of the regression analysis. See Appendix C, Table C.2 for the complete results of the analysis. * Significantly different from zero at the 10% level. ** Significantly different from zero at the 5% level. *** Significantly different from zero at the 1% level. | ||||
The results presented in this section refer to the effectiveness of options as assigned; in other words, these results do not take into account that some options were not always provided as assigned. In Section V.A, we analyze the fidelity to intervention components by using tracking tool data and discuss implementation in light of the feedback received from care managers. In Section VI, we briefly outline the impact analysis findings and interpret them based on the results of tracking tool analyses and findings from our conversations with care managers.
We found a statistically significant difference at the 5 percent level in outcomes between the routine care and enhanced care options for few components. There was no difference in the number of inpatient admissions between routine and enhanced care for any intervention component. We found fewer ER visits, on average, for members who were assigned to receive: (1) a higher (than the existing standard) minimum frequency for routine contacts and medication review; and (2) routine care practices for member education (rather than use of the more intensive teachback method).4 We also found that the likelihood of medical readmissions was lower for members assigned to receive a more frequent care plan review. However, none of the three enhanced care options that focused on reducing readmissions (Components 9, 10, and 11) was found to be more effective than the routine procedures used by the plans. Sensitivity analysis showed that results did not change materially if any single care manager or care team assigned to provide intervention components was dropped from the analysis. (Results not shown.) Below, we discuss the findings by component in more detail.
5. Regression Analysis Results for Each Component
Frequency-of-Routine Contacts and Medication Reviews (Component 1). Members who were assigned to receive a higher minimum number of routine contacts and medication reviews had fewer ER visits than those assigned to a lower minimum number. Members assigned to receive more frequent routine contacts and medication review averaged 1.7 ER visits, whereas those assigned to receive less frequent contacts had nearly two ER visits on average per person (Table IV.3). Therefore, by instituting a higher minimum frequency of contacts and medication review, the plan could reduce ER visits by 16 percent (p=0.03).5
Falls-Risk Screening (Components 2 and 3). Members who were assigned to receive regular falls-risk screening with an instrument did not have different outcomes compared with those who were assigned to informal screening (done as-needed without an instrument). Similarly, members assigned to be sent a letter with screening results and a pamphlet on how to avert falls did not have different outcomes from those who were assigned not to be sent a letter.
Screening for Depression (Components 4 and 5). Members who were assigned to be screened for depression once every three months did not have different outcomes compared with those assigned to receive twice yearly screenings. Members for whom care managers were to use a nine-item instrument (PHQ-9) did not have different outcomes compared with those for whom a two-item instrument (PHQ-2) was to be used.
Frequency of Care Plan Review (Component 6). Members who were assigned to receive quarterly care plan reviews did not have different outcomes compared with members assigned care plan reviews as per routine practice (less frequent reviews).
Method Used to Coach and Educate Members (Component 7). Members assigned to receive routine care practices in coaching and educating had fewer ER visits than members assigned to receive the teachback method. During the follow-up year, members whose care managers used routine care practices while coaching and educating had an average of 1.67 ER visits, whereas those assigned to the teachback method had 1.94 ER visits (Table IV.3). This means that using routine practice (versus the teachback method) was associated with 14.9 percent more ER visits (p=0.045). Members assigned to routinely used practices did not have different admission or readmission rates compared with those for whom the teachback method was to be used.
Number of Post-Discharge Follow-Ups (Component 9). Members who were assigned two post-discharge follow-ups did not have better outcomes than those assigned one follow-up.
Informing PCP of Members' Discharge (Component 10). Members for whom care managers were assigned to inform the PCP of discharge via telephone, in addition to by letter, did not have better outcomes than those whose PCPs were to be informed via a letter.
Formal (versus informal) Post-Discharge Follow-Up (Component 11). Members who were assigned to receive a formal post-discharge follow-up with an instrument and a checklist did not have better outcomes than those assigned to an informal follow-up.
6. Regression Analysis Results at First and Second Six-Month Follow-Up
We also estimated the effect of components on all members at the first and the second six-month follow-ups to assess whether enhanced options may have influenced outcomes early on but then dissipated, or whether they took several months to take effect. We found a few statistically significant results at the 5 percent level that appeared in one period or the other but not both (detailed results not shown). At the first six-month follow-up, members assigned to more frequent falls-risk screening with an instrument were more likely to be readmitted following a medical discharge than those assigned to routine care; at the second six-month follow-up, the enhanced care group was less likely to be readmitted following a medical discharge. The finding is most likely anomalous in that periodic falls-risk screening is not expected to affect the likelihood of readmission.
At the first (but not the second) six-month follow-up, members assigned to receive coaching with the teachback method had more ER visits than those assigned to routine practices, a finding that accords with the results for the year-long follow-up. It is possible that care managers improved their skills in using the teachback method over time. At the first (but not the second) six-month follow-up, more frequent care plan reviews were associated with a lower likelihood of readmission, in line with the findings for the year-long follow-up.
V. IMPLEMENTATION ANALYSIS
A. Fidelity Analysis Using Tracking Tool Data
Enhanced care options introduced more frequent provision of an existing service and/or practices that qualitatively enhanced care. In most cases, care managers assigned to enhanced care options were making several changes to their routine practices. Given the relative absence of statistically significant results, we assessed the extent to which care managers implemented the routine and enhanced care options as planned (as part of the study protocol); that is, care managers' actual routine care practices may differ from routine care practices as specified in the study protocol. Further, care managers might not have implemented enhanced care practices successfully. For example, we were interested to see whether routine care may have been more intensive and enhanced care less intensive than prescribed in the study protocol, which would lead to routine and enhanced options being too similar, that is, routine and enhanced care may not be meaningfully different from each other. We analyzed fidelity to interventions quantitatively by using tracking tool information and conducting qualitative discussions with plan staff.
We analyzed the fidelity to assignments by using: (1) the percentage of members who received the assigned option at least once (Table V.1); (2) the annualized number of times each option was provided per member per year (Table V.2); and (3) the percentage of members who received a given option at least as often as assigned (Table V.3). We also computed the percentage of members who refused a given component or option at least once (Table V.1). We tracked refusals only for falls-risk screening, depression screening, and post-discharge follow-up. Given that we analyzed outcomes for both plans in aggregate, and the same training procedures regarding the study were used for both plans, we focused on the fidelity to assigned intervention alternatives for both plans combined. Overarching lessons from implementation analysis are needed to interpret regression analysis findings, which also analyze the two plans together.6 For more details on fidelity for each plan separately, see Table V.1, Table V.2, Table V.3, and Appendix D.
Following the final day of implementation, we conducted discussions with Gateway and Care Wisconsin care management staff and plan leaders, with the goal of understanding how the components were implemented and identifying the facilitators and barriers to implementation experienced by care managers. We reached all seven Gateway care managers and two leaders. Although we were unable to speak directly to care managers at Care Wisconsin, four leaders relayed care managers' feedback and provided their own perspectives. In Appendix D, we present detailed feedback we received about each tested alternative.
| TABLE V.1. Percentage of Members Assigned to an Option Who Received or Refused That Option at Least Once(mean) | |||
| Fidelity Measure | Both Plans | Care Wisconsin | Gateway |
| Routine Contacts (Component 1) | |||
| Percentage of members assigned to routine care who were contacted | 91.3 | 96.6 | 78.1 |
| Percentage of members assigned to more frequent contacts who were contacted | 88.2 | 98.5 | 77.5 |
| Medication Review (intended to be provided as part of Component 1) | |||
| Percentage of members assigned to routine care who received medication review | 73.3 | 74.7 | 69.7 |
| Percentage of members assigned to enhanced care who received medication review | 75.5 | 78.7 | 72.2 |
| Screening for Risk of Falls (Component 2) | |||
| Percentage of members screened informally as-needed | 25.9 | 19.8 | 35.6 |
| Percentage of members screened with tool | 52.1 | 50.3 | 54.9 |
| Percentage of members who refused | 6.7 | 8.2 | 4.5 |
| Referral to Fall Prevention Program for Members Who Screen Positive (Component 3) | |||
| Percentage of members referred without letter | 20.8 | 17.6 | 25.6 |
| Percentage of members who received letter and pamphlet | 25.7 | 23.1 | 29.9 |
| Use of Depression Screening Instruments (Component 4) | |||
| Percentage of members screened with PHQ-2 | 64.3 | 68.0 | 60.1 |
| Percentage of members screened with PHQ-9 | 58.1 | 63.4 | 45.8 |
| Depression Screening Frequency (Component 5) | |||
| Percentage of members assigned to twice yearly screening who were screened | 62.5 | 65.1 | 60.5 |
| Percentage of members assigned to quarterly screening who were screened | 74.0 | 81.1 | 44.6 |
| Percentage of members who refused screening | 7.4 | 8.7 | 5.3 |
| Referral to Mental Health Intervention for Members Who Screen Positive (Component 5) | |||
| Percentage of members referred without letter | 36.4 | 29.1 | 41.9 |
| Percentage of members referred and letter sent to PCP | 22.0 | 24.6 | 11.5 |
| Review of Care Plan (Component 6) | |||
| Percentage of members assigned to routine care whose care plans were reviewed | 77.1 | 82.5 | 63.6 |
| Percentage of members assigned to quarterly review whose care plans were reviewed | 72.8 | 75.5 | 69.9 |
| Method Used for Member Education (Component 7) | |||
| Percentage of members for whom routine practice was used | 74.5 | 75.4 | 73.2 |
| Percentage of members for whom teachback method was used | 39.3 | 29.1 | 55.7 |
| Number of Post-Discharge Follow-Ups (Component 9) | |||
| Percentage of discharged members assigned to 1 follow-up who received at least 1 | 38.5 | 40.2 | 37.6 |
| Percentage of discharged members assigned to 2 follow-ups who received at least 1 | 31.1 | 33.3 | 25.3 |
| Percentage of discharged members who refused follow-up | 0.0 | 0.0 | 0.0 |
| PCP Informed of Members' Discharge (Component 10) | |||
| Percentage of discharged members whose PCP was notified by letter | 42.8 | 44.9 | 38.9 |
| Percentage of discharged members whose PCP was notified by letter and telephone | 42.6 | 45.3 | 40.7 |
| Post-Discharge Follow-Up Procedure (Component 11) | |||
| Percentage of discharged members who received informal follow-up | 31.8 | 34.1 | 27.6 |
| Percentage of discharged members who received follow-up with checklist and instrument | 24.7 | 15.2 | 31.1 |
| NOTES: The table shows the proportion of members assigned to each option who received that option at least once. For each intervention component, the first shown option is routine care (Option a), and the second is enhanced care (Option b). Component 8 was a "dummy" component (one that was not specified or implemented). | |||
| TABLE V.2. Number of Times an Option Was Provided to Members Assigned to That Option(per member per year) | ||||
| Intervention Component | Both Plans | Care Wisconsin | Gateway | Assigned Frequency |
| Routine Contacts (Component 1) | ||||
| Number of contacts if assigned routine care | 9.9 | 12.3 | 4.0 | n.a. |
| Number of contacts if assigned more frequent contact | 9.2 | 14.1 | 4.1 | n.a. |
| Number of contacts (low-risk members assigned to quarterly contacts) | 8.8 | 10.7 | 3.6 | 4 |
| Number of contacts (low-risk members assigned to twice quarterly contacts) | 8.6 | 12.8 | 3.9 | 6 |
| Number of contacts (high-risk members assigned to monthly contacts) | 14.0 | 19.3 | 5.1 | 12 |
| Number of contacts (high-risk members assigned to twice monthly contacts) | 11.2 | 19.6 | 4.7 | 24 |
| Medication Review (part of Component 1) | ||||
| Number of times review performed if assigned to routine care | 2.4 | 2.2 | 3.0 | n.a. |
| Number of times review performed if assigned to enhanced care | 3.3 | 3.3 | 3.4 | n.a. |
| Screening for Risk of Falls (Component 2) | ||||
| Number of times informal screening performed | 0.36 | 0.29 | 0.48 | n.a. |
| Number of times member screened with tool | 0.65 | 0.64 | 0.68 | 3 |
| Referral to Fall Prevention Program for Members Screening Positive (Component 3) | ||||
| Number of times referred without letter | 0.27 | 0.36 | 0.21 | n.a. |
| Number of times letter and pamphlet sent | 0.34 | 0.39 | 0.30 | n.a. |
| Use of Depression Screening Instruments (Component 4) | ||||
| Number of times screened with PHQ-2 | 1.3 | 1.1 | 1.4 | n.a. |
| Number of times screened with PHQ-9 | 1.1 | 0.62 | 1.2 | n.a. |
| Depression Screening Frequency (Component 5) | ||||
| Number of times screened if assigned to do so twice yearly | 1.1 | 1.3 | 1.0 | 2 |
| Number of times screened if assigned to do so quarterly | 1.4 | 1.6 | 0.66 | 4 |
| Referral to Mental Health Intervention for Members Screening Positive (Component 5) | ||||
| Number of times referred without letter | 0.51 | 0.45 | 0.55 | n.a. |
| Number of times referred and letter sent to PCP | 0.30 | 0.33 | 0.17 | n.a. |
| Review of Care Plan (Component 6) | ||||
| Number of times reviewed if assigned to routine care | 2.8 | 2.6 | 3.3 | n.a. |
| Number of times reviewed if assigned to quarterly review | 2.6 | 2.2 | 3.0 | 4 |
| Method Used for Member Education (Component 7) | ||||
| Number of times routine practice used | 3.7 | 3.7 | 3.7 | n.a. |
| Number of times teachback method used | 1.3 | 0.76 | 2.1 | n.a. |
| Number of Post-Discharge Follow-Ups (Component 9) | ||||
| Number of times followed up if assigned to do so once | 0.75 | 0.81 | 0.73 | 1 |
| Number of times followed up if assigned to do so twice | 0.45 | 0.48 | 0.36 | 2 |
| PCP Informed of Members' Discharge (Component 10) | ||||
| Number of times PCP notified by letter | 0.74 | 0.74 | 0.76 | n.a. |
| Number of times PCP notified by letter and telephone | 0.80 | 0.96 | 0.69 | n.a. |
| Post-Discharge Follow-Up Procedure (Component 11) | ||||
| Number of times followed up informally | 0.60 | 0.58 | 0.62 | n.a. |
| Number of times followed up with checklist and instrument | 0.41 | 0.24 | 0.52 | n.a. |
| NOTES: For each intervention component, the first shown option is routine care, and the second is enhanced care. Component 8 was a dummy component (1 that was not specified or implemented).n.a. = not applicable. | ||||
1. Frequency-of-Routine Contacts and Medication Reviews (Component 1)
Analysis of Tracking Tool Data. Care managers contacted approximately 90 percent of members during the study and conducted a medication review for approximately 75 percent of members (Table V.1). Members assigned to enhanced care (a higher minimum number of contacts and medication reviews) received more contacts per member per year than those assigned to less frequent contacts; however, the difference was not as large as specified in the study protocol. Only 37.6 percent of members assigned to more frequent contacts received at least as many contacts as specified versus 64.3 percent of members assigned to less frequent contacts (Table V.3). Members assigned to enhanced care received approximately 38 percent more medication reviews--3.3 reviews per member per year compared to 2.4 for members assigned to routine care.
| TABLE V.3. Percentage of Members Who Received Each Option at Least as Often as Assigned(means) | |||
| Intervention Component | Both Plans | Care Wisconsin | Gateway |
| Routine Contacts (Component 1) | |||
| Percentage of members assigned to routine care who were contacted at least as often as assigned | 64.3 | 78.1 | 30.3 |
| Percentage of members assigned to more frequent contacts who were contacted at least as often as assigned | 37.6 | 57.4 | 16.9 |
| Screening for Risk of Falls (Component 2) | |||
| Percentage of members screened with tool at least as many times as assigned (3 times) | 1.8 | 1.7 | 1.9 |
| Depression Screening Frequency (Component 5) | |||
| Percentage of members assigned to twice yearly screening who were screened at least twice yearly | 27.4 | 34.0 | 22.3 |
| Percentage of members assigned to quarterly screening who were screened at least every quarter | 6.2 | 7.4 | 1.4 |
| Review of Care Plan (Component 6) | |||
| Percentage of members assigned to quarterly review whose care plans were reviewed at least every quarter | 27.6 | 21.8 | 33.7 |
| Number of Post-Discharge Follow-Ups (Component 9) | |||
| Percentage of discharged members assigned to 1 follow-up who received at least 1 follow-up | 19.9 | 23.6 | 17.9 |
| Percentage of discharged members assigned to 2 follow-ups who received at least 2 follow-ups | 2.7 | 3.3 | 1.2 |
| PCP Informed of Members' Discharge (Component 10) | |||
| Percentage of discharged members whose PCP was notified by letter about every discharge | 23.2 | 25.3 | 19.5 |
| Percentage of discharged members whose PCP was notified by letter and telephone about every discharge | 21.6 | 30.5 | 16.1 |
| NOTES: For each component, the first shown option is routine care, and the second is enhanced care. Component 8 was a dummy component (1 that was not specified or implemented). We computed the percentage of members who received a given option at least as often as assigned only for interventions that specified a frequency; they are all shown in the table. | |||
Summary of Conversations with Care Managers. Some care managers reported difficulties in following the frequency of contacts required in the study protocol. Some care managers believed that they made more contacts than were recorded in the tracking tool data.
2. Falls-Risk Screening (Components 2 and 3)
Analysis of Tracking Tool Data. Care managers assigned to provide three screenings per member per year screened twice as many members as those assigned to screen members as-needed (52.1 percent versus 25.9 percent). The screenings revealed that many members were at risk of falls; such members were referred to fall prevention programs (20.8 percent for routine care and 25.7 percent for enhanced care) (Table V.1).
Care managers assigned to screen members three times during the study performed 0.65 screenings compared with 0.36 screenings per member per year among those assigned to perform as-needed screenings. However, the number of screenings fell below the assigned three screenings per member per year (Table V.2). Less than 2 percent of members underwent screening three times per year (Table V.3).
Summary of Conversations with Care Managers. Care managers at Gateway found the falls-risk screening instrument to be useful. Care managers at Care Wisconsin believed that the screening was redundant because the plan already provides similar service through other staff (i.e., not the care managers). Staff at Gateway found the letters to members burdensome to generate; staff at both plans did not believe that the letters impacted members' outcomes.
3. Screening for Depression (Components 4 and 5)
Analysis of Tracking Tool Data. Approximately 62.5 percent of members assigned to twice yearly screening were screened for depression versus 74 percent of those assigned to quarterly screening (Table V.1). Approximately 64.3 percent of members assigned to screening with PHQ-2 were screened, and 58.1 percent of members assigned to be screened with PHQ-9 were screened.
Although care managers assigned to perform quarterly screenings conducted more screenings compared to care managers assigned to twice yearly screenings, the number of screenings fell short of the frequency specified in the study protocol; it was approximately 1.1 and 1.4 among those assigned to twice yearly and quarterly screening, respectively (Table V.2). Care managers assigned to twice yearly screenings reached 27.4 percent of members at least that often, whereas those assigned to quarterly screenings reached only 6.2 percent of members at least quarterly (Table V.3).
Summary of Conversations with Care Managers. Care Wisconsin leaders reported that they plan to adopt PHQ-9. Gateway care managers felt that depression screening was difficult for care managers without a background in mental health and that members sometimes experienced difficulty opening up about sensitive matters. Care managers believed that the depression screening component enabled them to identify and refer more members to appropriate care than before the study. Care managers did not believe that sending screening results letters to PCPs was effective.
4. Frequency of Care Plan Review (Component 6)
Analysis of Tracking Tool Data. Care plan reviews were provided to a greater percentage of members than most other components, except routine contacts. Care managers assigned to a less frequent care plan review screened 77.1 percent of members compared with 72.8 percent of members for care managers assigned to enhanced care (Table V.1). Care managers assigned to perform more frequent care plan reviews provided fewer reviews than those assigned to perform a routine number of reviews, 2.6 versus 2.8 times per member per year (Table V.2). Care managers assigned to provide quarterly reviews performed that many reviews for approximately 27.6 percent of members (Table V.3).
Summary of Conversations with Care Managers. We learned from plan staff that the routine care guidance for the number of care plan reviews differed at the two plans (see Appendix A for details). Plan staff were confused about how often to review the care plan (for both routine and enhanced care) and what a review entailed.
5. Method Used to Coach and Educate Members (Component 7)
Analysis of Tracking Tool Data. The proportion of members who received the teachback method was much lower than the proportion of members for whom care managers adhered to routine coaching methods, 39.3 percent versus 74.5 percent (Table V.1). Care managers used the teachback method 1.3 times per member per year and routine coaching practices 3.7 times per member per year (Table V.2). Additional analysis of tracking tool data showed that only about 6 percent of members received the teachback method when routine care was assigned (results not shown).
Summary of Conversations with Care Managers. Care managers and leaders at the plans liked the teachback method very much, although some care managers experienced difficulty in using the method. Others reported that the teachback method improved communication with members. Given that the routine coaching method for some care managers was the teachback method, such care managers recorded use of the routine method when they in fact relied on the teachback method.
6. Number of Post-Discharge Follow-Ups (Component 9)
Analysis of Tracking Tool Data. We found that 38.5 percent of discharged members assigned to one post-discharge follow-up received at least one follow-up compared to 31.1 percent of those assigned to two follow-ups (Table V.1). Paradoxically, care managers assigned to two follow-ups provided fewer follow-ups per member than did those assigned to one follow-up--0.45 versus 0.75 follow-up per member discharged per year (Table V.2). Only 2.7 percent of members assigned to two follow-ups received at least that many (Table V.3).
Summary of Conversations with Care Managers. Care managers and plan leaders believed that the additional follow-up was useful in theory even though some care managers found it difficult to conduct the second follow-up because calls were time consuming and members difficult to reach.
7. Informing PCP of Members' Discharge (Component 10)
Analysis of Tracking Tool Data. PCPs were informed of members' discharge for about 40 percent of discharged members regardless of whether the care manager was assigned to provide notification by telephone and letter or by letter only (Table V.1). PCPs were notified of a discharge slightly more times by telephone--0.80 versus 0.74 times per member per year (Table V.2). Care managers notified PCPs by telephone and letter and by letter only for every discharge for a similar proportion of members, 21.6 percent and 23.2 percent, respectively (Table V.3).
Summary of Conversations with Care Managers. Although care managers notified PCPs of members' discharge, they did not believe that such notification added value to members' health.
8. Post-Discharge Follow-Up with and Without an Instrument and Checklist (Component 11)
Analysis of Tracking Tool Data. Approximately 31.8 percent of members received follow-up without an instrument and checklist (routine care) compared to 24.7 percent who received follow-up with an instrument and checklist (enhanced care) (Table V.1). Care managers provided fewer post-discharge follow-ups per member to those assigned to enhanced care than to those assigned to routine care, 0.41 and 0.60 per member per year, respectively (Table V.2).
Summary of Conversations with Care Managers. The study prompted plans to develop and incorporate into their routine care a checklist inspired by the one used in the study. Care Wisconsin care managers felt that the CTM-3 should be administered before, rather than after, member discharge from the hospital.
B. Implementation Analysis: Care Managers' Feedback on Implementation Challenges
Plan leaders and care managers also provided feedback on study implementation, including implementation challenges in general (for example, the effect of the study on care manager workloads) as well as the influence of organizational changes on study implementation. In addition, they provided feedback on how local, state, or federal initiatives or policy changes may have affected the study.
1. Lessons Learned
Plan staff reported that the study enabled learning and improvements, namely: (1) the study facilitated learning and improvements; and (2) staff at both plans recognized the need to track provision of intervention components.
The Study Facilitated Learning and Improvements. The study prompted Care Wisconsin to adopt some of the processes and tools used in the study. Care Wisconsin leaders reported that the falls-risk screening as part of the study prompted them to consider training care managers in falls-risk assessment. (As part of routine care at Care Wisconsin, a nurse performs an in-person evaluation of mobility, safety, and functional status on each member. Falls-risk screening by care managers would be done in addition to the screening by nurses.) Care Wisconsin will adopt the PHQ-9 for depression screening in routine care going forward because care managers were more comfortable with a nine-item instrument compared to lengthier instruments used at the plan before the study, and felt the two-item PHQ-2 alternative was too limited. Care Wisconsin has developed a care transitions intervention that includes use of a structured checklist similar to the one implemented as part of the study. In addition, the plan is considering adoption of a second post-discharge follow-up as routine practice.
The study introduced additional structure to care management processes at Gateway. Gateway leaders stated that they plan to adopt structured processes for the provision of care management activities. For example, under routine practice, care managers use clinical judgment regarding when to contact members and which topics to discuss during contacts. Intervention Component 1, by contrast, instructed care managers on how often to contact members based on member risk and required them to include medication reviews during every contact with members. Similarly, falls-risk screening is routinely done for some members as deemed necessary by care managers and without following a specific protocol, whereas the study introduced formal screening with an instrument over prescribed intervals (quarterly). Care managers were receptive to the more structured processes and shared the opinion of the leaders that more structure would be useful. Gateway leaders also noted that they are considering providing additional training to care managers to help them better assess members' depression.
Staff at Both Plans Recognized the Need to Track Provision of Intervention Components. Both plans employed a tracking sheet for care managers to complete every time they contacted a member and every time they provided a given intervention component. After the year-long implementation, staff at the two participating plans noted that spreadsheets would have provided a better structure to track provision of intervention components than the tracking sheets developed for this study because spreadsheets could be used by care managers to track which members were due for a given intervention. Gateway care managers believed that using a spreadsheet to track timing and activities would have been a superior alternative to the tracking sheets. At Care Wisconsin, some care managers did successfully institute a spreadsheet-based tracking system.
2. Feedback About Study Implementation
Plan leaders and care managers found that: (1) study implementation became easier over time, in terms of both implementing intervention components and completing a tracking sheet; (2) buy-in of care management staff was essential for the success of the study; (3) plans were able to successfully transition new staff to replace care managers who left the plan; and (4) there were higher-than-expected costs associated with study implementation.
Implementation Became Easier for Staff Over Time. Plans found that burdens placed on staff due to study implementation decreased over time as support systems were put in place. Leaders indicated that study-specific workload was manageable after the first few months of the study.
Care managers at both plans experienced some difficulties integrating tracking sheets into day-to-day activities, albeit for different reasons. At Gateway, care managers sometimes forgot to fill out tracking sheets after speaking with members. Three care managers at Gateway described the tracking sheet process as burdensome and indicated that it reduced productivity. In contrast, care managers at Care Wisconsin got used to using the tracking tools and found them easy to complete.
Staff at both plans developed strategies to help care managers with implementation. Gateway required care managers to fill out tracking sheets in a cubicle dedicated to study activities. Gateway involved a project manager to assist staff with activities such as generation of letters to member and PCPs, completion of tracking sheets, and facilitating communication with Mathematica. Similarly, Care Wisconsin involved a staff member to help with the scanning of tracking tool sheets and to communicate with Mathematica research staff. Leaders indicated that they should have planned for dedicated project management time at the beginning of the study.
To monitor when service provision was due, some care managers at both plans developed informal ways of logging which members received a given alternative. Leaders at both plans found that feedback from care managers was very important in developing the informal tracking system; they noted that they should have sought the feedback from care managers earlier in the process. A Care Wisconsin leader felt that tracking spreadsheets helped care managers with implementation.
Buy-In of Care Management Staff was Essential for Success of the Study. Leaders worked to earn buy-in from concerned staff by discussing intervention component feasibility and familiarizing staff with the study. Although leaders at both plans experienced difficulty gaining staff buy-in before intervention components were finalized, Mathematica's training sessions were very useful in this process. However, leaders noted that it may have been useful to have Mathematica researchers return to review these items midway through the study period. Gateway leaders believe it may have helped to invite care managers who have participated in similar studies in the past to reassure staff and gain buy-in.
Both Plans were able to Successfully Transition New Staff into the Study. At Gateway, one care manager went on maternity leave and another retired during the study period. In both cases, leadership transitioned a new care manager to take over the department staff member's caseload and conduct interventions for his or her members. A leader at Care Wisconsin stated that staffing changes were handled by incorporating study training into new staff orientation.
There were Higher-than-Expected Costs Associated with Study Implementation. Plan leaders described costs as "low" or "modest." However, Care Wisconsin leaders felt that they should have asked for financial support. For Care Wisconsin, burden took the form of time commitments, training, and sending forms. Both plans experienced unanticipated expenses due to study participation, including printing materials and assigning staff to support data entry.
VI. DISCUSSION AND CONCLUSIONS
A. Interpretation of Impact Analysis Findings
In this section, we interpret the impact analysis findings in light of the results of the quantitative fidelity analysis and use the findings from the conversations with care managers to provide greater depth of understanding. First, we discuss the results that show significant differences in outcomes and, second, examine the results that point to no difference between routine and enhanced care options.
1. Results Showing Significant Differences in Outcomes
Over the full year of follow-up, much more frequent medication reviews, in conjunction with slightly more frequent contacts among the enhanced care group, were associated with 16 percent fewer ER visits. Members assigned to enhanced care received slightly more contacts and many more medication reviews (38 percent) than members assigned to routine care. The additional contacts may have allowed care managers to identify and address emerging health issues before they became urgent or severe enough for members to seek emergency care. Brown et al. (2012) identified frequent contacts and strong medication review as two of six approaches practiced in effective care management programs that cut readmissions for high-risk patients. Even though we observed no favorable effects for the number of inpatient admissions, the plans learned that the implemented number of contacts and reviews were more effective than routine practices and would allow them to reduce expenditures on ER visits by 16 percent. The effect on the number of ER visits among members hospitalized at least once was even higher. This suggests that targeting those hospitalized at least once before adopting a higher number of contacts for all members may be more effective.
Over the full year of follow-up, use of the teachback method to coach members was associated with 15 percent more ER visits, possibly because members assigned to teachback likely received less coaching overall. The percentage of members receiving the assigned alternative was much lower for those assigned to the teachback method than for those assigned to routine care (39.3 percent versus 74.5 percent) as was the number of times coaching used teachback versus routine methods (1.3 versus 3.7 times per member per year). Routine practices (versus the teachback method) may have been more effective in reducing ER visits simply because many more members assigned to routine practices received any kind of coaching. Even though care managers liked the teachback method very much, some care managers experienced barriers with the method. Further, impact analysis suggested that members assigned to teachback had more ER visits only at the second (but not the first) six-month follow-up; therefore, it is possible that care managers improved their skills in providing the teachback method over time, indicating that more training was needed than provided during the study in the use of the teachback method. Both plans plan to schedule further training of care managers in the teachback method.
Results for outcomes measured over the 1-6 and 7-12 month periods were similar to those for the full period, suggesting that most of the enhanced options neither influenced outcomes early on but then dissipated, nor that they took several months to take effect. One exception is that assigning members to more frequent falls-risk screenings with an instrument increased their likelihood of readmission following a medical discharge as compared to those assigned to routine care; at the second six-month follow-up, the finding was reversed. These findings are most likely anomalous in that periodic falls-risk screening is not expected to affect the likelihood of readmission.
2. Results Showing No Significant Differences in Outcomes
We found no difference in any outcomes between enhanced care and routine care for the following tested options: (1) falls-risk screening three times yearly versus as-needed; (2) fall prevention referral letter versus no letter; (3) quarterly depression screening versus twice yearly screening; (4) use of PHQ-9 versus PHQ-2; (5) more frequent care plan review; (6) two versus one post-discharge follow-ups; (7) informing PCPs of members' discharge via telephone versus letter only; and (8) use of an instrument and checklist during post-discharge follow-up versus use of no tools. We observed no difference in the number of inpatient admissions between routine and enhanced care options for any implemented intervention component. Care managers at both plans strongly believed that one particular component did not improve member outcomes--informing PCPs about members' discharge. They believed notifications were not useful whether they were done by telephone or letter.
Although it may seem disheartening that many enhanced care options did not affect the outcomes of interest, a finding of no difference is meaningful because it can guide improvements in program efficiency. If intervention components were implemented as intended, a finding of no difference in outcomes for members who received routine and enhanced care indicates that the more intensive alternative did not improve outcomes over the less intensive option. Such a finding suggests that it is not worth the extra cost of adopting the more expensive option. However, a finding of no difference in outcomes between routine and enhanced care options might have also been attributable to any one of the following reasons.
-
The routine care option may not have differed sufficiently from enhanced care as specified at the outset of the study.
- Care Wisconsin indicated that the more frequent screening for the risk of falls (Components 2 and 3) with the use of an instrument was in fact similar to the falls-risk screening routinely provided.
- Conversations with care managers revealed confusion about how often to review a care plan (Component 6) and what is involved in a plan review.
-
The enhanced care option may not have been implemented in a manner that distinguished it sufficiently from the routine care option because it was not implemented consistently or fully. For some components, the routine care option appears to have been delivered to more patients or more intensively than the enhanced version.
- Although members assigned to receive enhanced care received more depression screenings than those assigned to routine care, the number of screenings fell far short of the assigned frequency.
- One might expect improved outcomes among those assigned to one post-discharge follow-up (Component 9) because, as shown in the tracking analysis, such individuals were more likely to receive a follow-up and in fact did receive a slightly greater number of follow-ups per person. However, we did not find improved outcomes in either group, perhaps indicating that the difference between the two groups in the proportion receiving several follow-ups was not sufficiently large to generate detectable effects.
- Although post-discharge follow-up with an instrument and a checklist (Component 11) was qualitatively more intensive, care managers performed fewer follow-ups with the instrument/checklist.
-
Effects of some components that apply to only a subset of members are more difficult to detect than effects of components that apply to all members.
- For care transitions components (Components 9, 10, and 11), only hospitalized members were eligible; therefore, the power to detect effects for these interventions is even lower (although not markedly so, given that the number of care managers is the main determinant of power, rather than the number of patients). Similarly, for fall prevention referral (Component 3), only members who screen positive for the risk of falling are eligible to be referred.
It is possible that a given enhanced care component might show improvements in outcomes if the plan provides more resources to implement and monitor these changes (such as hire more staff or provide support to current staff). For example, although post-discharge follow-up with an instrument and a checklist (Component 11) was qualitatively more intensive, care managers performed fewer follow-ups with the instrument/checklist, possibly because it took them longer to perform follow-ups using a protocol.
3. Despite No Significant Differences in Outcomes, Several Enhanced Care Options Were Viewed as Useful or Otherwise Showed Promise
The more frequent screening for the risk of falls (Components 2 and 3) with the use of an instrument had no impact on the outcomes of interest for both plans together; however, it is possible that such screening benefitted Gateway members. Even though care managers assigned to screen members three times per year (enhanced care) screened a greater proportion of members (25.9 percent versus 52.1 percent) and performed many more screenings per member per year as compared to care managers assigned to as-needed screenings (0.36 versus 0.65), routine care proved as effective as enhanced care.
Depression screening under the enhanced care alternatives (Components 4 and 5) was not associated with different outcomes; however, use of the shorter instrument allowed the plans to screen more members. More frequent and formalized depression screening might have had an effect on intermediate outcomes by identifying a greater number of depressed members who were then referred to therapy, perhaps helping the affected individuals overcome their depression and improve their well-being. In the absence of access to data on quality of life outcomes, we were unable to discern whether such effects occurred. Care managers believed, however, that they were able to identify more cases of depression and refer members to appropriate care. One motivation for testing the two-question instrument (PHQ-2) was to determine whether more members would be screened with PHQ-2 versus to PHQ-9 because the former takes less time. Indeed, fidelity analysis showed that slightly more members were screened with PHQ-2 (64.3 percent versus 58.1 percent). Use of either instrument was not associated with different outcomes. However, as noted by some care managers, it is possible that PHQ-2 was not as sensitive in detecting depressive symptoms as the longer PHQ-9. As Care Wisconsin adopts PHQ-9, it should keep in mind that a substantial fraction of patients was not screened at all when PHQ-9 was the required instrument.
Even though requiring two post-discharge follow-ups (Component 9) was not associated with different outcomes, Care Wisconsin is planning to adopt the second post-discharge follow-up as routine care. Evidence presented earlier on the number of contacts showed that a greater number of contacts reduced ER visits among hospitalized members. Therefore, second post-discharge follow-ups may prove helpful to such members.
Even though care managers at both plans found the use of an instrument and checklist post-discharge (Component 11) to be highly useful, fewer members assigned to follow-up with the instrument/checklist actually received that follow-up compared to the proportion assigned to routine follow-up who received some follow-up contact (24.7 percent versus 31.8 percent). This difference may explain why formal follow-up was not associated with improved outcomes. Nonetheless, our study suggests that use of follow-up checklist might benefit members because: (1) though insignificant, the size of the effect is large; (2) care managers and plan leaders believed that the component was beneficial; and (3) the approach is consistent with the proven transitional care interventions developed by Naylor (2004) and Coleman (2006). Care Wisconsin is considering adoption of the checklist for routine use.
B. Limitations
The main limitations of this study are the limited power to detect differences between the component options, the need to analyze outcomes for both plans in the aggregate, and the limited exposure of some members to components, which might have undermined the detection of impacts. Further, given the many comparisons (for several outcomes over several periods and for several components) between enhanced and routine care, some of the few statistically significant findings may have resulted from chance. The implementation results indicate that there was incomplete reporting by the care coordinators on their activities. We also found that, for two components, the routine care option did not differ meaningfully from enhanced care as specified at the outset of the study.
Only 24 care managers/teams participated in the study, and true differences between routine and enhanced care options would have had to be quite large (22-32 percent of the mean outcome) for it to have been highly likely to observe statistically significant differences in our sample. To obtain even this many care managers, we needed to "pool" the care managers from the two programs and treat them all as if they were all homogeneous. We estimated intervention effects under the assumption that these effects were equal for the two plans after controlling for patient characteristics and which plan the member belonged to.
It therefore may have been even more difficult to detect differences between the tested options because 30 percent of the Gateway sample did not receive the interventions for long. Members in the Gateway plan were not enrolled in care management for the full (one year) duration of the study, since members who reach their goals "graduate" from the program and cease to receive care management services. On average, members received care management for 4-5 months. Further, it is possible that exposure to intervention components for even a full year was not long enough for outcomes to change. However, because we are analyzing a high-risk population and intervention components that are not likely to have cumulative effects, one year should be long enough for many analyzed components and outcomes to show effects.
Given that we performed many comparisons between enhanced and routine care, it is possible that even the few statistically significant differences observed resulted from chance. The number of significant differences was about what would be expected by chance for the 80 comparisons (two outcomes were analyzed for ten components for all members over three periods and two outcomes for ten components for hospitalized members). Thus, it is unclear whether these represent true effects or differences due to chance. A joint test of whether all enhanced versus routine care differences were zero could not be rejected, indicating that some or all of the observed differences were likely to be due to chance rather than to the interventions. This also indicates that as a group, enhanced components did not have a different effect on measured outcomes than routine practices.
The findings from the implementation analysis of the tracking data may be flawed by incomplete reporting by the care coordinators on their activities. Care managers at both plans experienced some difficulties integrating tracking sheets into day-to-day activities, which indicates that future studies should consider other ways to track fidelity, such as via electronic health records. In the related Brand New Day orthogonal design study, the plan collected such information as part of the electronic health record.
For two components, the routine care option did not differ sufficiently from enhanced care as specified at the outset of the study, so one cannot tell whether an enhanced version of services for a given component was more effective from the routine care. For example, conversations with care mangers revealed that there was confusion about how often to review a care plan (Component 6) and what is involved in a plan review, which is an important finding for the participating plans. The multiplicity of routine care practices and a lack of understanding of what is involved in these practices illustrate that sharp differences between studied options can be hard to define.
For three components, the enhanced care option was not implemented in a manner that distinguished it sufficiently from the routine care option because it was not implemented consistently or fully or because routine care was more intensive as delivered compared to routine care guidelines. This is, however, not a limitation, but rather, an important finding in itself. The analyses in this report took an "intent-to-treat" approach in which component effects are computed by comparing outcomes of those assigned to the two options, regardless of whether or how thoroughly the options were actually delivered. The study did not include overzealous monitoring to make certain that the assigned interventions are implemented because such oversight was not planned to be introduced into the ongoing programs at the two plans. Rather, standard supervisory measures at the two plans continued to test the components in a "real-world" environment with the currently available resources, rather than in a strictly controlled setting. Thus, the finding that a given component was not implemented suggests the need to identify the factors that limit case managers' willingness or ability to implement the planned intervention components.
C. Conclusions
In this study, we find that a great majority of routine practices concerning falls-risk screening and fall prevention referral, depression screening frequency and use of screening tools, frequency of care plan review, number of post-discharge follow-ups, mode of PCP referral of members' discharge, and use of an instrument and checklist during post-discharge follow-up at the two plans work as well as alternative practices in reducing hospitalizations and ER use. However, there were a few exceptions. Requiring a higher versus lower minimum frequency of contacts was associated with fewer ER visits. Yet, surprisingly, teachback method was associated with more ER visits than the routine coaching method. This finding is likely attributable to the fact that care managers were not sufficiently familiar with the teachback method, making it less effective than the routine approach. Fidelity analysis showed that members assigned to routine care received more coaching than those assigned to the teachback method. More thorough training in the teachback method might yield better results. Both plans' care managers and leaders believed that use of the teachback method was particularly helpful.
Members did not experience fewer inpatient admissions, ER visits, or a lower likelihood of readmission when their care managers were assigned to provide enhanced approaches versus routine care management approaches to falls-risk screening, depression screening, care plan reviews, and care transitions. Some findings of no difference in outcomes may be attributable to an enhanced care option that, in design or in implementation, turns out not to be noticeably different from the routine care option. For example, the fidelity analysis showed that the enhanced and routine care groups received approximately the same number of post-discharge follow-ups, consistent with care managers reporting having difficulties conducting the second follow-up because calls were time consuming and members difficult to reach. Although post-discharge follow-up with an instrument and a checklist was qualitatively more intensive and reported as useful by care managers because it provided structure, care managers assigned to the instrument/checklist performed fewer follow-ups, so it is not surprising that we observed similar outcomes for routine and enhanced care groups on this intervention component.
Plan staff felt that the study provided an opportunity for learning and introducing improvements such that both plans have adopted principles, and processes used in the study. Despite the findings that outcomes were not better for the enhanced version of most of the components tested, the participating plans have nonetheless decided to adopt some of these enhancements. Plans' decisions to adopt these enhancements were made before the results on relative effectiveness of enhancements were available to them, and were therefore based solely on their experience with the options. We found that both plans' care managers and leaders believed that use of the teachback method was a useful and appealing innovation; the two plans intend to train all care managers in the method before requiring its routine use. In addition, Care Wisconsin intends to implement the PHQ-9 instrument for depression screening because it was shorter than the tools used at the plan before the study and because community clinicians were familiar with it. Care Wisconsin is considering training care managers in falls-risk assessment. Care Wisconsin has also developed a post-discharge tool similar to one used in the study and is considering adoption of a second post-discharge follow-up because of positive feedback from care managers and because both these enhancements are believed to be helpful to members. Gateway noted that the study introduced more structure in routine contacts, falls-risk screening, and care transitions management, which it considers to be valuable and intends to continue. In addition, the plan intends to train care managers in depression screening. For both plans, the study highlighted the need to track the services delivered by care managers.
D. Implications for Policy and Practice
When implementing an orthogonal design study, it is important to ensure adequate power to detect differences between tested options. In clustered designs (such as the one we used in this study) in which care managers are assigned to implement a given set of components for all their members, power depends predominantly on the number of care managers. Further, if given outcomes are analyzed for a subset of members (such as hospitalized members), the power to detect impacts is even lower.
Although it is important to analyze the fidelity to assigned alternatives in order to interpret the results of their effectiveness, it is also important not to enforce fidelity unless enforcement is intended to be a part of the intervention during and after the study (if interventions are incorporated into routine practices). One criticism of traditional randomized trials is that interventions are studied in highly controlled rather than in real-world settings. Effectiveness of an intervention should be studied in the way they would be implemented on an ongoing basis--that is, in real-world conditions. So, if care managers do not implement a given alternative during the study, it's an equally good reason not to adopt that alternative as if it had not improved outcomes. In addition, the fidelity and effectiveness results should be interpreted in light of feedback received from the implementers. It is possible that a given component was ineffective and implemented rarely simply because training was insufficient, as it might have been the case with the teachback method.
An important benefit of an orthogonal design study, as we have seen from the reaction of the participating plans, might be the structure and consistency of expectations about interventions that it provides. Rather than providing only general training and guidelines to care managers on how to manage patients, care managers are told precisely how they are expected to implement each of the components of care management that are being tested. When routine care is not well defined or when the way routine care is implemented differs across care managers differs, this structure itself can help standardize the care management intervention, leading to less variation in implementation across managers. Further, fidelity analysis allows participating plans to assess the degree to which components were carried out as specified, which can help the plan identify which areas of care management to focus on in their quality improvement efforts. The orthogonal design approach also encourages organizations to create a culture of learning by providing participants with a rigorous approach for testing out their new ideas.
However, the study also identifies some important difficulties with conducting orthogonal design studies in health care organizations. The types of variations in how care coordination is delivered studied here are likely to generate only moderate size effects on hospitalizations or ER use. To have adequate statistical power to detect such effects, a sizeable number of care coordinator units are needed, because the variance of these outcomes across care coordinators is large. Without adequate power, statistically insignificant differences in outcomes between enhanced and routine versions of a care component cannot be taken as valid evidence that the routine (and typically less expensive) version of the intervention is just as effective as the enhanced version. Although the number of care managers (24) participating in this study exceeds the number used in several other studies, it was not sufficient to detect impacts in this study unless they were quite large (22-32 percent), due to the large variation in hospitalization rates across care managers.
The study also illustrates how hard it can be to change the behavior of even dedicated health professionals. For each of the components, both enhanced and routine care groups received the assigned intervention components less often than specified in the study. Very few members received at least the minimum number of services (for example, contacts, post-discharge visits, screenings) as specified in the study protocol, and an even smaller percentage of members assigned to enhanced care received services at least as often as assigned. Even though this finding may have been due in part to under-reporting of services provided, the large discrepancy between planned and delivered interventions suggests that care managers face various barriers to providing services as intended. Some of the barriers reported by care management staff include high caseloads, difficulty tracking provided component options, and multiple organizational changes occurring during the study period that were unrelated to the study. For example, plan staff indicated that they had developed informal ways of logging in which members received a given alternative to help them keep track. An automated way of tracking provision of services may have helped care managers focus on the provision of services. Further, although plans recognized the need to track provision of intervention components, some care managers found filling out tracking sheets burdensome. We found this qualitative investigation of barriers to implementation to be just as important for learning as estimation of the effects of the various enhancements.
REFERENCES
Au, M., S. Simon, A. Chen, E. Rich, S. Croake, C. Stone Valenzano, S. Ansell, D. Lipson, and G. Gimm. "Systematic Review of Original Studies of Care Coordination Programs for Adults with Disabilities." Washington, DC: Mathematica Policy Research, 2011.
Brown, R.S., D. Peikes, G. Peterson, J. Schore, and C.M. Razafindrakoto. "Six Features of Medicare Coordinated Care Demonstration Programs That Cut Hospital Admissions of High-Risk Patients." Health Affairs, June 2012, vol. 31, no. 6, pp. 1156-1166.
Coleman, E.A., C. Parry, S. Chalmers, and S. Min. "The Care Transitions Intervention." Archives of Internal Medicine, 2006, vol. 166, no. 17, pp. 1822-1828.
Care Wisconsin. "Overview." Available at http://www.carewisc.org/about-us/overview.html. Accessed January 15, 2013.
Centers for Medicare and Medicaid Services. "Special-Needs Plan: Fact Sheet and Data Summary." 2012. Available at http://www.cms.gov/Medicare/Health-Plans/SpecialNeedsPlans/downloads/FSNPFACT.pdf. Accessed January 28, 2013.
Gateway Health Plan. "Gateway Health Plan Introduces New Medicare Assured Plans." Available at http://gatewayhealthplan.com/sites/default/files/private/documents/Press%20Release%20for%20October%201.pdf. Accessed December 28, 2012.
Gateway Health Plan. "Celebrating 20 Years of Service to the Community." Available at http://www.gatewayhealthplan.com/about-us/gateway-timeline. Accessed December 18, 2012.
Gold, M., G. Jacobson, A. Damico, and T. Neuman. "Special-Needs Plans: Availability and Enrollment." Washington, DC: Kaiser Family Foundation, September 2011.
Grabowski, D.C. "Special-Needs Plans and the Coordination of Benefits and Services for Dual Eligibles." Health Affairs, January/February 2009, vol. 28, no. 1, pp. 136-146.
Health Net. "Special-Needs Plans (SNP) Model of Care." April 2014. Available at https://www.healthnet.com/static/provider/unprotected/pdfs/national/snp_model_of_care_training.pdf. Accessed December 17, 2012.
Healthcare Effectiveness Data and Information Set. "Volume 2: Technical Specifications for Health Plans." Washington, DC: National Committee for Quality Assurance, 2011.
Jack, B.W., V.K. Chetty, D. Anthony, J.L. Greenwald, G.M. Sanchez, A.E. Johnson, S.R. Forsythe, J.K. O'Donnell, M.K. Paasche-Orlow, C. Manasseh, S. Martin, and L. Culpepper. "A Reengineered Hospital Discharge Program to Decrease Rehospitalization: A Randomized Trial." Annals of Internal Medicine, 2009, vol. 150, pp. 178-187.
Mahoney, J.E. "Why Multifactorial Fall-Prevention Interventions May Not Work: Comment on 'Multifactorial Intervention to Reduce Falls in Older People at High Risk of Recurrent Falls.'" Archives of Internal Medicine, 2010, vol. 170, no. 13, p. 1117.
Medicare Payment Advisory Commission. "Report to the Congress: Medicare and the Health Care Delivery System." Washington, DC: Medicare Payment Advisory Commission, June 2011.
Miller, F.G., and E.J. Emanuel. "Quality-Improvement Research and Informed Consent." New England Journal of Medicine, 2008, vol. 358, no. 8, pp. 765-767.
National Health Policy Group. "SNP Alliance." Available at http://www.nhpg.org/about-us/snp-alliance.aspx. Accessed December 26, 2012.
Naylor, M.D., D. Brooten, R. Campbell, B.S. Jacobson, M.D. Mezey, M.V. Pauly, and J.S. Schwartz. "Comprehensive Discharge Planning and Home Follow-Up of Hospitalized Elders: A Randomized Clinical Trial." Journal of the American Medical Association, 1999, vol. 281, no. 7, pp. 613-620.
Ouwens, M., H. Wollersheim, R. Hermens, M. Hulscher, and R. Grol. "Integrated Care Programmes for Chronically Ill Patients: A Review of Systematic Reviews." International Journal for Quality in Health Care, 2005, vol. 17, no. 2, pp. 141-146.
Peikes, D., A. Chen, J. Schore, and R. Brown. "Effects of Care Coordination on Hospitalization, Quality of Care, and Health Care Expenditures Among Medicare Beneficiaries." Journal of the American Medical Association, 2009, vol. 301, no. 6, pp. 603-618.
Wagner, E.H., B.T. Austin, C. Davis, M. Hindmarsh, J. Schaefer, and A. Bonomi. "Improving Chronic Illness Care: Translating Evidence Into Action." Health Affairs, November 2001, vol. 20, pp. 664-678.
Zurovac, J., and R. Brown. "Orthogonal Design: A Powerful Method for Comparative Effectiveness Research with Multiple Interventions." Issue Brief. Washington, DC: Center on Health Care Effectiveness, April 2012.
Zurovac, J., D. Peikes, A. Zutshi, and R. Brown. "Efficient Orthogonal Designs: A Powerful Method to Study and Refine Medical Home Models." In Strategies to Ensure HITECH Supports the Patient-Centered Medical Home, edited by L. Moreno, D. Peikes, and A. Krilla. AHRQ publication no. 11-0013. Rockville, MD: Agency for Healthcare Research and Quality, forthcoming.
APPENDIX A. INTERVENTION COMPONENTS AND ROUTINE CARE AT PARTICIPATING PLANS
| TABLE A.1. Intervention Components and Routine Care at Participating Plans | |||
| Intervention Component | Component Options | Routine Care (Care Wisconsin) | Routine Care (Gateway) |
| 1. Frequency-of-routine contacts with members and frequency of medication review |
| Frequency of contact depends on risk and need. Contract dictates 1 contact per quarter. However, nearly all members are contacted every 2 months. | Although CMS only requires annual contact, care managers contact members based on clinical judgment. Members are typically contacted at least once quarterly, and the highest risk members receive contacts monthly. Prior to the start of the study, Gateway did not employ a structured process for contacting members.Some care managers conduct medication review at every contact. Some members are assigned to receive a medication review conducted by the pharmacy. |
| 2. Falls-risk screening |
| Routine care does not involve the use of a specific falls-risk screening tool. Currently, a registered nurse evaluates mobility, safety and functional status. Based on experience, care managers operate under the assumption that all members are at high-risk for falls. | Sometime before the study, Gateway used to contract an outside party to conduct falls-risk screening for members. Currently no formal assessment is used. Care managers use clinical judgment in assessing falls-risk. |
| 3. Fall prevention referral |
| Care Wisconsin implements falls prevention planning when a member falls. Care teams put together a plan, and if falls continue members are referred to Care Wisconsin's physical or occupational therapy for a more thorough assessment and plan. | Members at a risk of falls are referred to physical or occupational therapy. |
| 4. Depression screening tools |
| Care managers select from 3 screening instruments based on clinician preference for a given member: (1) Geriatric Depression Screen; (2) Beck Depression Screen; and (3) SIGECAPS. | Gateway has in-house guidelines for the kinds of questions care managers should ask. These guidelines were not empirically validated, although it was approved by behavioral health providers. |
| 5. Depression screening frequency and referral |
| Care managers conduct depression screening at least every 6 months and as-needed. If members screen positive for depression, the social worker will discuss with nurses medication possibilities and administration issues. If medication issues are complex, the nurse practitioner may refer the member to a psychiatrist. The social worker on the team provides supportive counseling to the member. If this proves too time consuming, the team will consult a practice leader in social work to discuss referring the member to an internal or external mental health counselor. | Care managers assess depression annually and as-needed based on clinical judgment. Referral for treatment is also based on clinical judgment. If a member is determined to be at risk for self-harm, then Gateway will contact an external behavioral health agency to do an evaluation. If the member needs to be admitted to a psychiatric hospital, the Community Behavioral Health Network of Pennsylvania will manage precertification, intake, discharge, and post-discharge referrals. |
| 6. Frequency of care plan review |
| Care managers review care plans every 6 months, including 1 brief review and 1 in-depth review per year. | Current practice is for care plan review to occur during every contact, and for care plans to be updated after every contact to reflect progress of care. Managers do not mail a copy of the care plan to the members. |
| 7. Coaching about health care needs |
| Care managers coach members using clinical judgment. Some care managers are trained in the teachback method. | Care managers coach members using clinical judgment. Current practice for many care managers is to use elements of teachback method, depending on the member's personality and the care manager's background. For example, care managers regularly ask questions to confirm understanding or compliance. |
| 8. Dummy component | This component addressed medication reviews and was merged with Component 1. | ||
| 9. Frequency of member contact after discharge |
| Care Wisconsin contacts members and/or caregivers within 72 hours of discharge. Care teams use clinical judgment to determine which person on the team should make the contact and if the contact should be via phone or in person. | Care managers do not contact hospitals. The Utilization Management (UM) department notifies the care manger when a member has been hospitalized. In some cases, the UM department does not receive a discharge summary from the hospital. Gateway reported that they do not have a protocol but that care managers attempt to contact members within a week post-discharge. |
| 10. Informing PCP of member discharge |
| Care Wisconsin nurse practitioners are highly integrated with members' PCPs, and as all the nurses are "advanced practice" they often undertake many activities normally performed by a PCP. Therefore, members' and care managers' involvement with PCPs varies greatly depending on the member. | Care transitions interventions are typically implemented by the UM department, which contacts PCPs. Gateway also sends a copy of the care plan to the PCP. However, hospital staff do not always contact the PCP as part of a member's stay and PCPs are often not informed of a member's discharge. |
| 11. Follow-up with member post-discharge |
| Nurse practitioners fill out a discharge summary within 48 hours post-discharge, and care managers do an informal follow-up within 72 hours using the discharge summary. The discharge summary tool is similar to that used in the study, although it includes sections based on the primary care work that nurse practitioners often engage in. | Gateway currently does not use a checklist for post-discharge follow-up. |
| NOTES: SIGECAPS is a mnemonic for symptoms of major depression and dysthymia. The first letter of the following words makes up the mnemonic: Sleep disorder, Interest deficit, Guilt, Energy deficit, Concentration deficit, Appetite disorder, Psychomotor retardation or agitation, and Suicidality. | |||
APPENDIX B. RANDOMIZATION AND INTERVENTION ASSIGNMENTS
In this study, 24 care managers were randomized to implement either Option a or b for each of ten intervention components. Care managers responsible for implementation were randomly assigned to a specific combination of options. For example, care manager number 1 was assigned the combination aabaaabbbab. The combination contains 11 letters (denoting ten options), one for each intervention component. Component 8 was a "dummy" component (one that was not specified or implemented). We were interested to see whether this "dummy" component (one that was not specified or implemented) would prove to have an impact on outcomes, where no such impact should occur. Due to the orthogonal design, inclusion of this dummy component in the analysis does not affect the estimates of impact of other components. The randomly assigned combinations of component options can be found in Table B.1. The analyses in this report took an "intent-to-treat" approach, in which component effects are computed by comparing outcomes of those assigned to the two options, regardless of whether or how thoroughly the options were actually delivered.
| TABLE B.1. Care Manager Random Assignments to Intervention Component Combinations | |||||||||||
| Assignment | 1 | 2 | 3 | 4 | 5 | 6 | 7 | 8 | 9 | 10 | 11 |
| 1 | a | a | b | a | a | a | b | b | b | a | b |
| 2 | b | a | a | b | a | a | a | b | b | b | a |
| 3 | a | b | a | a | b | a | a | a | b | b | b |
| 4 | b | a | b | a | a | b | a | a | a | b | b |
| 5 | b | b | a | b | a | a | b | a | a | a | b |
| 6 | b | b | b | a | b | a | a | b | a | a | a |
| 7 | a | b | b | b | a | b | a | a | b | a | a |
| 8 | a | a | b | b | b | a | b | a | a | b | a |
| 9 | a | a | a | b | b | b | a | b | a | a | b |
| 10 | b | a | a | a | b | b | b | a | b | a | a |
| 11 | a | b | a | a | a | b | b | b | a | b | a |
| 12 | b | b | b | b | b | b | b | b | b | b | b |
| 13 | b | b | a | b | b | b | a | a | a | b | a |
| 14 | a | b | b | a | b | b | b | a | a | a | b |
| 15 | b | a | b | b | a | b | b | b | a | a | a |
| 16 | a | b | a | b | b | a | b | b | b | a | a |
| 17 | a | a | b | a | b | b | a | b | b | b | a |
| 18 | a | a | a | b | a | b | b | a | b | b | b |
| 19 | b | a | a | a | b | a | b | b | a | b | b |
| 20 | b | b | a | a | a | b | a | b | b | a | b |
| 21 | b | b | b | a | a | a | b | a | b | b | a |
| 22 | a | b | b | b | a | a | a | b | a | b | b |
| 23 | b | a | b | b | b | a | a | a | b | a | b |
| 24 | a | a | a | a | a | a | a | a | a | a | a |
This study was designed using the Plackett-Burman 12 experimental design with a foldover. Plackett-Burman is an efficient orthogonal design, meaning the number of intervention components tested was large relative to the number of care managers. The major limitation of this design is that it is of resolution III, meaning any component's main effects are confounded with all two-component interactions that do not involve that component. For example, the main effect for Component 1 might be confounded with Components 2 and 3, Components 3 and 5, and so on. In order to mediate this problem and at the same time take advantage of the efficiency of the design, we utilized a complete foldover. This means that the assignment of component options in one half of the assignment grid was the mirror-image of assignments in the other half. The mirror-image effect can be seen in Table B.1, as assignment 13 offers the opposite options as assignment 1. The foldover design doubled the number of "runs" for each component Option and changed the design to resolution IV. As a result, confounding remained only for three-way or higher-order interactions, which are more negligible than are two-component interactions.
The proportion of all members assigned to receive the enhanced care option was close to 50 percent for each option, although some outliers existed at the plan level because randomization was not stratified by plan. For example, at Gateway, 24 percent of members were assigned to more frequent depression screening (Component 5b), 26 percent were assigned to two post-discharge follow-ups (Component 9b), and 37 percent were assigned to be screened with PHQ-9 (Component 4b). The complete breakdown can be found in Table B.2.
| TABLE B.2. Proportion of Members Assigned to Enhanced Care for Each Intervention Component(means) | |||
| Intervention Component | Both Plans | Care Wisconsin | Gateway |
| Int #1: More frequent routine contacts | 49.4 | 41.2 | 62.4 |
| Int #2: More frequent and formal falls-risk screening | 50.3 | 49.9 | 50.8 |
| Int #3: Send results of falls-risk screening to patient | 50.1 | 50.7 | 49.2 |
| Int #4: Use of longer depression screening instrument | 47.8 | 54.6 | 37.1 |
| Int #5: More frequent depression screening | 48.3 | 63.4 | 24.4 |
| Int #6: More frequent review of care plan | 50.8 | 42.7 | 63.7 |
| Int #7: Use of teachback method | 49.7 | 50.3 | 48.8 |
| Int #9: Two post-discharge follow-ups | 48.0 | 62.1 | 25.7 |
| Int #10: Inform PCP of member's discharge via phone | 50.7 | 43.8 | 61.6 |
| Int #11: Formal post-discharge follow-up | 51.0 | 43.3 | 63.0 |
| Number of Members Enrolled in the Study | 1,562 | 956 | 606 |
| NOTE: Component 8 was a "dummy" component (one that was not specified or implemented). | |||
APPENDIX C. REGRESSION ANALYSIS RESULTS
| TABLE C.1. Heckman-Hotz Analysis: Effect of Components on Baseline Outcomes | ||||
| Variables | Number of Admissions 1 Year Before Study | Number of ER Visits 1 Year Before Study | Any 30-Day Medical Readmission 1 Year Before Study | Any 30-DayReadmission 1 Year Before Study |
| Components | ||||
| Int #1: More frequent routine contacts | -0.281*** (0.002) | -0.252(0.122) | -0.004(0.911) | -0.015(0.687) |
| Int #2: More frequent falls-risk screening with an instrument | 0.052(0.529) | -0.012(0.944) | 0.016(0.668) | 0.010(0.785) |
| Int #3: Send falls-risk screening result to member | -0.151*(0.058) | -0.203(0.268) | 0.006(0.875) | 0.010(0.789) |
| Int #4: Use of longer depression screening instrument | 0.142(0.124) | -0.109(0.519) | -0.045(0.234) | -0.041(0.281) |
| Int #5: More frequent depression screening | -0.013(0.894) | -0.147(0.379) | -0.067(0.164) | -0.054(0.275) |
| Int #6: More frequent review of care plan | 0.079(0.361) | 0.259*(0.094) | 0.035(0.389) | 0.021(0.597) |
| Int #7: Use of teachback method | -0.075(0.514) | -0.006(0.965) | 0.081*(0.064) | 0.071(0.103) |
| Int #8: Dummy component | 0.026(0.790) | 0.055(0.727) | 0.110**(0.012) | 0.109**(0.020) |
| Int #9: Two post-discharge follow-ups (versus one) | 0.021(0.802) | 0.083(0.624) | -0.032(0.399) | -0.020(0.609) |
| Int #10: Inform PCP of member's discharge via phone (versus letter) | -0.033(0.692) | -0.045(0.791) | 0.0945**(0.036) | 0.082*(0.070) |
| Int #11: Post-discharge follow-up with a checklist and instrument | 0.009(0.912) | -0.035(0.830) | -0.000(0.993) | -0.000(0.996) |
| Age | ||||
| 46-64 | 0.026(0.879) | -1.546*** (0.001) | 0.193*** (0.001) | 0.217*** (0.000) |
| 65-74 | 0.071(0.705) | -1.913***(0.000) | 0.093(0.130) | 0.108*(0.085) |
| 75-84 | -0.031(0.861) | -1.585***(0.000) | 0.116*(0.084) | 0.144**(0.036) |
| Over 85 | -0.003(0.987) | -1.842***(0.000) | 0.117(0.111) | 0.144*(0.053) |
| Gender | ||||
| Male | 0.085(0.400) | -0.146(0.416) | 0.068*(0.087) | 0.053(0.187) |
| Race/Ethnicity | ||||
| African American | -0.080(0.567) | 0.712***(0.008) | -0.013(0.812) | -0.002(0.975) |
| Other or missing | -0.175(0.391) | 0.476(0.314) | -0.087(0.309) | -0.094(0.269) |
| Asian | -0.072(0.821) | 0.290(0.423) | -0.146(0.301) | -0.141(0.331) |
| Hispanic | -0.327(0.185) | -0.402(0.468) | -0.003(0.980) | 0.034(0.788) |
| Member Location | ||||
| Rural | -0.164(0.111) | -0.051(0.789) | 0.036(0.388) | 0.036(0.400) |
| Suburban | -0.089(0.627) | -0.491(0.137) | -0.055(0.292) | -0.079(0.130) |
| Missing | 0.175(0.342) | -0.065(0.812) | 0.137(0.122) | 0.154*(0.090) |
| Chronic Conditions | ||||
| Alzheimer's and related conditions | 0.095(0.546) | 0.240(0.305) | 0.007(0.910) | -0.007(0.907) |
| Cataracts | -0.361***(0.001) | -0.282(0.148) | -0.024(0.689) | -0.040(0.500) |
| Chronic kidney disease | 0.642***(0.000) | 0.442*(0.076) | 0.182***(0.001) | 0.175***(0.001) |
| COPD | 0.506***(0.001) | -0.112(0.651) | 0.020(0.661) | 0.004(0.922) |
| Depression | -0.336**(0.012) | 0.322(0.428) | -0.078(0.242) | -0.067(0.323) |
| Diabetes | 0.174*(0.079) | 0.162(0.301) | 0.059(0.147) | 0.051(0.212) |
| Glaucoma | -0.170(0.177) | -0.012(0.955) | -0.056(0.384) | -0.061(0.340) |
| Heart failure | 0.441***(0.004) | 0.319(0.124) | -0.039(0.411) | -0.043(0.366) |
| Osteoporosis | 0.244(0.157) | 0.307(0.491) | 0.072(0.272) | 0.082(0.216) |
| Rheumatoid or osteo-arthritis | -0.137(0.424) | 0.287(0.285) | -0.020(0.728) | -0.040(0.478) |
| Stroke | 0.529(0.121) | 0.904(0.181) | 0.007(0.928) | -0.016(0.823) |
| Other | 0.277(0.258) | 0.348(0.424) | 0.045(0.514) | 0.051(0.458) |
| Number of Months Enrolled in Plan During Baseline Year | ||||
| 5 months or less | 0.702***(0.002) | 1.621**(0.011) | 0.035(0.804) | 0.130(0.396) |
| Between 6 and 11 months | 0.498***(0.003) | 1.676***(0.001) | 0.033(0.668) | 0.050(0.525) |
| Mental Conditions | ||||
| Anxiety disorders | 0.629***(0.007) | 1.232**(0.012) | 0.079(0.222) | 0.089(0.182) |
| Bipolar disorder | 0.497*(0.051) | 1.804***(0.005) | -0.111*(0.083) | -0.105(0.113) |
| Conduct disorders and hyperkinetic syndrome | -0.022(0.964) | -0.821(0.455) | 0.017(0.911) | 0.358**(0.015) |
| Depressive disorders | 0.445***(0.005) | 0.371(0.470) | 0.093(0.185) | 0.093(0.197) |
| Personality disorders | 0.915(0.274) | -0.126(0.919) | -0.001(0.997) | 0.228(0.175) |
| Post-traumatic stress disorder | -0.379(0.383) | -1.727**(0.045) | 0.132(0.263) | 0.130(0.271) |
| Schizophrenia and other psychotic disorders | 0.124(0.555) | 0.700(0.194) | 0.028(0.709) | 0.086(0.286) |
| Tobacco Use | 0.327(0.103) | 1.204***(0.009) | -0.040(0.486) | -0.049(0.396) |
| Enrolled in Gateway Health Plan | 0.535**(0.030) | 0.265(0.379) | -0.123*(0.098) | -0.107(0.226) |
| Average Care Manager-Level Outcome 2 Years Before Study | 0.477(0.234) | 0.368*(0.089) | 1.552***(0.003) | 1.441***(0.005) |
| Constant | 0.144(0.664) | 1.809***(0.000) | -0.263**(0.013) | -0.259**(0.015) |
| Number of Observations | 1,562 | 1,562 | 694 | 694 |
| R-squared | 0.216 | 0.184 | 0.123 | 0.129 |
| * Significantly different from zero at the 10% level. ** Significantly different from zero at the 5% level. *** Significantly different from zero at the 1% level. | ||||
| TABLE C.2. Effects of Components on Number of Hospital Admissions, Number of ER Visits, and Likelihood of Readmission(at follow-up) | ||||
| Variables | Number of Admissions | Number of ER Visits | Any 30-Day Medical Readmission | Any 30-Day Readmission |
| Coefficient (p-value) | Coefficient (p-value) | Coefficient (p-value) | Coefficient (p-value) | |
| Components | ||||
| Int #1: More frequent routine contacts | 0.010(0.893) | -0.287**(0.030) | 0.078*(0.059) | 0.062(0.149) |
| Int #2: More frequent falls-risk screening with an instrument | -0.092(0.221) | -0.088(0.496) | 0.030(0.422) | 0.013(0.743) |
| Int #3: Send falls-risk screening result to member | -0.008(0.920) | 0.093(0.474) | -0.038(0.319) | -0.048(0.234) |
| Int #4: Use of longer depression screening instrument | -0.013(0.864) | 0.001(0.996) | 0.001(0.972) | -0.000(0.994) |
| Int #5: More frequent depression screening | 0.072(0.399) | 0.197(0.169) | 0.060(0.200) | 0.033(0.495) |
| Int #6: More frequent review of care plan | -0.005(0.943) | -0.003(0.982) | -0.070*(0.079) | -0.058(0.150) |
| Int #7: Use of teachback method | 0.020(0.812) | 0.269**(0.045) | 0.012(0.764) | -0.008(0.851) |
| Int #8: Dummy component | 0.052(0.538) | -0.262*(0.076) | 0.001(0.986) | 0.014(0.746) |
| Int #9: Two post-discharge follow-ups (versus 1) | 0.100(0.226) | -0.035(0.805) | -0.036(0.380) | -0.038(0.390) |
| Int #10: Inform PCP of member's discharge via phone (versus letter) | 0.050(0.548) | 0.093(0.514) | 0.022(0.606) | 0.028(0.524) |
| Int #11: Post-discharge follow-up with a checklist and instrument | -0.087(0.232) | -0.180(0.207) | 0.038(0.367) | 0.027(0.515) |
| Outcomes at Baseline | ||||
| Average care manager-level outcome 1 year before study | 0.027(0.926) | -0.087(0.640) | 0.757(0.214) | 0.708(0.247) |
| Member-level outcome 1 year before study | 0.020(0.589) | 0.089(0.165) | 0.063(0.494) | 0.079(0.374) |
| Member-level outcome 3 months before study | 0.340***(0.000) | 0.508***(0.001) | 0.174**(0.017) | 0.175**(0.012) |
| Age | ||||
| 46-64 | -0.061(0.696) | 0.212(0.564) | -0.037(0.571) | -0.012(0.863) |
| 65-74 | 0.067(0.675) | 0.100(0.778) | -0.018(0.808) | 0.006(0.945) |
| 75-84 | 0.129(0.461) | 0.098(0.788) | -0.017(0.831) | 0.011(0.893) |
| Over 85 | -0.052(0.783) | 0.188(0.622) | -0.030(0.734) | -0.008(0.928) |
| Gender | ||||
| Male | 0.100(0.251) | -0.050(0.746) | 0.029(0.480) | 0.046(0.288) |
| Race/Ethnicity | ||||
| African American | -0.030(0.786) | 0.279(0.265) | -0.068(0.214) | -0.047(0.427) |
| Other or missing | -0.029(0.870) | 0.137(0.740) | -0.073(0.457) | -0.071(0.494) |
| Asian | -0.152(0.359) | 0.095(0.745) | -0.293***(0.001) | -0.318***(0.000) |
| Hispanic | 0.129(0.616) | -0.142(0.768) | 0.002(0.989) | 0.080(0.578) |
| Location | ||||
| Rural | 0.023(0.796) | -0.247(0.148) | 0.020(0.668) | -0.004(0.936) |
| Suburban | 0.182(0.247) | -0.283(0.292) | 0.029(0.659) | 0.002(0.972) |
| Missing | 0.423*(0.053) | 0.903***(0.005) | 0.028(0.735) | 0.043(0.604) |
| Chronic Conditions | ||||
| Alzheimer's and related conditions | 0.031(0.781) | -0.041(0.812) | -0.105**(0.038) | -0.096*(0.067) |
| Cataracts | 0.055(0.574) | -0.006(0.968) | 0.002(0.967) | -0.021(0.699) |
| Chronic kidney disease | 0.348***(0.001) | 0.141(0.399) | 0.081*(0.066) | 0.070(0.116) |
| COPD | 0.060(0.624) | 0.037(0.863) | 0.010(0.831) | 0.002(0.971) |
| Diabetes | 0.181**(0.020) | 0.102(0.494) | 0.022(0.555) | 0.003(0.947) |
| Glaucoma | 0.164(0.203) | -0.343**(0.032) | 0.115*(0.064) | 0.121*(0.065) |
| Heart failure | 0.373***(0.001) | 0.198(0.243) | 0.067(0.154) | 0.051(0.277) |
| Osteoporosis | -0.085(0.512) | -0.116(0.622) | 0.026(0.636) | 0.031(0.590) |
| Rheumatoid or osteo-arthritis | -0.018(0.877) | 0.093(0.637) | -0.026(0.568) | -0.048(0.315) |
| Stroke | -0.370(0.117) | -0.140(0.777) | -0.078(0.307) | -0.133*(0.075) |
| Other | -0.192(0.337) | -0.055(0.842) | -0.008(0.893) | -0.030(0.615) |
| Mental Conditions | ||||
| Anxiety disorders | -0.065(0.568) | 0.203(0.382) | -0.006(0.901) | -0.009(0.859) |
| Bipolar disorder | 0.283*(0.096) | 0.226(0.491) | 0.054(0.407) | 0.037(0.588) |
| Conduct disorders and hyperkinetic syndrome | 1.010(0.245) | 0.544(0.637) | -0.222***(0.008) | -0.290***(0.008) |
| Depressive disorders | 0.089(0.298) | 0.087(0.591) | 0.004(0.926) | 0.027(0.513) |
| Personality disorders | 0.494(0.242) | 1.472*(0.091) | -0.083(0.344) | 0.099(0.348) |
| Post-traumatic stress disorder | -0.070(0.830) | 0.830(0.280) | -0.132(0.160) | -0.030(0.778) |
| Schizophrenia and other psychotic disorders | 0.185(0.286) | -0.263(0.382) | -0.027(0.659) | -0.016(0.815) |
| Tobacco Use | 0.128(0.285) | 0.194(0.411) | 0.051(0.307) | 0.061(0.250) |
| Number of Months Enrolled In Plan During Baseline Year | ||||
| 5 months or less | 0.056(0.678) | 0.147(0.558) | -0.001(0.992) | 0.008(0.910) |
| Between 6 and 11 months | -0.028(0.834) | -0.069(0.853) | 0.049(0.490) | 0.046(0.542) |
| Enrolled in Gateway Health Plan | 0.189(0.365) | 0.769***(0.005) | -0.030(0.699) | -0.024(0.782) |
| Constant | -0.038(0.897) | 0.350(0.418) | 0.075(0.495) | 0.129(0.287) |
| Number of Observations | 1,562 | 1,562 | 649 | 649 |
| R-squared | 0.287 | 0.468 | 0.135 | 0.117 |
| * Significantly different from zero at the 10% level. ** Significantly different from zero at the 5% level. *** Significantly different from zero at the 1% level. | ||||
APPENDIX D. ADDITIONAL FEEDBACK FROM CARE MANAGERS
In this section, we provide more detailed discussion of the feedback we received from care managers with regard to the implementation of each intervention component.
Implementation of intervention components and alternative options varied between care managers at the two participating plans. Gateway care managers made fewer contacts with members than the minimum required by the assigned options, whereas Care Wisconsin care managers made more contacts than the required minimum. This is not surprising because caseloads per care manager at Gateway are several times larger than those at Care Wisconsin, where teams of care managers serve members.
Care managers at Care Wisconsin who were assigned to screen their members for depression on a quarterly basis screened a greater proportion of members compared to those assigned to provide twice yearly screening. The opposite held for care managers at Gateway. Care Wisconsin care managers reviewed the care plans of approximately 22 percent of members on a quarterly basis, whereas Gateway care managers reviewed care plans of approximately 34 percent of members on a quarterly basis (Table V.3). Care managers at Care Wisconsin notified the PCP via telephone of nearly every discharged member; care managers at Gateway sent more notifications per member by letter versus telephone (Table V.2). Care Wisconsin care managers made a telephone notification of the PCP of every discharge for 30 percent of members. At Gateway, PCPs were notified by telephone for half as many discharges (Table V.3). At Care Wisconsin, twice as many members received informal post-discharge follow-up than formal follow-up with an instrument and checklist. At Gateway, the proportion of members receiving follow-up was similar between informal and formal follow-up (Table V.1).
1. Frequency-of-Routine Contacts and Medication Reviews (Component 1)
Care managers at Gateway reported that the minimum guidance for the number of contacts as part of the enhanced care option for low-risk members was insufficient for the provision of services and that they contacted most such members at least once per month instead of once every two months. However, several care managers found it difficult to maintain more frequent contact rates (enhanced care) for lower-risk members and noted that some members expressed the desire not to be contacted more than once a month. Gateway leaders remarked that participation in the study prompted the plan to consider adopting a better-defined frequency of contact as well as more structured processes for contacting members. Leaders at Care Wisconsin noted that some care managers experienced difficulty in following the frequency of contacts assigned in the study protocol because care managers tended to perceive all members as very high-risk, even though Care Wisconsin enrollees had fewer hospitalizations than Gateway enrollees.
Although care managers at Gateway believed that the minimum number of contacts assigned as part of the study was insufficient for the provision of services, they made fewer contacts than required by the assigned options. On the other hand, care managers at Care Wisconsin made more contacts than required as part of the study.
2. Falls-Risk Screening (Components 2 and 3)
Gateway Care managers reported that they found the formal falls-risk screening tool useful, even though they deemed it too long and found some screening tool questions redundant; nevertheless, they liked having a set of questions to ask. They often worked the questions into the flow of conversation such that members sometimes did not realize they were being asked questions from a formal instrument. Staff at Gateway found the letters to members burdensome to generate and did not believe the letters had a strong effect on members. Care managers at Care Wisconsin believed that the screening was redundant with services already provided at the plan.
3. Screening for Depression (Components 4 and 5)
Care Wisconsin leaders reported that care managers preferred the PHQ-9 depression screening instrument because it was shorter than the tools used at the plan before the study; similarly, nurses preferred it because community physicians were already familiar with it. Care Wisconsin will adopt PHQ-9 for depression screening in routine care. Care managers believed that PHQ-2 was not sufficiently comprehensive. In contrast, neither leaders nor care managers at Gateway expressed a preference for PHQ-2 or PHQ-9. Gateway care managers felt that depression screening was difficult and awkward for those without a background in mental health, and members sometimes experienced difficulty opening up sensitive mental health matters. Screening members with a history of mental health issues occurred more frequently regardless of assignment to enhanced or routine care. Care managers at both plans believed that the tested depression screening options enabled them to identify and refer more members to appropriate care than before the study. Care managers at both plans did not believe that sending letters with screening results to PCPs was effective.
4. Frequency of Care Plan Review (Component 6)
Gateway care managers noted that their standard process of care before the study was to conduct care plan reviews more frequently than prescribed under the enhanced care option. The enhanced care option prescribed a review every six months, whereas Gateway's care plan reviews take place every time a member is contacted as reported by care managers. Care Wisconsin care managers considered the quarterly care plan review to be burdensome and the most difficult study component to implement.
Gateway care managers assigned to a more frequent review of care plans provided fewer reviews than those assigned to routine care. It is not clear why the care plans at Care Wisconsin were reviewed more often by care managers assigned to routine care; the guidance for routine care is to review the care plans twice per year (Table A.1), whereas the enhanced care option called for quarterly reviews.
5. Method Used to Coach and Educate Members (Component 7)
Care managers and leaders at both Gateway and Care Wisconsin liked the teachback method very much. Gateway care managers, however, experienced some difficulties with the teachback method; they found that some members were unable to repeat instructions and others preferred to move on to other topics. In addition, they felt that members experienced difficulty in giving care managers their undivided attention during telephone contacts. Care managers at Care Wisconsin communicated to leaders that the teachback method improved communication with members. The leaders noted that Care Wisconsin is considering adoption of the method throughout the plan. Before the study, several care managers assigned to routine practices were trained in the teachback method (enhanced care option) and continued using it. Given that the routine coaching method for some care managers was the teachback method, such care managers recorded use of the routine method when they in fact relied on the teachback method.
6. Number of Post-Discharge Follow-Ups (Component 9)
Although they believed that post-discharge follow-up is useful, Gateway care managers found it difficult to contact members twice after discharge because post-discharge phone calls and letters were time consuming and because they were frequently unaware of members' discharge. Care managers reported that members' schedules after discharge were often busy with follow-up appointments and other care, making it difficult for care managers to reach them twice. Care Wisconsin leaders believed the additional follow-up to be useful and are considering its adoption.
7. Informing PCP of Members' Discharge (Component 10)
Gateway care managers found that PCPs had mixed reactions to follow-up efforts. Small primary care offices were more receptive than large offices to notification of members' hospital discharge. Further, care managers expressed the belief that PCPs were more likely to receive information through letters rather than via telephone. On occasion, members visited PCPs before letters to the physician were generated. Given that Care Wisconsin's advanced practice nurses provide some medical services directly to members, members' and care managers' involvement with PCPs varies greatly. Although care managers at both plans attempted to provide PCPs with notification of members' discharge, they did not believe such notification added value.
8. Formal (Versus Informal) Post-Discharge Follow-Up (Component 11)
Care managers at both Gateway and Care Wisconsin noted that the post-discharge follow-up checklist (part of the enhanced care option) provided much-needed structure to address members' needs as they transition from hospital to home. At Gateway, care managers found CTM-3 tool useful for conveying broad ideas and easy to incorporate into the flow of conversation. Care Wisconsin care managers felt that CTM-3 tool should be administered before members are discharged from the hospital rather than once they are at home. The plan has developed a care transition intervention that includes a post-discharge follow-up that uses a checklist similar to that implemented as part of the study.
NOTES
-
For the recruitment of SNPs for the study, we sought the help of Rich Bringewatt, the leader of the SNP Alliance, an organization that represents the needs and interests of SNPs and the members they serve (National Health Policy Group 2010). We are very thankful for Rich's engagement in the recruitment of the SNPs. The SNP Alliance introduced our study to plans serving dual eligibles that might be interested in participating, provided their contact information, and facilitated the communication with the leadership of the interested plans. After an in-person meeting in October 2010 and several more conversations with plan leaders, we secured a commitment to participate from three SNPs: Care Wisconsin and Gateway, the two plans described in this report, as well as Brand New Day, an SNP serving a population with SPMI, described in a separate report.
-
Unlike Gateway, Care Wisconsin did not restrict its included population in this study to the subset of patients at highest risk of hospitalization. While this results in differences between the two group, it should not bias the findings. We include in our analysis a binary control variable indicating which plan the care manager was employed by to eliminate the potential for such bias. We also control for sample members' chronic conditions and pre-enrollment hospitalization and ER use, and caregivers' pre-demonstration hospitalization rates for their caseloads in the prior period. Thus, the differences in target populations between the two plans should be adequately controlled for, as are differences in casemix across care managers within the two plans.
-
We used Plackett-Burman 12 design with a foldover. The design matrix and additional technical details are in Table C.1.
-
To simplify the language with which results are described, we refer here to members assigned to a given option. However, it was care managers--not members--who were randomized and assigned to provide a given option. A more precise interpretation would be that the difference in ER visits was found among members whose care managers were assigned a higher minimum frequency-of-routine contacts versus the minimum frequency prescribed as per routine care.
-
We computed the percentage reduction in ER visits by dividing the difference in the number of ER visits between members assigned to receive enhanced care and members assigned to receive routine care by the average number of ER visits among all members.
-
Pooling across plans for regression analysis was needed to obtain a large enough number of care managers. Regression analysis controls for the plan the observation was under.
CENTER OF EXCELLENCE IN RESEARCH ON DISABILITY SERVICES AND CARE COORDINATION AND INTEGRATION (CERDS)
REPORTS AVAILABLE
- Abstracted List of Tasks and Reports
- HTML http://aspe.hhs.gov/daltcp/reports/2014/CERDS.shtml
- PDF http://aspe.hhs.gov/daltcp/reports/2014/CERDS.pdf
--- --- --- --- ---
- Association between NCQA Patient-Centered Medical Home Recognition for Primary Care Practices and Quality of Care for Children with Disabilities and Special Health Care Needs
- HTML http://aspe.hhs.gov/daltcp/reports/2014/ChildDisV3.shtml
- PDF http://aspe.hhs.gov/daltcp/reports/2014/ChildDisV3.pdf
- Children with Disabilities and Special Health Care Needs in NCQA-Recognized Patient-Centered Medical Homes: Health Care Utilization, Provider Perspectives and Parental Expectations Executive Summary
- HTML http://aspe.hhs.gov/daltcp/reports/2014/ChildDisES.shtml
- PDF http://aspe.hhs.gov/daltcp/reports/2014/ChildDisES.pdf
- Descriptive Study of Three Disability Competent Managed Care Plans for Medicaid Enrollees
- Executive Summary http://aspe.hhs.gov/daltcp/reports/2014/3MCPlanses.shtml
- HTML http://aspe.hhs.gov/daltcp/reports/2014/3MCPlans.shtml
- PDF http://aspe.hhs.gov/daltcp/reports/2014/3MCPlans.pdf
- Effect of PACE on Costs, Nursing Home Admissions, and Mortality: 2006-2011
- Executive Summary http://aspe.hhs.gov/daltcp/reports/2014/PACEeffectes.shtml
- HTML http://aspe.hhs.gov/daltcp/reports/2014/PACEeffect.shtml
- PDF http://aspe.hhs.gov/daltcp/reports/2014/PACEeffect.pdf
- Effectiveness of Alternative Ways of Implementing Care Management Components in Medicare D-SNPs: The Brand New Day Study
- Executive Summary http://aspe.hhs.gov/daltcp/reports/2014/OrthoV2s.shtml
- HTML http://aspe.hhs.gov/daltcp/reports/2014/OrthoV2.shtml
- PDF http://aspe.hhs.gov/daltcp/reports/2014/OrthoV2.pdf
- Effectiveness of Alternative Ways of Implementing Care Management Components in Medicare D-SNPs: The Care Wisconsin and Gateway Study
- Executive Summary http://aspe.hhs.gov/daltcp/reports/2014/OrthoV1es.shtml
- HTML http://aspe.hhs.gov/daltcp/reports/2014/OrthoV1.shtml
- PDF http://aspe.hhs.gov/daltcp/reports/2014/OrthoV1.pdf
- Evaluating PACE: A Review of the Literature
- Executive Summary http://aspe.hhs.gov/daltcp/reports/2014/PACELitReves.shtml
- HTML http://aspe.hhs.gov/daltcp/reports/2014/PACELitRev.shtml
- PDF http://aspe.hhs.gov/daltcp/reports/2014/PACELitRev.pdf
- Factors Predicting Transitions from Medicare-Only to Medicare-Medicaid Enrollee Status
- HTML http://aspe.hhs.gov/daltcp/reports/2014/MMTransV2.shtml
- PDF http://aspe.hhs.gov/daltcp/reports/2014/MMTransV2.shtml
- Identifying Medicare Beneficiaries with Disabilities: Improving on Claims-Based Algorithms
- Executive Summary http://aspe.hhs.gov/daltcp/reports/2014/algorithmes.shtml
- HTML http://aspe.hhs.gov/daltcp/reports/2014/algorithm.shtml
- PDF http://aspe.hhs.gov/daltcp/reports/2014/algorithm.pdf
- Impacts of Waiting Periods for Home and Community-Based Services on Consumers and Medicaid Long-Term Care Costs in Iowa
- HTML http://aspe.hhs.gov/daltcp/reports/2014/IAWaitPd.shtml
- PDF http://aspe.hhs.gov/daltcp/reports/2014/IAWaitPd.pdf
- Integrating Physical Health Care in Behavioral Health Agencies in Rural Pennsylvania
- Executive Summary http://aspe.hhs.gov/daltcp/reports/2014/ruralPAes.shtml
- HTML http://aspe.hhs.gov/daltcp/reports/2014/ruralPA.shtml
- PDF http://aspe.hhs.gov/daltcp/reports/2014/ruralPA.pdf
- Non-Elderly Disabled Category 2 Housing Choice Voucher Program: An Implementation and Impact Analysis
- Executive Summary http://aspe.hhs.gov/daltcp/reports/2014/Cat2Housinges.shtml
- HTML http://aspe.hhs.gov/daltcp/reports/2014/Cat2Housing.shtml
- PDF http://aspe.hhs.gov/daltcp/reports/2014/Cat2Housing.pdf
- Parent Perspectives on Care Received at Patient-Centered Medical Homes for Their Children with Special Health Care Needs
- Executive Summary http://aspe.hhs.gov/daltcp/reports/2014/ChildDisV2es.shtml
- HTML http://aspe.hhs.gov/daltcp/reports/2014/ChildDisV2.shtml
- PDF http://aspe.hhs.gov/daltcp/reports/2014/ChildDisV2.pdf
- Physician Perspectives on the Influence of Medical Home Recognition on Practice Transformation and Care Quality for Children with Special Health Care Needs
- HTML http://aspe.hhs.gov/daltcp/reports/2014/ChildDisV1.shtml
- PDF http://aspe.hhs.gov/daltcp/reports/2014/ChildDisV1.pdf
- Strategies for Integrating and Coordinating Care for Behavioral Health Populations: Case Studies of Four States
- Executive Summary http://aspe.hhs.gov/daltcp/reports/2014/4CaseStudes.shtml
- HTML http://aspe.hhs.gov/daltcp/reports/2014/4CaseStud.shtml
- PDF http://aspe.hhs.gov/daltcp/reports/2014/4CaseStud.pdf
- Transitions from Medicare-Only to Medicare-Medicaid Enrollment
- HTML http://aspe.hhs.gov/daltcp/reports/2014/MMTransV1.shtml
- PDF http://aspe.hhs.gov/daltcp/reports/2014/MMTransV1.pdf
To obtain a printed copy of this report, send the full report title and your mailing information to:
U.S. Department of Health and Human ServicesOffice of Disability, Aging and Long-Term Care PolicyRoom 424E, H.H. Humphrey Building200 Independence Avenue, S.W.Washington, D.C. 20201FAX: 202-401-7733Email: webmaster.DALTCP@hhs.gov
RETURN TO:
Office of Disability, Aging and Long-Term Care Policy (DALTCP) Home [http://aspe.hhs.gov/office_specific/daltcp.cfm]Assistant Secretary for Planning and Evaluation (ASPE) Home [http://aspe.hhs.gov]U.S. Department of Health and Human Services (HHS) Home [http://www.hhs.gov]
Last Updated: 09/02/2014