
Amy Kandilov, Vincent Keyes, Noëlle Siegfried, Kevin Smith, Patrick Edwards, Jenna Brophy, Ann Larsen, and Martijn Van Hasselt
RTI International
Alisha Sanders and Robyn Stone
LeadingAge Center for Applied Research
Printer Friendly Version in PDF Format (96 PDF pages)
ABSTRACT
This evaluation report describes the implementation and impacts of a program intended to improve health status and slow the growth of health care expenditures among older adults living in affordable housing properties. The Support and Services at Home (SASH) program connects participants with community-based services and promotes coordination of health care. In July 2011, the SASH program was launched in Vermont; and by June 2015, the latest date for this analysis, the program had expanded to include 54 panels and 4,741 participants across the state who had spent at least 3 months in the program.
DISCLAIMER: The opinions and views expressed in this report are those of the authors. They do not necessarily reflect the views of the Department of Health and Human Services, the contractor or any other funding organization.
TABLE OF CONTENTS
1. INTRODUCTION
- 1.1. Support and Services at Home Program Background and Overview
- 1.2. Vermont Multi-payer Advanced Primary Care Practice Demonstration
2. METHODOLOGY
- 2.1. Qualitative Methods
- 2.2. Methodology for Beneficiary Mail Survey
- 2.3. Methodology for Medicare Claims Data Analysis
3. SUPPORT AND SERVICES AT HOME PROGRAM IMPLEMENTATION
- 3.1. Operational Successes and Challenges of Support and Services at Home
- 3.2. Support and Services at Home's Relationship with Community Partners
- 3.3. Recruitment for the Support and Services at Home Program
- 3.4. Property Management at Support and Services at Home Housing Sites
4. SUPPORT AND SERVICES AT HOME PROGRAM PARTICIPATION
- 4.1. Support and Services at Home Housing Properties
- 4.2. Site-Based Support and Services at Home Participants
- 4.3. Support and Services at Home Participants in the Community
5. SUPPORT AND SERVICES AT HOME PROGRAM OUTCOMES
- 5.1. Health Status of Support and Services at Home Participants
- 5.2. Hospital Admissions and Emergency Room Use among Support and Services at Home Participants
- 5.3. Impacts of Support and Services at Home on Medication Problems
- 5.4. Impacts of Support and Services at Home on Mini Nutritional Assessment
- 5.5. Medicare Expenditures among Support and Services at Home Participants
- 5.6. Support and Services at Home Funding Sources
- 5.7. Costs of Support and Services at Home to Participating Properties
6. CONCLUSION
LIST OF FIGURES
- FIGURE 2-1: SASH Beneficiary Survey Disposition
- FIGURE 4-1: Total SASH Participants and SASH Participants Included in the Quantitative Analysis
- FIGURE 4-2: Trends in Total Medicare Payments for Site-Based SASH Participants, Community SASH Participants, and the Community Comparison Group
- FIGURE 5-1: SASH Impacts on Health Status Measures Expressed as Standardized Effect Sizes
- FIGURE 5-2: Percentage of Respondents Who had Difficulty Performing Medication-Related Tasks
- FIGURE 5-3: Comparison of MNA Questions between SASH and Non-SASH Survey Respondents
LIST OF TABLES
- TABLE 2-1: Number of Interviews by Type for the SASH Evaluation Second Annual Site Visit
- TABLE 2-2: Number of Interviews by Panel Type for the SASH Evaluation Third Annual Site Visit
- TABLE 2-3: Number of Interviews by Role for the SASH Evaluation Third Annual Site Visit
- TABLE 2-4: Measures Included in the 2015 Beneficiary Survey of SASH Participants and Comparison Groups
- TABLE 2-5: SASH Participant Survey Disposition and Response Rates by Group
- TABLE 2-6: Demographic Characteristics of SASH and Comparison Groups
- TABLE 2-7: SASH Participant Survey Factors Affecting Response
- TABLE 2-8: Factors Distinguishing SASH and Comparison Group
- TABLE 2-9: Covariate Balance Before and After Inverse Propensity Score Weighting
- TABLE 2-10: Regression Results for Patient Self-Reported Outcomes
- TABLE 2-11: Number of Persons Starting Participation in SASH as of 2015:Q1
- TABLE 4-1: Characteristics of Properties in which Medicare FFS SASH Program Participants and Comparison Group Beneficiaries Reside
- TABLE 4-2: Average Baseline Demographic Characteristics and Health Status for SASH Medicare FFS Participants, and Unweighted and Weighted Average Demographic Characteristics and Health Status for Non-SASH Medicare FFS Beneficiaries
- TABLE 4-3: Average Baseline Demographic Characteristics and Health Status for SASH Site-Based Beneficiaries, SASH Community Beneficiaries, and Weighted Average Demographic Characteristics and Health Status for Non-SASH Community Comparison Group Beneficiaries
- TABLE 4-4: Average Quarterly Medicare Payments for Site-Based and Community SASH Participants and the Community Comparison Group
- TABLE 5-1: Average Quarterly Utilization of Services for SASH Participants and Non-SASH Comparison Beneficiaries in the Year Prior to SASH Enrollment and in up to 4 Years of SASH Participation
- TABLE 5-2: SASH Program Effect Estimates for Utilization, Comparing SASH Program Participants to Non-SASH Comparison Beneficiaries, January 2006-June 2014
- TABLE 5-3: Average Monthly Medicare Expenditures for SASH Participants and Non-SASH Comparison Beneficiaries in the Year Prior to SASH Enrollment and in up to 4 Years of SASH Participation
- TABLE 5-4: Overall DID Estimates for 8 Categories of Medicare Expenditures, Comparing SASH Program Participants to Non-SASH Comparison Beneficiaries: January 2006-June 2015
- TABLE 5-5: Yearly DID Estimates for Monthly Medicare Expenditures, Comparing SASH Program Participants to Non-SASH Comparison Beneficiaries: January 2006-June 2015
- TABLE 5-6: SASH Funding Sources in 2013 and 2016
ACRONYMS
The following acronyms are mentioned in this report.
| AAA | Area Agency on Aging |
|---|---|
| ACL | HHS Administration for Community Living |
| ACO | Accountable Care Organization |
| ADL | Activity of Daily Living |
| ASPE | HHS Office of the Assistant Secretary for Planning and Evaluation |
| BMQ | Brief Medication Questionnaire |
| CAR | LeadingAge Center for Applied Research |
| CDSMP | Chronic Disease Self-Management Program |
| CHT | Community Health Team |
| CMS | HHS Centers for Medicare & Medicaid Services |
| COA | Council on Aging |
| CSC | Cathedral Square Corporation |
| DAIL | Vermont Department of Disabilities, Aging and Independent Living |
| DID | Difference-in-Differences |
| DocSite | Vermont's central clinical registry |
| DRHO | Designated Regional Housing Organization |
| DVHA | Department of Vermont Health Access |
| EQ-5D | EuroQol Five Dimensions questionnaire |
| ER | Emergency Room |
| ESRD | End-Stage Renal Disease |
| FFS | Fee-For-Service |
| HCC | Hierarchical Conditions Category |
| HHS | U.S. Department of Health and Human Services |
| HUD | U.S. Department of Housing and Urban Development |
| LIHTC | Low Income Housing Tax Credit |
| MAPCP | Multi-payer Advanced Primary Care Practice |
| MNA | Mini Nutritional Assessment |
| MOU | Memorandum of Understanding |
| OAA | Older Americans Act |
| OLS | Ordinary Least Square |
| PBPM | Per-Beneficiary Per-Month |
| PCP | Primary Care Provider |
| PHC | Physical Health Composite measure |
| PIC | Public and Indian Housing Information Center |
| P.O. | Post Office |
| SASH | Support and Services at Home |
| SSN | Social Security Number |
| TRACS | Tenant Rental Assistance Certification System |
| USDA | U.S. Department of Agriculture |
| VNA | Visiting Nurse Association |
EXECUTIVE SUMMARY
Abstract
This evaluation report describes the implementation and impacts of a program intended to improve health status and slow the growth of health care expenditures among older adults living in affordable housing properties. The Support and Services at Home (SASH) program connects participants with community-based services and promotes coordination of health care. In July 2011, the SASH program was launched in Vermont; and by June 2015, the latest date for this analysis, the program had expanded to include 54 panels and 4,741 participants across the state who had spent at least 3 months in the program.
Our analysis combines findings from interviews with SASH staff members and key stakeholders, a survey of SASH participants, and an analysis of Medicare claims data. The SASH program faced challenges in expanding beyond the affordable housing properties and into the community. Highlighted successes included the partnerships formed with other organizations and the training program for SASH staff. Another notable success reported was the program's ability to help participants remain in their homes, in terms of both allowing participants to age in place as their health and functional needs increase and helping participants avoid eviction.
Self-reported health status and functioning were higher for SASH participants relative to the survey comparison group, and SASH participants reported fewer problems managing multiple medications. Overall, we do not find that the SASH program had a significant impact on the growth of Medicare expenditures. However, among participants enrolled in SASH panels established before April 2012 (early panels, representing 40% of SASH participants with Medicare living in affordable housing properties), growth in annual Medicare expenditures was slower by an estimated $1,227 per-beneficiary per year. These same beneficiaries in the early panels also had lower rates of hospitalization and slower rates of growth for hospital and specialty physician costs.
Introduction
In 2008, the non-profit housing provider Cathedral Square Corporation (CSC) in South Burlington, Vermont, began developing the SASH program out of concern that frail residents in its properties were not able to access or receive adequate supports to safely remain in their homes. CSC designed the SASH program to connect residents with community-based support services and promote greater coordination of health care. As part of the Multi-Payer Advanced Primary Care Practice (MAPCP) Demonstration, the SASH Teams extend the work of the Vermont Blueprint for Health's Community Health Teams and medical homes/primary care practices by providing targeted support and in-home services to participants. The SASH program was officially launched in July 2011 and expanded into other non-profit affordable housing sites and communities across the State of Vermont.
The SASH program is implemented at the panel level, and almost all of the 54 SASH panels are hosted by U.S. Department of Housing and Urban Development (HUD)-assisted or other non-profit affordable housing properties. Each SASH panel consists of up to 100 participants served by a full-time SASH coordinator and a quarter-time wellness nurse. Using evidence-based practices, key services provided by core SASH staff include comprehensive health and wellness assessments, creation of individualized care plans, on-site one-on-one nurse coaching, care coordination with medical homes/primary care practices and with hospitals, and health and wellness group programs. Local service providers build on these core tenets by offering additional community activities, health and wellness workshops, and direct services.
While SASH was originally created to help meet the needs of residents in affordable housing sites ("site-based participants"), the program is available to any Medicare beneficiary living in surrounding communities ("community participants"). SASH panels that started before April 2012 ("early panels") primarily serve residents in affordable housing sites; these are "site-based panels." As the SASH program expanded statewide, some panels based in affordable housing sites were created to serve a mixture of site-based and community participants ("mixed-panels"), and a few panels were created solely for community participants ("community panels"). "Late panels," started after April 2012, include site-based panels, mixed-panels, and community panels.
Using a mix of qualitative and quantitative methods, RTI International and the LeadingAge Center for Applied Research (LeadingAge) have been conducting an evaluation of the impact of the SASH program. The evaluation will address the core research questions of interest to the U.S. Department of Health and Human Services (HHS) and HUD: (1) "Can coordinated health and supportive services to older adults in affordable housing improve quality of life, health, and functional status?" and (2) "Are there differences in health care and housing costs for seniors who receive coordinated services in an affordable housing setting?"
Methodology
Our analysis combines findings from interviews with SASH staff members and key stakeholders, a survey of SASH participants, and an analysis of Medicare claims data. To address key evaluation questions on SASH program implementation and operation and identify successes and challenges in the statewide expansion of the program, we collected and analyzed three varieties of primary data: semi-structured, in-person interviews with SASH staff members and key stakeholders; telephone interviews with SASH staff members and key stakeholders; and a cost survey fielded to housing host organizations. The qualitative analyses of these data have been designed to illuminate the issues surrounding the SASH program start-up and continuing operations, with a particular focus on understanding points that are most relevant for program sustainability and replication, as well as helping interpret variation observed in the quantitative findings.
To determine the impact of the SASH program on self-reported physical and mental health status, problems taking multiple medications, and dietary issues, the evaluation team conducted a mail survey of SASH participants and comparison Medicare beneficiaries. We created outcome measures from the survey responses and then used regression modeling, with control variables for the demographic characteristics and with propensity-score weights, to estimate the effect of the SASH program on the five outcome measures related to health, nutrition, and medication management.
Finally, our analysis of Medicare claims data used regression methods to identify the impact of the SASH program on health care expenditure and utilization outcomes. Due to data availability, this analysis is limited to SASH properties that receive funding assistance from HUD or the Low-Income Housing Tax Credit (LIHTC) properties. This includes properties receiving assistance through HUD's multi-family programs, such as Section 202; the public housing program; and properties receiving tax credits.
The SASH intervention group consisted of Medicare fee-for-service (FFS) beneficiaries who had participated in the SASH program for at least 3 months and who lived in a non-profit affordable housing property as identified in the HUD or LIHTC data bases. As of June 2015, a total of 4,741 individuals had participated in the SASH program for at least 3 months. After applying the beneficiary and property exclusions, the sample for this analysis contained 2,682 SASH participants. The comparison group is composed of 3,591 individuals who were Medicare FFS beneficiaries who were not participating in SASH and who lived in HUD or LIHTC properties that were not hosting the SASH program.
For the Medicare expenditure outcomes, we used a linear version of a difference-in-differences model. The impact estimate is the difference between SASH program participants and the comparison group in the change in level of the Medicare expenditure outcomes between the baseline and intervention periods. For the utilization outcomes, we used a non-linear (negative binomial) version of the regression model. For negative binomial models, the coefficients are incidence rate ratios, and they are interpreted as the difference in the expected rate of events; values less than 1 indicate that the expected rate of utilization is less than that of the comparison group, and values greater than 1 indicate that the expected rate of utilization is greater than that of the comparison group.
Support and Services at Home Program Implementation
Among the operational successes of the SASH program, the development of relationships with a variety of community agencies and resources was important in order to better meet the needs of the SASH participants. CSC also succeeded in developing a comprehensive training program for the SASH program staff. Funding remained an operational challenge, both for operating SASH panels and for expanding the SASH program.
The relationships between SASH and their community partners have matured and strengthened over the course of the implementation of the SASH program, although some partners remain concerned about perceived overlap as the SASH program has expanded into the community. Interaction between the SASH Teams and the medical homes/primary care practices was greater for some panels than for others, but overall it had increased over the years.
Several SASH staff members and property managers believe that a notable success has been the program's ability to help participants remain in their homes, in terms of both allowing participants to age in place as their health and functional needs increase and helping participants avoid eviction. SASH staff are able to make sure that participants have the necessary services and resources to be safe in their apartments or uphold their tenancy obligations. Other successes of the SASH program noted by SASH staff members and property managers included the training program developed by CSC and the teamwork and communication within the networks established by the SASH staff members.
Support and Services at Home Program Participation
The SASH program sites included in this analysis are those that implemented the SASH program prior to July 2015. Designated SASH sites are non-profit affordable housing properties subsidized by HUD, the LIHTC, the U.S. Department of Agriculture Rural Development, or other State of Vermont funding sources.
The site-based SASH participants were older and in poorer health than the comparison group beneficiaries; propensity-score weighting methods were used to balance the demographic characteristics between the SASH group and the comparison group. Community participants in the SASH program have more health care needs, higher health care expenditures, and may be more difficult to serve than the site-based SASH participants.
Community participants receive the same set of services as the site-based participants. However, from the claims data analysis, community participants were found to have more health needs and higher health care expenditures compared to site-based participants. SASH staff also reported that community participants have more environmental issues with their homes compared to site-based participants, ranging from inaccessibility to severe dilapidation.
Support and Services at Home Program Outcomes
From both our interviews with SASH staff members and our analysis of the SASH participant survey, we found evidence that the SASH program had a positive impact on the health and functional status of participants. Additionally, SASH participants reported fewer issues with managing their multiple medications, which is consistent with the training that the SASH staff provided to participants on medication management, both in group programming and in one-on-one interactions. Our survey results should be interpreted with caution, because we surveyed our sample at only a single point in time and do not have information about their health status prior to the start of the SASH program.
The impact of the SASH program on the growth of Medicare expenditures varied across different panels. Site-based participants in the early panels--those launched in the first 9 months of the SASH program--experienced significantly slower growth in Medicare expenditures relative to a comparison group of similar Medicare beneficiaries; for these participants, growth in annual Medicare expenditures was slower by an estimated $1,227 per-beneficiary per year. However, for the SASH participants living in the HUD-assisted or LIHTC housing sites in the later panels, we found no evidence that Medicare cost growth was significantly slower. Consequently, across all of the SASH participants, we found no evidence that the SASH program slowed the growth of Medicare expenditures. For the participants in the early panels, we observed a shift in health care services, as they had lower rates of acute care hospitalization and slower growth in Medicare expenditures for both hospitalizations and specialist physicians following their enrollment in the SASH program.
The HHS Centers for Medicare & Medicaid Services (through the MAPCP Demonstration) was the primary funding source for the SASH program from July 2011 to December 2016; their per-beneficiary per-month payments covered the salaries of the SASH coordinators and wellness nurses. CSC was able to leverage additional funds from Medicaid and other Vermont agencies and foundations to cover the administrative costs of implementing and overseeing the SASH program statewide. Based on our survey of host properties, we also found that there were between $7,500 and $15,000 in additional costs each year for the housing properties to host an individual SASH panel.
Conclusion
The SASH program is designed to improve the continuity of care and reduce the growth of health care expenditures among a population of older adults and individuals with disabilities. The program's unique contribution is its use of coordinator and wellness nurse teams embedded in affordable housing properties as a platform to connect residents to health services and social supports. Thus far, our evaluation has identified many successes attributable to the SASH program and also challenges to consider when implementing a similar housing with services program.
Our continuing research efforts will follow the transition of the SASH program from its role in the MAPCP Demonstration to its role in Vermont's all-payer Accountable Care Organization. Having identified a group of SASH panels that has been successful in slowing the growth of health care expenditures for participants, we will focus our research efforts on which characteristics of those SASH panels are contributing to the slower growth in health care expenditures. We also plan to evaluate the impact of the SASH program on use of long-term care services and Medicaid expenditures among SASH participants.
1. INTRODUCTION
1.1. Support and Services at Home Program Background and Overview
In 2008, the non-profit housing provider Cathedral Square Corporation (CSC) in South Burlington, Vermont, began developing the Support and Services at Home (SASH) program out of concern that frail residents in its properties were not able to access or receive adequate supports to safely remain in their homes. SASH focuses on connecting residents with community-based support services and promoting greater coordination of health care. The SASH Teams extend the work of Vermont's Blueprint for Health Community Health Teams (CHTs) and primary care providers (PCPs) by providing targeted support and in-home services to participating Medicare fee-for-service (FFS) beneficiaries. Though closely associated with and partially financed by the Multi-Payer Advanced Primary Care Practice (MAPCP) Demonstration in Vermont, the SASH program is offered to all Vermont Medicare beneficiaries residing in or near housing properties that are hosting the SASH program, whether or not those beneficiaries were assigned to Blueprint for Health PCPs participating in the MAPCP Demonstration.
The SASH program is a Vermont-wide initiative coordinated at the state, regional, and local level. CSC oversees the program at the state level and is responsible for defining and implementing the programmatic elements along with coordinating program expansion and training. At the regional level, six Designated Regional Housing Organizations (DRHOs) are responsible for planning the roll-out of the SASH program across their geographic regions. The program is delivered at the community level through SASH panels, which are operated by housing host organizations.
There are more than 20 affordable housing organizations in Vermont that host the SASH program by operating one or more SASH panels in their properties.1 These hosts include a range of non-profit affordable housing properties with funding sources including the U.S. Department of Housing and Urban Development (HUD), the Low-Income Housing Tax Credit (LIHTC) program, the U.S. Department of Agriculture (USDA) Rural Development, and other sources available through the State of Vermont. Housing hosts also include a few mobile home parks. Throughout the report, we also refer to the properties hosting the SASH panels as SASH sites.
Panels are designed to serve 100 participants and have a core staff made up of a dedicated full-time SASH coordinator and a quarter-time SASH wellness nurse. The SASH program officially launched in July 2011, with the opening of the Heineberg panel in the Heineberg Senior Housing property in Burlington. Expansion of panels began immediately into other non-profit affordable housing properties throughout Vermont; however, this growth was paused in the fall of 2012 because of a funding gap. After receiving an enhanced payment from the U.S. Department of Health and Human Services (HHS) Centers for Medicare & Medicaid Services (CMS), the program was able to add more panels, and as of June 2015, the latest date for this analysis, the SASH program had 54 panels with 4,741 participants with at least 3 months in the program. At its launch, SASH focused on recruiting participants from within the SASH housing properties. Over time, however, the program began reaching out to the community and receiving referrals for individuals not residing in SASH properties. The site-based SASH panels, those that primarily serve SASH participants in the SASH properties, were joined by mixed SASH panels, which are hosted by a housing organization and have a large proportion of community participants in addition to the participants who reside in the host property. At the end of the first year of SASH, fewer than 15% of SASH participants were living in the community outside of SASH housing sites. By the program's fourth year, the number of community participants had grown, and almost 25% of participants were living in the community. While the majority of SASH panels are hosted in non-profit affordable housing properties, in a few areas, demand for the program outside of the SASH housing sites led to the creation of community panels, which were not housed in affordable housing properties but in other locations such as community centers.
SASH panels partner with local service provider organizations, such as home health agencies, councils on aging (COAs) or area agencies on aging (AAAs), and community mental health organizations, which create the SASH Team. Using evidence-based practices, key services provided by core SASH staff (coordinator and wellness nurse) include a comprehensive health and wellness assessment, creation of an individualized care plan, on-site one-on-one nurse coaching, care coordination, and health and wellness group programs. Local service providers build on these core tenets by offering additional community activities, health and wellness workshops, and direct services.
When individuals choose to participate in the SASH program, they consent to allowing the SASH staff and community partners to share information about them with each other and their health care providers. With this consent, SASH staff work with the participants' health care providers when necessary to ensure proper medication usage, successful hospital discharges, and overall coordination and continuity of care. Importantly, the SASH program provides a continuum of support and services that meets participants' needs, whether they are extremely healthy and looking for minimal supports or are very frail in need of more robust support from the full SASH Team. This ensures that the SASH program is ready to provide the help that is needed when circumstances change unexpectedly for participants. Individuals who do not consent to share their health information but live in SASH properties can still receive limited assistance from the SASH coordinator and wellness nurse and participate in SASH programming. However, without consent to share their information, staff cannot serve these individuals as intensively.2 SASH coordinators and wellness nurses are expected to communicate and meet with participating service providers on the SASH Team regularly (at least once a month) to discuss specific participant cases and group wellness approaches.
The SASH program receives financial support from a variety of sources. As the state coordinator, CSC is responsible for overseeing and securing funds for the program as a whole. At the regional level, DRHOs are encouraged to solicit additional funds from local organizations for ongoing support for their panels. CMS is the largest funding source and makes a per-beneficiary per-month (PBPM) payment to the SASH program through the MAPCP Demonstration. Other program costs are covered through a variety of sources. Medicaid is the second largest contributor, providing funds at both the federal and state levels. Other sources include the Department of Disabilities, Aging and Independent Living (DAIL), the Department of Vermont Health Access (DVHA), the Department of Health, and various foundations and grants. These sources represent the funding for the SASH program and not the actual health or long-term care services coordinated and arranged for as part of the SASH program.
The HHS Office of the Assistant Secretary for Planning and Evaluation (ASPE), HUD, and the HHS Administration for Community Living (ACL) have a strong interest in affordable housing3 models that connect low-income seniors with long-term services and supports that enable these seniors to age in an independent setting. The SASH program offers an important opportunity to evaluate the impact of connecting residents with these services on program participants and, in particular, to determine whether the program is associated with improved health outcomes.
RTI International, and its subcontractor, the LeadingAge Center for Applied Research (CAR), were contracted by ASPE/HUD/ACL to evaluate the SASH program. Through a mix of qualitative and quantitative methods, we are conducting a comprehensive evaluation of the impact of the SASH program. The evaluation will address the core research questions of interest to ASPE/HUD/ACL: (1) "Can coordinated health and supportive services to older adults in affordable housing improve quality of life, health, and functional status?"; and (2) "Are there differences in health care and housing costs for seniors who receive coordinated services in an affordable housing setting, and how does the 'package' of housing and health care services differ in a service enriched setting?"
1.2. Vermont Multi-payer Advanced Primary Care Practice Demonstration
In 2010, the State of Vermont applied to join the CMS MAPCP Demonstration. RTI is evaluating the MAPCP Demonstration for CMS, which also includes analysis for Maine, Michigan, Minnesota, New York, North Carolina, Pennsylvania, and Rhode Island. As the culmination of several years of health care reform efforts, Vermont also expanded statewide an advanced primary care practice infrastructure consisting of medical homes supported by CHTs and an integrated information technology infrastructure and payment reforms. A goal of the state's reform efforts is to strengthen coordination across the broad range of health and human services (medical and non-medical) to optimize patient experience and engagement and improve the health status of the population. As the state began preparing its MAPCP Demonstration application, CSC approached the state about incorporating the SASH program into the demonstration. The State of Vermont incorporated the SASH program into their application, recognizing that many of the state's high-cost health care users resided in affordable senior housing properties, and the SASH Team would have extensive knowledge of the residents and the elements in place to help these individuals and others better manage their health and supportive service needs. The SASH program was included in the demonstration as extenders of the CHTs.
2. METHODOLOGY
2.1. Qualitative Methods
To address key evaluation questions and complement our quantitative analyses, we conducted qualitative analyses using three methods of primary data collection: semi-structured, in-person interviews with SASH staff members and key stakeholders; telephone interviews with SASH staff members and key stakeholders; and a cost survey fielded to housing host organizations. The primary purpose of the qualitative data collection is to understand the details of SASH program implementation and operation, monitor implementation progress, and identify implementation and operational successes and challenges as the SASH program is expanded statewide and matures. The analyses of these data have been designed to help the evaluation team understand the issues surrounding the SASH program start-up and operations, with a particular focus on understanding points that are most relevant for program sustainability and replication, as well as helping interpret variation observed in the quantitative findings.
2.1.1. Methodology for Site Visit Interviews
Three annual site visits were conducted to understand the SASH program implementation and operational successes and challenges, as well as perceived impacts on program participants and SASH providers and partners. During the site visits, we conducted semi-structured interviews with key informants to investigate topics from the perspectives of those involved with the SASH program.
Key informants were selected with the goal to obtain a comprehensive perspective on the SASH program. We gathered insights and perspectives from a range of stakeholders, including SASH program staff, SASH service provider partners, physician practices and CHT staff, and state policy makers.
After the regions and stakeholder organizations were selected for each site visit, potential interviewees were identified. The majority of interviews were conducted face-to-face during each state's site visit, but some occurred over the phone before, during, or after the site visit because of scheduling conflicts.
Interview protocols were developed by RTI and LeadingAge CAR based on the focus of the particular site visit (described in detail later in this section) and were tailored to specific respondent types. Interviews were approximately 1 hour in length and were recorded to ensure notes were complete and accurate. After each site visit, RTI/LeadingAge produced a summary of findings to address key research questions and highlight any issues identified during the particular site visit.
First Annual Site Visit: Program Implementation
The first annual site visit took place over a 3-day period in February 2013. The purpose of the site visit was to understand the SASH program implementation and operation, implementation/operation successes and challenges, and perceived impacts on SASH participants, SASH providers and partners, and the state's MAPCP Demonstration primary care physician practices.
The visits were conducted by two two-person teams, and each team visited two SASH panels. The team prioritized selecting a mix of panels operating in different environments to provide insight on how the program worked in varying contexts. Several factors were considered, including the following:
-
Panel location (urban/rural, different areas of state).
-
Type of housing properties in the panel (public housing, subsidized, HUD, USDA Rural Development, LIHTC, state, mobile home park).
-
Number of housing properties that make up the panel (one property vs. multiple properties).
-
Number/proportion of community-dwelling participants (those living outside of housing properties) in the panel.
-
Years of experience of Vermont's Blueprint for Health CHT in the panel's region.
-
Interaction between the SASH Team and the CHT.
-
Composition of the SASH Team.
-
Roll-out date of the SASH panel.
The interview protocols were designed to help understand the following:
-
Facilitators and barriers to program implementation and operations.
-
Perceived impact on program participants and the property and service providers.
-
Possibilities for sustainability and replicability in other locations.
In each panel, interviews were conducted with the SASH coordinator, SASH wellness nurse, representatives from organizations participating on the SASH Team, CHT representatives, housing property managers, and the executive director of the DRHO for the region in which the panel was located.
Second Annual Site Visit: Community Stakeholders
The second annual site visit occurred over a 3-day period in March 2014. The purpose of the site visit was to learn about the collaboration between the SASH program and community organizations--including the COAs and AAAs, visiting nurse associations (VNAs), mental health agencies, and the Blueprint for Health CHTs--and to assess successes, challenges, and the perceived value of the SASH program in terms of the impact on each community organization and its clients.
Two teams of two analysts traveled to four different geographic areas of Vermont--Burlington, Rutland, St. Johnsbury, and Central Vermont--and conducted a total of 22 interviews with SASH community partners. Table 2-1 shows the number of interviews by type of organization. We interviewed executive-level and management-level staff and front-line staff (i.e., case managers and nurses) at the COAs/AAAs and VNAs to capture any differences in perspective given their varying roles and points of engagement with the SASH program. From the mental health agencies, we interviewed elder care clinicians who may be social workers, psychologists, or mental health professionals. We also interviewed CHT project managers and CHT coordinators.
| TABLE 2-1. Number of Interviews by Type for the SASH Evaluation Second Annual Site Visit | |
|---|---|
| Organization | Number of Interviewees |
| COAs/AAAs | 8 |
| VNAs | 4 |
| Mental health agencies | 4 |
| CHT staff | 6 |
| Total | 22 |
The interview protocols were designed to help understand the following:
-
Experiences with staffing multiple SASH panels.
-
Coordination and interaction with SASH interdisciplinary team members.
-
Perceived facilitation or duplication of efforts.
-
Perceived impact of SASH on the organization's ability to serve clients.
-
Perceived impact of SASH on the organization's clients.
-
Benefits or challenges to the organization for participating in the SASH program.
Third Annual Site Visit: Community Participants
The third annual site visit was conducted over a 3-day period in June 2015. The purpose of the site visit was to gain a greater understanding of who the community participants are and how the SASH program serves them. Specifically, we explored the characteristics and needs of community participants compared with those of traditional site-based participants, SASH staff interaction and engagement with community participants, and insights on the SASH program's ability to serve community participants effectively and to operate panels consisting of community participants. We also aimed to gain a better understanding about the impacts and effects of SASH on property management and participants' perceptions on the success of the SASH program.
Looking more broadly, we also aimed to learn about how SASH roles and activities of SASH staff had evolved and about how the interaction and collaboration with property managers and program partners--such as the Blueprint for Health CHTs, COAs/AAAs, and VNAs--had progressed since our last site visit. Finally, we asked about the successes, barriers, and challenges to operating the SASH program.
Two two-person teams traveled to four different geographic areas of Vermont--Burlington, Rutland, Bennington, and Brattleboro/Windsor--to meet with SASH staff and other stakeholders involved with the SASH panels. The site visit team selected a mix of the three panel types--site-based, mixed, and community--to gain insight into how the program operates across the various types of panels. Table 2-2 shows the number of panels, by type, from which we conducted interviews. A total of 21 interviews were conducted with staff who work with 13 panels.
| TABLE 2-2. Number of Interviews by Panel Type for the SASH Evaluation Third Annual Site Visit | ||
|---|---|---|
| Panel Type | Number of Panels Visited | Total SASH Panels (September 2015) |
| Site-based | 5 | 30.0 |
| Mixed | 6 | 21.5 |
| Community | 2 | 2.5 |
| Total | 13 | 54.0 |
Table 2-3 shows the number of interviews by role. Interviews were conducted with SASH coordinators, SASH wellness nurses, SASH Team leaders, DRHO representatives, and housing property managers.
| TABLE 2-3. Number of Interviews by Role for the SASH Evaluation Third Annual Site Visit | |
|---|---|
| Interviewee Role | Number of Interviewees |
| SASH coordinator | 8 |
| SASH wellness nurse | 7 |
| SASH Team leader | 2 |
| DRHO representative | 1 |
| Property manager | 3 |
| Total | 21 |
The interview protocols were designed to help understand the following:
-
How implementation of the program is proceeding and the evolution of SASH program activities.
-
Evolution in engagement across SASH staff and community partners.
-
Characteristics and needs of SASH community participants compared with those of site-based participants.
-
Types of assistance provided to SASH community participants compared with those provided to site-based participants.
-
Interaction and engagement with community participants.
-
Factors affecting the ability to serve panels.
-
Operational successes and challenges.
2.1.2. Methodology for Quarterly Conference Calls
The RTI/LeadingAge team held quarterly conference calls with SASH staff and other key stakeholders. The primary purpose of the quarterly calls was to understand the details of program implementation and operation, monitor implementation progress, and identify implementation and operational successes and challenges as the SASH program expanded statewide and matured. The quarterly calls also helped inform areas of investigation for the annual site visits.
Each call was generally organized around the following structure:
-
Update on the current status of implementation, including the number of existing panels and participants and any planned new panels.
-
Update of any significant changes, challenges, or success regarding program implementation.
-
In-depth discussion of a specific program implementation or operational element.
Calls were conducted with the appropriate SASH staff and other key stakeholders depending on the focused topic of the call. Staff included CSC SASH program staff, housing host property managers, and DRHO leadership. Calls were also held with representatives from the Blueprint for Health and DAIL. A discussion guide was created for each quarterly call and forwarded to the participants prior to the call to allow them to prepare any necessary information or data.
Topics for Quarterly Conference Calls in Year One
-
General background and organizational structure of the SASH program.
-
Funding and financing mechanisms for SASH program in the first year.
-
Start-up of new SASH panels.
-
Data collection and information technology (DocSite and clinical registry).
Topics for Quarterly Conference Calls in Year Two
-
SASH implementation update and trainings provided to the DRHOs, housing host sites, and SASH Teams.
-
Establishment of the Blueprint for Health CHTs and issues surrounding SASH's role as an extender of the CHTs.
-
DRHOs' experiences since launching the SASH program in their region.
-
Discrepancies between SASH participant lists and the individuals that are included in the data on publicly-assisted housing residents received from HUD.
Topics for Quarterly Conference Calls in Year Three
-
CSC staff perspective on community participants and community panels.
-
Effects of SASH on property management and the perceptions of property managers of the successes of the SASH program.
-
Relationship between the SASH program and DAIL and DAIL's perception of the successes and challenges of SASH.
-
Discussion with CSC about SASH panel characteristics that could enhance or impede the impact of SASH.
-
Update of funding and financing mechanisms for SASH program, looking at 2015.
2.1.3. Methodology for the SASH Panel Cost Survey
In June and July 2016, the RTI/LeadingAge team fielded a survey to understand the full costs to a housing host organization to operate a SASH panel beyond the annual $68,600 provided through the MAPCP Demonstration to support the SASH coordinator and wellness nurse. The survey asked about start-up costs in the year the panel was launched and ongoing operational costs. For ongoing costs, participants were instructed to provide the annual costs in each area for the year 2015.
The survey instrument was developed with insight from multiple sources, including:
-
The application housing hosts submitted to start a SASH panel, which details the various expenses a SASH panel may incur.
-
Input from CSC staff who operate their own SASH panels and have regular interaction with all other SASH panels around the state regarding the types of expenses that SASH panels may incur and the wording of questions to ensure understanding and consistent interpretation by survey respondents.
-
The evaluation team's observations from multiple interviews regarding SASH panel operations conducted during annual site visits and by telephone with CSC staff, DRHOs, and other stakeholders.
Housing host participants were targeted based on a mixture of the following criteria:
-
Representation from each DRHO region.
-
A mixture of panel types (site-based, community, and mixed).
-
Different types of housing hosts.
-
Urban and rural.
-
Panels including a single housing site and multiple housing sites.
The survey was sent via e-mail to nine housing host organizations requesting they complete the survey for a specific panel. The survey was limited to nine organizations to comply with the U.S. Office of Management and Budget's Paperwork Reduction Act data collection policy allowing collections with fewer than ten respondents without clearance. Survey participants were invited to join a group call hosted by the RTI/LeadingAge team to answer any questions the housing host organizations had about completing the survey. Eight housing host organizations returned a completed survey.
2.2. Methodology for Beneficiary Mail Survey
As the SASH program reached its fifth year as a part of the MAPCP Demonstration in Vermont, the evaluation team conducted a mail survey of SASH participants and comparison Medicare beneficiaries. The aim of this survey was to provide information about the impact of the SASH program on self-reported physical and mental health status, problems taking multiple medications, and dietary issues.
To address these issues of interest, our team designed a mail survey tailored to SASH participants and their peers living in affordable housing, fielded the survey, created the outcome measures from the survey responses, and then used regression modeling, with control variables for the demographic characteristics and with propensity-score weights, to estimate the effect of the SASH program on the five outcome measures. In the remainder of this section, we describe the survey content, data collection procedures, and statistical methods that were used to create and analyze five self-reported outcomes related to health, nutrition, and medication.
2.2.1. Survey Outcome Measures
We first conducted a literature search to identify brief, previously developed measures within the three domains of interest--physical health, nutrition status, and medication use (Table 2-4). Three of the survey instruments we identified measured different aspects of physical health. These were the RAND-12 Physical Health Composite (PHC) (Hays, 1998), the basic activities of daily living scale (ADLs) (Katz et al., 1963), and the EuroQol five dimensions (EQ-5D) questionnaire (Dolan, 1997). The PHC measures overall physical function; items include activity limitations (such as the ability to climb stairs), accomplishing less than desired, pain interference in work, and health self-perception. A higher PHC score is an indication of better physical function. ADLs measure a beneficiary's ability to perform six basic ADLs: bathing, dressing, eating, getting in or out of chairs, walking, and using the toilet. A higher ADL count indicates a greater number of activities that the survey respondent needs assistance with or is unable to do. The EQ-5D is a measure of health preference utility that consists of four physical functioning items (mobility, self-care, ability to perform usual activities, pain or discomfort) and one mental health item (anxiety/depression). We used Shaw et al.'s (2005) D1 valuation model for the United States to generate the EQ-5D scores. A higher score on the EQ-5D scale (from zero to 1) indicates better overall health status.
| TABLE 2-4. Measures Included in the 2015 Beneficiary Survey of SASH Participants and Comparison Groups | ||
|---|---|---|
| Measure Name | Description | Number of Items |
| Physical Health Composite (PHC) | Physical functioning | 6 |
| Activities of Daily Living (ADLs) | Count of daily activities beneficiary needs assistance with or is unable to do | 6 |
| EuroQol Five Dimensions (EQ-5D) | Health utility (zero=death; 1=perfect health) | 5 |
| Mini Nutritional Assessment (MNA) | Dietary nutrition status scale | 8 |
| Brief Medication Questionnaire (BMQ) | Problems with prescription medications | 5 |
We also selected two widely used and validated scales to measure SASH program effects on medication management and nutrition problems. The Mini Nutritional Assessment (MNA) measures a beneficiary's overall nutrition status based on dietary consumption (Guigoz, 2006). MNA survey questions ask about the number of full meals a beneficiary eats per day, whether they have experienced a loss of appetite, the types of food consumed, fluid intake, and whether they require assistance to eat. A higher MNA score indicates better self-reported nutrition.
The Brief Medication Questionnaire (BMQ) measures how much difficulty beneficiaries have with common medication management tasks (Svarstad et al., 1999). BMQ items asked survey respondents how difficult it was to open or close the medication bottle, read the print on the bottle, remember to take all the pills, get refills in time, and take multiple pills at the same time. A higher BMQ score indicates a higher level of difficulty performing medication management tasks.
2.2.2. Beneficiary Characteristics
We collected several additional beneficiary-level measures to use in our analyses. From the beneficiary survey, we collected demographic and background characteristics, as well as information on how often the respondent visits their provider, and whether someone helped the respondent complete the survey. Using data obtained from HUD, we created a series of indicators that identified whether a beneficiary was included in one of HUD's programs, including the 2012/2013 PIC, 2012/2013 TRACS, and 2012 LIHTC, or was not in any of these programs.4 We used this information in our statistical analyses to control for potential differences between beneficiaries selected from different HUD data bases. Using Medicare claims, we collected data on beneficiaries' Medicare expenditures, original reason for Medicare qualification (disability), Medicaid status, Hierarchical Condition Category (HCC) risk score, and Charlson comorbidity index score. These two measures of health status--the HCC risk score and the Charlson score--are created using diagnosis codes on claims in the baseline year (before the start of the SASH program). The HCC risk score is interpreted as the predicted health care costs relative to the average Medicare FFS beneficiary. An HCC risk score of 1.09 means that the predicted health care costs of that group are 9% more than the average. The Charlson comorbidity index is a mortality predictor that sums across a list of 18 chronic conditions, each of which receives a score between 1 and 6, depending on the probability of mortality. A higher average Charlson score indicates the presence of more chronic conditions. These measures were added to the self-reported items from the survey to create a merged analysis file.
2.2.3. Survey Design
The SASH beneficiary survey was used to collect information on health, nutrition, and medication outcomes directly from SASH participants and comparison beneficiaries. Our objective was to use brief, standardized scales with demonstrated reliability and validity in older adults. To assess the impacts of the SASH program on health outcomes, the survey consisted of items that could be aggregated into measures of five aspects of health: physical and mental health, functional status, health preference utility, medication problems, and dietary problems. An additional section included background characteristics. The survey consisted of 39 questions and was expected to take no longer than 20 minutes per respondent to complete.
The target population for the survey was Medicare beneficiaries participating in the SASH demonstration. The effect of the SASH program was estimated by contrasting the results for SASH participants with the results for a comparison group. The comparison group was drawn from Medicare beneficiaries receiving housing assistance from HUD or living in LIHTC properties in Vermont and northeastern New York. In Vermont, the comparison group beneficiaries were located in non-SASH housing properties and were assigned to practices participating in the MAPCP Demonstration. In New York, the comparison group beneficiaries were simply recipients of HUD housing assistance and were assigned to non-medical home practices identified from part of the MAPCP comparison group. The study was originally designed to have two comparison groups, distinguishing the Vermont from New York beneficiaries; however, because of the smaller-than-anticipated response rates for the comparison groups, we combined them into a single comparison group.
The survey sample size was derived from our goal to detect SASH program effect sizes of 0.35 or greater (0.35 standard deviations of the outcome measure) when contrasting SASH participants and comparisons. Applying statistical power analysis, a sample of 129 completed surveys was required in each group to detect effects of this magnitude (power=0.80, alpha=0.05, two-sided test). A sample of the same size of SASH non-participants in Vermont and comparison beneficiaries in New York was also collected. We had anticipated a survey response rate of 58% on the basis of prior experience with Medicare beneficiaries. From the sample frame for each group, we randomly selected 129/0.58=223 beneficiaries per group. Therefore, the size of the total sample was 669 beneficiaries, split evenly across the three types of respondents (Vermont SASH participants, Vermont non-SASH Medicare beneficiaries, New York non-MAPCP Medicare beneficiaries).
We used SASH program participant files from CSC to identify Medicare beneficiaries for our treatment group. HUD data bases, including PIC, TRACS, and LIHTC, were used to verify beneficiaries who were living in HUD-assisted or LIHTC housing for SASH participants and for those in the comparison group. Linking HUD information to data from the Medicare enrollment data base, we created a data file containing contact information on all eligible Medicare beneficiaries, stratified by group (SASH, Vermont non-SASH, New York non-MAPCP), and randomly selected 223 beneficiaries from each group.
2.2.4. Survey Administration
We surveyed beneficiaries by mail via FedEx, with reminder letters and telephone calls to non-respondents. We used a multiple-mode, multiple-contact approach incorporating suggestions from Jenkins and Dillman's (1997) best mail survey practices guidelines that had proven very successful on prior surveys conducted with the Medicare population. We distributed the survey in English, and developed separate cover letters for each mailing. The first letter contained required elements of informed consent and a toll-free telephone number that participants could call if they had any questions. The reminder letter was sent 2 weeks later to non-respondents. Cover letters were printed on letterhead and signed by RTI's project director to enhance the survey's legitimacy. Participation in the survey was voluntary, and no incentives or remuneration was provided to sample members. The data collection period ended approximately 4 weeks after the second mailing. Surveys were collected from June 15, 2015, through August 31, 2015.
2.2.5. Survey Response Rates
Our sample frame consisted of 669 total Medicare beneficiaries in both the SASH and comparison groups. Figure 2-1 shows the dispositions for the entire sample. We were unable to deliver surveys to 42 participants because of inaccurate mailing addresses. Undeliverable surveys, surveys sent to individuals who were physically or mentally incapable of responding, and surveys sent to those who were deceased were classified as ineligible. The eligible sample size was 571 Medicare beneficiaries. Of the surveys successfully delivered to eligible participants, 78 individuals could not be located for follow-up, follow-up time expired for 186, and nine individuals refused to participate. A total of 298 completed surveys were received.
| FIGURE 2-1. SASH Beneficiary Survey Disposition |
|---|
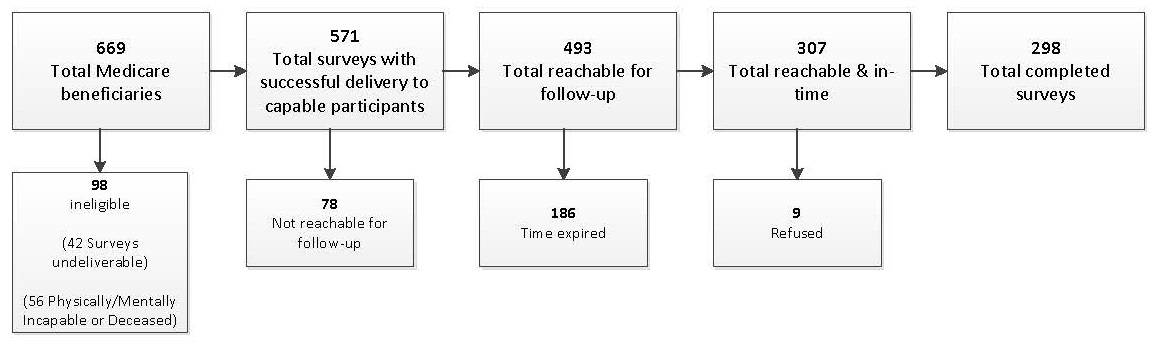 |
Our expected survey response rate was 58% based on prior surveys of Medicare beneficiaries. The SASH treatment group surpassed our expected response rate with 135 completed surveys (65% of eligible beneficiaries); however, the Vermont comparison group had 85 completed surveys (44% of eligible beneficiaries) and the New York comparison group had 78 completed surveys (46% of eligible beneficiaries). There were 298 total completed surveys, which represents an overall survey response rate of about 52% of eligible Medicare beneficiaries. Table 2-5 shows the survey disposition and response rates by group.
| TABLE 2-5. SASH Participant Survey Disposition and Response Rates by Group | ||||
|---|---|---|---|---|
| Disposition | SASH | Vermont Non-SASH | New York | Total |
| Contacted | 223 | 223 | 223 | 669 |
| Total eligible | 208 | 195 | 168 | 571 |
| Not locatable | 21 | 34 | 23 | 78 |
| Time expired | 49 | 71 | 66 | 186 |
| Refused | 3 | 5 | 1 | 9 |
| Completed | 135 | 85 | 78 | 298 |
| Response rate | 65% | 44% | 46% | 52% |
Table 2-6 shows the demographic characteristics of the SASH and comparison groups. The SASH sample was older than both comparison groups, with over half of those in the SASH sample older than 75 years of age. About four out of five respondents who were in the SASH sample were female, which is somewhat higher than the proportion of comparison groups' respondents who were female. Just over half of SASH respondents were receiving Medicaid, 1% were non-White, and 36% had originally qualified for Medicare because of a disability. The Vermont non-SASH and the New York comparison groups were very similar to each other across all demographic characteristics, other than race. Over 40% of the comparison group respondents were under 65 years of age, compared to just 16% among the SASH sample. Less than three-quarters of comparison group respondents were female, while more than three-quarters of comparison group respondents were receiving Medicaid. Medicare beneficiaries who were originally eligible for Medicare because of disability made up a larger portion of the comparison group than of the SASH sample. The only demographic characteristic that distinguished the Vermont and New York comparison groups was that a greater proportion of New York respondents were non-White. Because of the great degree of similarity between the two comparison groups, and the smaller-than-anticipated response rate for both, we chose to combine the Vermont non-SASH and New York respondents into a single comparison group for the outcome analysis. All remaining tables in this section combine these two comparison groups.
| TABLE 2-6. Demographic Characteristics of SASH and Comparison Groups | |||
|---|---|---|---|
| Characteristic | Percent | ||
| SASH | Vermont Non-SASH | New York | |
| Age less than 65 years | 16 | 43 | 42 |
| Age 65-74 | 28 | 23 | 20 |
| Age 75-84 | 37 | 17 | 21 |
| Age 85 or older | 19 | 16 | 17 |
| Female | 80 | 73 | 68 |
| Medicaid eligible | 56 | 85 | 76 |
| Non-White | 1 | 4 | 14 |
| Originally qualified for Medicare because of disability | 36 | 64 | 59 |
We conducted a detailed analysis of the response rates for eligible beneficiaries using logistic regression to examine the probability that an eligible beneficiary completed the survey. The purpose of this analysis was to determine whether survey participation was influenced by intervention status or other demographic or health characteristics of the beneficiary. Variables in the response propensity model included being a SASH participant, living in the State of New York, being in HUD data bases, gender, age group, type of mailing address (P.O. Box only or in care of another individual or facility), Medicaid eligible, and HCC risk score. Risk scores were measured in the year prior to the beginning of the SASH program in July 2011. Table 2-7 shows the logistic regression coefficient estimates for these characteristics.
| TABLE 2-7. SASH Participant Survey Factors Affecting Response | ||
|---|---|---|
| Explanatory Variable | Coefficient | Standard Error |
| SASH | 0.61* | 0.24 |
| New York | 0.03 | 0.23 |
| PIC data base--public housing | 0.10 | 0.27 |
| PIC data base--vouchers | -0.13 | 0.24 |
| LIHTC data base | -0.59 | 0.34 |
| Not in HUD data base | 0.03 | 0.52 |
| Female | -0.39 | 0.22 |
| Age 65-74 | 0.47 | 0.25 |
| Age 75-84 | 0.74* | 0.26 |
| Age 85 or older | 0.95* | 0.31 |
| In care of mailing address | -1.75* | 0.37 |
| P.O. Box only | 0.40 | 0.32 |
| Medicaid eligible | 0.02 | 0.21 |
| HCC score | -0.09 | 0.08 |
| Constant | 0.05 | 0.36 |
| * p0.05. Omitted housing category is TRACS data base; omitted age category is age less than 65 years. | ||
The response propensity results point to three factors that significantly influenced survey response rates. First, surveys were much less likely to be completed if the mailing address was an "in care of" address, which may indicate that the beneficiary's mail is being handled by someone else or that the beneficiary has moved to another facility. These beneficiaries may no longer be living in HUD-assisted or LIHTC housing. However, "in care of" addresses were found for only 11% of the eligible sample. Second, beneficiaries aged 65 years or older were much more likely to respond than younger Medicare beneficiaries (who were eligible for Medicare on the basis of disability) Finally, SASH beneficiaries were more likely to return surveys than comparison group members. The SASH effect remains even after adjustment for the other characteristics such as age group differences. Older beneficiaries are much more common in the SASH group than among comparison groups. Neither HCC risk scores nor the types of HUD assistance affected response patterns.
2.2.6. Treatment Group Propensity Analyses and Weighting
Because beneficiaries were not randomly assigned to the groups, we closely monitored any differences between the treatment (SASH) and comparison group because of concerns that these differences might bias estimates of SASH effects on outcomes. The first step in this process was to conduct another logistic regression analysis. This analysis used the same characteristics as the response propensity model but was based only on survey completers and the outcome changed to the probability that a respondent was a SASH participant rather than a comparison group member. Of 298 survey respondents, 135 (45.3%) were SASH participants.
A propensity-score is the predicted probability that a beneficiary is a member of the treatment group conditional on a set of observed variables. Estimates for the treatment group propensity model are shown in Table 2-8. Statistically significant coefficients indicate important distinctions in the composition of the groups.
| TABLE 2-8. Factors Distinguishing SASH and Comparison Group | ||
|---|---|---|
| Explanatory Variable | Coefficient | Standard Error |
| PIC data base--public housing | 0.06 | 0.34 |
| PIC data base--vouchers | -1.71* | 0.36 |
| LIHTC data base | -0.13 | 0.51 |
| Female | 0.25 | 0.34 |
| Age 65-74 | 1.15* | 0.41 |
| Age 75-84 | 1.03* | 0.40 |
| Age 85 or older | 0.58 | 0.43 |
| In care of mailing address | 0.85 | 0.81 |
| P.O. Box only | -1.20* | 0.55 |
| Medicaid eligible | -0.73* | 0.29 |
| HCC score | 0.26 | 0.17 |
| Constant | -0.39 | 0.50 |
| * p0.05. Omitted housing category is TRACS data base; omitted age category is age less than 65 years. | ||
The estimates underscore a sharp age group difference, with SASH beneficiaries far more likely to be in the three oldest age categories. There were two large effects arising from address source. Compared to comparison beneficiaries, SASH participants were much less likely to be receiving housing choice vouchers and less likely to have an address consisting only of a P.O. Box number. Neither of these characteristics, however, were the same as the address quality variables that affected overall survey response (see Table 2-7). Finally, there were significantly fewer Medicaid dual-eligible beneficiaries in the SASH group.
Propensity-scores can also be used to ameliorate group disparities; this is achieved by weighting data by the inverse of each comparison beneficiary's estimated propensity-score. The inverse propensity treatment weight is PS/(1-PS), where PS is a beneficiary's predicted propensity-score. It is helpful to examine the comparability or "balance" of the groups before and after weighting. If the groups are balanced, then the mean values for any variable should be nearly the same in the treatment and comparison groups. The magnitude of the difference between the groups can be expressed in the form of a standardized difference (the treatment mean score minus the comparison mean divided by the pooled standard deviation of the measure). The impact of propensity-score weighting can be discerned by contrasting standardized group differences for the same variables before and after weighting. An informal guideline is that standardized differences should have absolute values of 0.10 or lower when groups are well matched.
In covariate balance Table 2-9, columns 2-4 show the unweighted SASH mean, the unweighted comparison group mean, and the unweighted standardized difference for all the variables in the propensity model. The largest standardized differences--for vouchers, beneficiaries in the 75-84 age group, and Medicaid status--are consistent with the multivariate effects from the propensity model.
Columns 5 and 6 show the impact of applying the inverse propensity weights. The weighted comparison group means in column 5 have all shifted closer to the SASH means in column 2, leaving Medicaid status as the only variable with a weighted standardized difference slightly above the 0.10 threshold, despite the fact that weighting reduced the prevalence of this variable among comparisons from 76% to 45%. These results suggest that propensity-score weighting is helping improve the comparability of the groups.
2.2.7. Multivariate Analysis of SASH Effects on Self-Reported Outcomes
The final step in our analysis was to evaluate the impact of the SASH program on each of the self-reported domains in our survey. Since all five outcomes are continuous measures, SASH effects were estimated using ordinary least squares (OLS) regressions. The SASH indicator in each model estimates the impact of SASH on that outcome. The models control for the same set of address source, demographic, and Medicare-related variables that appeared in our propensity models above. In addition, given the evidence regarding improved group comparability presented in the previous section, inverse propensity-score weights were applied to the comparison group to reduce bias and further refine the model estimates. The complete set of SASH and covariate effects are summarized in Table 2-10.
| TABLE 2-9. Covariate Balance Before and After Inverse Propensity Score Weighting | |||||
|---|---|---|---|---|---|
| Variable | SASH Mean | Unweighted Comparison Group Mean | Unweighted Standardized Group Difference | Weighted Comparison Group Mean | Weighted Standardized Group Difference |
| PIC data base--public housing | 0.259 | 0.184 | 0.181 | 0.292 | -0.073 |
| PIC data base--vouchers | 0.111 | 0.472 | -0.863 | 0.094 | 0.057 |
| LIHTC data base | 0.104 | 0.055 | 0.179 | 0.090 | 0.048 |
| Female | 0.800 | 0.712 | 0.206 | 0.807 | -0.017 |
| Age 65-74 | 0.252 | 0.202 | 0.118 | 0.261 | -0.020 |
| Age 75-84 | 0.385 | 0.202 | 0.408 | 0.393 | -0.016 |
| Age 85 or older | 0.215 | 0.172 | 0.109 | 0.200 | 0.036 |
| In care of address | 0.030 | 0.043 | -0.071 | 0.041 | -0.063 |
| P.O. Box only | 0.052 | 0.129 | -0.270 | 0.049 | 0.011 |
| Medicaid eligible | 0.511 | 0.761 | -0.535 | 0.453 | 0.116 |
| HCC score | 1.222 | 1.096 | 0.151 | 1.316 | -0.100 |
The first three outcomes measure somewhat different aspects of physical functioning. Of these, a significant SASH effect was found for the PHC composite, but not for the other two measures. This may have occurred because the six-item PHC is a more comprehensive measure of functioning. ADLs are a simple count of basic activities that focus on more extreme forms of disability. It is not clear why the impact was not larger for the EQ-5D scale, which consists largely of physical health items. There was no SASH effect on nutrition status as measured by the MNA. However, SASH participants had significantly lower adjusted scores (by 0.63 points) on the BMQ, indicating that they experienced fewer problems with their medications than comparison group members.
While our focus has been on SASH effects, the regression results also provide further information about the selected outcomes. First, for three outcomes, the scores reported by beneficiaries 65 and older represent better health status than those reported by younger beneficiaries. Since there are major age-related differences between the SASH and comparison groups, this underscores the importance of adjusting for age group in these analyses. Second, even though they were measured in 2011, HCC risk scores continued to be associated with the three physical function measures at the time of the survey in 2015. Third, on the BMQ, women reported significantly fewer problems with their medications than did men. Finally, with a few exceptions, mailing address-related variables did not strongly influence the outcomes. Although we found several address-based group differences in the propensity models, it does not appear that these variables will distort our estimation of SASH effects.
| TABLE 2-10. Regression Results for Patient Self-Reported Outcomes | |||||
|---|---|---|---|---|---|
| Covariate | PHC | ADL | EQ-5D | MNA | BMQ |
| SASH | 3.17* (1.48) | -0.11 (0.23) | 0.02 (0.03) | -0.07 (0.21) | -0.63* (0.22) |
| PIC data base--public housing | -2.07 (1.82) | -0.15 (0.28) | -0.01 (0.03) | -0.35 (0.29) | -0.28 (0.30) |
| PIC data base--vouchers | -0.48 (1.77) | 0.24 (0.34) | 0.01 (0.04) | -0.48 (0.32) | -0.39 (0.29) |
| LIHTC data base | 0.74 (3.18) | -0.45 (0.38) | 0.05 (0.05) | -0.22 (0.40) | -0.63* (0.28) |
| Female | 0.52 (1.79) | -0.27 (0.35) | -0.02 (0.04) | 0.42 (0.27) | -0.86* (0.31) |
| Age 65-74 | 6.38* (1.97) | -0.33 (0.38) | 0.09* (0.04) | 0.81* (0.32) | 0.28 (0.39) |
| Age 75-84 | 7.04* (1.81) | -0.51 (0.36) | 0.14* (0.04) | 1.07* (0.34) | -0.33 (0.38) |
| Age 85 or older | 5.95* (1.83) | -0.08 (0.41) | 0.17* (0.04) | 0.81* (0.36) | 0.35 (0.45) |
| In care of address | 9.70* (2.40) | 0.29 (0.73) | 0.07 (0.06) | 1.43* (0.42) | -0.79 (0.91) |
| P.O. Box only | 2.50 (3.69) | -0.56 (0.53) | 0.09 (0.06) | 0.40 (0.40) | -0.34 (0.45) |
| Medicaid eligible | 1.66 (1.54) | -0.29 (0.26) | 0.03 (0.03) | -0.07 (0.23) | 0.08 (0.25) |
| HCC score | -2.53* (1.01) | 0.71* (0.22) | -0.08* (0.03) | -0.04 (0.14) | 0.01 (0.12) |
| Constant | 28.75* (2.86) | 1.62* (0.53) | 0.65* (0.05) | 5.56* (0.49) | 3.04* (0.47) |
| Model R2 | 0.170 | 0.200 | 0.214 | 0.135 | 0.118 |
| Mean | 33.7 | 1.70 | 0.678 | 6.30 | 1.97 |
| SD | 11.2 | 1.76 | 0.210 | 1.64 | 2.03 |
| * p0.05. Omitted housing category is TRACS data base; omitted age category is age less than 65 years. | |||||
One limitation of our analysis is that this was a one-time cross-sectional survey conducted several years after SASH had begun. As a result, we do not know whether the SASH and comparison groups were equivalent on these outcomes at the time SASH started. We did, however, extract earlier Medicare claims data to construct an HCC risk score (a measure of expected health care expenditures) for 2011 and used that measure in our propensity-score to achieve better balance between the SASH and comparison groups. The large differences in demographic characteristics between the SASH participants and the comparison group, especially the greater proportion of comparison beneficiaries who were first eligible for Medicare because of disability and the greater proportion of comparison beneficiaries who were dually eligible for Medicare and Medicaid, is also a limitation in this analysis, though our propensity-score methodology greatly improves the balance in covariates between the SASH group and the comparison group.
2.3. Methodology for Medicare Claims Data Analysis
Our analysis of Medicare claims data seeks to determine the impact of the SASH program on health care expenditure and utilization outcomes using regression methods. This section details the quantitative data and models used for this analysis.
For the Medicare expenditure outcomes, we use a linear version of a difference-in-differences (DID) model. In this case, the impact estimate is the difference between SASH program participants and the comparison group in the change in level of the Medicare expenditure outcomes between the baseline and intervention periods. As such, we will refer to this estimate as a DID estimate, which can be considered the average program effect across the entire period of SASH participation through June 2015. A negative DID estimate indicates that, between the baseline and intervention periods, average Medicare expenditure outcomes among SASH program participants either increased by a smaller amount or decreased by a larger amount, relative to the comparison group. Thus, negative DID estimates are indications that the SASH program was successful in reducing the trends in expenditures among intervention beneficiaries, relative to the comparison group. Positive DID estimates reflect that average Medicare expenditure outcomes among SASH program participants either increased by a larger amount or decreased by a smaller amount, relative to the comparison group.
For the utilization outcomes, we use a non-linear (negative binomial) version of the regression model. For negative binomial models, the coefficients are incidence rate ratios, and they are interpreted as the difference in the expected rate of events; values less than 1 indicate that the expected rate of utilization is less than that of the comparison group, and values greater than 1 indicate that the expected rate of utilization is greater than that of the comparison group. For example, if a certain group's incidence rate ratio is 0.5, the group is said to have an expected rate of utilization that is half that of the comparison group. An incidence rate ratio of 2 would indicate a rate in the treatment group that is twice that of the comparison group.
As of June 2015, there were 4,741 persons who had participated in SASH for at least one-quarter.5 RTI receives personal information--Social Security number (SSN), first and last name, date of birth--for these participants from CSC, the non-profit organization that developed and administers the SASH program. The participants' personal identifiers are cross-referenced with Vermont Medicare enrollment records for FFS beneficiaries alive as of July 1, 2011 (the official start of the SASH program). Of those 4,741 participants, 3,812 were positively identified as FFS Medicare recipients. That subset was further cross-referenced with HUD housing assistance data bases to determine if the participant was living in a HUD-assisted or LIHTC housing site. Only SASH participants found using both of these data sources (Medicare enrollment and HUD housing data bases) are included in this analysis resulting in a net sample of 2,682 SASH participants.
Medicare enrollment records are cross-referenced against the list of SASH participants using SSN,6 first and last name, and date of birth. Allowances for non-exact matches were made when an exact match occurred on three of the four items and the last unmatched item was of sufficient proximity (e.g., "William" to "Bill"; 01/01/1930 to 01/11/1930). All Medicare FFS beneficiaries alive as of July 1, 2011, who were not identified as SASH participants were retained as potential comparison group beneficiaries.
In addition to cross-referencing SASH participants with Medicare claims data, we also tried to identify participants in HUD housing records from 2012 to 2015 in order to verify their residence in affordable housing sites (either HUD-assisted or LIHTC properties). The housing records come from three separate HUD data bases. TRACS is the data base for all properties in programs run by HUD's Office of Multifamily Housing (Section 202, Section 236, Section 8, etc.); PIC is the data base for public housing and housing choice vouchers; and the LIHTC data base is the data base for low-income housing developed through tax credits. At the time of this report, RTI had acquired TRACs and PIC records for Vermont from 2012 to 2015 and LIHTC records from 2012 to 2014.
All housing records from the three data bases were retained except for PIC records designated as recipients of housing choice vouchers. Voucher records were removed before cross-referencing as they cannot be easily linked to specific properties by themselves, and they could indicate persons living in the community. Voucher recipients who were identified in HUD-assisted or LIHTC properties were kept in the sample. Duplicated persons within a data base (i.e., persons found in multiple years) were consolidated with the most recent record for each person being retained. Duplicated persons across data bases were also consolidated with a single record retained based on the following hierarchy: TRACs, PIC (if not TRACs), and finally LIHTC (if not TRACs or PIC). Therefore, persons represented in this analysis as "LIHTC only" were in fact persons we could only locate among LIHTC records.
To ensure confidentiality and adherence to set guidelines for our use of personally identifiable information, RTI established data use agreements with our data sources, including CMS and HUD. These agreements ensured RTI's compliance with privacy rules and proper storage of data files. Only authorized research staff were able to access the data within RTI's secure server, and all staff signed a code of conduct and completed training on data security. Strict electronic safeguards, such as password policies and security patches, have been in place throughout the duration of the project, and all data will be destroyed upon expiration of the data use agreement at the end of the project.
In this report, we estimate the effect of the SASH program on Medicare expenditures and health care utilization for SASH participants who are Medicare FFS beneficiaries living in HUD-assisted or LIHTC housing sites, relative to a comparison group of Vermont Medicare FFS beneficiaries living in HUD-assisted or LIHTC housing sites. The analysis of Medicare claims data is limited to SASH participants who are living in HUD-assisted or LIHTC housing and who are found in the HUD data bases described in Section 2.3.1. Note that all residents of LIHTC properties (as identified in the LIHTC data base) are eligible for inclusion in the sample, whether or not they receive rental assistance. Note also that voucher recipients are excluded from the analysis, unless they were identified as residents of a HUD-assisted or LIHTC property.
The potential comparison group included Medicare FFS beneficiaries alive as of July 1, 2011, who were not identified as participants in the SASH program. These beneficiaries were then cross-referenced with HUD housing records to identify those living in HUD-assisted or LIHTC housing. Potential comparison beneficiaries living in HUD-assisted or LIHTC housing and linked to properties where SASH participants composed more than 25% of the property's residents were excluded from the analysis. This was done to prevent any possible SASH spillover effects from contaminating the comparison group. We used property and development identification variables found in the HUD data bases to make this exclusion.
In addition to the full group of SASH participants, the report also examines subsets of participants associated with panels in an "early" cohort, as well as participants associated with site-based panels. The early cohort of panels was defined as those where SASH services were rolled out before April 1, 2012. The 13 panels in this early cohort represent roughly 40% of the 49 panels with known participants as of March 31, 2015. A site-based panel is defined as one where the majority of participants reside in designated SASH properties. Other panels are mixed-panels, defined as those where a greater proportion of participants reside in the community instead of in HUD-assisted or LIHTC housing properties that are hosting the SASH program. For each cohort analysis, the comparison group remains the same because non-SASH beneficiaries cannot be stratified by SASH panel characteristics.
2.3.3. SASH Participation Start Date
This report looks at SASH participants with a participation date prior to April 1, 2015. Participation in the program occurred on a rolling basis starting in the third calendar quarter of 2011. Not until the first quarter of 2013 were more than half of the current participants known to be receiving SASH services. All participants are viewed as participating in all quarters after their start date except when CSC was able to provide notification of their cessation of the program. Table 2-11 presents the number of participants starting in each calendar quarter up to March 31, 2015.
| TABLE 2-11. Number of Persons Starting Participation in SASH as of 2015:Q1 | |||||
|---|---|---|---|---|---|
| Period | Total | Early Cohort | Later Cohort | Site-Based | Mixed |
| 2011:Q3 | 26 | 26 | --- | 26 | --- |
| 2011:Q4 | 75 | 75 | --- | 70 | 5 |
| 2012:Q1 | 202 | 202 | --- | 169 | 33 |
| 2012:Q2 | 270 | 135 | 135 | 232 | 38 |
| 2012:Q3 | 299 | 43 | 256 | 180 | 119 |
| 2012:Q4 | 158 | 68 | 90 | 120 | 38 |
| 2013:Q1 | 448 | 275 | 173 | 391 | 57 |
| 2013:Q2 | 196 | 39 | 157 | 136 | 60 |
| 2013:Q3 | 136 | 29 | 107 | 79 | 57 |
| 2013:Q4 | 165 | 39 | 126 | 105 | 60 |
| 2014:Q1 | 159 | 29 | 130 | 105 | 54 |
| 2014:Q2 | 185 | 28 | 157 | 116 | 69 |
| 2014:Q3 | 145 | 23 | 122 | 94 | 51 |
| 2014:Q4 | 81 | 18 | 63 | 56 | 25 |
| 2015:Q1 | 137 | 20 | 117 | 89 | 48 |
| Total | 2,682 | 1,049 | 1,633 | 1,968 | 714 |
Comparison group beneficiaries described in Section 2.3.2 receive a person-level weight based on propensity-score matching methods. The propensity-score is the probability of participating in the SASH program conditional on various observed beneficiary characteristics. Propensity-scores are estimated using logistic regression where SASH participation is the dependent variable and beneficiary characteristics are independent variables. Comparison group beneficiaries whose propensity-scores are close to those of SASH participants are more similar to the treatment group across these characteristics.
In each of the two comparison groups, SASH participants are matched to up to five comparison beneficiaries whose propensity-scores were closest to that of the participant, while also falling no more +0.02/-0.02 units from the participant's score. The matching algorithm utilizes replacement, and as such, comparison group beneficiaries may be matched to more than one SASH participant if other suitable matches are lacking. Comparison group beneficiaries are assigned a weight that is a function of the number of times they were used to match to SASH participants.7 Persons in the comparison group who fail to match to any SASH participants are dropped from the analysis. SASH participants are given a weight of 1.
The purpose of matching treatment and comparison beneficiaries using propensity-scores is to increase the comparability of the two groups in terms of the characteristics included in the model. As such, it reduces the confounding bias that can result from using a non-randomized control group with group means that vary substantially. In this analysis, covariates used in the propensity-score model include the following characteristics: (dichotomous indicators) female, non-White, originally eligible for Medicare because of disability, Medicaid dual-eligible and end-stage renal disease (ESRD); (continuous) age, HCC risk score, Charlson score, household income and household size. An additional indicator for "LIHTC Only" was also included in the model to control for other differences in demographic characteristics between PIC/TRACs residents and LIHTC residents.8
In addition to the weight derived from propensity-score matching, the second component of a person's analytic weight was their quarterly eligibility fraction. A beneficiary's quarterly eligibility was measured as the fraction of days (out of 90) they met the following criteria: (1) they were a Medicare FFS beneficiary with Medicare as the primary payer; (2) they were attributed to a practice in the MAPCP Demonstration or comparison groups; and (3) they resided in Vermont. This quarterly eligibility fraction was multiplied by the matched propensity-score weight (equal to one for the treatment group) to create the final analytic weight used in the analysis contained in this report.
2.3.5. Cohorts
SASH enrollment took place on a rolling basis with the vast majority of participants starting to receive services after the official start of SASH in July 2011, with over half of participants in our sample enrolling in or after the first quarter of 2013. To account for this rolling entry, we separated SASH participants into cohorts based on the calendar quarter when they started receiving services. Because we use participants who enrolled in SASH on or before March 31, 2015, this gives us 15 cohorts of SASH participants--one cohort for each of the quarters from July 1, 2011, through March 31, 2015.
To mimic rolling entry among the comparison group, control beneficiaries were artificially assigned to similar quarterly cohorts based on their theoretical ability to have received SASH services in that quarter. For a given quarter, a comparison beneficiary is assigned to that quarter's cohort only if they are alive and Medicare-eligible at that point in time. Unlike in the treatment group where cohorts are based off enrollment and are mutually exclusive, comparison beneficiaries can be assigned to multiple cohorts based on their longevity and continued Medicare eligibility. This is necessary to mimic the trajectory of the treatment group whose staggered enrollment guarantees a certain longevity after the official start of the program.
Table 5-1 and Table 5-3 show pre-weighted and post-weighted averages of medical expenditure and utilization outcomes for SASH participants and comparison beneficiaries. Weights are equal to the product of a beneficiary's eligibility fraction and their frequency weight established from propensity-score matching. The frequency weight for SASH participants is by default equal to 1, which reduces to simply the eligibility fraction.
The pre-period and post-period in Table 5-1 and Table 5-3 represent quarters before and after a beneficiary's enrollment in the SASH program. The pre-period represents the four quarters immediately preceding enrollment, while the post comprises the (up to) 16 quarters after enrollment. In the tables, both the pre-period and post-period are stratified into annual sections.
It is important to note that because of staggered enrollment, the calendar quarters for the pre-enrollment and post-enrollment periods are not uniform across participants. Also, while all participants possess four quarterly observations prior to their enrollment, the number of post-enrollment quarters they possess is dictated by their enrollment date and the latest dates of our Medicare claims data. Currently, our claims data extends to the second quarter of 2015, allowing for a maximum of 16 quarterly observations post-enrollment.
Comparison beneficiaries do not possess an enrollment date. Instead, their pre-period and post-period are based off the enrollment dates of the SASH cohorts to which they were artificially assigned. Because comparison beneficiaries are not assigned exclusively to a single cohort, this means that comparison beneficiaries can be included more than once in the period averages. Observations for duplicated beneficiaries are still unique, however, as they represent different windows of calendar time based off the cohort's start date.
This analysis uses the following DID model to estimate the impact of the SASH program on PBPM Medicare expenditures and quarterly counts of utilization.
| Yit | = | α0 + αt + αp + β1Xit + β2Blueprinti + β3MAPCPi + β4Attit + γ1Cohort1i + γ2Cohort2i... γCCohortCi + β5SASHi + β6Demoit + εit | (2.1) |
In the above equation, i is an index for the beneficiary and t the quarterly period. The dependent variable, Yit, denotes the outcome for the ith beneficiary in quarter t. α0 is a general model-level intercept included for estimation purposes. αt(t=1,2,...T) are quarterly fixed effects that control for average trends in outcomes across time for all beneficiaries. αp (p=1,2,...P) are property fixed effects that control for variation in outcomes across housing properties. Both αt and αp are estimated by including indicator variables in the model for each quarter and each property. Beneficiary-level controls (e.g., age, gender, etc.) are denoted by Xit and εit is a model error term.
In the First and Second Annual Reports of the SASH Evaluation, the sample of SASH participants was limited to those who were attributed to primary care practices participating in the MAPCP Demonstration. For this report, we were able to obtain health care expenditure and utilization data for all Vermont Medicare FFS beneficiaries. Because being attributed to an MAPCP practice could affect health care utilization and expenditures, and because both treatment and comparison beneficiaries could be attributed to MAPCP practices, we include an indicator variable MAPCPi that is equal to 1 if the beneficiary was ever attributed to a primary care practice participating in Vermont's MAPCP Demonstration. Some of these primary care practices were a part of Vermont's pilot program, Blueprint for Health, before the start of the MAPCP Demonstration. As these pilot practices have been acting as medical homes even before the start of the MAPCP Demonstration and may be more effective at coordinating care and reducing the growth of Medicare expenditures, we also include an indicator Blueprinti for beneficiaries whose more recent primary care practice participated in the Blueprint for Health prior to the MAPCP Demonstration. Both of these variables are equal to either zero or 1 in all time periods and are included in the model to differentiate beneficiaries who may have had differing quality of care based on their providers. The variable Attit (=0,1) is an indicator that equals 1 starting in the quarter when a beneficiary was first attributed to a practice participating in the MAPCP Demonstration. MAPCPi, Blueprinti, and Attit are independent of SASH participation (and often unknown to the participant themselves) but are controlled for in our analysis because of their potential correlation with expenditures and utilization. Indicators for the SASH and comparison group cohorts are represented by the variables Cohort1, Cohort2... CohortC, where C equals the total number of cohorts in the analysis to date.
Finally, the variable SASHi (=0,1) is an indicator for SASH participants and is equal to 1 in all time periods for persons who received SASH services. The variable Demoit denotes quarters after participants started receiving SASH services, and its coefficient (β6) is the estimate of the change in outcomes correlated with SASH participation. This coefficient is interpreted as the difference between SASH and comparison beneficiaries with respect to their average change in outcomes between pre-period and post-period. A negative value corresponds to a slower rate of change in outcomes among SASH participants relative to comparison beneficiaries. This could occur in one of the following ways:
-
Average outcomes increased among comparison beneficiaries and decreased among SASH participants.
-
Average outcomes increased among both groups but at a slower rate among SASH participants.
-
Average outcomes decreased among both groups but at a faster rate among SASH participants.
Conversely, a positive value corresponds to faster rate of change in outcomes among SASH participants relative to comparison beneficiaries. This could occur in one of three ways:
-
Average outcomes increased among SASH participants and decreased among comparison beneficiaries.
-
Average outcomes increased among both groups but at a slower rate among comparison beneficiaries.
-
Average outcomes decreased among both groups but at a faster rate among comparison beneficiaries.
For all expenditure outcomes we estimate linear regressions using OLS. This is less appropriate for the utilization outcomes, however, which are count variables. For these outcomes, we estimate a negative binomial model instead. The interpretation of coefficients in the negative binomial models differ slightly from the interpretation of OLS coefficients. For negative binomial models, the coefficients are incidence rate ratios and are interpreted as the difference in the expected rate of events. If a certain group's incidence rate ratio is 0.5, the group is said to have an expected rate of utilization that is half that of the comparison group. An incidence rate ratio of 2 indicates a rate in the treatment group that is twice that of the comparison group. Following our DID interpretation, utilization effects are interpreted as the pre/post change in utilization rates among treatment beneficiaries expressed as a multiple of the rate change observed among comparison beneficiaries.
3. SUPPORT AND SERVICES AT HOME PROGRAM IMPLEMENTATION
3.1. Operational Successes and Challenges of Support and Services at Home
What are the operational challenges and successes of setting up the SASH program and what are the operational challenges to statewide expansion?
3.1.1. Operational Successes
Part of our evaluation of the SASH program focused on the successes of implementing the program from an operational perspective. One success was the establishment of relationships among different community organizations, which in turn helped connect participants to a variety of needed services and resources. The SASH program created formal linkages between the SASH staff and dedicated staff from community service organizations, including the local VNA agencies, COAs or AAAs, and the mental health agency. Given the fact that some residents were receiving Medicaid waiver-funded case management and home care/personal care services through either the VNAs or AAAs (the latter also provided other Older Americans Act [OAA]-funded services), coordination with these organizations was essential to optimize appropriate and efficient service delivery and to minimize redundancy. SASH staff also formed relationships with CHTs, PCPs, and local hospital(s) serving their communities. Despite this success, there were challenges building these relationships, which is discussed in Section 3.2, as relationships with community partners in some areas of the state are still evolving.
| From our interviews with stakeholders, the most noted successes of the SASH program included the creation of linkages between participants and vital resources in the community and the implementation of a comprehensive training program for SASH staff. |
Another success was that property managers felt the SASH program allowed them to better focus on their primary function of overseeing property operations and maintenance. This was because they did not have to spend time answering health-related questions, which they did not feel equipped to respond to, or deal with the ramifications of unaddressed health needs. Establishing the team of the SASH coordinator, wellness nurse, and community service providers afforded more resources and enabled better coordination of care for SASH program participants. SASH activities helped foster a better community within the property, and, by addressing unmet needs among aging residents (e.g., falls prevention), the financial risk to their portfolios, such as property legal liabilities, were reduced. See Section 3.4 for more details about the impact of SASH on the participating properties.
The development of an extensive training program to support SASH staff in fulfilling their roles was also an operational success. As the statewide administrator, CSC, provides an 8-week training program for new staff, as well as ongoing training for existing SASH staff. Training covers two main areas: (1) skills-building, such as motivational interviewing and end-of-life planning; and (2) leading self-care management programs for participants, such as a Chronic Disease Self-Management Program (CDSMP) or nutrition and tobacco-cessation counseling. CSC staff continue to refine the training modules as they identify gaps. For example, modules focused on leadership and becoming a meeting facilitator were added to help SASH coordinators with no previous experience working with a housing organization become leaders of the SASH Team. CSC also hosts monthly phone call/webinar meetings with SASH coordinators and wellness nurses to keep them up to date and to allow for peer-to-peer education. Feedback is also solicited from SASH coordinators and wellness nurses on training they recommend as beneficial.
The overall program infrastructure that CSC built was also an operational success. Although each DRHO and local panel have to build a relationship with their specific community partner organizations, CSC laid the ground work at the state level for the community partners to be part of the model. Each SASH panel did not have to separately educate their community partners and convince them to participate in the program. They also developed a large suite of tools and resources the housing hosts would need to build and operate their SASH panel so that housing hosts did not have to spend time and resources creating their own materials. Among other materials, this package included a program manual that detailed various operational procedures, SASH coordinator and wellness nurse job descriptions, templates for memoranda of understanding (MOU) with community partners, enrollment and consent forms for program participants, a resident assessment tool, a care planning tool and process, and a participant newsletter and other communication templates.
3.1.2. Operational Challenges
Despite the successful roll-out of the SASH program across housing properties in Vermont, a number of operational challenges existed. The rural nature of the state presents logistical challenges, with large geographic distances existing between properties or between properties and community residents. Poor cellular service made connection to the central data collection platform difficult. Limited public transportation for SASH participants made it challenging for participants to get to SASH-related appointments or activities.
A second challenge noted frequently among interviewees was the limited funding for the SASH program. Interviewees repeatedly identified the small amount of time allocated for wellness nurses as a primary constraint to program success. Wellness nurses work quarter-time (10 hours per week) for each full panel, which limits the amount of time they can spend with SASH participants, especially conducting one-on-one in home visits with the community participants. Many believe that the wellness nurse is the most valuable aspect of the program and could make a larger impact on participants if more funding was available to increase their weekly hours. Funding limitations also presented challenges for providing relevant programs for SASH participants and reimbursing for mileage for SASH staff to visit community participants.
Building the working relationship between SASH Teams and community partners was another challenge. Initially, a primary concern among the COAs/AAAs and VNAs was that the SASH program duplicated services their organizations already provided. In most areas, time and exposure helped ease tension between the partners as they gained a better understanding of each other's roles and capabilities. Although the organizations seem to have gained a much better understanding of ways to work together, some underlying tensions remain, particularly at the executive and administrative levels of the community partner organizations. See Section 3.2 for more detailed findings on the relationships between SASH Teams and the community partners.
A challenge identified early on in the evaluation was with data sharing between SASH Teams and the PCPs. SASH collects assessment data using DocSite, Vermont's central clinical registry, and uses it as their sole data platform for tracking and monitoring participants' health. The hope was for SASH and the primary care practices to share information about SASH participants using DocSite to provide more coordinated care and help participants achieve the goals set forth in their healthy living plans. Having the ability to check participants' clinical data would also help nurses to provide better self-management tools and coaching and would ensure visits were conducted efficiently.
The interoperability never came to full fruition, however, for a number of reasons including a lack of widespread adoption of DocSite by practices; a consent process that required the participant to consent to the electronic sharing of data from each of their providers as well as from SASH; a lack of confidence in the data that was in DocSite from the primary care practices; and a shut-down of DocSite for 2 months in 2013 while it connected with the state's multi-payer claims data base and health information exchange. These challenges diminished the full potential for communication between SASH Teams and the PCPs.
Another operational challenge was the adjustment of new staff who had not worked in the housing environment before to the SASH coordinator and wellness nurse roles. These staff had to learn how subsidized properties operate, and what can and cannot be required of residents under property and fair housing rules and regulations. For example, staff had to understand that residents cannot be required to utilize any services and can only be held accountable to the tenancy requirements in their lease. New staff who had previously been in direct service roles also had to adjust to the focus on the SASH staff roles, which is to educate, advise, and help coordinate services rather than provide direct care.
Initially, there was some confusion and overlap between the roles of CSC as the statewide program administrator and the roles of the DRHOs as regional administrators. Because both entities had a role in supporting the launch and operation of the SASH panels there was some uncertainty about which entity was responsible for which function. CSC and the DRHOs revised the MOU between the two organizations to further clarify roles and functions.
One other operational challenge identified was that establishing a new panel is a very involved process. Despite CSC laying the ground work at the state level for the community partners to be part of the model and developing all the necessary materials and templates, it still takes considerable time and effort. The amount of time it takes to establish a new panel depends on the relationship between the DRHO and the community organizations. It can be a lengthier process to develop the necessary agreements in a new area than in areas with existing SASH panels (and thus, existing DRHOs), where the process is simpler and often involves only an amendment to an existing agreement.
3.1.3. Operational Challenges with Expanding SASH Statewide
SASH's statewide expansion, while highlighted by CSC as one of the major successes of the program, was met with some challenges. SASH originally planned to launch 40 panels by the original end date for the 3-year MAPCP Demonstration.9 In July 2011, the SASH program was officially launched with the opening of the Heineberg panel. Expansion of panels began immediately into other non-profit affordable housing properties throughout Vermont; however, this expansion was paused in the fall of 2012 because of a funding gap, which occurred because fewer than anticipated Medicare FFS beneficiaries were attributed to PCPs participating in the MAPCP Demonstration. After receiving an enhanced payment from CMS, expansion resumed. Though they were able to overcome this hurdle, CSC felt that the freeze in expansion greatly hindered the program's momentum and reduced the amount of time CSC could plan for further expansion with the housing hosts because of the funding uncertainty.
The training infrastructure was challenged by funding limitations as the number of SASH panels and staff grew. CSC is unable to increase the size of its training and technical assistance staff and cannot provide the same level of attention to new panels and staff as it did when the program was smaller. The program also does not have the funding to pay for travel expenses to bring staff from around the state to centralized training events. To help overcome this, CSC provides virtual trainings and tries to collaborate with agencies across the state that offer applicable trainings to leverage other resources and bring trainings as close to SASH staff as possible.
Maintaining relationships with community partners is the cornerstone of the SASH program. These relationships can become strained, however, when new panels are added to the workload of the community partners. For the community partners serving more than one SASH panel, this increases the number of team meetings the community partners have to attend. Community partners are concerned this adds to an already large workload and takes time away from direct client care. In some areas, SASH panels attempted to decrease this time burden by having monthly rather than bi-monthly team meetings or by designating an administrative-level person to attend team meetings rather than a direct service provider.
3.1.4. Summary of Operational Successes and Challenges
Among the operational successes of the SASH program, the development of linkages with a variety of community agencies and resources was important in order to better meet the needs of the SASH participants. CSC also succeeded in developing a comprehensive training program for the SASH program staff. Funding remained an operational challenge, both for operating SASH panels and for expanding the SASH program. Continued funding for the SASH program through Vermont's all-payer accountable care organization (ACO) may help to alleviate some concerns about SASH funding.10
3.2. Support and Services at Home's Relationship with Community Partners
How have relationships evolved between the SASH program and community partners? What are the benefits of the SASH program in terms of the impact on the community organizations and the clients they serve? Have relationships between properties and service providers changed as a result of the SASH program? Have relationships between long-term services and supports providers and health providers changed as a result of the SASH program?
3.2.1. Evolution of the SASH Program's Relationship with Community Partners
The SASH program launched with some of the COAs/AAAs and VNAs feeling concerned that their long-term history and experience providing Medicaid waiver-funded and OAA-funded services in their community were not appropriately acknowledged and considered in the creation of the CHTs and the inclusion of the SASH program in the Blueprint for Health. In light of the fact that Vermont Medicaid funds for home and community-based services are limited, these SASH community partners were particularly frustrated that new housing-based service coordinator entities were created rather than just expanding their existing capacity to deliver services to housing residents by funding them directly.
Two years into the implementation of the program, however, relationships between SASH and the COAs/AAAs and VNAs had matured and strengthened. There was widespread agreement among organizations that a common pathway of working together was needed in order to best serve Vermonters, which was not something organizations agreed upon a year into implementation (2013). Time and exposure helped ease the tension between SASH and the community partners as they gained a better understanding of each other's capabilities. However, some panels continued to have difficulty working with the community partners in their area who perceived the SASH program to be duplicating their efforts.
In particular, COAs/AAAs and VNAs believed SASH's extension into the community (beyond the housing host sites) to be a duplication of their roles because they already serve individuals in the community and provide services similar to what SASH has to offer. The community partners felt that their experience working in the community made them the best suited to work with community participants and did not understand why a housing-based organization should be involved beyond the walls of SASH properties.
Community partners also expressed concern about the ability of the SASH program to adequately serve the community and the impact on the SASH program of stretching its resources so thin. The community partners believed that the SASH program does not have the capacity (time and resources) to expand into the community. This is particularly true for the wellness nurses who have very limited hours (10 hours per panel/per week) to provide services to clients. Serving individuals in the community requires driving time, particularly in rural communities, so more time is needed overall. The SASH Teams for community panels are not given additional resources to account for the driving time to meet with participants.
The relationships between the CHTs and the SASH Teams matured and strengthened over the course of our evaluation. The two teams better understand their individual roles and the ways they can work together. They have adapted the partnership processes on the basis of their unique organizational and regional circumstances. The teams appear to be collaborating around clients and leveraging each other's skills and expertise in various ways. For example, the teams are collaborating on delivery of the Healthier Living Workshops (Vermont's name for the CDSMP), a core component of the state's Blueprint for Health initiative.
Interaction between the SASH Teams and the medical homes/primary care practices was greater for some panels than for others but appeared to be increasing by the second year of implementation. Some of the SASH Teams reported direct engagement with the medical homes/primary care practices and noted that providers began to routinely make referrals to SASH. Others noted that they were making strides, but more outreach efforts were needed to solidify the relationship.
3.2.2. Benefits of the SASH Program to Community Partners and Their Clients
Despite concern over duplication and role confusion, several community partners reported benefits of the SASH program, either for themselves or their clients. COA case managers noted they find that SASH complements the services they provide to their clients and fills a gap in care, rather than duplicating the case manager's efforts. Even though there are a lot of community resources available, the population in need of these resources is too large for any one organization to serve effectively. The SASH program is able to provide flexible services to a broad range of people in a way that the COAs/AAAs and VNAs are unable to because of their program restrictions. Under Medicare's home health program, for example, the VNA is only able to serve individuals eligible for home health services and is only able to provide reimbursable services for a specified length of time.
The elder care clinicians appear to be highly collaborative partners on the SASH Team and recognize several benefits that the SASH program offers to them and to their clients. For example, they appreciate being able to call on the SASH coordinators and wellness nurses to assist them with their clients, because the elder care clinicians typically have large caseloads and limited resources. They do not perceive any duplication or overlap between their work and the SASH program. Elder care clinicians leverage the resources of the SASH program and vice versa. To some extent this perspective may be because of the clinicians' more independent role--elder care clinicians are located either at the local mental health agency or at the COA/AAA offices--and that they have autonomy when it comes to collaborating with other organizations. With their mental health backgrounds, elder care clinicians also have very clear skills and roles that the SASH staff are not necessarily able to duplicate.
Clients participating in SASH may receive services more quickly. If a COA/AAA case manager cannot see a client or cannot make a call right away to arrange a service, the SASH coordinator can assist in his or her place. The SASH coordinator will also alert case managers if a client needs assistance immediately, which is beneficial because the case manager learns of situations earlier and can respond before those situations escalate. Further, the needs of clients in SASH may be fully understood more comprehensively and more quickly. It takes time to completely understand the needs of a complex client. With the SASH coordinator and wellness nurse on-site and regularly checking on the client, multiple people are looking at the client and seeing different issues that might otherwise take a long time to uncover.
The SASH program helps to decrease community partner workloads because of the team approach to brainstorming solutions. SASH staff can also do some of the tasks that the COAs/AAAs previously did for clients in the SASH housing properties, allowing them to focus on more complex clients. Community partners, specifically COAs, appreciate having the SASH coordinators at the housing properties to serve as another set of eyes and ears and to alert them more quickly to issues and crises that arise. SASH's expansion into the community can be seen as an advantage to the community partners because it could result in referrals of individuals who were not aware of the services available from the VNA or the COA/AAA.
3.2.3. Impacts of the SASH Program on Relationships Between Service Providers and Health Providers
A focus of the SASH program is building relationships and greater collaboration across community organizations, which in turn can help connect SASH participants to a variety of needed services and resources. As the SASH program matured, some community partners developed relationships with other community organizations and learned about new resources that are available for their clients. In one region, SASH helped the community partners strengthen their relationship with the hospital and the CHT because of the SASH Team's well-established relationship with both entities. Communication between community organizations also improved because the SASH Team meetings brought people together face-to-face and created a sense of being a part of a team.
3.3. Recruitment for the Support and Services at Home Program
How were residents in assisted properties identified as potentially eligible for the SASH program? How were individuals in the community identified? What were the processes for outreach, enrollment, and assessment of SASH participants?
3.3.1. Identification of Eligible Residents
SASH program participation is open to any resident living in a housing property included in the SASH program or any Medicare beneficiary living in the surrounding community, regardless of income. Outreach efforts consisted of disseminating information about the SASH program in the following ways:
-
SASH coordinators and property managers using word of mouth to inform their residents.
-
Informational events held in housing properties and senior centers.
-
Articles published in the local paper.
-
Promoting the program on the local community access channel.
-
Referrals made by health care providers, community partners, hospitals, and CHTs.
At its launch, SASH focused on recruiting participants from within the SASH housing properties. As participation in the housing properties grew, SASH staff began to expand outreach into the community. Referrals and interest from potential community participants increased, as general awareness of SASH grew. In some areas, panels expanded from a half to a full panel, or a new half or full panel was added to accommodate the growing community participant interest. Two-and-a-half panels were created to serve community participants only. These panels were developed after housing host organizations began to receive referrals or calls from interested participants living in areas where there were no housing properties eligible to host a SASH panel. At the end of the first year of SASH, fewer than 15% of SASH participants were living in the community outside of housing sites. By the program's fourth year, the number of community participants had grown significantly, and about one-quarter of participants were living in the community.11
3.3.2. Enrollment and Assessment
After identifying individuals interested in the SASH program, a formal enrollment and assessment is conducted. When enrolling in the SASH program, an individual first signs an Authorization for Use and Disclosure Agreement, which authorizes the SASH staff and team members to receive and share information about the participant's health. With this consent, SASH staff work with the participant's health care providers, when necessary, to ensure proper medication usage, successful hospital discharges, and overall coordination and continuity of care. As mentioned in Section 1.1, individuals who live in SASH properties but do not consent can still receive assistance from the SASH coordinator and wellness nurse and participate in SASH programming. However, staff can only provide limited support to these individuals.
Next, participants receive a comprehensive assessment conducted by the SASH wellness nurse and SASH coordinator. The assessment collects information on health conditions, medications, care providers, history of falls, fall risk, emergency room (ER) visits, hospitalizations, nursing home stays, functional abilities, mental health, nutritional and cognitive status, and support services currently used or needed. A social isolation scale and substance abuse module were added after the initial program launch. These assessments take approximately 45-90 minutes to conduct.
SASH coordinators then complete an interview with each individual. The interview was designed to understand the participant in a more holistic manner and asks about the person's life milestones, personal interests and goals, significant events and relationships, daily routine, and existing social support network.
From the assessment and interview, SASH staff develop a healthy living plan with the individual and the SASH Team--together with the resident and relevant community partners--to help implement and monitor each resident's plan. Results from the individual assessments are also aggregated across the SASH panel and a community healthy living plan is developed for that panel. The SASH coordinator, with input from the SASH nurse, then identifies evidenced-based programming to help address group needs and issues that have emerged across the panel.
The information gathered through the assessment and the individual's healthy living plan is maintained in an electronic data base, previously called DocSite.12 The SASH coordinator and wellness nurse can use this data base to track and monitor how they address resident needs and fulfill the goals in the healthy living plan. SASH staff can also run reports on their overall panel to identify common needs, and check on progress that is being made toward addressing those needs. At the state level, CSC also runs reports to help track progress made by panels and highlight problem areas at the community level to help the SASH staff identify possible group wellness activities.
3.3.3. Barriers
Several barriers to recruiting new participants were raised by SASH staff across the panels visited. Interviewees cited the following reasons as to why some individuals were apprehensive about joining:
-
Some residents are nervous about sharing their health information with their housing property for fear it could be used against them and ultimately could be used as grounds for eviction.
-
Some participants mentioned not wanting to sign up for yet another program because they have given out their private information multiple times.
-
One service provider felt that some individuals might feel that the SASH program is just government intrusion. Similarly, a SASH coordinator at a different panel explained that their population has a conservative streak in them, which means that they tend to ideologically look down on subsidized housing and government-funded programs.
In the initial recruiting stage, wellness nurses reported that the enrollment and assessment process dominated their already-limited time. SASH staff have developed efficiencies and made process changes in conducting the assessments, such as using laptop computers with portable Wi-Fi in the communities so that assessment information can be entered directly into the data base. Some COA/AAA and VNA representatives believed the SASH participant assessment to be too invasive and/or too long and that it collected more information than necessary. Some also felt the assessment duplicated information already collected by their agency's assessment process. Currently, however, there is no mechanism for sharing assessment information between community partner agencies and SASH. Additionally, only a fraction of SASH participants are clients of the partner organizations.
3.4. Property Management at Support and Services at Home Housing Sites
What, if any, impacts are there on participating properties, including in the following areas--turnover rates and vacancy reduction; property maintenance and costs; building improvements for accessibility; tenant complaints and management's conflicts with tenants; property managers' workload, smooth running, or property administration?
3.4.1. Impacts on Participating SASH Properties
The SASH program was initially designed to serve the needs of older adults and individuals with disabilities living in affordable housing properties and to help these residents age in place. Although the program expanded to include Medicare beneficiaries who were living in the community, the majority of SASH participants are residents of HUD-assisted or LIHTC housing. The SASH program has the potential to have a positive impact on the participating properties and property management. Our evaluation examined the effect of the SASH program on the host properties by conducting interviews with property managers during the third annual site visit; these site visit interviews were supplemented by one-on-one telephone interviews with property managers from four additional housing organizations. See Section 2.1 for further details on the qualitative data collection during the third site visit and one-on-one quarterly calls with property managers.
| Property managers reported that the SASH program helped provide residents with the services and resources to remain safely in their homes and to avoid eviction. |
During our site visit interviews, property managers discussed the impacts the SASH program had on operations, property administration, and their own workload. Property managers who had not formerly had support services in place before the SASH program felt that they were better able to perform their primary function because the SASH coordinator and wellness nurse were able to focus on the health and wellness of participants. One property manager felt that aging residents with unmet needs presented financial risk to their portfolios, such as physical property damages and property legal liabilities. For this reason, they felt the SASH program could reduce costs for the housing properties. Furthermore, SASH staff and property managers felt that SASH activities help create a better community within the property. In addition to providing opportunities for social engagement, the program helps address tenant conflicts and complaints, such as conflicts surrounding lifestyle differences between long-term older residents and younger residents with disabilities, which can be disruptive to the community.
A SASH Team leader explained that the SASH program offers a useful counterpart to the property manager and can support property management in achieving its objectives. SASH staff are able to play the role of nurturer, while the property manager acts as the enforcer. Having these two distinct roles allows SASH participants to feel as if there are tools to address both their housing issues and their interpersonal and health-related issues, without having one affect the other.
Property managers spoke of working with the SASH staff to identify resources and supports to address issues that arose. Almost all of the property managers interviewed have regular engagement with the SASH staff, most often with the SASH coordinator. They mentioned meeting as needed, sometimes as frequently as weekly, or daily communication via phone and e-mail. At these meetings they discuss many issues, including delinquent tenants, such as not paying rent or not obeying property policies (e.g., smoking areas, hoarding, or other unsanitary conditions), conducting joint welfare checks on residents, or mobility challenges that make it difficult for residents to get around and to keep their apartments safe and well maintained, or other medical-related needs.
One property manager stated that mental health issues are the most challenging resident issue she encountered, and does not feel she is equipped to handle them. She had several residents with mental illness at a previous property she operated, many of whom ended up being evicted. By contrast, properties she now manages with the SASH program have had no evictions because of mental health issues because SASH connects these residents with the needed resources and services. Both the SASH coordinator and wellness nurse receive some training on mental health issues through the program. The sites are also required to partner with the local mental health agency. This enhanced behavioral health capacity is an asset to property managers as well as the residents.
Many property managers noted SASH has helped a lot of residents; they believe some people might not be able to remain in their apartments without the supports and services the SASH program helped put in place.
3.4.2. Summary of Impacts on Participating SASH Properties
Several SASH staff and property managers believe that a notable success has been the program's ability to help participants remain in their homes, both in terms of aging in place as their health and functional needs increase and in terms of helping participants avoid eviction. SASH staff are able to make sure that participants have the services and resources needed to be safe in their apartments or uphold their tenancy obligations. A property manager attributed the success of SASH to teamwork and communication. Several interviewees also cited the successful training program and network that SASH has established to enable SASH staff to fulfill their roles.
4. SUPPORT AND SERVICES AT HOME PROGRAM PARTICIPATION
4.1. Support and Services at Home Housing Properties
What are the characteristics of the properties participating in SASH and properties that house the comparison beneficiaries?
The housing host sites are essential partners in the implementation of the SASH program. The SASH coordinators and wellness nurses typically operate out of space provided by the housing host. Across the 51.5 SASH panels (excluding 2.5 community panels), we identified 111 properties that were housing SASH participants; on average, each SASH panel included just over two properties.
The SASH housing sites included in this descriptive analysis are those associated with SASH panels that implemented the SASH program prior to March 31, 2015. Designated SASH sites include a range of non-profit affordable housing properties funded through a variety of sources including HUD, LIHTC, USDA, and other sources available through the State of Vermont. SASH sites also include a few mobile home parks. SASH participants in our analysis sample were drawn only from properties that receive funding assistance from HUD or LIHTC, which includes properties receiving assistance through HUD's Office of Multifamily Housing, such as Section 202; public housing programs; or tax credit properties. The analysis is limited to these communities because these data sources are best suited to linking Medicare beneficiaries to specific properties. These property linkages allow us to obtain information about the property as well to control for property-level fixed effects in our regression models (see Section 2.3.7).
Properties that receive multiple forms of funding assistance are included in the analysis if one of the funding sources is LIHTC or requires reporting in the PIC or TRACS. Properties funded through the USDA and the State of Vermont cannot be included unless they are LIHTC properties or receive assistance that must be reported in PIC or TRACS. This is because we do not have a data source that allows us to identify residents in USDA and State of Vermont properties that are not participating in the SASH program, which would be necessary to construct a reasonably similar comparison group to the SASH participants who live in USDA and State of Vermont properties. These excluded properties represent a small portion of the total SASH properties.
| TABLE 4-1. Characteristics of Properties in which Medicare FFS SASH Program Participants and Comparison Group Beneficiaries Reside | ||
|---|---|---|
| Property Characteristics | Properties Associated | |
| SASH Participantsa | Non-SASH Beneficiariesb | |
| Total number of properties in TRACS | 49 | 98 |
| Mean number of units | 35 | 25 |
| Mean occupancy length (years) | 4.3 | 4.2 |
| Mean household size | 1.4 | 1.9 |
| Mean household income | $15,043 | $14,642 |
| Median household income | $14,869 | $14,253 |
| Mean tenant monthly rent | $320 | $312 |
| Residents aged 65 and older (%) | 67 | 40 |
| Section 8 recipients (%) | 84 | 88 |
| Metropolitan (%) | 38 | 24 |
| Micropolitan (%) | 30 | 52 |
| Rural (%) | 32 | 24 |
| County-level median household income | $52,140 | $51,045 |
| Average annual Medicare expenditures | $7,757 | $7,917 |
| Total number of properties in PIC | 9 | 4 |
| Mean number of units | 353 | 381 |
| Mean occupancy length (years) | 5.3 | 5.3 |
| Mean household size | 2.1 | 3.1 |
| Mean household income | $15,983 | $21,180 |
| Median household income | $15,799 | $21,998 |
| Mean tenant rent | $329 | $348 |
| Residents aged 65 and older (%) | 33 | 21 |
| Metropolitan (%) | 11 | 50 |
| Micropolitan (%) | 67 | 50 |
| Rural (%) | 22 | 0 |
| County-level median household income | $50,240 | $55,903 |
| Average annual Medicare expenditures | $7,790 | $7,811 |
| Total number of LIHTC properties | 53 | 180 |
| Mean number of units | 63 | 81 |
| Mean occupancy length (years) | --- | --- |
| Mean household size | 1.8 | 2.3 |
| Mean household income | $18,817 | $20,260 |
| Median household income | $17,679 | $20,028 |
| Mean tenant rent | $441 | $473 |
| Residents aged 65 and older (%) | 42 | 25 |
| Metropolitan (%) | 50 | 41 |
| Micropolitan (%) | 29 | 33 |
| Rural (%) | 21 | 26 |
| County-level median household income | $54,481 | $54,387 |
| Average annual Medicare expenditures | $7,925 | $8,171 |
NOTES: TRACS and PIC data are from calendar years 2012-2015. LIHTC data is from 2012 to 2014. Occupancy length could not be determined from the LIHTC data base. "Section 8" refers to a property's percentage of residents receiving Section 8 assistance. The figures in this table represent the average of those percentages across all properties in a group.
| ||
In Table 4-1, we present the property characteristics for properties associated with intervention and comparison beneficiaries, using HUD data from calendar years 2012-2015. TRACS is the data base for all programs administered by HUD's Office of Multifamily Housing (Section 202, Section 236, etc.); PIC is the data base for public housing and housing choice vouchers; and the LIHTC data base contains information on low-income housing developed through tax credits. Because there are differences between the data sources, we present means separately for properties listed in the TRACS, PIC, and LIHTC data bases.
In the TRACS data base we were able to link intervention beneficiaries to 49 properties and comparison group beneficiaries to 98 properties. Overall, there were many similarities between the two sets of properties. However, properties associated with SASH participants had on average a higher number of housing units than the comparison group (35 vs. 25) and a higher percentage of residents aged 65 and older (67% vs. 40%). They were also more likely to be in metropolitan areas (38% vs. 24%) and consequently in counties with higher median household incomes.
In the PIC data base we were able to link intervention beneficiaries to nine properties and comparison group beneficiaries to four properties. The two sets of properties varied in many ways: PIC properties associated with SASH beneficiaries had fewer units, smaller average household sizes and incomes, and larger percentages of residents aged 65 and older. They were also less likely to be in metropolitan areas. Though there were many differences, it should be noted that the number of comparison group individuals associated with PIC properties was small compared to the number of comparison beneficiaries associated with properties in the TRACS and LIHTC data bases. At the time of analysis, SASH was available in all PIC senior housing properties in Vermont; the few comparison beneficiaries who are identified as living in PIC properties are living in PIC properties that are not restricted to senior residents.
In the LIHTC data base we were able to link intervention beneficiaries to 53 properties and comparison group beneficiaries to 180 properties. SASH and non-SASH LIHTC properties were fairly similar, though once again SASH properties contained a higher percentage of residents aged 65 and older (42% vs. 25%) and were more likely to be in metropolitan areas than properties associated with the comparison group.
Across all three types of housing examined, the SASH housing hosts had smaller average household sizes and greater proportions of residents aged 65 and older. Otherwise, there were no consistent patterns in the differences between SASH properties and non-SASH properties based on the data available in the three housing data bases. Overall, it does not appear these small differences in the properties would have an effect on the differences we estimate in the health status and health care utilization of the Medicare beneficiaries residing in the properties.
4.2. Site-Based Support and Services at Home Participants
How do site-based SASH participants compare with individuals in HUD-assisted or LIHTC properties in the comparison group?
For the regression analysis of Medicare claims data in this report, the intervention group consists of Medicare FFS beneficiaries who started participating in the SASH program prior to March 31, 2015. The comparison group comprises Medicare FFS beneficiaries who were alive as of July 1, 2011, and who were not identified as SASH participants.
| Our analysis finds that SASH participants are older and in poorer health than residents of HUD-assisted or LIHTC housing who are not participating in SASH. |
We limit our claims data regression analyses in Section 5.2 and Section 5.5 to SASH participants and comparison Medicare beneficiaries who are living in HUD-assisted or LIHTC housing, as demonstrated by their presence in one of the three HUD housing data bases. For the purposes of this analysis, when we describe our SASH population and our comparison group as living in "HUD-assisted or LIHTC housing sites," we define that as beneficiaries who are found in the PIC, TRACS, or LIHTC data bases. Note that all residents of LIHTC properties (as identified in the LIHTC data base) are eligible for inclusion in the sample, whether or not they receive rental assistance. Both intervention and comparison group beneficiaries were cross-referenced with HUD administrative data from 2012 to 2015 (see Section 2.3). Only beneficiaries successfully identified as recipients of HUD assistance for affordable housing or as residents of LIHTC properties were included in the regression analysis.13 This step was taken in order to remove SASH participants who were residing in the community and not in SASH site-based housing properties.14 SASH participants residing in the community were excluded from the regression analysis because of concerns about identifying an appropriate comparison group; in the following section (Section 4.3), we provide a descriptive analysis of the SASH participants living in the community, relative to the site-based SASH participants and relative to a comparison group drawn from other Medicare FFS beneficiaries living in the community.
We exclude from the comparison group non-SASH participants living in properties where SASH participants make up over 25% of the residents. In properties where SASH is active, residents who are non-participants in SASH may still benefit from the programming and the availability of the SASH coordinator and the wellness nurse. We do not want to include in the comparison group any non-participants who may be benefiting from the SASH program; this could dilute the true impacts of the SASH program. Future analyses should explore if there are any positive spillover effects of the SASH program onto non-participants in HUD-assisted and LIHTC properties where SASH is active.
In Figure 4-1, we show which types of SASH participants are included in our analysis, and how many SASH participants there are in each included and excluded group. As of June 2015, there were 4,741 individuals with at least one-quarter of participation in the SASH program; 3,812 of them were Medicare FFS beneficiaries. The 929 SASH participants who are not Medicare FFS beneficiaries may instead be covered by Medicare Advantage, or they may not be eligible for Medicare. As we do not have claims data for SASH participants who are not Medicare FFS beneficiaries, these participants are excluded from our analysis. Of the 3,812 SASH participants who were Medicare FFS beneficiaries, 70% (2,682) were living in HUD-assisted or LIHTC housing, while the other 30% (1,130) were living in the community.
| FIGURE 4-1. Total SASH Participants and SASH Participants Included in the Quantitative Analysis |
|---|
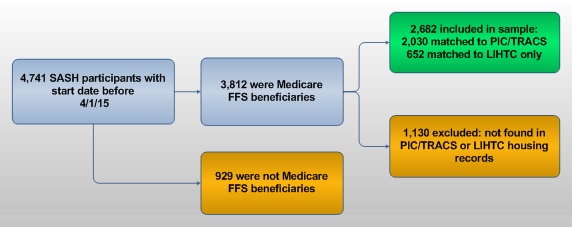 |
As described above, we also limit the comparison group in the regression analysis to Medicare FFS beneficiaries who are living in HUD-assisted or LIHTC housing; there were 3,591 of these beneficiaries in Vermont. Table 4-2 presents the average demographic and health status characteristics for the SASH participants in the sample and the unweighted and propensity-score weighted averages for the non-SASH comparison group beneficiaries.
The beneficiary characteristics are reported during the baseline year, which for both the SASH intervention group and the comparison group is defined as the calendar year prior to the start of the SASH program (July 2010-June 2011). Baseline variation between SASH program beneficiaries and the comparison group are quantified using standardized differences (Austin, 2011). A standardized difference between -0.10 and +0.10 indicates that the difference in means between two groups is not statistically significant. Standardized differences between the two groups greater than or equal to the absolute value of 0.10 are denoted by an asterisk (*).
Similar proportions of site-based SASH participants and the comparison group beneficiaries were White, female, dually eligible for Medicare and Medicaid, and eligible for Medicare because of ESRD; mean household income was also similar between the SASH participants and the comparison group. However, there were significant differences between the SASH participants and the comparison group in all the remaining characteristics. SASH program participants were older on average than the comparison group beneficiaries (mean age, 69 vs. 63), were less likely to have originally qualified for Medicare because of disability, and resided in smaller households. A larger proportion of SASH participants in the sample (83%) were attributed to primary care practices that were participating in the Blueprint for Health demonstration, relative to the comparison group (74%).
| TABLE 4-2. Average Baseline Demographic Characteristics and Health Status for SASH Medicare FFS Participants, and Unweighted and Weighted Average Demographic Characteristics and Health Status for Non-SASH Medicare FFS Beneficiaries | |||
|---|---|---|---|
| Demographic and Health Status Characteristics | SASH Program Beneficiariesa | Non-SASH Comparison Beneficiariesb | |
| Unweighted | Weighted | ||
| Total beneficiaries | 2,682 | 3,591 | 2,682 |
| Demographics | |||
| Mean age | 69.1 | 63.4* | 69.3 |
| Age =64 (%) | 33.3 | 41.4* | 33.5 |
| Age 65-74 (%) | 30.0 | 26.2 | 29.3 |
| Age >=75 (%) | 36.7 | 32.4 | 37.2 |
| White (%) | 97 | 96 | 98 |
| Female (%) | 70 | 65 | 70 |
| Originally qualified for Medicare because of disability (%) | 44 | 53* | 43 |
| Medicaid eligible (%) | 54 | 55 | 54 |
| ESRD (%) | 1 | 1 | 1 |
| Mean household income ($) | $16,184 | $16,554 | $16,040 |
| Mean household size | 1.15 | 1.35* | 1.14 |
| MAPCP | 83 | 74* | 82 |
| Health status | |||
| Mean HCC score | 1.09 | 0.97* | 1.09 |
| Mean Charlson Comorbidity Index | 0.77 | 0.62* | 0.75 |
| Property type | |||
| LIHTC only (%) | 24.3 | 44.7* | 24.9 |
| PIC or TRACS | 75.7 | 55.3* | 75.1 |
NOTE: Standardized differences comparing SASH program beneficiaries to non-SASH comparison beneficiaries that are greater than or equal to the absolute value of 0.10 are noted with an "*".
| |||
We examined two measures of health status, the HCC risk score and the Charlson comorbidity index; both of these measures are created using diagnosis codes on claims in the baseline year before the start of the SASH program. The HCC risk score is interpreted as the predicted health care costs relative to the average Medicare FFS beneficiary. SASH participants have an HCC risk score of 1.09, meaning that their predicted health care costs are 9% more than the average, while the comparison group has an HCC risk score of 0.97, meaning that their predicted health care costs are 3% less than the average. The Charlson comorbidity index is a mortality predictor that sums across a list of 18 chronic conditions, each of which receives a score between 1 and 6, depending on the probability of mortality. SASH participants have a higher average value of the Charlson index score (0.77 vs. 0.62) than the comparison group, meaning that they have more chronic conditions on average.
With respect to property type, SASH participants were more likely than the comparison group to be to be receiving housing assistance that was reported in the PIC or TRACS data bases (75.7% vs. 55.3%). In Section 4.3, we will explore the characteristics of the different types of HUD-assisted and LIHTC housing sites that hosted the SASH program.
Because the comparison group differs from the intervention group across seven of the baseline characteristics, which may affect Medicare expenditures and other health care utilization outcomes of interest, all descriptive statistics and outcome analyses in Section 5.2 and Section 5.5 use weights derived from propensity-scores (see Section 2.3.4). Propensity-score matching attempts to balance the intervention and comparison groups with respect to baseline characteristics to reduce the potential for bias in the estimate of the intervention effect. The final column in Table 4-2 shows the characteristics of the comparison group after propensity-score matching. After matching, all of the statistically significant standardized differences disappeared, indicating that matching was able to sufficiently balance demographic characteristics and health status between the SASH participants and the comparison group.
4.3. Support and Services at Home Participants in the Community
How many SASH participants reside in the community outside of SASH housing sites? What are the characteristics and health needs of SASH participants and how are they different from SASH participants living in HUD-assisted or LIHTC housing sites?
The SASH program was designed to meet the needs of an aging population living in affordable housing such as HUD-assisted or LIHTC housing with high concentrations of older adults. As a condition of its Medicare funding through the MAPCP Demonstration, the SASH program was required to be open to all Vermont Medicare FFS beneficiaries regardless of income, including beneficiaries who live in the surrounding communities, outside of the SASH housing sites. At the start of the SASH program, very few participants were living in the community outside of SASH housing sites; but by the program's fourth year, almost 30% of Medicare FFS beneficiaries participating in the SASH program were living in the community.15 Our evaluation of the SASH program explored the characteristics and needs of the community participants through the third annual site visit and through our analysis of Medicare claims data. See Section 2.1 for details on the qualitative data collection during the third site visit. Details on the Medicare enrollment and claims data used in the quantitative analysis are available in Section 2.3.
| Our analysis finds that community participants in the SASH program have more health needs, higher health care expenditures, and may be more difficult to serve than the site-based SASH participants. |
4.3.1. SASH Staff Experiences with Community Participants in SASH
Understanding the characteristics, types of assistance needed, and factors that affect the ability of the SASH program to serve participants living outside of the housing properties became especially important as the proportion of SASH participants in the community grew. Thus, community participants and community panels were the primary focus of the third annual site visit.
Most community participants join one of the 51.5 SASH panels that are hosted in an affordable housing property. As the SASH panels began to expand and recruit outside of the housing properties and as general awareness of SASH grew, interest from potential community participants increased. In some areas, panels expanded from a half to a full panel, or a new panel or half panel was added to accommodate the growing community participant interest. Two-and-a-half panels were created specifically to serve community participants only. These panels were developed after housing host organizations began to receive referrals or calls from interested participants living in areas where there were no housing properties eligible to host a SASH panel. These community panels operate similarly to panels tied to a housing property. There is a SASH Team consisting of a SASH coordinator and wellness nurse who collaborate with the network of community partner organizations, but the team operates out of a space in the community such as a senior center or a partner agency office rather than a housing property.
SASH coordinators and wellness nurses provide similar services to site-based and community participants, such as help with chronic disease management, help with medications, and referrals for other types of assistance. Community participants may require additional or more intense types of assistance with issues such as home repairs and accessibility modifications, homemaker services, financial assistance (for expenses such as prescriptions, hospital bills, home fuel/energy needs, and telephone service), and caregiver support to spouses or other live-in caregivers.
There was no single consensus around the characteristics and needs of community participants. Many SASH coordinators and wellness nurses believed community participants are generally frailer than site-based participants and are more socially isolated, possibly because they are often homebound because of their frailties or have limited transportation options. Several SASH staff believed community participants often desire a great degree of autonomy, which could also contribute to their isolation. SASH staff noted that this can lead to community participants taking longer to feel comfortable enough to open up to SASH staff or accept their advice. Interviewees also found that community participants often have limited knowledge of community resources and are less likely to engage in community programs. One SASH wellness nurse thought that community participants have weaker social support systems--either because of their desire for autonomy or a lack of or estrangement from family.
SASH staff noted that some community participants have slightly higher incomes than site-based participants. Community participants often do not qualify for public assistance programs but still struggle with expenses and paying for services. Some SASH staff interviewed said that high housing and energy expenses can eat away at community participants' income and ability to purchase needed supports. Several SASH staff interviewed said that they often have to be more creative in identifying solutions and resources for community participants because they are not eligible for many of the public programs.
Several SASH staff noted that community participants are more likely to have environmental issues with their homes compared to site-based participants, ranging from inaccessibility to severe dilapidation. Site-based participants generally do not have these concerns, as any housing-related issues that arise can usually be addressed easily through the property's management. Addressing home repair and accessibility needs for community participants is often much more complex and requires greater problem-solving by the SASH staff to identify resources.
Interaction and engagement with the community participants typically occurs in the participants' homes and is one-on-one with the SASH coordinator, wellness nurse, or both. Because of community participants' mobility or transportation challenges, they are generally not able to get to the housing properties to visit with the SASH staff or to participate in group programming. SASH staff also like to be able to observe the participant's living environment to check for safety and housekeeping issues.
The frequency with which SASH coordinators and wellness nurses interact with community participants depends mainly on the needs and desire of each participant. Several SASH coordinators and wellness nurses stated that they try to connect with community participants for regular telephone check-ins. In-home visits tend to be more episodic and need-based. For example, a wellness nurse may regularly visit a participant who is having trouble managing their blood pressure to help them monitor it. Another wellness nurse explained that they may see community participants in person only once a year, during the reassessment process. Many SASH staff maintain a list of higher need community participants whom they check on more frequently by telephone or an in-person home visit, depending on the type of need.
Site visit interviewees generally agreed that SASH coordinators and wellness nurses do not have the same type of engagement with community participants as they do with site-based participants, primarily because of the greater regularity and frequency with which they can interact with site-based participants. A SASH coordinator explained that a community participant could fall and she may never hear about it unless the participant tells her, whereas in a housing property, the coordinator is "bombarded" by people informing her when someone has had a health crisis. Despite coordinators' telephone calls and one-on-one visits, they can miss things by not being physically present near community participants' homes.
SASH staff felt that they did not have as great an impact on community participants as on those living in a housing property. A SASH coordinator stated, however, that there is still great value in seeing a participant in his or her home environment. She can more easily identify problems, such as whether a person's medicines are in disarray or the person is not eating. She can see that a person lost prescription coverage because the mail is piled up and the participant did not fill out the required forms to continue the coverage. These observations allow the coordinator to provide the individual's physician with important insight that may otherwise go unnoticed.
Site visit interviewees said that the ability to effectively serve all types of participants was largely based on the number of community participants in a panel, the geographic distance between community participants, and the number of high-need participants in a panel. When asked what would be an optimal mix of site-based and community participants, SASH coordinators and wellness nurses responded that no more than one-third to one-half of a panel's participants should be community participants. For panels serving only community participants, interviewees said almost unanimously that between 75 and 85 community participants would be a good size, compared to the standard 100 participants per panel, which the program is currently funded to serve. To effectively serve 100 community participants, the SASH staff, and particularly the wellness nurse, reported that they would need more hours than they are currently allocated.
4.3.2. Medicare Enrollment and Claims Data Descriptions of Community Participants in SASH
For the examination of community SASH participants' Medicare enrollment and claims data, we utilized two comparison groups. First, we compared the community SASH participants to those living in HUD-assisted housing, which we refer to as site-based SASH participants. Second, we used propensity-score matching to draw a comparison group for the community participants in SASH. We limited the possible sample to Medicare FFS beneficiaries who were not living in HUD-assisted housing and matched the community SASH participants to community comparison group members using demographic and health characteristics. In particular, we used the HCC score in the baseline year (year prior to joining SASH for the participant and the same calendar year for the comparison beneficiaries) to better match for the expected Medicare expenditures in the first year of participation. In Table 4-3, we provide the descriptive statistics for the site-based SASH participants, the community SASH participants, and the community comparison group.
| TABLE 4-3. Average Baseline Demographic Characteristics and Health Status for SASH Site-Based Beneficiaries, SASH Community Beneficiaries, and Weighted Average Demographic Characteristics and Health Status for Non-SASH Community Comparison Group Beneficiaries | |||
|---|---|---|---|
| Demographic and Health Status Characteristics | SASH (site-based)a | SASH (community)b | Comparison Group (community)c |
| Total beneficiaries | 2,682 | 1,065 | 1,065 |
| Demographics | |||
| Mean age | 69.1 | 73.5 | 75.0 |
| Age =64 (%) | 33.3 | 21.5 | 18.2 |
| Age 65-74 (%) | 30.0 | 25.8 | 28.7 |
| Age >=75 (%) | 36.7 | 52.7 | 53.1 |
| White (%) | 97 | 98 | 98 |
| Female (%) | 70 | 68 | 68 |
| Originally qualified for Medicare because of disability (%) | 44 | 26 | 26 |
| Medicaid eligible (%) | 54 | 27 | 27 |
| ESRD (%) | 1 | 0 | 0 |
| Mean household income ($) | $16,184 | --- | --- |
| Mean household size | 1.15 | --- | --- |
| MAPCP | 83 | 83 | 83 |
| Health status | |||
| Mean HCC score | 1.09 | 1.25 | 1.24 |
| Mean Charlson Comorbidity Index | 0.77 | 1.07 | 1.05 |
| |||
There were 1,065 community SASH participants included in this descriptive analysis.16 Although community SASH participants are similar to site-based SASH participants along many dimensions, we observe important differences. Community SASH participants are slightly older than site-based SASH participants, with an average age of 73.5 vs. 69.1. Site-based SASH participants are much more likely to have qualified for Medicare because of disability, with 44% originally eligible for Medicare because of disability compared to 26% among community SASH participants. Also, site-based SASH participants are more likely to be dually eligible for Medicare and Medicaid, with 54% receiving Medicaid, compared to 27% among the community SASH participants.
We looked at two measures of health status, the HCC risk score and the Charlson comorbidity index; both of these measures are based on diagnosis codes on claims in the baseline year. The HCC risk score is interpreted as the predicted health care costs relative to the average Medicare FFS beneficiary. SASH community participants have an HCC risk score of 1.25, meaning that their predicted health care costs are 25% more than the average, while the site-based SASH participants have an HCC risk score of 1.09, meaning that their predicted health care costs are just 9% more than the average. The Charlson comorbidity index is a mortality predictor that sums across a list of 18 comorbid conditions, each of which receives a score between 1 and 6, depending on the probability of mortality. SASH community participants have a higher average value of the Charlson index than the site-based SASH participants (1.07 vs. 0.77), meaning that they have more chronic conditions on average.
Because we matched the community comparison group to the community SASH participants using the health and demographic characteristics reported in Table 4-3, there are no noticeable differences between the community SASH and community comparison groups.
In Table 4-4, we present the average Medicare payments during the baseline year and the first 4 years of the SASH program, for site-based SASH participants, community SASH participants, and the matched community comparison group. For each SASH participant, the baseline year is the year prior to their initial entry into the SASH program. Each community SASH participant is matched 1:1 to a beneficiary in the community using propensity-scores, and the SASH participant's baseline year is used as the baseline year for the matched comparison beneficiary. Similarly, each SASH participant has a first year in SASH, and their matched comparison beneficiary uses the same calendar time period for their "SASH Year One."
| TABLE 4-4. Average Quarterly Medicare Payments for Site-Based and Community SASH Participants and the Community Comparison Group | ||||||
|---|---|---|---|---|---|---|
| Time Perioda | SASH (site-based) | SASH (community) | Comparison Group (community) | |||
| N | Mean Payments | N | Mean Payments | N | Mean Payments | |
| Baseline Year One | 2,682 | $790 | 1,065 | $1,005 | 1,065 | $871 |
| SASH Year One | 2,682 | $1,060 | 1,065 | $1,344 | 1,065 | $937 |
| SASH Year Two | 2,319 | $1,059 | 654 | $1,324 | 654 | $997 |
| SASH Year Three | 1,674 | $1,098 | 326 | $1,096 | 326 | $932 |
| SASH Year Four | 573 | $1,127 | 122 | $830 | 122 | $879 |
| ||||||
While all participants are present in the baseline year and in the first SASH year by definition, only a few of the beneficiaries entered the sample early enough to have 4 years of SASH participation. This was particularly true in the SASH community group, where just over 10% of participants have been in the program more than 3 years as of June 2015. Therefore, the lower average Medicare expenditures reported in Years Three and Four for the community participants are not an effect of the SASH program.
In both SASH groups, the average Medicare payments increase sharply from the baseline year to the first SASH year. In the baseline year and in the first SASH year, the average payments for the community participants are much higher than those for the site-based SASH participants or for the community comparison group. This is despite having matched the community comparison group on HCC scores and other demographic characteristics. This provides us with evidence both that SASH participants in the community are costlier than those in the SASH sites, and that even matching using HCC scores does not fully control for selection of the community participants in the SASH program. Figure 4-2 presents the same numbers as Table 4-4, but graphically.
| FIGURE 4-2. Trends in Total Medicare Payments for Site-Based SASH Participants, Community SASH Participants, and the Community Comparison Group |
|---|
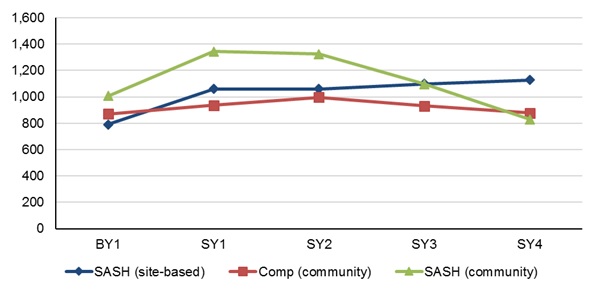 |
| In this figure, Baseline Year and SASH Years reference the individual SASH participant's year before enrollment and first, second, third, and fourth year of SASH participation. These years do not align to calendar time. |
Note that although the Medicare payments for the community SASH participants appear to decline over time, this is likely because of the very small number of community SASH participants who have been in the SASH program for 3-4 years, meaning the averages could fluctuate more than what is expected in a larger population. Most of the community participants joined the SASH program in the third and fourth years of the demonstration.
Both our site visits interviews and our analysis of the Medicare enrollment and claims data confirm that community participants in the SASH program have more health needs, higher health care utilization and expenditures, and may be more difficult to serve (because of travel time and distance, participants' desire for autonomy, lack of community resources, and weak social support networks) than the site-based SASH participants.
5. SUPPORT AND SERVICES AT HOME PROGRAM OUTCOMES
5.1. Health Status of Support and Services at Home Participants
Does the SASH program improve the physical and mental health status (or slow the decline of physical and mental health status) among SASH participants relative to their peers living in affordable housing but not participating in the program?
By working with participants to improve their self-management of health care issues and with both participants and property managers to address environmental issues that could contribute to falls, the SASH program has the potential to positively impact the health and functional status of participants. As part of our evaluation, we conducted a mail survey of site-based SASH participants who were Medicare FFS beneficiaries and a comparison group of Medicare FFS beneficiaries living in HUD-assisted or LIHTC housing where SASH was not available, in order to address the question of whether the SASH program improves (or slows the decline of) physical and mental health status. Further details on the beneficiary survey and the analysis of the beneficiary survey responses are available in Section 2.2. Based on the results of the beneficiary survey, there is some evidence that SASH participants had better physical and mental health status compared to non-SASH Medicare beneficiaries in other HUD-assisted or LIHTC housing.
| Our analysis finds that SASH participants have fewer physical limitations and higher scores for measures of physical function and health utility, relative to a randomly selected comparison group of Medicare beneficiaries. |
The three outcomes of physical and mental health status included in the survey measure different aspects of physical functioning. The PHC measures overall physical function, including activity limitations (such as the ability to climb stairs), accomplishing less than desired, pain interference in work, and health self-perception. A higher PHC score indicates better physical function. ADLs measure a beneficiary's ability to perform six basic ADLs: bathing, dressing, eating, getting in or out of chairs, walking, and using the toilet. A lower ADL count indicates that the survey respondent can do more of the activities unassisted. The EQ-5D is a measure of health preference utility that consists of four physical functioning items (mobility, self-care, ability to perform usual activities, pain or discomfort) and one mental health item (anxiety/depression). A higher score on the EQ-5D scale (from zero to 1) indicates better overall health status.
As reported in Section 2.2, the effect of the SASH program on all three of these measures is positive as expected. SASH participants have higher (+3.17) PHC scores, fewer limitations in their ADLs (-0.11), and higher EQ-5D scores (+0.02). Only the effect on the PHC is statistically significant.
Obtaining a sense of the magnitude of the program effects is difficult when each outcome is measured by a different scale and metric. One way to compare the relative effects for different outcomes is to convert each treatment effect into a standardized effect size (the regression-adjusted treatment effect divided by the pooled standard deviation of the outcome). A frequently cited guideline is that effect sizes of 0.20 represent "small" impacts, while an effect size of 0.50 is a medium impact. The SASH survey was designed to be able to detect effect sizes of 0.35 or greater.
Figure 5-1 shows the regression results (from Table 2-10) translated into effect sizes. The effect size for the PHC (0.28) falls in the small to medium effect range. The effect sizes for the EQ-5D and ADLs are in the favorable direction, but both are less than 0.10 in magnitude.
| FIGURE 5-1. SASH Impacts on Health Status Measures Expressed as Standardized Effect Sizes |
|---|
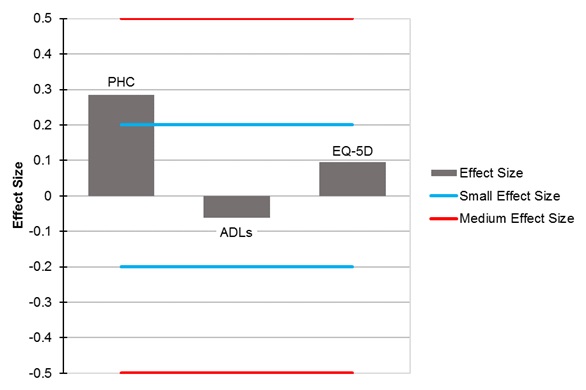 |
| A higher PHC score indicates better physical function. A lower ADL count indicates that the survey respondent can do more of the activities unassisted. A higher score on the EQ-5D scale (from zero to 100) indicates better overall health status. |
SASH participants have fewer physical limitations and higher scores for measures of physical function and health utility, relative to a randomly selected comparison group that was adjusted using propensity-score weights. This is consistent with interviews from the third annual site visits, many of which highlighted successes related to participant health outcomes. Several interviewees said that the program had helped create healthier individuals and communities. SASH staff believed that participants were better educated about their health issues and had stronger self-care management skills. When improved self-care management is combined with monitoring by the wellness nurses, looming health issues are caught before they become bigger issues, according to the wellness nurses we interviewed. Although the survey results are limited by the fact that we do not have baseline scores for the SASH participants and the comparison group to know how their scores compared prior to the start of the SASH program, the survey results are consistent with the qualitative results for this outcome.
5.2. Hospital Admissions and Emergency Room Use among Support and Services at Home Participants
Do participants in the SASH program have fewer hospital admissions and emergency department visits relative to their peers living in affordable housing but not participating in the program?
SASH coordinators and wellness nurses work together with health care providers when appropriate to increase coordination and continuity of care for SASH participants. We would expect these efforts to result in relative reductions in avoidable hospitalizations and avoidable ER visits, as SASH staff work with health care providers to address participants' health issues before they need ER or hospital-level care. Identifying avoidable hospitalizations and ER visits in claims data is challenging. As we examine the impact of the SASH program on all-cause acute care hospitalizations, all-cause ER visits, and ER visits not leading to a hospitalization, we recognize that only some of these adverse health events are actually avoidable through preventive and primary care. In this section, we analyze the effect of the SASH program on health care utilization. See Section 2.3 for further details on the methodology for analyzing health care utilization from Medicare claims data. There is no evidence that ER visits declined among SASH participants, but we do find that SASH participants in the early panels had lower rates of all-cause hospital admissions compared to non-SASH Medicare beneficiaries in other HUD-assisted and LIHTC housing.
The analyses in this section evaluate the effect of the SASH program on the health care utilization of SASH participants, compared to similar non-participants. In these analyses, both SASH participants and individuals in the comparison group were Medicare FFS beneficiaries living in HUD-assisted or LIHTC housing, as described in Section 2.3. We use Medicare claims data from January 1, 2006, through June 30, 2015; and we estimate a multivariate regression model for each of the three outcomes, controlling for all of the beneficiary characteristics listed in Table 4-1. We estimate the effect of the SASH program on health care utilization outcomes for the entire population of SASH participants in our sample, and also separately for specific subsets of SASH participants.
In the First and Second Annual Reports of the SASH evaluation, we estimated the impact of the SASH program for two subgroups of participants: an "early panel" cohort and a "late panel" cohort. The early panel cohort comprises SASH participants who received SASH services from a panel that started operating before April 1, 2012. The late panel cohort comprises SASH participants who received SASH services from a panel that started operating on or after April 1, 2012. The initial reason for separating SASH participants by the panel start dates was that there are many SASH panel start-up activities associated with hiring staff, gaining participation consent, conducting a detailed needs assessment, and initiating supportive services, which would reduce a SASH panel's ability to make a significant impact on health care utilization in its first few quarters of operation. We hypothesized that the more established panels--the ones with the earlier start dates--would likely have a stronger impact on health care utilization. In both previous reports, we found slower growth in total Medicare expenditures among participants in the early panels, but not among the later panels, which supports the hypothesis that there is a lag between the start of a SASH panel and that panel's ability to influence health care expenditures and health care utilization.
In this analysis, we again subdivide the sample of SASH program participants into those belonging to early panels and those belonging to late panels. We keep the same cutoff date of April 1, 2012, but note that the early panel sample in this report is not identical to the early panel sample in the previous reports. We have expanded our sample to include SASH participants who were not attributed to Blueprint for Health practices. Also, rolling entry into the SASH program means that all participants who joined the early SASH panels since the timeframe of the last report are included in the early panel group, although they may not have received the SASH intervention for the full demonstration period. Again, what we are comparing by splitting early and late panels is the change in the rate of Medicare expenditure growth for panels that have been participating in SASH longer, rather than beneficiaries who have been participating longer, though the two are correlated.
Similarly, the number of late panels in this report differs from the number of late panels in the earlier reports due to rolling entry into the SASH program. SASH panels that started after the timeframe for the previous report are also grouped into the late panel cohort.
Through conversations with CSC and further exploration of the SASH panels, it was brought to our attention that the cohort of early panels consisted almost entirely of site-based panels, while the late panel cohort was a mix of site-based panels, mixed-panels, and a few community panels. SASH program leadership within CSC classifies SASH panels into three groups: site-based, mixed, and community. The earliest SASH panels rolled out were site-based, meaning that the majority--an average of 82% across these 30 panels--of SASH participants in the panel live in a HUD-assisted or LIHTC housing site that hosts the SASH program. Some site-based panels evolved into mixed-panels, where an average of 57% of participants lived in the community and not in a SASH site, as a result of increasing demand for SASH services from people living outside the SASH sites. In both site-based and mixed-panels, SASH coordinators and wellness nurses have office space and space to host group programming in the SASH site. As of June 2015, the SASH program had 30 panels that CSC classifies as site-based panels and 21.5 panels that CSC classifies as mixed-panels.
Panels composed solely of "community" participants (that is, SASH participants not residing in a SASH housing site) were not initially envisioned for the SASH program; however, community panels were created later because of larger-than-anticipated demand from beneficiaries residing in more rural areas of Vermont. Community panels have 100% community participants and do not have a housing property hub site available nearby. SASH coordinators and wellness nurses host events and operate out of local senior centers, partner agency space, private rental space, or other forms of community centers. As of June 2015, the SASH program had 2.5 panels that CSC classifies as community panels. By removing community panels from the sample and identifying participants in one of the three housing data bases, we hope to remove almost all of the SASH participants living in the community from our analysis. As discussed in Section 4.2, we remove the SASH community participants because it is very difficult to design an appropriate comparison group for community participants.
Given that the early panel cohort in the first report contained mainly site-based SASH panels, we would like to determine whether the success of these panels is because of their longer experience in the SASH program or because of the composition of their participants. Site-based SASH panels may be more effective at reducing Medicare expenditures, because of limited SASH coordinator and wellness nurse time. The SASH coordinator and wellness nurse time and resources may be spread more thinly in panels where there are a large proportion of community participants. Two of the possible reasons for this are: (1) staff may need to travel to participants to see them; and (2) the participants may have higher needs because they were referred to SASH for coordination needs. Even though the analysis includes only the SASH participants living in HUD-assisted or LIHTC housing, the "site-based" participants in the mixed-panels may not receive the same level of benefit from the SASH program as the participants in the site-based panels, if the community participants are requiring greater resources from the SASH Team.
Methods Summary. Our quantitative analysis estimates the impact of the SASH program on outcomes using regression methods. Details on the quantitative data and models used for this analysis are contained in Section 2. The results comparing the SASH participants to the non-SASH participants in Vermont are presented in this section. As discussed in Section 4, only SASH participants in HUD-assisted or LIHTC housing are included in the analysis (see Figure 4-1); we define beneficiaries living in "HUD-assisted or LIHTC housing" as those who are found in the PIC, TRACS, or LIHTC data bases. Note that all residents of LIHTC properties (as identified in the LIHTC data base) are eligible for inclusion in the sample, whether or not they receive rental assistance. Note also that voucher recipients are excluded from the analysis, because they live in the community and not in the SASH host site.
For these utilization outcomes, we use a non-linear (negative binomial) version of the regression model. For negative binomial models, the coefficients are incidence rate ratios and they are interpreted as the difference in the expected rate of events; values less than 1 indicate that the expected rate of utilization is less than that of the comparison group, and values greater than 1 indicate that the expected rate of utilization is greater than that of the comparison group. For example, if a certain group's incidence rate ratio is 0.5, the group is said to have an expected rate of utilization that is half that of the comparison group. An incidence rate ratio of 2 would indicate a rate in the treatment group that is twice that of the comparison group.
Descriptive Statistics. In Table 5-1 we present the weighted quarterly health care utilization rates for the SASH program beneficiaries and the Vermont comparison group of residents of HUD-assisted or LIHTC housing who are not participating in the SASH program. For both intervention and comparison groups, we report the weighted quarterly utilization rates for the baseline period; for each beneficiary, the baseline period is the 12 months prior to the beneficiary's enrollment in SASH. These quarterly rates of all-cause acute care hospitalizations, all-cause ER visits, and ER visits not leading to a hospitalization are provided in order to give context for the regression results presented in Table 5-2. Also, these descriptive statistics help establish that our intervention and comparison groups have similar outcomes at baseline, supporting the validity of the comparison group. We anticipate that the SASH program may help reduce some of these adverse health events, by promoting care coordination, primary care, and hospital discharge planning.
| TABLE 5-1. Average Quarterly Utilization of Services for SASH Participants and Non-SASH Comparison Beneficiaries in the Year Prior to SASH Enrollment and in up to 4 Years of SASH Participation | |||||
|---|---|---|---|---|---|
| Utilization Outcome | Baseline | Year One | Year Two | Year Three | Year Four |
| All-cause acute care hospitalizations | |||||
| SASH participants | 64.9 | 94.4 | 95.6 | 92.2 | 97.3 |
| Non-SASH comparison group | 74.1 | 87.8 | 92.8 | 97.3 | 102.0 |
| All-cause ER visits | |||||
| SASH participants | 262.9 | 320.0 | 317.5 | 301.7 | 335.7 |
| Non-SASH comparison group | 243.8 | 271.8 | 285.1 | 299.6 | 307.3 |
| ER visits not leading to a hospitalization | |||||
| SASH participants | 220.9 | 257.8 | 248.1 | 232.3 | 256.3 |
| Non-SASH comparison group | 200.0 | 218.0 | 228.5 | 240.3 | 245.0 |
| NOTES: Utilization is measured in rates per 1,000 beneficiaries per quarter. Average utilization is weighted by propensity weights for the comparison group. SASH program beneficiaries limited to Medicare FFS beneficiaries receiving housing assistance reported in PIC or TRACS data bases and/or living in a LIHTC property and participating in the SASH program. Non-SASH, Blueprint for Health comparison beneficiaries includes Medicare FFS beneficiaries receiving housing assistance reported in PIC or TRACS data bases and/or living in an LIHTC property not participating in the SASH program or living in a housing property that hosted the SASH program. | |||||
During the baseline period, we saw some small differences in the levels of acute care utilization between SASH participants and the non-SASH comparison group. Rates of all-cause hospitalization were lower among the SASH participants, 64.9 hospitalizations per 1,000 beneficiary-quarters relative to 74.1 hospitalizations per 1,000 beneficiary-quarters for the non-SASH comparison group.17 The baseline rate of all-cause ER visits and the subset of ER visits not leading to a hospitalization were slightly higher among SASH participants than among the non-SASH comparison group. Note that these baseline differences are controlled for in the regression models, but the descriptive comparisons help provide reassurance that the two populations are fairly similar in their rates of hospital visits and ER visits prior to the start of the SASH program.
| TABLE 5-2. SASH Program Effect Estimates for Utilization, Comparing SASH Program Participants to Non-SASH Comparison Beneficiaries, January 2006-June 2014 | |||||
|---|---|---|---|---|---|
| Utilization Outcome | (1) All SASH Participants (n=2,682) | (2) Early SASH Panels (n=1,049) | (3) Late SASH Panels (n=1,633) | (4) Site-Based Panels (n=1,968) | (5) Mixed Panels (n=714) |
| All-cause acute care hospitalizationsa | 1.05 (0.05) | 0.89* (0.06) | 1.12** (0.06) | 0.96 (0.06) | 1.22** (0.09) |
| All-cause ER visitsa | 1.07* (0.04) | 1.00 (0.05) | 1.09* (0.05) | 1.02 (0.04) | 1.17** (0.09) |
| ER visits not leading to a hospitalizationa | 1.06 (0.04) | 1.01 (0.05) | 1.08 (0.06) | 1.03 (0.04) | 1.13 (0.10) |
| * p0.10; ** p0.05; *** p0.01; standard errors are in parentheses. NOTES: The early SASH panel cohort is comprised of SASH participants receiving services from SASH panels that were operating before April 1, 2012. The late SASH panel cohort comprises participants receiving services from SASH panels that were operating on or after April 1, 2012. Site-based panels have greater than 50% of participants living in HUD-assisted or LIHTC housing. Mixed-panels have greater than 50% of participants living in the community.
| |||||
Regression Estimates. To answer our research question, we estimate the impact of the SASH program on the health care utilization outcomes described in Table 5-1: all-cause acute care hospitalizations; all-cause ER visits; and ER visits not leading to a hospitalization. Among the population of Medicare FFS beneficiaries who are living in HUD-assisted or LIHTC housing, we compare SASH participants to beneficiaries who are not participating in SASH. Our regression model controls for all of the beneficiary characteristics listed in Table 4-1--age, household income, household size, two measures of health status, as well as indicators for race, sex, eligibility for Medicare because of disability, dual-eligibility for Medicare and Medicaid, and ESRD--and also controls for differences in the housing properties that do not change over time. See Section 2.3.7 for further details on the non-linear model used to estimate the impact of the SASH program on the health care utilization outcomes in this section.
The results of the regression analysis are interpreted as incidence rate ratios between the SASH sample and the comparison group; these are reported in Table 5-2. Coefficients greater than 1 in the table indicate that the rate of hospital or ER visits was higher among the SASH participants relative to the comparison group. Coefficients less than 1 indicate that the utilization rate was lower among SASH participants and would signal that the SASH program was successful in reducing these adverse health events. For example, if a certain group's incidence rate ratio is 0.5, the group is said to have an expected rate of utilization that is half that of the comparison group. An incidence rate ratio of 2 would indicate a rate in the treatment group that is twice that of the comparison group. Statistically significant results in the table are denoted by an asterisk (*). The first column of Table 5-2 reports the results for all SASH participants in the sample. Columns 2 and 3 separately reports the effects of SASH on health care utilization for the early panel cohort (2) and for the late panel cohort (3). We present the results for the subset of site-based panels in column 4 and the mixed-panels in column 5.
All-cause acute care hospitalizations. There was no evidence that the SASH program significantly reduced all-cause acute care hospitalizations in the first 4 years of the program, across all SASH participants relative to the comparison group. For SASH participants in the early panels, the rate of hospitalizations among the SASH participants was 89% of the rate for the comparison group. For both the late SASH panels and the mixed SASH panels, coefficients higher than 1 indicate that the rates of hospitalization for the SASH participants were relatively higher than the rates for the comparison group.
All-cause ER visits. While we might expect to see that the SASH program reduces all-cause ER visits, the regression results indicate that the rate of all-cause ER visits was significantly higher among all SASH participants, among both those in the late panel cohort the mixed-panel cohort. There were no significant differences in the rates of all-cause ER visits for either the early panel cohort or the site-based panel cohort.
ER visits not leading to a hospitalization. When we examine ER visits not leading to a hospitalization, we do not find any significant differences in the rates between all SASH participants and the comparison group, or between any of the subsets of SASH participants and the comparison group.
Thus, we have no statistically significant evidence that the SASH program was associated with a decrease in the rates of any of the health care utilization measures for the entire population of SASH participants in the sample, across the first 4 years of the SASH program. In fact, rates of all-cause ER visits are significantly higher for the SASH participants than for the comparison group.
The lower rates in acute care hospitalizations among the SASH participants in the early panels are consistent with the reduced growth in Medicare expenditures that we observe for SASH participants in the early panel cohort (see Section 5.5).
5.3. Impacts of Support and Services at Home on Medication Problems
Do participants in the SASH program have fewer medication problems relative to their peers living in HUD-assisted and LIHTC housing but not participating in the program?
Many SASH participants are managing one or more chronic illness, as well as multiple medications that accompany those illnesses. Therefore, medication management is an important issue in the SASH program. Our evaluation of the SASH program examined issues with taking multiple medications in the annual site visits and in the mail survey of Medicare beneficiaries. See Section 2.1 for details on the qualitative data collection during the site visits; details on the beneficiary survey are available in Section 2.2. Site visits from the first 3 years of the SASH evaluation highlight that SASH staff helped participants manage their medications and also helped ensure proper usage in collaboration with the participants' health care provider. There is evidence that SASH participants experienced fewer problems with their medications compared to non-SASH Medicare beneficiaries in other HUD-assisted or LIHTC housing.
| Our analysis finds that SASH participants reported less difficulty with common medication management tasks, such as remembering to take all pills and getting refills on time. |
When enrolling in the SASH program, individuals must sign an Authorization for Use and Disclosure Agreement and undergo a comprehensive assessment that gathers information on health conditions, medications, and support services currently used or needed. The signed consent form allows SASH staff to communicate with a participant's health providers about any potential medication issues. Through the assessment, SASH staff are able to identify program participants who may have problems with their medications or need assistance with managing them. This comprehensive assessment is updated annually for SASH participants who re-enroll in the SASH program, providing the SASH staff with a yearly snapshot of the medication-related needs of their participants.
Site visit interviewees consistently reported over the 3 years of the evaluation that SASH staff provide a helpful front-line for identifying medication problems early and preventing issues caused by medication mismanagement. Wellness nurses were identified as a key resource in this area because of their medical background. Since COAs case managers and elder care clinicians18 often lack the health care backgrounds necessary to support their clients in this area, these members of the SASH Team particularly valued the assistance the wellness nurses are able to provide for medication management, such as reminding participants to take all medications, training participants in how to fill their weekly pill boxes, or reaching out to participants' providers on medication usage. However, wellness nurses' ability to provide broader support and assistance around medication management is limited by the 10 hours per week they are available for each panel. Their medication management support is also limited by their scope of practice. For example, the wellness nurse can work with a participant to teach them how to fill their weekly pill boxes, but the nurse cannot fill the pill boxes on a regular basis.
SASH coordinators and wellness nurses provide medication-related services to both site-based and community participants, with an emphasis on teaching SASH participants better self-management of their prescription drugs. For example, one wellness nurse had a participant in the community whom she was teaching how to fill her pill box. They had frequent interactions until the participant was able to properly fill her pill box on her own.
One SASH coordinator recruited pharmacy interns to assist with medication management and counseling SASH participants about their medications. This helped to relieve some of the pressure on the limited time of the wellness nurse, and it delivered these medication services to more participants. After an intern met with a participant, the intern would research the participant's medications, form a plan which was reviewed by the wellness nurse, and then follow up with the participant. The SASH coordinator reported that this was a very successful program, because the interns received additional training, the participants enjoyed interacting with the interns, and the wellness nurse could devote time to other participant concerns.
| FIGURE 5-2. Percentage of Respondents Who had Difficulty Performing Medication-Related Tasks |
|---|
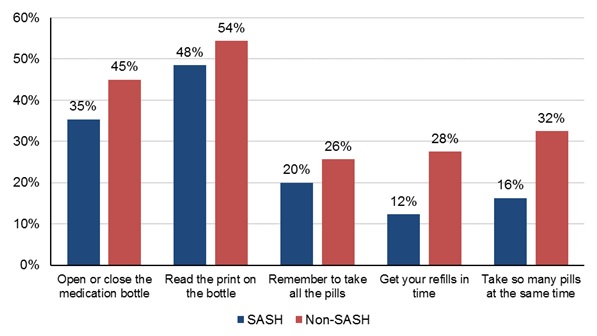 |
| NOTE: Unweighted responses from 2015 SASH beneficiary survey. |
To evaluate the impact of the SASH program on participants' difficulties with common medication management tasks, our survey of SASH participants and a comparison group of Medicare beneficiaries included questions from the BMQ (Svarstad et al., 1999). The BMQ asked questions about how difficult it was to open or close the medication bottle, read the print on the bottle, remember to take all the pills, get refills in time, and take many pills at the same time. As shown in Figure 5-2, SASH respondents indicated less difficulty with each of the five medication tasks relative to the comparison group of Medicare FFS beneficiaries in HUD-assisted or LIHTC housing, where SASH was not available. Most notably, SASH participants had much less difficulty getting their refills in time and taking multiple pills at the same time.
Answers from the BMQ survey questions were combined into a single measure, and the measure was scaled such that a higher value indicated greater difficulty in medication management tasks. Our regression analysis of this medication measure, using propensity-score weights to balance the health and demographic characteristics of the SASH participants and the comparison group beneficiaries, revealed that SASH participants had fewer problems with medication-related tasks than comparison group members (see Table 2-10). The magnitude of this effect was moderate, in the small to medium size when scaled by the standard deviation, and statistically significant.
Overall site visit findings suggest that the SASH program has provided valuable medication support to SASH participants that they otherwise would have not received. Support included communication by staff with participants' health providers to ensure appropriate and non-conflicting medications, interactions with participants to teach them about proper usage, and assistance to help participants become more self-reliant in managing and taking their medications. The SASH program has benefited the most from having the front-line assistance from coordinators and wellness nurses spending time and observing their participants' needs. While the survey results are limited by the fact that we do not have baseline information on medication management for the SASH participants and the comparison group to know how their scores compared prior to the start of the SASH program, the survey results are consistent with the efforts that SASH staff are taking to help participants better manage their medications.
5.4. Impacts of Support and Services at Home on Mini Nutritional Assessment
Do participants in the SASH program have fewer dietary problems relative to their peers living in affordable housing but not participating in the program?
To help achieve its goal of improving participant health, the SASH program seeks to empower participants to improve their nutritional and dietary habits. Our evaluation of the SASH program examined nutrition-related issues in the three annual site visits and in the survey of Medicare beneficiaries (both SASH participants and a comparison group). See Section 2.1 for details on the qualitative data collected during the site visits; details on the beneficiary survey are available in Section 2.2. Site visits from the first 3 years of the SASH evaluation highlight that program staff encourage participants to eat healthier foods, educate participants on nutrition and food labels, and connect participants to nutrition-related resources in the community. These efforts are designed to help participants access healthy food and improve their diets. However, there is no evidence from the beneficiary survey that the SASH program as a whole improved participant nutrition, compared to Medicare beneficiaries in other HUD-assisted and LIHTC housing who were not participating in the SASH program.
Nutrition is strongly linked to health status and is a significant risk factor for obesity and chronic diseases, such as diabetes and cardiovascular disease (World Health Organization, 2003). Therefore, the SASH program provides nutrition support to help lower participants' health risk. In its role as the state-level coordinator of the SASH program, CSC provides multiple training programs for SASH staff, such as the CDSMP and trainings focused on nutrition.
SASH participants may take part in group informational sessions on nutrition, receive one-on-one help from SASH coordinators and wellness nurses, and receive referrals to resources in the community, including CHT nutritionists, dietitian, and health coaches. An example of one-on-one nutritional assistance was highlighted in a Vermont Public Radio segment in May 2016, which reported on a SASH coordinator who helped participants understand food labels and the dangers of sodium (Keck, 2016). In one SASH panel, the SASH coordinator arranged cooking lessons at the local culinary school for groups of SASH participants to learn how to prepare healthy food.
The availability of nutrition-related services within each community varied across the state, with fewer resources typically being available in the more rural areas of Vermont. The COAs offer similar resources and services as the SASH Team with respect to providing nutrition-related services, which include making healthy living plans, setting goals, arranging Meals on Wheels, and making referrals for food stamps.
The CHTs became an increasingly helpful resource for the SASH program in terms of providing community resources on nutrition to help improve SASH participants' nutritional status. During the first year of the program, SASH staff built relationships with partners in the community and learned about the types of services offered by the CHTs. By the second year, some CHTs provided SASH Teams with health coaching and other support for nutritional issues. CHT resources varied by health service area, with some CHTs noting limited resources for healthy eating education. By Year Three, several wellness nurses reported making referrals to the CHT dietitian and diabetes educators. CHTs also offered group nutritional education sessions for SASH panels.
To evaluate the impact of the SASH program on the nutritional status of participants, our survey of SASH participants and a comparison group of Medicare beneficiaries included questions from the MNA to measure a beneficiary's overall nutritional status based on dietary consumption (Guigoz, 2006). The MNA asked about the number of full meals a beneficiary ate per day, whether they had experienced a loss of appetite, the types of foods consumed, fluid intake, and whether they required assistance to eat. Figure 5-3 shows mixed results in terms of whether the SASH program has improved participants' diets. SASH respondents were more likely to indicate having no loss of appetite over the past 3 months that led to a food intake decline. In addition, 86% of SASH respondents had at least one serving of dairy per day and 67% had at least two servings of fruits or vegetables per day, which were greater than the proportions for comparison beneficiaries who were not in the SASH program. However, SASH participants responded more unfavorably in a few areas, including that they were less likely to eat three full meals per day.
| FIGURE 5-3. Comparison of MNA Questions between SASH and Non-SASH Survey Respondents |
|---|
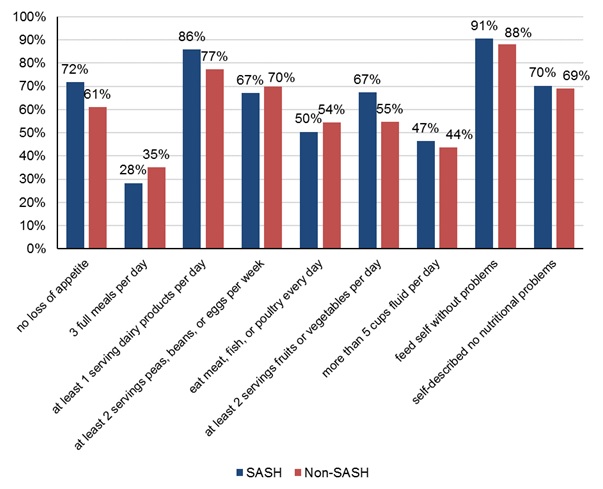 |
| NOTE: Unweighted responses from 2015 SASH beneficiary survey. |
We combined the responses to eight of the nine questions into a single score, where a higher MNA score indicates better self-reported nutrition; this is the standard method for scoring the MNA (Guigoz, 2006). Our propensity-weighted regression analysis of the survey results indicated that self-reported nutrition was not significantly different between the SASH participants and the comparison group of Medicare beneficiaries living in HUD-assisted housing (see Table 2-10 for regression output). Thus there was no evidence from the beneficiary survey that the SASH program affected participant nutritional status. Despite the work the SASH staff did linking participants to nutrition services in the community and providing information sessions on nutrition, there was no evidence that nutritional status was better among SASH participants relative to the comparison group. This could partly be because only 3% of the sample reported being malnourished, while the majority (70%) reported no nutritional problems, and the rest (27%) were uncertain as to whether they had nutritional problems. The survey results are limited by the fact that we do not have baseline information on nutritional status for the SASH participants and the comparison group to know how their scores compared prior to the start of the SASH program. Our analysis is not able to determine if the SASH participants had more nutritional problems than the comparison group prior to the SASH program.
Although there was no clear evidence from the beneficiary survey that the SASH program improved nutritional outcomes for a random sample of participants, the site visits reflected a variety of approaches that SASH coordinators and wellness nurses use to improve healthy eating habits among their participants, constrained by the availability of nutrition-related resources within each community. There is anecdotal evidence from SASH staff that the program has helped certain individuals improve their food access and nutrition.
5.5. Medicare Expenditures among Support and Services at Home Participants
What is the impact of the SASH program on Medicare expenditures?
SASH coordinators and wellness nurses emphasize prevention, nutrition, and healthy living in their work with SASH participants. Blood pressure clinics and foot clinics provided by the SASH staff help identify health problems before they lead to costly adverse health events. We would expect these efforts to result in relative reductions in the growth of Medicare expenditures, when SASH participants are compared to a similar group of non-participants. In this section, we analyze the effect of the SASH program on Medicare expenditures. There is no evidence that ER visits declined among SASH participants, but we do find that SASH participants in the early panels had lower rates of all-cause hospital admissions compared to non-SASH Medicare beneficiaries in other HUD-assisted and LIHTC housing.
The analyses in this section evaluate the effect of the SASH program on the Medicare expenditures of SASH participants, compared to similar non-participants. In these analyses, both SASH participants and individuals in the comparison group were Medicare FFS beneficiaries living in HUD-assisted or LIHTC housing, as described in Section 2.3. We use Medicare claims data from January 1, 2006, through June 30, 2015, to address the research questions.
Methods Summary. Our quantitative analysis estimates the impact of the SASH program on expenditure outcomes using regression methods. Details on the quantitative data and models used for this analysis are contained in Section 2.
For the Medicare expenditure outcomes, we use a linear version of the differences-in-differences (DID) model. We convert the PBPM results into overall aggregate dollar amounts by multiplying the regression coefficients by the total number of months that the beneficiaries participated in the SASH program. A negative DID estimate indicates that, between the baseline and intervention periods, the average change in Medicare expenditure outcomes among SASH program participants was lower by the reported amount, relative to the comparison group. Thus, negative DID estimates are indications that the SASH program was successful in reducing the growth in expenditures among SASH beneficiaries, relative to the comparison group. Positive DID estimates reflect that the average change in Medicare expenditure outcomes among SASH program participants was higher by the reported amount, relative to the comparison group.
| TABLE 5-3. Average Monthly Medicare Expenditures for SASH Participants and Non-SASH Comparison Beneficiaries in the Year Prior to SASH Enrollment and in up to 4 Years of SASH Participation | |||||
|---|---|---|---|---|---|
| Expenditure Type | Baseline | Year One | Year Two | Year Three | Year Four |
| Total Medicare | |||||
| SASH participants | $790 | $1,060 | $1,059 | $1,098 | $1,127 |
| Non-SASH comparison group | $824 | $971 | $1,030 | $1,047 | $1,074 |
| Acute care | |||||
| SASH participants | $254 | $358 | $355 | $375 | $357 |
| Non-SASH comparison group | $277 | $337 | $357 | $368 | $389 |
| Post-acute care | |||||
| SASH participants | $77 | $139 | $154 | $140 | $182 |
| Non-SASH comparison group | $100 | $130 | $144 | $138 | $131 |
| ER | |||||
| SASH participants | $41 | $55 | $56 | $50 | $58 |
| Non-SASH comparison group | $39 | $47 | $52 | $58 | $58 |
| Hospital outpatient department | |||||
| SASH participants | $172 | $185 | $182 | $201 | $204 |
| Non-SASH comparison group | $156 | $167 | $172 | $172 | $176 |
| Primary care physician | |||||
| SASH participants | $31 | $37 | $40 | $40 | $41 |
| Non-SASH comparison group | $27 | $31 | $33 | $35 | $36 |
| Specialty care physician | |||||
| SASH participants | $58 | $61 | $57 | $61 | $60 |
| Non-SASH comparison group | $52 | $54 | $55 | $54 | $55 |
| Hospice | |||||
| SASH participants | $1 | $7 | $12 | $30 | $20 |
| Non-SASH comparison group | $2 | $11 | $15 | $15 | $17 |
| NOTES: Average expenditures are weighted by propensity-score weights for the comparison groups and eligibility fraction for all Medicare beneficiaries. SASH program beneficiaries limited to Medicare FFS beneficiaries receiving housing assistance reported in PIC or TRACS data bases and/or living in a LIHTC property and participating in the SASH program. Non-SASH, Blueprint for Health comparison beneficiaries includes Medicare FFS beneficiaries receiving housing assistance reported in PIC or TRACS data bases and/or living in a LIHTC property and not participating in the SASH program or living in a housing property that hosted the SASH program. | |||||
Descriptive Statistics. In Table 5-3 we present the weighted average monthly Medicare expenditures for the SASH program beneficiaries and the comparison group.19 For the SASH treatment group, we report the average monthly Medicare expenditures during a baseline period that occurs 12 months prior to the participant's first enrollment in the SASH program, and then the average monthly expenditures for each of the 4 possible years of the SASH program. Because Medicare beneficiaries are enrolling in SASH throughout the 4-year period considered in this analysis, the Year Four averages reflect only SASH participants who have been enrolled for 4 years. These descriptive statistics help to establish that our intervention and comparison groups have similar Medicare expenditures at baseline, supporting the validity of the comparison group. We anticipate that the SASH program may help reduce the growth in some of these categories of Medicare expenditures.
It is interesting to note that total Medicare expenditures largely consist of expenditures to acute care hospitals and expenditures to hospital outpatient departments. Together, these two expenditure categories accounted for more than half of all Medicare expenditures in all time periods, for both the SASH participants in our sample and the non-SASH comparison beneficiaries.
During the baseline period, average monthly Medicare expenditures measured at the beneficiary level were somewhat higher among the non-SASH comparison group, compared to SASH participants ($824 vs. $790); acute care expenditures were also a little higher among the non-SASH comparison group ($277 vs. $254). ER, primary care physician, and specialty care physician expenditures were very similar between SASH participants and comparison beneficiaries. Note that these baseline differences are controlled for in the regression models, but the descriptive comparisons help provide reassurance that the two populations are fairly similar in their baseline Medicare expenditures.
Regression Estimates. To answer our research question, we estimate the impact of the SASH program on the health care expenditure outcomes listed in Table 5-3. Among the population of Medicare FFS beneficiaries who are living in HUD-assisted or LIHTC housing, we compare SASH participants to beneficiaries who are not participating in SASH. Our regression model controls for all the beneficiary characteristics listed in Table 4-1--age, household income, household size, two measures of health status, as well as indicators for race, sex, eligibility for Medicare because of disability, dual-eligibility for Medicare and Medicaid, and ESRD--and also controls for differences in the housing properties that do not change over time. See Section 2.3.6 for further details on the model used to estimate the impact of the SASH program on the Medicare expenditure outcomes in this section.
The results of the regression analysis are interpreted as DID estimates in the Medicare expenditures between the SASH sample and the comparison group. Medicare results for all SASH participants, for those in early panels or late panels, and for those in site-based or mixed-panels are reported in Table 5-4. Positive coefficients in the table indicate that the growth in expenditures was faster among the SASH participants relative to the comparison group. Negative coefficients indicate that the growth in expenditures was slower among SASH participants and signal that the SASH program was successful in reducing the growth of these expenditures. Statistically significant results in the table are denoted by asterisks (*).
| TABLE 5-4. Overall DID Estimates for 8 Categories of Medicare Expenditures, Comparing SASH Program Participants to Non-SASH Comparison Beneficiaries: January 2006-June 2015 | |||||
|---|---|---|---|---|---|
| Expenditure Type | (1) All SASH Participants (n=2,682) | (2) Early SASH Panels (n=1,049) | (3) Late SASH Panels (n=1,633) | (4) Site-Based Panels (n=1,968) | (5) Mixed Panels (n=714) |
| Total Medicare | $1,936,020 | -$3,196,323** | $3,627,495** | -$1,107,075 | $1,944,111 |
| Acute care | $223,455 | -$1,423,260* | $887,175 | -$1,122,693 | $760,419 |
| Post-acute care | $1,099,980 | -$331,626 | $1,167,021** | $221,349 | $661,158* |
| ER | $186,321 | -$119,025 | $236,478* | $54,759 | $105,270 |
| Hospital outpatient department | -$471,219 | -$430,800 | -$32,361 | -$450,270 | -$60,927 |
| Primary care physician | $127,140 | -$1,239 | $105,756 | $66,585 | $47,886 |
| Specialist physician | -$81,645 | -$148,563* | $17,439 | -$104,049 | -$23,142 |
| Hospice care | -$100,962 | -$84,141 | -$37,569 | -$56,250 | -$77,385 |
| * p0.10; ** p0.05; *** p0.01; standard errors are in parentheses. NOTES: Aggregate totals equal the estimated DID coefficient multiplied by the total number of beneficiary-quarters observed during the period of SASH participation. Beneficiary-quarters refer only to persons included in the DID model. The early SASH panel cohort comprises SASH participants receiving services from SASH panels that were operating before April 1, 2012. The late SASH panel cohort comprises participants receiving services from SASH panels that were operating on or after April 1, 2012. Site-based panels have greater than 50% of participants living in HUD-assisted or LIHTC housing. Mixed-panels have greater than 50% of participants living in the community. | |||||
The first column of Table 5-4 reports the results for all SASH participants in the sample. Columns 2 and 3 separately report the effects of SASH on Medicare expenditure growth for the early panel cohort (2) and for the late panel cohort (3). We present the results for the subset of site-based panels in column 4 and the mixed-panels in column 5.
The estimates in this table have been converted to total dollar amounts, to reflect the total impact of the SASH program on Medicare expenditures in these categories. These values are calculated by multiplying the DID estimates on the monthly Medicare expenditures by the number of total months that SASH participants were participating in the SASH program. For example, the DID estimate for the change in monthly expenditures across all SASH participants was $28.84; all 2,682 SASH participants spent a total of 67,130 months (or an average of 2.1 years) in the SASH program, leading to an overall DID effect of $1,936,020.
Total Medicare expenditures. Among all SASH participants, there is no significant reduction in the growth of total Medicare expenditures, relative to the comparison group. For the early panel cohort, the SASH program reduced the growth in total Medicare expenditures by a total of $3,196,323 across the first 4 years of the SASH program. This significant result is consistent with the findings in the First and Second Annual Reports. Neither site-based panels nor mixed-panels exhibit significant reductions in total Medicare expenditure growth; for late SASH panels, growth in total Medicare expenditures is significantly higher relative to the comparison group.
Acute care expenditures. SASH participants in the early panels had significantly slower growth in acute hospital care expenditures; Medicare expenditure growth in this category was $1,423,260 lower among SASH participants. This amount accounts for almost half of the slower total Medicare expenditure growth. There was no evidence that the SASH program significantly reduced the growth rate of acute care expenditures in the first 4 years of the program, for all SASH participants relative to the comparison group, or for participants in any of the other subsets of SASH panels.
Post-acute care expenditures. When we examine post-acute care expenditures, we find that participants in both late SASH panels and mixed SASH panels have significantly faster growth in post-acute care expenditures.
ER expenditures. The growth rate in ER expenditures is $236,478 higher for the SASH participants in the late panel cohort than for the comparison group, but all other subsets of SASH participants do not have a significant difference in ER expenditure growth, nor does the entire sample of SASH participants.
Hospital outpatient expenditures. When we examine hospital outpatient expenditures, we do not find any significant differences between the SASH participants and the comparison group, or among any of the subsets of SASH participants and the comparison group.
Primary care physician expenditures. Among all SASH participants, there is no significant reduction in the growth of primary care physician expenditures, relative to the comparison group. Also, no subset of SASH panels exhibits significant reductions in primary care physician expenditure growth.
Specialist physician expenditures. For the early panel cohort, the SASH program reduced the growth in specialist physician expenditures by $148,563 across the first 4 years of the SASH program. No other subset of SASH panels exhibits significant reductions in specialist physician expenditure growth.
Hospice care expenditures. There is no evidence that the SASH program increases or decreases the rate of growth in hospice care expenditures among all SASH participants relative to the comparison group, or among any of the subsets of SASH participants and the comparison group.
Based on the results in Table 5-4, we have no statistically significant evidence that the SASH program was associated with a decrease in the growth of any of the examined Medicare expenditure measures for the entire population of SASH participants in the sample, across the first 4 years of the SASH program. When we report the results for the early panel cohort separately, we do find significantly slower PBPM growth in total Medicare expenditures, acute care expenditures, and specialist physician expenditures.
There are no significant decreases in the growth in Medicare expenditures relative to the comparison group when site-based panels and mixed-panels are considered separately. At this point in the evaluation, we can draw no inferences on any differences in the effect of the SASH program on site-based versus mixed-panels.
Another way to answer our research question regarding how the panel characteristics affect the SASH panel's effectiveness in reducing the growth of Medicare expenditures is to examine the yearly DID estimates, as seen in Table 5-5. We estimate the same model as in Table 5-4, and note that the "All Years Combined" results in the fifth row of Table 5-5 (included for reference) are the same as the ones used to calculate the Total Medicare results in the first row of Table 5-4. The All Years Combined results in the fifth row can be thought of as a weighted average of results for Years One, Two, Three, and Four. Note that for the late panels, Year One results include data for only a few participants in the last quarter of Year One.
| TABLE 5-5. Yearly DID Estimates for Monthly Medicare Expenditures, Comparing SASH Program Participants to Non-SASH Comparison Beneficiaries: January 2006-June 2015 | |||||
|---|---|---|---|---|---|
| Year | (1) All SASH Participants (n=2,682) | (2) Early SASH Panels (n=1,049) | (3) Late SASH Panels (n=1,633) | (4) Site-Based Panels (n=1,968) | (5) Mixed Panels (n=714) |
| Year One | -17.13 (77.26) | -63.94 (93.31) | -135.02 (100.79) | -49.41 (81.43) | 161.60 (245.81) |
| Year Two | 109.87* (62.69) | -54.04 (81.13) | 213.89** (93.60) | 59.91 (70.53) | 155.39 (146.84) |
| Year Three | 1.84 (53.02) | -109.70 (72.39) | 62.31 (65.72) | -52.25 (59.67) | 116.96 (94.58) |
| Year Four | 1.99 (50.86) | -144.14** (61.85) | 83.73 (60.04) | -47.20 (57.71) | 106.09 (85.92) |
| All years combined | 28.84 (37.85) | -102.29** (47.89) | 101.12** (45.77) | -21.70 (42.96) | 120.67 (74.68) |
| * p0.10; ** p0.05; *** p0.01; standard errors are in parentheses. | |||||
As in Table 5-4, the results of the regression analysis are interpreted as DID in the Medicare expenditures between the SASH sample and the comparison group. Positive coefficients in the table indicate that the growth in Medicare expenditures was higher among the SASH participants relative to the comparison group in that particular year (or in all years in the All Years Combined row). Negative coefficients indicate that the growth in Medicare expenditures was slower among SASH participants and signal that the SASH program was successful in reducing the growth of these Medicare expenditures. Statistically significant results in the table are denoted by asterisks (*).
The first column of Table 5-5 reports the results for all SASH participants in the sample. Columns 2 and 3 separately report the effects of SASH on Medicare expenditure growth for the early panel cohort (2) and for the late panel cohort (3). We present the results for the subset of site-based panels in column 4 and the mixed-panels in column 5.
Year One. Among all SASH participants, and among all subsets of SASH participants, there was no significant reduction in the growth of total Medicare expenditures in Year One, relative to the comparison group.
Year Two. The rate of growth of total Medicare expenditures was $109.87 higher among all SASH participants relative to the comparison group. For the late panel, we also report significantly higher growth in total Medicare expenditures in Year Two, which may indicate unmet demand for health care that was recognized at the start of SASH participation. Keep in mind that, for the late panels, Year Two was essentially the first year of implementation.
Year Three. Among all SASH participants, and among all subsets of SASH participants, there was no significant reduction in the growth of total Medicare expenditures in Year Three, relative to the comparison group.
Year Four. For early panels, the rate of growth of total Medicare expenditures was $144.14 slower in Year Four, but no subgroup of panels showed significantly slower expenditure growth.
We have no statistically significant evidence that the SASH program was associated with a slower rate of total Medicare expenditure growth for the entire population of SASH participants in the sample, across the first 4 years of the SASH program combined, or looking at each year separately. When we report the results for early panel cohorts and late panels cohorts separately, we find that the slower growth rate in total Medicare expenditures for the early panel cohort was particularly strong in Year Four. This is consistent with the idea that panels need a certain amount of start-up time before their implementation of the SASH program becomes fully effective.
When site-based panels and mixed-panels are considered separately, we find no statistically significant reductions in total Medicare expenditure growth for either type of panel. This contrasts our results in the Second Annual Report, where site-based panels showed significant reductions in Medicare expenditure growth in Year Three. As we have expanded our sample beyond beneficiaries participating in the MAPCP and included SASH participants who have more recently joined, those additional SASH participants do not appear to be experiencing the same reduced rate of Medicare expenditure growth.
5.6. Support and Services at Home Funding Sources
How is the SASH program financed? Are the SASH program costs potentially offset by reductions in other public program spending?
The SASH program receives financial support from a variety of sources. As the state coordinator, CSC is responsible for overseeing and securing funds for the program as a whole. At the regional level, DRHOs are encouraged to solicit additional funds from local organizations for ongoing support for their panels. CMS was the largest funding source, which made a PBPM payment to the SASH program through the MAPCP Demonstration until the end of the demonstration in December 2016.20 The MAPCP Demonstration funding was initially used to provide $70,000 in annual funding for each panel, to cover the cost of the SASH coordinator and the wellness nurse. However, the federal budget sequestration of 2013 reduced the MAPCP funding from CMS by 2%, which meant that the annual funding available for each panel was reduced to $68,600 from April 2013. Other program costs are covered through a variety of sources. Medicaid is the second largest contributor, providing funds at both the federal and state levels. Other sources include DAIL, DVHA, the Department of Health, and various foundations and grants. These sources represent the funding for the SASH program and not the actual health or long-term care services coordinated and arranged for as part of the SASH program.
In Table 5-6, we present two snapshots of the financial support provided for the SASH program. Representatives of CSC provided these figures to the evaluation team in two separate quarterly calls. The 2013 figures reflect the funding for the 26.5 panels that were in operation at the time, but by 2016, the program had doubled, expanding to 54 panels.
| TABLE 5-6. SASH Funding Sources in 2013 and 2016 | ||
|---|---|---|
| SASH Funding Sources | 2013 (26.5 panels) | 2016 (54 panels) |
| Medicare (through MAPCP)--SASH coordinators and wellness nurses | $2,015,416 | $3,704,400 |
| Medicaid (leveraged savings)--Statewide and regional coordination of SASH program | $438,222 | $648,200 |
| DAIL--Housing and Supportive Services program grantees | $325,823 | $325,823 |
| DVHA--Development and coordination of a statewide information technology infrastructure | $130,000 | $205,000 |
| Department of Health--Community Transformation Grants (awarded by CDC) to 2 DRHOs for hypertension and tobacco-cessation activities | $189,000 | $60,056 |
| Foundations--Support implementation and coordination | $175,000 | $125,000 |
| Total | $3,282,608 | $5,068,479 |
We calculate the per-beneficiary cost of the SASH program by summing the number of months that each of the participants was enrolled in the program in 2013 (2016), dividing by 12 to get the number of SASH participant years in 2013 (2016), and then dividing the 2013 (2016) funding total from Table 5-6 by the number of SASH participant years in that same calendar year. The results were that the annual per-beneficiary cost of SASH was about $1,500 per-participant in 2013, and $1,200 per-participant in 2016. These declining per-participant costs reflect that there were likely efficiencies as the SASH program expanded, and the state coordination activities of CSC did not have to double as the number of panels and participants doubled.
5.7. Costs of Support and Services at Home to Participating Properties
Are there any costs to participating properties, such as increased demands on employees or increased property maintenance costs? If so, how do SASH program costs compare with the reductions (if any) in other public program spending, specifically Medicare?
Each SASH panel received $68,600 annually through the MAPCP Demonstration.21 This funding covered only the SASH coordinator and wellness nurse and could not be used to cover other expenses associated with operating the SASH panel, such as mileage to visit community participants, office equipment and supplies, or supplies for program activities. To determine the magnitude of additional costs that properties participating in SASH might face, we fielded a cost survey to eight property owners who were housing hosts in the SASH program. The cost survey asked about start-up and ongoing costs of operating a SASH panel. See Section 2.1 for additional details on the methodology for the SASH panel cost survey.
We found that the full cost to operate a SASH panel in 2015 for our eight survey respondents ranged from approximately $76,100-$103,850. The panel with annual operating costs of $103,850 was an outlier compared to all other survey respondents because of the fact that the panel had an additional funding source, which allowed it to increase the wellness nurse hours from 10 hours (on which the MAPCP Demonstration funding level was based) to 15 hours and to supplement additional cost areas such as programming and activities. The total annual operating costs for the seven other responding SASH panels ranged from approximately $76,100-$83,300.
Given that each panel receives $68,600 through the MAPCP Demonstration, this leaves an annual operating cost gap of approximately $7,500-$35,250 that the respondent panels must cover through additional funding sources. When we exclude the panel that reported having an additional funding source to increase the wellness nurse hours to 15 hours, the cost gap is reduced to approximately $7,500-$14,700, which better portrays the gap to operate a panel at the basic level (i.e., 10 hours of wellness nursing).
The MAPCP Demonstration funding level of $68,600 assumed a full-time SASH coordinator and quarter-time wellness nurse. For most of the panels surveyed, however, this amount did not completely cover the cost (including salary and benefits) of both staff members. Panels either supplemented the MAPCP Demonstration funding with funding from additional sources or provided fewer wellness nursing hours. In various interviews with SASH stakeholders, it was mentioned that the hourly rate to contract the wellness nurse is higher than was assumed in developing the MAPCP Demonstration funding level.
Common additional operating expenses across the surveyed panels included cell phones; mileage for SASH staff to travel between multiple housing sites in certain panels, visit participants in the community, and attend meetings and trainings; equipment and supplies for program activities; and office supplies. Several of the survey respondents also noted costs for professional liability insurance.
The operating expenses reflected in the survey may not necessarily reflect the complete cost to operate the panel in a desired manner. For example, in interviews with SASH staff, some mentioned that their travel to visit participants or attend meetings or trainings is curtailed because they have limited funding. Some also mentioned wanting to implement certain programming or activities but not having funding to pay individuals to deliver it or to purchase needed equipment or supplies.
The surveyed SASH panels reported start-up costs to launch the panel ranging from zero to $2,100. Reported start-up costs were primarily related to the purchase of equipment, if needed. Several panels that responded purchased a computer and/or iPad. Some also reported purchasing office equipment such as desks, file cabinets, and printers.
The cost survey results indicate that, for the panels surveyed, operating a SASH panel with 10 (or fewer) hours for the wellness nurse and a full-time SASH coordinator costs between $76,100 and $83,300 per year. Our site visit interviewees regularly cited the limited number of wellness nurse hours as one of the challenges in the SASH program. While we cannot infer too much from a single observation, the $103,850 in costs for the SASH panel with additional wellness nurse hours provides some of idea of what the cost of an enhanced SASH model would be.
6. CONCLUSION
In this evaluation of the SASH program, the RTI/LeadingAge team addressed the core research questions of interest to ASPE, HUD, and ACL: (1) "Can coordinated health and supportive services to older adults in affordable housing improve quality of life, health, and functional status?" and (2) "Are there differences in health care and housing costs for seniors who receive coordinated services in an affordable housing setting?" Our analysis combined data from interviews with SASH staff, key stakeholders and community partners; a survey of SASH participants and a comparison group of Medicare beneficiaries; and health care and utilization expenditure data from Medicare claims to answer these questions.
From both our interviews with SASH staff and our analysis of the SASH participant survey, we find evidence that the SASH program had a positive impact of the health and functional status of participants. Additionally, SASH participants reported fewer issues with managing their multiple medications, which is consistent with training SASH staff provided to participants on medication management, both in group programming and in one-on-one interactions.
The impact of the SASH program on the growth of Medicare expenditures varied across different panels. Site-based participants in the early panels--representing 40% of site-based SASH participants who were Medicare beneficiaries--experienced significantly slower growth in Medicare expenditures relative to a comparison group of similar Medicare beneficiaries; for these participants, growth in annual Medicare expenditures was slower by an estimated $1,227 per-beneficiary per year. However, for the SASH participants living in the HUD-assisted or LIHTC housing sites in the later panels, we found no evidence that Medicare cost growth was significantly slower. Consequently, across all of the SASH participants, we found no evidence that the SASH program slowed the growth of Medicare expenditures. For the participants in the early panels, we observed a shift in health care services, as they had lower rates of acute care hospitalization and slower growth in Medicare expenditures for both hospitalizations and specialist physicians following their enrollment in the SASH program.
When we examined housing issues, our discussions with property managers indicated that the SASH staff were valued assets to most property managers. SASH coordinators and wellness nurses aided residents with health concerns and provided connections with services that helped to reduce evictions.
An additional goal of our evaluation was to provide guidance and lessons learned for the implementation of SASH-like models in other settings. The successes of the SASH program included the partnerships that the SASH staff were able to build with other organizations and resources in the community. Also, the training program for SASH staff developed by CSC was highly regarded. The challenges of expanding the SASH program into the community and the costs of the SASH program to various stakeholders represented some of the important lessons learned.
The expansion of the SASH program beyond the housing sites and into the community faced many challenges. Many community partners expressed concerns about perceived duplication of services. SASH staff noted that participants living in the community (instead of in the SASH housing sites) had greater health and support needs and fewer resources to obtain the supports they required. Our claims data analysis confirmed that SASH participants in the community were older and in poorer health relative to the site-based participants. Any future SASH-like programs seeking to serve a widely dispersed population in the community should be aware of the possibility that these community participants could have additional needs and require additional resources to meet those needs.
CMS (through the MAPCP Demonstration) was the primary funding source for the SASH program from July 2011 to December 2016; their PBPM payments covered the salaries of the SASH coordinators and wellness nurses. CSC was able to leverage additional funds from Medicaid and other Vermont agencies and foundations to cover the administrative costs of implementing and overseeing the SASH program statewide. Based on our survey of host properties, we also found that there were between $7,500 and $15,000 in additional costs each year for the housing properties to host an individual SASH panel.
The SASH program is designed to promote greater care coordination for a high-cost population of older adults and individuals with disabilities living in affordable housing properties. The program's unique contribution is its use of teams embedded in affordable housing properties as a platform to connect residents to health services and social supports. The evaluation identified many successes attributable to the SASH program and also challenges to consider when implementing a similar housing with services program.
Our continuing research efforts will follow the transition of the SASH program from its role in the MAPCP Demonstration to its role in Vermont's all-payer ACO. Having identified a group of SASH panels that has been successful in slowing the growth of health care expenditures for participants, we will focus our research efforts on which characteristics of those SASH panels are contributing to the slower growth in health care expenditures. We also plan to evaluate the impact of the SASH program on use of long-term care services and Medicaid expenditures among SASH participants.
REFERENCES
Austin, P.C. (2011). An introduction to propensity score methods for reducing the effects of confounding in observational studies.Multivariate Behavioral Research, 46(3), 399-424. http://dx.doi.org/10.1080/00273171.2011.568786.
Dolan, P. (1997). Modeling valuations for EuroQol health states. Medical Care, 35(11), 1095-1108. http://dx.doi.org/10.1097/00005650-199711000-00002.
EuroQol, EQ-5D. http://www.euroqol.org/. Accessed June 1, 2016.
Guigoz, Y. (2006). The Mini Nutritional Assessment (MNA) review of the literature--What does it tell us? Journal of Nutrition, Health and Aging, 10, 466-487.
Hays R.D. (1998). RAND-36 Health Status Inventory. San Antonio, TX: The Psychological Corporation. Index of Independence in Activities of Daily Living (Katz Index of ADL). https://www.healthcare.uiowa.edu/igec/tools/function/katzADLs.pdf. Accessed August 3, 2016.
Jenkins, C.R., & Dillman, D.A. (1997). Towards a theory of self-administered questionnaire design. In L. Lyberg, P. Biemer, M. Collins, E.D. De Leeuw, C. Dippo, N. Schwarz, & D. Trewin (Eds.), Survey measurement and process quality (pp. 165-196). New York, NY: Wiley-Interscience. http://dx.doi.org/10.1002/9781118490013.ch7.
Katz, S., Ford, A.B., Moskowitz, R.W., Jackson, B.S., & Jaffe, M.W. (1963). The Index of ADL: A standardized measure of biological and psychological function. Journal of the American Medical Association, 185(12), 914-919. http://dx.doi.org/10.1001/jama.1963.03060120024016.
Keck, N. Vermont's Innovative Elder Care Program, SASH, Cited as A National Model. Vermont Public Radio. May 24, 2016. http://digital.vpr.net/post/vermonts-innovative-elder-care-program-sash-cited-national-model#stream/0. Accessed September 18, 2016.
RAND Health, 12-Item Short Form Survey (SF-12). http://www.rand.org/health/surveys_tools/mos/12-item-short-form.html. Accessed June 1, 2016.
Shaw, J.W., Johnson, J.A., & Coons, S.J. (2005). U.S. valuation of the EQ-5D health states: Development and testing of the D1 valuation model. Medical Care, 43(3), 203-220. http://dx.doi.org/10.1097/00005650-200503000-00003.
Svarstad, B.L., Chewning, B.A., Sleath, B.L., & Claesson, C. (1999). The Brief Medication Questionnaire: A tool for screening patient adherence and barriers to adherence. Patient Education and Counseling, 37(2), 113-124. http://dx.doi.org/10.1016/S0738-3991(98)00107-4.
World Health Organization (2003). Diet, nutrition and the prevention of chronic diseases, Report of the joint WHO/FAO expert consultation, WHO Technical Report Series, No. 916 (TRS 916). Retrieved from http://apps.who.int/iris/bitstream/10665/42665/1/WHO_TRS_916.pdf.
NOTES
-
A complete list of housing organization participating in SASH is available at http://sashvt.org/admin/.
-
For example, if a SASH participant is admitted to the hospital, that participant's physicians have permission to involve the SASH coordinator and wellness nurse in discharge planning for the participant. For an individual who does not consent, his or her physicians would not be able to involve the SASH Team in discharge planning, or even alert them to the hospitalization.
-
As described in more detail in Section 4, for the purposes of this evaluation, residents of "HUD-assisted or LIHTC housing" are defined as those who are receiving housing assistance reported in Public and Indian Housing Information Center (PIC) or Tenant Rental Assistance Certification System (TRACS) data bases and/or living in an LIHTC property.
-
The TRACS is for all properties assisted through programs run by HUD's Office of Multifamily Housing (Section 202, Section 236, Section 8, etc.); the PIC is the program for public housing and housing choice vouchers; and the LIHTC is the program for low-income housing developed through tax credits. See Section 4 for more information on these data sources.
-
This excludes 46 participants associated with 2.5 panels identified by CSC as community panels (i.e., panels not based in SASH housing sites). These panels include Addison--Shoreham/Orwell, Bennington--Northshire, Rutland--Castleton/Fair Haven.
-
For LIHTC records, only the last four digits of the SSN are available.
-
That formula equals one over the maximum number of matches sought (i.e., 1/5, or 0.2) times the total number of times the comparison group beneficiary was matched to a SASH participant.
-
Not all residents of LIHTC housing are receiving HUD-assistance; as shown in Table 4-2, the average income in LIHTC buildings that host the SASH program is higher than the average income in HUD-assisted properties reported in the PIC and TRACS data bases.
-
The original end date of the MAPCP Demonstration in Vermont was June 30, 2014, but was extended to December 31, 2014; it was then extended a second time to December 31, 2016.
-
For details see https://innovation.cms.gov/initiatives/vermont-all-payer-aco-model/.
-
About one-quarter of SASH participants were Medicare FFS beneficiaries living in the community, over 55% of participants were site-based Medicare FFS beneficiaries, and the remaining 20% of participants were not Medicare FFS beneficiaries. See Figure 4-1 in Section 4.1 for further details.
-
The SASH program previously used DocSite, Vermont's clinical data registry, but transitioned to Care Navigator in August 2016. At this time, the Blueprint for Health completed reconstitution of DocSite to the Blueprint Clinical Registry, newly hosted by Vermont Information Technology Leaders, the state's Health Information Exchange provider.
-
This excludes Housing Choice Voucher recipients in the PIC data base. Voucher recipients were excluded unless they were otherwise identified as living in a HUD-assisted or LIHTC property.
-
A total of 1,130 participants were excluded based on this criterion. See Figure 4-1.
-
As shown in Figure 4-1 in the previous section, 80% of all SASH participants were Medicare FFS beneficiaries. Community SASH participants are 30% of the Medicare FFS participants, and about one-quarter of all SASH participants.
-
Figure 4-1 reports that we identified 1,130 community SASH participants, but 65 were not included in this descriptive analysis because of missing data.
-
Another way of understanding 64.9 hospitalizations per 1,000 beneficiary-quarters is to convert to years. Across the baseline year, for every 250 SASH participants, there were 64.9 hospitalizations, or for every 1,000 SASH participants, there were about 260 hospitalizations.
-
Elder care clinicians may be social workers, psychologists, or mental health professionals; they are not physicians.
-
The monthly expenditures are calculated by summing the expenditures for the quarter and dividing by 3 to produce monthly values.
-
While the MAPCP funding for the SASH program ended in December 2016, the approved all-payer ACO model is expected to continue to fund the SASH program.
-
Funding for the SASH program through the MAPCP Demonstration lasted through the end of the MAPCP Demonstration in December 2016.
Support and Services at Home (SASH) Evaluation
This report was prepared under contract #HHSP23337006T between the U.S. Department of Health and Human Services (HHS), Office of Disability, Aging and Long-Term Care Policy (DALTCP) and RTI International. For additional information about this subject, you can visit the DALTCP home page at http://aspe.hhs.gov/office-disability-aging-and-long-term-care-policy-daltcp or contact the ASPE Project Officer, Emily Rosenoff, at HHS/ASPE/DALTCP, Room 424E, H.H. Humphrey Building, 200 Independence Avenue, S.W., Washington, D.C. 20201. Her e-mail addresses is: Emily.Rosenoff@hhs.gov.
Reports Available
Support and Services at Home (SASH) Evaluation: First Annual Report
- Full HTML: https://aspe.hhs.gov/report/support-and-services-home-sash-evaluation-first-annual-report
- Full PDF: https://aspe.hhs.gov/pdf-report/support-and-services-home-sash-evaluation-first-annual-report
Support and Services at Home (SASH) Evaluation: Second Annual Report
- Full HTML: https://aspe.hhs.gov/basic-report/support-and-services-home-sash-evaluation-second-annual-report
- Full PDF: https://aspe.hhs.gov/pdf-report/support-and-services-home-sash-evaluation-second-annual-report
Support and Services at Home (SASH) Evaluation: Highlights from the First Four Years Research Summary
- Full HTML: https://aspe.hhs.gov/basic-report/support-and-services-home-sash-evaluation-highlights-first-four-years-research-summary
- Full PDF: https://aspe.hhs.gov/pdf-report/support-and-services-home-sash-evaluation-highlights-first-four-years-research-summary
Support and Services at Home (SASH) Evaluation: Evaluation of the First Four Years