
Amy Kandilov, Vincent Keyes, Noëlle Siegfried, Patrick Edwards, Ann Larsen, Kevin Smith, Celia Eicheldinger, Nancy McCall, Martijn Van Hasselt, and Doug Raeder
RTI International
Alisha Sanders and Robyn Stone
LeadingAge
Printer Friendly Version in PDF Format (71 PDF pages)
ABSTRACT
This memorandum describes the ongoing implementation and impacts of a program the Support and Services at Home (SASH) program. The program is intended to improve health and decrease health care expenditures among elderly residents of affordable housing developments. Using claims data for a sample of Medicare fee-for-service (FFS) beneficiaries, the evaluation analyzed health care utilization and expenditures among SASH participants and a comparison group of Medicare beneficiaries living in affordable housing properties in Vermont. Impact estimates in this memorandum are based on the first 3 years of the implementation of the SASH program, from July 2011 through June 2014.
DISCLAIMER: The opinions and views expressed in this report are those of the authors. They do not necessarily reflect the views of the Department of Health and Human Services, the contractor or any other funding organization.
TABLE OF CONTENTS
1. INTRODUCTION
- 1.1. Support and Services at Home Program Overview
- 1.2. Vermont Multi-payer Advanced Primary Care Practice Demonstration
2. QUALITATIVE IMPLEMENTATION FINDINGS
- 2.1. Support and Services at Home Community Partner Relationships
- 2.2. Support and Services at Home Training
- 3.1. Data
- 3.2. Evaluation Property and Beneficiary Sample
- 3.3. Property Characteristics
- 3.4. Participant Characteristics
- 4.1. Methods
- 4.2. Support and Services at Home Program Outcomes Analysis
5. CONCLUSION
APPENDICES
- APPENDIX A: Qualitative Data and Methods
- APPENDIX B: Support and Services at Home Team Training
- APPENDIX C: Quantitative Data and Methods
- APPENDIX D: Assignment Criteria for Beneficiaries in the Multi-payer Advanced Primary Care Practice Demonstration
- APPENDIX E: Secondary Analysis
LIST OF FIGURES
FIGURE 3-1: Total SASH Participants and SASH Participants Included in the Quantitative Analysis
LIST OF TABLES
TABLE 3-1: Characteristics of Properties in which Medicare FFS SASH Program Participants and Comparison Group Beneficiaries Reside
TABLE 3-2: Average Baseline Demographic Characteristics and Health Status for SASH Medicare FFS Participants, and Unweighted and Weighted Average Demographic Characteristics and Health Status for Non-SASH Medicare FFS Blueprint for Health Beneficiaries
TABLE 4-1: Average Quarterly PBPM Medicare Expenditures for SASH Participants and Non-SASH Comparison Beneficiaries for the Baseline Period July 2010-June 2011
TABLE 4-2: Overall DID Estimates for PBPM Six Categories of Medicare Expenditures, Comparing SASH Program Participants to Non-SASH Comparison Beneficiaries, January 2006-June 2014
TABLE 4-3: Yearly DID Estimates for Total PBPM Medicare Expenditures, Comparing SASH Program Participants to Non-SASH Comparison Beneficiaries: January 2006-June 2014
TABLE 4-4: Quarterly Average Utilization of Services for SASH Participants and Non-SASH Comparison Beneficiaries for the Baseline Period July 2010-June 2011
TABLE 4-5: SASH Program Effect Estimates for Utilization, Comparing SASH Program Participants to Non-SASH Comparison Beneficiaries, January 2006-June 2014
TABLE A-1: Number of Interviews by Type for the SASH Evaluation Second Annual Site Visit
TABLE C-1: Number of Persons Starting Participation in SASH
TABLE E-1: Characteristics of Properties in which Medicare FFS SASH Program Participants and Comparison Group Beneficiaries Reside
TABLE E-2: Unweighted and Weighted Baseline Demographic Characteristics and Health Status for SASH Participants and Non-SASH, Non-PCMH Comparison Group Beneficiaries
TABLE E-3: Average Quarterly PBPM Medicare Expenditures for SASH Participants and New York Non-PCMH Comparison Beneficiaries for the Baseline Period July 2010-June 2011
TABLE E-4: DID Estimates for PBPM Medicare Expenditures, Comparing SASH Program Participants to New York Non-PCMH Comparison Beneficiaries
TABLE E-5: Quarterly Average Utilization of Services for SASH Participants and New York Non-PCMH Comparison Group Beneficiaries for the Baseline Period July 2010-June 2011
TABLE E-6: SASH Program Effect Estimates for Utilization, Comparing SASH Program Participants to New York Non-PCMH Comparison Beneficiaries
ACRONYMS
The following acronyms are mentioned in this report and/or appendices.
| AAA | Area Agency on Aging |
|---|---|
| ACL | HHS Administration for Community Living |
| ARC | Actuarial Research Corporation |
| ASPE | HHS Office of the Assistant Secretary for Planning and Evaluation |
| CAH | Critical Access Hospital |
| CDSMP | Chronic Disease Self-Management Program |
| CHT | Community Health Team |
| CMS | HHS Centers for Medicare and Medicaid Services |
| COA | Council on Aging |
| CPT | Current Procedural Terminology |
| CSC | Cathedral Square Corporation |
| DAIL | Vermont Department of Disabilities, Aging and Independent Living |
| DID | Difference-in-Differences |
| DRHO | Designated Regional Housing Organization |
| DVHA | Department of Vermont Health Access |
| E&M | Evaluation and Management |
| EDB | Enrollment Data Base |
| ER | Emergency Room |
| ESRD | End-Stage Renal Disease |
| FFS | Fee-For-Service |
| FQHC | Federally Qualified Health Center |
| HCC | Hierarchical Conditions Category |
| HHS | U.S. Department of Health and Human Services |
| HIPAA | Health Insurance Portability and Accountability Act |
| HUD | U.S. Department of Housing and Urban Development |
| ID | Identifier/Identification |
| LIHTC | Low Income Housing Tax Credit |
| MAPCP | Multi-payer Advanced Primary Care Practice |
| NPI | National Provider Identifier |
| NPPES | National Plan and Provider Enumeration System |
| OPD | Outpatient Department |
| PBPM | Per-Beneficiary Per-Month |
| PCP | Primary Care Provider |
| PIC | Public and Indian Housing Information Center |
| PT | Physical Therapist |
| RHC | Rural Health Clinic |
| SASH | Support and Services at Home |
| SSN | Social Security Number |
| TIN | Tax Identification Number |
| TRACS | Tenant Rental Assistance Certification System |
| USDA | U.S. Department of Agriculture |
| VNA | Visiting Nurse Association |
EXECUTIVE SUMMARY
Abstract
This report describes the ongoing implementation and impacts of a program intended to improve health and decrease health care expenditures among elderly residents of affordable housing developments. In July 2011, the Support and Services at Home (SASH) program was officially launched in Vermont; by June 2014, the latest date for this analysis, the program had expanded to include 49 panels and 3,485 participants across the state. The SASH program connects residents with community-based services and promotes coordination of health care.
Using claims data for a sample of Medicare fee-for-service (FFS) beneficiaries, the evaluation analyzed health care utilization and expenditures among SASH participants and a comparison group of Medicare beneficiaries living in affordable housing properties in Vermont. Relative to the growth of Medicare expenditures in the comparison group, growth in annual Medicare expenditures was lower by an estimated $1,536 per beneficiary among beneficiaries enrolled in SASH panels established before April 2012 (i.e., well-established panels). However, a little more than half of the participants in the sample are not yet experiencing a lower rate of growth in Medicare expenditures. Impact estimates in this report are based on the first 3 years of the implementation of the SASH program, from July 2011 through June 2014.
Background
In 2008, the non-profit Cathedral Square Corporation (CSC) in South Burlington, Vermont, began developing the SASH program out of concern that frail residents in its properties were not able to access or receive adequate supports to remain safely in their homes. CSC designed the SASH program to connect residents with community-based support services and promote greater coordination of health care. As part of the Multi-payer Advanced Primary Care Practice (MAPCP) Demonstration, the SASH teams extend the work of the Vermont Blueprint for Health's Community Health Teams (CHTs) and primary care providers by providing targeted support and in-home services to participating Medicare FFS beneficiaries. Although the SASH program was developed for residents of affordable congregate housing, all Medicare FFS beneficiaries in Vermont were eligible to participate. The SASH program was officially launched in July 2011 and expanded into other affordable congregate housing sites and communities across the State of Vermont.
Implementation Findings
Our qualitative analysis explored how the relationships between the SASH program and the community partners changed throughout the first few years of the SASH program and what challenges remain. The SASH program was designed to extend the work of the Vermont Blueprint for Health's CHTs and to create linkages among a diverse team of service, health care, and housing providers, enabling better coordination of care for SASH program participants. Each SASH panel of approximately 100 participants includes a full-time SASH coordinator and a quarter-time wellness nurse, who work in collaboration with community partners--such as the councils and area agencies on aging, visiting nurse associations, and mental health agencies--to assist SASH participants.
The establishment of the SASH program initially created apprehension about overlapping responsibilities among some community partners. By early 2014, these relationships had improved considerably, as community partners gained a better understanding of the strengths of the SASH program and as roles and responsibilities were more clearly defined. Concerns from other community-based providers about duplication of services remain as the SASH program extends beyond affordable congregate housing sites and into the community.
Another focus of our qualitative analysis was an examination of the training program established by CSC for the SASH staff (coordinator and wellness nurse), SASH team members from partner agencies, and housing host organizations. For the SASH staff and team members, ongoing training covers two main areas: (1) self-care management programs for participants, such as Chronic Disease Self-Management Program, nutrition, and tobacco cessation counseling; and (2) staff skill-building, such as motivational interviewing and end-of-life planning. Limited staff time and limited funding are the primary challenges to providing training.
Characteristics of Properties and Participants in This Quantitative Analysis
The SASH program sites included in this analysis are those that implemented the SASH program before July 2014. Designated SASH sites are non-profit affordable housing properties funded by the U.S. Department of Housing and Urban Development(HUD), the Low Income Housing Tax Credit (LIHTC), the U.S. Department of Agriculture Rural Development, or other State of Vermont funding sources. As we can only identify a comparison group using HUD and LIHTC data bases, this analysis is limited to SASH properties that receive funding assistance from HUD or LIHTC. This includes properties receiving assistance through HUD's multi-family programs, such as Section 202 and Section 8, the public housing program, and properties receiving tax credits.
The SASH intervention group for this Second Annual Report consists of SASH participants who are: (1) Medicare FFS beneficiaries; (2) attributed to a primary care practice participating in the Blueprint for Health/MAPCP Demonstration for at least one-quarter between July 2011 and June 2014; and (3) residents of a non-profit affordable housing property as identified in either the HUD or LIHTC data bases. As of June 2014, 3,485 individuals were participating in the SASH program. After we applied the beneficiary and property exclusions, the sample for this analysis contains 1,602 SASH participants. The comparison group comprises 1,458 individuals who are: (1) Medicare FFS beneficiaries; (2) attributed to a Blueprint for Health/MAPCP practice; and (3) residing in HUD or LIHTC properties not participating in SASH.
Quantitative Findings
We estimated the impact of the SASH program among Blueprint for Health/MAPCP participants, comparing SASH participants living in affordable congregate housing to similar Vermont residents of affordable congregate housing who were not participating in SASH. We reported the effects of the SASH program on Medicare expenditures and health care utilization, both for SASH program participants as a whole and for subgroups of participants identified by their panel start date or by their panel participant composition.
The "early panel cohort" contains SASH participants in panels that started operating before April 1, 2012; about 45% of SASH participants in the sample belonged to the early panel cohort. The "late panel cohort" contains SASH participants in panels that started operating on or after April 1, 2012. When analyzing the SASH program effects stratified by early and late panel start dates, under the hypothesis that panels need a certain amount of start-up time before their implementation of the SASH program becomes fully effective, we would expect to see a larger program impact among participants receiving services from earlier and therefore more experienced SASH panels.
SASH panels in the "site-based panel" cohort have a majority of participants living in affordable congregate housing, whereas SASH panels in the "mixed-panel cohort" have more than half of their participants living in the community. SASH panels serving mostly affordable congregate housing residents may be more effective at reducing health care expenditures and utilization, because their participants are more easily accessible to the SASH staff.
When considering beneficiaries in all SASH panels in the sample, we observe the rate of growth among the SASH program participants' total Medicare expenditures trending lower; however, this result does not reach statistical significance for data through June 2014. Among SASH participants in the early panel cohort, the SASH program reduced the rate of growth in total Medicare expenditures by $128 per-beneficiary per-month, or about $1,536 annually; this result is driven by particularly large reductions in Medicare expenditure growth in the third year of the SASH program. The early panel cohort also experienced lower growth in expenditures for emergency room (ER) visits, hospital outpatient department visits, and primary care/specialist physician visits. When stratifying the panels by participant composition, we find that the SASH program reduced the rate of growth in total Medicare expenditures among participants residing in the site-based SASH panels, but only in the third year of the program.
Despite the very positive findings with respect to reduced rates of growth in Medicare expenditures for SASH participants in the early panel cohort, we do not observe decreased rates of hospitalizations or ER visits among these SASH participants relative to the comparison group. Further exploration of the source of the reduced growth in Medicare expenditures is warranted.
Conclusion
A primary goal of the SASH program is to create linkages among a diverse team of service, health care, and housing providers, enabling better coordination of care for SASH program participants. Our qualitative analysis explored how the relationships between the SASH program and the community partners changed over the first few years of the SASH program and what challenges remain. Although the establishment of the SASH program initially created tension and apprehension about overlapping responsibilities among some of the community partners, these relationships improved considerably by the second year of the SASH program, as community partners gained a better understanding of the strengths of the SASH program and as roles and responsibilities were more clearly defined. Concerns remain about duplication of services with regard to SASH's expansion into the community. The next SASH Evaluation report will explore in more detail the SASH community participants and community panels.
The quantitative findings of this second SASH Evaluation report largely confirm the more preliminary findings of the first evaluation report. Although there were no statistically significant reductions in the growth of Medicare expenditures for the SASH program as a whole, the early SASH panels continue to be associated with lower rates of growth in Medicare expenditures relative to the comparison group, with the lower rates of expenditure growth being particularly strong in the third year of the program. Future analyses will examine whether participants in the late panel cohort experience similar reductions in Medicare expenditure growth when their SASH panels have been in operation for an additional year.
1. INTRODUCTION
1.1. Support and Services at Home Program Overview
In 2008, the non-profit Cathedral Square Corporation (CSC) in South Burlington, Vermont, began developing the Support and Services at Home (SASH) program out of concern that frail residents in its properties were not able to access or receive adequate supports to remain safely in their homes. CSC focused on connecting residents with community-based support services and promoting greater coordination of health care. The SASH teams extend the work of the Blueprint for Health's Community Health Teams (CHTs) and primary care providers (PCPs) by providing targeted support and in-home services to participating Medicare fee-for-service (FFS) beneficiaries. Though closely associated with and partially financed by the Multi-Payer Advanced Primary Care Practice (MAPCP) Demonstration in Vermont, the SASH program is offered to all Vermont Medicare beneficiaries residing in or near SASH properties, whether or not those beneficiaries were assigned to Blueprint for Health PCPs participating in the MAPCP Demonstration.
The SASH program is a Vermont-wide initiative coordinated at the state, regional, and local level. CSC oversees the program at the state level and is responsible for defining and implementing the programmatic elements along with coordinating program expansion and training. At the regional level, six Designated Regional Housing Organizations (DRHOs) are responsible for planning the roll-out of the SASH program across their geographic regions. The program is delivered at the community level through SASH panels, which are operated by the housing host organizations. In July 2011, the SASH program was officially launched with the opening of the first SASH panel. Subsequent SASH panels were opened in other non-profit affordable housing properties throughout the State of Vermont.
Each panel has the ability to serve roughly 100 beneficiaries and has a core staff made up of a dedicated full-time SASH coordinator and a quarter-time SASH wellness nurse. The SASH program launched in July 2011 and began expansion of panels immediately, though this growth was paused in the fall of 2012 due to a funding gap. After receiving an enhanced payment from the U.S. Department of Health and Human Services (HHS) Centers for Medicare and Medicaid Services (CMS), the program was able to add more panels and as of June 30, 2014, the latest date for this analysis, the SASH program had 49 panels with 3,485 participants. Panels partner with local service provider organizations, such as home health agencies, councils on aging (COAs), and community mental health organizations, which create the SASH Team. Using evidence-based practices, key services provided by core SASH staff (coordinator and wellness nurse) include a comprehensive health and wellness assessment, creation of an individualized care plan, on-site one-on-one nurse coaching, care coordination, and health and wellness group programs. Local service providers build on these core tenets by offering additional community activities, health and wellness workshops, and direct services.
When individuals choose to participate in the SASH program, they consent to allowing the SASH staff and community partners to share information about them with each other and their health care providers. With this consent, SASH staff work with the participants' health care providers when necessary to ensure proper medication usage, successful hospital discharges, and overall coordination and continuity of care. Importantly, the SASH program does not "discharge" participants. Rather, the SASH program provides a continuum of support and services that meet participants' needs whether they are extremely healthy and looking for minimal supports or very frail participants in need of more robust support from the full SASH Team. This ensures that the SASH program is ready to provide the help that is needed when circumstances change unexpectedly for participants. Individuals who do not consent, but live in SASH properties can still receive assistance from the SASH coordinator and wellness nurse and participate in SASH programming. However, without consent to share their information, staff cannot serve these individuals as intensively.1 SASH coordinators and wellness nurses are expected to communicate and meet with participating service providers on the SASH Team regularly (at least once a month) to discuss participant specific cases and group wellness approaches.
The SASH program receives financial support from a variety of sources. As the state coordinator, CSC is responsible for overseeing and securing funds for the program as a whole. At the regional level, DRHOs are encouraged to solicit additional funds from local organizations for ongoing support for their panels. CMS is the largest funding source and makes a per-beneficiary per-month (PBPM) payment to the SASH program through the MAPCP Demonstration. The MAPCP Demonstration initially provided $70,000 in annual funding for each panel, to cover the cost of the SASH coordinator and the wellness nurse. However, the federal budget sequestration of 2013 reduced the MAPCP funding from CMS by 2%, such that the annual funding for each panel has been $68,600 since April 2013. Other program costs are covered through a variety of sources. Medicaid is the second largest contributor, providing funds at both the federal and state level. Other sources include the Department of Aging and Independent Living, the Department of Vermont Health Access (DVHA), the Department of Health, and various foundations and grants. These sources represent the funding for the SASH program and not the actual health or long-term care services coordinated and arrange for as part of the SASH program.
The U.S. Department of Housing and Urban Development (HUD), the HHS Office of the Assistant Secretary for Planning and Evaluation (ASPE) and the HHS Administration for Community Living (ACL) have a strong interest in affordable congregate housing2 models that provide long-term services and supports to low-income seniors who wish to age in an independent setting. The SASH program offers an important opportunity to evaluate the impact of these services on program participants and, in particular, to determine whether the program is associated with improved health outcomes.
RTI International (RTI), and its subcontractor, the LeadingAge Center for Applied Research (LeadingAge), were selected by ASPE/HUD/ACL to evaluate the SASH program. Through a mix of qualitative and quantitative methods, we are conducting a comprehensive evaluation of the SASH program. The evaluation builds on the CMS-funded MAPCP Demonstration evaluation and assesses whether the SASH model of coordinated health and supportive services in affordable properties improves health and functional status of participants and lowers medical expenditures and acute care utilization for seniors.
1.2. Vermont Multi-payer Advanced Primary Care Practice Demonstration
In 2010, the State of Vermont applied to join the CMS MAPCP Demonstration. RTI is evaluating the MAPCP Demonstration for CMS, which also includes analysis for the states Maine, Michigan, Minnesota, New York, North Carolina, Pennsylvania, and Rhode Island. As the culmination of several years of health care reform efforts, the State of Vermont also expanded statewide an advanced primary care practice infrastructure consisting of medical homes supported by CHTs and an integrated information technology infrastructure and payment reforms. A goal of the state's reform efforts is seamless coordination across the broad range of health and human services (medical and non-medical) to optimize patient experience and engagement and improve the health status of the population. As the state began preparing its MAPCP Demonstration application, CSC approached the state about incorporating the SASH program into the demonstration. CSC's argument was that many of the state's high-cost health care users resided in affordable senior housing properties, and the SASH team would have extensive knowledge of the residents and the elements in place to help these individuals and others better manage their health and supportive service needs. The SASH program was included in the demonstration as extenders of the CHTs.
2. QUALITATIVE IMPLEMENTATION FINDINGS
To address key evaluation questions and complement our quantitative analyses, we conducted a qualitative analysis using two methods of primary data collection: semi-structured, in-person interviews and quarterly conference calls with SASH staff, key stakeholders, and ASPE/HUD/ACL. The primary purpose of the qualitative data collection is to understand the details of SASH program implementation and operation, monitor implementation progress, and identify implementation and operational successes and challenges as the SASH program is expanded statewide and matures. More information on the qualitative data and methodology is located in Appendix A. The analyses of these data have been designed to help the evaluation team understand the issues surrounding the SASH program start-up and operations, with a particular focus on understanding points that are most relevant for program sustainability and replication. In this section, we use qualitative data to answer the following research questions.
-
What are the operational challenges and successes of setting up the SASH program--that is, a coordinated system of housing, health services, and long-term services and supports?
-
What are the operational challenges to statewide expansion of the SASH program?
-
Have relationships between properties and service providers changed as a result of the SASH program?
-
Have relationships between long-term services, support providers, and health providers changed as a result of the SASH program?
In the second year of the evaluation, RTI and LeadingAge conducted a site visit to four different geographic areas of Vermont over a 3-day period in March 2014 to learn about the collaboration between the SASH program and community organizations. During the site visit, we interviewed staff from the COAs and the area agencies on aging (AAAs), visiting nurse associations (VNAs), mental health agencies, and the Blueprint for Health CHTs to assess successes, challenges, and the perceived value of the SASH program in terms of the impact on each community organization and the clients it serves.
In addition, the evaluation team conducted quarterly calls with SASH staff and other key stakeholders to receive ongoing feedback on the implementation of the program. Each call focused on a specific aspect of the SASH program, giving the evaluation team a deeper understanding of the infrastructure and processes of the program. We conducted four calls that focused on:
-
Trainings provided to SASH teams, the DRHOs, and housing host sites.
-
Establishment of the Blueprint for Health CHTs and SASH's role as an extender of the CHTs.
-
DRHOs' experiences with launching the SASH program in their region.
-
SASH participant data discrepancies (discussed in Section 3).
To address the research questions previously listed, the next two sections present our principal qualitative findings using primary data gathered from the site visit to Vermont and the quarterly calls.
2.1. Support and Services at Home Community Partner Relationships
As mentioned previously, a main focus of the second year site visit was to learn about the interactions and relationships between the SASH program and its community partners. Each SASH panel is staffed by a SASH coordinator and wellness nurse who work in collaboration with community partners, including the COAs/AAAs, VNAs, and elder care clinicians.3 As described in Section 1, the SASH program serves as an extension of the CHTs, providing support to beneficiaries living in publicly subsidized congregate housing and in the surrounding communities.
The SASH program launched with some of the COAs/AAAs and VNAs feeling that their long-term history and experience providing services in the community were not appropriately acknowledged and considered in the creation of the CHTs and the inclusion of the SASH program in the Blueprint for Health. Some SASH community partners were frustrated that new entities were created rather than utilizing their existing organizations that had a long history of serving the community. The community organizations did not understand why they were not given funds to expand their teams and services, rather than establishing an entirely new program.
According to Blueprint for Health officials, the SASH program was selected to serve as the extender of the CHTs because it offered something unique that the existing community organizations were unable to provide. The VNAs and COAs/AAAs are bound by program eligibility and reimbursement requirements that control whom the organizations can serve, what types of services they can provide, and how the services can be provided. In contrast, the SASH program has complete flexibility in who it can serve and what services it can provide. This allows SASH to complement the various existing programs by filling gaps and offering assistance that other organizations and programs are unable to provide.
Two years into the implementation of the program, relationships between SASH and the COAs/AAAs and VNAs appear to have matured and strengthened. There is now wide agreement among organizations that a common pathway of working together is needed in order to best serve Vermonters, which a year into implementation (2013) was not something organizations agreed upon. Time and exposure has helped ease the tension between SASH and the community partners as they have gained a better understanding of each other's capabilities.
A primary concern the COAs/AAAs and VNAs had with the SASH program was that they felt it duplicated services their organizations already provide. Some community partners reported that roles and responsibilities of the SASH teams, particularly those of the SASH coordinator, have become clearer over time, and there is less overlap or perception of duplication. One COA case manager noted that when SASH first began, it seemed that SASH was stepping on the COA's toes, but she no longer hears these complaints from her coworkers. The case manager attributed this to the evolution of the SASH program and staff from the different organizations learning how to work together. She and the SASH coordinators know each other well now, and the coordinators have a good understanding of what the COA's programs are and of how and when to make referrals.
Other COA case managers noted that they have not experienced any duplication of services with the SASH program; rather, they find that SASH complements the services they provide to their clients. One COA case manager believed she gained information about her clients from SASH staff that she would not otherwise know because she does not see her clients as frequently and does not observe them in different circumstances. She also has the SASH staff check on her clients from time to time, which saves her from having to travel to see them.
Another COA case manager explained that the SASH program fills a gap in care, rather than duplicating the case manager's efforts. The COA case manager does not interact with her clients around medical issues because COA case managers "aren't medical at all." They do not know when clients are going to the emergency room (ER) or hospital. She explained that the SASH wellness nurse generally has a list of high-risk participants whom she regularly follows. Some may be the case manager's clients, but the case manager would not be interacting with them around these types of medical issues. When clients do go to the hospital, she is informed at the SASH team meeting and then may go visit them, but that is the extent of the services provided by the COA for medical issues.
Blueprint for Health officials do not perceive any duplication between the SASH program and the COAs/AAAs and VNAs. The SASH program is able to provide flexible services to a broad range of people in a way that the COAs/AAAs and VNAs are unable to because of their program restrictions. Under Medicare's home health program, for example, the VNA is only able to serve individuals eligible for home health services and is only able to provide reimbursable services for a specified length of time. A Blueprint for Health official felt that the SASH program's financial freedom and greater access to participants, regardless of health status or insurance, affords great opportunities and is perhaps the biggest benefit of the SASH program and what differentiates SASH from other community providers.
At least one CHT interviewed did not believe the SASH program duplicated the COAs/AAAs and VNAs. This CHT explained that even though there are a lot of community resources available, the population needing these resources is too large for any one organization to serve effectively. The CHT has found that there is often an extended wait time to get an appointment with the COA, perhaps because the agency is dealing with individuals in crises first. Instead of individuals waiting for the COA/AAA or going without needed services, SASH can fill the gap and help these individuals obtain the care they need in a timely manner.
Although the organizations seem to have gained a much better understanding of their respective roles and ways to work together, some underlying tensions remain, particularly at the executive and administrative level of the community partner organizations. The COAs continue to report some level of duplication, although the evaluation team was not able to clearly see what degree of overlap exists because the COAs were usually unable to quantify the number of SASH participants in their case management caseloads. It appeared to be a small number, however--on average 3-5 individuals. Additionally, case managers see their clients infrequently. Depending on the client's eligibility status, case managers are only required to make monthly to quarterly contact, although they may make additional contact, if needed.
The COAs/AAAs and VNAs' concern about duplication appears to be mostly with the SASH program's extension into the community beyond the SASH housing sites. As a requirement of the MAPCP Demonstration (which funds SASH), the program must be open to all Medicare-eligible individuals and cannot be limited to those living in affordable housing properties. The community partners do not understand why a housing-based organization should be involved beyond the walls of SASH properties, and they feel that their experience working in the community makes them the best suited to work with community participants.
CSC noted that many SASH housing host organizations do more than operate affordable housing properties and also have experience working with individuals in the community. The housing organizations manage rental subsidy vouchers, operate mobile home parks, coordinate energy efficiency and equity sharing programs, and provide homeownership counseling. CSC believes that community members have benefited by knowing that there is a "hub" they can go to for support and services. CSC sees SASH's expansion into the community as an advantage to the community partners because it could result in referrals of individuals who were not aware of the services available from the VNA or the COA/AAA.
Community partners also expressed concern about the ability of the SASH program to adequately serve the community and the impact on the SASH program of stretching its resources so thin. The community partners believe that the SASH program does not have the capacity (time and resources) to expand into the community. This is particularly true for the wellness nurses who have very limited hours (10 hours per panel/per week) to provide services to clients. Serving individuals in the community requires driving time, particularly in rural communities, so more time is needed overall. Some SASH panels are dedicated to serving community participants; however, they are staffed at the same level as panels that are predominately serving individuals in a housing property. The community panels are not given additional resources to account for the driving time to meet with participants. In the next annual report of the SASH Evaluation, we will summarize the results of the third round of site visits, which focused on investigating community panels and community participants. Our qualitative discussion of the community panels and participants in the next report will accompany an initial quantitative analysis of this population.
The elder care clinicians appear to be highly collaborative partners on the SASH team. Elder care clinicians are part of a program jointly operated by the departments of Aging and Independent Living and Mental Health in which the regional mental health agency pairs a clinician to work with the COA/AAA. The clinicians may be social workers, psychologists, mental health professionals, or mental health outreach workers.4 They work with any adult age 60 or over who is experiencing a mental health concern that interferes with his or her daily life, such as depression, anxiety, or substance abuse.
The elder care clinicians recognize several benefits that the SASH program brings to them and to their clients. For example, they appreciate being able to call on the SASH coordinators and wellness nurses to assist them with their clients, since the elder care clinicians typically have large caseloads and limited resources. They do not perceive any duplication or overlap between their work and the SASH program. On the contrary, elder care clinicians leverage the resources of the SASH program and vice versa. To some extent this perspective may be because of the clinicians' more independent role--elder care clinicians are located either at the local mental health agency or at the COA/AAA offices--and that they have autonomy when it comes to collaborating with other organizations. With their mental health backgrounds, elder care clinicians also have very clear skills and roles that the SASH staff are not necessarily able to duplicate. There is some indication, however, that not all elder care clinicians are as actively engaged with the SASH teams, which may be a place for further investigation.
The relationships between the CHTs and the SASH teams have also matured and strengthened. Since our initial site visit in 2013, the two teams appear to better understand their individual roles and the ways they can work together. They have adapted the partnership processes on the basis of their unique organizational and regional circumstances. The teams appear to be collaborating around clients and leveraging each other's skills and expertise in various ways. For example, the teams are collaborating on delivery of the Healthier Living Workshops (Vermont's name for the Chronic Disease Self-Management Program [CDSMP]), a core component of the state's Blueprint for Health initiative. The CHTs are training SASH staff to be leaders for the program and to deliver the workshops in the housing properties. One CHT noted that the workshops were offered in housing sites before SASH, but the workshops are seeing greater success now because the SASH program targets appropriate individuals and provides participants with encouragement and support to continue with the workshop series and to achieve their established goals.
One CHT finds SASH to be a valuable resource for their advanced directives initiative. The CHT sends a trained volunteer to the properties every other week, and the SASH coordinators schedule appointments with SASH participants in need of the documents. Another CHT finds SASH's focus on healthy eating beneficial because the CHT has limited resources on this topic. In another region, the CHT provided the SASH team with health coaching and support for nutrition issues. CHTs provide the SASH teams with support for tobacco cessation efforts. In another region, the SASH teams collaborate with the CHT for social work assistance regarding transitions of care, end-of-life planning, and mental health issues. The SASH teams also utilize the CHT's medical social workers, who are often more knowledgeable about funding and insurance-related aspects.
All the community partners view the SASH wellness nurses as a highly valuable component of the SASH program and believe the nurses enhance the support the community partners are able to provide to their clients. The community partners appreciate having someone to address health-related and medical-related questions and issues for their clients, particularly around medication-related issues. Because the COA case managers and elder care clinicians do not have medical backgrounds and typically have clients with health complications, the wellness nurse is a valuable resource--one they do not have within their own organizations. Concerns remain that the small number of hours allotted for the nurses is inadequate to fully support the needs of the SASH participants.
2.2. Support and Services at Home Training
As the statewide administrator for the SASH program, CSC established an extensive training program. Training is provided for housing host organizations, the SASH staff (SASH coordinator and wellness nurse), and SASH team members from partner agencies. Trainings for the SASH staff focus on program fidelity, administrative aspects, and skill-building.
CSC involved several of the housing organizations, which ultimately became the DRHOs, in the development and piloting of the SASH program. After the pilot launched, CSC and the DRHOs began contemplating the program's expansion into other housing properties. The organizations began shaping an administrative infrastructure and developing many of the program's processes and materials, such as legal documents and job descriptions.
When the SASH program was selected for inclusion in the Blueprint for Health and the MAPCP Demonstration, CSC began developing a formal training program for the DRHOs. The DRHO organizations served as the housing hosts in the initial round of SASH panel roll-outs. These housing organizations were involved in the development and piloting of the SASH program and were already familiar with the program. However, CSC wanted to develop a formal training infrastructure for the additional housing organizations that would eventually participate in the program. CSC also wanted to develop templates for all of the administrative processes and materials a housing organization would need to launch and operate the program. In addition to ensuring program consistency, CSC wanted potential housing host organizations to know they would be supported and would not be expected to create everything on their own.
CSC first held a formal day-long training at the SASH pilot site with the DRHOs. The training included presentations from the pilot site SASH team on the enrollment process, how the model worked day-to-day, and challenges and successes experienced thus far. The DRHOs also heard from participating residents and observed a local table meeting.
After this, CSC and the DRHOs launched a recruitment and training effort for other housing host organizations. The initiative included a kick-off conference followed by one-on-one training sessions with potential housing host organizations. The purpose of the kick-off event was to pique organizations' interest in participating and to begin familiarizing the organizations with the components of the program.
The kick-off conference was followed by more intensive one-on-one meetings with those organizations that expressed interest in participating. These "peer-to-peer" exchanges were held with CSC staff, the DRHO for the region, and the leadership team from the potential housing host organization. The meetings included reviewing:
-
The SASH site application, including a summary of proposed costs of hosting SASH.
-
Proposed budgets and how program funding flows.
-
Legal documents (e.g., memorandums of understanding with partner organizations and contracts for wellness nurses).
-
The SASH operations manual.
-
The DRHO's function and how it will support the housing host.
-
Training provided by CSC.
-
The partnership structure with the Blueprint for Health and others.
-
Job descriptions and recruitment materials.
These one-on-one trainings are conducted with new housing host organizations as new panels roll-out.
As mentioned above, CSC created a SASH operations manual. The manual contains 17 modules and covers a range of topics to guide the housing host organizations and SASH staff in implementing and operating the program (e.g., SASH staff roles and responsibilities, participant assessment, information sharing and privacy/confidentiality, maintaining records, funding, etc.). In addition, CSC maintains a website that hosts a variety of tools and resources for SASH staff to assist them in their various activities.
When a new panel is ready to launch, CSC provides an 8-week training program for new SASH coordinators and wellness nurses. The training begins with a full-day kick-off session.
CSC also provides ongoing training for SASH staff and team members from partner organizations. Ongoing training primarily falls into two main areas: (1) self-care management programs; and (2) staff skill-building. In the area of self-care management, SASH staff receivetraining that either prepares them to deliver certain programs and/or increases their knowledge of issues often faced by program participants. Staff can be trained to deliver the CDSMP, Aging Well, Tai Chi, or tobacco cessation counseling. Staff also receive training on falls prevention, nutrition, and memory-related disorders. Skill-building trainings include topics on motivational interviewing, end-of-life planning, managing difficult people, facilitating team meetings, and using DocSite, the SASH program's electronic record keeping system. For more specific details about the SASH trainings, see Appendix B.
Some trainings are required, while others are strongly recommended. Required trainings include HIPAA regulations and compliance, motivational interviewing, and basic-level tobacco cessation. Recommended trainings include CDSMP, hypertension, falls prevention, and nutrition. Being mindful of staff time and program resources, CSC is considering what trainings should be considered core training requirements.
Training is delivered through multiple avenues. In addition to participating in trainings offered by outside partner organizations (e.g., training to deliver the CDSMP), CSC hosts:
-
Monthly phone call/webinar meetings with SASH coordinators and wellness nurses (held separately by role).
-
Bi-monthly DocSite webinar trainings.
-
Quarterly regional group trainings facilitated by the CSC Statewide Support Coordinator.
CSC also sends a monthly SASH Training News email to all SASH staff and provides individual, on-site technical assistance and training when needed or requested.
Challenges exist to providing trainings. The biggest challenge is finding a balance with the volume of training. SASH staff ask for training in certain areas, but also express concerns that there is too much training. Lack of funding to pay for the time of the SASH partner agency staff to attend training is another challenge. SASH partner agencies have been very clear that CSC needs to fund any cost of participation that might incur. Additionally, because of the limited number of hours per week the nurses are allocated, they often have to choose between attending training sessions and spending time with SASH participants. CSC also lacks funding to cover mileage for staff to travel to trainings. CSC is working toward greater collaboration with agencies across the state that offer applicable trainings to leverage other resources and bring trainings as close to SASH staff as possible. Another challenge is that as the SASH program has grown, the coordinating staff at CSC has remained the same size because of limited funding. CSC is not able to provide the same level of attention to new panels and staff as it did when training the initial panels.
3. DESCRIPTIVE ANALYSIS
In this section we provide descriptive statistics for Medicare FFS beneficiaries in the Vermont Blueprint for Health (part of the CMS MAPCP Demonstration) who were either participating in SASH during our sample period or who were identified as members of the comparison group for the quantitative analyses in this report. For this analysis, participation in SASH is current as of June 30, 2014. In this section, we address the following two primary research questions:
-
What are the characteristics of Blueprint for Health Medicare FFS beneficiaries in SASH relative to Blueprint for Health Medicare FFS beneficiaries in the comparison group?
-
What are the characteristics of the low-income housing properties associated with Blueprint for Health Medicare FFS SASH participants and Blueprint for Health Medicare FFS non-participants?
In the First Annual Report, there were two separate comparison groups used to identify the effects of the SASH program on Medicare expenditures and health care utilization: (1) Medicare FFS beneficiaries participating in the Vermont Blueprint for Health and living in publicly-assisted housing where SASH was not available; and (2) Medicare FFS beneficiaries living in publicly-assisted housing in the State of New York who were assigned to primary care practices that were not recognized as medical homes. Due to concerns about the differences between the selection of the SASH participants and the selection of the New York comparison beneficiaries, we have moved the descriptive and multivariate analyses using the New York control group to Appendix E. Specifically, the SASH participants and non-participants in Vermont could enter or exit the sample quarterly based on their assignment to a primary care practice, while the New York comparison group could only enter or exit the sample on an annual basis. Also, the New York comparison group beneficiaries were assigned to medical practice units that could be much larger than the medical practice units used for assignment in Vermont. Both of these differences in sample selection between Vermont and New York have the potential to create differences between the populations which are due to their selection, and not to any effect of the SASH program. This potential for bias in the results convinced us to focus the report on results using the Vermont comparison group. (For further details and complete descriptive results of the New York comparison group, see Appendix E.)
3.1. Data
The quantitative data sources used in this report include the Medicare Enrollment Data Base (EDB), Medicare claims data, HUD tenant and property-level data, and SASH program participant files. We use two data sources to create beneficiary-level demographic and health risk variables used in the both the descriptive analysis presented below and the regression analysis in Section 4. The Medicare EDB allows us to identify beneficiaries' demographic characteristics in the year prior to their assignment to a practice in the Blueprint for Health Demonstration. Medicare claims are used to develop measures of health risk and comorbidity for this same period prior to assignment and to create all Medicare expenditure and health care utilization outcome variables for the analysis. Property data come from 2012-2013 HUD housing data bases: the 2012/2013 TRACS, the 2012/2013 PIC data base and the 2012 LIHTC data base. SASH program participant files from CSC were used to identify participants in Medicare and HUD data bases and to stratify participants into cohorts based on panel characteristics (see Section 4). (For more information, see Appendix C.1 Data).
3.2. Evaluation Property and Beneficiary Sample
The intervention group for this evaluation report consists of Medicare FFS beneficiaries who were attributed to Blueprint for Health practices between July 1, 2011, and June 30, 2014, and who started participating in the SASH program prior to July 1, 2014. The comparison group is comprised of Medicare beneficiaries attributed to Blueprint for Health practices during that same time period who were not identified as SASH participants.5
We limit our analysis to SASH participants who are living in affordable congregate housing, as demonstrated by their presence in one of the three HUD housing data bases. For the purposes of this analysis, when we describe our SASH population and our comparison group as living in "affordable congregate housing," we define that as beneficiaries who are found in the PIC, TRACS, or LIHTC data bases. Note that all residents of LIHTC properties (as identified in the LIHTC data base) are eligible for inclusion in the sample, whether or not they receive rental assistance. Both intervention and comparison group beneficiaries were cross-referenced with HUD housing records from 2012 and 2013 (see Appendix C). Only beneficiaries successfully identified as recipients of HUD assistance for affordable congregate housing or as residents of LIHTC properties were included in this analysis.6 This step was taken in order to remove SASH participants who were residing in the community.7 SASH participants residing in the community are excluded from the analysis due to concerns about identifying an appropriate comparison group.
We exclude from the comparison group all non-SASH participants living in properties where SASH was available. In properties where SASH is active, those who choose not to participate in SASH may still benefit from the programming and the availability of the SASH coordinator and the wellness nurse. We do not want to include in the comparison group any beneficiaries who may be benefiting from the SASH program. Future analyses may explore if there are any positive spillover effects of the SASH program onto non-participants in affordable congregate housing properties where SASH is active.
The SASH program sites included in this analysis are those that implemented the SASH program prior to July 1, 2014. Designated SASH sites include a range of non-profit affordable housing properties funded through a variety of sources including HUD, LIHTC, the U.S. Department of Agriculture (USDA) Rural Development, and other sources available through the State of Vermont. Sites also include a few mobile home parks. SASH participants in our analysis sample were drawn only from properties that receive funding assistance from HUD or LIHTC, which includes properties receiving assistance through HUD's multi-family programs, such as Section 202 and Section 8, public housing programs, or tax credit properties. The analysis is limited to these types of communities because these data sources are best suited to linking Medicare beneficiaries to specific properties. These property linkages allow us to obtain information about the property as well to control for property-level fixed effects in our regression models (see Appendix C.5 Regression Analysis).
Properties that receive multiple forms of funding assistance are included in the analysis if one of the funding sources is LIHTC or requires reporting in PIC or TRACS. Properties funded through the USDA and the State of Vermont cannot be included unless they are LIHTC properties or receive assistance that must be reported in PIC or TRACS. This is because we do not have a data source that allows us to identify residents in USDA and State of Vermont properties that are not participating in the SASH program, which we would need in order to construct a reasonably similar comparison group to the SASH participants who live in USDA and State of Vermont properties. These excluded properties represent a small portion of the total SASH properties.
At the time of the first annual SASH Evaluation report, there were 1,502 Medicare FFS beneficiaries participating in the SASH program. In that analysis, beneficiaries were excluded from the analysis sample if they were not attributed to a Blueprint for Health practice as of June 1, 2013, or if they were not found in the PIC or the TRACS housing data. This produced a final sample of 549 Medicare beneficiaries.
In January 2015, RTI and LeadingAge held a conference call with CSC to discuss data issues surrounding the SASH participant list and to explore ways to increase the proportion of SASH participants included in the current round of analysis. Of particular concern were a portion of SASH participants who were attributed to Blueprint for Health practices but who were not found in either the PIC or the TRACS housing data.
CSC confirmed that some of these participants were community SASH participants, those who were not living in congregate housing associated with a SASH panel. These community participants were excluded from the analysis due to concerns about identifying an appropriate comparison group. Community participants who seek out or are referred to a program such as SASH are likely to be very different from other members of the community who do not join SASH, and different in ways that are likely to affect their health care utilization and expenditures. As evaluators, we cannot observe the reasons that the community participants choose to join SASH, making it difficult to identify a comparison group of reasonably similar community members use to in our modeling.
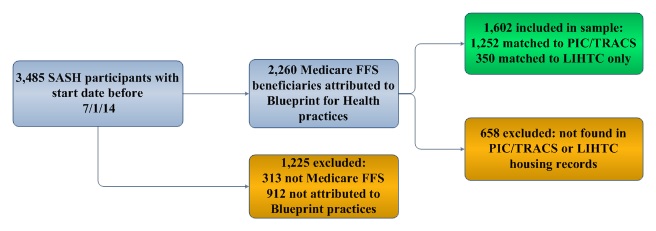
CSC was also able to confirm that other participants in question were living in LIHTC properties. These SASH participants in LIHTC properties were added to the sample when RTI was able to obtain LIHTC data from HUD. As of June 30, 2014, there were 3,485 individuals participating in the SASH program. After restricting to Medicare FFS beneficiaries attributed to Blueprint for Health practices who were who were identified in the PIC or TRACS data bases, or identified as residents of affordable housing in a LIHTC property, 1,602 SASH participants remained for this analysis. The comparison group of non-SASH Blueprint for Health Medicare FFS beneficiaries also receiving public housing assistance was comprised of 1,458 individuals (see Figure 3-1).
Since the comparison group may differ from the intervention group in terms of baseline characteristics, which affect Medicare expenditures and other health care utilization outcomes of interest, all descriptive statistics and outcome analyses use weights derived from propensity scores (see Appendix C.4 Weights). Propensity score matching attempts to balance the intervention and comparison groups with respect to baseline characteristics to reduce the potential for bias in the estimate of the intervention effect.
| FIGURE 3-1. Total SASH Participants and SASH Participants Included in the Quantitative Analysis |
|---|
 |
Descriptive analyses present unweighted and weighted beneficiary characteristics during the baseline period, which is defined as the year before a beneficiary's assignment to a Blueprint for Health practice. Baseline variation between SASH program beneficiaries and the comparison group are quantified using standardized differences (Austin, 2011). A standardized difference between -0.10 and +0.10 indicates that the difference in means between two groups is not statistically significant. For this report, we also report average quarterly expenditure and health care utilization outcomes for the 12 months prior to the start of the SASH program. Regression results for these outcomes are given in Section 4.2.
3.3. Property Characteristics
In Table 3-1, we present the property characteristics for properties associated with intervention and comparison beneficiaries, using HUD data from calendar year 2012/2013. TRACS is the data base for all multi-family properties (Section 202, Section 236, Section 8, etc.); PIC is the data base for public housing and housing choice vouchers; and LIHTC is the data base for low-income housing developed through tax credits. Because there are differences between the data sources, we present means separately for properties listed in the TRACS, PIC, and LIHTC data bases.
In the TRACS data base we were able to link intervention beneficiaries to 65 properties and comparison group beneficiaries to 80 properties. Overall, there were many similarities between the two sets of properties. However, properties associated with SASH participants had on average a higher number of housing units than the comparison group (51 vs. 30) and a higher percentage of elderly residents (78% vs. 64%). They were also more likely to be in metropolitan areas (53% vs. 20%) and consequently in counties with higher median household incomes.
In the PIC data base we were able to link intervention beneficiaries to 52 properties and comparison group beneficiaries to 36 properties. The two sets of properties varied in many ways: PIC properties associated with SASH beneficiaries had more units, shorter average occupancy lengths, smaller average household sizes and incomes, and larger percentages of elderly residents. There were also less likely to be in rural areas. Though there were many differences, it should be noted that the number of comparison group individuals associated with PIC properties was small (44) compared to the number of comparison beneficiaries associated with properties in the TRACS (819) and LIHTC (595) data bases. At the time of analysis, SASH was available in all PIC senior housing properties in Vermont; the few comparison beneficiaries who are identified as living in PIC properties are living in PIC family properties.
In the LIHTC data base we were able to link intervention beneficiaries to 56 properties and comparison group beneficiaries to 125 properties. SASH and non-SASH LIHTC properties were fairly similar, though once again SASH properties contained a higher percentage of elderly residents (67% vs. 43%) and were more likely to be in metropolitan areas than properties associated with the comparison group.
| TABLE 3-1. Characteristics of Properties in which Medicare FFS SASH Program Participants and Comparison Group Beneficiaries Reside | ||
|---|---|---|
| Property Characteristics | Properties Associated with SASH Particpants1 | Properties Associated with Non-SASH, Blueprint for Health Comparison Group2 |
| Total Number of Properties in TRACS | 65 | 80 |
| Mean number of units | 51 | 30 |
| Mean occupancy length (years) | 5.6 | 5.8 |
| Mean household size | 1.2 | 1.5 |
| Mean household income | $15,479 | $15,135 |
| Mean tenant rent | $329 | $325 |
| Elderly residents (%) | 78 | 64 |
| Section 8 (%) | 83 | 87 |
| Metropolitan (%) | 53 | 20 |
| Micropolitan (%) | 24 | 56 |
| Rural (%) | 22 | 24 |
| Median household income (by county) | $55,214 | $50,593 |
| Average annual Medicare expenditures | $7,776 | $7,990 |
| Total number of properties in PIC | 52 | 36 |
| Mean number of units | 101 | 14 |
| Mean occupancy length (years) | 7.4 | 8.2 |
| Mean household size | 1.3 | 2.9 |
| Mean household income | $15,213 | $20,912 |
| Mean tenant rent | $313 | $349 |
| Elderly residents (%) | 54 | 27 |
| Metropolitan (%) | 30 | 36 |
| Micropolitan (%) | 62 | 25 |
| Rural (%) | 8 | 39 |
| Median household income (by county) | $53,999 | $52,914 |
| Average annual Medicare expenditures | $7,807 | $7,759 |
| Total number of LIHTC properties | 56 | 125 |
| Mean number of units | 49 | 46 |
| Mean occupancy length (years) | --- | --- |
| Mean household size | 1.5 | 1.9 |
| Mean household income | $18,456 | $20,059 |
| Mean tenant rent | $476 | $485 |
| Elderly residents (%) | 67 | 43 |
| Metropolitan (%) | 71 | 42 |
| Micropolitan (%) | 17 | 28 |
| Rural (%) | 12 | 30 |
| Median household income (by county) | $58,004 | $53,315 |
| Average annual Medicare expenditures | $7,694 | $7,865 |
NOTES: TRACS and PIC data are from calendar years 2012 and 2013. LIHTC data is from 2012. Occupancy length could not be determined from the LIHTC data base.
| ||
3.4. Participant Characteristics
Table 3-2 presents the average demographic and health status characteristics for the SASH participants in the sample and the unweighted and weighted averages for the non-SASH comparison group beneficiaries. Standardized differences between the two groups less than -0.10 or greater than +0.10 are denoted by a "star" (*). SASH program participants were on average slightly older than the comparison group beneficiaries (71 vs. 68), less likely to be disabled and on average resided in smaller households. They were also in generally poorer health as measured by their higher average hierarchical conditions category (HCC) risk score (1.27 vs. 1.19) and higher average value of the Charlson index (1.03 vs. 0.86). With respect to property type, SASH participants were less likely than the comparison group to be housed in LIHTC properties without receiving housing assistance that was reported in the PIC or TRACS data bases (21.8% vs. 40.8%). Overall, before propensity score matching, there were five characteristics where standardized differences between the two groups were less than -0.10 or greater than +0.10.After propensity score matching, these statistically significant standardized differences disappeared, indicating that matching was able to sufficiently balance demographic characteristics and health status between the two groups.
| TABLE 3-2. Average Baseline Demographic Characteristics and Health Status for SASH Medicare FFS Participants, and Unweighted and Weighted Average Demographic Characteristics and Health Status for Non-SASH Medicare FFS Blueprint for Health Beneficiaries | |||
|---|---|---|---|
| Demographic and Health Status Characteristics | SASH Program Beneficiaries1 | Non-SASH, Blueprint for Health Comparison Beneficiaries2 | |
| Unweighted | Weighted | ||
| Total beneficiaries | 1,602 | 1,458 | 1,601 |
| Demographics | |||
| Mean age | 70.9 | 67.9* | 71.1 |
| White (%) | 97 | 97 | 98 |
| Female (%) | 73 | 70 | 71 |
| Disabled (%) | 43 | 49* | 42 |
| Medicaid (%) | 64 | 67 | 65 |
| ESRD (%) | 1 | 1 | 1 |
| Mean household income ($) | $15,998 | $16,119 | $15,839 |
| Mean household size | 1.14 | 1.21* | 1.13 |
| Health status | |||
| Mean HCC Score | 1.27 | 1.19 | 1.23 |
| Mean Charlson Comorbidity Index | 1.03 | 0.86* | 0.95 |
| Property type | |||
| LIHTC only (%) | 21.8 | 40.8* | 22.5 |
NOTE: Standardized differences comparing SASH program beneficiaries to non-SASH, Blueprint for Health comparison beneficiaries that are greater than or equal to 0.10 are noted with an "*".
| |||
4. QUANTITATIVE FINDINGS
The analyses in this section evaluate the effect of the SASH program on the Medicare expenditures and health care utilization of SASH participants, compared to similar non-participants; both SASH participants and individuals in the comparison group were Medicare FFS beneficiaries participating in the Vermont Blueprint for Health and living in affordable congregate housing, as described in Section 3. We use Medicare claims data from January 1, 2006, through June 30, 2014, to address the following three research questions:
-
What is the impact of SASH on health care service expenditures? For the purposes of this report, health care service expenditures include the following categories, measured at the PBPM level and calculated by dividing quarterly expenditures by 3:
- Total Medicare expenditures;
- Acute care expenditures (Medicare expenditures for acute care hospital and critical access hospital [CAH] claims);
- Post-acute care expenditures (Medicare expenditures for post-acute care facilities including skilled nursing facilities and inpatient rehabilitation facilities);
- ER expenditures (Medicare expenditures for ER visits that do not lead to hospitalization, including both the hospital claim and any associated physician claims);
- Hospital outpatient department (Medicare expenditures for outpatient procedures that do not require a hospital stay); and
- Primary care/specialist physician (Medicare expenditures for all physician claims).
-
Does the impact of SASH on total Medicare expenditures differ by specific panel characteristics? For purposes of expansion and replicability, we would like to determine the panel characteristics that are most strongly associated with reducing the growth of Medicare expenditures.
-
Do individual participating in SASH have fewer adverse outcomes relative to their peers who are not participating in SASH? For the purposes of this report, adverse outcomes are measured in rates per 1,000 beneficiary quarters and include:
- All-cause acute care hospitalizations;
- All-cause ER visits;
- ER visits not leading to a hospitalization; and
- Unplanned readmissions (readmission to a hospital within 30 days of a hospital discharge, excluding certain planned hospital visits such as rehabilitation or chemotherapy, measured in rates per 100 live discharges).
To answer these questions, we estimate multivariate regressions, controlling for all of the beneficiary characteristics listed in Table 3-2. We estimate the effect of the SASH program on these expenditure and health care utilization outcomes for the entire population of SASH participants in our sample, and then, to answer our second research question, we estimate the models separately for specific subsets of SASH participants.
In the First Annual Report of the SASH evaluation, we estimated the impact of the SASH program for two subgroups of participants: an "early panel" cohort and a "late panel" cohort. The early panel cohort is comprised of SASH participants who received SASH services from a panel that started operating before April 1, 2012. The late panel cohort is comprised of SASH participants who received SASH services from a panel that started operating on or after April 1, 2012. The initial reason for separating SASH participants by the panel start dates was that there are many SASH panel start-up activities associated with hiring staff, gaining participation consent, conducting a detailed needs assessment, and initiating supportive services which would reduce a SASH panel's ability to make a significant impact on Medicare expenditures and health care utilization in its first few quarters of operation. We hypothesized that the more established panels, the ones with the earlier start dates, would likely have a stronger impact on Medicare expenditures and health care utilization. In the First Annual Report, we found slower growth in total Medicare expenditures among participants in the early panels, but not among the later panels, which supports the hypothesis that there is a lag between the start of a SASH panel and that panel's ability to influence health care expenditures and health care utilization.
In this analysis, we again subdivide the sample of SASH program participants into those belonging to early panels and those belonging to late panels. We keep the same cutoff date of April 1, 2012, but note that the early panel sample from the previous report is not identical to the early panel sample in this report. The largest change occurs with the addition of the LIHTC data, since that allows us to include 56 more properties in the SASH sample, many of which were categorized as part of the early panel cohort. Also, rolling entry into the SASH program means that all participants who joined the early SASH panels since the timeframe of the last report are included in the early panel group. Again, what we are comparing by splitting early and late panels is the change in the rate of Medicare expenditure growth for panels who have been participating in SASH longer, not necessarily beneficiaries who have been participating longer, though the two are highly correlated.
Similarly, the number of late panels in this report differs from the number of late panels in the earlier report due to the addition of the LIHTC data and rolling entry into the SASH program. SASH panels that started after the timeframe for the previous report are also grouped into the late panel cohort.
Through conversations with CSC and further exploration of the SASH panels, it was brought to our attention that the cohort of early panels was comprised almost entirely of site-based panels, while the late panel cohort was a mix of site-based panels, mixed-panels, and a few community panels. SASH program leadership within CSC classifies SASH panels into three groups: site-based, mixed, and community. The earliest SASH panels rolled out were considered site-based, meaning that the majority, greater than 50%, of SASH participants in the panel live in a congregate building operated out of a non-profit housing host. In this type of panel, SASH coordinators and wellness nurses have office space in the hub site and also space available to host group programming within the hub site. The SASH program currently has 30 panels that CSC classifies as site-based panels.
SASH also provides services to participants outside of a hub site, as was a requirement of receiving CMS funding through the MAPCP program. Some site-based panels evolved into mixed-panels as a result of increasing demand for SASH services from people living outside the hub sites or residing in surrounding towns. Panels classified as mixed-panels generally have greater than 50% of participants residing outside of a congregate building, or are projected to have community participants as the majority in the future. Within mixed-panels, SASH staff can still operate out of an office and host group programs at a housing hub site convenient for community participants to also join. The SASH program currently has 17 panels that CSC classifies as mixed-panels.
Panels comprised solely of "community" participants (that is, SASH participants not residing in a SASH housing sites) panels were not initially envisioned for the SASH program; however, community panels were created later due to larger-than-anticipated demand from beneficiaries residing in more rural areas of Vermont. Community panels have 100% community participants, and do not have a congregate housing hub site available nearby. SASH coordinators and wellness nurses host events and operate out of local senior centers, partner agency space, private rental space, or other forms of community centers. The SASH program currently has four panels that CSC classifies as community panels. By removing community panels from the sample and identifying participants in affordable congregate housing data bases, we hope to remove almost all of the SASH participants living in the community from our analysis. As discussed in Section 3, we are particularly concerned about the difficulty of designing an appropriate comparison group for the community participants.
Given that the early panel cohort in the first report contained mainly site-based SASH panels, we would like to determine whether the success of these panels is due to their longer experience in the SASH program or due to the composition of their participants. Site-based SASH panels may be more effective at reducing Medicare expenditures, due to limited SASH coordinator and wellness nurse time. The SASH coordinator and wellness nurse time and resources may be spread more thinly in panels where there are a large proportion of community participants. Two of the possible reasons for this are: (1) staff may need to travel to participants to see them; and (2) the participants themselves may have higher needs since they were referred to SASH for coordination needs. Even though the analysis includes only the SASH participants living in publicly-assisted congregate housing, the "site-based" participants in the mixed-panels may not receive the same level of benefit from the SASH program as the site-based participants in the site-based panels, if the community participants are requiring greater resources from the SASH team.
Finally, we consider separately the effects of SASH on the Medicare expenditures and health care utilization of SASH participants belonging to site-based panels in the late cohort, to try to tease out the impact of the constraints of the mixed-panel on expenditure growth, and to try to better understand the relative importance of the age of the panel versus the participant mix in the panel. All but four of the early cohort of panels are site-based, so it is reasonable to compare the early cohort results with the results for the late cohort of site-based panels. As we hope our evaluation will inform future expansions or replications of the SASH model, our aim is to identify the important characteristics of panels that are successful in lowering the rate of health care expenditure growth.
Another way to determine if having more experience is one of the defining characteristics of a SASH panel that is successful in reducing the rate of Medicare expenditure growth is to separate the results by year. For this reason, we report the estimates for the SASH effect on total Medicare expenditures separately for each of the three years of the program. We hypothesize that we will see larger reductions in total Medicare expenditure growth for later years if panel experience is an important factor in panel success.
In the analysis that follows, we use a single comparison group as described in Section 3. In the First Annual Report, there were two separate comparison groups used to identify the effects of the SASH program on Medicare expenditures and health care utilization: (1) Medicare FFS beneficiaries participating in the Vermont Blueprint for Health and living in publicly-assisted housing where SASH was not available (similar to the current comparison group); and (2) Medicare FFS beneficiaries living in publicly-assisted housing in the state of New York who were assigned to primary care practices that were not recognized as medical homes. Due to concerns about the differences between the selection of the sample of SASH participants and the selection of the sample of the New York comparison beneficiaries, we have moved the descriptive and multivariate analyses using the New York comparison group to Appendix E. Specifically, the SASH participants and non-participants in Vermont could enter or exit the sample quarterly based on their assignment to a primary care practice, while the New York beneficiaries could only enter or exit the sample on an annual basis. Also, the New York comparison group beneficiaries were assigned to medical practice units that could be much larger than the medical practice units used for assignment in Vermont. Both of these differences in sample selection between Vermont and New York have the potential to create differences between the populations which are due to their selection into the sample, and not to any effect of the SASH program. This potential for bias in the results convinced us to focus the report on results using the Vermont comparison group. (For further details and complete multivariate results using the New York comparison group, see Appendix E.)
4.1. Methods
Our quantitative analysis estimates the impact of the SASH program on outcomes using regression methods. Details on the quantitative data and models used for this analysis are contained in Appendix C. The results comparing the SASH participants to the non-SASH participants in Vermont are presented in this section. As discussed in the Section 3, only SASH participants in affordable congregate housing are included in the analysis (see Figure 3-1); we define beneficiaries living in "affordable congregate housing" as those who are found in the PIC, TRACS, or LIHTC data bases. Note that all residents of LIHTC properties (as identified in the LIHTC data base) are eligible for inclusion in the sample, whether or not they receive rental assistance. Note also that voucher recipients are excluded from the analysis, because they live in the community and not in the SASH host site.
For the Medicare expenditure outcomes, we use a linear version of the difference-in-differences (DID) model. In this case, the impact estimate is the difference between SASH program participants and the comparison group in the change in level of the Medicare expenditure outcomes between the baseline and intervention periods. As such, we will refer to this estimate as a DID estimate, which can be considered the average program effect across the entire period of SASH participation through June 2014. A negative DID estimate indicates that, between the baseline and intervention periods, average Medicare expenditure outcomes among SASH program participants either increased by a smaller amount or decreased by a larger amount, relative to the comparison group. Thus, negative DID estimates are indications that the SASH program was successful in reducing the trends in expenditures among intervention beneficiaries, relative to the comparison group. Positive DID estimates reflect that average Medicare expenditure outcomes among SASH program participants either increased by a larger amount or decrease by a smaller amount, relative to the comparison group.
For the utilization outcomes, we use a non-linear (negative binomial) version of the regression model. In this case, the impact estimate shows whether during the intervention period, the regression-adjusted utilization rate increased or decreased among SASH program participants, relative to the comparison group. The estimate does not have a DID interpretation, so for utilization outcomes we will simply refer to the "impact estimate" or "SASH program effect." Positive numbers indicate that the SASH program was associated with increased utilization relative to the comparison group, whereas negative numbers indicate a decrease in utilization.
4.2. Support and Services at Home Program Outcomes Analysis
4.2.1. Expenditure Outcomes
SASH coordinators and wellness nurses emphasize prevention, nutrition, and healthy living in their work with SASH participants. Blood pressure clinics and foot clinics provided by the SASH staff help to identify health problems before they lead to costly adverse health events. We would expect these efforts to result in relative reductions in the growth of Medicare expenditures, when SASH participants are compared to a similar group of non-participants. In this section, we analyze the effect of the SASH program on Medicare expenditures.
Descriptive Statistics. Presented in Table 4-1 are the weighted average quarterly PBPM Medicare expenditures for the SASH program beneficiaries and the comparison group. For both intervention and comparison groups, we report the average quarterly PBPM Medicare expenditures during a baseline period that runs from July 1, 2010, through June 30, 2011, the year before the start of the SASH program These baseline expenditures are provided in order to give context for the regression results presented in Table 4-2 and Table 4-3. Also, these descriptive statistics help to establish that our intervention and comparison groups have similar Medicare expenditures at baseline, supporting the validity of the comparison group. We anticipate that the SASH program may help to reduce the growth in some of these categories of Medicare expenditures.
| TABLE 4-1. Average Quarterly PBPM Medicare Expenditures for SASH Participants and Non-SASH Comparison Beneficiaries for the Baseline Period July 2010-June 2011 | ||
|---|---|---|
| Expenditure Type | SASH Treatment Group1 | Non-SASH Comparison Group2 |
| Total Medicare | $681 | $758 |
| Acute care | $220 | $260 |
| Post-acute care | $55 | $91 |
| ER | $37 | $37 |
| Hospital outpatient department | $162 | $166 |
| Primary care/specialist physician | $85 | $70 |
NOTES: Average expenditures are weighted by propensity score weights for the comparison groups and eligibility fraction for all Medicare beneficiaries.
| ||
It is interesting to note that total Medicare expenditures are largely comprised of expenditures to acute care hospitals and expenditures to hospital outpatient departments. Together, these two expenditure categories accounted for over half of all Medicare expenditures, for both the SASH participants in our sample and the non-SASH comparison beneficiaries.
During the baseline period, average total PBPM Medicare expenditures were somewhat higher among the non-SASH comparison group, compared to SASH participants ($758 vs. $681); acute care expenditures were also a little higher among the non-SASH comparison group ($260 vs. $240). ER expenditures and hospital outpatient expenditures were very similar between SASH participants and comparison beneficiaries. Note that these baseline differences are controlled for in the regression models, but the descriptive comparisons help to reassure that the two populations are fairly similar in their baseline Medicare expenditures.
Regression Estimates. To answer our first two research questions, we estimate the impact of the SASH program on the health care utilization outcomes listed in Table 4-1. Among the population of Medicare FFS beneficiaries who are living in affordable congregate housing and attributed to Blueprint for Health PCPs, we compare SASH participants to beneficiaries who are not participating in SASH. Our regression model controls for all of the beneficiary characteristics listed in Table 3-2--age, household income, household size, two measures of health status, as well as indicators for race, sex, eligibility for Medicare due to disability, dual-eligibility for Medicare and Medicaid, and end-stage renal disease (ESRD)--and also controls for differences in the housing properties that do not change over time. See Appendix C.5 Regression Analysis for further details on the model used to estimate the impact of the SASH program on the Medicare expenditure outcomes in this section.
The results of the regression analysis are interpreted as DID estimates in the Medicare expenditures between the SASH sample and the comparison group; these are reported in Table 4-2. Positive coefficients in the table indicate that the growth in Medicare expenditures was higher among the SASH participants relative to the comparison group. Negative coefficients indicate that the growth in Medicare expenditures was lower among SASH participants and would signal that the SASH program was successful in reducing the growth of these Medicare expenditures. Statistically significant results in the table are denoted by asterisks (*).
The first column of Table 4-2 reports the results for all SASH participants in the sample. Columns 2 and 3 separately report the effects of SASH on Medicare expenditure growth for the early panel cohort (2) and for the late panel cohort (3). We present the results for the subset of site-based panels in column 4 and the mixed-panels in column 5. Column 6 contains the effects of the SASH program on the growth in Medicare expenditures for SASH participants who belong to site-based panels in the late panel cohort.
| TABLE 4-2. Overall DID Estimates for PBPM Six Categories of Medicare Expenditures, Comparing SASH Program Participants to Non-SASH Comparison Beneficiaries, January 2006-2014 | ||||||
|---|---|---|---|---|---|---|
| Expenditure Type | (1) All SASHP Participants (n=1,602) | (2) Early SASHP Panels (n=699) | (3) Late SASHP Panels (n=933) | (4) Site-BasedP Panels (n=1,218) | (5) Mixed-Panels (n=384) | (6) Late Site-Based Panels (n=614) |
| Total Medicare | -12.31 (57.1) | -127.99* (71.7) | 62.18 (71.55) | -65.76 (62.12) | 121.25 (95.78) | 2.74 (82.39) |
| Acute care | 5.08 (33.61) | -27.97 (42.49) | 26.36 (41.7) | -15.27 (36.78) | 56.25 (54.93) | 4.84 (48.77) |
| Post-acute care | 5.44 (17.86) | -21.91 (21.23) | 27.56 (22.54) | -8.63 (18.95) | 48.96 (31.03) | 13.08 (25.18) |
| ER | -4.54 (3.75) | -9.18** (4.17) | -2.62 (4.9) | -6.19 (3.95) | -1.83 (6.47) | -5.18 (5.47) |
| Hospital outpatient department | -10.33 (11.7) | -26.56* (14.33) | -2.13 (14.18) | -17.95 (12.44) | 7.20 (19.54) | -17.80 (15.05) |
| Primary care/ specialist physician | -1.69 (4.15) | -9.11* (5.26) | 3.69 (5.21) | -4.27 (4.58) | 5.57 (6.47) | 1.51 (6.15) |
| NOTES: * p0.10; ** p0.05; *** p0.01; standard errors are in parentheses. The early SASH panel cohort is comprised of SASH participants receiving services from SASH panels that were operating before April 1, 2012. The late SASH panel cohort comprises participants receiving services from SASH panels that were operating on or after April 1, 2012. Site-based panels have greater than 50% of participants living in affordable congregate housing. Mixed-panels have greater than 50% of participants living in the community. | ||||||
-
Total Medicare Expenditures: Among all SASH participants, there is no significant reduction in the growth of total Medicare expenditures, relative to the comparison group. For the early panel cohort, the SASH program reduced the growth in total Medicare expenditures by $128 PBPM. This significant result is consistent with the findings in the First Annual Report. No other subset of SASH panels exhibit significant reductions in total Medicare expenditure growth.
-
Acute Care Expenditures: There was no evidence that the SASH program significantly reduced the growth rate of acute care expenditures in the first 3 years of the program, for all SASH participants relative to the comparison group, or for participants in any of the subsets of SASH panels. None of the reported differences in acute care expenditure growth were statistically significantly different from zero.
-
Post-Acute Care Expenditures: When we examine post-acute care expenditures, we do not find any significant differences between the all SASH participants and the comparison group, or between any of the subsets of SASH participants and the comparison group.
-
Emergency Room Expenditures: The growth rate in ER expenditures is $9.18 lower for the SASH participants in the early panel cohort than for the comparison group, but all other subsets of SASH participants do not have a significant difference in ER expenditure growth, nor does the entire sample of SASH participants.
-
Hospital Outpatient Expenditures: SASH participants in the early panel cohort experienced $26.56 lower growth in hospital outpatient expenditures relative to the comparison group, but no other sample of SASH participants had significantly lower growth relative to the comparison group.
-
Primary Care/Specialist Physician Expenditures: Among all SASH participants, there is no significant reduction in the growth of primary care/specialist physician expenditures, relative to the comparison group. For the early panel cohort, the SASH program reduced the growth in total Medicare expenditures by $9.11 PBPM. No other subset of SASH panels exhibit significant reductions in primary care/specialist physician expenditure growth.
Based on the results in Table 4-2, we have no statistically significant evidence that the SASH program was associated with a decrease or increase in the growth of any of the examined Medicare expenditure measures for the entire population of SASH participants in the sample, across the first 3 years of the SASH program. When we report the results for the early panel cohort separately, we do find significantly lower PBPM growth in total Medicare expenditures, ER expenditures, hospital outpatient expenditures, and primary care/specialist expenditures. The rate of growth in PBPM Medicare expenditures for acute care hospital services and post-acute care services were also trending lower among SASH participants belonging to early SASH panels, but the difference did not reach statistical significance.
There are no significant differences in the growth in Medicare expenditures relative to the comparison group when site-based panels and mixed-panels are considered separately. The rates of growth for all of the expenditure categories among SASH participants in site-based panels are trending lower, while the rates of growth for all but one of the expenditure categories for SASH participants in the mixed-panels are trending higher, but at this point in the evaluation, we can draw no inferences on any differences in the effect of the SASH program on site-based versus mixed-panels. We estimate no significant effect of the SASH program on the Medicare expenditure growth of SASH participants who are in the late cohort of site-based panels.
Another way to answer our second research question relating to how the panel characteristics affect the SASH panel's effectiveness in reducing the growth of Medicare expenditures is to examine the yearly DID estimates, as seen in Table 4-3. We estimate the same model as in Table 4-2, and note that the All Years Combined results in the fourth row of Table 4-3 (included for reference) are the same as the Total Medicare results in the first row of Table 4-2. The All Years Combined results in the fourth row can be thought of as a weighted average of results for Year One, Year Two, and Year Three. Note that for the late panels, Year One results include data for only a few participants in the last quarter of Year One.
As in Table 4-2, the results of the regression analysis are interpreted as DID in the Medicare expenditures between the SASH sample and the comparison group. Positive coefficients in the table indicate that the growth in Medicare expenditures was higher among the SASH participants relative to the comparison group in that particular year (or in all years in the All Years Combined row). Negative coefficients indicate that the growth in Medicare expenditures was lower among SASH participants and would signal that the SASH program was successful in reducing the growth of these Medicare expenditures. Statistically significant results in the table are denoted by asterisks (*).
The first column of Table 4-3 reports the results for all SASH participants in the sample. Columns 2 and 3 separately report the effects of SASH on Medicare expenditure growth for the early panel cohort (2) and for the late panel cohort (3). We present the results for the subset of site-based panels in column 4 and the mixed-panels in column 5. Column 6 contains the effects of the SASH program on the growth in Medicare expenditures for SASH participants who belong to site-based panels in the late panel cohort.
-
Year One: Among all SASH participants, and among all subsets of SASH participants, there is no significant reduction in the growth of total Medicare expenditures in Year One, relative to the comparison group.
-
Year Two: The rate of growth of total Medicare expenditures was $164.51 higher among all SASH participants relative to the comparison group. For the late panel cohort and the late site-based panel cohort, we also report significantly higher growth in total Medicare expenditures in Year Two, which may indicate unmet demand for health care that was recognized at the start of SASH participation. Keep in mind that, for the late panels, Year Two was essentially the first year of implementation.
-
Year Three: For early panels, the rate of growth of total Medicare expenditures was $221.25 lower in Year Three. For site-based panels, the rate of growth of total Medicare expenditures was $188.45 lower in Year Three. It is difficult to determine, based on these results, whether additional experience as a SASH panel or having a majority of participants living in the SASH site is the more important characteristic of a successful panel.
| TABLE 4-3. Yearly DID Estimates for Total PBPM Medicare Expenditures, Comparing SASH Program Participants to Non-SASH Comparison Beneficiaries: January 2006-June 2014 | ||||||
|---|---|---|---|---|---|---|
| Year | All SASH Participants (n=1,602) | Early SASH Panels (n=699) | Late SASH Panels (n=933) | Site-Based Panels (n=1,218) | Mixed-Panels (n=384) | Late Site-Based Panels (n=614) |
| Year One | -24.54 (79.27) | -52.55 (90.35) | -52.28 (177.12) | -22.43 (84.73) | -48.66 (195.09) | 51.57 (207.14) |
| Year Two | 164.51* (81.72) | -33.95 (106.64) | 317.4* (111.43) | 108.02 (91.14) | 253.51 (156.5) | 288.24* (133.61) |
| Year Three | -124.07 (76.02) | -221.25* (94.24) | -71.76 (85.91) | -188.45* (81.2) | 59.8 (116.36) | -156.18 (96.01) |
| All years combined | -12.31 (57.1) | -127.99* (71.7) | 62.18 (71.55) | -65.76 (62.12) | 121.25 (95.78) | 2.74 (82.39) |
| NOTES: * p0.10; ** p0.05; *** p0.01; standard errors are in parentheses. | ||||||
We have no statistically significant evidence that the SASH program was associated with a lower rate of total Medicare expenditure growth for the entire population of SASH participants in the sample, across the first 3 years of the SASH program combined, or looking at each year separately. When we report the results for early panel cohorts and late panels cohorts separately, we find that the lower growth rate in total Medicare expenditures for the early panel cohort was particularly strong in Year Three. This is consistent with the idea that panels need a certain amount of start-up time before their implementation of the SASH program becomes fully effective
When site-based panels and mixed-panels are considered separately, we find significant reductions in total Medicare expenditure growth for the site-based panels, but only in Year Three. With additional data in the next report, we will continue examine how the patterns of Medicare expenditure growth are affected by an additional year of the SASH program and characteristics of the panel participants.
4.2.2. Utilization
SASH coordinators and wellness nurses work together with health care providers when appropriate to ensure successful hospital discharges and overall coordination and continuity of care for SASH participants. We would expect these efforts to result in relative reductions in adverse health events such as all-cause acute care hospitalizations, all-cause ER visits, ER visits not leading to a hospitalization, and unplanned readmissions, when SASH participants are compared to a similar group of non-participants. In this section, we analyze the effect of the SASH program on health care utilization.
Descriptive Statistics. Presented in Table 4-4 are the weighted quarterly health care utilization rates for the SASH program beneficiaries and the Vermont comparison group of residents of affordable congregate housing who are not participating in the SASH program. For both intervention and comparison groups, we report the weighted quarterly utilization rates for the baseline period, 1 year prior to the start of the SASH program in July 2011. These quarterly rates of all-cause acute care hospitalizations, all-cause ER visits, ER visits not leading to a hospitalization, and unplanned readmissions are provided in order to give context for the regression results presented in Table 4-5. Also, these descriptive statistics help to establish that our intervention and comparison groups have similar outcomes at baseline, supporting the validity of the comparison group. We anticipate that the SASH program may help to reduce some of these adverse health events, by promoting care coordination, primary care, and hospital discharge planning.
During the baseline period, we saw some small differences in the levels of acute care utilization between our SASH participants and the non-SASH comparison group. Rates of all-cause hospitalization were lower among the SASH participants, 61.5 hospitalizations per 1,000 beneficiary quarters relative to 69.4 hospitalizations per 1,000 beneficiary quarters for the non-SASH comparison group. The baseline rate of all-cause ER visits and the subset of ER visits not leading to a hospitalization were slightly higher among SASH participants than among the non-SASH comparison group, and unplanned readmissions were also slightly lower for the SASH participants in our sample. Note that these baseline differences are controlled for in the regression models, but the descriptive comparisons help to reassure that the two populations are fairly similar in their rates of hospital visits, ER visits, and hospital readmissions prior to the start of the SASH program.
| TABLE 4-4. Quarterly Average Utilization of Services for SASH Participants and Non-SASH Comparison Beneficiaries for the Baseline Period July 2010-June 2011 | ||
|---|---|---|
| Utilization Outcome | SASH Treatment Group1 | Non-SASH Comparison Group2 |
| All-cause acute care hospitalizations | 61.5 | 69.4 |
| All-cause ER visits | 251.3 | 222.1 |
| ER visits not leading to a hospitalization | 214.5 | 193.6 |
| Unplanned readmissions | 10.7 | 13.6 |
NOTES: Utilization is measured in rates per 1,000 beneficiaries per quarter, except for unplanned readmissions which are measured in rates per 100 live discharges. Average utilization is weighted by propensity weights for the comparison group.
| ||
Regression Estimates. To answer our third research question, we estimate the impact of the SASH program on the health care utilization outcomes described in Table 4-4: all-cause acute care hospitalizations; all-cause ER visits; ER visits not leading to a hospitalization; and unplanned readmissions. Among the population of Medicare FFS beneficiaries who are living in affordable congregate housing and attributed to Blueprint for Health PCPs, we compare SASH participants to beneficiaries who are not participating in SASH. Our regression model controls for all of the beneficiary characteristics listed in Table 3-2--age, household income, household size, two measures of health status, as well as indicators for race, sex, eligibility for Medicare due to disability, dual-eligibility for Medicare and Medicaid, and ESRD--and also controls for differences in the housing properties that do not change over time. See Appendix C.5 Regression Analysis for further details on the non-linear model used to estimate the impact of the SASH program on the health care utilization outcomes in this section.
The results of the regression analysis are interpreted as differences in the utilization rates between the SASH sample and the comparison group; these are reported in Table 4-5. Positive coefficients in the table indicate that the rate of hospital or ER visits was higher among the SASH participants relative to the comparison group. Negative coefficients indicate that the utilization rate was lower among SASH participants and would signal that the SASH program was successful in reducing these adverse health events. Statistically significant results in the table are denoted by an asterisk (*).
The first column of Table 4-5 reports the results for all SASH participants in the sample. Columns 2 and 3 separately reports the effects of SASH on health care utilization for the early panel cohort (2) and for the late panel cohort (3). We present the results for the subset of site-based panels in column 4 and the mixed-panels in column 5. Column 6 contains the effects of the SASH program on the SASH participants who belong to site-based panels in the late panel cohort.
-
All-Cause Acute Care Hospitalizations: There was no evidence that the SASH program significantly reduced all-cause acute care hospitalizations in the first 3 years of the program, for all SASH participants relative to the comparison group, or for any of the subsets of SASH panels. None of the reported differences in all-cause acute care hospitalization rates were statistically significantly different from zero.
-
All-Cause ER Visits: While we might expect to see that the SASH program reduces all-cause ER visits, the regression results indicate that there are no statistically significant differences in the rate of all-cause ER visits, relative to the comparison group, in the first 3 years of the SASH program, for the entire sample (column 1) or for any of the subsets of SASH participants.
-
ER Visits not Leadingto a Hospitalization: When we examine ER visits not leading to a hospitalization, we do not find any significant differences between the all SASH participants and the comparison group, or between any of the subsets of SASH participants and the comparison group.
-
Unplanned Readmissions: Better hospital discharge planning and care coordination might be expected to reduce unplanned readmissions following hospitalization. However, we find no evidence that the SASH program had a significant effect on hospital readmissions for the population of SASH participants living in affordable congregate housing and attributed to Blueprint for Health practices, relative to the population of Blueprint for Health beneficiaries living in affordable congregate housing and not participating in the SASH program. None of the six groups of SASH participants considered show a significant reduction in unplanned readmissions.
Thus, we have no statistically significant evidence that the SASH program was associated with a decrease or increase in any of the examined health care utilization measures for the entire population of SASH participants in the sample, across the first 3 years of the SASH program. When we report the results for early panel cohorts and late panels cohorts separately, we do not find any significant differences in the utilization rates comparing the SASH participants to the comparison group. Similarly, there are no significant differences in utilization rates relative to the comparison group when site-based panels and mixed-panels are considered separately. We estimate no effect of the SASH program on the heath care utilization of SASH participants who are in late, site-based panels.
| TABLE 4-5. SASH Program Effect Estimates for Utilization, Comparing SASH Program Participants to Non-SASH Comparison Beneficiaries, January 2006-June 2014 | ||||||
|---|---|---|---|---|---|---|
| Utilization Outcome | (1) All SASH Participants (n=1,602) | (2) Early SASH Panels (n=699) | (3) Late SASH Panels (n=933) | (4) Site-Based Panels (n=1,218) | (5) Mixed-Panels (n=384) | (6) Late Site-Based Panels (n=614) |
| All-cause, acute care hospitalizations1 | 2.78 (6.33) | -5.54 (7.59) | 7.28 (8.85) | -2.05 (6.41) | 17.76 (14.53) | 0.33 (8.87) |
| All-cause ER visits1 | 6.72 (8.60) | 3.23 (10.49) | 6.53 (11.13) | 3.23 (8.90) | 18.91 (16.79) | 0.88 (12.68) |
| ER visits not leading to a hospitalization1 | 2.42 (5.29) | 1.53 (6.76) | 1.30 (6.79) | 1.35 (5.62) | 6.53 (10.03) | -2.13 (8.01) |
| Unplanned readmissions2 | 4.79 (9.39) | 1.65 (12.38) | 14.29 (16.76) | 11.31 (14.17) | -4.21 (11.59) | 26.47 (27.13) |
NOTES: The early SASH panel cohort is comprised of SASH participants receiving services from SASH panels that were operating before April 1, 2012. The late SASH panel cohort comprises participants receiving services from SASH panels that were operating on or after April 1, 2012. Site-based panels have greater than 50% of participants living in affordable congregate housing. Mixed-panels have greater than 50% of participants living in the community.
| ||||||
Given the reduced growth in Medicare expenditures that we observe for SASH participants in the early panel cohort and, in the third year, for the site-based panel cohort, it is surprising that we do not find corresponding reductions in health care utilization for those subgroups. While the magnitudes of the change in all-cause hospitalizations for the early SASH panels are negative for these populations, which would be consistent with the reduced growth in expenditures, the effects do not reach statistical significance in the first 3 years (July 2011-July 2014) of the SASH program. In the next evaluation report, we will explore further the relationship between reductions in Medicare expenditure growth and health care utilization.
5. CONCLUSION
A primary goal of the SASH program is to create linkages with a diverse team of service, health care, and housing providers, enabling better coordination of care for SASH program participants. The SASH program was designed to extend the work of the Blueprint for Health's CHTs. Each SASH panel includes a coordinator and wellness nurse who work in collaboration with community partners, such as the COA/AAAs, VNAs, and mental health agencies, to assist SASH participants. Our qualitative analysis explored how the relationships between the SASH program and the community partners changed over the first 2 years of the SASH program, and what challenges remain.
The establishment of the SASH program initially created tension and apprehension about overlapping responsibilities among some of the community partners. These relationships improved considerably by the second year of the SASH program, as community partners gained a better understanding of the strengths of the SASH program and as roles and responsibilities were more clearly defined. Concerns from other community-based providers about duplication of services remain with regard to the SASH program's extension into the community. Partner organizations are skeptical that SASH resources can effectively serve large numbers of community participants, particularly in more rural areas of the state. The next SASH Evaluation report will explore in more detail the SASH community participants and community panels.
The SASH intervention group for the quantitative analysis of this Second Annual Report consists of Medicare FFS beneficiaries residing in SASH properties who have also been attributed to practices participating in the Blueprint for Health from July 1, 2011, through June 30, 2014, and who participate in SASH panels that started within that same time period.
Designated SASH sites include a range of non-profit affordable housing properties funded through a variety of sources, including HUD, LIHTC, USDA, and other sources available through the State of Vermont. Sites also include a few mobile home parks. This current analysis includes properties that receive funding assistance though HUD or tax credits through LIHTC, expanding on the First Annual Report which was not able to include LIHTC properties
As of June 30, 2014, there were 3,485 Medicare FFS beneficiaries participating in the SASH program. After applying a number of beneficiary and property exclusions, the SASH program sample for this analysis included 1,602 Medicare beneficiaries. The two primary reasons for exclusion were: (1) not being attributed to a Blueprint for Health practice as of June 30, 2014; and (2) living in the community (that is, not living in HUD-assisted or LIHTC housing). While this sample size is almost three times larger than the sample of SASH participants in the previous report, there is still large amount of variation in the observed outcomes, producing large standard errors and confidence intervals and limiting the outcomes that we could study for this report. Also, our ability to identify statistically significant differences in the effect of the SASH program across different types of panels is limited by the sample size. Our comparison group was comprised of Vermont Medicare FFS beneficiaries who were attributed to a primary care practice participating in the Blueprint for Health but who were living in publicly-assisted housing properties where SASH was not active.
Despite these limitations, we observe that the SASH program is associated with a reduction in the rate of growth in total Medicare expenditures and expenditures for ER, hospital outpatient departments, and primary care/specialist physicians among SASH panels that started within the first 9 months of the SASH program. The decreased growth in Medicare expenditures was particularly strong in Year Three of the SASH program for these SASH participants in the early panels, which is consistent with the hypothesis that the start-up activities for a SASH panel reduce that panel's ability to make a significant impact on Medicare expenditures and utilization in the first few quarters of operation.
Further, when we consider the site-based panels separately from the mixed-panels, we find that the site-based panels are associated with a significant decrease in total Medicare expenditures in Year Three of the SASH program. None of the Medicare expenditure outcomes show significant reductions in growth for any of the other subgroups of panels. Neither do we find any evidence of significant reductions in hospital or ER utilization for any set of SASH panels.
While still preliminary, our quantitative evaluation of the SASH program through June 2014 indicates that there have been significant reductions in the growth of Medicare payments for SASH participants living in publicly-assisted housing properties where the SASH panel began before April 1, 2012. The annual growth rate for Medicare expenditures is estimated to be $1,536 lower for SASH participants in the early panels than for the comparison group. Based on our evaluation results thus far, the SASH program appears to be a promising model for reducing Medicare expenditures by providing services for elderly residents of affordable congregate housing properties. As additional years of data become available, further research will help us to determine if the later cohort of SASH panels are as successful in reining in Medicare cost growth as the early panels have been, and if the expenditure reductions experienced by the early panels in the first 3 years are sustained over a longer period of time.
REFERENCES
Austin, P.C. (2011). An Introduction to Propensity Score Methods for Reducing the Effects of Confounding in Observational Studies. Multivariate Behavioral Research, 46(3), 399-424.
Cameron, A.C., & Trivedi, P.K. (2005). Microeconometrics: Theory and Applications. Cambridge, UK: Cambridge University Press.
Puhani, P.A. (2012). The Treatment Effect, the Cross Difference, and the Interaction Term in Nonlinear "Difference-in-Differences" Models. Economics Letters, 115, 85-87.
APPENDIX A. QUALITATIVE DATA AND METHODS
A.1. Annual Site Visits
The RTI/LeadingAge team conducted the second annual site visit over a 3-day period in March 2014. The purpose of the site visits was to learn about the collaboration between the SASH program and community organizations--including the COAs and the AAAs, VNAs, mental health agencies, and the Blueprint for Health CHTs--and to assess successes, challenges, and the perceived value of the SASH program in terms of the impact on each community organization and the clients it serves.
Two 2-person teams traveled to four different geographic areas of Vermont--Burlington, Rutland, St. Johnsbury, and Central Vermont--and conducted a total of 22 interviews with SASH community partners. Table A-1 shows the number of interviews by type of organization. We interviewed both executive-level and management-level staff and frontline staff (i.e., case managers and nurses) at the COAs, AAAs, and VNAs to capture any differences in perspective given their varying roles and points of engagement with the SASH program. From the mental health agencies, we interviewed elder care clinicians: social workers, psychologists, and mental health professionals. We also interviewed CHT project managers and CHT coordinators.
| TABLE A-1. Number of Interviews by Type for the SASH Evaluation Second Annual Site Visit | |
|---|---|
| Organization | Number of Interviewees |
| COAs/AAAs | 8 |
| VNAs | 4 |
| Mental health agencies | 4 |
| CHT staff | 6 |
| Total | 22 |
Protocols were developed by RTI/LeadingAge and reviewed by ASPE and HUD. The protocols were designed to help understand:
-
Experiences with staffing multiple SASH panels.
-
Coordination and interaction with SASH interdisciplinary team members.
-
Perceived facilitation or duplication of efforts.
-
Perceived impact of SASH on the organization's ability to serve clients.
-
Perceived impact of SASH on the organization's clients.
-
Benefits or challenges to the organization for participating in the SASH program.
Interview protocols were tailored to specific respondent types. Interviews were approximately one hour in length and were recorded to ensure notes were complete and accurate. For the second site visit report, RTI/LeadingAge produced a high-level summary of findings to address key research questions.
A.2. Quarterly Conference Calls
The RTI/LeadingAge team held four quarterly conference calls with SASH staff, key stakeholders, and ASPE/HUD during the second year of the evaluation. The primary purpose of the quarterly calls was to understand the details of program implementation and operation, monitor implementation progress, and identify implementation and operational successes and challenges as the SASH program expands statewide and matures. The quarterly calls helped inform the evaluation team on areas of investigation for the annual site visits.
Each call was organized around the following structure:
-
An update on the current status of implementation, including the number of existing panels and participants and any planned new panels.
-
An update of any significant changes, challenges, or success regarding program implementation.
-
An in-depth discussion of a specific program implementation or operational element.
In Year Two, the following four topical areas were discussed:
-
SASH implementation update and trainings provided to the DRHOs, housing host sites, and SASH teams.
-
Establishment of the Blueprint for Health CHTs and issues surrounding SASH's role as an extender of the CHTs.
-
DRHOs' experiences since launching the SASH program in their region.
-
Discrepancies between SASH participant lists and the individuals that are included in the data on publicly-assisted housing residents received from HUD.
The calls were conducted with the appropriate SASH staff and other key stakeholders depending on the focused topic of the call. Staff included CSC SASH program staff, the Blueprint for Health Executive Director, and DRHO leadership. A discussion guide was created for each quarterly call. The guide was sent to ASPE and HUD for review and input and then forwarded to the call participants prior to the call to allow them to prepare any necessary information or data.
APPENDIX B. SUPPORT AND SERVICES AT HOME TEAM TRAINING
Training for the SASH teams primarily fall into two main areas: (1) self-care management programs; and (2) skill-building. Self-care management trainings include topics such as:
-
CDSMP: The grants from the Department of Disabilities, Aging and Independent Living (DAIL) and the DVHA have elements that pertain to the CDSMP program. The DAIL grant includes a performance measure requiring them to train a minimum number of SASH staff to lead CDSMP classes and offer classes statewide by the end of the grant period (June 30, 2014). The DVHA grant provides some funding for the coordination of staff training and certification, and pays for materials, registration, and transportation.
-
Prevention and Self-Management of Hypertension and Pre-Hypertension and Smoke-Free Housing and Tobacco Cessation: These are funded in part by community transformation grants from CDC, which are only for rural areas. Through the Department of Health and the Blueprint for Health, SASH has been able to get training to all SASH sites around the state. This training provides a chance for SASH coordinators to work in tandem with the SASH wellness nurses and PCPs as community health workers. The grant is a lot of work but they feel they are seeing a lot of great things come out of it.
-
Fall Prevention: SASH works with the Vermont Physical Therapist (PT) chapter to bring training to different sites. The PT goes into SASH sites and conducts presentations on fall safety, looks at people's shoes, canes, and walkers, and performs falls risk assessments. In conjunction with the University of Vermont Center on Aging, SASH created a video on home safety assessment and falls prevention that they distributed to all SASH staff.
-
Nutrition: When the SASH program was smaller, they were able to have a nutritionist from the CHTs do presentations at all the SASH sites. It was good for collaboration and a good training for SASH coordinators. Many wellness nurses are doing group presentations around nutrition (e.g., making healthy soups, how to get vitamin C into your diet), because they have such a high nutritional deficit in many areas. The program has gotten so big, however, that it is hard to coordinate this at a statewide level. SASH wants to keep fostering collaboration with CHTs because it is a great way to become educated on this topic and will help nurture the partnership.
-
Aging Well: This program was designed by the recipient of geriatric fellowship from the University of Vermont Center on Aging, who took a year off from medical school to work with the SASH program. He developed it with the help of SASH participants. The program consists of one-hour sessions around positive topics on aging. A large portion of SASH staff have been trained throughout Vermont and SASH has received very positive feedback on the program.
-
Alzheimer's: SASH worked with the Alzheimer's Association around training and delivering two programs--"Know the 10 Signs" and "The Basics of Dementia/Alzheimer's." In September 2012, SASH conducted a big training with the coordinators on delivering the programs. The programs have had some success, but SASH is looking at ways to revise the training. SASH coordinators felt they needed a little more in depth training.
-
Tai Chi: SASH has lots of requests for training in this area. As of the end of 2013, SASH had 25 trained leaders. SASH collaborates with the Champlain Valley AAA for northern Vermont; they organize and deliver the leader training classes. The Arthritis Foundation does it for southern Vermont. The program is really well received by participants and they are often asking for more classes. SASH coordinators have great interest in getting trained. CSC is working with organizational leaders around the state to see how they can better coordinate training and make the resources more available to individuals.
-
Wellness Recovery Action Planning: This is a mental health self-management program. The Blueprint for Health has limited resources in getting people trained in how to deliver this program. SASH is eagerly waiting because they have such a high need for mental health services.
Skill-building trainings include the following topics:
-
Motivational Interviewing: This has become a skill of interest in Vermont and nationally. It really challenges SASH staff to look at how they are working with people. SASH (and CHTs) has made it a requirement to get the basic knowledge on motivational interviewing.
-
Compassion/Managing Difficult People: At the request of SASH staff, they collaborated with a physician from Fletcher Allen to develop a training program on this topic. He also did a component on time management with a compassion framework.
-
Facilitating Team Meetings: SASH coordinators are challenged by facilitating a meeting with other staff coming from different backgrounds (e.g., clinical, case management). Everyone has a different approach and they have to be reminded to maintain a person-centered mentality.
-
DocSite Training: This is an ongoing and constant training process that SASH staff take part in as they can.
APPENDIX C. QUANTITATIVE DATA AND METHODS
C.1. Data
As of June 30, 2014, there were 3,485 persons with at least one-quarter of participation in SASH.8 RTI receives personal information--Social Security Number (SSN), first and last name, date of birth--for these participants from CSC, the non-profit organization that developed and administers the SASH program. The participants' personal information was then cross-referenced with Medicare claims data for persons assigned to practices in the MAPCP Demonstration in Vermont as of June 30, 2014. Of those 3,485 participants, 2,260 were positively identified as Medicare/MAPCP beneficiaries. MAPCP participants were further cross-referenced with HUD housing assistance records to determine congregate housing status. Only SASH participants found among both of these data sources (MAPCP and HUD) are included in this analysis, resulting in a net sample of 1,602 SASH participants.
As part of the MAPCP Demonstration evaluation, RTI receives prospective TAP Medicare claims in and after 2010 on a quarterly basis from the Actuarial Research Corporation (ARC). These files are supplemented by Medicare claims data from 2006 through 2010 pulled from the Data Extract System by RTI analysts. These longitudinal data contain the claims for all persons currently or ever attributed to a practice participating in the MAPCP Demonstration as of June 30, 2014. Beneficiary assignment occurs on a rolling basis and is triggered by the presence of qualifying current procedural terminology (CPT) codes in Medicare claims across a rolling 24-month look-back period. (For more information, see Appendix D).
Per the methods of the MAPCP Demonstration Evaluation, if after a person's initial assignment to a practice they fail to meet the assignment criteria in subsequent quarters, they are then censored in the analysis files from that point forward. A person may become uncensored (i.e., rejoin the longitudinal data), however, if they again meet the assignment criteria at some point in the future.
The Medicare claims data used in the MAPCP Demonstration Evaluation are cross-referenced against the list of SASH participants using the last four digits of the SSN,9 first and last name and date of birth. Allowances for non-exact matches were made in instances when an exact match occurred on three of the four items and the last unmatched item was of sufficient proximity (e.g., "William" to "Bill"; 01/01/1930 to 01/11/1930). All persons in the MAPCP data not identified as SASH participants were retained as potential comparison group beneficiaries.
In addition to cross-referencing SASH participants with MAPCP Evaluation data, we also tried to identify participants in 2012/2013 HUD housing records in order to verify their residence in congregate housing. The housing records come from three separate HUD data bases. TRACS is the data base for all multi-family properties (Section 202, Section 236, Section 8, etc.); PIC is the data base for public housing and housing choice vouchers; and the LIHTC is the data base for low-income housing developed through tax credits. At the time of this report, RTI had acquired TRACSs and PIC records for Vermont from 2012 and 2013 and LIHTC records from 2012. In the case of TRACSs and PIC, the most recent record for a person was retained when they appeared in both the 2012 and 2013 data bases.
All housing records were retained from the three data bases except in instances when PIC data base records were designated as voucher financing. Voucher records were removed before cross-referencing as they cannot be easily linked to specific properties and are less likely to indicate persons living in congregate housing. When a person appeared in more than one data base, single records were retained based on this hierarchy: TRACs, PICs (if not TRACs) and finally LIHTC (if not TRACs or PICs). Therefore, persons represented in this analysis as "LIHTC only" were in fact persons we could only locate among LIHTC records.
C.2. Analysis Groups
This report evaluates the effect of the SASH program on Medicare expenditures and health care utilization relative to the following two comparison groups:
-
Beneficiaries identified in HUD data bases who were ever assigned to patient-centered medical homes (PCMHs) participating the Vermont MAPCP Demonstration (Blueprint for Health).
-
Beneficiaries identified in HUD data bases who were ever assigned to non-PCMHs chosen as the comparison group for the New York MAPCP Demonstration (ADK Demonstration).
The Vermont MAPCP comparison group is the primary focus of this analysis, due to the greater degree of similarity with the SASH intervention group. Beneficiaries assigned to non-PCMH practices in New York (as part of a separate MAPCP Demonstration in that state) are considered a secondary analysis and are reported in Appendix E.
Beneficiaries in the Vermont MAPCP comparison group that were linked to properties with SASH participants were excluded from the analysis so that the comparison group would not be contaminated by individuals who were participating in or who were exposed to the treatment. Shared property status was determined using property and development identification variables found in the HUD data bases.
In addition to the full group of SASH participants, the report also examines subsets of participants associated with panels in an "early" cohort as well as participants associated with site-based panels. The early cohort of panels were defined as those where SASH services were rolled out before April 1, 2012. The 16 panels in this early cohort represent roughly 40% of the 41 panels with known participants as of June 30, 2014. A site-based panel is defined as one where the large majority of participants reside in designated SASH properties. Other panels are mixed-panels, defined as those where a greater proportion of participants reside in the community instead of in SASH properties. For each cohort analysis, the comparison group remains the same since non-SASH beneficiaries cannot be stratified by SASH panel characteristics.
C.3. Support and Services at Home Participation Start Date
This report looks at SASH participants with a participation date prior to July 1, 2014. Participation in the program occurred on a rolling basis starting in the third calendar quarter of 2011. Not until the fourth quarter of 2012 were more than half of the current participants known to be receiving SASH services. Since we are not able to reliably determine when (or if) a participant stopped receiving SASH services, all participants are viewed as participating in all quarters after their participation start date. Table C-1 presents the number of participants starting in each calendar quarter up to June 30, 2014.
| TABLE C-1. Number of Persons Starting Participation in SASH | |||||
|---|---|---|---|---|---|
| Period | Total | Early Cohort | Later Cohort | Site-Based | Mixed |
| 2011:Q3 | 19 | 19 | --- | 19 | --- |
| 2011:Q4 | 59 | 59 | --- | 52 | 7 |
| 2012:Q1 | 148 | 148 | --- | 121 | 27 |
| 2012:Q2 | 205 | 101 | 104 | 181 | 24 |
| 2012:Q3 | 222 | 30 | 192 | 139 | 83 |
| 2012:Q4 | 94 | 34 | 60 | 80 | 14 |
| 2013:Q1 | 256 | 171 | 85 | 223 | 33 |
| 2013:Q2 | 152 | 26 | 126 | 113 | 39 |
| 2013:Q3 | 104 | 20 | 84 | 62 | 42 |
| 2013:Q4 | 128 | 30 | 98 | 88 | 40 |
| 2014:Q1 | 112 | 20 | 92 | 78 | 34 |
| 2014:Q2 | 103 | 11 | 92 | 62 | 41 |
| Total | 1,602 | 669 | 933 | 1,218 | 384 |
| NOTE: The early SASH panel cohort is comprised of SASH participants receiving services from SASH panels that were operating before April 1, 2012. The late SASH panel cohort is comprised of participants receiving services from SASH panels that were operating on or after April 1, 2012. Site-based panels have greater than 50% of participants living in affordable congregate housing. Mixed-panels have greater than 50% of participants living in the community. | |||||
C.4. Weights
Beneficiaries in the two comparison groups described in Appendix C.2 receive a person-level weight based on propensity score matching methods. The propensity score is the probability of participating in the SASH program conditional on various observed beneficiary characteristics. Propensity scores are estimated using logistic regression where SASH participation is the dependent variable and beneficiary characteristics are independent variables. Comparison group beneficiaries whose propensity scores are close to those of SASH participants are more similar to the treatment group across these characteristics.
In each of the two comparison groups, SASH participants are matched to at most five comparison beneficiaries whose propensity scores were closest to that of the participant while also falling no more +0.02/-0.02 units from the participant's score. The matching algorithm utilizes replacement, and as such comparison group beneficiaries may be matched to more than one SASH participant if other suitable matches are lacking. Comparison group beneficiaries are assigned a weight that is function of the number of times they were used to match to SASH participants.10 Persons in the comparison group who fail to match to any SASH participants are dropped from the analysis. SASH participants are given a weight of one.
The purpose of matching treatment and comparison beneficiaries on propensity scores is to increase the comparability of the two groups in terms of the characteristics included in the model. As such, it reduces the confounding bias that can result from using a non-randomized control group with group means that vary substantially. In this analysis, covariates used in the propensity score model include the following characteristics: (dichotomous indicators) female, non-White, disabled, Medicaid dual-eligible and ESRD; (continuous) age, HCC risk score, Charlson score, household income and household size. An additional indicator for "LIHTC Only" was also included in the model to control for other differences in demographic characteristics between PIC/TRACS residents and LIHTC residents.
In addition to the weight derived from propensity score matching, the second component of a person's analytic weight was their quarterly eligibility fraction. A beneficiary's quarterly eligibility was measured as the fraction of days (out of 90) they met the following criteria: (1) they were a Medicare FFS beneficiary with Medicare as the primary payer; (2) they were attributed to a practice in the MAPCP Demonstration or comparison groups; and (3) they resided in Vermont. This quarterly eligibility fraction was multiplied by the matched propensity score weight (equal to one for the treatment group) to create the final analytic weight used in the analysis contained in this report.
C.5. Regression Analysis
This analysis uses the following "difference-in-differences" model to estimate the impact of the SASH program on PBPM Medicare expenditures and quarterly counts of utilization.
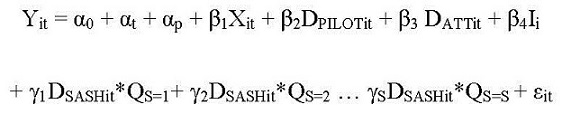 | (C.1) |
In the above equation, i is an index of the beneficiary and t the quarterly period. The dependent variable, Yit, denotes the outcome for the ith person in quarter t. Beneficiary-level covariates included in the model as controls are denoted by Xit. These covariates include age, household income, household size, HCC risk score, Charlson Comorbidity Index, as well as indicators for race, sex, eligibility for Medicare due to disability, dual-eligibility for Medicare and Medicaid, and ESRD. The error term is denoted as εit. The quarter fixed effects, αt (t = 1,2,…), control for variation in health care expenditures and utilization across time for all beneficiaries, while αp(p = 1,2,…) are property fixed effects, or individual indicators for each property. The property fixed effects allow the model to control for any characteristics of an individual property that do not change over time, such as number of units and location. By using these property fixed effects, we eliminate the need to include property-level characteristics in the model, many of which are not consistently measured across different types of properties. Both sets of fixed effects are estimated by including indicator variables in the model for each quarter and for each property.
The variable DPILOTit (= 0,1) is an indicator for assignment to a practice participating in the MAPCP pilot program (Blueprint for Health) that occurred prior to the start of the SASH program. The variable DATTit (= 0,1) is an indicator that equals 1 starting in the quarter when a beneficiary was first attributed to a practice participating in the MAPCP Demonstration. Both DPILOTit and DATTit are independent of SASH participation (and often unknown to the participant) but are controlled for in our analysis due to their potential correlation with expenditures and utilization.
The variable Ii (= 0,1) is an indicator for SASH participants and it equals one in all time periods. The variable DSASHit(= 0,1) is an indicator that switches from 0 to 1 in the quarter that a SASH participant actually started participating in the program. It remains equal to 1 in all quarter after their participation start date. The variables QS=1, QS=2… QS=S denote individual quarters during the SASH demonstration period. In this analysis there are 12 SASH demonstration quarters (2011:Q3 to 2014:Q2). These quarterly indicators are interacted with the indicator for current SASH participation (DSASHit) to measure on a quarterly basis the program effect in terms of the change in the level of the outcome--relative to the comparison group--after starting participation in the SASH program. It is these coefficients (γ1… γS) from which estimates of the impact of the SASH program are derived.
For all expenditures outcomes we estimate linear regressions using ordinary least squares. This is less appropriate for the utilization outcomes, however, which are count variables. For these outcomes we estimate a negative binomial model instead.11 The same parameters as on the right-hand side of Equation C.1 appear in this model, but the impact of the SASH program on utilization is calculated as follows.12
 | (C.2) |
The parameter τ measures the increase (γS> 0) or decrease (γS 0) in utilization during the period of SASH program participation, among SASH participants relative to beneficiaries in the comparison group. We multiply τ by 1,000 to express the SASH program effect in terms of a rate per 1,000 Medicare FFS beneficiaries.
In this report, quarterly program effects are presented at the annual level by taking the weighted average of the four quarterly coefficients within a given year. The weights used in these averages are the number of SASH participants participating in each quarter divided by the total number of quarters observed for those participants across the year. Stata's "lincom" command is used to calculate the weighted average in order to derive standard errors for the annual estimate. Standard errors in the model are clustered at the person level.
APPENDIX D. ASSIGNMENT CRITERIA FOR BENEFICIARIES IN THE MULTI-PAYER ADVANCED PRIMARY CARE PRACTICE DEMONSTRATION
In this appendix, we outline the criteria used for assigning Medicare beneficiaries to primary care practices in the MAPCP Demonstration.
D.1. Vermont
-
Use a look-back period of the most recent 24 months for which claims are available.
-
Identify all Medicare beneficiaries meeting the following criteria as of the last day in the look-back period:
- Reside in Vermont.
- Have both Medicare Parts A and B.
- Are covered under the traditional Medicare FFS Program and not enrolled in a Medicare Advantage or other Medicare health plan.
- Have Medicare as the primary payer.
-
Select all claims for beneficiaries identified in Step 2 with the following qualifying CPT Codes in the look-back period (most recent 24 months) where the provider specialty is internal medicine, general medicine, geriatric medicine, family medicine, nurse practitioner, or physician assistant or where the provider is a federally qualified health center (FQHC).
- Check for the CPT codes on the physician file. Keep the date of visit and performing National Provider Identifier (NPI) from the physician claim.
- CAH/rural health clinic (RHC) identification: Check for these CPT codes on the Outpatient Department (OPD) file where the provider is a CAH or a RHC: 1300-1399, 3400-3499, 3800-3999, or 8500-8599.
- FQHC: Check revenue codes for the visit codes listed below where the provider is an FQHC (facility type 7 and service type 1, 3, or 7).
- Keep the date of visit, attending NPI, group NPI, and provider ID from the OPD claim.
- Combine the OPD and physician claims to create one file for beneficiary assignment.
- Merge on specialty code from National Plan and Provider Enumeration System (NPPES) file (taxonomy code). Drop claims that do not match specialties listed above. This will remove claims from all non-specified specialties (e.g., psychiatric FQHC providers).
-
Assign beneficiaries to the practice where they had the greatest number of qualifying claims. Identify a practice by the tax ID (physician) or provider ID (OPD).
-
If beneficiaries had an equal number of qualifying visits to more than one practice, assign them to the one with the most recent visit.
-
Run this beneficiary assignment algorithm every 3 months.
| Qualifying CPT Codes |
|---|
E&M--Office or Other Outpatient Services
|
Consultations--Office or Other Outpatient Consultations
|
Nursing Facility Services
|
Domiciliary, Rest Home (e.g., Boarding Home), or Custodial Care Service
|
Home Services
|
Prolonged Services--Prolonged Physician Service With Direct (Face-to-Face) Patient Contact
|
Prolonged Services--Prolonged Physician Service Without Direct (Face-to-Face) Patient Contact
|
Preventive Medicine Services
|
Medicare Covered Wellness Visits
|
Counseling Risk Factor Reduction and Behavior Change Intervention
|
Other Preventive Medicine Services--Administration and Interpretation
|
Other Preventive Medicine Services--Unlisted Preventive
|
FQHC--Global Visit (billed as a revenue code on an institutional claim form)
|
Transitional Care Management Services
|
D.2. New York
-
Use a look-back period of most recent 24 months for which claims were available, with the look-period ending on June 30th of any given year.
-
Identify all Medicare beneficiaries meeting the following criteria as of the last day in the look-back period:
- Reside in New York.
- Have both Medicare Parts A and B.
- Are covered under the traditional Medicare FFS Program and not enrolled in a Medicare Advantage or other Medicare health plan.
- Have Medicare as the primary payer.
-
Select all claims for beneficiaries identified in Step 2 with qualifying CPT Codes in the look-back period (most recent 24 months) where the provider specialty is internal medicine, general medicine, geriatric medicine, family medicine, nurse practitioner, or physician assistant, or where the provider is an FQHC.
- Check for the CPT codes on the physician file. Keep the date of visit and performing NPI from the physician claim.
- CAH/RHC identification: Check for these CPT codes on the OPD file where the provider is a CAH or a RHC: 1300-1399, 3400-3499, 3800-3999, or 8500-8599.
- FQHC: Check revenue codes for the visit codes listed below where the provider is an FQHC (facility type 7 and service type 1, 3, or 7).
- Keep the date of visit, attending NPI, group NPI, and the provider ID from the OPD claim.
- Combine the OPD and physician claims to create one file for beneficiary assignment.
- Merge on specialty code from NPPES file (taxonomy code). Drop claims that do not match specialties listed above. This will remove claims from all non-specified specialties (e.g., psychiatric FQHC providers).
-
Assign beneficiaries to the provider with whom they had the greatest number of qualifying claims. Identify and define a provider by the tax ID (physician) or provider ID (OPD).
-
If beneficiaries had an equal number of qualifying claims to more than one provider, assign them first to the one with the most preventive office visit claims and, if that is equal, to the one with the most recent visit.
-
Run this beneficiary assignment algorithm every 12 months.
| Qualifying CPT Codes |
|---|
Office/Outpatient Visit E&M
|
Office Visit Preventive
|
Medicare Covered Wellness Visits
|
Consultations
|
Nursing Home and Home Care
|
Telemedicine
|
FQHC Global Visit Code (from institutional claim form)
|
Transitional Care Management Services
|
APPENDIX E. SECONDARY ANALYSIS
In addition to the primary analysis using Vermont MAPCP beneficiaries as the comparison group for the SASH participants, this appendix includes a secondary analysis with an alternative comparison group. Both comparison groups were used in the First Annual Report, but, as described below, there are important differences in the ways that the comparison groups were constructed which can affect the impact estimates. The alternative comparison group in this appendix is comprised of Medicare FFS beneficiaries in New York who were assigned to primary care practices that were not recognized as medical homes (i.e., non-PCMHs). These non-PCMH practices were selected to be part of the comparison group for the evaluation of New York's MAPCP Demonstration.
Although the practice assignment criteria for the New York non-PCMH beneficiaries and the Vermont MAPCP beneficiaries were similar, there were two key differences. The first is the frequency of the assignment process. Among Vermont MAPCP beneficiaries, the assignment algorithm was applied on a quarterly basis, while among New York non-PCMH beneficiaries, assignment occurred on an annual basis (see Appendix D). This leads to differences in both the rates at which beneficiaries enter the sample and the rates of attrition from persons who cease to meet the assignment criteria. The misalignment of the timing of the assignment process between the Vermont MAPCP intervention group and the New York comparison group has the potential to bias the regression results for our outcome variables. Without additional data, it is difficult to say in which direction the biases might go.
The second difference is in the unit to which beneficiaries are assigned. As part of the expenditure process for the MAPCP Demonstration, the ARC was able to assign MAPCP beneficiaries to providers grouped within specific primary care practices. In duplicating this process for the evaluation, RTI was only able to assign comparison beneficiaries to providers grouped under common tax identification numbers (TINs). TINs can cover a large number of providers and facilities under a single ownership entity, and so discerning specific practice characteristics at the level of a TIN is more difficult than for individual practices. This could lead to dissimilarities between those providers identified as part of the comparison group and those actually participating in the MAPCP Demonstration, which could also bias the results when using the New York non-PCMH comparison group in the regressions.
The secondary analysis in this appendix follows the same methodology outlined in Appendix C. This methodology includes the verification of beneficiaries in HUD housing records, the use of propensity score matching to balance group characteristics, and the fixed effects differences-in-differences regression models. However, since we cannot determine the effects (if any) that the aforementioned differences in assignment may have on the comparability of non-PCMH beneficiaries and SASH participants, this analysis should be considered secondary to the results presented in the main body of this report.
E.1. Participant and Property Characteristics
In the TRACS data base, we successfully linked SASH intervention beneficiaries to 65 properties and New York comparison group beneficiaries to 196 properties. The two sets of properties were very similar to each other, though properties associated with the comparison group had on average more units, lower rents, and a lower average percentage of elderly residents. In the PICs data base, we linked SASH and New York comparison group beneficiaries to 52 properties and 124 properties respectively. Properties associated with the comparison group again had on average more units and lower rents, but this time the average percentages of elderly residents between the two groups were similar. Finally, in the LIHTC data base, we were able to link SASH and comparison group beneficiaries to 56 properties and 68 properties respectively. LIHTC properties associated with the comparison group had lower average rents and household incomes as well as a lower percentage of elderly residents.
| TABLE E-1. Characteristics of Properties in which Medicare FFS SASH Program Participants and Comparison Group Beneficiaries Reside | ||
|---|---|---|
| Property Characteristics | SASH Program Properties1 | Properties Associated with Non-SASH, Non-MAPCP Demonstration Comparison Group2 |
| Total number of properties in TRACS | 65 | 196 |
| Mean number of units | 51 | 95 |
| Mean occupancy length | 5.6 | 5.5 |
| Mean household size | 1.2 | 1.3 |
| Mean household income | $15,479 | $15,011 |
| Mean tenant rent | $329 | $274 |
| Elderly residents (%) | 78 | 70 |
| Section 8 (%) | 83 | 80 |
| Metropolitan (%) | 53 | 44 |
| Micropolitan (%) | 24 | 46 |
| Rural (%) | 22 | 10 |
| Median household income (by county) | $52,214 | $46,967 |
| Average annual Medicare expenditures | $7,776 | $7,783 |
| Total number of properties in PIC | 52 | 124 |
| Mean number of units | 101 | 132 |
| Mean occupancy length (years) | 7.4 | 6.9 |
| Mean household size | 1.3 | 1.4 |
| Mean household income | $15,213 | $15,664 |
| Mean tenant rent | $313 | $248 |
| Elderly residents (%) | 54 | 54 |
| Metropolitan (%) | 30 | 26 |
| Micropolitan (%) | 62 | 73 |
| Rural (%) | 8 | 1 |
| Median household income (by county) | $53,999 | $44,891 |
| Average annual Medicare expenditures | $7,806 | $7,670 |
| Total number of properties in LIHTC | 56 | 68 |
| Mean number of units | 49 | 68 |
| Mean occupancy length (years) | --- | --- |
| Mean household size | 1.5 | 1.7 |
| Mean household income | $18,456 | $15,561 |
| Mean tenant rent | $476 | $310 |
| Elderly residents (%) | 67 | 49 |
| Metropolitan (%) | 71 | 63 |
| Micropolitan (%) | 17 | 24 |
| Rural (%) | 12 | 13 |
| Median household income (by county) | $58,004 | $46,877 |
| Average annual Medicare expenditures | $7,694 | $7,536 |
NOTES:
| ||
Table E-2 presents the unweighted and weighted demographic and health status characteristics for the SASH and New York non-PCMH Medicare FFS beneficiaries. Standardized differences between the two groups less than -0.10 or greater than +0.10 are denoted by a "star" (*). Much like the Vermont MAPCP comparison group, the non-PCMH comparison group differed from SASH participants on only a few key characteristics. Although both groups were overwhelmingly White, the non-PCMH beneficiaries from New York were slightly less likely to be White. The New York comparison group also had slightly lower average household incomes, and fewer of them were in properties that only had LIHTC assistance. However, after propensity score matching, differences between the two groups were no longer present.
| TABLE E-2. Unweighted and Weighted Baseline Demographic Characteristics and Health Status for SASH Participants and Non-SASH, Non-PCMH Comparison Group Beneficiaries | |||
|---|---|---|---|
| Demographic and Health Status Characteristics | SASH Program Beneficiaries1 | New York Non-SASH, Non-PCMH Comparison Group Beneficiaries2 | |
| Unweighted | Weighted | ||
| Total beneficiaries | 1,602 | 2,730 | 1,598 |
| Demographics | |||
| Mean age | 70.9 | 70.1 | 70.8 |
| White (%) | 97% | 94%* | 98% |
| Female (%) | 73% | 72% | 73% |
| Disabled (%) | 43% | 44% | 42% |
| Medicaid (%) | 64% | 62% | 64% |
| ESRD (%) | 1% | 1% | 1% |
| Mean household income ($) | $15,998 | $15,006* | $15,983 |
| Mean household size | 1.14 | 1.14 | 1.13 |
| Health status | |||
| Mean HCC Score | 1.27 | 1.30 | 1.26 |
| Mean Charlson Comorbidity Index | 1.03 | 1.07 | 0.99 |
| Property type | |||
| LIHTC only | 21.8% | 8.7%* | 21.2% |
NOTES:
| |||
E.2. Support and Services at Home Program Outcomes Analysis
SASH participants are evaluated across the following expenditure outcomes: total Medicare expenditures and Medicare expenditures for acute care hospitalizations, post-acute care providers, ER visits, hospital outpatient department services, and combined primary care and specialty care physician services; and the following utilization outcomes: all-cause hospitalizations and all-cause ER visits. ER visits not leading to a hospitalization and unplanned 30-day hospital readmissions were not included for this comparison group because the estimates were not stable. All expenditures outcomes are measured in dollars PBPM and were calculated by dividing quarterly expenditures by three. All utilization outcomes are measured in rates per 1,000 Medicare FFS beneficiaries.
E.2.1. Expenditure Outcomes
Descriptive Statistics. The (weighted) average quarterly PBPM Medicare expenditures for SASH program beneficiaries and the New York non-PCMH comparison group are shown in Table E-3. We present average quarterly PBPM Medicare expenditures during a baseline period that runs from July 1, 2010, through June 30, 2011, the year before the start of the SASH program. Average PBPM Medicare expenditures at baseline were very similar between SASH program participants and comparison group beneficiaries, though SASH participants had somewhat higher average expenditures to hospital outpatient departments and somewhat lower average expenditures to primary care/specialty physicians relative to the comparison group.
| TABLE E-3. Average Quarterly PBPM Medicare Expenditures for SASH Participants and New York Non-PCMH Comparison Beneficiaries for the Baseline Period July 2010-June 2011 | ||
|---|---|---|
| SASH Treatment Group1 | Non-SASH, Non-PCMH Comparison Group2 | |
| Total Medicare | $681 | $653 |
| Acute care | $220 | $217 |
| Post-acute care | $55 | $48 |
| ER | $37 | $30 |
| Hospital outpatient department | $162 | $106 |
| Primary care/specialty physician expenditure | $85 | $118 |
NOTES:
| ||
Regression Estimates. In Table E-4 we present overall DID estimates for the Medicare expenditure outcomes. Relative to non-PCMH comparison beneficiaries, we find no statistically significant decreases among SASH participants in the growth of total Medicare expenditures, acute care expenditures, post-acute care expenditures, ER expenditures, or expenditures to hospital outpatient departments. We did observe statistically significant overall decreases in the growth in expenditures to primary care/specialty physicians for all SASH participants, and also for the subgroups of early panels and site-based panels.
| TABLE E-4. DID Estimates for PBPM Medicare Expenditures, Comparing SASH Program Participants to New York Non-PCMH Comparison Beneficiaries | ||||||
|---|---|---|---|---|---|---|
| All SASH Participants (n=1,602) | Early SASH Panels (n=699) | Late SASH Panels (n=933) | Site-Based Panels (n=1,218) | Mixed-Panels (n=384) | Late Site-Based Panels (n=614) | |
| Total expenditures | 41.86 (50.08) | -89.62 (65.41) | 127.81* (64.69) | -15.11 (55.35) | 183.33* (90.07) | 67.82 (76.25) |
| Acute care | -17.42 (29.66) | -61.50 (38.45) | 4.77 (37.99) | -41.76 (32.80) | 31.05 (51.72) | -19.86 (45.30) |
| Post-acute care | 18.82 (15.56) | -11.05 (19.21) | 43.46* (20.17) | 4.27 (16.76) | 65.16* (29.09) | 29.58 (22.96) |
| ER | 5.38* (2.86) | 0.68 (3.34) | 8.52* (4.08) | 3.96 (3.06) | 9.52 (5.82) | 6.37 (4.70) |
| Hospital outpatient department | 13.07 (8.85) | -2.67 (12.27) | 23.91* (11.15) | 6.01 (9.70) | 34.31* (17.34) | 9.23 (12.05) |
| Primary care/ specialist physician | -12.36* (4.82) | -22.21* (5.87) | -7.62 (5.94) | -15.79* (5.22) | -7.19 (7.14) | -10.86 (6.84) |
| NOTES: * p0.10; ** p0.05; *** p0.01; standard errors are in parentheses. The early SASH panel cohort is comprised of SASH participants receiving services from SASH panels that were operating before April 1, 2012. The late SASH panel cohort is comprised of participants receiving services from SASH panels that were operating on or after April 1, 2012. Site-based panels have greater than 50% of participants living in affordable congregate housing. Mixed-panels have greater than 50% of participants living in the community. | ||||||
E.2.2. Utilization Outcomes
Descriptive Statistics. The (weighted) average quarterly utilization rates for SASH program beneficiaries and the New York non-PCMH comparison group are shown in Table E-5. At baseline, SASH participants had lower average rates of all-cause hospitalizations but similar rates of all-cause ER visits relative to the comparison group.
| TABLE E-5. Quarterly Average Utilization of Services for SASH Participants and New York Non-PCMH Comparison Group Beneficiaries for the Baseline Period July 2010-June 2011 | ||
|---|---|---|
| SASH Treatment Group1 | Non-SASH, Non-PCMH Comparison Group2 | |
| All-cause acute care hospitalizations | 61.5 | 80.0 |
| All-cause ER visits | 251.3 | 248.6 |
NOTES: Utilization is measured in rates per 1,000 beneficiaries per quarter. Average utilization is weighted by propensity weights for the comparison group.
| ||
Regression Estimates. In Table E-6 we present overall program effect estimates for utilization rates. There were no statistically significant differences in the rates of all-cause hospitalization or all-cause ER visits among SASH participants overall, or among any of the subgroups of SASH participants, relative to the non-PCMH comparison group.
| TABLE E-6. SASH Program Effect Estimates for Utilization, Comparing SASH Program Participants to New York Non-PCMH Comparison Beneficiaries | ||||||
|---|---|---|---|---|---|---|
| All SASH Participants (n=1,602) | Early SASH Panels (n=699) | Late SASH Panels (n=933) | Site-Based Panels (n=1,218) | Mixed-Panels (n=384) | Late Site-Based Panels (n=614) | |
| All-cause acute care hospitalizations | 4.16 (4.93) | -4.59 (6.53) | 8.42 (6.54) | -0.44 (5.15) | 19.57 (11.91) | 2.34 (7.33) |
| All-cause ER visits | 10.37 (9.62) | 4.01 (10.30) | 9.41 (11.81) | 5.96 (10.08) | 18.41 (15.41) | 3.03 (12.93) |
| NOTES: * p0.10; ** p0.05; *** p0.01; standard errors are in parentheses. The early SASH panel cohort comprises SASH participants receiving services from SASH panels that were operating before April 1, 2012. The late SASH panel cohort comprises participants receiving services from SASH panels that were operating on or after April 1, 2012. Site-based panels have greater than 50% of participants living in affordable congregate housing. Mixed-panels have greater than 50% of participants living in the community. | ||||||
NOTES
-
For example, if a SASH participant is admitted to the hospital, that participant's physicians have permission to involve the SASH coordinator and wellness nurse in discharge planning for the participant. For an individual who does not consent, his or her physicians would not be able to involve the SASH team in discharge planning, or even alert them to the hospitalization.
-
As described in more detail in Section 3, for the purposes of this evaluation, residents of "affordable congregate housing" are defined as those who are receiving housing assistance reported in Public and Indian Housing Information Center (PIC) or Tenant Rental Assistance Certification System (TRACS) data bases and/or living in a Low Income Housing Tax Credit (LIHTC) property.
-
The Elder Care Clinician Program is a statewide program jointly supported by the departments of Aging and Independent Living and Mental Health. Generally, the regional mental health agency embeds the clinician in the COA or AAA and the clinician works with any adult age 60 or over who is experiencing a mental health concern that interferes with his or her daily life, such as depression, anxiety, or substance abuse. The clinician sees people in their homes or in an office.
-
For more detail on the Mental Health Elder Care Clinician Program in Vermont, see their website at: http://ddas.vermont.gov/ddas-programs/programs-mh-elder-care-default-page.
-
An additional comparison group was drawn from Medicare FFS beneficiaries assigned to non-Patient-Centered Medical Homes identified for the New York MAPCP Evaluation (see Appendix C and Appendix E).
-
This excludes Housing Choice Voucher recipients in the PIC data base. Voucher recipients were excluded because they were living in the community instead of in a subsidized congregate housing hub.
-
A total of 658 participants were excluded based on this criteria.
-
This excludes 46 participants associated with panels identified by CSC as community-based. These panels include: Addison - Shoreham/Orwell, Bennington - Northshire, Rutland - Castleton/Fair Haven.
-
Only the last four digits were used as this is the only part of the SSN available in the LIHTC data base.
-
That formula equals one over the maximum number of matches sought (i.e., 1/5, or 0.2) times the total number of times the comparison group beneficiary was matched to a SASH participant.
-
See Cameron & Trivedi (2005) for an extensive discussion of this model. The average outcome, conditional on the covariates, in the negative binomial model is exp(linear index), where exp(.) is the exponential function and the "linear index" is the right-hand side of Equation C.1.
-
Puhani, P.A. (2012). The treatment effect, the cross difference, and the interaction term in non-linear "difference-in-differences" models. Economics Letters 115, p. 85-87. Note that the program impact in Equation C.2 depends on Xit, the vector of beneficiary characteristics.
-
This represents the sum of the products of the beta estimates and sample averages for each of the k explanatory variables in Xit:

Support and Services at Home (SASH) Evaluation
This report was prepared under contract #HHSP23337006T between the U.S. Department of Health and Human Services (HHS), Office of Disability, Aging and Long-Term Care Policy (DALTCP) and RTI International. For additional information about this subject, you can visit the DALTCP home page at http://aspe.hhs.gov/office-disability-aging-and-long-term-care-policy-daltcp or contact the ASPE Project Officer, Emily Rosenoff, at HHS/ASPE/DALTCP, Room 424E, H.H. Humphrey Building, 200 Independence Avenue, S.W., Washington, D.C. 20201. Her e-mail addresses is: Emily.Rosenoff@hhs.gov.
Reports Available
Support and Services at Home (SASH) Evaluation: First Annual Report
- Executive Summary: https://aspe.hhs.gov/execsum/support-and-services-home-sash-evaluation-first-annual-report
- Full HTML: https://aspe.hhs.gov/report/support-and-services-home-sash-evaluation-first-annual-report
- Full PDF: https://aspe.hhs.gov/pdf-report/support-and-services-home-sash-evaluation-first-annual-report
Support and Services at Home (SASH) Evaluation: Second Annual Report