


Determinants of Rural Hospital Closures or Conversions in the United States
Given the recent spotlight on rural hospital closures, we build on prior research to
develop a model that identifies the key determinants of rural hospital closures or
conversions to outpatient-only facilities. Using national data from 2012 to 2023, our
analysis shows that low occupancy rates, for-profit ownership, and proximity to an
urban county are key predictors of closure or conversion.
KEY POINTS:
- Rural hospitals face unique challenges that make them especially vulnerable to closure or conversion
to outpatient-only facilities. While 8% of rural hospitals have closed or converted since 2010, only
3.5% of urban hospitals have done so during the same period. - From 2012-2023, rural hospitals that close or convert tend to have lower occupancy rates (31% vs.
47%), more likely to be for-profit (38% vs. 9%), and more likely to be located in a county that borders
an urban county (72% vs. 57%) than those that remain open. - Low occupancy rates play the most important role in increasing the risk of closure. A 7 percentage
point decrease in occupancy rates (1 standard deviation) will increase the likelihood of closure by
more than one-third. - For-profit hospitals are at higher risk of closure than non-profits and government hospitals. All else
equal, the average for-profit is three times more likely to close or convert relative to a government
hospital. - Urban county adjacency significantly increases closure risk. Hospitals in rural counties that are
adjacent to urban counties are 80% more likely to close or convert, compared to those in rural
counties that are not adjacent to an urban county. - The proportion of Medicare or Medicaid patients does not predict a rural hospital’s likelihood of
closure or conversion.
INTRODUCTION:
Approximately 46 million Americans lived in non-urban areas as of July 1, 2024, making up about 14 percent of the U.S. population.1 Hospitals are a crucial source of healthcare in rural America. However, rural hospitals face unique challenges that make them vulnerable to closure or conversion to outpatient-only facilities. Since 2010, 8 percent of rural hospitals have closed or converted, compared to only 3.5% of urban hospitals.2,i In addition, in recent years, rural hospital closures far outpace new openings, whereas urban hospital closures and openings are more on par. A recent KFF study found that closures of rural hospitals exceeded openings from 2017 to 2023, with 61 rural hospitals closing compared to 11 that opened, indicating a net reduction of 50 hospitals. By comparison, there were 87 urban hospital closures compared to 74 openings, a net reduction of only 13 hospitals.3 Finally, there was considerable fluctuation in hospital closures and conversions between 2012 and 2023, with a general rise in the early and mid-decade years followed by more variability afterward (Figure 1). On average, converted closures represent 44% of all closures during this period.
Figure 1: Number of Hospital Closures and Conversions by Year, 2012-2023

Notes: Closure: Facilities no longer provide health care services; Conversion: Facilities no longer provide in-patient services but continue to provide some health care services (e.g., primary care, skilled nursing care, long-term care). 125/133 hospitals matched from SHEPS closures database to HCRIS. 70 complete closures and 55 converted closures.
While several papers present evidence on predictors of rural hospital financial distress4,5,6,7, evidence on predictors of rural hospital closure is comparatively scant.8,9,10 The papers examining the determinants of rural hospital closure are in alignment with regards to the importance of poor financial metrics in determining whether a rural hospital is at risk of closure. However, only two of these studies evaluate the impact of other factors like occupancy rates10 and community characteristics like access to other hospitals9, on rural hospital closure risk. The first study by Chartis (2022) shows that higher occupancy rates have a protective effect on closure risk, and the second study by Thomas et al. (2016) indicates that for each additional driving mile increase to the nearest hospital, there is a decrease in odds of closure of 9.7%. This second study is the onlystudy to consider competitive pressures from other hospitals. However, the evidence provided is based on a time period when Medicaid expansion had only just been implemented in about half of states (2005-2015), and the risk of closure was only assessed for rural hospitals in financial distress as opposed to all hospitals. This limits the conclusions that can be drawn for the current post-Medicaid expansion period and for rural hospitals that are not in financial distress.
This Issue Brief builds on this prior work by incorporating (1) financial characteristics like profit margins and liabilities to assets, (2) non-financial characteristics like ownership type and occupancy rates, and (3) competitive pressures from other hospitals, which we capture by assessing whether the rural hospital is in a county that borders an urban county as well as the share of total beds in the county that the hospital has. The value-add of this research is that our analysis is more timely, spanning the period from 2012 to 2023, and focuses on all rural hospitals rather than only those in financial distress. In addition, including proximity to an urban area in our model allows us to capture the potential impact of rural hospital “bypass” on rural hospital closure risk, an as-yet unexplored area of research11,16.
The results provided in this Issue Brief can inform hospitals and policymakers about the key determinants of rural hospital closure or conversion. In addition, our results can be used to target funding strategies to either support at-risk hospitals or support alternative sources of care in communities that face the highest risk of hospital closure.
DATA AND METHODS:
We constructed a longitudinal dataset on Rural Hospitals by merging Healthcare Cost Report Information System (HCRIS) with the American Hospital Association (AHA) Annual Survey data from 2012 through 2023. Hospital closures/conversions were identified using the Cecil G. Sheps Center for Health Services Research at the University of North Carolina (SHEPS), which maintains a verified list of rural hospital closures or conversion to outpatient-facilities occurring between 2012 and 2023.12 Closure/conversion records were linked to HCRIS and AHA files using name and address matching. This allowed us to observe financial performance, organizational characteristics, and operating status annually in the years leading up to closure/conversion. From this point we use the term closure to indicate either closure or conversion.
Our analytic sample was restricted to rural hospitals, defined using federal geographic classification systems. All hospitals located in counties with Rural-Urban Continuum Codes13 (RUCC) 4–9 were included in our sample, as well as an additional 30 closed hospitals that were identified by SHEPS as rural based on Rural-Urban Commuting Area14 (RUCA) codes 1–3. The final sample comprised 2,064 rural hospitals observed over the study period; 1,940 which remained open throughout, and 125 which closed or converted (6%).ii
We used a Cox proportional hazards model with time-varying covariates to estimate the determinants of rural hospital closure. This model includes financial indicators, organizational characteristics, and measures reflective competitive pressures. From the estimated model, we calculate predicted closure probabilities for each hospital and then group hospitals in order to compare closure risk across hospital ownership types, CAH status, proximity to an urban county, and high versus low occupancy rates. We also stratified hospitals into risk quintiles, with those in quintile one (Q1) having the lowest risk of closure and those in quintile five (Q5) having the highest. We present summary statistics across these five risk quintiles.
FINDINGS:
Inpatient Occupancy Rates
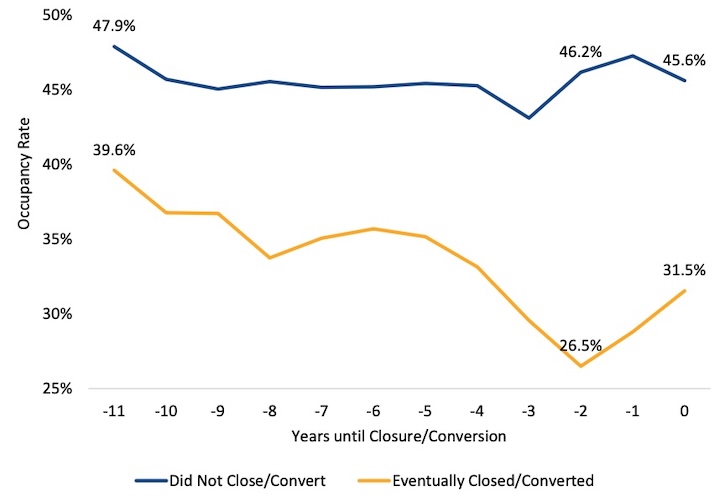
Figure 2 presents trends in inpatient occupancy rates from 2012-2023, among hospitals that eventually closed or converted to outpatient-only facilities, compared to hospitals that did not closure or convert, in the 12-year period prior to closure.iii,iv The trend for hospitals that don’t close or convert reflect time trends in inpatient occupancy and show no secular trends. The trend for hospitals the eventually close or convert indicates that occupancy rate declines began several years prior to closure, falling from nearly 39.6% 11 years prior to closure to a low of 26.5% two years prior to closure, before settling at 31.5% in the year of closure (a 24% decline over 11 years). Showing that occupancy rates only decline for eventually closing/converting hospitals, with no secular trend observed for those that don’t, indicates that occupancy rates are likely an important determinant of closure/conversion.
Figure 2. Trends in Occupancy Rates prior to Closure or Conversion, 2012-2023
Source: 2012-2023 HCRIS data merged with SHEPS rural hospital closure database.
Notes: Closure sample is 109 rural hospitals that closed/converted from 2014-2023 and non-closure sample is 1,933 hospitals. First closure year is 2014 in order to have at least three years of pre-closure/conversion data for each hospital. The closure sample is an unbalanced panel. Number of closing hospitals whose data is contributing to each data point from -11 to 0 is as follows (10, 13, 20, 36, 50, 62, 67, 81,95, 89, 75, 35). Number of closing hospitals with data in time 0 is significantly smaller than for t=-1 because hospitals are generally not observed in the cost report data in year they closed. Averages weighted using total hospital revenue.
Table 1 shows the characteristics of rural hospitals between 2012 and 2023. The sample includes all hospitals, and averages are weighted using total hospital revenue to capture the fact that each hospital observation reflects hospitals of different sizes. Over time the share of for-profit hospitals fell from 12% in 2012 to 7% in 2023, a decline of 42%, while the share of nonprofit hospitals increased from 65% to 70% during this period. In addition, the average liability-to-asset ratio in our sample decreased from 40% in 2012 to 29% in 2023. Finally, the Medicaid share of discharges increased from 14% in 2012 to 20% in 2023, coinciding with the 2014 Medicaid expansion. Other characteristics were unchanged over time.
Table 1: Summary Statistics Among All Rural Hospitals, 2012-2023
| Year | N | For-Profit | Nonprofit | Government | System affiliation | Critical Access Hospital | Share of beds in county | Occupancy rate | Adjacent to urban County | Medicare share of discharges | Medicaid share of discharges | Profit margin | Liability-to-asset ratio |
| 2012 | 1,821 | 12% | 65% | 23% | 59% | 28% | 84% | 47% | 59% | 50% | 14% | 5% | 40% |
| 2013 | 1,822 | 12% | 65% | 23% | 58% | 29% | 84% | 45% | 58% | 51% | 14% | 5% | 38% |
| 2014 | 1,813 | 11% | 66% | 23% | 58% | 29% | 84% | 44% | 57% | 51% | 16% | 5% | 36% |
| 2015 | 1,795 | 11% | 65% | 24% | 58% | 29% | 84% | 45% | 57% | 52% | 18% | 5% | 38% |
| 2016 | 1,798 | 10% | 67% | 23% | 58% | 30% | 84% | 45% | 57% | 52% | 19% | 5% | 38% |
| 2017 | 1,804 | 10% | 67% | 23% | 57% | 30% | 85% | 62% | 57% | 53% | 19% | 5% | 36% |
| 2018 | 1,791 | 9% | 68% | 23% | 57% | 31% | 84% | 45% | 57% | 53% | 19% | 4% | 36% |
| 2019 | 1,773 | 9% | 69% | 22% | 56% | 31% | 84% | 45% | 56% | 53% | 19% | 5% | 36% |
| 2020 | 1,778 | 8% | 68% | 24% | 56% | 31% | 85% | 43% | 57% | 51% | 20% | 7% | 39% |
| 2021 | 1,759 | 8% | 69% | 23% | 55% | 32% | 85% | 47% | 56% | 50% | 20% | 12% | 33% |
| 2022 | 1,759 | 8% | 69% | 23% | 56% | 33% | 85% | 48% | 56% | 50% | 20% | 1% | 28% |
| 2023 | 1,691 | 7% | 70% | 23% | 56% | 33% | 85% | 46% | 59% | 51% | 20% | 5% | 29% |
Note: Sample includes all hospitals, and averages weighted using total hospital revenue. Data: 2012-2023 HCRIS data. Profit margin refers to total facility margin or (total revenue-total expenses)/total revenue, where total revenue is net patient revenue plus total other income. Net patient revenue is Total Patient Revenue minus Contractual Allowance and Discounts on Patients' Accounts. Contractual Allowance and Discounts on Patients' Accounts is defined as Provision for Bad Debts, Contractual Adjustments, Charity Discounts, Teaching Allowances, Policy Discounts, Administrative Adjustments, and Other Deductions from Revenue.
Table 2 compares key financial, operational, and structural characteristics of hospitals that remained open with those that closed or converted, highlighting important differences between the two groups. These results are weighted to reflect differences in hospital size, which we capture through total revenue.
Table 2 compares key financial, operational, and structural characteristics of hospitals that remained open with those that closed or converted, highlighting important differences between the two groups. These results are weighted to reflect differences in hospital size, which we capture through total revenue.
Table 2: Characteristics of Open and Closed/Converted Rural Hospitals, 2012-2023
Open hospitals N=1,940 | Closed/Converted hospitals N=125 | Difference (Closed –Open) | |
| For-profit | 9% | 38% | 29% |
| Nonprofit | 68% | 54% | -13% |
| System affiliation | 57% | 65% | 8% |
| Critical Access Hospital | 31% | 19% | -12% |
| Share of beds in the county | 84% | 66% | -19% |
| Occupancy rate | 47% | 31% | -16% |
| Adjacent to Urban County | 57% | 72% | 15% |
| Medicare Share of discharges | 51% | 56% | 5% |
| Medicaid Share of discharges | 18% | 17% | -1% |
| Profit margin | 5% | -2% | -8% |
| Liability-to-asset ratio | 34% | 64% | 30% |
Note: Sample includes all hospitals, and averages weighted using total hospital revenue. Revenue weighting reflects the system-wide impact across rural hospitals and reduces sensitivity to outliers by giving more influence to higher-volume facilities. 70 complete closures and 55 converted closures.
Open hospitals (1,940) differ notably from closed or converted hospitals (125) across several operational and financial measures. Closed hospitals had substantially lower occupancy rates (31% vs. 47%) on average, with 10% of them having below 22% occupancy. Closed hospitals also had much worse profit margins (–2% vs. 5%), showing weaker financial performance prior to closure. Hospitals that closed also had a higher liability-to-asset ratio (64% vs. 34%), indicating greater financial leverage and instability.
Ownership and market characteristics also differed. Closed hospitals were more likely to be for-profit (38% vs. 9%) and less likely to be nonprofit (54% vs. 68%). A smaller share of closed hospitals was designated Critical Access Hospitals (CAH; 19% vs. 31%), and they accounted for a smaller share of beds within their counties (66% vs. 84%), suggesting limited market presence. Notably, closed hospitals were more likely to be in counties adjacent to urban areas (72% vs. 57%). While informative, these descriptive characteristics may obscure some of the true differences in some measures that may be influenced by secular trends like Medicaid share of discharges. This is because open hospitals have more recent years of data as compared to hospitals that closed or converted. To formally test whether differences in these characteristics are determinative of closure, we model closure as a function of these variables using a Cox proportional hazards model.
Our Cox proportional hazards model incorporates these hospital-level covariates to assess factors associated with closure risk. These include financial indicators such as profit margin, liability-to-asset ratio, and Medicaid/Medicare share of discharges, which capture fiscal stability and payer mix, as well as non-financial characteristics like occupancy rates and system affiliation. Variables such as ownership type (profit, nonprofit, or government ownership), CAH designation, hospital share of beds in the county, and whether the hospital is in a county adjacent to an urban county—help account for differences in market position, rural status, and competitive environment. Together, these measures allow the model to evaluate how financial health, organizational structure, and local market context relate to the likelihood of hospital closure over time.
Table 3 presents the main findings from the Cox Hazard model. The overall model is highly significant (LR χ² (11) = 272.36, p < 0.001), relative to a model with no covariates, the included variables jointly predict the risk of hospital closure. The hazard ratio is the ratio of the hazard rates between two groups and represents the relative instantaneous risk of the event occurring at any given time. A hazard ratio greater than one indicates a higher risk of closure in the group of interest, whereas a value less than one indicates a lower risk.
We find that three strong and significant predictors of rural hospital closure or conversion are occupancy rates, for-profit ownership, and adjacency to an urban county. Among all continuous covariates, higher occupancy rates most significantly reduce the risk of closure [HR=0.003, p<0.001. Between 2012 and 2023, the baseline risk of closure for an average hospital with a 45.2% occupancy rate was 3.3% (95% CI: 3.17%–3.35%). A one standard deviation (~7 percentage-point) decrease in occupancy to 38.3%, all else equal, would increase the risk to approximately 4.5% (95% CI: 4.4%–4.6%). For a detailed comparison, see the Technical Appendix for estimated closure risk changes associated with a one standard deviation change for each continuous covariate that is statistically significant.
For-profit hospitals are three times as likely to close or convert, relative to government hospitals [HR=3.04, p<0.001), in line with prior work showing that for-profit are only most likely to be in financial distress, an outcome is positively associated with closure. Finally, urban county adjacency (HR = 1.804, p = 0.007) significantly increases closure risk. Hospitals in rural counties adjacent to an urban county are 80% more likely to close compared to those in rural counties not adjacent to an urban county. This suggests that rural hospital “bypass” is an important phenomenon driving closures as rural hospitals that are near urban counties face significantly more competition through shorter driving distances than those that are not. In fact, recent research indicates that 30% of adults over age 18 in Arizona, Iowa, Kentucky, New York, North Carolina, Vermont, Washington, and Wisconsin “bypassed” their local rural hospital and 49 percent of all rural beneficiaries bypassed their nearest surgery-capable hospital to receive surgical care elsewhere.”11,16
Other factors associated with reduced risk of closure include share of total beds in the county (HR = 0.216, p < 0.001). In addition, higher profit margins reduce closure risk (HR = 0.336, p < 0.001) as does CAH designation (HR = 0.430, p < 0.001), since CAHs are reimbursed by Medicare at 101% of their reasonable, allowable costs for inpatient, outpatient, laboratory, and swing-bed services. System affiliation and Medicare or Medicaid share of discharges shows no meaningful association with the risk of closure or conversion. Finally, a higher liability-to-asset ratio increases closure risk (HR = 1.452, p < 0.001).
Table 3: Predictors of Rural Hospital Closure or Conversion, 2012-2023
| Variable | Hazard ratio | p-value | 95% CI |
| For-profit | 3.043 | 0 | 1.794-5.162 |
| Nonprofit | 1.416 | 0.174 | 0.858-2.336 |
| System affiliation | 0.78 | 0.209 | 0.530-1.149 |
| Critical Access Hospital | 0.43 | 0 | 0.278-0.663 |
| Share of beds in the county | 0.241 | 0 | 0.142-0.409 |
| Occupancy rate | 0.003 | 0 | 0.001-0.012 |
| Adjacent to urban county | 1.804 | 0.007 | 1.175-2.770 |
| Medicare share of discharges | 0.87 | 0.835 | 0.234-3.231 |
| Medicaid share of discharges | 0.447 | 0.395 | 0.070-2.860 |
| Profit margin | 0.336 | 0 | 0.209-0.540 |
| Liability-to-asset ratio | 1.452 | 0 | 1.238-1.704 |
Notes: Sample includes all hospitals from 2012-2023. Results from Cox proportional hazard model with time varying covariates. The Cox proportional hazards model includes 2,005 hospitals contributing 21,659 observations across 12 years, with 120 recorded closures or conversions. 5 hospitals that closed/converted are excluded due to missing data on covariates
From the estimated Cox proportional hazard model, we generated closure probabilities for each hospital in 2023 (see Technical Appendix for further details). In Figure 3, we present the results for hospitals in 2023 ordered by the predicted probabilities from highest to lowest. We find that predicted risk is greatest among low-occupancy, for-profit hospitals that are in counties adjacent to urban counties and lowest among high-occupancy government or non-profit hospitals that are not in counties adjacent to an urban county. The highest risk is observed for hospitals that are for-profit, non-CAH, adjacent to an urban county, with low occupancy (30.7%). This is followed by hospitals that are non-profit, non-CAH, adjacent to an urban county, with low-occupancy rates (16.0%) and for-profit, CAH, not adjacent to an urban county, low-occupancy hospitals (15.0%). Other elevated risk groups include for-profit, non-CAH, non-adjacent, low-occupancy hospitals (11.9%), for-profit, CAH, adjacent, low-occupancy hospitals (10.2%), with several government and non-profit low-occupancy groups ranging between approximately 6.1% and 8.9%. In contrast, high-occupancy groups consistently exhibit much lower predicted risks, generally 4.6% or lower, regardless of ownership or adjacency to urban counties. Government and non-profit hospitals face the lowest predicted risk of closure across characteristics like occupancy rates, CAH status and adjacency to rural counties. Overall, the ranking highlights that low occupancy and proximity an urban county—particularly for-profit and non-CAH settings—is strongly associated with higher predicted risk.
Figure 3: Predicted Risk of Closure/Conversion by Hospital Type, Segmented by Ownership, CAH Status, Occupancy Level (Above/Below Median), and Whether Adjacent to Urban County (2023)
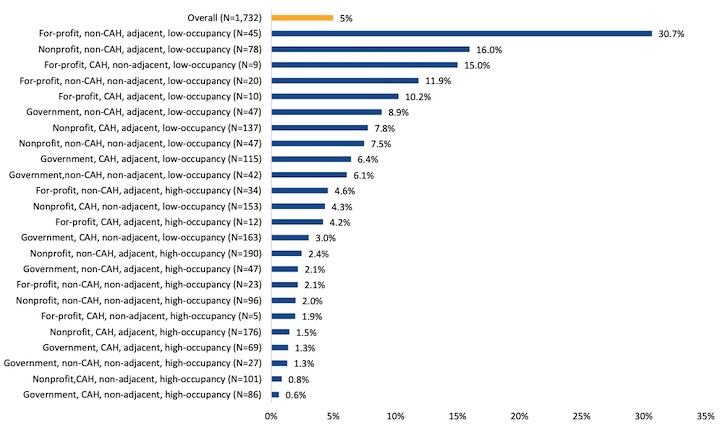
Note: All hospitals in 2023. Results are unweighted. High occupancy is defined as at or above median occupancy (29.8%) and low occupancy is below median occupancy.
Table 4 shows that as average predicted risk of closure increases, for-profit ownership shares increase, average occupancy rates decrease, and likelihood of being adjacent to an urban county increases. Hospitals at highest risk of closure (in Q5) are most likely to be for-profit (22.0%), lowest average occupancy rates (21.4%), and most likely to be adjacent to an urban county (74.1%).
Table 4: Hospital Characteristics, By Closure Risk Quintile (2023)
Hospital Characteristics | Risk Quintile 1 (Lowest Risk) | Risk Quintile 2 | Risk Quintile 3 | Risk Quintile 4 | Risk Quintile 5 (Highest Risk) |
| Predicted Probability of closure Mean, (Min-Max) | 0.4% (0.0%-0.8%) | 1.2% (0.8%-1.8%) | 2.5% (1.8%-3.4%) | 4.6% (3.4%-6.4%) | 13.9 (6.4% - 99.9%) |
| For-profit | 5.30% | 3.70% | 7.00% | 7.90% | 22.00% |
| Nonprofit | 76.60% | 70.90% | 67.30% | 62.30% | 54.70% |
| System affiliation | 62.40% | 52.20% | 48.80% | 55.30% | 46.40% |
| Critical Access Hospital | 30.90% | 33.50% | 34.10% | 39.10% | 25.90% |
| Share of beds in the county | 88.50% | 88.30% | 86.00% | 79.70% | 67.00% |
| Occupancy rate | 64.70% | 46.40% | 35.20% | 27.80% | 21.40% |
| Adjacent to an urban county | 46.40% | 63.50% | 60.20% | 75.50% | 74.10% |
| Medicare Share of discharges | 49.80% | 51.40% | 51.40% | 51.10% | 51.30% |
| Medicaid Share of discharges | 24.00% | 18.40% | 19.60% | 17.50% | 17.40% |
| Profit margin | 7.70% | 5.10% | 3.90% | 1.60% | -1.40% |
| Liability-to-asset ratio | 21.70% | 30.80% | 27.80% | 26.70% | 49.60% |
Note: Sample includes all hospitals, and averages weighted using total hospital revenue. Data: 2023 HCRIS and AHA (closures based on UNC SHEPS database).
CONCLUSION:
This study informs policies that aim to support rural health and access. Low occupancy rate is the most important predictor of rural hospital closure or conversion to outpatient-only facilities. Other key determinants include proximity to an urban county and for-profit ownership. Our study adds to the existing literature on rural hospital closure/conversion risk by (1) highlighting the heightened risk associated with low occupancy rates, especially when combined with for-profit ownership, and (2) presenting contemporaneous evidence that proximity to an urban county—which relates to rural hospital “bypass”— is a key and previously overlooked determinant of closure.11,16 Additionally, we found no evidence that system affiliation or the proportion of Medicare or Medicaid patients predicts a rural hospital's risk of closure or conversion.
Financial performance and solvency typically worsen prior to closure or conversion, as expected in most business settings. However, the fact that occupancy rates, proximity to urban counties, and ownership structure are the primary determinants of closure or conversion suggests that underlying structural weaknesses in some rural hospitals largely predetermine poor financial performance, rather than financial distress being the sole root cause. In other words, many at-risk rural hospitals suffer from chronically low patient volumes and competitive disadvantages that make sustained viability difficult.
The Rural Health Transformation Program enacted by the One Big Beautiful Bill, presents a valuable opportunity to improve access to care for rural residents, but only if states critically evaluate the sustainability and structural vulnerabilities of some of their rural hospitals and design fund allocation strategies accordingly. Taxpayer support for hospitals with limited pathways to viability should be balanced with policy actions that promote competition and innovation, and relax regulations designed for large urban hospitals, to better address the evolving needs of rural communities.
TECHNICAL APPENDIX
Cox Proportional Hazards Model: Predicting Hospital Closure/Conversion to Outpatient Only Facility
We estimate a Cox proportional hazards model in which the event of interest is a rural hospital’s closure or conversion to outpatient-only status. Let ℎ𝑖(𝑡∣𝑋𝑖𝑡) denote the hazard that hospital 𝑖 exits inpatient operation in year 𝑡, conditional on remaining open through the start of that year. We specify ℎ𝑖(𝑡∣𝑋𝑖𝑡) = ℎ0(𝑡)exp(𝑋𝑖𝑡′𝛽), where ℎ0(𝑡) is an unspecified baseline hazard and 𝑋it includes annual hospital and county-level covariates capturing ownership, financial condition, payer mix, market position, and local competitive pressure. Specifically, the model includes indicators for for-profit and nonprofit ownership, with government hospitals as the omitted category, as well as system affiliation, Critical Access Hospital designation, share of beds in the county, occupancy rate, adjacency to an urban county, Medicare share of discharges, Medicaid share of discharges, profit margin, and the liability-to-asset ratio. Covariates that vary over time enter the model as annual measures, allowing closure risk to respond to changes in hospital circumstances over the sample period.
Hazard ratios reported in Table 3 are equal to 𝑒𝛽𝑘 and therefore measure the proportional change in the instantaneous risk of closure or conversion associated with a one-unit increase in the corresponding covariate, holding other factors constant. Values greater than one indicate a higher risk, whereas values less than one indicate a lower risk. We use this semi-parametric specification because it allows the baseline hazard of closure to vary flexibly over time while estimating the association between observed hospital characteristics and closure risk in a consistent framework.
Additional Results from Table 3
Here we present the full set of results for all continuous variables included in our Cox model that were found to be statistically significant. We compute the change in predicted closure risk for a one standard deviation change in the covariate, holding all else equal. We find that between 2012 and 2023, the baseline predicted risk of closure for an average hospital with a 45.2% occupancy rate was 3.3%. A 7 percentage-point decrease in occupancy rates (1 SD) will increase risk of closure to 4.5%; A one standard deviation (20 percentage-points) increase in liability-to-asset ratio from 35% to 55%, holding all else equal, increases the risk to approximately 3.7%; A one standard deviation decreases in profit margins holding all else equal, increases the risk to approximately 3.6%; A one standard deviation (2 percentage-points) decrease in share of beds in the county from 85% to 83%, holding all else equal, increases the risk to approximately 3.4%.
For binary variables, holding all else equal, if all hospitals in our sample are adjacent to an urban county, the predicted risk of closure increases to 3.9% from a baseline of 3.3%; if all government hospitals in our sample are converted to for-Profit hospitals, the predicted risk of closure increases to 4.7% from a baseline of 3.3%; if all nonprofit hospitals in our sample are converted to for-Profit hospitals, the predicted risk of closure increases to 5.7% from a baseline of 3.3%; if all hospitals in our sample are converted from CAH to Non-CAH, the risk of closure increases to 4.8% from a baseline of 3.3%.
REFERENCES
[1] U.S. Census Bureau. Metropolitan and Micropolitan Statistical Areas Population Totals: 2020-2025. Accessed April 2026. https://www.census.gov/data/tables/time-series/demo/popest/2020s-total-metro-and-micro-statistical-areas.html
[2] Turbow, Sara D., et al. “Where and What Separates Rural from Urban Hospital Closures?” Journal of Hospital Medicine, vol. 19, no. 9, Sept. 2024, pp. 812–15, https://doi.org/10.1002/jhm.13438.
[3] Key Facts About Hospitals. KFF. https://www.kff.org/health-costs/key-facts-about-hospitals/. Accessed 10 Apr. 2026.
[4] Malone, Tyler, et al. Publication Details: Using the Updated Financial Distress Index to Describe Relative Risk of Hospital Financial Distress - Rural Health Research Gateway. NC Rural Health Research Program, Apr. 2024, https://www.ruralhealthresearch.org/publications/1658. Accessed 10 Apr. 2026.
[5] Malone, Tyler L et al. “An updated model of rural hospital financial distress.” The Journal of rural health : official journal of the American Rural Health Association and the National Rural Health Care Association vol. 41,2 (2025): e12882. doi:10.1111/jrh.12882
[6] Langabeer, James R 2nd et al. “Predicting Financial Distress in Acute Care Hospitals.” Hospital topics vol. 96,3 (2018): 75-79. doi:10.1080/00185868.2018.1451262
[7] Karim, Saleema A et al. “Fixed-to-total cost ratio is predictive of rural hospital financial distress and closures.” The Journal of rural health : official journal of the American Rural Health Association and the National Rural Health Care Association vol. 42,1 (2026): e70123. doi:10.1111/jrh.70123
[8] Holmes, George M et al. “Predicting Financial Distress and Closure in Rural Hospitals.” The Journal of rural health : official journal of the American Rural Health Association and the National Rural Health Care Association vol. 33,3 (2017): 239-249. doi:10.1111/jrh.12187
[9] Thomas, Sharita R et al. “To What Extent do Community Characteristics Explain Differences in Closure among Financially Distressed Rural Hospitals?.” Journal of health care for the poor and underserved vol. 27,4A (2016): 194-203. doi:10.1353/hpu.2016.0176
[10] Topchik, Michael et al. The Rural Health Safety Net under Pressure Rural Hospital Vulnerability. The Chartis Center for Rural Health. 2022, https://www.chartis.com/insights/rural-health-safety-net-under-pressure-rural-hospital-vulnerability. Accessed 10 Apr. 2026.
[11] Holden, Craig, et al. An Examination of All-Payer Inpatient Rural Hospital Bypass. ESTU/NORC Rural Health Research Center, Mar. 2026, https://www.etsu.edu/cph/rhrc/documents/rherc_031926.pdf.
[12] The Cecil G. Sheps Center for Health Services Research. Rural Hospital Closures. University of North Carolina at Chapel Hill, https://www.shepscenter.unc.edu/programs-projects/rural-health/rural-hospital-closures/. Accessed 7 Apr. 2026
[13] U.S. Department of Agriculture, Economic Research Service. Rural-Urban Continuum Codes. 30 Dec. 2025, https://www.ers.usda.gov/data-products/rural-urban-continuum-codes. Accessed 7 Apr. 2026.
[14] U.S. Department of Agriculture, Economic Research Service. Rural-Urban Commuting Area Codes. 9 Dec. 2025, https://www.ers.usda.gov/data-products/rural-urban-commuting-area-codes, Accessed 7 Apr. 2026.
[15] Bai, Ge, et al. “The Financial Fragility of For-Profit Hospitals: Evidence from the COVID-19 Pandemic.” Working Paper no. 29388, National Bureau of Economic Research, Oct. 2021. Working Paper Series. National Bureau of Economic Research, https://doi.org/10.3386/w29388.
[16] Mullens, Cody Lendon, et al. “Half Of Rural Patients Bypassed Their Local Hospital But Received Lower-Quality Surgical Care Elsewhere, 2016–20.” Health Affairs, vol. 45, no. 3, Mar. 2026, pp. 313–21, https://doi.org/10.1377/hlthaff.2025.00640.
[17] Centers for Medicare & Medicaid Services. Rural Health Transformation (RHT) Program: Overview. U.S. Department of Health & Human Services, 10 Apr. 2026, https://www.cms.gov/priorities/rural-health-transformation-rht-program/overview. Accessed 7 Apr. 2026.
Related Products: