


KEY POINTS
- Annual growth in the number of kidney transplants began to accelerate in 2019. The annual growth rate in kidney transplants increased from 2.6% during 2009–2018 to 2.8% during 2019–2025, with much of the long-term increase driven by deceased-donor transplantation.
- The Advancing American Kidney Health initiative was launched by President Donald Trump via Executive Order 13879 on July 10, 2019. In this Data Point, we estimate the range of increased growth in transplants that might be attributed to the policies launched through the Executive order and the economic value of that increased growth.
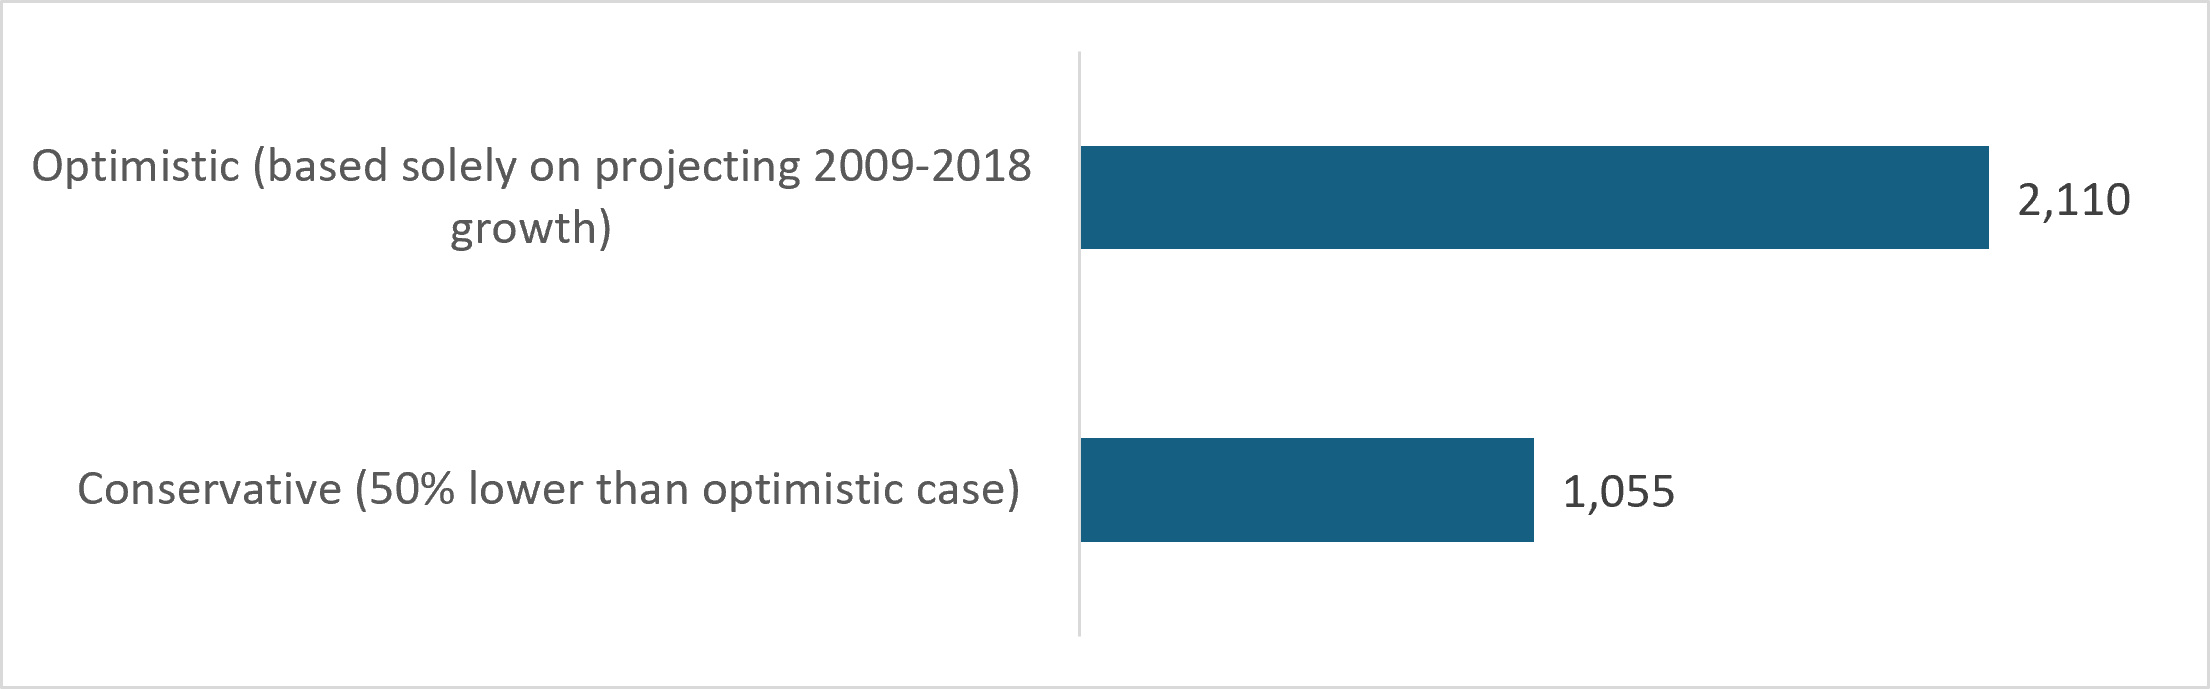
- The estimated impacts of the Executive Order (EO) range from a conservative 1,055 additional transplants annually to an upper estimate of 2,110 additional transplants. The range reflects variation in the counterfactuals used to compare with post-2019 transplant growth.
- Under the conservative-case scenario, the policy is estimated to be associated with approximately 23,214 additional kidney transplants between 2019 and 2040, generating about 147,410 life-years gained and 21,821 quality-adjusted life-years (QALYs) gained. Under the optimistic-case scenario, the policy is estimated to be associated with approximately 46,428 additional kidney transplants between 2019 and 2040, generating about 294,819 life-years gained and 43,643 quality-adjusted life-years (QALYs) gained.
- Sustaining the increase in kidney transplants from 2019 to 2040 could generate substantial health and economic benefits. Using methods intended to measure willingness to pay for mortality and morbidity risk reductions, the estimated additional transplants attributed to the policy would generate significant benefits. The conservative scenario assumes approximately 1,055 additional kidney transplants per year and results in an estimated $103 billion in economic benefits from 2019 to 2040; the optimistic scenario assumes 2,110 additional transplants per year and generates approximately $206 billion in benefits from 2019 to 2040.
INTRODUCTION
On July 10, 2019, President Trump signed an Executive Order (EO) 13879, Advancing American Kidney Health,1 directing the Department of Health and Human Services (HHS) to revise the rules governing Organ Procurement Organizations (OPOs) and establish transparent, enforceable performance metrics. In response, the Centers for Medicare & Medicaid Services (CMS) proposed a rule in December 2019 and finalized it on November 20, 2020,2 with an effective date in March 2021. The rule replaced OPO-reported eligible-death counts with a standardized measure based on death-certificate data and benchmarked OPOs against higher-performing organizations. Together, these changes strengthened incentives to identify donors, recover organs, and successfully place them for transplantation. The reforms also coincided with other policies that could also have increased kidney transplantation.
METHODS AND RESULTS
We used an economic model to estimate the cumulative economic value of additional kidney transplants associated with the policy change from 2019 to 2040. The analysis estimated economic benefits from three separate components following the methods used in previous analysis:3 (1) reduced mortality; (2) improved quality of life from reduced morbidity; and (3) time savings from no longer requiring dialysis, which typically requires 4.5 hours per treatment, thrice weekly. We monetize these benefits using methods intended to measure willingness to pay for reductions in mortality and morbidity and improvements in quality of life, described in greater detail in an Appendix. The model compared observed transplant activity following the post-Executive Order (EO) period with a counterfactual expected transplant trajectory in the absence of the policy.
Estimated Additional Kidney Transplants Associated with the Executive Order
To estimate additional transplants associated with the Executive Order, we took the difference between observed trends in transplants and a counterfactual trend, representing what would have occurred in the absence of the new policy. Because multiple factors may have affected the observed trends, we present a range of policy benefits by projecting different counterfactual trends. See Appendix for a detailed literature review of these other factors.
For the optimistic (upper-bound) scenario, we attributed the entire increase in kidney transplants relative to the historical pre-2019 trend to the new policy. To construct this counterfactual, we projected the historical annual growth rate of 2.6% observed during 2009–2018 forward through 2025. This scenario yielded an estimated EO-associated increase of 2,110 kidney transplants per year. For the conservative (lower-bound) scenario, we attributed 1,055 additional kidney transplants per year to the EO. This estimate represents a 50% reduction from the upper-bound estimate and was selected as a conservative assumption rather than a statistical confidence bound. The lower-bound scenario allows for the potential contribution of factors other than drug overdose deaths to increased organ supply, such as fewer restrictions on the use of organs from donors diagnosed with hepatitis C. See Appendix Section 1 for details. In a sensitivity analysis, we estimated the annual number of additional kidney transplants associated with the policy after adjusting for changes in drug overdose deaths.
Impacts and Value of Kidney Transplants on Mortality
To estimate the average increase in life expectancy associated with kidney transplantation, we relied on estimates from published studies and reports, indicating a 10-year increase in life expectancy attributable to kidney transplantation.3,4,5 Using a 3% annual discount rate, the discounted benefit from each kidney transplant was about 6.35 life years. After applying a central Value of Statistical Life Year (VSLY) of $607,402, we estimate $3.9 million per transplant (occurring in 2026) in benefits associated with life-expectancy gains. A low VSLY estimate of $283,454 yields about $1.8 million per transplant and a high VSLY estimate of $924,602 yields about $5.9 million per transplant.
Impacts and Value of Kidney Transplants on Morbidity
To estimate the economic benefits due to quality of life gains from kidney transplantation, we used a meta-analysis, demonstrating a mean utility score that is 0.11 higher than the score from patients receiving dialysis.3, 6 Using a 3% discount rate, a kidney transplant yields 0.94 additional quality-adjusted life years (QALYs) and, after applying a central Value per QALY (VQALY) of $722,068, yields about $0.68 million per transplant in benefits associated with improved health-related quality of life.7,8 Benefits ranged from about $0.32 million per transplant (using a low value VQALY of $336,965) to about $1.03 million per transplant (using a high value VQALY of $1,099,149).
Time Savings and Value from Fewer Kidney Dialysis Treatments
We also account for the benefits associated with time savings from fewer dialysis treatments. To quantify these benefits, we assume that each dialysis session lasts approximately four hours and that patients typically receive three treatments per week. In addition, we assume an average of 30 minutes of round-trip travel time per treatment. Thus, each avoided dialysis session results in approximately 4.5 hours of time savings for the patient.3 In addition to the health benefits, the analysis monetized time savings: 671 hours per year (assuming 4.5 hours per treatment and 149 treatments per year, after accounting for an average of 7.1 missed treatments per year),9 or roughly 5,720 hours in present value (PV) time savings.10 The Standard Regulatory Impact Analysis (RIA) Values data point suggests an hourly ‘value of time’ of $20.27, which is an additional $0.12 million per transplant.3
Medical Expenditures Associated with Transplantation
In addition to monetized health gains, we evaluated the net lifetime medical cost savings associated with kidney transplantation as a separate economic benefit. Although transplantation is less costly than dialysis on an annual basis, transplant recipients accrue additional spending due to higher life-expectancy. Economic estimates in the literature vary significantly and range from transplantation resulting in material cost-savings to transplantation resulting in higher lifetime spending.4,11 We estimated net lifetime medical savings per kidney transplant, incorporating data from multiple sources,12,13,14 including the annual cost of dialysis, median age and remaining life expectancy of patients receiving dialysis, the initial cost of kidney transplantation, post-transplant annual healthcare expenditures, and the average age and expected survival of kidney transplant recipients. The estimates ranged from a net lifetime medical savings of $36,667 per additional transplant to a net increase in medical expenditures of approximately $12,000 depending on data used and assumptions. Other studies found a net increase in medical expenditures per transplant.15 Given the small magnitude of these impacts relative to the total economic benefits per transplant and the uncertainty associated with the estimates, we have excluded changes in medical expenditures from the calculation of total benefits.
Overall, the total economic benefit per kidney transplant occurring in 2026 is estimated to be around $4.7 million: $3.9 million associated with life-expectancy gains, $0.7 million associated with improved health-related quality of life gains, and $0.1 million associated with time savings from fewer kidney dialysis treatments.
Figure 1 illustrates the trend in kidney transplants in the United States by donor type from 2002 to 2025. The data shows an overall increase in the number of annual kidney transplants from 2002 to 2025, from 14,781 in 2002 to 27,574 in 2025. This growth was driven primarily by deceased donor transplants, whose numbers increased substantially from 8,540 to 21,052 per year during the same period. In contrast, the number of living donors remained relatively stable, generally ranging between about 5,200 and 6,900 per year. Between 2009 and 2018, the total annual number of kidney transplants grew at an average rate of approximately 2.6%. Following the implementation of the Advancing American Kidney Health Executive Order in 2019, annual growth increased to approximately 2.8% from 2019 to 2025.
Figure 1: Kidney Transplant in the US by Donor Type
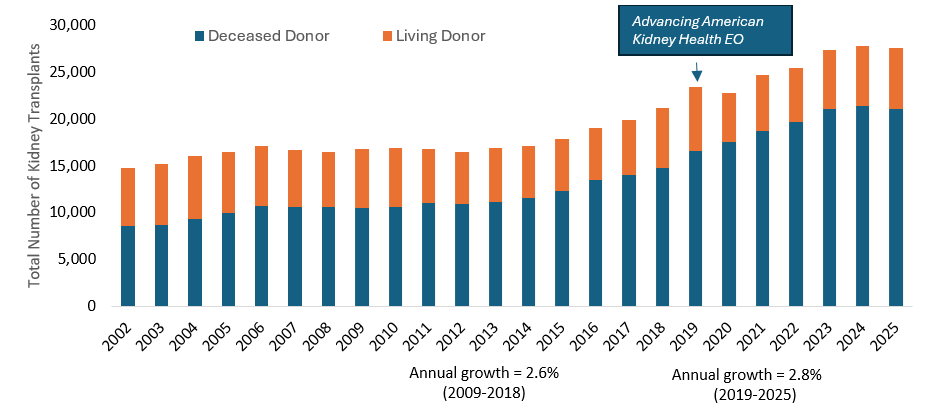
Source: Organ Procurement and Transplantation Network. (n.d.). National data. Health Resources and Services Administration, Report is based on OPTN data as of August 31, 2026. Growth reported here is compound annual growth rate.
Figure 2 presents the estimated range of annual increases in kidney transplantation associated with the EO under two alternative assumptions. An optimistic upper-bound estimate of 2,110 additional transplants per year was obtained using the same historical growth trend of 2.6%. This estimate reflects a larger association between the share of the observed increase in transplantation and the EO. To account for additional uncertainty in attributing post-2019 transplant growth to the policy, a conservative lower-bound sensitivity scenario applied an approximately 50% reduction from the optimistic-case estimate, or 1,055 additional transplants per year associated with the EO. The lower bound estimate allows for a greater proportion of the observed increase to be attributable to secular trends and other contemporaneous changes in organ donation and transplantation. See Appendix Section 1 for more details.
Figure 2: Annual Kidney Transplants Associated with Policy Change (2019-2025)
Source : Author’s calculation from Organ Procurement and Transplantation Network. (n.d.). National data. Health Resources and Services Administration.
Table 1 presents the estimated mortality benefits, measured in life years gained, and morbidity benefits, measured in quality-adjusted life-year (QALY) gains, corresponding to EO-associated increases in kidney transplantation from 2019 through 2040 under two scenarios. The lower-bound scenario assumes approximately 23,214 additional transplants, resulting in an estimated 147,410 life-years gained and 21,821 QALYs gained. The upper-bound scenario assumes approximately 46,428 additional transplants, yielding an estimated 294,819 life-years gained and 43,643 QALYs gained.
Table 1. Estimated Mortality and Morbidity Gains Associated with Additional Kidney Transplants, 2019–2040
Estimated policy-associated additional kidney transplants | Mortality Benefits (Life-years Gained) | Morbidity Benefits (QALYs Gained) | |
|---|---|---|---|
| Conservative | 23,214 | 147,410 | 21,821 |
| Optimistic | 46,428 | 294,819 | 43,643 |
Note: Optimistic (based solely on projecting 2009-2018 growth); Conservative (50% lower than optimistic case). Totals may differ slightly because of rounding.
Table 2 presents the estimated economic benefits stemming from EO-associated increases in kidney transplantation from 2019 through 2040 under two scenarios. These estimates reflect the combined economic value of three distinct benefits associated with kidney transplantation: reductions in mortality, reductions in morbidity through improvements in health-related quality of life, and time savings from no longer requiring dialysis. The reported economic benefits are calculated using a 3 percent discount rate for future events over the analysis period.3 The lower-bound, conservative scenario assumes approximately 1,055 additional kidney transplants per year and results in an estimated $103 billion in economic benefits. The upper-bound scenario assumes 2,110 additional transplants per year and results in approximately $206 billion in benefits. Estimate ranges were produced using a value of a statistical life-year (VSLY) = $607,402 (lower bound of $283,454 and upper bound of $924,602) and value of a quality-adjusted life-year (VQALY) =$722,068.
Table 2. Estimated Economic Benefits from Additional Kidney Transplants from 2019 to 2040
|
Estimated policy-associated additional kidney transplants | Economic Benefits, Present Value (3%) ($Billion) | ||
|---|---|---|---|---|
VSLY =$283,454 (Low) | VSLY =$607,402 (Central) | VSLY =$924,602 (High) | ||
| Conservative | 23,214 | $57 B | $103 B | $148 B |
| Optimistic | 46,428 | $114 B | $206 B | $295 B |
Note: The analysis estimated economic benefits from three components: (1) Benefits from mortality gains, (2) Benefits from morbidity gains; (3) Time savings from fewer kidney dialysis treatments. Applying a central VQALY of $722,068. Optimistic (based solely on projecting 2009-2018 growth); Conservative (50% lower than the optimistic case). VSLY = Value of a statistical life-year, VQALY= Value of a quality-adjusted life-year. Totals may differ slightly because of rounding.
SENSITIVITY ANALYSIS
In the sensitivity analysis, we estimated the annual number of additional kidney transplants associated with the policy after adjusting for changes in drug overdose deaths. To estimate the counterfactual number of kidney transplants in the absence of the policy, we projected historical growth in kidney transplants from 2009–2018 forward to 2019–2025. We then adjusted this counterfactual trend to account for growth in organ donation associated with drug overdose deaths. The adjustment was calibrated over 2019–2025, capturing both the surge in overdose deaths during 2019–2023,16,17 and the sharp decline during 2024–2025.18 The time frame considered reveals that the adjustment is not good at explaining kidney transplant trends. While there was a big uptick in the number of kidney transplants when drug overdose deaths substantially increased over the first time period, the number of kidney transplants did not decrease even when drug overdose deaths plummeted in the following time period. In fact, averaging across both time periods, the results show a small difference between the drug overdose death adjusted estimates and those from the optimistic scenario.
LIMITATIONS
The models used to provide estimates in this Data Point required several assumptions for developing counterfactuals and monetizing the value of additional transplants. These assumptions are used to produce upper and lower bound estimates to reflect the uncertainties inherent in modeling studies. While the estimates provide a reasonable range for the impact of the EO, we recognize that they do not fully account for all the factors that may have affected organ supply and transplants and some inherent uncertainties associated with projecting benefits into the future.
CONCLUSION
Following the 2019 Advancing American Kidney Health Initiative, kidney transplant in the United States increased more rapidly than would have been expected based on historical transplant growth. In the analysis, the post-2019 increase was associated with approximately 23,214 to 46,428 additional transplants under conservative and optimistic cases over 2019–2040. The policy is estimated to yield approximately 147,410 additional life-years under the conservative scenario and 294,819 additional life-years under the optimistic scenario and quality-adjusted life-years (QALY) gains ranging from 21,821 to 43,643 under those two scenarios. If sustained through 2040, our analysis suggests that the EO could generate an estimated $206 billion in economic benefits in the optimistic scenario. Even under conservative assumptions regarding transplant volume and health gains, the EO is associated with substantial health and economic gains.
These findings suggest that policies that hold OPOs accountable for performance and that expanding access to kidney transplantation may generate meaningful improvements in population health and economic benefits. Because the analysis relies on counterfactual projections rather than causal research design, the estimated increases should be interpreted as policy-associated rather than directly attributable to the Executive Order.
APPENDIX
Section 1: Literature Review of other factors affecting Kidney transplant rates
EO-related reforms coincided with other changes that could have independently increased kidney transplantation. Following five years of stagnation, kidney transplants began rising steadily after the 2014 introduction of the Kidney Allocation System (KAS).19 Most notably, donation after circulatory death (DCD), which was already growing before 2019, expanded thereafter.20 The DCD share of deceased kidney donations more than doubled from 21% in 2018 to 44% in 2024, and DCD kidneys accounted for 30.5% of all kidney transplants that year.21 This expansion was supported by the uptake of normothermic regional perfusion (NRP), which saw expanded use in the United States after 2020. NRP restores circulation after circulatory death and can improve the recovery and utilization of DCD organs.22,23,24 ,25 It is unclear whether some of these increases (especially those related to DCD and NRP) are partially attributable to the EO, which incentivized OPOs to more aggressively identify potential deceased donors.
Changes in the underlying donor pool independent of the EO also likely mattered.26,27 The opioid epidemic increased the number of deceased donors before 2019,28,29 and overdose deaths rose sharply again during the COVID-19 pandemic before declining in 2024.30,31 Many of these donors had hepatitis C virus (HCV) risk,32 while direct-acting antivirals (DAA) made HCV-positive kidneys increasingly acceptable for transplantation.33,34
State-level policy changes could have also increased transplants at the margin. Illustrative reforms include Pennsylvania’s modernization of its donor registry in 2018,35 Maryland’s donor leave and insurance protections in May 2019,36 and New York's revised Anatomical Gift Act in 2019.37 Later examples include New York's 2022 Living Donor Support Act,38 Michigan's 2024 living-donor tax credit,39 and Mississippi's 2024 insurance protections.40 These examples are not exhaustive but show that some state efforts to reduce barriers to donation predated the EO. For policies that occurred concurrent or subsequent to the EO, it is unclear whether or to what extent the EO may have increased political support for these state-specific policies.
Section 2: Estimates of the Value per Quality-Adjusted Life Year
Value per statistical life (VSL)
Each year, ASPE updates its default recommendations for several key inputs commonly used in HHS regulatory impact analyses (RIAs).41 These recommendations are based on the HHS RIA Guidelines,42 which discuss an approach to valuing mortality risk reductions based on estimates of individual willingness to pay, commonly referred to as the value per statistical life (VSL). The VSL estimates are based on a criteria-driven literature review commissioned by ASPE to identify values that are suitable for use in its regulatory impact analyses.43 The RIA Guidelines and a published Appendix provide background information on the VSL estimates, including technical guidance on applying the estimates and process for updating these values.44 This appendix summarizes the analytic steps used to update the VSL estimates and reports estimates that cover the time horizon of this data point.
The VSL estimates originally reported in the literature review correspond to a 2013 base year.45 Adjusted for inflation to constant 2025 dollars using the consumer price index,46 the central estimate of VSL based on 2013 earnings is about $12.4 million. To produce year-specific VSL estimates in other years, we apply an assumption that the VSL income elasticity is 1.0. For 2019 through 2025, we combine this assumption with historic data on real earnings;47 and for 2026 through 2040, we adopt a projection of the long-term annual growth rate for real earnings of 1.117%.48 For example, we compute a VSL for 2026 of about $14.1 million, indicating that the willingness to pay for mortality risk reductions increased by about 14% from 2013 to 2026.
Value per Quality-Adjusted Life Year (VQALY)
This cost-benefit analysis values health benefits associated with kidney transplants following an approach that uses quality-adjusted life years (QALYs), a non-monetary measure that integrates the duration and severity of illness. QALYs are derived by multiplying the amount of time an individual spends in a health-state by a measure of the health-related quality of life associated with that state. To quantify benefits using this approach, the analysis multiplies estimates of the change in QALYs by a monetary value per QALY (VQALY).
The HHS RIA Guidelines outline an approach to estimating VQALY that is designed to be consistent with estimates of the VSL, life expectancy data, measurements of age-varying (but otherwise population-average) health-related quality-of-life (HRQL) scores,49 and the approach to discounting used in the analysis. Specifically, we compute VQALY by dividing VSL by an estimate of discounted future QALYs. For the denominator, we calculate the expected present value of remaining QALYs for an individual 40 years of age, consistent with the average age reported in the literature review of VSL studies, accounting for age-specific survival probabilities.
According to the most recent life expectancy data available,50 an individual 40 years of age has a remaining life expectancy of 41.0 years. When applying a 3% discount rate, the present value of remaining life expectancy is 23.3 years. Incorporating the HRQL scores, we calculate that an individual 40 years of age has an expected 33.9 remaining QALYs, or 19.6 QALYs when applying a 3% discount rate. In the table below, we report the intermediate calculation of future QALYs. For 2019 through 2024, we produce an estimate of remaining QALYs based on life tables covering the same year. For 2025 and beyond, we base our estimates on the 2024 life tables, which are the most recent estimates available at the time of analysis. Combined with the year-specific VSL estimates, we report VQALY estimates for each year of the time horizon of the analysis.51
Appendix Table 1: VSLY and VQALY Estimates
| Year | VSLY Estimate | VQALY Estimate | ||||
| Low | Central | High | Low | Central | High | |
| 2019 | $269,419 | $577,325 | $878,818 | $320,237 | $686,223 | $1,044,583 |
| 2020 | $292,140 | $626,014 | $952,932 | $346,755 | $743,047 | $1,131,083 |
| 2021 | $285,477 | $611,736 | $931,197 | $338,760 | $725,914 | $1,105,002 |
| 2022 | $276,330 | $592,136 | $901,363 | $328,164 | $703,209 | $1,070,441 |
| 2023 | $276,591 | $592,695 | $902,214 | $328,728 | $704,418 | $1,072,281 |
| 2024 | $276,576 | $592,662 | $902,163 | $328,788 | $704,545 | $1,072,475 |
| 2025 | $280,323 | $600,693 | $914,388 | $333,243 | $714,092 | $1,087,007 |
| 2026 | $283,454 | $607,402 | $924,602 | $336,965 | $722,068 | $1,099,149 |
| 2027 | $286,621 | $614,187 | $934,929 | $340,729 | $730,134 | $1,111,426 |
| 2028 | $289,822 | $621,048 | $945,373 | $344,535 | $738,290 | $1,123,841 |
| 2029 | $293,060 | $627,985 | $955,932 | $348,384 | $746,536 | $1,136,394 |
| 2030 | $296,333 | $634,999 | $966,610 | $352,275 | $754,875 | $1,149,088 |
| 2031 | $299,643 | $642,092 | $977,407 | $356,210 | $763,307 | $1,161,923 |
| 2032 | $302,990 | $649,264 | $988,325 | $360,189 | $771,833 | $1,174,902 |
| 2033 | $306,374 | $656,517 | $999,364 | $364,212 | $780,454 | $1,188,025 |
| 2034 | $309,797 | $663,850 | $1,010,527 | $368,280 | $789,172 | $1,201,295 |
| 2035 | $313,257 | $671,265 | $1,021,815 | $372,394 | $797,987 | $1,214,714 |
| 2036 | $316,756 | $678,763 | $1,033,229 | $376,554 | $806,901 | $1,228,282 |
| 2037 | $320,294 | $686,345 | $1,044,770 | $380,760 | $815,914 | $1,242,002 |
| 2038 | $323,872 | $694,012 | $1,056,440 | $385,013 | $825,028 | $1,255,875 |
| 2039 | $327,490 | $701,764 | $1,068,240 | $389,313 | $834,243 | $1,269,903 |
| 2040 | $331,148 | $709,602 | $1,080,172 | $393,662 | $843,562 | $1,284,088 |
Note: VSLY and QALY by Year (3% discount rate, constant 2025 dollars)
Executive Order on Advancing American Kidney Health
https://trumpwhitehouse.archives.gov/presidential-actions/executive-order-advancing-american-kidney-health/↩︎
- Centers for Medicare & Medicaid Services. (2020). Medicare and Medicaid Programs; Organ Procurement Organizations Conditions for Coverage: Revisions to the Outcome Measure Requirements for Organ Procurement Organizations; Final rule. 85 Fed. Reg. 77898 (Dec. 2, 2020). CMS-3380-F, RIN 0938-AU02.↩︎
- Organ Procurement and Transplantation: Implementation of the HIV Organ Policy Equity Act, Docket No. HRSA-2024-0001 https://www.regulations.gov/document/HRSA-2024-0001-0058↩︎
Wolfe, R.A., Ashby, V.B., Milford, E.L., Ojo, A.O., Ettenger, R.E., Agodoa, L.Y., Held, P.J. and Port, F.K., 1999.
Comparison of mortality in all patients on dialysis, patients on dialysis awaiting transplantation, and recipients of a first cadaveric transplant. New England Journal of Medicine, 341(23), pp.1725-1730. Quoted from page 1728.↩︎
- Neild GH. Life expectancy with chronic kidney disease: an educational review. Pediatr Nephrol. 2017 Feb;32(2):243-248. doi: 10.1007/s00467-016-3383-8. Epub 2016 Apr 26. PMID: 27115888; PMCID: PMC5203814.↩︎
- Wyld, M., Morton, R.L., Hayen, A., Howard, K. and Webster, A.C., 2012. “A systematic review and meta analysis of utility-based quality of life in chronic kidney disease treatments.” PLoS Med. 2012;9(9):e1001307.↩︎
- Tonelli, M., Wiebe, N., Knoll, G., Bello, A., Browne, S., Jadhav, D., Klarenbach, S. and Gill, J., 2011. Systematic review: kidney transplantation compared with dialysis in clinically relevant outcomes. American Journal of Transplantation, 11(10), pp.2093-2109.↩︎
- Quality-adjusted life years (QALYs) are a nonmonetary measure that integrates the duration and severity of illness. QALYs are derived by multiplying the amount of time an individual spends in a health state by a measure of the health-related quality of life associated with that state.↩︎
- Chan KE, Thadhani RI, Maddux FW. Adherence barriers to chronic dialysis in the United States. J Am Soc Nephrol. 2014 Nov;25(11):2642-8. doi: 10.1681/ASN.2013111160. Epub 2014 Apr 24. PMID: 24762400; PMCID: PMC4214530.↩︎
- The 5,720 hours estimate uses a 3% discount rate.↩︎
- Fu R, Sekercioglu N, Berta W, Coyte PC. Cost-effectiveness of Deceased-donor Renal Transplant Versus Dialysis to Treat End-stage Renal Disease: A Systematic Review. Transplant Direct. 2020 Jan 13;6(2):e522. doi: 10.1097/TXD.0000000000000974. PMID: 32095508; PMCID: PMC7004633.↩︎
- https://usrds-adr.niddk.nih.gov/2025/end-stage-renal-disease/6-mortality↩︎
- https://usrds-adr.niddk.nih.gov/2025/end-stage-renal-disease/9-healthcare-expenditures-for-persons-with-esrd↩︎
- https://pmc.ncbi.nlm.nih.gov/articles/PMC5203814↩︎
- Axelrod D.A., Schnitzler M.A., Xiao H., et al. 2018. “An Economic Assessment of Contemporary Kidney Transplant Practice.” American Journal of Transplantation, 18: 1168-1176. Cost estimates are present values using an annual discount rate of 3%, originally reported in 2016 dollars inflated to 2023 constant dollars.↩︎
- https://www.cdc.gov/nchs/data/databriefs/db457-tables.pdf↩︎
- https://www.cdc.gov/nchs/data/databriefs/db549.pdf↩︎
- U.S. Overdose Deaths Decrease for Third Consecutive Year in 2025↩︎
- https://www.hrsa.gov/optn/professionals/resources/kidney-pancreas/kidney-allocation-system↩︎
- Israni AK, Zaun D, Rosendale JD, Schaffhausen C, McKinney W, Snyder JJ. OPTN/SRTR 2019 annual data report: deceased organ donors. American Journal of Transplantation. 2021 Feb;21:567-604.↩︎
- Lentine KL, Smith JM, Lyden GR, Miller JM, Booker SE, Dolan TG, Handarova D, Weiss S, Temple KR, Snyder JJ, Hart A. OPTN/SRTR 2024 Annual Data Report: Kidney. Am J Transplant. 2026 Jun;26(8S1):S22-S145. doi: 10.1016/j.ajt.2026.05.719. PMID: 42276698.↩︎
- Fischer RM, Muñoz N, Ong O, L. Abt P, C. Gruessner A, F. Parsons R. Emerging National Trends in Normothermic Regional Perfusion for Simultaneous Pancreas–Kidney Transplantation. Clinical Transplantation. 2025 Nov;39(11):e70389.↩︎
- Normothermic Regional Perfusion (NRP). Health Resources and Services Administration, Organ Procurement and Transplantation Network, 12 Aug. 2026, www.hrsa.gov/optn/policies-bylaws/policy-issues/normothermic-regional-p…. Accessed 1 Sept. 2026↩︎
- Israni, Ajay K., et al. "OPTN/SRTR 2024 Annual Data Report: Deceased Organ Donation." American Journal of Transplantation 26.8 (2026): S551-S584.↩︎
- Sellers MT, Philip JL, Brubaker AL, et al. Normothermic Regional Perfusion Experience of Organ Procurement Organizations in the US. JAMA Netw Open. 2024;7(10):e2440130. Published 2024 Oct 1. doi:10.1001/jamanetworkopen.2024.40130↩︎
- Chute DF, Sise ME. Effect of the Opioid Crisis on the Donor Pool for Kidney Transplantation: An Analysis of National Kidney Deceased Donor Trends from 2010-2016. Am J Nephrol. 2018;47(2):84-93. doi:10.1159/000486516↩︎
- Dickert-Conlin, Stacy, et al. "Opioids and organs: How overdoses affect the supply and demand for organ transplants." American Journal of Health Economics 10.4 (2024): 505-538.↩︎
- Goldberg D, Lynch R. Improvements in organ donation: Riding the coattails of a national tragedy. Clin Transplant. 2020; 34:e13755. https://doi.org/10.1111/ctr.13755↩︎
- Israni A. K., Zaun D., Rosendale J. D., Schaffhausen C., Snyder J. J. & Kasiske B. L. OPTN/SRTR 2017 Annual Data Report: Deceased Organ Donation. Am J Transplant 2019; 19 (Suppl 2): 485–516. doi: 10.1111/ajt.15280↩︎
- Betterbed D, Khan S, Lee R, Patel B, Xue A, Ozdemir M, Tun M, Andalibi A, Yu Y, Koizumi N, et al. One-Year Outcomes of Kidney and Liver Transplantation from Drug Overdose Donors Before and During the COVID-19 Pandemic. Transplantology. 2026; 7(2):15. https://doi.org/10.3390/transplantology7020015↩︎
- Hart A, Lentine KL, Smith JM, et al. OPTN/SRTR 2019 Annual Data Report: Kidney. Am J Transplant. 2021;21 Suppl 2:21-137. doi:10.1111/ajt.16502.↩︎
- Durand, Christine M., et al. "The drug overdose epidemic and deceased-donor transplantation in the United States: a national registry study." Annals of internal medicine 168.10 (2018): 702-711.↩︎
- Gordon, Craig E., et al. "Kidney transplantation from hepatitis C virus–infected donors to uninfected recipients: a systematic review for the KDIGO 2022 hepatitis C clinical practice guideline update." American journal of kidney diseases 82.4 (2023): 410-418.↩︎
- Fabrizi F, Cerutti R, Alfieri CM, Messa P. Updated View on Kidney Transplant from HCV-Infected Donors and DAAs. Pharmaceutics. 2021; 13(4):496. https://doi.org/10.3390/pharmaceutics13040496.↩︎
- Pennsylvania Modernization of Organ Donor Registry Act, 20 Pa. Cons. Stat. § 8601 et seq. (2018).↩︎
- Maryland General Assembly. HB 1284: Organ Donation – Prohibition on Discrimination by Insurer and Unpaid Leave. Chapter 402, approved May 13, 2019.↩︎
- New York State Legislature. S. 6000-A/A. 7800-A, The New York Gift Act (2019).↩︎
- New York State Living Donor Support Act, S. 1594/A. 146-A, 244th Leg., (2022).↩︎
- Income Tax Act of 1967, Mich. Comp. Laws § 206.280 (2025).↩︎
- Living Donor Protection Act, Miss. Code Ann. § 83-5-97 (2024)↩︎
- Kearsley, A. “HHS Standard Values for Regulatory Analysis, 2026.” Office of the Assistant Secretary for Planning and Evaluation, U.S. Department of Health and Human Services. March 2026. https://aspe.hhs.gov/reports/standard-ria-values.↩︎
- U.S. Department of Health and Human Services, Office of the Assistant Secretary for Planning and Evaluation. 2016. Guidelines for Regulatory Impact Analysis.↩︎
- Robinson, L.A. and Hammitt, J.K., 2016. “Valuing reductions in fatal illness risks: Implications of recent research.” Health Economics, 25(8), pp. 1039-1052.↩︎
- U.S. Department of Health and Human Services, Office of the Assistant Secretary for Planning and Evaluation. 2021. Appendix D: Updating Value per Statistical Life (VSL) Estimates for Inflation and Changes in Real Income.↩︎
- The literature review provides population-average values in 2013 dollars at 2013 income levels, which range from $4.2 million to $13.7 million with a mid-point of $9.0 million. HHS uses these values as the basis of its low, high, and central VSL estimates, respectively.↩︎
- U.S. Bureau of Labor Statistics. Consumer Price Index for All Urban Consumers (CPI-U), Not Seasonally Adjusted. Series ID: CUUR0000SA0. Annual figures for 2013 to 2025.↩︎
- U.S. Bureau of Labor Statistics. Weekly and hourly earnings data from the Current Population Survey, Not Seasonally Adjusted. Series ID: LEU0252881600. Annual figures for 2013 to 2025.↩︎
- Congressional Budget Office. February 25, 2026. The Long-Term Budget Outlook Data: 2026 to 2056. Table 13. Average Annual Values for Additional Economic Variables That Underlie CBO’s Extended Baseline Projections: Growth of real earnings per worker, Overall, 2026-2056.↩︎
- Hamner, J., W.F. Lawrence, J.P. Anderson, R.M. Kaplan, and D.G. Fryback. 2006. “Report of Nationally Representative Values for the Noninstitutionalized US Adult Population for 7 Health-Related Quality-of-Life Scores.” Medical Decision Making 26(4), pp. 391-400.↩︎
- Centers for Disease Control and Prevention, National Center for Health Statistics. August 25, 2026. United States Life Tables, 2024. National Vital Statistics Reports, Vol. 75, No. 5. Table 1. Life table for the total population: United States, 2024.↩︎
- VQALY estimates for 2025 differ by about 0.5% from the “HHS Standard Values for Regulatory Analysis, 2026” due to the availability of more recent life expectancy data than were contemporaneously available at the time of publication.↩︎
*This content is in the process of Section 508 review. If you need immediate assistance accessing this content, please submit a request to Kaushik Ghosh, Kaushik.Ghosh@hhs.gov. Content will be updated pending the outcome of the Section 508 review.