
Functional Trajectories at the End of Life for Individuals with Dementia: Final Report
Ila H. Broyles, PhD; Amy Huebeler, BS; Ira Dave, MS; Emily Graf, BA; Qinghua Li, PhD; Lauren Palmer, PhD; Zhanlian Feng, PhD; and Sarita L. Karon, PhD
RTI International
January 2020
Printer Friendly Version in PDF Format (50 PDF pages)
ABSTRACT
Dementia, including Alzheimer’s disease and related disorders, is a neurocognitive disease affecting an individual’s cognitive function and behavior. Dementia is a leading cause of death and is particularly prevalent at the end of life (EOL) in older adults. However, there is limited knowledge regarding the patterns of decline for adults with dementia, who may also have comorbid terminal conditions. This knowledge gap may prevent providers from offering palliative and hospice services, because they may not be able to identify when a dementia patient has entered the terminal phase of illness. It may also limit patients’ and families’ ability and willingness to access palliative services that can improve and complement EOL care.
For this project, we used a sample of decedents from the 2000-2012 Health and Retirement Study to understand the trajectories of functional decline of older adults with dementia near the EOL, and how these trajectories differ from those of people without dementia. In addition, we examined whether and how these trajectories vary by other patient characteristics such as demographics, comorbidities, and access to caregiving. Overall, the findings from the point-in-time analyses indicated that people with dementia have significantly higher levels of functional impairments than do people without dementia up until the last year of life. However, the functional impairment of people with dementia at 2-4 years before death may look similar to people without dementia in the last 6-12 months before death, after controlling for other characteristics.
This report was prepared under contract #HHSP23320160001I between HHS's ASPE/DALTCP and RTI International. For additional information about this subject, you can visit the DALTCP home page at https://aspe.hhs.gov/office-disability-aging-and-long-term-care-policy-… or contact the ASPE Project Officer, Helen Lamont, at HHS/ASPE/DALTCP, Room 424E, H.H. Humphrey Building, 200 Independence Avenue, S.W., Washington, D.C. 20201;
Helen.Lamont@hhs.gov, Judith.Dey@hhs.gov, Iara.Oliveira@hhs.gov.
DISCLAIMER: The opinions and views expressed in this report are those of the authors. They do not reflect the views of the Department of Health and Human Services, the contractor or any other funding organization. This report was completed and submitted on May 2019.
TABLE OF CONTENTS
2.1. Background
2.2. Research Questions
3.1. Data
3.2. Variables
3.3. Sample Identification
3.4. Analysis
4.1. Sample: Sample for Point-in-Time Estimates
4.2. Functional Status at the End of Life
4.3. Sample: Sample for Longitudinal Analysis of Change in ADL Scores
4.4. Change Scores in Functional Status at the End of Life
5.1. Point-in-Time Predicted ADL Scores in the Last 4 Years of Life
5.2. Longitudinal Change Score in the Last Two Surveys
5.3. Harmonizing the Two Sets of Findings
5.4. Functional Status in the Last Months of Life
5.5. Final Conclusion
APPENDICES
- APPENDIX A: Regression Model for Cross-Sectional Analysis
- APPENDIX B: Regression Coefficients for Longitudinal Analysis of Change Score
LIST OF EXHIBITS
- EXHIBIT 1: Sample Characteristics for Decedents at their Last HRS Survey
- EXHIBIT 2: Predicted ADL Impairments by Dementia Status
- EXHIBIT 3: Predicted ADL Impairments by Dementia Status and Nursing Facility Residence
- EXHIBIT 4: Predicted ADL Impairments by Primary Caregiver Use and Dementia Status
- EXHIBIT 5: Predicted ADL Impairments by Dementia Status and Stroke
- EXHIBIT 6: Predicted ADL Impairments by Dementia Status and Cancer Diagnosis
- EXHIBIT 7: Predicted ADL Impairments by Dementia Status and Heart Disease Diagnosis
- EXHIBIT 8: Predicted ADL Impairments by Dementia Status and Obesity
- EXHIBIT 9: Sample Characteristics for Longitudinal Analysis of Change Scores
- EXHIBIT 10: Predicted Change in ADL Impairments by Dementia Status
- EXHIBIT 11: Predicted Change in ADL Impairments by Dementia Status and Nursing Facility Residence
- EXHIBIT 12: Predicted Change in ADL Impairments by Dementia Status and Caregiver Access
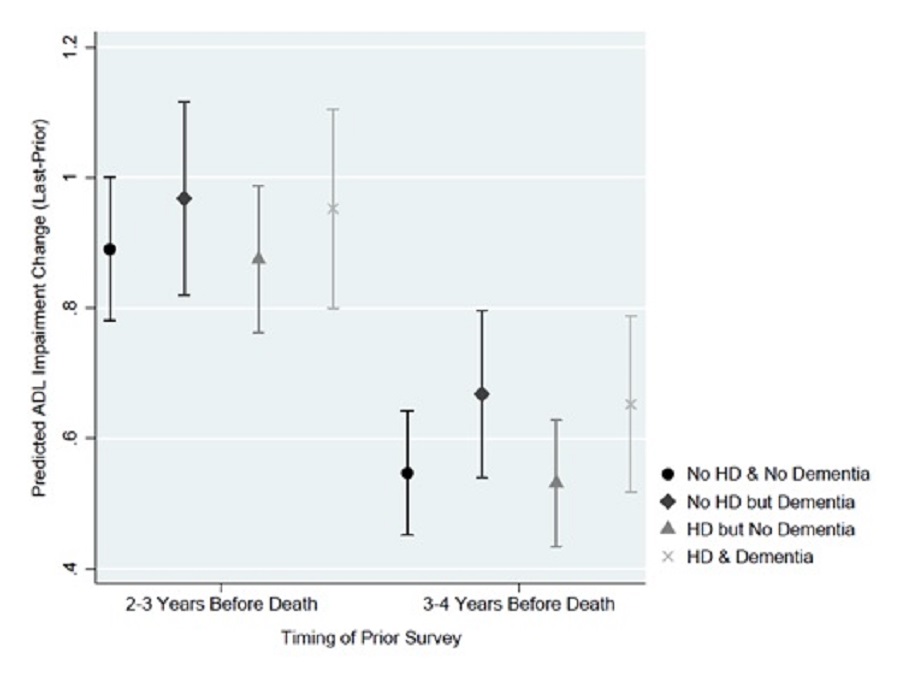
- EXHIBIT 13a: Predicted Change in ADL Impairments by Dementia Status and Stroke
- EXHIBIT 13b: Predicted Change in ADL Impairments by Dementia Status and Cancer Diagnosis
- EXHIBIT 13c: Predicted Change in ADL Impairments by Dementia Status and Heart Disease
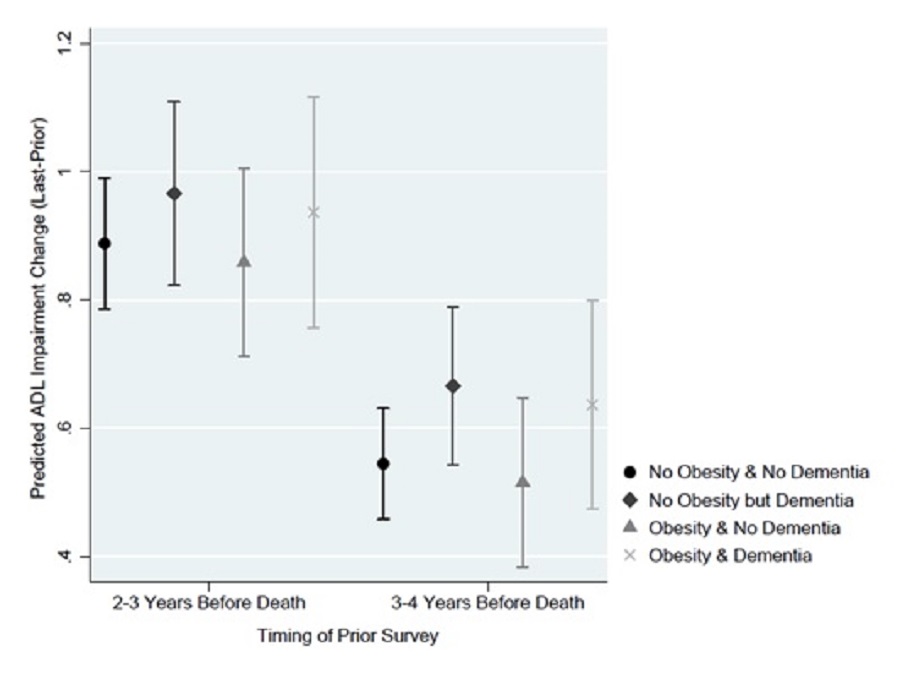
- EXHIBIT 13d: Predicted Change in ADL Impairments by Dementia Status and Obesity
LIST OF TABLES
- TABLE A-1: Negative Binomial: ADL Score
- TABLE B-1: Linear Regression: Change in ADL Score from Prior to Last Survey
ACRONYMS
The following acronyms are mentioned in this report and/or appendices.
| ADL | Activity of Daily Living |
|---|---|
| ASPE | Office of the Assistant Secretary for Planning and Evaluation |
| BMI | Body Mass Index |
| CI | Confidence Interval |
| EOL | End Of Life |
| HRS | Health and Retirement Study |
| IADL | Instrumental Activity of Daily Living |
| LTSS | Long-Term Services and Supports |
| MedPAC | Medicare Payment Advisory Commission |
| NDI | National Death Index |
1. EXECUTIVE SUMMARY
1.1. Introduction
Dementia, including Alzheimer's disease and related disorders, is a neurocognitive disease affecting an individual's cognitive function and behavior. Dementia is a leading cause of death and is particularly prevalent at the end of life (EOL) in older adults. When patients enter the terminal phase of illness, palliative and hospice care services can offer integrated care to relieve symptom burden for patients and their families. However, there is limited knowledge regarding the patterns of decline for adults with dementia, who may also have comorbid terminal conditions. This knowledge gap may prevent providers from offering palliative and hospice services, because they may not be able to identify when a dementia patient has entered the terminal phase of illness. It may also limit patients' and families' ability and willingness to access palliative services that can improve and complement EOL care.
This project, funded by the Office of the Assistant Secretary for Planning and Evaluation (ASPE) in the U.S. Department of Health and Human Services, aims to understand the functional trajectories of older adults with dementia at the EOL. Specifically, researchers at RTI International sought to answer the following question posed by ASPE: What are the trajectories of functional decline of older adults with dementia near the EOL, and how do these trajectories differ from those of people without dementia? In addition, we examined whether and how these trajectories vary by other patient characteristics such as demographics, comorbidities, and access to caregiving. This project provides new and valuable evidence to: (1) inform clinicians' understanding of the trajectories of decline near the EOL; and (2) guide future policy regarding the delivery of EOL care for people with dementia.
1.2. Data Sources and Methods
We used a sample of decedents over the age of 65 (and thus eligible for Medicare) from the 2000-2012 Health and Retirement Study (HRS). The HRS is a nationally representative, longitudinal panel study that includes about 20,000 adults who are interviewed every 2 years. Using this sample, we identified decedents and the two HRS surveys that occurred in their last 4 years of life. For each survey, we identified relevant characteristics that might affect the participants' functional trajectories: demographics, socioeconomic status, residential setting, caregiving utilization, and comorbidities. The primary outcome of functional status, measured by a summed score of activities of daily living[1] (ADLs) in which the respondent reported difficulty (0-6), was also calculated in each survey. A higher score indicates more ADL impairments.
Using these data, we conducted two sets of analyses. The first set ("point-in-time analyses") were intended to examine the effect of personal characteristics, particularly dementia, that are associated with ADL scores at different time points in the last 4 years of life. To do this, the point-in-time analyses leveraged up to two surveys for each HRS decedent, with each survey providing a snapshot at a random time relative to death, and treated each survey as an observation. These analyses estimated the effect of dementia and other characteristics on the ADL score in each month in the last 4 years of life. The point-in-time analyses used these estimates to predict ADL scores in each month in the last 4 years of life for patients with and without dementia, controlling for other patient characteristics. The second set of analyses ("longitudinal analyses") were intended to estimate the effect of personal characteristics, particularly dementia, on individual's ADL scores over time. To do this, the longitudinal analyses calculated the change in ADL between the two last surveys in a decedent's life. The longitudinal analyses estimated the effect of dementia and other characteristics on the change in ADL score between the last two surveys of life, controlling for patient characteristics.
1.3. Findings
Overall, the findings from the point-in-time analyses indicated that people with dementia have significantly higher levels of functional impairments than do people without dementia up until the last year of life. The point-in-time estimates are the average predicted ADL score, controlling for other personal characteristics at that time, if all people were to have dementia versus if not. For much of the last year of life, there was no significant difference in ADL scores if people did or did not have dementia.
-
In the last 4 years of life, dementia was associated with a higher predicted ADL score from 48 months until 10 months before death. Controlling for other characteristics, the predicted ADL score if people had dementia (compared to if they did not) varied from 10% higher at 1 year before death to 48.5% higher at 4 years before death.
-
At 17 months before death people with dementia showed a comparable level of predicted impairment (1.92 ADLs) to people without dementia at 6 months before death.
-
Dementia was consistently associated with a significantly higher predicted ADL score from 48 months until 17-10 months before death across the types of long-term services and supports (LTSS) received--including living in a nursing facility or receiving caregiving from one's spouse or child. The difference in the predicted ADL scores between patients with and without dementia and the timing of when this difference diminished varied by LTSS type.
-
Both stroke and obesity were associated with significantly worse (or higher) predicted ADL scores for much of the last 4 years of life compared to not having these conditions, regardless of dementia status. However, if dementia and comorbidities were both present, dementia was associated with a higher predicted ADL score from 48 months before death until 12 months before death if people had a stroke (at 13 months it was 2.49 if decedents had dementia vs. 2.25 if they did not) and until 16 months before death if people were obese (at 17 months before death it was 2.24 if decedents had dementia vs. 1.95 if they did not).
-
Cancer and heart disease were not associated with a difference in ADL scores over the last 4 years of life regardless of dementia status.
The findings from the analysis of the effects of dementia and other characteristics on the change in ADL scores suggest that, after starting ADL score and other patient characteristics were controlled for, dementia was not associated with the amount of change in ADL impairments between the last two surveys before death:
-
Dementia was not associated with the amount of change in ADL score from the second-to-last survey before death (the "prior" survey) to the last survey before death (the "last" survey).
-
When LTSS use at the time of the prior survey and prior ADL score were controlled for, there was no significant difference in the ADL change between people with and without dementia.
-
Comorbidities at the time of the prior survey were not associated with subsequent change in ADL score, regardless of dementia status.
1.4. Conclusion
In combination, the findings offer new insight into the role of dementia in functional trajectories at EOL. Analysis of predicted ADL scores in the last 4 years of life suggests that when demographics, comorbidities, and LTSS use are controlled for, people with dementia may experience less decline in functional status in the last 4 years of life than people without dementia. This can be partly explained by the fact that people with dementia have higher levels of functional impairment at 3-4 years before death, and therefore, there is less room for further decline. The functional impairment of people with dementia at 2-4 years before death may look similar to people without dementia in the last 6-12 months before death, after controlling for other characteristics. Indeed, individuals with dementia have the same predicted average ADL score (1.92 impairments) at 17 months before death as individuals without dementia at 6 months before death. This creates challenges for prognostication for dementia patients as they may appear to be at EOL for several years. In the last year of life, patients with and without dementia have similar ADL scores.
The analysis of the longitudinal change score suggests that, when personal characteristics and particularly baseline ADL score are controlled for, there may be no independent effect of dementia on ADL decline. People with dementia do not experience more functional decline than those at similar levels of ADL impairment but without dementia. Similarly, after controlling for LTSS use and baseline ADL score at the prior survey, there was not a significant difference in subsequent ADL decline attributable to dementia. However, because of the challenges of repeatedly surveying individuals at the EOL and the high levels of baseline ADL impairments among dementia patients, these results may be applicable only to patients with less severe disease.
The implication of these findings for prognostication for dementia patients is that functional status alone may not be, on average, a clear flag for the terminal phase of dementia; this observation is in contrast to ADL trajectories associated with other terminal illnesses, where change in functional status may be a hallmark of the last months of life. In addition, given their higher levels of functional impairment 2-4 years before death, people with dementia likely have different and greater care needs earlier on compared to people without dementia. As a result, traditional models that offer palliative and supportive care at EOL but focus only on the last few months of life may require modifications to support people with dementia and their families.
2. INTRODUCTION
2.1. Background
Dementia, including Alzheimer's disease and related disorders, is a neurocognitive disease affecting an individual's cognitive function and behavior. Dementia is a leading cause of death and is particularly prevalent at the end of life (EOL) in older adults. Although the prevalence of dementia has decreased in recent years (Langa et al., 2017), dementia is still a leading cause of death in the United States (Murphy, Xu, Kochanek, & Arias, 2018). Deaths attributed to Alzheimer's disease increased in absolute terms 123% between 2000 and 2015 (Aldridge & Bradley, 2017). In the last years of life, dementia has a high disease burden most frequently related to functional impairment resulting from cognitive decline.
When patients enter the terminal phase of their illness, palliative and hospice care services offer integrative care to relieve symptom burden. Palliative care is a type of care delivered to relieve symptom burden and patient suffering consistent with patient goals. Hospice is a Medicare benefit to provide palliative care to EOL patients with a 6-month prognosis. These services can also support the caregivers of individuals with dementia in meeting patient and family care goals. However, access to these services can be limited for older adults with dementia at EOL (Sachs, Shega, & Cox-Hayley, 2004).
The nature of dementia's progression can contribute to this limited access. The long course of illness (Walsh, Welch, & Larson, 1990), and the related reality that dementia can co-occur with other terminal conditions, can mean that dementia is underrecognized as being a potential cause of, or a contributor to, a person's death. More specifically, one potential cause of limited access to palliative and hospice care is the uncertainty around prognostication for patients with dementia. Limited knowledge regarding the patterns of decline for adults with dementia near death, who may also have comorbid terminal conditions, makes it difficult for providers to help patients and families understand the severity of their disease (Sachs et al., 2004). Much research on functional trajectories focuses on the last year, or even last months, of life, even though functional decline typically starts earlier for dementia patients (Chen, Chan, Kiely, Morris, & Mitchell, 2007; Murtagh, Addington-Hall, & Higginson, 2011). Uncertainty about when dementia patients may enter the terminal phase of their illness can create barriers to high-quality EOL care for the dementia population.
This project, funded by the Office of the Assistant Secretary for Planning and Evaluation in the U.S. Department of Health and Human Services, aims to understand the functional trajectories of older adults with dementia at the EOL. Our research questions, as described below, strive to provide new and valuable evidence to inform future policy regarding the delivery of EOL care for people with dementia.
2.2. Research Questions
Using the Health and Retirement Study (HRS), we address the following questions in this report:
-
What are the trajectories of functional decline of older adults with dementia near the EOL?
-
How do these trajectories of people with dementia differ from the trajectories of people without dementia?
-
-
How do these trajectories vary based on other factors such as comorbidities? How do these trajectories vary based on other patient characteristics?
-
Are there patient characteristics that can predict these trajectories?
-
How do the trajectories vary by the different providers and can those variations be attributed to differences in individual setting-specific factors?
-
3. METHODS
3.1. Data
We used the HRS to understand functional decline among older adults with and without dementia.
3.1.1. The Health and Retirement Study
The HRS is a nationally representative, longitudinal panel study that includes about 20,000 middle-aged and older adults who are interviewed every 2 years(Institute for Social Research, University of Michigan, 2018). The HRS, a publicly available survey, contains a wide variety of information on health and functional abilities, including cognitive functioning. It collects information on demographics, individual health information, health services utilization, economic status, labor force participation, housing, and family structure. The HRS selects its sample at the household level to estimate the community-dwelling population; the survey does not recruit adults living in nursing facilities or other types of institutions. However, after community-dwelling older adults complete a baseline survey, they may be followed into an array of residential settings in future years, including community and nursing facility settings. This feature allowed us to compare outcomes of interest for those living in varied residential settings and caregiving arrangements, including nursing facilities. However, it is important to note that the HRS nursing facility population is not representative of all people living in nursing facilities due to the study sample design.
The survey is conducted through in-person or telephone interviews. Proxy respondents are permitted to respond for individuals who are unable to complete the survey themselves. The study design allowed us to conduct a longitudinal study of people with dementia, to assess the trajectory of functional decline for this population. This report uses HRS data beginning in 2000, to allow for an adequate sample size, and ending in 2012. Our analytic files were constructed from the RAND Longitudinal HRS file (Center for the Study of Aging, RAND Corporation, 2019), with additional characteristics and variables merged on from the RAND Fat Files, the original HRS files, and the restricted files for characteristics not included in the longitudinal file. Future analyses will include linked Medicare claims, and thus the study sample focused on the population 65 and older (see Section 3.3 for more detail).
3.2. Variables
3.2.1. Independent Variables
The primary independent variable of interest was indication of dementia. A key variable for sample selection and for dating respondents' functional status was date of death. We also used other variables, including residential setting, access to caregiving, comorbidities, and demographics. As detailed below, we classified individuals who had an indication of dementia in the last two surveys of life and those who had none. Residential settings included nursing facilities and community settings. Comorbidities included in the analyses were diabetes, obesity, congestive heart failure, stroke, and cancer. Demographic information included age, race, ethnicity, sex, level of education, and income. The variables of interest are described in further detail below.
Death
The primary variable for sample selection and for dating the outcomes of interest was death. We leveraged the death date to identify the sample and calculate the timing of any given interview relative to death. HRS obtains mortality information from two sources. At each wave, an interview with each panel member is sought. If a panel member has since died, this is recorded, and an exit interview is sought with a proxy respondent. Additionally, the HRS includes mortality information obtained from the National Death Index (NDI; National Center for Health Statistics, 2013, 2017), a centralized database with death record information including death status, cause of death, and date of death. Where the NDI and the interview date are contradictory, HRS applies an algorithm to determine a day of death. We then subtracting the date of death from the date of the interview to determine time from each interview to death. We classified the time to death in months for each survey response.
Dementia
We classified individuals into two groups: those who had an indication of dementia in either of the last two surveys of life and those who had no such indication. To identify those with dementia on the basis of the HRS data, we used the scoring approach developed by Langa, Kabeto, & Weir (2009) and validated by Crimmins, Kim, Langa, & Weir (2011). The application of this approach across HRS waves is similar to the approach successfully used by Feng, Coots, Kaganova, & Wiener (2014).
For individuals responding to the HRS themselves rather than through a proxy, we used a composite measure of cognitive function to determine dementia status. The composite measure is based on the Telephone Interview for Cognitive Status and uses measures of working memory, recall, and short-term memory. The composite measure is on a scale of 0-27. Scores of 6 or less indicate an individual has dementia, 7-12 indicate cognitive impairment without dementia, and greater than 12 indicate normal cognitive functioning (no dementia; Crimmins et al., 2011; Feng, et al. 2014). For individuals responding to the HRS through a proxy, we used the proxy's assessment of the individual's memory and the respondent's ability to complete instrumental activities of daily living (IADLs[2]) as well as the survey interviewer's score of difficulty to complete the interview with the respondent. These measures are compiled on a scale of 0-11. Scores of 6 or greater indicate an individual has dementia, 3-5 indicate cognitive impairment without dementia, and less than 3 indicate no dementia (Crimmins et al., 2011).
Because, as noted, study participants are surveyed every 2 years, an individual may have different scores in different waves and thus be categorized as having dementia, having cognitive impairment without dementia, or having no cognitive impairment. Given the average 2-year gap in survey responses and the possibility for underreporting, we classified all participants who were identified with dementia at any point using their last two surveys, which primarily occur in the last 4 years of life, as older adults with dementia.
Residential Settings
Residential setting can affect access to supportive and health care services that could mediate the trajectory of decline at EOL. We identified and included in our modeling the respondent's residential setting at the time of the HRS survey. Residential setting included nursing facilities and community settings. The HRS asks individuals if they have moved since the last wave of the survey; therefore, we were able to identify the most recent transition to a different residential setting. We considered including several other measurements of residential setting in our analyses, including an indicator of whether individuals ever lived in a nursing facility during the 4-year period of interest and indicators of whether they lived in an assisted living or senior housing community during the 4-year period of interest. However, because >90% of participants lived in a nursing facility at some point and because assisted living measures had a high degree of missingness, these measures were not used in the analyses.
Caregiving Access and Utilization
Individuals may decline at different rates, depending on the amount of assistance they receive. Caregiving use could mediate the effects of a disability on health and subsequent decline or the effects of the environment on functional status. Therefore, individual access to and utilization of caregiving could be an important contributor to functional decline. We considered the assistance individuals receive with both ADLs and IADLs. The HRS asks who provides the most assistance with each of these two types of tasks. We identified the primary caregiver as the individual who provided the most assistance for both ADLs and IADLs (as measured by the number of days and hours). We classified the primary caregiver into spouse, child, or other. We also included a separate indicator of whether the primary caregiver was paid. Finally, we included a continuous variable indicating the number of caregivers from whom they reported receiving help as a measure of access to care.
Comorbidities
We used several comorbidities in the analyses to assess the relationship between comorbidities and functional status and to assess how functional trajectories differ at the EOL by various comorbidities and dementia. Comorbidities included in the analyses were diabetes, obesity, congestive heart failure, stroke, and cancer. Individuals were identified as having diabetes, congestive heart failure, stroke, and cancer if they reported in the HRS that a doctor had told them they had that disease or condition. They were identified as having obesity if their body mass index (BMI), calculated based on height and weight, was greater than 30.
Demographics
We used individual sociodemographic characteristics to describe the study population and to understand how functional trajectories differ at the EOL by these characteristics. Sociodemographic characteristics included categorical age (categories of 5 year increments up to age 85), race (White, African American, and other) and ethnicity (Hispanic or non-Hispanic), sex, level of education (less than high school, high school to some college, college or greater), and categorical income (less than $20,000; $20,000-$100,000; and greater than $100,000).
3.2.2. Dependent Variables
Key dependent variables of interest included point-in-time estimates of functional status and changes in functional status. These variables are described in greater detail below.
Point-in-Time Functional Status
We assessed functional status through an index that reflects the individual's reported difficulty with the six ADLs included in the Katz Index (Katz, Downs, Cash, & Grotz, 1970; Katz, Ford, Moskowitz, Jackson, & Jaffe, 1963). Because of concerns about the overlap of IADLs with the definition of dementia and the level of detail available for assistance with IADLs in the HRS survey, we did not include an outcome measure of functional status using IADLs.
The original Katz Index is calculated based on an individual's receipt of assistance with the six ADLs, including bathing, dressing, eating, bed transfer, toileting, and incontinence. We modified this definition to ensure that it captured impairment rather than access to caregiving; the index used for these analyses indicates whether the respondent or their proxy reported difficulty with these ADLs. A higher score indicates more difficulty with ADLs. However, because of the nature of binary responses in scoring an individual's dependence, the scale does not provide the ability to measure minor changes in functional status over time. We generated the ADL index using the sum of the ADLs with which the respondent reported difficulty.
Change in Functional Status
For the longitudinal analysis, we also calculated a change score of the difference in the ADL score between HRS survey responses, subtracting the score in the prior survey from the score in the last survey. For this outcome, a positive score indicates an increase in the number of ADLs that a respondent reported difficulty with as death approached.
3.3. Sample Identification
The primary population of interest was decedents who had been eligible for Medicare. We began by identifying HRS participants who died after January 1, 2000, and who were responsive to the HRS in their last survey before death (n = 8,915). We restricted the sample population to include older adult decedents, age 65 or older by the time of their last survey before death (n = 6,929) and age 65 or older by January 1, 2000 (n = 6,645), and thus largely eligible for Medicare coverage at the time of the survey. In combination, these two requirements resulted in a sample of 5,853 included older adults residing in either the community or nursing facility settings and having or not having dementia.
From this population, we created two different analytic samples. Our first analytic sample (the "point-in-time analysis sample"), detailed in Section 3.3.1, consisted of person-survey combinations from the last two surveys in a respondent's life. Each survey was treated as a snapshot for the respondent at a given point in time. We used this analytic sample to test the effect of respondents' characteristics on their ADL scores at any given time point and to generate predicted ADLs at all time periods in the last 4 years of life. Our second analytic sample (the "longitudinal analysis sample"), detailed in Section 3.3.2, consisted of person-level data compiled from both of the last two surveys. We used this analytic sample to test the effect of respondent characteristics on the change in ADL scores between the last two surveys in a respondent's life.
3.3.1. Point-in-Time Analysis Sample
In the cross-sectional analysis estimating point-in-time functional status, we used person-survey combinations from multiple surveys across multiple waves for the population of interest. Each person-survey combination was treated as a separate observation (see Section 3.4.1 for more information on this approach). For this analysis, we used the last survey before death ("the last survey") or the second-to-last survey before death ("the prior survey"). Depending on the exact timing of the survey, the last two surveys could occur from 0 to 58 months before death. Although we considered using the third-to-last survey before death, we decided not to use information that ranged from 5-6 years before death, because it might bias estimates regarding the potentially unique patterns of decline nearer to death and because many individuals would not have these surveys available within the 2000-2012 data window (e.g., for respondents whose last survey before death was 2000-2004).
To use the survey, we required that survey records have non-missing information regarding the date of the interview as well as the component and score variable for the ADL index at the time of the interview. Because some individuals were non-responsive in their prior survey and some individuals may have had a prior survey before the data selection period, not all individuals had two survey records for inclusion in the cross-sectional analysis.
Of the 5,853 potential individuals, some (n = 216) had missing information regarding their ADL score in the last survey, leaving 5,637 person-survey combinations from the last survey. Of this same group eligible for the longitudinal sample (n = 5,853), 4,801 had a prior survey; an additional 150 had missing values for the last survey but had no missing values for the prior survey. Because of some (n = 303) observations with missing information regarding the timing of their prior survey or the ADL score in their prior survey, 4,498 person-survey combinations were available from the prior survey. This left a total sample of 10,135 person-survey combinations (5,853 + 4,498) from respondents' last two surveys before death.
3.3.2. Longitudinal Analysis Sample
For the longitudinal analysis, we used information for each person from multiple surveys across multiple waves. However, each observation was at a respondent level, with variables reflecting information from multiple surveys (see Section 3.4.2 for more information on this approach). For this analysis, we needed selected information from both prior and last surveys to calculate the ADL change. We began with the 5,637 persons with ADL scores and time to death for their last survey. To calculate the change score, we required them to have a prior survey (n = 4,801) and additionally have an ADL score and a time to death in their prior survey, leaving 4,348 persons.
3.4. Analysis
In the first set of analyses, RTI used the survey data cross-sectionally to estimate an average functional status (ADL) in every month in the 4 years before death. Each observation consisted of person-survey combinations from the last two surveys in a respondent's life, and each survey was treated as a snapshot for the respondent at a given point in time. We used this analytic sample to test the effect of respondents' characteristics at any given time point on their ADL scores at that time. Using the model we developed, we generated predicted ADLs at all months in the last 4 years of life.
For the cross-sectional analysis, the distribution of the ADL count outcome (range of 0-6) drove the testing of the modeling approach. The overall modeling approach was a generalized linear model, which allows for a non-normal distribution of the error term. Given the count outcome and the overdispersion in the outcome, a negative binomial was preferred to the Poisson as a more conservative approach. After comparisons of the distribution of the predicted against the observed value of ADLs, information criterion, and correlations of the predicted and observed values, the final model was a negative binomial; although the information criterion values were slightly lower for the zero-inflated negative binomial than for the negative binomial, the predictions from the negative binomial were closer to the observed for the majority of observations.
Because individuals could have multiple surveys in the last 4 years before death, there were likely correlations within person. We tested and ultimately decided not to use a generalized estimating equation model (Burton, Gurrin, & Sly, 1998) because of lack of convergence, likely due to the limited number of repeated observations per person. Instead, we tested and used Huber-White clustered standard errors, which adjust standard errors to account for the correlation between an individual's repeated surveys (Wooldridge, 2002).
Using the ADL index as a count outcome, the final model took the following general form:
| E(ADLi,t) = α + β*Dementiai,t + γ*TTDeathi,t + µ*Dementiai,t * TTDeathi,t + λ*Xi,t + εi,t |
where E(ADLi,t) denotes the ADL score of individual i at time t; α is the intercept; β is the parameter estimate for individual i with dementia at t; γ is the parameter estimate for the months until death for individual i at t; µ is the parameter estimate for the interaction of dementia status and months until death for individual i at t; λ is a vector of parameter estimates for Xi,t, which represents a vector of all other relevant covariates (e.g., comorbidities, caregiving use, etc.) as potential confounders measured at t; and εi,t is the error term. We tested the inclusion of categorical time trends, but given the decreased efficiency created by the inclusion of many additional bivariate time trends and similar conclusions from these results, we included a linear term marking the number of months before death (0-58; median of 23) as well as time trends for the wave of the HRS.
Using the model parameter estimates obtained above, we then predicted average trajectories if respondents were to have key characteristics of interest (i.e., holding other observed characteristics at their true values, changing values for key characteristics such as dementia status and generating predicted ADL score; Williams, 2012). We generated predicted ADLs from the model, rather than displaying coefficient estimates, to give a more practical interpretation of the magnitude of a characteristic's effect. Changing characteristics with a small effect on the ADL score would show no significant difference in predicted score for those with or without characteristics, whereas covariates with a large effect would generate larger and significant changes in the predicted ADL score. We generated predictions by changing characteristics such as dementia or non-dementia status, as well as predictions for those with and without dementia and with and without other key characteristics (dementia status in nursing facility and community settings, etc.). Results can be interpreted as average predicted ADL impairments controlling for other characteristics at any given point in time if all individuals were to have the examined characteristic. Results should not be interpreted as predicted values within subgroups of people with and without the characteristic.
In the second set of analyses, we modeled the effect of individual characteristics on the subsequent change in ADL score from the prior to the last survey. Each observation was at a respondent level, with variables reflecting information from multiple surveys. The dependent variable was a change score between the number of ADLs with difficulty between the prior and last survey. Covariates represented respondent characteristics at the time of the prior survey.
Similar to that in the cross-sectional analysis, the overall modeling approach was a generalized linear model, which allows for a non-normal distribution of the error term. Because the outcome of change in functional status could be negative or positive but was centered at zero, we tested several potential link functions in Gaussian distributions. When we compared the distribution of the predicted value with the distribution of the observed, information criterion, and correlations of the predicted and observed value, the final model was a linear regression. We controlled for several timing variables that may affect the magnitude of the change in functional status, including the time of the prior survey, the ADL score at the time of the prior survey (a proxy for risk for ADL decline or improvement), and the interval of time between the prior and last survey. Besides dementia, all other covariates were measured at the time of the prior survey (before the measured change in ADLs occurred).
Using a measure of functional status as a change in the ADL score, we specified a generalized linear model that takes the following general form:
| E(ADLi,t - ADLi,t-1) = α + β*Dementiai + γ*TTDeathi,t-1 + µ*Dementiai,t-1 * TTDeathi,t-1 + ∞*Time Intervali + κ*ADL Scorei,t-1 + λ*Xi,t-1 + εi,t-1, |
where the dependent variable is the change score in functional status from the prior survey (t-1) to the last survey (t); β is the parameter estimate for individual i with dementia at (t-1); γ is the parameter estimate for the time to death measured in years from the prior survey (t-1; 1-2 years, 2-3 years, etc.); µ is the parameter estimate for the interaction of dementia status and years from the prior survey until death for individual i at (t-1); ∞ is a parameter estimate for the interval of time over which the change in ADLs could be measured ((t-1) - t); κ is a the parameter estimate for the ADL score for individual i at (t-1); λ is a vector of parameter estimates for Xi,t, which represents a vector of all other relevant covariates (as mentioned above) as potential confounders measured at the prior survey (t-1); and εi is the error term.
Using the model parameter estimates obtained above, we then predicted change in ADL impairments from t to t-1 if respondents were to have key characteristics of interest (i.e., holding other observed characteristics at their true values, changing values for key characteristics such as dementia status and generating predicted ADL change; Williams, 2012). Results are presented as the predicted change in ADLs between the two last surveys if only the characteristic in question were changed (e.g., what would the average predicted change in ADL be if everyone had dementia compared to the predicted change in ADL if no one had dementia). Because these estimates control for the starting ADL score, the predicted change in ADL should be interpreted as the predicted ADL decline for people with and without dementia but with similar ADL dependency 2-4 years before death.
3.4.3. Sensitivity Testing and Limitations
To sensitivity test these results, we examined predictions using an array of possible interaction terms, which made marginal but non-substantive differences in the findings. We also examined whether the estimated point-in-time ADL scores were broadly consistent if we used a categorical variable for time trends, though this number of categorical terms substantially reduced the statistical power of the analysis. Additionally, we tested whether cross-sectional results for the last 2 years of life were generally consistent if we limited observations to the last survey before death; point estimates and differences in the dementia and non-dementia population were similar in their difference, though confidence intervals (CIs) widened with implications for hypothesis testing. Finally, for the cross-sectional models, we tested whether omitting caregiving use and nursing facility residence from the explanatory model affected the findings, since these could both change the decline of individuals and yet also serve as a marker for acuity. Omitting these variables from the explanatory model increased the overall average predicted acuity and the exact month at which dementia made a significant difference in the average predicted ADL, but did not change the overall findings regarding dementia's significant effect further away from death. Overall, the findings were broadly consistent in all sensitivity tests examined.
For the longitudinal model, we also examined possible interaction terms with marginal increased power but non-substantive differences in findings. We tested whether omitting variables that might be associated with acuity of illness and thus functional status, such as the starting number of ADLs, nursing facility residence, and caregiving at the prior survey, affected these findings. Unfortunately, these revised models did a poor job predicting subsequent ADL decline overall (R2 reduced by 0.11 and not aligned with observed values), thus the model results are unreliable although dementia's effect remained non-significant in these findings. Otherwise, model results were consistent in sensitivity tests.
Despite our extensive sensitivity testing, limitations in the analysis remain. For both analyses, the survey used self-reported or proxy-reported responses, both of which are subject to measurement bias, for almost all questions regarding dementia, comorbidities, or both. In addition, for the change score, comorbidities were included at the time of the prior survey. In some cases, participants may have had a health event or diagnosis in the intervening time that was non-random and associated with included covariates. For dementia status, we used a validated methodology that should be fairly sensitive (Crimmins et al., 2011; Langa et al., 2009). However, because our approach was more inclusive in that participants were identified as having dementia if either of the last two surveys indicated that they had dementia, it may label some participants who did not have dementia as dementia patients. In this case, estimates should be more conservative and biased to the null. In addition, respondents with only one survey had only one assessment to contribute to their dementia category.
Non-response bias is a limitation of both the cross-sectional and longitudinal analyses, and it also has implications for any differences in findings between the two. Although participants with missing data in non-critical covariates (e.g., income, etc.) were not excluded, participants who were non-responsive to the survey in general or skipped any questions critical to the analyses (such as ADL score or components used in the dementia status) were excluded from either sample. However, the nature of those exclusions varied. For the cross-sectional analysis, we were able to include respondents who had complete responses for only the last survey; in some cases, we also were able to include respondents who had complete responses from only the prior survey (n = 150). However, for the longitudinal analysis, we could include only those who had both a prior and a last survey and complete responses for ADL status in both (we made inferences regarding dementia status using any complete dementia score from the last two surveys). An implication is that the longitudinal analysis may be more vulnerable to non-response bias and the sample for the change score analysis may be limited to respondents who are less sick or have more compensating social support as discussed in Section 5.3 (which could enable them or their proxies to respond to questions).
We did include caregiving and nursing facility usage in the list of explanatory variables, as these could affect the pace of decline. We were also interested in examining their effects on functional status. However, both of these could also be associated with functional status or act as proxy for the severity of disease affecting functional status. As discussed above, we conducted sensitivity testing to remove these covariates, which did not significantly change our findings; thus, we included them which allowed us to test how nursing home status and caregiving might be associated with functional status or ADL changes.
Finally, the estimates here do not include survey weights because of the sample construction across HRS waves, the focus of these analyses on decedents, and inclusion of individuals in nursing facilities. Including sampling weights in these analyses would have amounted to a false precision, may not have been appropriate for decedents alone (the focus of these analyses), and would have been impossible for those living in nursing facilities. As a result, despite the robustness of the sample, estimates regarding the prevalence of dementia and other characteristics are not nationally generalizable.
4. RESULTS
4.1. Sample: Sample for Point-in-Time Estimates
The cross-sectional sample to estimate point-in-time ADL scores included observations from the last and prior survey before death for decedents (person-survey combinations). The sample characteristics in Exhibit 1 are presented at a person-level for people with and without dementia who were included in the cross-sectional analysis. The characteristics reflect responses at the time of the last survey and individuals who only had a prior survey are not presented in the table below.
There were significant differences in decedents with and without dementia. HRS decedents with dementia had a significantly higher mean ADL impairment score compared to those without dementia. Across age groups, the dementia population was significantly more likely to be female. The distribution of age among HRS decedents also looked significantly different; decedents with dementia were more likely to be aged 65-69, 75-79, or over 85. Dementia respondents were significantly more likely to be of African American or other non-White race, as well as Hispanic.
Clinically, decedents with dementia were significantly more likely to have had a stroke but significantly less likely to have had a cancer diagnosis, heart disease, or obesity. There were also differences in their socioeconomic status and caregiving. Dementia decedents were significantly more likely to have not attended college and have received less than a high school education. The dementia population was also significantly more likely to have lower reported income levels. Dementia decedents were more likely to live in a nursing facility and had a significantly higher mean number of caregivers than those without dementia. The dementia population was also significantly more likely to receive primary caregiving from their children. There was no significant difference between the two groups in receiving primary caregiving from a spouse.
| EXHIBIT 1. Sample Characteristics for Decedents at their Last HRS Survey | |||||
|---|---|---|---|---|---|
| Description | No Dementia (N = 3,361) | Dementia (N = 2,276) | Significance Test | ||
| N | % or Mean | N | % or Mean | ||
| Time to death in months: Last survey | 3,361 | 13.39 | 2,276 | 13.64 | 0.221 |
| ADL score (0-6) | 3,361 | 1.64 | 2,276 | 2.19 | 0.000 |
| Demographics | |||||
| Age: 65 to 69 | 83 | 2.5% | 121 | 5.3% | 0.000 |
| Age: 70 to 74 | 346 | 10.3% | 214 | 9.4% | 0.272 |
| Age: 75 to 79 | 690 | 20.5% | 370 | 16.3% | 0.000 |
| Age: 80 to 84 | 837 | 24.9% | 520 | 22.8% | 0.076 |
| Age: 85+ | 1,405 | 41.8% | 1,051 | 46.2% | Referent |
| Male | 1,563 | 46.5% | 977 | 42.9% | 0.008 |
| Female | 1,798 | 53.5% | 1,299 | 57.1% | 0.008 |
| Race and ethnicity | |||||
| White | 2,958 | 88.0% | 1,825 | 80.2% | Referent |
| African American | 331 | 9.8% | 381 | 16.7% | 0.000 |
| Other race | 72 | 2.1% | 70 | 3.1% | 0.028 |
| Hispanic ethnicity | 179 | 5.3% | 185 | 8.1% | 0.000 |
| Socioeconomic | |||||
| College | 515 | 15.3% | 210 | 8.9% | 0.000 |
| Less than high school | 1,086 | 32.3% | 1,051 | 44.3% | 0.000 |
| High income | 139 | 4.1% | 67 | 2.8% | 0.019 |
| Low income | 1,522 | 45.3% | 1,293 | 54.5% | 0.000 |
| Comorbidities | |||||
| Cancer | 947 | 28.2% | 488 | 20.6% | 0.000 |
| Diabetes | 889 | 26.5% | 561 | 23.7% | 0.129 |
| Heart disease | 1,697 | 50.5% | 1,010 | 42.6% | 0.000 |
| Obesity | 489 | 14.5% | 293 | 12.4% | 0.074 |
| Stroke | 829 | 24.7% | 685 | 28.9% | 0.000 |
| Caregiving utilization | |||||
| Primary caregiver: Child | 503 | 15.0% | 418 | 17.6% | 0.001 |
| Primary caregiver: Spouse | 275 | 8.2% | 192 | 8.1% | 0.735 |
| Primary caregiver: Paid | 160 | 4.8% | 112 | 4.7% | 0.783 |
| Number of caregivers | 3,361 | 0.58 | 2,276 | 0.679 | 0.001 |
| Nursing Facility | 600 | 17.9% | 512 | 22.5% | 0.000 |
| NOTE: Higher ADLs scores indicate greater impairment. | |||||
4.2. Functional Status at the End of Life
The results presented below detail the relationship of dementia with functional decline in the last 4 years of life. In general, people with and without dementia had a similar average predicted ADL score in the last year of life after controlling for other characteristics. However, there was a significant difference in functional status between people with and without dementia up until the last year of life. In combination, dementia was associated with a smaller decline in predicted ADL impairments over the last 4 years because baseline predicted ADL score was higher 4 years before death. Predicted ADL impairments over the last 4 years of life are presented for all respondents in Section 4.2.1; differences in predicted ADL by dementia status are also presented by nursing facility or community residence in Section 4.2.2, caregiving access and use in Section 4.2.3, and other comorbidities in Section 4.2.4.
Note that all predicted ADL impairment scores discussed in Sections 4.2.1-4.2.5 are estimated in the full population, to generate the average marginal effects of dementia and the covariate of interest, holding other observed values constant. Thus, discussions below are not observed or predicted values within subgroups, but the average predicted value if the full population were to have the characteristic of interest.
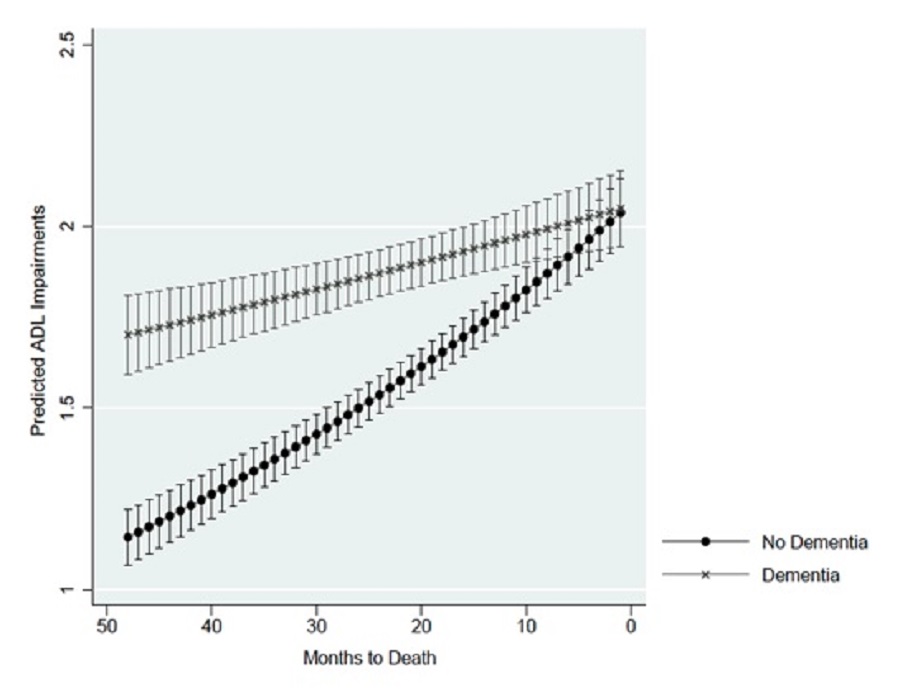
Overall, dementia status was associated with a higher predicted number of ADLs performed with difficulty from 48 to 10 months before death. Exhibit 2 shows the predicted ADLs by dementia status at each month for the last 4 years of life. In the months immediately preceding death, the predicted number of ADL impairments is a little over 2 and similar regardless of dementia status. At 1 year preceding death, the predicted number of ADL impairments was 10% higher at 1.96 with dementia and 1.78 without dementia. At 2 years preceding death, the predicted number of ADL impairments was 22% higher at 1.87 with dementia and 1.54 without dementia. At 3 years preceding death, the predicted number of ADL impairments was 34% higher at 1.78 with dementia and 1.33 without dementia. At 4 years preceding death, the predicted number of ADL impairments was 49% higher at 1.70 with dementia and 1.15 without dementia.
| EXHIBIT 2. Predicted ADL Impairments by Dementia Status |
|---|
 |
4.2.2. Residential Setting and Dementia Status
Living in a nursing facility was associated with a significantly higher predicted number of ADL impairments compared to living in the community, adjusting for other characteristics. Exhibit 3 shows the predicted ADL impairments by dementia status and residential setting at each month for the last 4 years of life. If decedents lived in a nursing facility, having dementia was associated with a higher predicted number of ADL impairments for much of the last 4 years of life relative to not having dementia. The predicted number of ADL impairments increased and became more similar as participants approached death, regardless of their dementia status. Living in the community was associated with a significantly lower predicted number of ADL impairments than living in a nursing home after adjusting for other characteristics, regardless of time point .
If decedents lived in a nursing facility, the difference in predicted number of ADL impairments between those with and without dementia was significantly different from the beginning of the observation window until 12 months before death. Assuming nursing home residence, the predicted number of ADL impairments was significantly higher for people with dementia than for people without dementia at 1 year (4.00 vs. 3.63, respectively), 2 years (3.82 vs. 3.14), 3 years (3.64 vs. 2.71), and 4 years preceding death (3.47 vs. 2.34).
The effect of dementia if respondents lived in the community (instead of in a nursing facility), was similar; however, there were smaller differences in the predicted number of ADL impairments between those with and without dementia. If respondents lived in the community during their survey, the predicted number of ADL impairments was significantly higher from the beginning of the observation window until 11 months before death. The predicted number of ADL impairments was significantly higher at 1 year (1.52 vs. 1.38, respectively), 2 years (1.45 vs. 1.19), 3 years (1.38 vs. 1.03), and 4 years (1.32 vs. 0.89) before death.
| EXHIBIT 3. Predicted ADL Impairments by Dementia Status and Nursing Facility Residence |
|---|
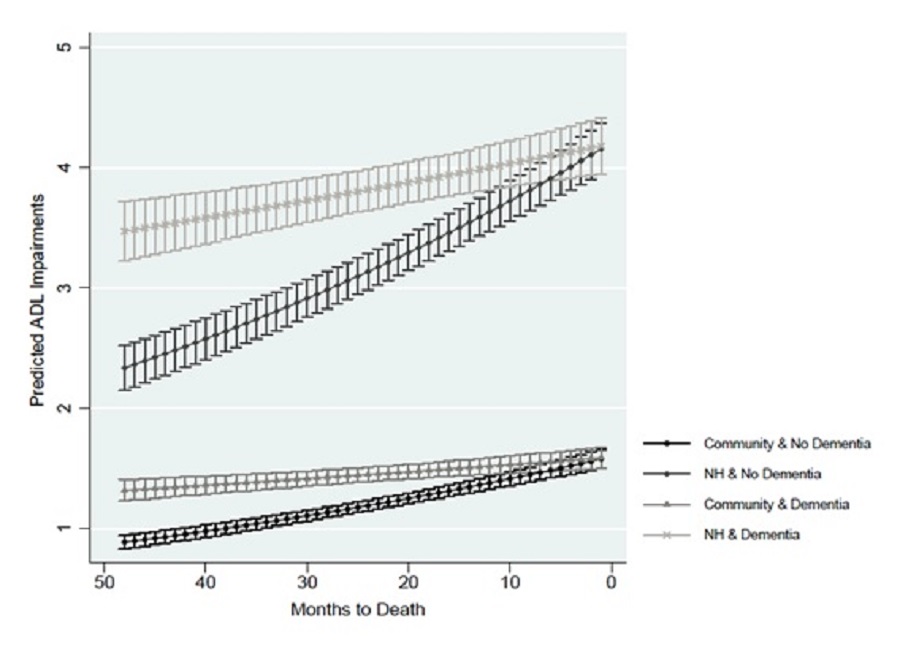 |
| NOTE: NH = nursing facility residence. |
4.2.3. Caregiving and Dementia Status
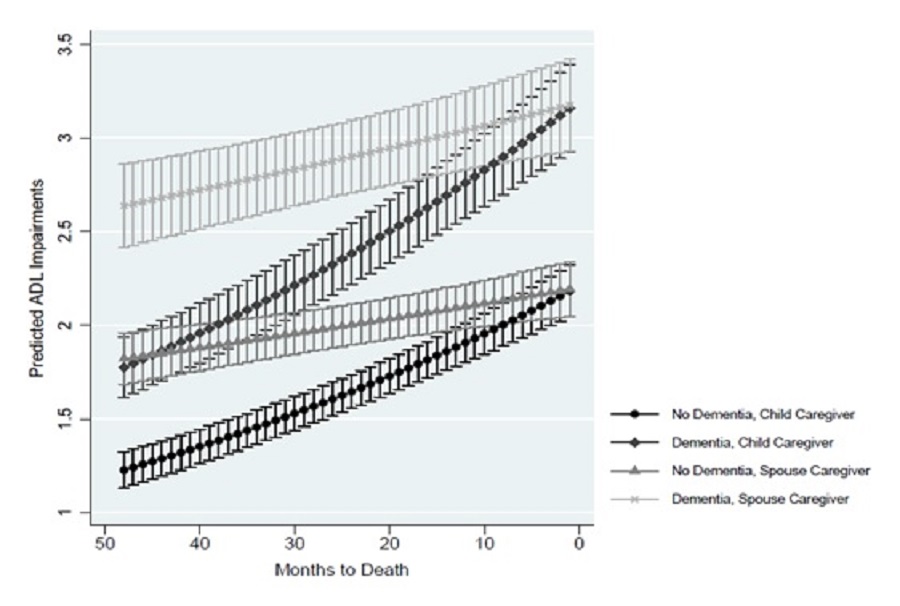
Regardless of dementia status, caregiving use was associated with the predicted number of ADL impairments. Caregiving reflected the respondent's reported use of caregiving at the time of the survey, and all predictions also adjusted for the total number of caregivers the participant reported receiving help from and whether the respondent lived in a nursing facility. Exhibit 4 shows the predicted ADL impairments by dementia status and primary caregiver at each month for the last 4 years of life. Across time periods, having a spouse as primary caregiver was associated with a significantly higher predicted number of ADL impairments, followed by having a child as primary caregiver, and then by having no caregiver (omitted from Exhibit 4). At 4 years preceding death, dementia was associated with a higher predicted number of ADL impairments across all three caregiver categories (no primary caregiver, spouse as primary caregiver, child as primary caregiver) compared to not having dementia. However, near death, the predicted number of ADL impairments was similar within the caregiving groups regardless of dementia status.
If the respondent reported no primary caregiver (omitted from Exhibit 4), the difference in predicted ADL impairments between those with and without dementia was significantly different from the beginning of the observation window until 11 months before death. If the spouse was the primary caregiver, the difference in predicted number of ADL impairments between those with and without dementia was statistically significant beginning from the beginning of the observation window until 17 months before death. The predicted number of ADL impairments was significantly higher if the spouse was the primary caregiver for those with dementia at 2 years preceding death (2.90 vs. 2.38, respectively), 3 years preceding death (2.76 vs. 2.06), and 4 years preceding death (2.64 vs. 1.77). If the child was the primary caregiver, the difference in predicted number of ADL impairments between those with and without dementia was statistically significant from the beginning of the observation window until 14 months before death. The predicted number of ADL impairments was significantly higher for those with dementia if the child was the primary caregiver at 2 years before death (2.00 vs.1.65, respectively), 3 years before death (1.91 vs. 1.42), and at 4 years before death (1.82 vs. 1.23).
| EXHIBIT 4. Predicted ADL Impairments by Primary Caregiver Use and Dementia Status |
|---|
 |
4.2.4. Comorbidities and Dementia Status
Stroke
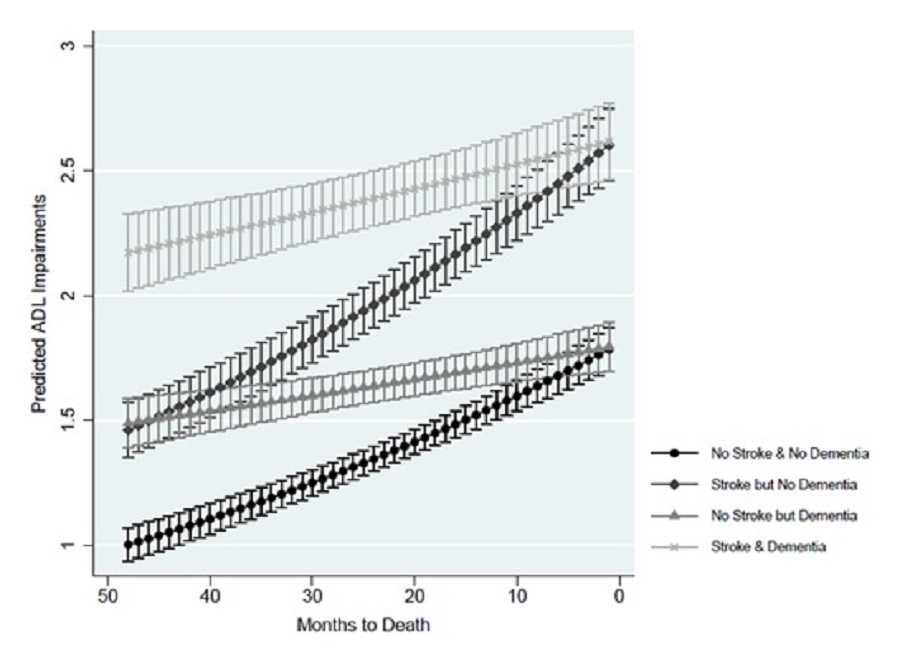
Overall, a prior stroke was associated with a higher number of predicted ADL impairments compared to no stroke history. Exhibit 5 shows the predicted ADL impairments by dementia status and prior stroke at each month for the last 4 years of life. If decedents reported a stroke, the difference in predicted number of ADL impairments between those with and without dementia was statistically significant from the beginning of the observation window until 12 months before death. The predicted number of ADL impairments was significantly higher at 1 year (2.50 vs. 2.27, respectively), 2 years (2.39 vs. 1.96), 3 years (2.28 vs. 1.69), and 4 years preceding death (2.17 vs. 1.46). Overall, the predictions followed a similar pattern if the decedent was assumed to have no prior stroke, though the predictions were lower overall.
| EXHIBIT 5. Predicted ADL Impairments by Dementia Status and Stroke |
|---|
 |
Cancer
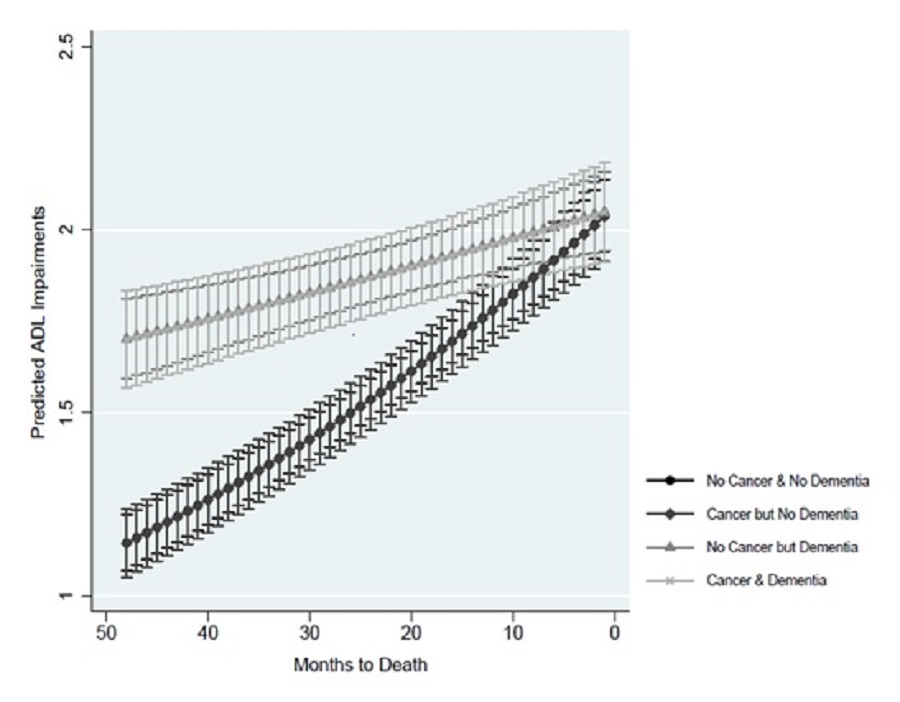
There was no significant difference in the predicted number of ADL impairments associated with cancer. Exhibit 6 shows the predicted ADL impairments by dementia status and cancer diagnosis at each month for the last 4 years of life. Regardless of reported cancer, dementia was associated with a significantly higher number of predicted ADL impairments earlier than 1 year before death. See Section 4.2.1 for a more detailed discussion of the differences in predicted ADL impairments for those with and those without dementia.
| EXHIBIT 6. Predicted ADL Impairments by Dementia Status and Cancer Diagnosis |
|---|
 |
Heart Disease
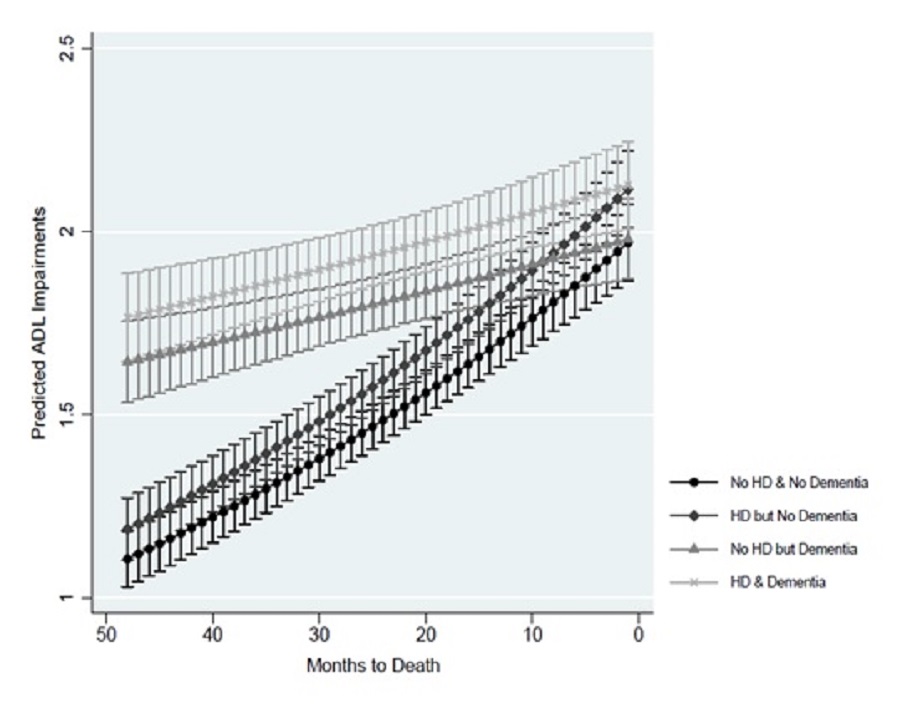
There was no significant difference between the predicted number of ADL impairments, regardless of reported heart disease. Exhibit 7 shows the predicted ADLs by dementia status and heart disease diagnosis at each month for the last 4 years of life. Regardless of reported heart disease, dementia was associated with a significantly higher number of predicted ADL impairments compared to no dementia earlier than 1 year before death. See Section 4.2.1 for a more detailed discussion of the differences in predicted ADL impairments for those with and without dementia.
| EXHIBIT 7. Predicted ADL Impairments by Dementia Status and Heart Disease Diagnosis |
|---|
 |
Obesity
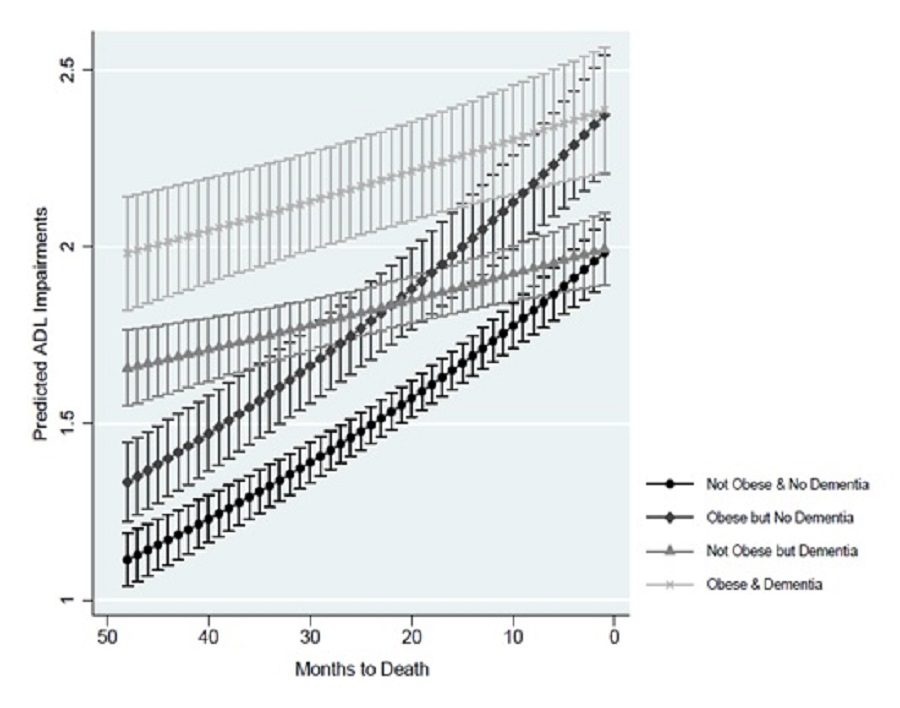
Obesity was associated with a significant difference in the predicted number of ADL impairments. Exhibit 8 shows the predicted ADL impairments by dementia status and obesity at each month for the last 4 years of life. If decedents were obese, the difference in predicted number of ADL impairments between those with and without dementia was statistically significant from the beginning of the observation window until 16 months before death (versus 10 months before death with no obesity). If decedents were obese, dementia was associated with a significantly higher predicted number of ADL impairments at 2 years (2.18 vs. 1.79, respectively), 3 years (2.08 vs. 1.55), and 4 years preceding death (1.98 vs. 1.33). If participants were not obese, the same general patterns appear, although the difference in predicted number of ADL impairments between those with and without dementia was statistically significant from the beginning of the observation window until 10 months before death.
| EXHIBIT 8. Predicted ADL Impairments by Dementia Status and Obesity |
|---|
 |
4.3. Sample: Sample for Longitudinal Analysis of Change in ADL Scores
The longitudinal sample included observations with both last and prior surveys and information regarding ADL status at both time points. The sample characteristics in Exhibit 9 are presented at a person-level, showing the characteristics at the time of their prior survey for those with and without dementia. Differences between the point-in-time sample from Exhibit 1 and the longitudinal sample (Exhibit 9) include the timing of measurement for characteristics (characteristics are presented below at the prior survey 2-4 years before death rather than the last survey) and the respondents. Everyone in the longitudinal analysis also appears in the cross-sectional analysis, but some individuals who were part of the cross-sectional analysis were not eligible for the longitudinal analysis.
There were significant differences in HRS decedents with and without dementia. The dementia population had a significantly higher average ADL impairment score than the non-dementia population at the prior survey. The dementia population was significantly more likely to be female and more likely to be over 85. Dementia decedents were significantly more likely to be of African American or other non-White race and Hispanic.
Clinically, decedents with dementia were significantly more likely to have had a stroke but significantly less likely to have had a cancer diagnosis or heart disease. There were no significant differences between the dementia and non-dementia respondents in their rates of obesity and diabetes.
There were also socioeconomic differences in respondents with and without dementia. Respondents with dementia were less likely to have attended college and more likely to have lower reported income levels. Caregiving at the time of the prior survey was also significantly different for people with and without dementia. Decedents with dementia were significantly more likely to live in a nursing facility, had a significantly higher mean number of caregivers than those without dementia, and were significantly more likely to have a child as a primary caregiver at 2-4 years before death.
| EXHIBIT 9. Sample Characteristics for Longitudinal Analysis of Change Scores | |||||
|---|---|---|---|---|---|
| Description | No Dementia (N = 2,919) | Dementia (N = 1,429) | Significance Test | ||
| N | % or Mean | N | % or Mean | ||
| Time to death in months: Prior survey | 2,919 | 13.44 | 1,429 | 13.14 | 0.736 |
| ADL score (0-6) at last survey | 2,919 | 1.63 | 1,429 | 2.76 | 0.0001 |
| Demographics | |||||
| Age: 65 to 69 | 56 | 1.9% | 19 | 1.3% | 0.161 |
| Age: 70 to 74 | 309 | 10.6% | 92 | 6.4% | 0.000 |
| Age: 75 to 79 | 625 | 21.4% | 212 | 14.8% | 0.000 |
| Age: 80 to 84 | 752 | 25.8% | 325 | 22.7% | 0.030 |
| Age: 85+ | 1,177 | 40.3% | 781 | 54.7% | Referent |
| Male | 1,382 | 47.3% | 589 | 41.2% | 0.000 |
| Female | 1,537 | 52.7% | 840 | 58.8% | Referent |
| Race and ethnicity | |||||
| White | 2,456 | 84.1% | 993 | 69.5% | Referent |
| African American | 262 | 9.0% | 263 | 18.4% | 0.000 |
| Other race | 58 | 2.0% | 43 | 3.0% | 0.036 |
| Hispanic ethnicity | 143 | 4.9% | 130 | 9.1% | 0.000 |
| Socioeconomic | |||||
| College | 474 | 16.2% | 120 | 8.4% | 0.000 |
| Less than high school | 862 | 29.5% | 704 | 49.3% | 0.000 |
| High income | 132 | 4.5% | 36 | 2.5% | 0.001 |
| Low income | 1,254 | 43.0% | 834 | 58.4% | 0.000 |
| Comorbidities | |||||
| Cancer | 864 | 29.6% | 288 | 20.2% | 0.000 |
| Diabetes | 797 | 27.3% | 357 | 25.0% | 0.103 |
| Heart disease | 1,500 | 51.4% | 656 | 45.9% | 0.000 |
| Obesity | 445 | 15.2% | 187 | 13.1% | 0.057 |
| Stroke | 677 | 23.2% | 498 | 34.8% | 0.000 |
| Caregiving utilization | |||||
| Primary caregiver: Child | 403 | 13.8% | 336 | 23.5% | 0.000 |
| Primary caregiver: Spouse | 236 | 8.1% | 136 | 9.5% | 0.112 |
| Primary caregiver: Paid | 130 | 4.5% | 82 | 5.7% | 0.064 |
| Number of caregivers | 2,919 | 0.540 | 1,429 | 0.846 | 0.000 |
| Nursing Facility | 110 | 3.8% | 288 | 20.2% | 0.000 |
| NOTE: Higher ADLS scores indicate greater impairment. | |||||
4.4. Change Scores in Functional Status at the End of Life
The results below detail the association of dementia with the ADL change measured between the two last surveys (prior and last survey), controlling for respondent characteristics including baseline ADL score. Most respondents had a prior survey that occurred at 2-3 years before death (39%) or 3-4 years before death (47.5%) and then had an average 24-month interval until their last survey (the interval over which ADL change could occur).
This analysis suggests there was no significant difference in ADL change associated with dementia status after controlling for prior ADL impairment score. Predicted ADL changes are presented by dementia status for all patients in Section 4.4.1; differences in predicted ADL by dementia status are also presented by nursing facility or community residence in Section 4.4.2, caregiving access and use in Section 4.4.3, and other comorbidities in Section 4.4.4.
Note that all predicted ADL impairment changes discussed in Sections 4.4.1-4.4.4 are estimated to generate the average marginal effect of dementia and the included covariate, holding other observed values constant. Thus, discussions below address the average predicted value if the full population were to have the characteristic of interest. These estimates control for respondent characteristics, including the baseline ADL impairments, at the time of the prior survey.
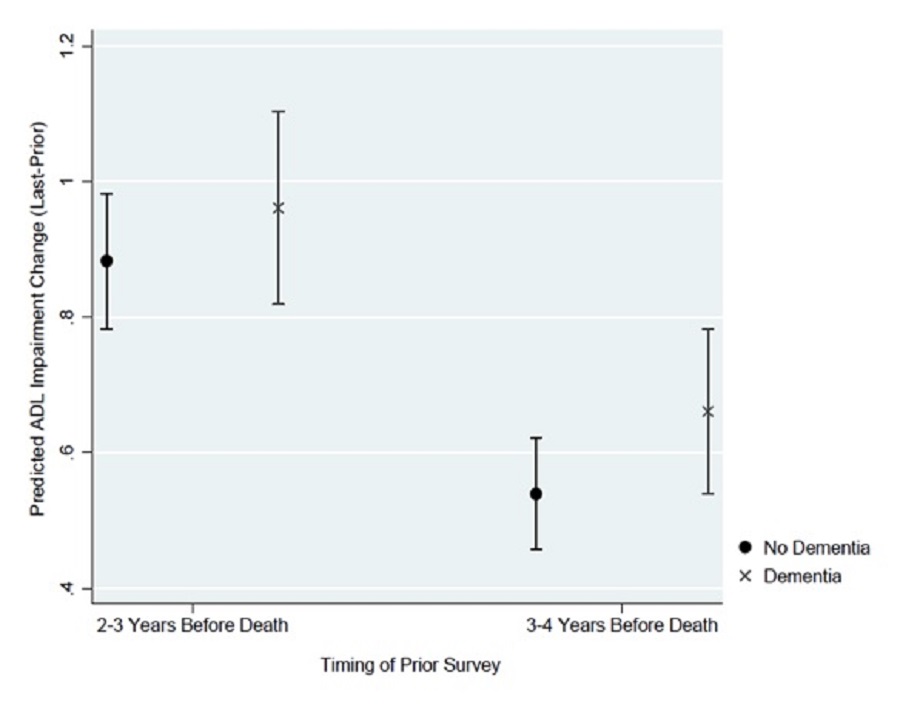
The sample had similar average predicted change in ADL impairments from the prior to the last survey regardless of dementia status, controlling for baseline ADL impairments. Exhibit 10 presents the predicted ADL change from the prior to the last survey by dementia status. The predicted ADL impairments change was not significantly different between those with and without dementia, regardless of the time period covered by the change score (2-3 years to 0-1 years before death vs. 3-4 years to 1-2 years before death). When the starting point (anchored by the prior survey) was assumed to be 2-3 years before death, the average predicted increase in ADL impairments was 0.883 (95% CI of 0.783-0.983) if respondents had no dementia and 0.961 (95% CI of 0.819-1.103) if respondents had dementia. If the starting point was measured farther away from death (e.g., 3-4 years), the non-significant change in ADL score was consistent, though the predicted increase in ADL impairments was smaller. When the starting point was 3-4 years before death, the average predicted increase in ADL index was 0.54 (95% CI of 0.457-0.622) if respondents had no dementia and 0.661 (95% CI of 0.539-0.783) for respondents had dementia.
| EXHIBIT 10. Predicted Change in ADL Impairments by Dementia Status |
|---|
 |
4.4.2. Residential Setting and Dementia Status
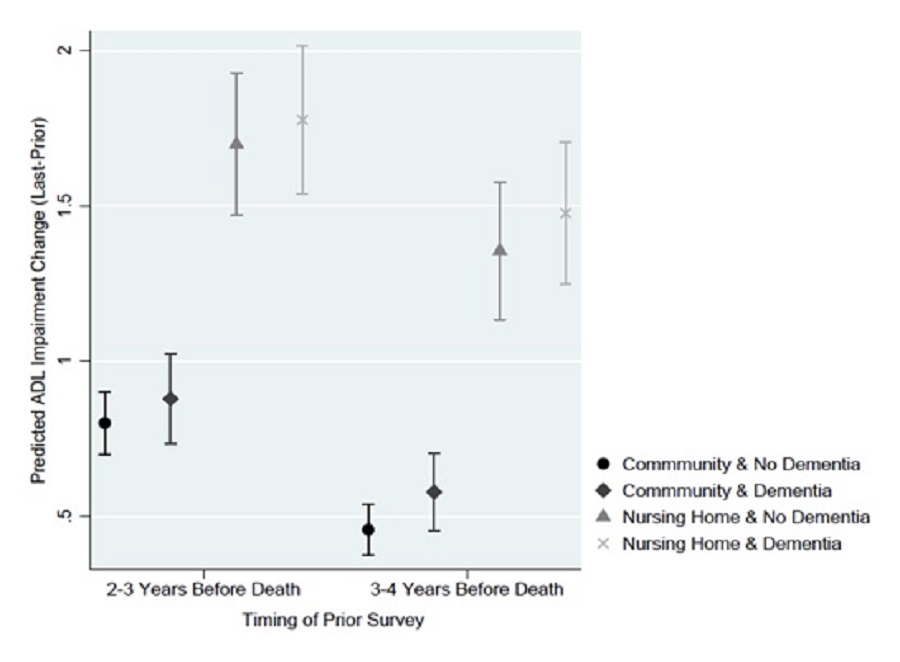
Nursing facility residence at the time of the prior survey was associated with a much larger predicted change in ADL impairments after adjusting for baseline ADLs and other characteristics. However, assuming decedents lived in a nursing facility at the time of the prior survey, there was no significant difference in the rate of decline if the respondent did or did not have dementia. Exhibit 11 presents the predicted ADL change from the prior to the last survey by dementia status and residential setting at the prior survey. When the starting point (anchored by the prior survey) was 2-3 years before death, the average predicted increase in ADL impairments for respondents with and without dementia if they lived in a nursing facility was, respectively, 1.776 (95% CI of 1.537-2.015) and 1.698 (95% CI of 1.469-1.927). Using that same starting point, however, the predicted increase in ADLs if respondents were living in the community was significantly lower for both those with dementia [0.878 (0.734-1.023)] and without dementia [0.800 (0.700-0.901)]. This trend in predicted ADL change remained consistent when the starting point and prior survey was conducted farther away from death; nursing facility residence was associated with a larger predicted increase in ADLs, but, conditional on nursing facility residence, dementia status was not associated with predicted change in ADLs.
| EXHIBIT 11. Predicted Change in ADL Impairments by Dementia Status and Nursing Facility Residence |
|---|
 |
4.4.3. Caregiving and Dementia Status
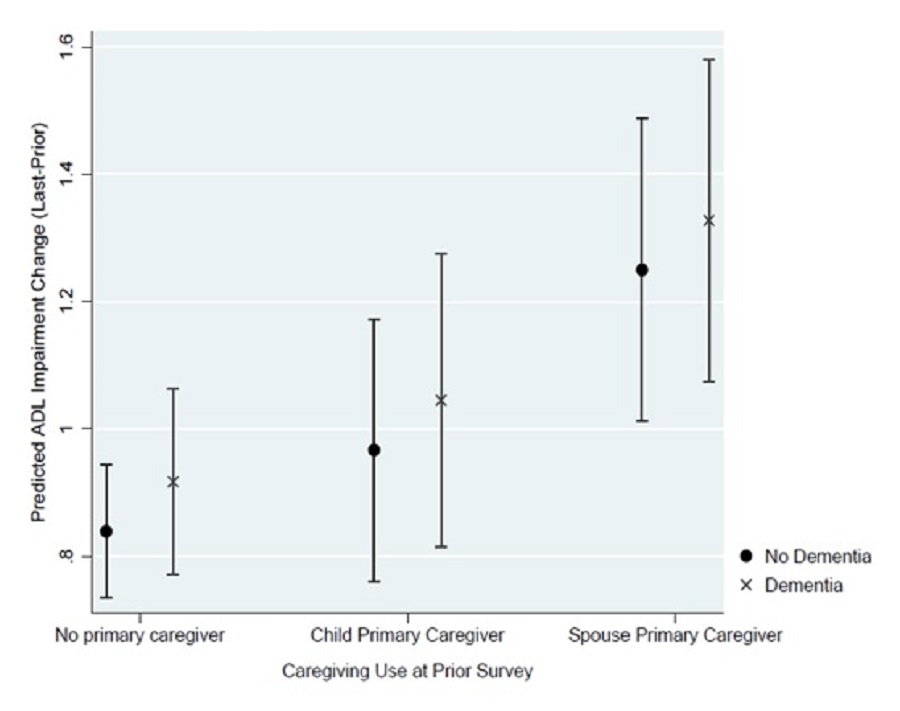
Holding the baseline ADL score at the time of the prior survey and the number of caregivers constant, access to a primary caregiver and the identity of that caregiver were associated with the predicted ADL impairments change. In particular, having one's spouse as the primary caregiver was associated with a larger ADL change; however, within each caregiving group, dementia was not associated with a significant difference in the predicted ADL change. Exhibit 12 presents the predicted ADL impairments change from the prior to the last survey by dementia status and primary caregiver at the prior survey. When the starting point (anchored by the prior survey) was 2-3 years before death, the average predicted ADL impairments increase assuming spousal primary caregiving, was, respectively, 1.327 (95% CI of 1.075-1.580) and 1.249 (95% CI of 1.012-1.487) for those with and without dementia. If respondents received primary caregiving from a child, the predicted ADL impairments increase was 1.045 (95% CI of 0.814-1.276) and 0.967 (95% CI of 0.761-1.172) for respondents with and without dementia.
| EXHIBIT 12. Predicted Change in ADL Impairments by Dementia Status and Caregiver Access |
|---|
 |
4.4.4. Comorbidities and Dementia Status
Although some comorbidities had a differential effect on the change in ADL impairments, there was not a significant confounding effect of dementia status. Exhibits 13a-13d includes the predicted ADL change from the prior to the last survey by dementia status and each comorbidity at the prior survey.
Stroke
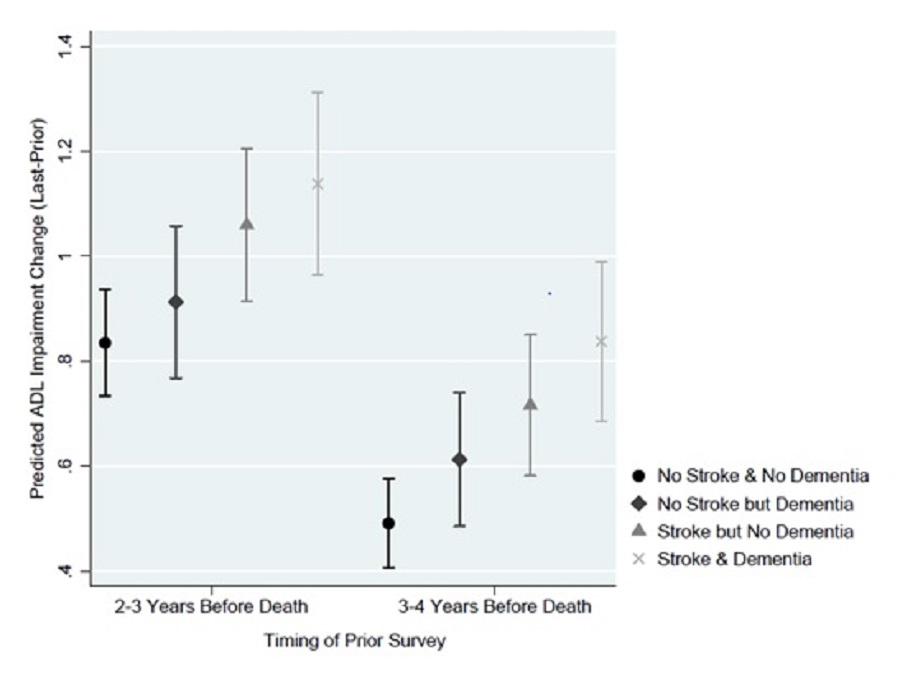
Prior stroke, regardless of dementia status, did not significantly alter the predicted change in ADL impairments, regardless of the time of prior survey (i.e., 2-3 vs. 3-4 years before death). If the starting point was 2-3 year before death and a prior stroke was assumed, the average predicted increase in ADL impairments was 1.137 (95% CI of 0.963-1.311) and 1.059 (95% CI of 0.914-1.205), respectively, with and without dementia. If we assumed no prior stroke there were similar changes in ADL score, with and without dementia, of 0.912 (95% CI of 0.768-1.057) and 0.834 (95% CI of 0.732-0.936), respectively. (Exhibit 13a)
| EXHIBIT 13a. Predicted Change in ADL Impairments by Dementia Status and Stroke |
|---|
 |
Cancer
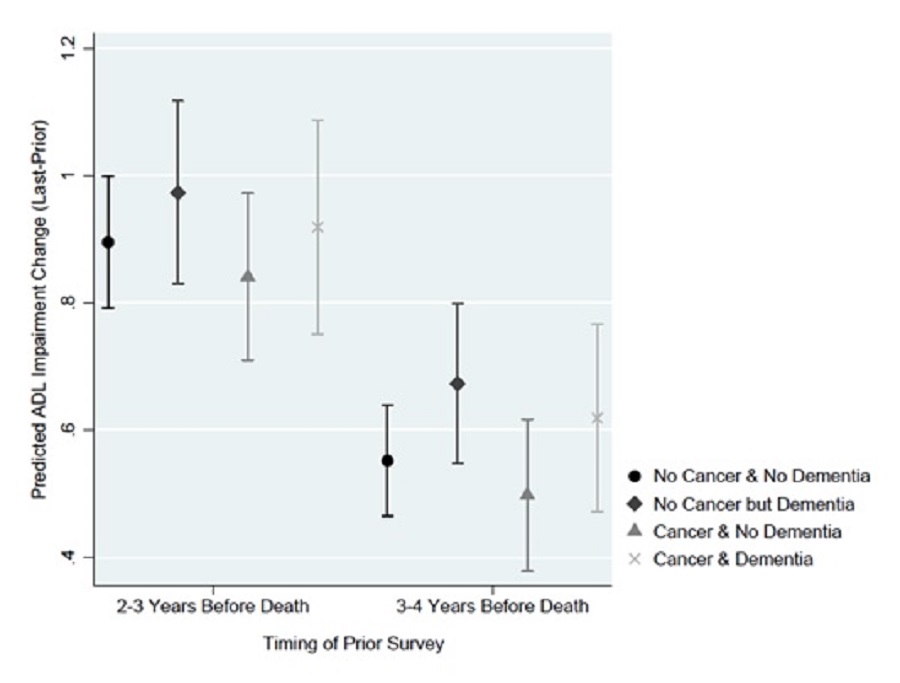
Cancer, regardless of dementia status, did not significantly alter the predicted change in ADL impairments, regardless of the time of prior survey (i.e., 2-3 vs. 3-4 years before death). At 2-3 years before death, if we assumed a decedent had a cancer diagnosis, the average predicted increase in ADL impairments was 0.918 (95% CI of 0.750-1.087) and 0.840 (95% CI of 0.709-0.972), respectively, with and without dementia. If we assumed no cancer diagnosis, there were similar increases in ADL impairments, with and without dementia, of 0.972 (95% CI of 0.829-1.116) and 0.895 (95% CI of 0.791-0.998), respectively. (Exhibit 13b)
| EXHIBIT 13b. Predicted Change in ADL Impairments by Dementia Status and Cancer Diagnosis |
|---|
 |
Heart Disease
Heart disease, regardless of dementia status, did not significantly alter the predicted change in ADL impairments, regardless of the time of prior survey (i.e., 2-3 vs. 3-4 years before death). When the starting point (anchored by the prior survey) was 2-3 years before death, the average predicted increase in ADL impairments if a decedent had heart disease was 0.952 (95% CI of 0.800-1.104) and 0.874 (95% CI of 0.761-0.987), respectively, with and without dementia. Predictions assuming no heart disease showed similar increases in ADL impairments, with and without dementia, of 0.968 (95% CI of 0.819-1.116) and 0.890 (95% CI of 0.780-1.000), respectively. (Exhibit 13c)
| EXHIBIT 13c. Predicted Change in ADL Impairments by Dementia Status and Heart Disease |
|---|
 |
Obesity
Obesity, regardless of dementia status, did not significantly alter the predicted change in ADL impairments, regardless of the time of prior survey. When the starting point (anchored by the prior survey) was 2-3 years before death, the average predicted increase in ADL impairments if respondents were obese was 0.936 (95% CI of 0.756-1.116) and 0.858 (95% CI of 0.712-1.005), respectively, with and without dementia. If we assumed decedents were not obese, estimates with and without dementia were similar with changes at 0.965 (95% CI of 0.822-1.109) and 0.887 (95% CI of 0.785-0.990), respectively. (Exhibit 13d)
| EXHIBIT 13d. Predicted Change in ADL Impairments by Dementia Status and Obesity |
|---|
 |
5. CONCLUSION
Results from the two sets of analyses--the point-in-time ADL analyses (Section 4.1 and Section 4.2) and the longitudinal change score analyses (Section 4.3 and Section 4.4)--suggest different conclusions that should be interpreted in tandem. Thus, we will discuss our conclusions from these findings separately and then in combination. We will then discuss the implications for our understanding of functional status in the last 6 months of life, where EOL is often targeted, as well as final conclusions.
5.1. Point-in-Time Predicted ADL Score in the Last 4 Years of Life
The results of the predicted ADL scores in the last 4 years of life suggest that, after demographic, socioeconomic, and clinical characteristics are adjusted for, dementia was associated with a slower and less-steep decline in functional status in the last 4 years of life compared to no dementia. Dementia was associated with a higher predicted ADL score (or more ADL impairments) several years before death and then a very gradual increase in ADL needs. However, there was no significant difference in the predicted ADL score in much of the last year of life regardless of dementia status (see Section 5.4 for more discussion of this finding).
Given that dementia is often associated with functional dependencies, these results reflect that ADL dependencies appear several years before death for people with dementia (in contrast to people without dementia, who have fewer ADL impairments 1-4 years before death). This finding is consistent with other research that suggests an earlier decline in functional status due to dementia (Murtagh et al., 2011); our research extends these findings to cover the entire 4 years before death.
Results also suggested that dementia status consistently modified the decline in functional status experienced in the last 4 years, even if participants received various long-term services and supports (LTSS) and reported comorbidities. However, the exact pattern varied depending on the characteristic, as discussed below.
Results suggest that LTSS were also associated with differences in the trajectories at EOL. For the population at the EOL, LTSS can come via a constellation of different facilities and people. Dementia was associated with differences in functional trajectories for people receiving assistance from most long-term care sources. Living in a nursing home at the time of the survey was associated with a much higher predicted ADL score overall than living in the community (likely because nursing facility residence is often a response to ADL dependency when individuals can no longer remain in their homes); but dementia was associated with a smaller and more gradual increase in ADL dependency for both nursing facility and community residence compared to no dementia. Similarly, receipt of caregiving and the source of caregiving were associated with differences in predicted ADL impairments in the last 4 years of life. Participants whose primary caregivers were their spouses had the highest predicted ADL impairments at all times in the last 4 years of life, regardless of dementia diagnosis, followed by those whose primary caregivers were their children. For all of these caregiving situations, dementia was associated with a less-steep decline in the last 4 years of life. Also, for all caregiving situations, there was no significant difference in the number of predicted ADL impairments between people with and without dementia in the very last year of life.
The combination of dementia and some comorbidities also resulted in differences in the trajectories of decline. There was no significant difference in the predicted ADL score between those with and without cancer; this may be because some respondents were reporting a cancer diagnosis that they have survived, rather than a recent diagnosis, and thus cancer may have limited effects on their functional status in the current period. Similarly, there was no significant difference in the predicted ADL impairments for those reporting heart disease once dementia status was controlled for.
However, prior stroke was associated with a higher average predicted ADL impairments overall, and dementia affected the predicted functional decline. For both prior stroke and no prior stroke, dementia was associated with a less-precipitous predicted ADL decline over the last 4 years of life. This finding was particularly stark for stroke: stroke with dementia was associated with a much more gradual predicted functional decline than stroke with no dementia.
Obesity was associated with a significant difference in predicted ADL impairment score for both people with and without dementia for months earlier than 1 year before death. Obesity may be associated with limitations in movement, which could both cause a functional limitation and be a result of functional limitations. However, dementia appeared to make a significant difference in the functional limitations experience by obese respondents, particularly in the period 2-4 years before death.
5.2. Longitudinal Change Score in the Last Two Surveys
The analysis of the change in ADL score suggests no significant difference in ADL impairment change between people with and without dementia from the prior to the last survey in the last 4 years of life, after ADL impairments at the time of prior survey were controlled for. These findings were consistent regardless of whether the prior survey (i.e., the starting point for the "change") occurred 2-3 years before death or 3-4 years before death (regardless of the starting point, both estimates measure change that occurred over roughly 2 years). The point estimates generated in these analyses also suggested that dementia was associated with a larger change score in ADL impairments between the two surveys, though the difference in the point estimate was not statistically significant. Additionally, these estimates suggest no significant difference in the change score associated with comorbidities at the time of prior diagnosis. These estimates adjust for the ADL score at the time of the prior survey, however, and thus should be interpreted as the predicted ADL impairment change for similarly disabled individuals with or without dementia.
The non-significant effect of dementia was consistent for predictions that examined nursing facility residence, reported prior caregiving, or both at the prior survey. When we adjusted for the baseline ADL impairment score, nursing facility residence at the time of the prior survey was associated with a larger predicted functional decline relative to community residence. However, there was no significant difference in the predicted increase in ADL impairments for nursing facility residents who did or did not have dementia. Similarly, having a primary caregiver who was one's child or spouse was associated with having a larger predicted increase in ADL impairments relative to reporting no primary caregiver; however, within those groups, there was no significant difference in predicted ADL impairment change if the respondent had dementia or not.
5.3. Harmonizing the Two Sets of Findings
The seeming contrast in the take-away from the two sets of analyses is likely due to a few factors. However, the two sets of results should actually be viewed as two slightly different sets of findings with different conclusions, as discussed below.
The first reason for the difference in findings is the difference in the two samples, and particularly the non-response bias required to assess the change score from two surveys. Theoretically, those who are able to respond to two surveys may have systematically lower acuity dementia, higher social support, or both compared to those available for only one survey. The proportion of dementia in the additional surveys available in cross-sectional analysis, where only one survey was required for inclusion, was nearly double that of the sample in the longitudinal analysis (62.6% and 32.9%, respectively), and the average mean number of caregivers (as measured in the last survey) was significantly higher for the population in only the cross-sectional analysis than for respondents in both the longitudinal and cross-sectional analyses (though there was no significant difference between the two groups in the proportion whose primary caregiver was their spouse or their child). Thus, it may be that analysis of change score in dementia looked at a systematically lower acuity group of respondents with dementia relative to the cross-sectional analysis. This difference has implications for interpretation of the results. The cross-sectional results may be more appropriately generalized to the functional status of the more general dementia population, with a higher variability in severity; the longitudinal results may be more appropriately generalized to the population that was well enough and/or had enough compensating social support to respond to survey requests repeatedly.
Second, the longitudinal change score analysis controlled for baseline ADL impairment score (the ADL score at the prior survey that preceded the change), whereas the cross-sectional analysis did not include information about prior ADL impairment score. Because respondents with no prior ADL dependencies were at greater risk for developing new dependencies, whereas respondents with multiple ADL dependencies were actually "at risk" for losing those dependencies (regaining function), the change score analysis provides insight into the effects of dementia, controlling for ADL status. This difference in modeling has implications for the conclusions from each analysis. The cross-sectional ADL score should be interpreted as predicted functional decline for people with and without dementia on average, controlling for clinical and demographic characteristics. The longitudinal predicted change in ADL should be interpreted as the predicted functional decline for people with and without dementia but with similar ADL dependency 2-4 years before death. Of course, on average, at 2-4 years before death, most people without dementia will not have disability levels similar to those with dementia. A limitation of this study is that analyses were limited to the last 4 years of life.
5.4. Functional Status in the Last Months of Life
The results of the point-in-time analysis suggests that, after controlling for comorbidities and other characteristics, the adjusted functional status in the last 6 months of life is similar for people with and without dementia. Both groups of decedents had an average prediction of roughly two ADL impairments with which they report difficulty in the last 6 months of life. Analyses of other characteristics, such as comorbidities like stroke and obesity, suggest that these characteristics may change the predicted ADL impairments the last 6 months of life (e.g., such that people who have had a stroke have a significantly higher predicted ADL impairment score in the last 6 months of life compared to those who have not had a stroke). But after adjusting for those characteristics, there was no significant functional difference in people with and without dementia in the last 6 months of life.
However, because the point-in-time analysis suggests that people with dementia have limited functional decline overall in the last 4 years of life, people with dementia may appear to be at EOL for several years before death if functional status alone is used as a marker. In fact, people with dementia look functionally similar for a much longer period to the functional status of people without dementia in just the last 6 months of life. People with dementia have the same predicted average ADL impairment score (1.92) at 17 months before death as individuals with dementia at 6 months before death. Thus, for people with dementia, functional status may not be a strong marker of the EOL stage compared to people without dementia.
5.5. Final Conclusion
The implication of these findings for prognostication for dementia patients is that functional status and changes in functional status may not be, on average, a clear flag for the terminal phase of dementia; this situation is in contrast to other terminal illnesses, where change in functional status may be a hallmark of the EOL. These results are consistent with clinical experience that suggests that functional status during the last 6-12 months of life is less distinct for dementia patients than for patients without dementia. Other research in more narrow populations such as those in long-term care facilities, such as that of Chen et al. (2007), found that people with advanced dementia were more functionally disabled than those dying from cancer or organ failure throughout the last year of life, with less possible decline as death approached. Our findings are consistent with Chen's results but in a broader dementia population and with a longer window of observation at EOL. Indeed, our results found that people with dementia look similar at 1.5 years before death to those without dementia at 6 months before death.
In addition, the finding that, when prior functional status is controlled for, people with dementia have no significantly different functional decline compared to similarly disabled people without dementia suggests that there may be a limited effect of dementia status on subsequent decline. However, these results should be interpreted for the population with less severe illness and yet with similarly high ADL impairment scores at 2-4 years before death, not the entirety of the population with and without dementia.
In combination, these findings can inform clinicians' understanding of the indicators for prognostication at the very EOL for dementia patients. Clinicians treating patients with a mix of diagnoses, or treating patients with comorbidities like cancer and dementia, may be tempted to use functional status as a marker for the last months of life across clinical groups. The findings, in combination with other research, suggest clinicians should not look at functional status or a large change in functional status to determine if their dementia patient has entered the final phase of their illness. If they are looking for changes in ADL impairment status, they may miss the terminal phase of illness for dementia patients and thus miss the appropriate timing to offer palliative services.
The findings also have implications for models that seek to support patients at EOL and their families. Existing models to provide EOL care require clinicians to make prognosis estimates. Most significantly, the Medicare hospice benefit, which provides comprehensive symptom relief and supportive care to terminally ill patients and their families, requires a physician to certify that a patient is within 6 months of death (Medicare.gov, 2019). Patients must agree to forego curative treatment for their disease to receive hospice care. Patients with neurological illnesses, such as dementia, have the longest length-of-stay of hospice patients (MedPAC, 2019). Our finding suggest that this may be partially attributed to the challenges of prognostication for dementia patients and the ability to identify how close to death they may be. Our findings validate that dementia patients may experience similar levels of functional impairment for much longer compared to patients without dementia. This lack of a clear functional change may inhibit accurate prognosis and contribute to the long lengths-of-stay for hospice patients with dementia.
Additionally, these findings suggest that EOL models that serve people with dementia should consider how this long period of functional impairment affects their caregivers. The multi-year period of functional impairment, largely equivalent to the last months of life for many other patients, highlights that caregivers for people with dementia may also be required to provide a longer period of intensive and sustained support. Existing literature suggests that EOL care for patients with dementia leaves their caregivers more burdened in the last months of life compared to caregivers for patients without dementia (Boogard et al., 2019). This analysis provides evidence that sustained functional impairment for people with dementia may be an explanation for that increased burden. Models that serve people with dementia should acknowledge that their caregivers may arrive at the last months of life having effectively served an EOL patient for years. As a result, traditional models that offer palliative and supportive care at EOL but focus only on the last few months of life may require modifications to support people with dementia and their families.
REFERENCES
Aldridge, M., & Bradley, E. (2017). Epidemiology and patterns of care at the end of life: Rising complexity, shifts in care patterns and sites of death. Health Affairs, 36(7), 1175-1183. dx.doi.org/10.1377/hlthaff.2017.0182. http://content.healthaffairs.org/content/36/7/1175.
Boogaard, J.A., van der Steen, J.T., de Boer, A.H., and van Groenou, M.I.B. (2019). How is end-of-life care with and without dementia associated with informal caregivers' outcomes? American Journal of Hospice & Palliative Medicine. dx.doi.org/10.1177/1049909119836932.
Burton, P., Gurrin, L., & Sly, P. (1998). Extending the simple linear regression model to account for correlated responses: An introduction to generalized estimating equations and multi-level mixed modelling. Statistics in Medicine, 17, 1261-1291. doi.org/10.1002/(SICI)1097-0258(19980615)17:11%3C1261::AID-SIM846%3E3.0.CO;2-Z.
Center for the Study of Aging, RAND Corporation. (2019). FAQ: RAND HRS Longitudinal File. https://www.rand.org/well-being/social-and-behavioral-policy/centers/aging/dataprod/faq.html.
Chen, J., Chan, D., Kiely, D., Morris, J., & Mitchell, S. (2007). Terminal trajectories of functional decline in the long-term care setting. Journal of Gerontology, 62A, 531-536. doi.org/10.1093/gerona/62.5.531.
Crimmins, E.M., Kim, J.K., Langa, K.M., & Weir, D.R. (2011). Assessment of cognition using surveys and neuropsychological assessment: The Health and Retirement Study and the Aging, Demographics, and Memory Study. Journals of Gerontology Series B: Psychological Sciences & Social Sciences, 66B(Suppl. 1), i162-i171. doi.org/10.1093/geronb/gbr048.
Feng, Z., Coots, L., Kaganova, Y., & Wiener , J. (2014). Hospital and ED use among Medicare beneficiaries with dementia varies by setting and proximity to death. Health Affairs, 33, 683-690. doi:10.1377/hlthaff.2013.1179.
Institute for Social Research, University of Michigan. (2018). The Health and Retirement Study. https://hrs.isr.umich.edu/about?_ga=2.230841242.481701387.1552875532-11….
Katz, S., Downs, T., Cash, H., & Grotz, R. (1970). Progress in development of the Index of ADL. Gerontologist, 10, 20-30. doi.org/10.1093/geront/10.1_Part_1.20.
Katz, S., Ford, A., Moskowitz, R., Jackson, B., & Jaffe, M. (1963). Studies of illness in the aged: The index of ADL: A standardized measure of biological and psychosocial function. JAMA, 185, 914-919. doi.org/10.1001/jama.1963.03060120024016.
Langa, K.M., Kabeto, M., & Weir. D. (2009). Report on race and cognitive impairment using HRS. In 2010 Alzheimer's Disease Facts and Figures. https://www.alzheimersanddementia.com/article/S1552-5260(10)00014-2/fulltext#sec7.
Langa, K.M., Larson, E.B., Crimmins, E.M., Faul, J.D., Levine, D.A., Kabeto, M.U., & Weir, D.R. (2017). A comparison of the prevalence of dementia in the United States in 2000 and 2012. JAMA Intern Med, 177(1), 51-58. dx.doi.org/10.1001/jamainternmed.2016.6807.
Medicare.gov. (n.d.). How Hospice Works. https://www.medicare.gov/what-medicare-covers/what-part-a-covers/how-hospice-works.
Medicare Payment Advisory Commission (MedPAC). (2019). Report to the Congress: Medicare Payment Policy. Washington, DC: MedPAC. http://medpac.gov/docs/default-source/reports/mar19_medpac_entirereport_sec.pdf?sfvrsn=0.
Murphy, S.L., Xu, J., Kochanek, K.D., & Arias, E. (2018). Mortality in the United States, 2017. (NCHS Data Brief No. 328). Atlanta, GA: Centers for Disease Control and Prevention. https://www.cdc.gov/nchs/products/databriefs/db328.htm.
Murtaugh, F., Addington-Hall, J., & Higginson, I. (2011). End-stage renal disease: A new trajectory of functional decline in the last year of life. Journal of the American Geriatrics Society, 59, 304-308. doi.org/10.1111/j.1532-5415.2010.03248.x.
National Center for Health Statistics. (2013). National Death Index user's guide. Hyattsville, MD: National Center for Health Statistics. https://www.cdc.gov/nchs/data/ndi/NDI_Users_Guide.pdf.
National Center for Health Statistics. (2017).National Death Index. https://www.cdc.gov/nchs/ndi/index.htm.
Sachs, G., Shega, J., & Cox-Hayley, D. (2004). Barriers to excellent end-of-life care for patients with dementia. Journal of General Internal Medicine, 19, 1057-1063. doi:10.1111/j.1525-1497.2004.30329.x.
Walsh, J., Welch, H., & Larson, E. (1990). Survival of outpatients with Alzheimer-type dementia. Annals of Internal Medicine, 113(6), 429-434. https://www.ncbi.nlm.nih.gov/pubmed/2386336.
Williams, R. (2012). Using the margins command to estimate and interpret adjusted predictions and marginal effects. Stata Journal, 12, 308-331. doi.org/10.1177%2F1536867X1201200209.
Wooldridge, J.M. (2002). Econometric Analysis of Cross Section and Panel Data. Cambridge, MA: MIT Press.
APPENDIX A. REGRESSION MODEL FOR CROSS-SECTIONAL ANALYSIS
| TABLE A-1. Negative Binomial: ADL Score (0-6) | ||||||
|---|---|---|---|---|---|---|
| Coefficient | SE | T | P | CI | ||
| Lower | Upper | |||||
| LTSS (Referent: No Nursing Facility + No Caregiver) | ||||||
| Primary caregiver: Child | 0.157 | 0.031 | 5.047 | 4.49E-07 | 0.096 | 0.217 |
| Primary caregiver: Spouse | 0.526 | 0.037 | 14.235 | 0.000 | 0.454 | 0.599 |
| Primary caregiver is paid | 0.504 | 0.046 | 10.925 | 0.000 | 0.413 | 0.594 |
| Number of caregivers | 0.211 | 0.012 | 18.057 | 0.000 | 0.188 | 0.234 |
| Nursing facility | 0.968 | 0.025 | 38.014 | 0.000 | 0.918 | 1.017 |
| Demographics (Referent: Age 85+, Female, White, Non-Hispanic) | ||||||
| Age: 65 to 69 | -0.440 | 0.081 | -5.431 | 5.61E-08 | -0.599 | -0.281 |
| Age: 70 to 74 | -0.271 | 0.046 | -5.902 | 3.59E-09 | -0.361 | -0.181 |
| Age: 75 to 79 | -0.196 | 0.034 | -5.815 | 6.05E-09 | -0.262 | -0.130 |
| Age: 80 to 84 | -0.144 | 0.030 | -4.870 | 1.12E-06 | -0.202 | -0.086 |
| Male | -0.207 | 0.027 | -7.664 | 1.80E-14 | -0.260 | -0.154 |
| African American | 0.119 | 0.038 | 3.147 | 0.002 | 0.045 | 0.194 |
| Race other than White or African American | -0.059 | 0.085 | -0.695 | 0.487 | -0.226 | 0.108 |
| Hispanic ethnicity | 0.207 | 0.053 | 3.914 | 9.09E-05 | 0.103 | 0.310 |
| Comorbidities | ||||||
| Cancer | -0.001 | 0.028 | -0.048 | 0.961 | -0.057 | 0.054 |
| Diabetes | 0.092 | 0.027 | 3.383 | 0.001 | 0.039 | 0.146 |
| Heart disease | 0.071 | 0.024 | 3.004 | 0.003 | 0.025 | 0.118 |
| Obesity (BMI > 30) | 0.180 | 0.032 | 5.588 | 0.000 | 0.117 | 0.243 |
| Stroke | 0.377 | 0.025 | 14.989 | 0.000 | 0.327 | 0.426 |
| Socioeconomic (Referent: High School and Some College, Income $20,000-100,000) | ||||||
| Education level: College or above | 0.047 | 0.041 | 1.126 | 0.260 | -0.034 | 0.128 |
| Education level: Less than high school | 0.046 | 0.028 | 1.675 | 0.094 | -0.008 | 0.101 |
| Income > $100,000 | -0.113 | 0.068 | -1.663 | 0.096 | -0.247 | 0.020 |
| Income $20,000 | 0.071 | 0.026 | 2.689 | 0.007 | 0.019 | 0.123 |
| Dementia and Time Variables | ||||||
| Dementia status | -0.003 | 0.036 | -0.083 | 0.934 | -0.073 | 0.067 |
| Months to death | -0.012 | 0.001 | -12.277 | 0.000 | -0.014 | -0.010 |
| Dementia status * Months to death | 0.008 | 0.001 | 6.058 | 0.000 | 0.006 | 0.011 |
| Survey wave | 0.019 | 0.007 | 2.826 | 0.005 | 0.006 | 0.031 |
| Constant | -0.039 | 0.070 | -0.555 | 0.579 | -0.176 | 0.098 |
| NOTE: Higher ADLs scores indicate greater impairment. | ||||||
APPENDIX B. REGRESSION COEFFICIENTS FOR LONGITUDINAL ANALYSIS OF CHANGE SCORE
| TABLE B-1. Linear Regression: Change in ADL Score from Prior to Last Survey | ||||||
|---|---|---|---|---|---|---|
| Characteristic: Prior Survey | Coefficient | SE | T | P | CI | |
| Lower | Upper | |||||
| Starting ADL Score (Referent: Starting ADL Score = 0) | ||||||
| Starting ADL score = 1 | -0.342 | 0.066 | -5.197 | 2.12E-07 | -0.471 | -0.213 |
| Starting ADL score = 2 | -0.591 | 0.097 | -6.102 | 1.14E-09 | -0.781 | -0.401 |
| Starting ADL score = 3 | -0.879 | 0.122 | -7.213 | 6.44E-13 | -1.117 | -0.640 |
| Starting ADL score = 4 | -1.736 | 0.136 | -12.799 | 7.76E-37 | -2.001 | -1.470 |
| Starting ADL score = 5 | -1.930 | 0.127 | -15.241 | 3.98E-51 | -2.178 | -1.682 |
| Starting ADL score = 6 | -2.445 | 0.115 | -21.283 | 1.16E-95 | -2.670 | -2.220 |
| Demographics (Referent: Age 85+, Female, White, Non-Hispanic) | ||||||
| Age: 65 to 69 | -0.568 | 0.116 | -4.881 | 1.10E-06 | -0.796 | -0.340 |
| Age: 70 to 74 | -0.455 | 0.080 | -5.674 | 1.49E-08 | -0.612 | -0.298 |
| Age: 75 to 79 | -0.314 | 0.070 | -4.491 | 7.29E-06 | -0.451 | -0.177 |
| Age: 80 to 84 | -0.201 | 0.068 | -2.969 | 0.003 | -0.334 | -0.068 |
| Male | -0.078 | 0.053 | -1.472 | 0.141 | -0.183 | 0.026 |
| African American | 0.009 | 0.081 | 0.114 | 0.909 | -0.150 | 0.169 |
| Race other than White or African American | -0.119 | 0.159 | -0.750 | 0.453 | -0.431 | 0.193 |
| Hispanic ethnicity | 0.020 | 0.106 | 0.186 | 0.852 | -0.187 | 0.227 |
| Socioeconomic (Referent: High School and Some College, Income $20,000-100,000) | ||||||
| Education level: College or above | 0.046 | 0.075 | 0.618 | 0.537 | -0.100 | 0.192 |
| Education level: Less than high school | 0.095 | 0.058 | 1.632 | 0.103 | -0.019 | 0.208 |
| Income $20,000 | 0.074 | 0.057 | 1.305 | 0.192 | -0.037 | 0.185 |
| Income > $100,000 | -0.074 | 0.125 | -0.596 | 0.551 | -0.319 | 0.170 |
| Comorbidities | ||||||
| Cancer diagnosis | -0.054 | 0.057 | -0.947 | 0.344 | -0.166 | 0.058 |
| Diabetes diagnosis | 0.015 | 0.057 | 0.257 | 0.797 | -0.097 | 0.127 |
| Heart disease | -0.016 | 0.050 | -0.312 | 0.755 | -0.114 | 0.082 |
| Obesity (BMI > 30) | -0.029 | 0.066 | -0.444 | 0.657 | -0.159 | 0.100 |
| Stroke | 0.225 | 0.065 | 3.442 | 0.001 | 0.097 | 0.353 |
| LTSS (Referent: No Nursing Facility + No Caregiver) | ||||||
| Primary caregiver: Child | 0.128 | 0.106 | 1.203 | 0.229 | -0.081 | 0.337 |
| Primary caregiver: Spouse | 0.411 | 0.119 | 3.464 | 0.001 | 0.178 | 0.643 |
| Primary caregiver is paid | 0.215 | 0.156 | 1.376 | 0.169 | -0.091 | 0.520 |
| Number of caregivers | 0.130 | 0.040 | 3.206 | 0.001 | 0.050 | 0.209 |
| Nursing facility residence | 0.897 | 0.112 | 8.026 | 0.000 | 0.678 | 1.117 |
| Dementia and Time Variables | ||||||
| Time elapsed from prior to last survey | 0.002 | 0.000 | 9.935 | 0.000 | 0.002 | 0.003 |
| Dementia | -0.138 | 0.257 | -0.538 | 0.591 | -0.642 | 0.366 |
| Year of Prior Survey (Referent: Prior Survey in Year 2-3 Before Death) | ||||||
| Prior survey in Year 3-4 before death | -0.661 | 0.192 | -3.436 | 0.001 | -1.038 | -0.284 |
| Prior survey in Year 4-5 before death | -1.005 | 0.192 | -5.231 | 0.000 | -1.381 | -0.628 |
| Prior survey in Year 5-6 before death | -1.207 | 0.206 | -5.848 | 0.000 | -1.612 | -0.802 |
| Interaction: Dementia * Prior survey in Year 3-4 before death | 0.216 | 0.268 | 0.808 | 0.419 | -0.308 | 0.741 |
| Interaction: Dementia * Prior survey in Year 4-5 before death | 0.259 | 0.265 | 0.980 | 0.327 | -0.259 | 0.778 |
| Interaction: Dementia * Prior survey in Year 5-6 before death | 0.082 | 0.312 | 0.262 | 0.793 | -0.530 | 0.693 |
| Wave number of prior survey | 0.033 | 0.016 | 2.079 | 0.038 | 0.002 | 0.065 |
| Constant | 0.009 | 0.282 | 0.030 | 0.976 | -0.545 | 0.562 |
| NOTE: Higher ADLs scores indicate greater impairment. | ||||||
NOTES
-
The measured ADLs were bathing, dressing, eating, bed transfer, toileting, and incontinence.
-
The measured activities of daily living (ADLs) are bathing, dressing, eating, bed transfer, toileting, and incontinence. The IADLs are telephone use, shopping, food preparation, housekeeping, laundry, transportation, responsibility for one's own medication, and ability to handle finances.
Functional Trajectories at the End of Life for Individuals with Dementias
This brief was prepared by RTI International under contract #HHSP23320160001I with the U.S. Department of Health and Human Services, Office of the Assistant Secretary for Planning and Evaluation, Office of Disability, Aging and Long-Term Care Policy. For additional information about this subject, visit the DALTCP home page at https://aspe.hhs.gov/office-disability-aging-and-long-term-care-policy-daltcp or contact ASPE Project Officers at HHS/ASPE/DALTCP, Room 424E, H.H. Humphrey Building, 200 Independence Avenue, S.W., Washington, D.C. 20201, Helen.Lamont@hhs.gov.
Reports Available
Functional Trajectories at the End of Life for Individuals with Dementia Issue Brief
- HTML version: https://aspe.hhs.gov/basic-report/functional-trajectories-end-life-individuals-dementia-issue-brief
- PDF version: https://aspe.hhs.gov/pdf-report/functional-trajectories-end-life-individuals-dementia-issue-brief
Functional Trajectories at the End of Life for Individuals with Dementia: Final Report