


KEY POINTS
- CDC reported a provisional 2025 age-adjusted death rate of 689.2 deaths per 100,000 population, the lowest ever reported death rate and 4.6% below the final 2024 rate of 722.1 deaths per 100,000 population.
- CDC notes that the published 2024 and 2025 rates use different Census population-estimate methodologies. Re-estimating both years using Vintage 2025 populations reduces the estimated decline from 4.6 percent to approximately 2 percent. A common-vintage calculation for all years covered by Vintage 2025 (2020 – 2025) confirms that 2025 still has the lowest age-adjusted death rate.
- Using this common-vintage comparison between 2024 and 2025, we find that declines in unintentional injury mortality made the largest contribution to the age-adjusted death rate decline (30%), followed by deaths from COVID-19 (28%), cancer (18%) and heart disease (11%).
- Approximately 73 percent of the decline in unintentional-injury mortality came from a decline in unintentional drug overdoses, and nearly all of the overdose decline was concentrated among deaths involving synthetic opioids other than methadone, including fentanyl.
INTRODUCTION
In July 2026, the National Center for Health Statistics (NCHS) reported that 3,094,593 deaths occurred among U.S. residents in 2025 and that the provisional age-adjusted death rate was 689.2 deaths per 100,000 population. This decline from 2024 to 2025 continued a broader post-pandemic decline in age-adjusted mortality from its peak in 2021. The 2025 rate was 4.6 percent below the final 2024 rate of 722.1 and was the lowest age-adjusted death rate recorded in the United States.1,2
Age-adjusted death rates are used to compare mortality trends over time. Age adjusting death rates matters because the U.S. population has been both growing, and aging through time. An age-adjusted death rate applies age-specific mortality rates to a fixed standard age distribution which allows mortality risk to be compared over time without falsely attributing changes in population mortality to overall population changes or changes in population age structure. When comparing trends over time, age-adjusted death rates answer a different question than what measuring the total number of deaths or the crude death rate would.
SEPARATING THE POPULATION METHODOLOGY CHANGE FROM THE AGE-ADJUSTED MORTALITY DECLINE
The NCHS report notes that the published 2024 and 2025 age-adjusted death rates are calculated using different Census population-estimation methodologies. The final 2024 age-adjusted death rate uses the “Vintage 2024” Census population estimate methodology based on a blended base population between the 2020 census, 2020 Demographic Analysis estimates, and population estimates from Vintage 2020. The provisional 2025 age-adjusted death rate instead uses the “Vintage 2025” Census population estimate methodology based on the enumerated 2020 Census population and the Census Bureau's Modified Age and Race Census (MARC) file. The Census Bureau’s Vintage 2025 release also provides revised estimates of the 2024 population by age using the Vintage 2025 methodology. Moreover, NCHS explicitly identifies this change in population methodology as a limitation of the year-to-year comparison.1,3
To separate the mortality change from the concurrent population-denominator methodology change, we recalculated both 2024 and 2025 age-adjusted death rates using the same Vintage 2025 methodology applied to each year’s age-specific population. Holding 2024 deaths fixed but replacing Vintage 2024 populations with Vintage 2025’s revised 2024 populations lowers the reconstructed 2024 age-adjusted rate from 722.1 to 703.9. Applying Vintage 2025 populations to the current August 2026 provisional 2025 death counts produces an age-adjusted rate of 689.8. We note that this 2025 age-adjusted death rate of 689.8 differs from the 689.2 presented in the NCHS report as their provisional death data are current as of May 10th and ours is current as of August 20th which has added a small number of additional deaths. On this common-vintage basis, the 2024-2025 mortality decline is 14.1 deaths per 100,000, (approximately 2%), rather than the approximately 32 deaths per 100,000 in the mixed-vintage comparison (approximately 4.5%). CDC reported the provisional 2025 age-adjusted death rate as the lowest rate on record. Our recalculation of all years covered by Census Vintage 2025 confirms that 2025 has the lowest age-adjusted death rate during 2020–2025; however, Vintage 2025 does not provide comparable population estimates for years before 2020.
Figure 1. Separating the components of the 2024-2025 decline in the age-adjusted death rate.
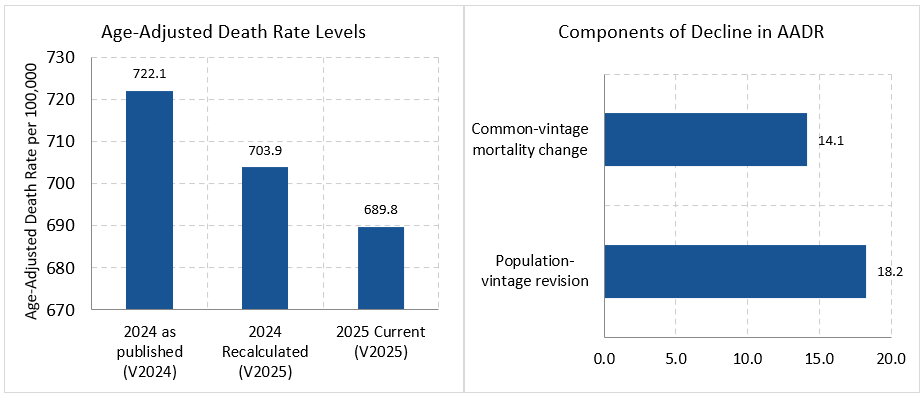
Notes: The 2024 “as-published” age-adjusted death rate uses final 2024 deaths and Vintage 2024 populations. The 2024 recalculated age-adjusted death rate uses the same deaths but with Vintage 2025 revised methodology for 2024 populations. The current 2025 age-adjusted death rate uses provisional deaths available as of August 20th, 2026, and Vintage 2025 populations. The official NCHS report used an earlier May 10, 2026 provisional death count and reported 689.2 rather than 689.8. Source: ASPE analysis of CDC WONDER mortality data and Census Vintage 2024 and Vintage 2025 population estimates.1,3,4
This does not imply that either official annual rate is incorrect. Each estimate is the correct, official rate calculated with the official population estimates available at the given time. However, it does show that the decline from the 2024 to the 2025 age-adjusted death rates combines two separate factors simultaneously: first, a change in estimated mortality and second, a change in the estimated population age structure used as the relevant denominator. We therefore use a common Vintage 2025 based denominator when performing analyses by cause and age in the remainder of this brief.
ANALYZING THE COMMON VINTAGE MORTALITY DECLINE BY CAUSE
As discussed above, between 2024 and 2025, the age-adjusted death rate fell by 14.1 deaths per 100,000 population using the common-vintage approach. Figure 2 shows the extent to which varying causes of death contributed to this decline. Positive values indicate that a particular cause reduced the overall age-adjusted death rate and negative values indicate that the cause offset part of the decline. The analysis assigns each death to a single underlying cause including an “other causes, residual” category. Age-specific cause rates are then standardized to the 2000 U.S. standard population, and the cause contributions sum to the aggregate all-cause change.
We find that unintentional injuries made the largest contribution to the aggregate decline between 2024 and 2025, reducing the age-adjusted death rate by 4.23 deaths per 100,000, approximately 30 percent of the overall net decline. This contribution was followed by COVID-19 at 4.01 (28%), cancer at 2.55 (18%), and heart disease at 1.57 (11%). Together, these four top causes accounted for about 87 percent of the net common-vintage decline. Homicide and Alzheimer’s disease also made significant contributions, while increases in influenza and pneumonia mortality offset 1.57 deaths per 100,000 of the overall improvement.
The results also show why changes in death counts cannot be used to infer contributions to the age-adjusted rate. In the current provisional data, cancer deaths increased by approximately 3,300 and heart disease deaths increased by approximately 12,400, yet both causes reduced the age-adjusted rate because their age-specific mortality rates declined. Conversely, it is logically possible for a cause to have fewer deaths without making a comparably large contribution after accounting for age structure.
Figure 2. Contributions to the common-vintage decline in the age-adjusted death rate, by underlying cause.
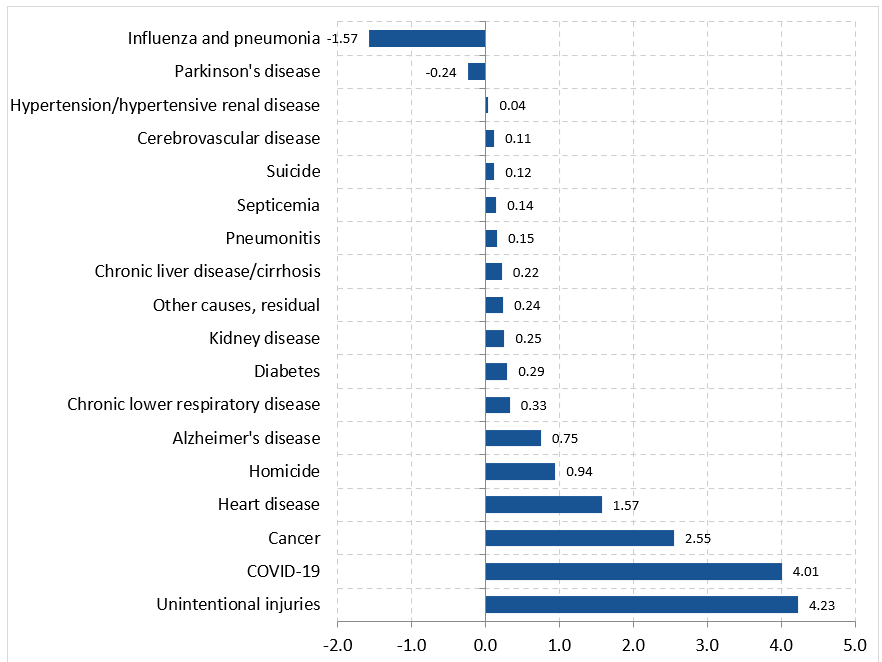
Notes: Positive values are contributions to the net decline between 2024 and 2025; negative values offset the decline. Rates use Census Vintage 2025 populations for both 2024 and 2025 and the 2000 U.S. standard population. The 2025 mortality file is provisional and reflects the August 20th 2026 CDC WONDER snapshot. Named causes are mutually exclusive; all remaining causes are included in the other-causes, residual category. Suppressed national age-cause cells were assigned a midpoint of 5 deaths; Source: ASPE analysis of CDC WONDER and Census data.3,4
MOST OF THE DECLINE IN UNINTENTIONAL-INJURY MORTALITY CAME FROM DRUG OVERDOSES
We next examine the largest contributor, the unintentional-injury category, in Figure 3. The age-adjusted death rate for all unintentional injuries declined from 53.02 to 48.80 deaths per 100,000 on a common-vintage basis. Unintentional drug overdose—defined by underlying-cause codes X40-X44 in CDC WONDER—accounted for 3.09 deaths per 100,000 of the 4.23-per-100,000 decline, constituting 73 percent of this category’s mortality reduction.
Furthermore, within the unintentional overdose subcategory, the decline was concentrated among deaths involving synthetic opioids other than methadone, identified by multiple-cause code T40.4. The age-adjusted rate for this category declined by 2.98 deaths per 100,000, which is approximately 96 percent of the net unintentional-overdose decline. The number of T40.4-involved unintentional-overdose deaths fell from 45,917 in 2024 to 36,406 in 2025, a decline of approximately 20.7 percent. Mortality involving another opioid but not T40.4 increased slightly, while non-opioid unintentional-overdose mortality declined modestly.
T40.4 includes fentanyl, fentanyl analogs, tramadol, and other synthetic opioids other than methadone. Overdose deaths of course may involve multiple substances, so we design mutually exclusive categories for Figure 3 by partitioning into: deaths with T40.4, deaths involving another opioid but not T40.4, and deaths with no opioid identified.
Figure 3. Categorizing the decline in mortality from unintentional-injury and unintentional-overdose.
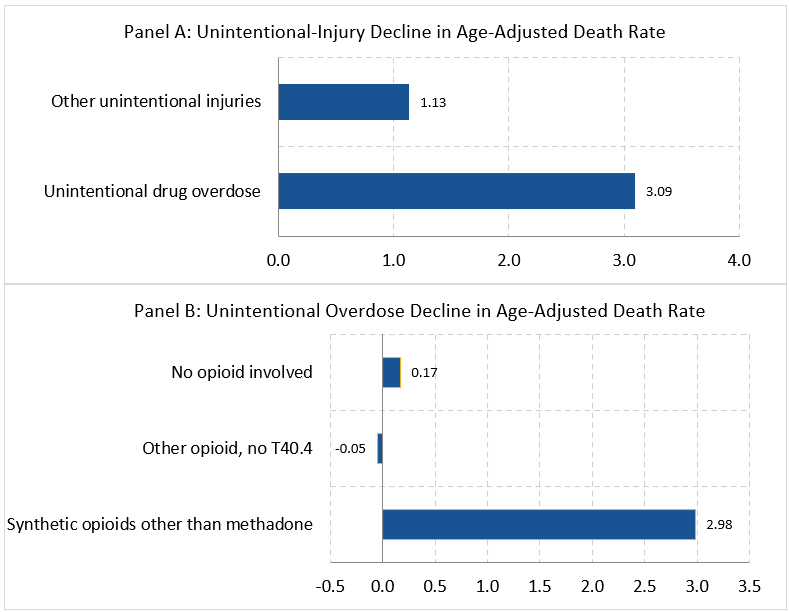
Notes: Panel A partitions all unintentional-injury mortality into unintentional drug overdose and other unintentional injuries. Panel B partitions unintentional overdose into T40.4 involved, another opioid involved but no T40.4, and no opioid involved. Unintentional drug overdose is defined by underlying-cause codes X40-X44. Any opioid is defined by multiple-cause codes T40.0-T40.4 and T40.6. T40.4 denotes synthetic opioids other than methadone, including fentanyl. Values are contributions to the common-vintage decline in age-adjusted deaths per 100,000. Source: ASPE analysis of CDC WONDER and Census data.3,4,5,6
POLICY CONTEXT AND IMPLICATIONS
The above analysis helps identify specific causes driving the observed mortality decline between 2024 and 2025, but it does not explicitly identify why the decline occurred. However, the significance of the decline in unintentional injury mortality and, within this category, the particularly large decline in mortality from the T40.4 category suggest that mechanisms specific to the illicit synthetic-opioid environment may have played an important role. These mechanisms include potential changes in availability, potency, contamination, or market composition as well as relevant treatment dimensions such as overdose reversal agents, treatment initiation and retention, and recovery support.
Given the magnitude of the opioid epidemic, there is a significant history of relevant policy effort aimed at combating it, with Federal policy operating across several complementary margins. The 2016 CDC Guideline for Prescribing Opioids for Chronic Pain gave recommendations on opioid selection as well as initiation, continuation, and assessing risk.7 The 2018 SUPPORT for Patients and Communities Act expanded prevention, treatment, recovery, and monitoring infrastructure.8 In 2023, overdose-reversal access expanded when the FDA approved 4mg naloxone nasal spray for over the counter use.9 The 2023 MAT Act removed the federal DATA-waiver requirement and patient caps for prescribing buprenorphine for opioid use disorder.10 The 2025 SUPPORT Act reauthorization continued and updated programs for substance use disorder, overdose prevention, and related workforce, and recovery programs.11 Public-safety efforts have also targeted multiple components of the illicit fentanyl and synthetic-opioid supply chain, including precursor-chemical suppliers, trafficking networks, illicit laboratories, and the potency and composition of illicit fentanyl products.12,13 DEA laboratory data show that the average purity of seized fentanyl powder, which had risen through August 2023, declined substantially by 2024 and into 2025.14,15 Specifically, fentanyl powder purity was 10.3 percent in FY2025, down from 19.5 percent in FY2023, and the share of analyzed pills containing a potentially lethal dose fell from 76 percent to 29 percent.15 These purity shifts coincided with multi-agency work—financial sanctions, precursor controls, interdiction, and information sharing with Mexican counterparts—aimed at disrupting the synthetic-opioid supply chain. The concentration of the 2024–2025 mortality decline in synthetic-opioid deaths is consistent with a change in the illicit supply environment.
It is important to note that the aggregate mortality data studied in this brief hint at, but do not provide causal attribution to any of the particular policies mentioned above. Moreover, recent policy actions launched in 2026, such as the Great American Recovery Initiative, show compelling efforts to extend recent mortality progress but cannot explain the particular 2025 decline detailed in this brief.16 In addition, while a reduction in mortality from synthetic opioids played an important role in lowering overall mortality, as described above, reductions in mortality from other causes such as COVID-19 also contributed.
CONCLUSION
The 2025 provisional age-adjusted death rate represents an encouraging improvement in U.S. mortality. The improvement remains meaningful even after disentangling the simultaneous change in population estimation methodology that occurred between 2024 and 2025, although the comparable age-adjusted death rate decline is closer to 2.0 percent rather than the 4.6 percent reported in the headline mixed-vintage published comparison. However, even with this adjustment, the 2025 provisional age-adjusted death rate remains the lowest on record among the years covered by Vintage 2025, 2020-2025.
This brief shows that the age-adjusted death rate decline occurred across many causes but was quantitatively concentrated in four categories. Unintentional injuries made the largest single contribution, but COVID-19, cancer, and heart disease also contributed significantly. Within unintentional injuries, falling drug-overdose mortality accounted for nearly three-quarters of the decline and this was itself concentrated overwhelmingly among deaths involving synthetic opioids other than methadone. Continued progress in age-adjusted mortality rates may be achievable from continued policy efforts focused on reducing avoidable opioid exposure, expanding evidence-based treatment and overdose reversal, as well as addressing the illicit synthetic-opioid supply. Lastly, final 2025 mortality data and revised population estimates will be needed to officially confirm the magnitude of the declines analyzed in this brief.
TECHNICAL APPENDIX: SENSITIVITY TO POPULATION VINTAGE BY AGE AND CAUSE
The two figures in this appendix show how the apparent age and cause composition of the mortality decline changes when 2024 is calculated using Vintage 2024 populations and 2025 using Vintage 2025 populations (mixed vintage), rather than using the Vintage 2025 methodology for both years (common vintage).
Figure A1. Age contributions to the decline in the age-adjusted death rate: common versus mixed population vintage.
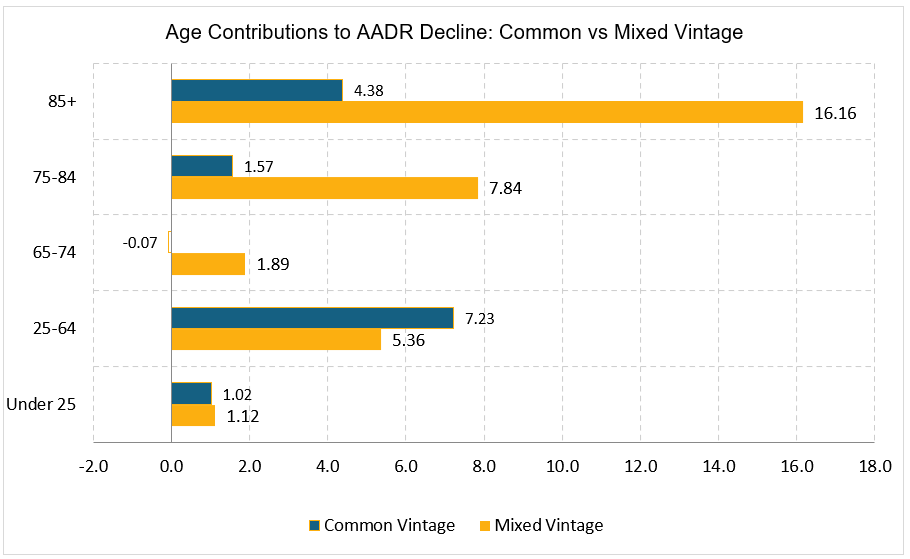
Notes: Positive values indicate contributions to the decline; negative values indicate offsets. The mixed-vintage comparison uses Vintage 2024 populations for 2024 and Vintage 2025 populations for 2025. The common-vintage comparison uses Vintage 2025 populations for both years. Source: ASPE analysis of CDC WONDER and Census data.3,4
Figure A1 shows the age contributions under the common vintage and mixed vintage approaches. Under the mixed-vintage comparison, ages 65 and older appear to account for approximately 80 percent of the decline, with nearly half attributed to age 85 and older. In contrast, under the common-vintage comparison, ages 65 and older account for approximately 42 percent, while ages 25-64 account for slightly more than half. The denominator revision across the two vintages therefore changes not only the magnitude of the decline but also its demographic composition.
Figure A2. Cause contributions to the decline in the age-adjusted death rate: common versus mixed population vintage.
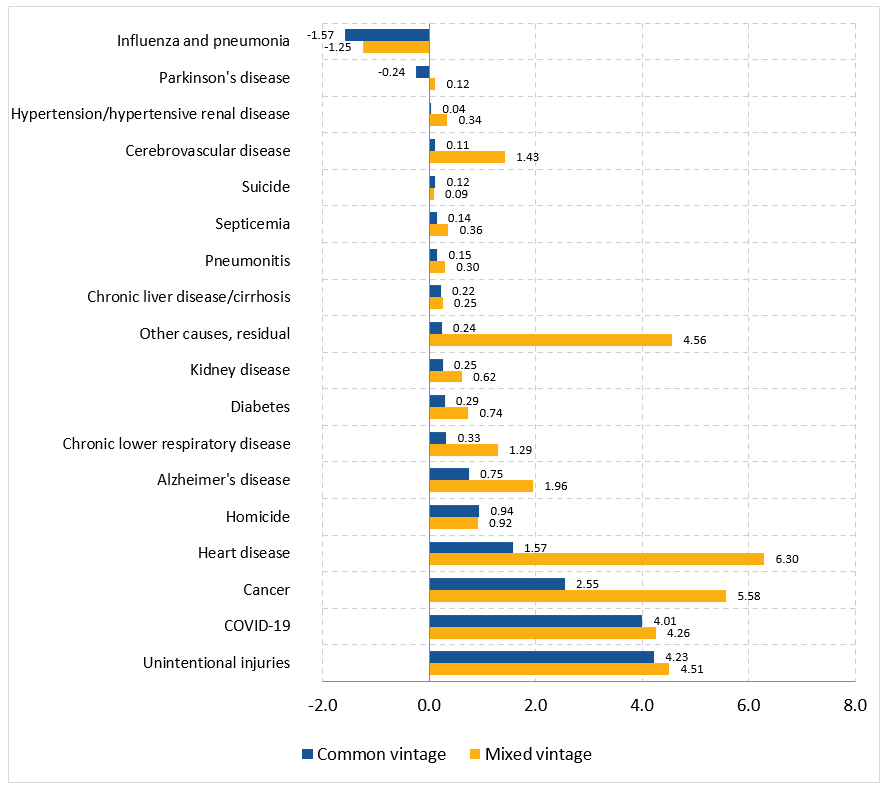
Notes: Positive values indicate contributions to the decline; negative values indicate offsets. The mixed-vintage comparison uses Vintage 2024 populations for 2024 and Vintage 2025 populations for 2025. The common-vintage comparison uses Vintage 2025 populations for both years. Source: ASPE analysis of CDC WONDER and Census data.3,4
Figure A2 shows the cause contributions under the common vintage and mixed vintage approaches. The mixed-vintage decomposition would make heart disease and cancer appear to be the two largest contributors to the decline in the age-adjusted death rate and would generate a large residual contribution from other causes. The common-vintage decomposition instead identifies unintentional injuries and COVID-19 as the two largest contributors. The more detailed overdose conclusion is comparatively robust because overdose mortality is concentrated at younger and middle ages, where the population revisions were smaller.
REFERENCES
1. Ahmad FB, Cisewski JA, Anderson RN. Mortality in the United States: Provisional Data, 2025. Vital Statistics Rapid Release, No. 44. National Center for Health Statistics; July 2026. https://www.cdc.gov/nchs/data/vsrr/vsrr044.pdf
2. Xu JQ, Murphy SL, Kochanek KD, Arias E. Mortality in the United States, 2024. NCHS Data Brief, No. 548. National Center for Health Statistics; January 2026. https://www.cdc.gov/nchs/products/databriefs/db548.htm
3. U.S. Census Bureau. National Population by Characteristics: Vintage 2024 and Vintage 2025; Methodology for the United States Population Estimates. https://www.census.gov/programs-surveys/popest.html
4. Centers for Disease Control and Prevention, National Center for Health Statistics. CDC WONDER: Underlying Cause of Death and Provisional Mortality Statistics. https://wonder.cdc.gov
5. Curtin SC. Trends in Death Rates for Leading Methods of Injury: United States, 2003-2023. NCHS Data Brief, No. 526. March 2025. https://www.cdc.gov/nchs/products/databriefs/db526.htm
6. Garnett MF, Minino AM. Drug Overdose Deaths in the United States, 2023-2024. NCHS Data Brief, No. 549. January 2026. https://www.cdc.gov/nchs/products/databriefs/db549.htm
7. Dowell D, Haegerich TM, Chou R. CDC Guideline for Prescribing Opioids for Chronic Pain—United States, 2016. MMWR Recomm Rep. 2016;65(No. RR-1):1–49.
8. U.S. Congress. SUPPORT for Patients and Communities Act. H.R. 6, 115th Cong. (2017–2018). Pub. L. No. 115-271; enacted October 24, 2018.
9. U.S. Food and Drug Administration. FDA Approves First Over-the-Counter Naloxone Nasal Spray. March 29, 2023.
10. Substance Abuse and Mental Health Services Administration. Waiver Elimination (MAT Act). U.S. Department of Health and Human Services; last updated November 6, 2024.
11. U.S. Congress. SUPPORT for Patients and Communities Reauthorization Act of 2025. H.R. 2483, 119th Cong. (2025–2026). Pub. L. No. 119-44; enacted December 1, 2025.
12. U.S. Department of Justice, Office of Public Affairs. Fact Sheet: Justice Department Actions to Counter the Scourge of Fentanyl and Other Synthetic Drugs. July 31, 2024; updated February 6, 2025.
13. U.S. Department of the Treasury, Office of Foreign Assets Control. Treasury Sanctions Criminal Operators and Money Launderers for the Notorious Sinaloa Cartel. March 31, 2025.
14. U.S. Drug Enforcement Administration. 2025 National Drug Threat Assessment. May 2025. https://www.dea.gov/sites/default/files/2025-07/2025NationalDrugThreatAssessment.pdf
15. U.S. Drug Enforcement Administration. DEA Launches Fentanyl Free America Initiative to Combat the Synthetic Drug Crisis. December 3, 2025
16. Executive Office of the President. Addressing Addiction Through the Great American Recovery Initiative. Executive Order 14379, January 29, 2026. Federal Register. 2026;91(22):5081–5083. Published February 3, 2026.
*This content is in the process of Section 508 review. If you need immediate assistance accessing this content, please submit a request to Nicholas Holtkamp, Nicholas.Holtkamp@hhs.gov. Content will be updated pending the outcome of the Section 508 review.