
U.S. Department of Health and Human Services
October 2011
Prepared by:
The Offices of CLASS, ASPE, and the General Counsel
For additional information, you may visit the DALTCP home page at http://aspe.hhs.gov/_/office_specific/daltcp.cfm or contact the office at HHS/ASPE/DALTCP, Room 424E, H.H. Humphrey Building, 200 Independence Avenue, SW, Washington, DC 20201. The e-mail address is: webmaster.DALTCP@hhs.gov.
"Introduction
The Community Living Assistance Services and Supports (CLASS) Act was enacted as Title VIII of the Patient Protection and Affordable Care Act (ACA), P.L. 111-148 (Mar. 23, 2010), which amended the Public Health Service Act, 42 U.S.C. section 201 et seq., by adding the CLASS Act as Title XXXII. The law was designed to establish a voluntary, national insurance program for American workers to help pay for long-term services and supports they may need in the future. The CLASS program seeks to help enrollees live independently in the community and to give them considerable freedom to determine the necessary services and supports they purchase with their coverage. By statute, CLASS benefits must be funded entirely through enrollee premiums; there is no taxpayer subsidy. Appendix A includes a description of the Act that was prepared by the CLASS Office to guide their work.
There is a critical need to find ways to help Americans prepare for their long-term care needs. Almost seven out of ten people turning age 65 today will experience, at some point in their lives, functional disability and will need some paid or unpaid help with basic daily living activities. While most people who need long-term care are in their 70s and 80s, young people also can require care, with 40 percent of long-term care users today between the ages of 18 and 64.
Long-term care is also expensive. While costs for nursing home care vary widely, they average about $6,500 per month, or anywhere from $70,000 to $80,000 per year. People who receive long-term care services at home spend an average of $1,800 per month. Expected lifetime long-term care spending for a 65 year old is $47,000; sixteen percent will spend $100,000 and five percent will spend $250,000. Medicare does not cover long-term care services. Medicaid pays for such services only for people with limited financial means; qualifying for Medicaid often means exhausting all other resources.
Furthermore, few private mechanisms are available to help people plan ahead to pay for their future care. Long-term care insurance, by far the most popular private option available, can be costly and difficult to purchase for those with pre-existing health conditions or disabilities. Only about 2.8 percent of Americans have a policy. For workers who already experience a disability and a need for long-term services and supports, the options are even fewer.
The CLASS Act would add a new option for people who are employed. Among the unique and attractive features that differentiate it from long-term care insurance products available on the private market are that it offers lifetime benefits, is not underwritten, and provides a cash benefit.
The CLASS Act directs the Secretary of the Department of Health and Human Services (HHS), “in consultation with appropriate actuaries and other experts, [to] develop at least 3 actuarially sound benefit plans as alternatives for consideration for designation by the Secretary as the CLASS Independent Benefit Plan under which eligible beneficiaries shall receive benefits under” the law. The Act requires that each of the plan alternatives be designed to provide the benefits specified in the law consistent with a set of requirements, also specified in the law, concerning, among other things, premiums, the vesting period, benefit triggers, and the cash benefit. Of particular significance, the Act makes clear that the Secretary shall establish premiums for each plan “based on an actuarial analysis of the 75-year costs of the program that ensures solvency throughout such 75-year period.”
Consisting of two parts, this report documents the work undertaken by the Department of Health and Human Services (HHS) to fulfill the Secretary’s responsibilities under the law. Part One describes the organizational, analytical, policy, and implementation steps taken by HHS to develop the CLASS plan alternatives and prepare for implementation. Part Two provides legal analysis of the plans undertaken by the Office of the General Counsel.
This report also includes numerous links to material posted on the Web and over 200 pages of appendices. These materials more fully describe ideas that are only summarized in the report for the sake of brevity and readability. Complete descriptions of all the CLASS benefit designs that were considered can be found in the report of the CLASS Chief Actuary in Appendix O. We also include links to influential research briefs and analyses that helped shape the thinking behind the policies that are discussed in the report. In the interest of openness and transparency, we have also included relevant information about consultations and meetings with experts and stakeholders.
Part I: Developing the Class Program
This Part describes the organizational, analytical, policy, and implementation steps taken by HHS to develop the CLASS plan alternatives and prepare for implementation. It consists of seven sections. Section One outlines the offices and divisions within HHS and the roles played by them, and the functions and status of two federal advisory committees created by the CLASS Act. Section Two briefly outlines the HHS process used for identifying policy issues and enumerates the issues identified. Significant documents (both internally and externally developed) that informed policy and implementation discussions are noted. Section Three lists public presentations, along with links to the relevant Congressional hearing record. Section Four discusses the work undertaken to draft proposed regulations. Section Five presents the activities conducted to support marketing the program to employers and individuals, as well as consumer research. Sections Six and Seven describe the development of two actuarial models for conducting estimates for CLASS premiums and the plan options that were developed and modeled, respectively.
Section One: HHS Management
Pre-Enactment
The Office of Disability, Aging and Long-Term Care Policy in the Office of the Assistant Secretary for Planning and Evaluation (ASPE) led the analytical work relating to CLASS prior to enactment. For 30 years, ASPE has maintained the only office in the federal government dedicated to long-term care (LTC) policy research and analysis. ASPEs LTC research portfolio includes, among other topics, an extensive array of projects on LTC reform, planning and awareness, insurance, community services and financing. ASPE originated and managed the Cash and Counseling demonstration, on which the CLASS cash benefit is based.
In the months leading up to the passage of the ACA, the Department was asked to provide technical assistance on the CLASS program to Members of Congress and staff. That technical assistance was provided by senior staff from the Administration. The technical assistance was based, in part, on analyses conducted by HHS using pre-existing actuarial and economic studies of CLASS and similar proposals (including analyses by the CMS Actuary, http://www.cms.gov/ActuarialStudies/Downloads/HR3962_2009-11-13.pdf, http://www.cms.gov/ActuarialStudies/Downloads/S_PPACA_2009-12-10.pdf http://www.cms.gov/ActuarialStudies/Downloads/S_PPACA_2010-01-08.pdf and the American Academy of Actuaries, http://actuary.org/pdf/health/class_july09.pdf), data on disability rates among workers, and data based on state experiences with various LTC financing initiatives. These senior leaders were asked to brief House and Senate Committee members and their staff in person and by telephone during the fall of 2009.
In October 2009, prior to enactment, ASPEs Deputy Assistant Secretary for Disability Aging and Long-Term Care Policy discussed the bill at a meeting held by the Kaiser Family Foundation. There he emphasized the Departments support for the program but also recognized that it faced significant challenges that would need to be addressed (http://www.kff.org/healthreform/kcmu102009pkg.cfm).
In September and December 2009, HHS met with House and Senate staff about CLASS. During this same period, HHS also met to discuss CLASS with the Actuary for the Centers for Medicare and Medicaid Services (CMS) and with staff of the Congressional Budget Office (CBO). HHS also held meetings with the American Academy of Actuaries and the Social Security Administration (SSA) Actuary. In December and January, Senate staff asked HHS to begin developing a list of technical corrections to the bill, to address concerns on which there was broad consensus.
Post-Enactment
Upon enactment of the ACA, the Secretary established implementation work groups, including the Long-Term Care Work Group, which was charged with overseeing the identification and analysis of policy issues related to CLASS and the multiple Medicaid long-term care provisions of the ACA. With participation from across HHS, this group was co-chaired by ASPEs Deputy Assistant Secretary for Disability, Aging and Long-Term Care Policy and the Director of the CMS Disabled and Elderly Health Programs Group. More details about the work group are provided below under Identification, Analysis, and Discussion of Policy Issues.
On April 22, 2010, the CMS Actuary issued a memo on the estimated financial impact of the ACA. Regarding the CLASS program, he asserted that after fiscal year 2025:
The new Community Living Assistance Services and Supports (CLASS) insurance program would produce an estimated total net savings of $38 billion through fiscal year 2019. This effect, however, is due to the initial 5-year period during which no benefits would be paid. Over the longer term, expenditures would exceed premium receipts, and there is a very serious risk that the program would become unsustainable as a result of adverse selection by participants.1
In late spring 2010, Secretary Sebelius asked Kathy Greenlee, Assistant Secretary for Aging, to take the lead on implementing CLASS.2 ASPE worked closely with the HHS Assistant Secretary for Administration to develop alternative designs for the location and structure of the CLASS office.
CLASS staff recruiting began in October 2010. A detailee from the U.S. Office of Personnel Management who had experience implementing and managing the Federal Long-Term Care Insurance Program led the effort. Also during this time, one staff person from the HHS Office of Medicare Hearings and Appeals (OMHA) began a three month detail to work at ASPE on the policy and implementation issues related to CLASS appeals. The first non-detailed CLASS staff member was hired September 27, 2010, the CLASS Chief Actuary began work in January 2011, and approximately 14 FTEs were hired by May 2011. As of October 15, 2011, there are seven individuals assigned part or full time to the CLASS office.
In late 2010 HHS decided to place the CLASS Office within the Administration on Aging (AoA), and published a notice of reorganization in the Federal Register on January 28, 2011 (Appendix C). The basis for that decision was that it would be the most cost-effective way of implementing and running the CLASS program. At that time, the Assistant Secretary for Aging was named the Administrator of the CLASS program. The Long-Term Care Work Group was disbanded in March 2011.
ASPE continues to conduct policy analysis and research to inform CLASS implementation and, most significantly, to maintain and run the two actuarial models that were developed to generate CLASS premium and participation estimates. Details on ASPEs research and on the actuarial models appear in subsequent sections of this report.
Organization of the Class Office
The CLASS Office was originally organized into six divisions:
- Actuarial Integrity and Benefit Design
- Benefits Administration and Enrollee Services
- Regulatory Affairs
- Information Systems
- Marketing and Employer Outreach
- Program Integrity, Evaluation, and Compliance
An organizational chart is located in Appendix D. Each division developed work plans, delineating the steps and products necessary to move to full program implementation. These work plans were put together in a flow chart so that CLASS management could be coordinated across many functions. (Appendix E contains the summary flow chart.)
Class Federal Advisory Committees
The CLASS Act authorizes two Federal Advisory Committee Act panels: the CLASS Independence Advisory Council and the Personal Care Attendants Workforce Advisory Panel. The CLASS Office has a contract in place to plan and manage the meeting logistics for both committees.
-
CLASS Independence Advisory Council
Secretary Sebelius signed the charter for the CLASS Independence Advisory Council on November 9, 2010. This Council is charged with advising the Secretary on matters of general policy in administering the CLASS program and formulating regulations. A notice appeared in the Federal Register on November 16, 2010 announcing the establishment of the Council and soliciting nominations. (Appendix F) The nomination period was open from November 16, 2010 to December 1, 2010 and the CLASS Office received over 140 nominations. The Council has not been named yet.
-
Personal Care Attendants Workforce Advisory Panel (PCAWAP)
The PCAWAP was authorized in the CLASS Act but is not directly related to the CLASS benefit. The purpose of the Panel is to examine and advise the Secretary and the Congress on workforce issues related to personal care attendant workers. Secretary Sebelius signed the charter for the PCAWAP on June 4, 2010. A notice establishing the Panel and a call for nominations appeared in the Federal Register on June 16, 2010.
An initial nomination package was sent to the Office of the Secretary (OS) in October 2010. Upon review, the list of proposed panel members was revised and a new nominations package was sent to the Secretary in April 2011. Secretary Sebelius approved the nominations and sent letters of invitation to the nominees. Thirteen of the fifteen nominees accepted, and those members have completed the HHS Human Resources on-boarding process required for Special Government Employees. Additional nominees have been identified to fill the two open seats, but final selections have not been made. Appendix G contains the PCAWAP announcement and membership list.
Section Two: Identification, Analysis, and Discussion of Policy Issues
Long-Term Care Work Group
In addition to its chairs, ASPEs Deputy Assistant Secretary for Disability, Aging and Long-Term Care Policy and the Director of the CMS Disabled and Elderly Health Programs Group, membership in the Long-Term Care Work Group included representatives from: the Immediate Office of the Secretary; the Administration on Aging; the Offices of the Assistant Secretaries for Legislation, Financial Resources, and Administration; the Office on Disability; the Administration on Developmental Disabilities; the Office of the General Counsel; the Office for Civil Rights; the Substance Abuse and Mental Health Services Administration; the Indian Health Service; the National Institutes of Health; and the Executive Secretariat.
Members of the group took responsibility for preparing policy papers and presenting their work at weekly meetings. The groups primary purpose was to review the CLASS statute thoroughly, and to identify all of the policy issues that needed to be addressed. Leaders of the group briefed senior HHS leaders.
The issues presented and discussed are summarized below; the full papers are contained in Appendix H.
Enrollment and Vesting. This discussion covered five significant enrollment issues: (1) opt out and payroll deductions; (2) alternative enrollment processes; (3) penalties for lapsing; (4) delays in CLASS enrollment; and, (5) the definition of active employment. The group noted that both CBO and the Business Roundtable had identified the issue that the law mandated automatic enrollment only for employees whose employer had elected to participate in CLASS and that it was not likely that many employers would do so. Other options for enrollment such as employers offering information or a yes/no choice were discussed. Group members analyzed the implications of policy holders lapsing, or skipping multiple payments. Thus, individuals could strategically (and legally) game the program, threatening financial stability. The group considered a variety of strategies for addressing the lapsing issue. The group also considered different ways to approach the earnings requirement during the vesting period. The group discussed whether individuals would be required to pay premiums while in benefit status. In an early meeting with representatives from the IRS, HHS officials learned that the IRS code had not been amended to cover payroll deductions for CLASS premium payments so that the protections that addressed the potential failure of employers to pay money withheld from other payroll deductions would not apply to the automatic withholding of CLASS premiums. Enrollment options were discussed to address this concern.
Indexing of Premiums. Based on internal analyses and discussions with outside experts, there was a concern that structural imbalances created by the statutory requirement to index benefits but not premiums would result in threats to take-up and solvency. The group analyzed and discussed the implications of both indexing and not indexing premiums.
Eligibility. The group discussed a number of eligibility issues, including the definition of a licensed health care professional and how limitations in activities of daily living (ADLs) would be assessed for individuals with dementia and other non-physical impairments. The group suggested that the actuaries model the program using as eligibility triggers two and three ADLs to support future decision making. The group also noted that the tiering provisions in the CLASS Act, which provide that there must be at least two levels of cash benefits depending on the individuals functional limitations, could create incentives to overstate ADL limitations. It was therefore important to consider the design of the benefit tiers carefully. The group also commissioned a paper on assessment of people with cognitive impairments. This paper is discussed under Additional Analyses, below.
Cash Benefits. The work group discussed cash benefits -- including their structure and management and consumer privileges, responsibilities and issues related to using debit cards for cash benefits. Much of the analysis was based on extensive ASPE sponsored research on cash benefits and consultation with experts from other nations that use cash benefits for long-term services and supports.
Protection and Advocacy and Advice and Assistance. The group suggested that protection and advocacy (P&A) and advice and assistance services, which are required benefits under the CLASS Act, should be targeted to beneficiaries once they are in claim status.
Administrative Expenses. The group discussed various ways to analyze and implement the statutory three percent cap on administrative expenses provision. ASPE directly analyzed data from regulatory filings from several states, obtained information from outside actuaries and contracted for additional actuarial analyses from the Actuarial Research Corporation (ARC). It concluded that the range of administrative costs is six to twenty percent in the private LTC insurance industry.
Interaction with Medicaid. The group discussed how the Department could address the multiple interactions between Medicaid and the CLASS program.
Additional staff analyses provided to the work group on marketing and information systems are discussed in detail elsewhere in this report.
Additional Analyses
ASPE procured four immediate analyses in order to address issues related to CLASS policy development and implementation; in addition, consistent with ongoing long-term care planning and awareness research done over the past eight years, ASPE contracted for a consumer survey and series of focus groups about LTC planning. The CLASS Office published a Request for Information on enrollment and premium administration systems (see Appendix I); no contracts have been awarded for administration systems.
The four analyses procured by ASPE, found in Appendix J, are:
-
A paper on underwriting (specifically, on individuals who are typically precluded from buying private LTC insurance policies because of underwriting) from LifePlans. This paper provided insight into a potential target market, individuals who are interested in purchasing LTC coverage but are unable to do so due to underwriting. The paper concluded that additional research would need to be conducted on this pool of likely buyers to ensure that their risk profile is taken into account in setting program premiums.
-
A paper on assessment instruments and procedures for identifying ADL impairment equivalents in individuals with cognitive impairments, by Katie Maslow, an independent consultant and nationally recognized expert in dementia. This work provided a thorough review of strategies for assessing the eligibility of people with dementia for LTC programs.
-
A Strategic Analysis of HHS Entry into the LTC Insurance Market, in which business experts analyzed the LTC insurance industry and the CLASS statute and offered their views on how CLASS could be positioned and how private industry might respond. The authors noted the possibility that private companies might begin offering CLASS-like products.
-
An exploration by Univita (a private company that provides administrative and management support to LTC insurance companies) about cash benefits in the private LTC insurance market. This paper concluded that consumers prefer cash for the flexibility it offers, but that cash benefits are more expensive to administer because of the recordkeeping involved.
Review of Key External Papers and Analyses
In addition to commissioning papers and conducting internal analyses, HHS staff and leaders reviewed a large number of papers and reports written outside the Department. These included:
- Kaiser Family Foundation briefs on CLASS
- A National Health Policy Forum brief on CLASS
- A series of papers commissioned by the SCAN Foundation (http://www.thescanfoundation.org/commissioned-supported-work/class-technical-assistance-briefs)
- An actuarial analysis by Milliman (http://publications.milliman.com/publications/healthreform/pdfs/perspectives%20on-community-living.pdf)
- The experience of the California Public Employees Retirement System
- An actuarial analysis of an earlier formulation of CLASS that had been commissioned by AARP.
Meetings with Experts and Stakeholders
To inform the policy development process, HHS staff met with a wide range of experts and stakeholders with an interest in CLASS, as well as others with related interests. These included:
- Groups focused on providers of aging and disability home and community based services
- Consumer organizations representing long-term care users with disabilities (including groups focused mainly on seniors and multiple subgroups within the disability community)
- Nursing home and other provider organizations
- Organizations representing the long-term care workforce, including organized labor
- Representatives of the insurance industry
- Foundations interested in long-term care
- Payroll management and support companies
- State Medicaid, mental health and intellectual disabilities officials and the associations that represent them
- Actuaries with expertise in disabilities or long-term care.
A detailed listing of these meetings can be found in Appendix K.
Section Three: Public Presentations
The Department presented and discussed its work on CLASS in numerous public meetings and Congressional hearings following enactment. Public presentations included forums and meetings sponsored by AcademyHealth, Alliance for Health Reform, AARP, the Long-Term Care Discussion Group, and the Kaiser Family Foundation (where Secretary Sebelius spoke about CLASS in February 2011; the speech can be accessed at http://www.hhs.gov/secretary/about/speeches/sp20110207.html).
CLASS leaders and staff spoke at national meetings (e.g., 17th Annual Policy Briefing of the National Association of Area Agencies on Aging, Intercompany LTC Insurance Conference) in March, April and May 2011. Administrator Greenlee spoke about CLASS to the American Health Lawyers Association in February 2011 and to the Society of Professional Benefits Administrators in March 2011.
In addition, CLASS was the focus of a hearing held by the House Energy and Commerce Committee, Subcommittee on Health on March 17, 2011. (Written testimony can be accessed at http://republicans.energycommerce.house.gov/Media/file/Hearings/Health/031711/Greenlee.pdf) Secretary Sebelius also discussed CLASS at a March 30, 2011 hearing before the Senate Finance Committee.
Section Four: Regulation Development
The CLASS Office began developing CLASS Act implementing regulations in January 2011, building on the policy option papers prepared by the LTC Work Group and legal advice from the HHS Office of General Counsel (OGC).
The CLASS Office prepared the CLASS Regulations Development Plan (CLASS RDP) document in February 2011. The CLASS RDP established a framework for rulemaking and compiled documents describing: the roles and responsibilities of the various entities participating in the regulation development process; the Secretarys rulemaking authorities and requirements; rulemaking steps; development activities; and other considerations.
Also in February 2011, the CLASS Office began forming the CLASS Regulations Project Team, an interdepartmental group of subject matter experts that included representatives from ASPE, the Centers for Medicare and Medicaid Services (CMS), the Office on Disability (OD), the Office for Civil Rights (OCR), and the Office of the General Counsel (OGC). The team was tasked with providing initial informal review of draft regulations. Ultimately the CLASS Office determined that additional actuarial and legal work was required prior to drafting the appropriate regulatory language needed for the Notice of Proposed Rulemaking (NPRM). After the CLASS Chief Actuary was hired, the CLASS Office recognized that several critical issues needed to be more fully developed internally before regulations could be developed.
Many of the regulations related solely to operational aspects of the CLASS program have been drafted. For example, the CLASS staff has made significant progress in drafting regulations in the following areas: enrollment; waiver of automatic enrollment; lapse in enrollment and disenrollment; reenrollment; payment of premiums; and benefit eligibility. The draft regulations did not address key benefit design issues because policy and legal analysis were still underway.
Section Five: Marketing Research and Ltc Planning
Secretary Sebelius and Administrator Greenlee have clearly stated on multiple occasions that the CLASS program will not go forward unless it is solvent, sustainable, and consistent with the law. Program solvency depends on premiums, benefit payouts, and take-up rates -- enough people buying CLASS policies. Attracting enrollees with lower health risks, people who pay premiums over a long period of time before needing long-term services and supports, is also critical. Achieving sufficient take-up rates and attracting an average mix of enrollees with respect to their health status both depend heavily on marketing.
To prepare for implementing the CLASS program, the Department made a targeted set of investments in consumer awareness and marketing of possible CLASS benefit options that are described below. Not all of the findings from the marketing research are available yet. The research will provide an understanding of: how potential buyers think about long-term care planning; how they make decisions about what and when to buy and how much they are willing to spend; and, how employers think about whether to offer LTC coverage and how they would respond to the opportunity to offer CLASS to their employees. HHS commissioned this research in order to understand whether potential CLASS plan designs would be attractive to a large enough group of buyers. The observations about marketing that are made later in this report rest on preliminary analyses of the marketing research conducted thus far or consultations that HHS has had with experts in long-term care insurance.
In addition, HHS has conducted research for the past fifteen years to understand consumers knowledge about long-term care, their experiences arranging or providing care, their attitudes about planning ahead, and their assessment of their own risk for needing long-term care. HHS has considered findings from this research in formulating and modeling premiums and take-up rates for the proposed plan options.
Initial CLASS Marketing Strategy. Initial planning for a CLASS marketing strategy identified two primary sets of customers -- employers and consumers. For CLASS to obtain a sufficient level of enrollment, marketing campaigns would have to target both groups. To determine how best to market to each group, HHS sought to learn more about their respective attitudes and preferences, then identify those within each group who were most likely to participate in the CLASS program. To prepare for developing marketing strategies for both groups, several research and message development procurements were conducted by ASPE and the CLASS Office in the three following areas: Consumer Research, Employer Research and Long-Term Care Awareness Activities.
Long-Term Care Awareness Survey. In 2010, ASPE awarded a contract to RTI International to design a large, nationally-representative survey to study the attitudes, experiences, opinions and actions of Americans related to planning for long-term care services. The data collection contract was awarded to Knowledge Networks. At the time of contract award, ACA had not yet passed and the purpose of the contract was to gain knowledge for future phases of existing long-term care policy (such as the Own Your Future campaigns). Upon passage of ACA, ASPE expanded the scope of the project to include background research for CLASS. The survey, which is not yet completed, will also employ a discrete choice experiment that will measure individuals preferences for various attributes of plans at specific price points.
Qualitative Research. ASPE contracted with Thomson Reuters to conduct a number of in-person focus groups and interactive discussions as part of the background research for both the CLASS program and the larger survey effort. Participants in the focus groups, which took place in three cities (Baltimore, MD, St. Louis, MO and Edison, NJ) considered the value to consumers of various CLASS program proposals, consumers cost/benefit analyses and their reaction to federal government sponsorship. The research sought to help identify factors that facilitate or inhibit planning for long-term care. Knowledge Networks convened the interactive discussions using members of their KnowledgePanel®. The data from the interactive discussions informed hypothetical questions for the design and administration of the survey mentioned above. Each interactive and in-person discussion solicited from participants reactions, opinions and ideas related to various aspects of long-term care planning and awareness.
Highlights of the findings from the focus groups include: (1) women are more likely to believe that they will need care in their older years compared to men; (2) the belief that one will need long-term care does not necessarily translate into purchasing LTC insurance; (3) many people believe that postponing the purchase of insurance will save money; and (4) many people think that an insurance policy should cover all costs of care; anything less is inadequate. Respondents reacted negatively to vesting periods and complicated benefit plans. Respondents reacted positively to the absence of underwriting, and the option of a cash benefit. Reasons for not purchasing insurance involve cost, first and foremost, but also involve other expenses (such as college tuition and weddings), a perception that insurance is akin to gambling, and the lack of a perceived need for it (particularly among men). Respondents also believed that there should be incentives to purchase long-term care insurance, such as tax deductions.
Development of a Strategic Brand for CLASS. The CLASS Office released a solicitation to develop a strategic brand for CLASS, but no procurement was awarded.
Employer Research. The CLASS Office released a solicitation to assess the potential for employers of all types and sizes to sponsor the CLASS program as a voluntary employee benefit, but no procurement was awarded.
Long-Term Care Awareness Activities
The CLASS Office released a solicitation to design a plan for a national long-term care awareness campaign to be implemented over a five-year period and to enhance and continue the operation of the National Clearinghouse for Long-Term Care Information (Clearinghouse) as authorized by Section 6021 (d) of the Deficit Reduction Act of 2005, and extended by Section 8002 (d) of the Affordable Care Act. The Clearinghouse Procurement represents the Departments longstanding effort to increase consumer awareness of the need to plan ahead for long-term care. This procurement will facilitate consideration of a broader awareness effort while also enhancing the Departments existing awareness activities. Clearinghouse enhancements include a transition from direct mail to web-based outreach, and a refinement of the long-term care planning calls to action.
Section Six: Actuarial Model Development
By April 2010, it became clear that existing actuarial models that had been used before enactment of the CLASS Act (both those already relied on by HHS and those being developed by outside groups such as Boston College) would be insufficient to provide CLASS estimates and new models would have to be developed. Actuarial modeling of the CLASS program was undertaken by staff in ASPE, and reviewed by the CLASS Office. The model development and modeling were largely supported through a long-standing contract between Actuarial Research Corporation (ARC) and ASPE, and a new contract with AvalereHealth that began in September 2010. The rationale for developing two models was to compare premiums and other program dynamics using different methodological approaches and data and to assess the sensitivity of results to varying model assumptions. This is standard practice in the insurance industry when developing new products. Further, the ARC model does not include Medicaid offset estimates, while the Avalere model does. The key economic and demographic/actuarial assumptions are largely the same. This section briefly describes the two actuarial models, and model development and estimation across three phases: early model development and estimation; model refinement and development of preliminary benefit options; and final model development and estimation.
Both models adopted conservative assumptions that would tend to produce higher premiums and lower take-up rates than the best existing empirical evidence might suggest. For example, in modeling adverse selection it was assumed that potential enrollees would sort themselves perfectly by health status and join CLASS in reverse order (the most disabled first). The models used conservative assumptions because the existing empirical evidence is relatively sparse and there is great uncertainty around the existing estimates.
Summary of Actuarial Research CorporationS Long-Term Care Premium Model
The ARC Long-Term Care Premium Model is designed to calculate long-term care insurance premiums for a government-operated, self-financing program and to project cash flow to assist policymakers in understanding program dynamics (see Appendix L for an in-depth description of the model). It can model various CLASS benefit structures under user-selected assumptions related to: program options, economic and demographic/actuarial assumptions (including antiselection/adverse selection), and long-term care utilization. The latter two sets of assumptions do not vary according to the program options, but are parameters used in the formulas to calculate premiums. Input and output are in Microsoft Excel Worksheets with program calculations performed in Visual Basic for Applications (VBA). The computer code underlying these calculations can be viewed by simply opening Excels Visual Basic Editor.
The key program options that can be modeled include alternative formulations of the following provisions of the CLASS program:
- vesting and work requirements
- earnings requirements
- benefit triggers
- daily benefit amount
- duration of benefits
- scheduled increase in premiums (i.e., indexing to a specific percentage increase or none);
- waiver of premium while on claim (full, partial, or none)
- participation rate
- administrative expense load on premiums.
Two approaches to adverse selection are built into the model: a theoretical approach and a first-year assumption regarding additional claims (a.k.a. the first-in method). The theoretical approach is based on a formula that assumes that adverse selection is greatest at the time of issue and declines the longer an individual is enrolled in the program. The second approach is based on observed data and an estimate of the number of people who are immediately eligible to enroll in the program and who also meet the ADL or cognitive requirement to qualify for benefits. This alternative method assumes that 100 percent of the population with limitations in ADLs or severe cognitive impairment would: (1) choose to enroll in the CLASS program the first year policies are offered, (2) survive the 5-year vesting period, (3) meet the work requirements during the vesting period, and (4) file a claim as soon as possible. After the first year in which benefits are paid, incidence rates for policyholders are assumed to be the same as general population incidence.
The model uses the 2011 OASDI Trustees Report, the Current Population Survey (CPS), the National Health Interview Survey (NHIS), the National Long-Term Care Survey (NLTCS), and the National Nursing Home Survey (NNHS). The model uses the 2011 OASDI Report and the CPS to set input parameters related to future inflation, mortality, interest rates, and labor force participation. The model uses the NHIS, NLTCS, and NNHS to estimate initial long-term care utilization by age and sex. Program options, economic and demographic/actuarial assumptions, and utilization can be saved and retrieved so that estimates can be replicated easily, and the impact of individual assumptions, or sets of assumptions, can be determined.
Summary of Avalere HealthS Revised Long-Term Care Policy Simulator
Avalere Healths Revised Long-Term Care Policy Simulator (LTC-PS) is an Excel-based model that tracks age-specific groups of CLASS program enrollees for 75 years (see Appendix M for an in-depth description of the model). The LTC-PS builds off a long-term care premium calculator originally developed under a grant from The SCAN Foundation. ASPE contracted with Avalere Health in the fall of 2010 to expand the capacity of the original model to incorporate key features of the CLASS program and a wider set of assumptions.
The basic approach to estimating premiums is similar to ARCs Long-Term Care Premium Model in that the present value of total expected costs of the program (including administrative costs) must equal the present value of total expected income (premiums plus interest on accumulated reserves). The estimated premium represents the average premium required in the initial year for each age of enrollment to accomplish an actuarially balanced model. The model estimates the impact on premiums of different benefit triggers and benefit amounts, program enrollment rates, low-income premium subsidies, and various benefit structures (including cash vs. service reimbursement).
The model incorporates adverse selection through an approach that is a hybrid of that used in the ARC model. Specifically, the LTC-PS estimates the number of people by age that will develop a severe disability over the next five years, and given a rate of assumed overall participation in the program, compares the number of people that would enroll in the program against the total estimated incidence of disability for the entire eligible population over the next five years. Under a pure adverse selection scenario, the model assumes that all people who would develop a severe disability will enroll in the program; this is similar to the ARC first-in method. However, because perfect adverse selection is unlikely to occur, the model builds in several factors that dampen the impact of adverse selection at initial enrollment and over time.
The LTC-PS uses many of the same sources of data as the ARC Long-Term Care Premium Model. For example, the model bases key economic and demographic assumptions on the 2011 OASDI Trustees Report, and uses data from the NNHS and NLTCS on the older population with disabilities, both living in the community and institutions. However, unlike the ARC model that relies on the CPS and NHIS for labor force participation and core disability data, the LTC-PS uses the American Community Survey and the Survey of Income and Program Participation.
Phase I. Early Model Development and Estimation (March 23, 2010 to September 22, 2010)
EARLY WORK ON THE ARC LONG-TERM CARE PREMIUM MODEL
ARC began preliminary modeling of CLASS in late 2009 to help HHS and other federal staff understand how premiums would vary based on different levels of participation and program options that were being considered by Congress at that time. Most of this work relied on an existing premium calculator that ARC had previously developed for a different purpose, and had quickly revised to model the major program features of the CLASS Act. Following passage of the ACA, ARC began to systematically review previous assumptions and premium calculations for accuracy. Major revisions to the model were undertaken through early summer 2010 to incorporate several aspects of the program that were not previously modeled in-depth, most notably the impact of the nominal premiums for low income persons and full-time students. In addition, staff at ARC began to update program parameters, the approach to adverse selection, demographic and actuarial assumptions, and input data. The ARC staff made these revisions with the goal of having independent technical experts review the methodology, assumptions, and data used in the model during the summer of 2010.
The first draft describing the model was produced in early April 2010 and preliminary premium estimates were completed in late August. At that point, the estimated baseline average premium at 2 percent program participation for a $50/day benefit based on a 2+ ADL trigger (or similar level of cognitive impairment) with full waiver of premium while in claim was $354/month. Changing the parameters of the program to increase the work and earning requirements during the vesting period, and indexing the premium reduced the premium to an average of $134/month. The impact on premiums of other changes to the program (e.g., increasing the vesting period to seven years; having enrollees continue to pay premiums if receiving home care; changing the duration of the benefit to seven years; and adding a 90 day elimination period) were also explored.
EARLY WORK ON THE AVALERE HEALTH MODEL
In early 2009, ASPE staff learned that Avalere Health was developing a long-term care premium calculator under a grant from The SCAN Foundation. Although the calculator was not intended to directly model the CLASS program, many of the components could be adapted to develop a more robust model that could more fully analyze aspects of CLASS. This was recognized by ASPE staff following the passage of the ACA as an opportunity to develop an alternative model to compare output from ARC, and to better understand how differences in methodology, assumptions, and input data affected premium estimates and CLASS program dynamics. After briefly considering revising the model in-house, ASPE decided to pursue a contract with Avalere Health directly. ASPE developed the Statement of Work and other contract documents over the summer of 2010; the contract was formally awarded to Avalere Health on September 17, 2010. The first contract activity was for staff at Avalere Health to attend a meeting five days later at HHS on actuarial modeling of the CLASS Act.
CLASS ACT MODELS MEETING
A half-day meeting of technical experts was held on September 22, 2010 to discuss progress on modeling the CLASS program (see Appendix N for the agenda, list of participants, and presentations). Participants included actuaries, economists, and analysts in health and long-term care in HHS, and members of several outside organizations, both public and private. The purpose of the meeting was threefold: (1) to describe the updated ARC Long-Term Care Premium Model and critically review the methods, assumptions and data underlying the model; (2) to describe and review Avalere Healths Long-Term Care Policy Simulator developed for The SCAN Foundation and plans for its revision to better model the CLASS program; and (3) to discuss outstanding technical issues and get feedback on such critical questions as:
-
Do the models incorporate realistic assumptions related to incidence/continuance of functional limitations and trends in disability? Are the assumptions related to the prevalence and trends in cognitive impairment reasonable?
-
Are there alternative approaches to modeling the relationship between CLASS participation and premiums?
-
Is potential adverse selection adequately incorporated into the models?
Because the models were still being developed, the preliminary premiums that ARC produced in late August were not presented; the discussion was focused exclusively on how the two models could be improved going forward. Several suggestions that were raised in the meeting led to substantive changes in the models. For example, ARC expanded its approach to adverse selection, adding a second approach that eventually became the first-in method. Staff at ARC also further revised and updated key assumptions and data on long-term care utilization. Suggestions for ways to improve the Avalere Health models estimation of age-specific participation were also eventually incorporated.
Phase II. Model Refinement and Development of Preliminary Benefit Options (September 23, 2010 to June 22, 2011)
Actuarial work over this period focused on further revisions and testing of the ARC model, and the completion of a revised LTC-PS that could more completely model the CLASS program. HHS sought to have both models in near final condition (with extensive documentation) so that preliminary benefit options could be developed and tested, and a Technical Expert Panel (TEP) could thoroughly vet both models in spring 2011.
During this time period, the CLASS Office hired its Chief Actuary, also known as the Director of Actuarial Integrity and Benefit Design. He began developing potential plan designs to mitigate the effects of adverse selection. He also worked to review and understand the ARC and Avalere models and provided his perspective on those. He focused on program provisions having a significant influence on the benefit design, including that: (1) participation in CLASS is voluntary; (2) actuarial soundness is a requirement; (3) any successful benefit design must present a clear value proposition to attract enrollees; (4) no underwriting other than age can be used to set premiums or prevent enrollment; and, (5) CLASS is not an entitlement program. The CLASS Office brought in an actuary from the U.S. Office of Personnel Management on a temporary detail. He and the Chief Actuary coauthored a report, Actuarial Report on the Development of CLASS Benefit Plans (see Appendix O), which discusses their analyses and findings, and describes benefit plans that have the potential of being actuarially sound.
PROGRESS ON THE ARC LONG-TERM CARE PREMIUM MODEL
Staff at ARC continued to revise the model and update the input data based on suggestions made by the CLASS Chief Actuary and the participants in the CLASS Act Models Meeting in September 2010. In early January 2011, another set of baseline premiums was estimated along with several benefit options with various work and earnings requirements during the vesting period (at this point almost all estimation assumed that premiums would be indexed, i.e., increase according to a fixed schedule such as CPI-U). The estimated baseline average (indexed) premium was now slightly lower: $339/month assuming 2 percent program participation for a $50/day lifetime benefit that used a 2+ ADL trigger (or similar level of cognitive impairment) with full waiver of premium while in claim. Increasing both the work requirement (to five years instead of three of five years) and earning requirement (to $12,000 per year instead of $1,120 per year) during the vesting period produced a slightly lower average premium compared to the $134 estimate from April 2010: $127/month. These premium estimates were forwarded to the Chief Actuary at the CLASS Office on February 17, 2011. Contemporaneously, staff in ASPE and the CLASS Office began to explore alternative benefit options that might lead to reduced premiums. Several of these were formally modeled (discussed further below and in the Actuarial Report on the Development of CLASS Benefit Plans which can be found in Appendix O) and eventually presented at the TEP meeting. Analyses of the implications of changes to key economic and demographic/actuarial assumptions continued in preparation for the TEP meeting as well as the development of final estimates to present to the TEP.
PROGRESS ON AVALERE HEALTHS LTC-PS
Because the original LTC-PS was not designed to model CLASS, work by staff at Avalere Health concentrated on developing a thorough CLASS baseline prior to the planned TEP meeting and building in as much flexibility to model alternatives as possible. The first preliminary estimates were produced in late January 2011. The average premiums were very similar to those being estimated by the ARC model, although the distribution of premiums by age was different. Actuarial work in late winter and the spring, as well as drafting documentation, focused on preparation for the TEP Meeting which was scheduled for June 2011.
TECHNICAL EXPERT PANEL MEETING ON ACTUARIAL MODELING OF THE CLASS PROGRAM
The full-day meeting of the TEP took place on June 22, 2011 (see Appendix P for the agenda and meeting materials). As with the previous meeting, participants included actuaries, economists, experts in disability data, and analysts in health and long-term care; none of the formal members of the TEP were federal employees, although participants included the CLASS Chief Actuary, actuaries from SSA and CMS, and other technical experts. Time during the morning was devoted to presentations on the two models and a review of methods, assumptions, and data. The agenda in the afternoon consisted of a review of the premiums produced by each model under different sets of assumptions and alternative benefit designs. The TEP reached consensus that the models methods and demographic/actuarial assumptions were credible and that the estimates were plausible. There was some debate as to whether the incidence rates in the ARC model were too high, and thus premium estimates also too high. The TEP also extensively discussed issues of adverse selection and suggested follow up work to improve the models handling of adverse selection; however, TEP members reiterated that there was no definitive way to determine the impact of participation and adverse selection a priori because CLASS is such a unique program, and CLASS modeling would thus be inherently uncertain. The discussion of alternative benefit designs was brief and there were no strong opinions voiced one way or the other about specific options.
Phase III. Final Model Development and Estimation (June 23, 2011 to Present)
Model development at this stage has focused on further improvements to the ARC Long-Term Care Premium Model to take into account situations of extremely low enrollment (e.g., under 1 percent), modeling of an alternative benefit design contained in the Actuarial Report on the Development of CLASS Benefit Plans (Appendix O and further described in the next section), and additional reviews of both models calculations and assumptions. Two independent actuaries are undertaking the latter effort as part of ASPEs ongoing contract with Avalere Health. The CLASS Actuary also explored an alternative approach based on information derived from Genworths net premium rates, with adjustments (see page 14 of the Actuarial Report on the Development of CLASS Benefit Plans, Appendix O).
FEDERAL ACTUARIES MEETING
The CLASS Actuary convened a meeting of government actuaries on June 28, 2011 to discuss actuarial modeling on CLASS and alternative plan options. Attendees included actuaries from the CMS Office of the Actuary and the Center for Consumer and Insurance Oversight, the Social Security Administration, and the Office of Personnel Management. Additional attendees included CLASS and ASPE staff members. The group discussed plans outlined in detail in the next section of this report. The consensus was that some benefit options under consideration could theoretically reduce adverse selection and have the potential to be actuarially sound. However, concerns were raised about: how to interpret the three percent administrative cost provision contained in the law; the policy and administrative complexities associated with some of the options; the unique marketing challenges of offering a federal benefit to large employer groups; and the very high level of uncertainty around assumptions in the actuarial models.
Section Seven: Plan Options
Since the passage of the ACA, numerous CLASS plan options have been considered (see the Actuarial Report on the Development of CLASS Benefit Plans, Appendix O, for the CLASS Chief Actuarys description of several of the benefit options). Those plan options whose parameters could be well-specified were modeled using the actuarial models described above, or by the Chief Actuary of the CLASS Office, under various assumptions about adverse selection, and different economic and demographic/actuarial parameters. Although a large number of plans have been modeled, the options can be grouped into roughly three categories: (1) those that are closest to the natural reading of the CLASS statute (benefit plan option one below); (2) benefit options that vary in limited, but important ways from the baseline (benefit plan option two below); and (3) benefit designs that vary much more from the baseline, either because of the sheer number of changes or because of modifications to key features of the program (benefit plan options three through eight).
The models described above estimate premiums for plans under a set of specific assumptions. The most critical of these assumptions are the assumptions around participation rates and adverse selection. Given these assumptions, the estimated premiums are, by definition, actuarially sound. However, the question of long-term solvency of the program depends on whether the assumptions around take-up and adverse selection, as well as other model assumptions, are plausible. As neither the CLASS program nor any other program like it has existed before, there is much greater uncertainty around these assumptions than is the case around the corresponding assumptions for either private long-term care insurance or existing programs, such as Social Security and Medicare. As a consequence, less confidence can be placed in actuarial judgments about the long run solvency of the CLASS program than about corresponding assessments of private insurance or existing government programs.
Existing data sources provide an uncertain picture of what the CLASS claims experience would be. Survey data, such as those used in the ARC and Avalere models, provide information on the entire population but do not provide information on the future claims experience of the CLASS program. Private insurers claims data provide information for those who qualify for private insurance (either underwritten or large group) but do not provide information for the CLASS benefit, which is very different from the typical private market product and targets a more diverse population.
Table 1 presents a summary of the actuarial model estimates for four representative plan options (Options 1-4) that were either modeled for the TEP meeting in June 2011 and the federal actuaries meeting convened by the CLASS Chief Actuary or estimated over the last few months. Because of the uncertainty around parameter assumptions, a range of average premiums is presented rather than a point estimate. Below, we describe each of these benefit plans, provide estimates of premiums, discuss actuarial soundness, and summarize points made in the discussion of these plan options.
| Program Features | 1. | 2. | 3. | 4a. | 4b. | ||
|---|---|---|---|---|---|---|---|
| Enhanced CLASS Plan | Family of Options: Variation 1 | Family of Options: Variation 1 | Family of Options: Variation 2 | Family of Options: Variation 2 | |||
| Basic CLASS | Modified CLASS | w/Phased Enrollment1 | Modified CLASS | Increasing Benefits (CLASS Partnership) | Enhanced CLASS Plan w/Phased En.1 | Increasing Benefits (CLASS Partnership) | |
| Enrollment Requirements: | |||||||
| Age 18+ | Yes | Yes | Yes | Yes | Yes | Yes | Yes |
| Taxable Wages/Income | Yes | Yes | Yes | Yes | Yes | Yes | Yes |
| Actively Employed | Yes | Yes | Yes | Yes | Yes | Yes | Yes |
| Not in Institution | Yes | Yes | Yes | Yes | Yes | Yes | Yes |
| Coverage/Benefits: | |||||||
| Primary Benefit | Cash | Cash | Cash | Cash | Cash | Cash | Cash |
| Daily Benefit Amount (DBA) | $50 (Average) | $50 (Average) | $57.5 (Average)2 | $50 (Average) | Varies - Up to $1503 | $57.5 (Average)2 | Varies - Up to $1503 |
| Unit of Payment | Daily or Weekly | Daily or Weekly | Daily or Weekly | Daily or Weekly | Daily or Weekly | Daily or Weekly | Daily or Weekly |
| Minimum Duration in Years | NA - Lifetime | NA - Lifetime | NA - Lifetime | NA - Lifetime | 3 Years | NA - Lifetime | 3 Years |
| Total Value | TBD | TBD | TBD | TBD | $164,250 | TBD | $164,250 |
| Inflation Protection | CPI-U (2.8%) | CPI (2.8%) | CPI (2.8%) | CPI (2.8%) | CPI (2.8%) | CPI (2.8%) | CPI (2.8%) |
| Advocacy Services | Yes | Yes | TBD | Yes | TBD | TBD | TBD |
| Advice and Asst. Counseling | Yes | Yes | TBD | Yes | TBD | TBD | TBD |
| Eligibility for Benefits: | |||||||
| 5 Year Vesting Period | Yes | Yes | Yes | Yes | Yes | Yes | Yes |
| Work Req. Over Vesting Period | At Least 3 Years | 5 Years | 5 Years | 5 Years | 5 Years | 5 Years | 5 Years |
| Earnings Req. Over Vesting Period | $1,120/ Year | $12,000/ Year | $12,000/ Year | $12,000/ Year | $12,000/ Year | $12,000/ Year | $12,000/ Year |
| 24 Months of Prior Prem. Payment | Yes | Yes | Yes | Yes | Yes | Yes | Yes |
| Minimum Benefit Trigger | 2 or 3 of 6 ADLs4 | TBD | TBD | TBD | TBD | TBD | TBD |
| Tiered Benefit | Yes | Yes | Yes | Yes | TBD | Yes | TBD |
| Elimination Period in Days | 0 | 0 | 0 | 0 | 0 | 0 | 0 |
| Presumptive Eligibility | Yes - if in Inst.5 | Yes - if in Inst.5 | Yes - if in Inst.5 | Yes - if in Inst.5 | Yes - if in Inst.5 | Yes - if in Inst.5 | Yes - if in Inst.5 |
| Administrative Expenses | 3% | 3% | 3% | 3% | 3% | 3% | 3% |
| Monthly Premium: | |||||||
| Underwritten (Other Than Age) | No | No | No | No | No | No | No |
| Increasing Premium (Indexed) | No | Yes (2.8%) | Yes (2.8%) | Yes (2.8%) | Yes (2.8%) | Yes (2.8%) | Yes (2.8%) |
| Low Income Premium | Yes | No | No | No | No | No | No |
| Full Time Student Premium | Yes | No | No | No | No | No | No |
| Waiver of Premium | TBD | TBD | TBD | TBD | TBD | TBD | TBD |
| Level Premium | After Age 656 | After Age 656 | After Age 656 | After Age 656 | After Age 656 | After Age 656 | After Age 656 |
| 1 Initial enrollment limited to group (employer) settings first; individual enrollment will begin after meeting target goals in the group market | |||||||
| 2 Initial $50/day cash benefit for persons with 2-3 ADLs; $60/day cash benefit for persons with 4+ ADLs or cognitive impairment; cash benefit is reduced by 80% after five claim years | |||||||
| 3 The inflation-adjusted DBA increases over a 25-year period to the final amount: years 0-10=0%; years 11-15=5%; years 16-20=10%; years 21-25=29.5% | |||||||
| 4 Or equivalent level of cognitive impairment | |||||||
| 5 An active enrollee is presumed to be eligible for benefits if they are a patient in a long-term care hospital, nursing facility, intermediate care facility for the mentally retarded, or an institution for mental disease and are in the process of being discharged, or are within 60 days from the date of discharge | |||||||
| 6 Enrollees age 65 and older who have paid premiums for enrollment for 20 years and are not actively employed are exempt from premium increases | |||||||
-
BASIC CLASS PLAN
This plan option is based on the most natural reading of the statute and incorporates the key features of the plan described in law (e.g., eligible enrollees must be at least 18 years old and actively employed; there is no underwriting required for enrollment; the primary benefit is a lifetime $50/day [on average] cash payment; before being eligible to receive a benefit, enrollees must wait five years and meet certain work and earnings requirements; etc.). Estimates for this option were produced by ARC and Avalere Health, and are described in Column 1 of Table 1 (baseline). Though the plans cash benefit would increase by the annual percentage change in the consumer price index for all urban consumers (CPI-U), the plan modeled by the actuaries assumes that the cash benefit would increase annually by a fixed percentage, 2.8 percent, which is equal to the long-range inflation forecast published in the 2011 OASDI Trustees Report. The actuaries did this because actuarial models cannot easily estimate future costs when benefits increase by an unknown and variable amount. It is important to emphasize that the 2.8 percent inflation adjuster is for actuarial modeling purposes only; for this option it is contemplated that CPI-U would be used for ongoing program operations.
Under the set of assumptions designated as Scenario II (Expected) (see Appendix Q for Table 2) discussed at the June 2011 TEP meeting, the average premium for a $50/day lifetime benefit with a 2+ ADL trigger (or similar level of cognitive impairment) with full waiver of premium while in claim range from $235/month to $391/month. These estimates are based on a take-up assumption of 2 percent.
In the current private long-term care insurance market, most buyers choose products that provide a substantial daily benefit (e.g., $150/day to $200/day) for three to five years of coverage--daily benefit amounts that are significantly higher than the $50/day lifetime benefit. This could be an issue for marketing CLASS to a broad population as participants in focus groups specifically mentioned that they preferred a benefit that covered more of the total cost of long-term care. Moreover, premiums for products similar to the CLASS benefit, when they are sold to an underwritten population in the private market, would cost much less than the estimated premiums above. Thus, most discussion of this Basic CLASS Plan suggested that the assumed take-up rates used to compute premiums could not be achieved and were not plausible.
-
MODIFIED CLASS PLAN OPTION
The benefit plan shown in Column 2 modifies three key aspects (highlighted in yellow [ROWS are "Eligibility for Benefits"/"Work Req. Over Vesting Period" and "Earnings Req. Over Vesting Period", COLS are 2 through 4b]) of the baseline CLASS benefit: first, the work requirement during the vesting period is increased from at least three of five years to five of five years; second, the earnings requirement during the vesting period is increased from $1,120 per year to $12,000 per year (the amount of earnings that SSA uses to determine whether a nonblind person is engaged in substantial gainful activity); and finally, the monthly premium is increased annually by a fixed percentage (modeled at 2.8 percent in this example). The latter feature is sometimes referred to as an increasing premium schedule or indexed premium.
Increasing the work and earnings requirement over the vesting period significantly mitigates adverse selection, thus reducing the average premium. In addition, moving to an indexed premium instead of a constant (level) premium lowers the initial premium required to balance expected costs and expected income.
Under the set of assumptions designated as Scenario II (Expected) discussed at the June 2011 TEP meeting, the average premium for a $50/day lifetime benefit with a 2+ ADL trigger (or similar level of cognitive impairment) with full waiver of premium while in claim declines significantly; premium estimates range from $114/month to $160/month. These estimates assume a take-up rate of 2 percent.
The reduction in premiums achieved under this option make the take-up assumption more plausible for the Modified CLASS Plan than for the Basic CLASS Plan. However, the ultimate take-up level is still unknown. The daily benefit amount remains lower than what is prevalent in the private market, which likely increases the risk of low participation rates, especially by those who are able to purchase private policies. In addition, as the federal actuaries noted, the statutory 3 percent limit on administrative costs could make it very challenging to market the product and achieve the expected level of participation. Thus, while the assumed take-up rate used to compute premiums under this model is plausible, there is a high degree of uncertainty about the long-run solvency of this option.
-
ENHANCED CLASS PLAN WITH PHASED ENROLLMENT
Column 3 of Table 1 shows the key features of a benefit option described in detail in the Actuarial Report on the Development of CLASS Benefit Plans. In various documents it is referred to as the Enhanced CLASS Plan with Phased Enrollment or simply Phased Enrollment. This benefit plan builds off the Modified CLASS Plan, but differs in two important respects (highlighted in blue [ROW "Coverage/Benefits"/"Daily Benefit Amount", COLUMNS "Phased Enrollment"]). First, it uses an explicit two-tiered benefit structure for the first five years that a person is on claim:
- an initial $50/day cash benefit for persons with 2-3 limitations in ADLs
- an initial $60/day cash benefit for persons with 4+ limitations in ADLs or cognitive impairment.
After the fifth year, the daily benefit amount declines by 80 percent. Beneficiaries would therefore receive $10/day and $12/day for the above two tiers, respectively. For modeling purposes, it is assumed that the amount of the cash benefit is equivalent to a lifetime $57.50 daily benefit.
The second difference between the Modified Class Plan and the Enhanced CLASS Plan is that initial enrollment in the program would be limited to certain group settings first, such as large employers; individual enrollment would begin after group enrollment meets a pre-set threshold, explained in more detail by the CLASS Chief Actuary on page 10, Actuarial Report on the Development of CLASS Benefit Plans, Appendix O).
Early modeling of the Enhanced CLASS Plan with Phased Enrollment using the ARC Long-Term Care Premium Model produced an average indexed premium that ranges from $99/month to $106/month for a $57.50/day lifetime benefit with full waiver of premium. A preliminary comparison of age-specific premiums is also shown on p. 14 of the Actuarial Report on the Development of CLASS Benefit Plans.
As observed by the CLASS Chief Actuary, this plan achieves a greater reduction in premiums than does the Modified CLASS Benefit. The range of estimated premiums is also more similar to what is observed in the private LTC insurance market, although the daily benefit is lower in CLASS. Successfully marketing the program remains a serious challenge due to the changing benefit amounts for beneficiaries. The phased enrollment approach could substantially reduce the degree of uncertainty around the rates of enrollment by healthier individuals. By opening the program to individual subscribers only when take-up has reached a threshold level, this approach could manage the risk of adverse selection and potential insolvency.
-
FAMILY OF OPTIONS: MODIFIED CLASS PLAN & SCHEDULED INCREASING BENEFITS
Columns 4a and 4b of Table 1 describe a set of benefit plans referred to as the Family of Options. One of the options would be consistent with the CLASS statute (e.g., the Modified CLASS Plan in the case of Variation 1). The structure of the other options would vary more extensively, but would continue to incorporate similar requirements for enrollment; a primary benefit that is cash; a five year vesting period; and no underwriting except for age. The Family of Options would be structured to offer either one or two tiers of eligibility for benefits. The Family of Options would be actuarially sound, either at the individual option level or, through cross-subsidization in their entirety. Finally, one of the options within the family would be designed so that purchasers could buy a private (underwritten) insurance product to wrap around this option and provide a higher level of benefit.
Column 4a shows one variation of the Family of Options that includes the Modified CLASS Plan and the Scheduled Increasing Benefits Plan discussed above. (Column 4b shows the corresponding Family of Options with the Enhanced Class Plan with Phased Enrollment paired with the increasing benefit option.) Several features of this plan (highlighted in orange [ROWS "Coverage/Benefits"/"Daily Benefit Amount" and "Minimum Duration in Years", COLUMNS "Family of Options: Variation 1: Increasing Benefits" and "Family of Options: Variation 2: Increasing Benefits"]) differ from aspects of the plans presented in Column 1 and Column 2. Specifically, the daily benefit amount increases the longer the CLASS policy is held without going into claim, rising from approximately $20/day after the vesting period to $150/day after 25 years. Also, the duration of coverage is limited to three years, although the expected payout for this benefit option could be designed in such a way as to be actuarially equivalent to that of the Modified CLASS Plan.
Figure 1 illustrates how the basic daily benefit amount (dark blue area) increases over a 25-year period to $150/day (see Appendix R for Figure 1). This plan is sometimes referred to as the CLASS Partnership because the structure of the benefit provides an opportunity for private insurers to develop products that would naturally wrap around and supplement the underlying basic benefit (light blue area in Figure 1).
If there is no subsidization across benefits options, then the individual plans that make up any set of Family of Options can be priced independently (although specific assumptions related to participation and adverse selection could be adjusted to take into account expected interactions). The range of estimates for an average premium at 2 percent participation assuming a 2+ ADL trigger (or similar level of cognitive impairment) with full waiver of premium is $112 per month to $148 per month. These estimates do not include the cost of a supplemental policy. The total cost of an initial combined policy, for example, for a 50 year old enrollee who could pass underwriting, is currently estimated to be $154 per month ($118 per month for the basic policy and $36 per month for the supplement).
This model achieves a somewhat greater reduction in premiums than does the Modified CLASS Plan. Because of the choice of benefit structure, this option offers benefits more similar to those available in the private market. With private supplementation, purchasers could achieve coverage comparable to that in the private market at similar prices. The design significantly mitigates adverse selection, and premiums do not vary much even under alternative assumptions about take-up rates.3 There were varying opinions about the marketability of the Family of Options design. Some believed that offering choice would be attractive; others thought that it would be burdensome and confusing, especially since the low administrative load for marketing permitted under CLASS would limit the ability to explain the plan. The great uncertainty about the marketability of this option means that uncertainty about the long run solvency of this option is very high.
-
TEMPORARY EXCLUSION PLAN
This benefit option addresses adverse selection through the claims process rather than the enrollment process. Specifically, any person who meets the enrollment requirements could join CLASS, but no benefits would be paid for the first fifteen years in the program if a limitation in ADLs or cognitive impairment during this period resulted from a serious medical condition that existed at the time of enrollment. The CLASS program would provide enrollees with a list of possibly exclusionary medical conditions, but no health information would be collected at enrollment. Only when a person sought benefits would a review of medical records occur to ensure that the limitation was not the result of an underlying condition at enrollment. Existing data available to the modeling team did not provide sufficient longitudinal information about underlying conditions and subsequent disability to model this option.
This plan would likely reduce premiums substantially because potential buyers with existing health conditions would recognize that they would not be able to claim for pre-existing conditions for fifteen years. There was concern that uncertainty about future benefit receipt would make it challenging to market this option (as purchasers could not be certain that a subsequent disability would not be tied to an underlying condition). Those who could meet an underwriting standard would likely prefer to buy a policy where there was no subsequent uncertainty. See Appendix O (Actuarial Report on the Development of CLASS Benefit Plan) for additional information on this plan option.
-
TEMPORARY EXCLUSION PLAN WITH PHASED ENROLLMENT
This benefit option combines the features of Temporary Exclusion with phased enrollment as described above. Because the Temporary Exclusion Plan was not modeled, this option was not modeled either. Clearly, the combination of temporary exclusion and phased enrollment would provide substantial protection for the program against actuarial risk. It might, however, be challenging to market this package. See Appendix O (Actuarial Report on the Development of CLASS Benefit Plan) for additional information on this plan option.
-
LIMITED INITIAL BENEFIT PLAN WITH PHASED ENROLLMENT
This benefit option is analogous to the Enhanced CLASS Plan with Phased Enrollment but has a different benefit structure. While the Enhanced CLASS Plan has a two-tiered benefit that is reduced after five years on claim, this benefit option starts with a low daily benefit amount (e.g., $5 per day or $10 per day) for a fixed period of time (e.g., 20 years) before increasing to its ultimate $50 per day value.
This plan was not formally modeled. While the approach would certainly mitigate adverse selection to a great extent, the initial low benefit and extended period before the benefit increases are unlikely to be very attractive, especially to healthy older workers. See Appendix O (Actuarial Report on the Development of CLASS Benefit Plan) for additional information on this plan option.
-
PRE-PAID BENEFIT PLAN
Under extreme levels of adverse selection when 100 percent of the enrolled population is eligible for benefits, the monthly premium is essentially the amount that is required for enrollees to pre-pay their future benefit. Because the cost of a pre-paid plan is too high to make it marketable, it is not a viable benefit design. However, the exercise of determining the cost of a pre-paid plan can be instructive, since it provides us with the high end of the range of costs for a plan. The Chief Actuary of the CLASS Office estimated that a pre-paid plan would cost approximately $3,000 per month in premiums. Because enrollees are essentially pre-paying their future long-term care costs, this plan does not include a nominal premium for low income persons and full-time students. See Appendix O (Actuarial Report on the Development of CLASS Benefit Plan) for additional information on this plan option.
In addition to evaluating the formal benefit options discussed above, HHS staff also considered several features, either individually or together, to determine their impact on premiums and program dynamics. The goal was to add specific aspects that would mitigate adverse selection, lower premiums, and increase the marketability of the CLASS program. These features included adding incentive payments for delaying claim, combining CLASS with disability insurance, using variable inflation protection for the benefit instead of a fixed percentage, and possibly returning all or a portion of an enrollees accumulated premiums if he or she died at an early age before going on to claim. Most of the features were eventually discarded because they either did not significantly lower premiums or were deemed to be too complicated to implement.
Part II: Legal Analysis
This Part provides the legal analysis of the proposed plans. It consists of two sections. Section One analyzes the legal basis for each of the individual features of the eight plans summarized in Part I. In identifying these features, we rely on the discussion in the prior section and the charts and documents in the appendix. Section Two provides an overall analysis of the legal authority for the plans themselves and discusses the likelihood that the plans would survive a legal challenge. It also discusses the substantial uncertainty about what would happen if the CLASS program were implemented and then a decision were made that the CLASS program had to be closed.
Section One: Legal Analysis of Plan Features
-
BASIC CLASS PLAN
The Basic CLASS Plan meets the requirements in the CLASS Act, 42 U.S.C. § 300ll-300ll-9. Under the Act, an active enrollee becomes an eligible beneficiary if, at the time the individual is determined to have a qualifying functional limitation or cognitive impairment, the individual: 1) has paid premiums for at least five years; 2) has earned, during at least three calendar years of the first sixty months in which the individual has paid premiums, at least the amount necessary to earn one quarter of Social Security coverage; and 3) has paid premiums for twenty-four consecutive months, if the individual has had a lapse in premium payments for more than three months. Id. § 300ll-1(6)(A). The plan provides eligible beneficiaries with the three-part benefit package of a cash benefit, advocacy services, and advice and assistance counseling. Id. § 300ll-4(b)(1)-(3). The cash benefit also tracks the statutory language: the benefit amount meets the prescribed $50 per day average, there are between two and six benefit levels that vary with level of functional ability, benefits are paid on a daily or weekly basis, and benefits are not subject to any lifetime or aggregate limits. Id. § 300ll-2(a)(1)(D).
To be clear, the actuarial models based on Basic CLASS assumed a fixed 2.8 percent rate of inflation for the cash benefit. As we understand it, the cash benefit under Basic CLASS will increase by the percentage increase in the consumer price index for all urban consumers (CPI-U). This is significant because section 3205(b)(1)(B) sets the percentage increase in the CPI-U as the minimum amount by which the cash benefit must increase each year. Id. § 300ll-4(b)(1)(B).
-
MODIFIED CLASS PLAN
The Modified CLASS Plan differs from the Basic CLASS Plan in three material respects. First, it increases the amount of the minimum earnings requirement. Second, it increases the duration of that requirement. And third, it raises premiums annually according to a schedule set at the time of enrollment. While there is a plausible statutory basis for the proposed minimum earnings requirement, we have concerns that there could be a successful challenge to this interpretation. While such concerns alone would not preclude the implementation of a program with this requirement, it is appropriate that they be considered in conjunction with information about whether the program meets the statutory requirements of solvency in making decisions about the CLASS program. With respect to the schedule of premium increases, we believe that the Secretary may reasonably interpret the statute to authorize such a schedule.
Minimum Earnings -- Amount. Section 3202 of the CLASS Act provides, in relevant part:
The term eligible beneficiary means any individual who is an active enrollee in the CLASS program and . . . [among other things] has earned, with respect to at least three calendar years that occur during the first 60 months for which the individual has paid premiums for enrollment in the program, at least an amount equal to the amount of wages and self-employment income which an individual must have in order to be credited with a quarter of coverage under section 213(d) of the Social Security Act for the year.
Id. § 300ll-1(6)(A)(ii). The most straightforward reading of this provision is that in order to become an eligible beneficiary, an active enrollee in the CLASS program must, among other things, earn at a minimum an amount sufficient to qualify for one quarter of coverage under the Social Security Act for three years. The current amount of earnings necessary to be credited with one quarter of coverage for Social Security is approximately $1,200. See Quarter of Coverage, http://www.ssa.gov/oact/cola/QC.html (last visited Oct. 12, 2011). Thus, under the statute, an active enrollee who earned about $1,200 for at least three calendar years during the first sixty months in which he or she paid premiums would meet the earnings requirement for eligible beneficiary status in the CLASS program.
It is possible to read the statutory language in a way that authorizes the Secretary to adopt a minimum earnings requirement of $12,000. Section 3202(6)(C) provides, in relevant part, that [t]he Secretary shall promulgate regulations specifying exceptions to the minimum earnings requirements . . . for purposes of being considered an eligible beneficiary for certain populations. Id. § 300ll-1(6)(C). This exception language could be interpreted to allow the Secretary to raise the minimum earnings requirement for certain populations. She could do so for specific populations, such as those who are not students or not low-income, or for all populations; to support the latter conclusion, the term certain populations would be interpreted not as circumscribing the Secretarys authority, but instead only as clarifying the Secretarys authority to make distinctions among populations.
Reliance on the Secretarys exceptions authority could be challenged on the ground that the interpretation is in tension with the natural reading of the statutory language. An exception is a case to which a rule does not apply, Websters New Collegiate Dictionary 432 (9th ed. 1985), or something that is excluded from a rules operation. Blacks Law Dictionary 604 (8th ed. 2004). In this case, the relevant rule would be that an active enrollee must meet the specified minimum earnings requirement. Though requiring an individual to earn more than the statutory minimum would technically meet the definition of making an exception to the rule, one would ordinarily interpret the authority to make exceptions to a minimum earnings requirement as the authority to waive or lessen the requirement, not to raise it--that is, the authority to say that the requirement need not be met, not that the requirement may be made more stringent. See Edward C. Liu, Cong. Research Serv., 7-5700, Authority of the Secretary of HHS to Make Exceptions to Minimum Earnings Requirement for Eligibility Under the CLASS Act (2011) (reaching a similar conclusion).
There is a related, alternative way of achieving a type of higher minimum earnings requirement. Instead of focusing on minimum earnings per se, this alternative would focus on the definition of actively employed. Only individuals who are actively employed may enroll in the CLASS program. Id. § 300ll-3(c). The term actively employed refers to an individual who is reporting for work at the individuals usual place of employment or at another location to which the individual is required to travel because of the individuals employment . . . and is able to perform all the usual and customary duties of the individuals employment on the individuals regular work schedule. Id. § 300ll-1(2). It could be argued that the Secretary has authority to define the term actively employed further, setting forth, for example, a minimal weekly wage or work hours requirement. Though the Supreme Court has rejected agencies attempts to define terms further when the statutory definitions are unusually detailed, INS v. Hector, 479 U.S. 85, 88 (1986), or are explicitly and comprehensively defined . . . by including . . . discrete definitions, Carcieri v. Salazar, 129 S. Ct. 1058, 1066 (2009), it could be argued that those cases are inapplicable here because the CLASS statutes definition of actively employed is minimal. By defining the term actively employed to require a minimum level of wages or work hours, the Secretary may effectively institute a minimum earnings requirement for individuals enrolling in the program.
There could, however, be a successful challenge to the Secretarys authority to adopt this alternative. Beyond the issue of whether the Secretary has authority to add terms to the definition of actively employed, concerns about tension with the statutory purpose to provide opportunities to purchase long-term care insurance to a very broad group of individuals, would apply to the heightened enrollment conditions. Yet the more detailed definition of actively employed may be on a firmer legal footing than a $12,000 minimum earnings requirement. Insofar as the active employment requirement applies only as a condition of enrollment, and not as an ongoing requirement during the vesting period,4 it would be reconcilable with the minimum earnings provision, which applies only during the vesting period.
Minimum Earnings -- Duration. The CLASS Act also specifies a time component of the minimum earnings requirement. Section 3202(6)(A)(ii) requires that an eligible enrollee earn the stated amount for at least 3 calendar years during the first 60 months for which the individual has paid premiums for enrollment in the program[.] Id. § 300ll-1(6)(A)(ii). Modified CLASS would extend the duration of the minimum earnings requirement from three calendar years to five years. The argument that the proposed five-year requirement is legally authorized focuses on the same statutory provision as the arguments in favor of the $12,000 minimum earnings amount: the provision authorizing the Secretary to create exceptions to the minimum earnings requirement. Id. § 300ll-2(6)(C). Because the analysis of that provision in the foregoing section applies equally in this context, we have reached the same conclusion for the five-year minimum earnings requirement. Although there is a plausible statutory basis for the requirement, we have concerns that there could be a successful challenge to this interpretation.
Fixed Premium Increase -- Schedule and Amount. Modified CLASS would adopt a premium schedule in which enrollees premiums rise according to a fixed rate over time. We believe that the Secretary may reasonably interpret the statute to authorize such a schedule.
Section 3203 is the principal section of the statute setting forth requirements applicable to the premiums in the CLASS program. Id. § 300ll-2. Section 3203(a)(1)(A)(i) provides, in relevant part, Beginning with the first year of the CLASS program, and for each year thereafter . . . , the Secretary shall establish all premiums to be paid by enrollees for the year based on an actuarial analysis of the 75-year costs of the program that ensures solvency throughout such 75-year period. Id. § 300ll-2(a)(1)(A)(i). Section 3203(b) further provides, with limited exceptions inapplicable here, that the amount of the monthly premium determined for an individual upon such individuals enrollment in the CLASS program shall remain the same for as long as the individual is an active enrollee in the program5Id. § 300ll-2(b)(1)(A) (emphasis supplied). We assume that under Modified CLASS, the premium schedule would be based on an actuarial analysis of the seventy-five-year costs of the program that ensured solvency throughout the seventy-five-year period. The question raised by the plans design is whether the proposed premium schedule, which rises at a fixed rate over time, satisfies the requirement that the amount of the monthly premium remain the same.
The language requiring that the monthly premium remain the same during an individuals active enrollment is unclear. One reading of the statute is that the amount of the monthly premium must be the identical amount every month throughout the individuals active enrollment. In other words, if the monthly premium is $75 when an individual enrolls, then the monthly premium must remain $75 throughout the period of active enrollment. Under this interpretation, the CLASS program could not adopt a premium schedule in which the premium amount rises over time.
There is an alternative, reasonable interpretation of the statutory provision. Under Modified CLASS, the monthly premiums rise over time, but all present and future premiums are set at the time of enrollment and do not change thereafter. In other words, when an individual enrolls in the CLASS program, he or she would receive a premium schedule that would remain in effect for as long as the individual is an active enrollee. Because the schedule is fixed or unchanging, one could reasonably argue that the amount of the monthly premium determined for an individual upon such individuals enrollment remains the same.
In Chevron, the Supreme Court held that, if a statute is silent or ambiguous, it will defer to the agencys interpretation of the statute, so long as it is reasonable. See Chevron, U.S.A., Inc. v. Natural Resources Defense Council, 467 U.S. 837, 842-43 (1984). Because of our conclusions that the statutory provision requiring premiums to remain the same is ambiguous and that it is reasonable to interpret the provision as requiring only that the monthly premium be determined and fixed at the time of enrollment, we believe that the Secretary has discretion to interpret the statute as authorizing the proposed premium schedule.
-
ENHANCED CLASS PLAN
The Enhanced CLASS Plan builds on the features of the Modified CLASS Plan. It adopts the three features analyzed above of the Modified CLASS Plan. In addition, Enhanced CLASS features two levels of cash benefit scaled to levels of functional ability. The cash benefit would decrease in amount after five claim years. Furthermore, the Enhanced CLASS Plans enrollment process would be conducted in phases, with individuals employed by large employers being given the initial opportunity to enroll.
Minimum Earnings -- Amount. For an analysis of this feature, see supra pp. 29-30.
Minimum Earnings -- Duration. For an analysis of this feature, see supra pp. 30-31.
Fixed Premium Increase -- Schedule and Amount. For an analysis of this feature, see supra pp. 31-32.
Two-Tier Benefit Structure and Decreased Benefit After Five Years. The Enhanced CLASS Plan would establish two benefit levels, one for eligible beneficiaries unable to perform two or three activities of daily living (ADLs) and one for beneficiaries unable to perform four or more ADLs. Additionally, the plan would pay 100 percent of the daily benefit for an initial period (e.g., five claim years) and then only twenty percent of the daily benefit amount for the remainder of the beneficiarys lifetime. We believe that the Enhanced CLASS Plan may adopt the proposed benefit structure if the benefits meet the minimum required benefit amount discussed below.
Under the CLASS statute, a benefit plan must include a benefit trigger for provision of benefits that requires a determination that an individual has a functional limitation such that an individual (1) is unable to perform at least two or three ADLs without substantial assistance from another individual; (2) requires substantial supervision to protect the individual from health and safety threats due to substantial cognitive impairment; or (3) has a level of functional limitation similar to that described in subparagraphs (1) or (2). 42 U.S.C. § 300ll-2(a)(1)(C). ADLs are defined as eating, toileting, transferring, bathing, dressing, and continence, as specified in the Internal Revenue Code. Id. § 300ll-1(3). The plan must pay a cash benefit that satisfies the following requirements. First, [t]he benefit amount provides an eligible beneficiary with not less than an average of $50 per day (as determined based on the reasonably expected distribution of beneficiaries receiving benefits at various levels). Id. § 300ll-2(a)(1)(D)(i). Second, [t]he benefit amount is varied based on a scale of functional ability, with not less than 2, and not more than 6, benefit level amounts. Id. § 300ll-2(a)(D)(ii). Third, [t]he benefit is paid on a daily or weekly basis. Id. § 300ll-2(a)(1)(D)(iii). Fourth, [t]he benefit is not subject to any lifetime or aggregate limit. Id. § 300ll-2(a)(1)(D)(iv).
As an initial matter, setting two benefit levels tied to two different ranges of limitations is authorized by the statutory requirement that there be at least two and not more than six benefit level amounts based on a scale of functional ability. Id. § 300ll-2(a)(1)(D)(ii). The authority to establish an initial benefit for a finite period and a decreased benefit, at twenty percent of the initial rate, to be paid for the remainder of the beneficiarys lifetime could be problematic. Its legality depends, in part, on the amount of the proposed benefits. At all times--including when individuals are receiving the initial reduced benefit--the daily cash benefit must meet the $50 per day average.6 To be clear, the statute does not require that any one beneficiary receive, on average, $50 per day during the period of beneficiary status. Rather, it requires that, on any given day, the sum total of all beneficiaries receive, on average, $50 per day. In other words, whether the $50 per day average is met is determined based on the reasonably expected distribution of beneficiaries receiving benefits at various benefit levels. Id. § 300ll-2(a)(1)(D)(i).
Assuming that that $50 per day average requirement were met, the question remains whether the reduced benefit meets the requirement that [t]he benefit is not subject to any lifetime or aggregate limit. Formally, there are no lifetime or aggregate limits, as those terms are normally understood. Undefined in the statute, in the insurance context, lifetime limit refers to a cap on the total amount of benefits, either overall or for a specific set of services, that a plan will pay for a beneficiary over the beneficiarys lifetime. See Glossary, p. 11, HealthCare.gov, http://www.healthcare.gov/glossary/04262011a.pdf (last viewed Sept. 28, 2011). Aggregate limit means the total dollar amount that a plan will pay for a beneficiary within a specified period (e.g., a plan will pay no more than $50,000 toward a beneficiarys care during a calendar year period ). See, e.g., Glossary of Insurance and Risk Management Terms, International Risk Management Institute, Inc., http://www.irmi.com/online/insurance-glossary/terms/a/aggregate-limit-of-liability.aspx (last viewed Oct. 6, 2011). Although the Enhanced CLASS Plan would reduce a beneficiarys daily benefit amount by eighty percent after a specified period of time, it would pay some benefits, free from any predetermined capped amount, throughout a beneficiarys lifetime. It can be argued that such an approach does not impose aggregate or lifetime limits.
There is, however, a sound argument that the proposed benefit reduction violates the no lifetime or aggregate limit provision. The argument would be that paying only twenty percent of the full daily benefit to a subset of the period of beneficiary status is effectively an aggregate or lifetime limit. On this view, the restriction of the full benefit to a limited period of time sets caps, or an aggregate limit, on the amount that a beneficiary may receive over time; the fact that it does so by setting a reduced percentage, rather than an absolute dollar value, is not a sufficient answer. If a plan may reduce the amount paid after a set period of time--for example, by paying $1 or two percent after the first three years7--then it can render the aggregate or lifetime limits prohibition virtually meaningless. Moreover, reducing the benefit over time, rather than starting with a lower percentage of the daily benefit amount and increasing it to the maximum, appears contrary to the purpose of the CLASS Act. The Act seeks to provide eligible individuals with the opportunity to purchase an affordable long-term care insurance plan that would provide meaningful cash benefits to help them to obtain the services and supports they need to live independently in the setting of their choice. Reducing the plans payments as individuals are likely to grow sicker runs counter to the statutory purpose.
Notwithstanding the forceful challenge that may be made to the proposed benefit structure, in light of the relevant statutory provision and the deference ordinarily accorded to the agency in interpreting such provisions, we conclude that the proposed benefit structure might be permissible. We caution that the greater the reduction in benefits over time, the more likely a challenge to the reduction as an impermissible end-run around the lifetime and aggregate limit prohibition could succeed.
Phased Enrollment. The Enhanced CLASS Plan would permit enrollment of different categories of individuals in phases. In particular, individuals working for large employers, who employ a specified minimum number of employees, or some subset of those individuals, would be able to enroll in the first phase. Other individuals, including self-employed persons and those who work for smaller employers, would be able to enroll in subsequent phases, after the initial enrollment meets a pre-set threshold. Though the statute does not expressly contemplate phased enrollment, we believe that the Secretary has statutory authority to establish phased enrollment procedures, subject to certain conditions described below. The phased enrollment process described in the Enhanced CLASS Plan would open enrollment to all statutorily-eligible individuals only if the initial group satisfied a predetermined risk profile. Because opening enrollment is subject to a condition that may never be met, this enrollment structure does not comply with the law.
Section 3204 sets forth the statutory requirements for enrollment in the CLASS program. This section requires, among other things, that the Secretary, in coordination with the Secretary of the Treasury, establish procedures to enable employers to enroll employees in the program automatically; establish alternative procedures for individuals who are self-employed, who have more than one employer, and whose employers do not elect to participate in the automatic enrollment process; and establish procedures to ensure that an individual is not automatically enrolled by more than one employer. 42 U.S.C. § 300ll-3(a)(1)-(3). Section 3204 further provides that [e]nrollment in the CLASS program shall be made in such manner as the Secretary may prescribe in order to ensure ease of administration. Id. § 300ll-3(a)(3)(B). With a limited exception inapplicable here,8 the statute is silent on the time at which individuals must be able to enroll and the duration of the enrollment period. The statute also does not establish a deadline by which the CLASS program must be fully implemented. In light of that silence, the absence of a deadline, and the Secretarys authority to establish enrollment procedures, we believe the CLASS program may institute a phased-in enrollment process, so long as the process aims to ensure ease of administration and is otherwise consistent with the statutory design of the CLASS program.
The statute does not define ease of administration. The Secretary has authority to interpret that term, and we believe it would be within her discretion to interpret it to encompass the effective and efficient functioning of the program. As we understand it, the proposed phased enrollment process is attractive for many reasons. It would allow program administrators to test actuarial projections about matters such as take-up and claim rates on a small scale, so that any necessary premium or other adjustments could be made before taking the program to a larger scale. It would also allow for a more controlled enrollment process, helping program administrators to secure a sufficient reserve of initial funds from premiums paid by individuals who are assumed to be at low risk for entering benefit status immediately after the vesting period. In addition, the efficiencies of scale that could be achieved through marketing to and enrolling employees of large employers would help make initial enrollments more manageable and control start-up expenses. All of these purposes can reasonably be interpreted to serve the aim of easing the administration of the CLASS program.
The phased enrollment process must be consistent with the statutory design of the CLASS program. To be consistent, the process would have to ensure, at a minimum, that (1) at least some representation of all classes of statutorily eligible enrollees have the opportunity to enroll in each phase; and (2) the process becomes fully open and all statutorily eligible enrollees have an opportunity to enroll within a reasonable period after start-up. Relatedly, the Secretarys obligation to designate a program that will be actuarially sound for seventy-five years cannot rest on the assumption that the program can control enrollment throughout the seventy-five-year period or any significant part of that period. To the contrary, the Secretarys designation (and the plans premium estimates) must rest on the assumption that, within a reasonable period of time, all statutorily eligible enrollees will have the opportunity to enroll in the program. The proposed phased enrollment process does not meet the two conditions, and hence would be inconsistent with the statute.
To be clear, even if a phased enrollment plan allowed some representation of all classes of statutorily eligible enrollees in each phase, it could not adopt a wait-and-see approach like the one proposed here. The requirement that the CLASS program eventually opens enrollment to all statutorily eligible individuals within a reasonable time period means that the program must be designed from the outset to do so. The phased enrollment process must ensure that the program will fully open, not that the program will fully open only if there are manageable take-up and claim rates. Making fully open enrollment contingent on the successful enrollment of only certain classes of individuals, particularly individuals who are expected to be healthier than those excluded, or certain distributions of classes of individuals, is inconsistent with the statutory scheme. The statute contemplates a program open to all statutorily eligible individuals. While the Secretarys authority to make regulations consistent with the title and to prescribe enrollment procedures can reasonably be interpreted to permit her to have enrollment proceed in phases--particularly if doing so were deemed necessary to adopt an actuarially sound and fiscally solvent program--we do not believe that authority extends to making certain statutorily eligible individuals ability to enroll in the program contingent upon specific enrollment or fiscal criteria goals being met. Because the proposed phased enrollment process would not provide certainty that all eligible individuals will be able to enroll in the program within a reasonable time, we conclude that there is no statutory basis for this type of approach.9
-
FAMILY OF OPTIONS PLAN (MODIFIED CLASS PLAN + SCHEDULED INCREASING BENEFIT PLAN)
The Family of Options Plan would establish the statutorily required CLASS Independence Benefit Plan as a single plan that has two plan options within it: the Modified CLASS Plan and the Scheduled Increasing Benefit Plan. Any individual enrolling in the Partnership Plan would have the option to enroll in the plan that he or she prefers. While a reasonable argument can be made that the statute allows the designated plan to encompass multiple plan options, we believe that at least one plan option must be consistent with all of the statutory requirements, and both plan options must, at a minimum, be consistent with the statutory requirements applicable to cash benefits and eligible beneficiaries. Because the Scheduled Increasing Benefit Plan option conflicts with those requirements, we do not believe that there is legal authority for the proposed Family of Options Plan.
Family of Options. Section 3203(a)(1) of the CLASS Act directs the Secretary to develop at least three actuarially sound alternative plans for designation as the CLASS Independence Benefit Plan. Id. § 300ll-2(a)(1). Each of the plan alternatives must be designed to provide eligible beneficiaries with the benefits described in section 3205 consistent with a set of requirements concerning premium amounts, a five-year vesting period, benefit triggers, and a cash benefit. Id. Section 3205 establishes that the plan shall provide three types of benefits: the cash benefit established by the Secretary in accordance with the requirements of section 3203, advocacy services to assist beneficiaries with accessing the appeals process and complying with the annual recertification process, and advice and assistance counseling.10Id. § 300ll-4(b)(1)-(3).
The statute is silent on the question of whether there may be a family of options under one plan, and we believe the Secretary has discretion to designate such a plan, subject to certain conditions. According to section 3203, the plan shall be designed to provide eligible beneficiaries with the benefits described in section 3205 [concerning the three types of benefits described above] consistent with the requirements in section 3203 concerning premiums, vesting period, benefit triggers, and the cash benefit. Id. § 300ll-2(a)(1). We understand that the family of plans design rests on the assumption that one option would satisfy all of the statutory requirements in sections 3203 and 3205 while the other option need not. The argument here is that section 3203 establishes only that the designated plan provides a set of benefits consistent with the section 3205 requirements, not that the specified benefits exhaust the range of permissible options, or constitute the only benefits that a plan may provide. In other words, the designated plan must be designed, at a minimum, to provide the specified benefits, but it may, in addition, provide other benefits that need not be consistent with sections 3203 and 3205. Because the statute is silent on this issue, and a reasonable argument can be made that such an interpretation is consistent with the statute, we have concluded that the Secretary has authority to designate such a plan.
We have two caveats to our conclusion. First, as mentioned above, at least one of the plans must satisfy the statutory requirements in section 3203 concerning premiums, vesting period, benefit triggers, and the cash benefit and in section 3205 related to plan benefits. Second, in light of the appropriations provisions of the CLASS Act, for any plan option, the Secretarys discretion to stray from the statutory requirements concerning the cash benefit and eligible beneficiaries is limited. In particular, in each plan option, the cash benefit must meet the statutory requirements applicable to cash benefits, see id. §§ 300ll-2(a)(1)(D), 300ll-4 (b)(1) ($50 per day average minimum, rising annually with the CPI-U percentage increase; two to six benefit levels, scaled to functional ability; daily or weekly payments; and no lifetime or aggregate limits), and the cash benefits may be paid only to beneficiaries who meet the statutory definition of eligible beneficiaries. See id. § 300ll-1(6) (prescribing, for example, the minimum earnings requirement).
Section 3206(a) establishes the CLASS Independence Fund, which receives all premiums and any unpaid, accrued benefits that have been recouped, as well as any investment gains from those moneys. Id. § 300ll-5(a). Section 3206(a) further provides that the amounts held in the fund are appropriated and shall remain available for three purposes: to be held for investment on behalf of individuals enrolled in the CLASS program; to pay administrative expenses associated with the Fund and its investments; and to pay cash benefits to eligible beneficiaries under the CLASS Independence Benefit Plan. Id. (emphasis supplied). It is a cardinal principle of appropriations law that appropriated funds may be used only for the purposes specified in federal law. See, e.g., 31 U.S.C. § 1301(a) (Appropriations shall be applied only to the objects for which the appropriations were made except as otherwise provided in law.); General Accounting Office, GAO-04-261SP, Principles of Federal Appropriations Law 4-6 - 4-13 (3d ed. 2004). Though one might argue that the appropriations provision authorizes any cash benefits that are paid to any individuals who have enrolled in and achieved beneficiary status under the plan designated by the Secretary, we think that that argument is unpersuasive. The statute makes clear in its definitions section that the term eligible beneficiary in the Act has the meaning prescribed in section 3202(6). Although the statute does not include the term cash benefit in its definitions section, the statute frequently references the term, and courts generally do not approve of agencies defining terms one way in one part of the statute and a different way in another part. See Sullivan v. Stroop, 496 U.S. 478, 484 (1990) (applying the normal rule of statutory construction that identical words used in different parts of the same act are intended to have the same meaning (internal quotations omitted)). Accordingly, we conclude that the appropriations provisions mean that the designated CLASS plan may pay only those cash benefits that meet the prescribed statutory standards to eligible beneficiaries who also meet the prescribed statutory standards.
Modified CLASS + Scheduled Increasing Benefit. The Family of Options Plan would offer the Modified CLASS Plan and the Scheduled Increasing Benefit Plan.11 We do not, however, believe that the Family of Options Plan satisfies the essential statutory requirements of the CLASS Independence Benefit Plan. First, the plan rests on the assumption that one of the plan options, the Modified CLASS Plan, satisfies the specified statutory requirements. It is unclear, however, whether this option does so. The Modified CLASS Plan includes a minimum earnings requirement of $12,000, a requirement that that amount be earned during the first five years of enrollment, and an indexed monthly premium that rises at a fixed rate of 2.8 percent. As described above, although there is a plausible statutory basis for a $12,000, five-year minimum earnings requirement, we have concerns that there could be a successful challenge to this requirement. See supra pp. 29-31.
Second, the Scheduled Increasing Benefits option would not satisfy the requirements applicable to cash benefits. Incorporating the increased minimum earnings requirement and the fixed schedule of premium increases of the Modified CLASS Plan, the Scheduled Increasing Benefit Plan would provide benefits for a maximum of three claim years. It would provide for a low daily cash benefit amount to beneficiaries who become eligible to claim benefits within the first twenty years of enrollment. The available daily benefit would rise by a set amount each year for twenty years until it reached a maximum of $150 per day. To be more specific, if enrollees were to receive benefits in the sixth year of enrollment (i.e., in the first possible year to qualify after the five-year vesting period), individuals with functional limitations in two or three ADLs would receive benefits of $20 per day and individuals with four or more ADL limitations, $24 per day.12 The benefit amounts would rise each year by $6.50, plus a three percent automatic compound inflation (ACI) factor. Without taking inflation into account, if that enrollee were to receive benefits during the seventh year of enrollment, the individual would receive a benefit of $26.50 per day; during the ninth year of enrollment, a daily benefit of $39.50 ($20 + ($6.50 * 3)). In the twenty-sixth year of enrollment, without taking inflation into account, the daily benefit would reach its maximum amount of $150 and would remain at that level in subsequent years.13 Beneficiaries with two or three functional ADLs who begin receiving benefits before their twenty-fourth year of enrollment would never receive the maximum, however, because the benefit term would be only thirty-six months.
The three-year benefit term would violate the statutory prohibition on lifetime limits for cash benefits. 42 U.S.C. § 300ll-2(a)(1)(D)(iv). Additionally, unless the benefits provided in the Modified CLASS Plan are sufficiently high to compensate for the low initial daily benefits in the Scheduled Increasing Benefit Plan, the Family of Options Plans benefits would violate the $50 per day average minimum requirement. See id. § 300ll-2(a)(1)(D)(i). Even if the requirement were met, it bears emphasis that this benefit structure is likely inconsistent with the statute in another way. The CLASS Acts stated purpose is to provide beneficiaries with tools that will allow them to ensure their personal and financial independence and exercise their options to live in the community for as long as possible. See id. § 300ll. Because initial daily benefit amounts that are as low as $20 or $24 may well be inadequate to ensure any meaningful level of services or supports for an individual with substantial functional limitations, setting benefits that low would likely be seen as defeating the statutory purpose.
As discussed above, the family of plans approach may allow some deviation from the statutory requirements unrelated to cash benefits and eligible beneficiaries for one plan if the other plan meets all the statutory requirements. We have concerns about whether the Modified CLASS Plan meets all the statutory requirements. Even if it does, the Scheduled Increasing Benefits option violates the prohibition of lifetime limits on the cash benefit. Accordingly, we conclude that there is no legal authority for the Family of Options Plan.
-
TEMPORARY EXCLUSION PLAN
The Temporary Exclusion Plan would impose a fifteen-year waiting period for the receipt of benefits on enrollees whose functional limitations that trigger benefits result from a serious health condition that existed at the time of enrollment. We believe that there is no legal authority to implement the Temporary Exclusion Plan.
The CLASS Act sets forth detailed criteria concerning the minimum earnings and premium payments requirements that an active enrollee must meet to become an eligible beneficiary, the benefit triggers that allow for the provision of benefits, and the process of determining eligibility. As discussed above, concerning minimum earnings and premium payment requirements, section 3202(6) provides that, in order to become an eligible beneficiary, an active enrollee must have paid premiums for at least sixty months and have met other earnings and premium payment requirements. Id. § 300ll-1(6)(A). With respect to benefit triggers, section 3203 provides that benefits are triggered when an individual is determined to be unable to perform a specific number of ADLs or is determined to have the requisite level of cognitive impairment. Id. § 300ll-2(a)(1)(C).
Concerning eligibility determinations, the statute requires the Secretary to establish procedures under which an active enrollee may apply for benefits. Id. § 300ll-4(a)(1). The statute further provides that [a]n active enrollee shall be deemed presumptively eligible if the enrollee:
- has applied for, and attests is eligible for, the maximum cash benefit under [the plan];
- is a patient in a hospital (but only if the hospitalization is for long-term care), nursing facility, intermediate care facility for the mentally retarded, or an institution for mental diseases; and
- is in the process of, or about to begin the process of, planning to discharge from the hospital, facility or institutions, or within 60 days from the date of discharge from the hospital, facility, or institution.
Id. § 300ll-4(a)(1)(C).
The statute does not explicitly address whether the CLASS Plan may impose a waiting period for receipt of benefits on enrollees whose functional limitations resulted from serious health conditions at the time of enrollment. Although it might be possible to argue that the statutes silence on the issue means that the Secretary has authority to establish a waiting period, we think that such a waiting period is inconsistent with the statute. While the statutory provision concerning benefit triggers does not specify that a functional limitation determination triggers immediate benefits, another provision states that [b]enefits shall be paid to, or on behalf of, an eligible beneficiary beginning with the first month in which an application for such benefits is approved. Id.§ 300ll-4(b)(3). Although the Secretary has the authority to establish procedures for the application process, the statute does not permit her to delay the approval of any applicants, including those with serious health conditions at the time of enrollment. The statute prescribes very detailed criteria concerning eligible beneficiary status and benefit triggers. Establishing any additional factors for eligibility, or that would delay eligibility, is precluded by the clarity with which Congress spoke on this issue. Likewise, in authorizing the Secretary to prescribe regulations for the eligibility determination process, nowhere does the statute discuss, or even intimate, waiting periods for individuals with serious health conditions at the time of enrollment. To the contrary, the statute explicitly addresses the eligibility of enrollees who have been hospitalized for long-term care or have been patients in nursing facilit[ies], intermediate care facilit[ies] for the mentally retarded, or institution[s] for mental disease. Id. § 300ll-4(a)(1)(C). In making such enrollees presumptively eligible for receipt of benefits, the statute aims to make access to benefits for them easier, rather than more difficult. Put another way, one of the statutes underlying assumptions is that individuals who have already demonstrated a need for long-term care or live with intellectual disabilities, developmental disabilities, or mental illness deserve benefits in an expedited fashion. As the statute aims to help individuals purchase insurance that will provide them with monetary benefits to help them secure the long-term care options of their choice, a requirement that eligible beneficiaries who have an immediate need for long-term care after the vesting period wait fifteen years before receiving benefits is at cross-purposes with the statutory objectives and the plain language of the statute.
Another provision of the statute, which prohibits underwriting, also supports the argument that the proposed waiting period is inconsistent with the statute. Section 3203(b)(3) provides in relevant part that [n]o underwriting (other than on the basis of age . . .) shall be used to (A) determine the monthly premium for enrollment in the CLASS program; or (B) prevent an individual from enrolling in the program. Id. § 300ll-2(b)(3) It is true that the waiting period does not technically violate this prohibition; individuals with health conditions that lead to functional limitations may enroll in the program, and their monthly premium is not determined by the health condition. Yet, the waiting period conflicts with the prohibitions underlying goal. The waiting period treats individuals with specific health conditions at the time of application differently than individuals without such conditions while the underwriting prohibition seeks to make all factors other than age irrelevant to an individuals ability to participate in and benefit from the program. Accordingly, we conclude that there is no authority under the CLASS Act for a plan to adopt the proposed waiting period.14
-
TEMPORARY EXCLUSION PLAN WITH PHASED ENROLLMENT
This plan combines the Temporary Exclusion Plan with the phased enrollment feature. Consistent with our prior analysis, see supra pp. 39-41 (Temporary Exclusion), pp. 34-36 (Phased Enrollment), because of the incorporation of the fifteen-year waiting period for pre-existing conditions, we do not believe that there is legal authority to implement this plan.
-
LIMITED INITIAL BENEFIT PLAN WITH PHASED ENROLLMENT
With the exception of its benefit structure, this plan is the same as the Enhanced CLASS Plan with Phased Enrollment, the Limited Initial Benefit Plan would provide a very low benefit amount to individuals who become eligible for benefits in the first twenty years of their enrollment. Enrollees who become eligible after the twentieth year of enrollment would receive a $50 per day average benefit. We believe that this plan is inconsistent with the statute.
Limited Initial Benefit. The Limited Initial Benefit Plan with Phased Enrollment would offer one or two benefit levels. Because the statute requires at least two benefit level amounts, scaled to functional ability, see 42 U.S.C. § 300ll-2(a)(1)(D)(ii), we assume, for purposes of this analysis, that the plan offers two such benefit level amounts. If a beneficiary were to enter benefit at any time during the first twenty years after enrollment, the beneficiary would receive a low benefit, for example, $5 or $10 per day, for each benefit level, respectively. Thereafter, beneficiaries would receive a regular benefit, for example $50 to $60 per day, for each benefit level. The proposed benefit structure is inconsistent with the statute because of its effect on the first twenty years of the programs operation. As discussed above, the CLASS Act requires that the cash benefit amount meet or exceed the $50 per day average, taking into account the reasonably expected distribution of beneficiaries receiving benefits at various benefit levels, for the first year in which beneficiaries receive benefits under the plan. Id. § 300ll-2(a)(1)(D)(i). For each subsequent year, the benefit amount must increase by not less than the percentage change in CPI-U over the previous year. Id.§ 300ll-4(b)(1)(B). The Limited Initial Benefit plans proposal to provide initial low daily benefits would not satisfy this requirement. During the first twenty years of the plans operation, all enrollees that become eligible for beneficiary status would receive only the limited $5 or $10 per day. Because both of those amounts are less than $50, it would be impossible for the per day average to meet the minimum requirement. Moreover, as with the Scheduled Increasing Benefits Plan, see supra pp. 38-39, the Limited Initial Benefit structure is inconsistent with the statutes purpose. Because initial daily benefit amounts that are as low as $5 of $10 would be inadequate to ensure any meaningful level of services or supports for an individual with substantial functional limitations, setting benefits that low would defeat the statutory purpose to provide beneficiaries with tools that will allow them to ensure their personal and financial independence and exercise their options to live in a community for as long as possible. See 42 U.S.C. § 300ll. Accordingly, we conclude that there is no statutory authority for the Limited Initial Benefit Plan with Phased Enrollment.
-
PRE-PAID BENEFIT PLAN
The Pre-Paid Benefit Plan rests on two basic assumptions. First, because the CLASS program is voluntary, a disproportionate number of people who are at high risk of needing long-term care services will enroll. Second, nearly every enrollee will become eligible for benefits shortly after vesting. To ensure the financial viability of the program, the Pre-Paid Benefit Plan would set the premium level for each individual to cover the expected payout for that individual; in other words, individuals would essentially pre-pay their benefits. Similar to the Enhanced CLASS Plan, the Pre-Paid Benefit Plan would provide beneficiaries with 100 percent of the daily benefit amount for the first five claim years and twenty percent of the daily benefit amount thereafter. We have concluded that the Pre-Paid Benefit Plan is not consistent with the statute.
Section 3203(a)(1)(A)(i) of the CLASS Act requires the Secretary to set initial premiums based on an actuarial analysis of the 75-year costs of the program that ensures solvency throughout such 75-year period. Id. § 300ll-2(a)(1)(A)(i). Subject to limited exceptions not relevant here, the statute requires that the amount of the monthly premium determined for an individual upon such individuals enrollment in the CLASS program shall remain the same for as long as the individual is an active enrollee in the program. Id. § 300ll-2(b)(1)(A). In addition, the statute requires that there be a nominal premium, not to exceed $5 per day, to be paid by the poorest individuals and actively employed full-time students. Id. § 300ll-2(a)(1)(A)(ii).
The Pre-Paid Benefits Plan would establish a premium at the time of an individuals enrollment, and the premium would not change. We understand that because the plan would not control for adverse selection and assumes that nearly everyone who enrolls will receive benefits shortly after vesting, the plan would have to set the premium between $400 and $3,000 per month in order to be actuarially sound. Though such premium might satisfy the Secretarys obligation to set initial premiums based on actuarial analysis to ensure solvency for seventy-five years and would meet the requirement that the premium remain the same, it does not account for a nominal premium. The statute explicitly creates a nominal premium for individuals with incomes below the poverty line and actively employed full-time students, and does not authorize a waiver or elimination of the nominal premium. Id. § 300ll-2(a)(1)(A)(ii). In fact, it requires the Secretary to maintain a nominal premium even if the standard premium rate must be adjusted to ensure the solvency of the program. See id. § 300ll-2(b)(1)(B)(i) (authorizing the Secretary to adjust premiums as necessary upon a showing that the premiums will be inadequate to meet the twenty-year demands of the program but maintaining a nominal premium for enrollees whose income is below the poverty line or who are full-time students actively employed). Because the Pre-Paid Benefits Plan violates the statutory provision for a nominal premium, it is inconsistent with the statute.
Decreasing Benefit After Five Claim Years. For an analysis of this feature, see supra pp. 32-34.
Section Two: Overall Analysis
Legal Risks
In our analysis thus far, we have principally analyzed the legality of each of the plans individual features. Some proposed features, such as the two-tier benefit structure and the fixed rate of premium increase, fall within the Secretarys authority to implement the CLASS Act. Some other features, such as the temporary exclusion, the prepaid plan premium, and the limited initial benefit, fall outside the Secretarys authority. Whether the Secretary has legal authority to adopt many of the other features, such as the five-year, $12,000 minimum earnings requirement and the phased enrollment process, is not clear. Although there are arguments that can be made that the Secretary can implement those features, there are also arguments, and in some cases strong arguments, that she cannot. As we have described above, our view on the legal permissibility of each of those features varies along a spectrum.
Concerning the legal risks that would accompany implementing any of these plans, it bears emphasis that the more features of a plan that are on questionable legal grounds, the greater the risk of a successful legal challenge to the plan, because each aspect of a particular CLASS plan would have to be lawful in order for the plan to be sustained. As we understand it, the proposed features deviating from or going beyond a plain reading of the statutory language help to minimize the solvency risks and thereby contribute to the actuarial soundness of a plan. But as the plans incorporate more features of a questionable legality to improve the risks against solvency, they increase the risks that such plans, if challenged, would be invalidated. Finally, we turn now to an analysis of what would occur if, for any reason, HHS needed to shut down the CLASS program.
Program Shutdown
While the designated CLASS Plan is operational, solvency or legal problems may prevent the CLASS Program from continuing to implement the plan. The Secretary might determine that the CLASS plan could no longer be reasonably expected to remain solvent, even if she were to make statutorily authorized changes to the plan, or a court might conclude that the designated CLASS Benefit Plan violates the CLASS Act. In those circumstances, there is substantial uncertainty about both what the Secretary would have authority to do and what a court would require. If such a circumstance occurred, there is a risk that the CLASS program would have to be entirely shut down, rather than simply closed to future enrollment, and then-existing enrollees or eligible beneficiaries would have no opportunity to receive the anticipated benefits, although it is possible--though by no means guaranteed--that they may be able to recoup some portion of their paid premiums.
The Secretary and the statutorily created Board of Trustees for the CLASS Independence Fund have a continuing obligation to monitor and take steps to ensure the solvency of the program. See 42 U.S.C. §§ 300ll-2(b)(1)(B), 300ll-5(a)(2), 300ll-7(a), 300ll-7(d)(5). Based on actual take-up or claims rates, rather than the ones that were originally assumed when the program was developed and tested for solvency, the Secretary and the Board might conclude that the program will become insolvent and the reasonable premium increases or other means authorized by the statute are inadequate to avoid insolvency. The statute requires the Secretary and the Board to submit annual reports to Congress on the CLASS program and fund, and to recommend legislative action as they deem to be appropriate. Id. §§ 300ll-5(a)(2)(C), 300ll-7(d)(5). For the Board of Trustees, the statute expressly provides that it should recommend legislative action, including whether to adjust monthly premiums or impose a temporary moratorium on new enrollments. Id. § 300ll-5(c)(2)(C). There are no guarantees, however, that Congress will enact any legislative changes necessary to ensure program solvency. Absent any necessary legislative changes, the Secretary might conclude that it is necessary to close down, at least in part, the then-operational plan.
The Secretary might also reach that conclusion because of a court decision. If a court concluded that the designated plan violated the statute, a court might order a range of remedies, from simply invalidating specific elements found to violate the statute to shutting down the entire program. The remedy required will depend in significant part on the nature and extent of the violation. Even if a court only invalidated specific features, such as the heightened minimum earnings requirement or the phased enrollment process, and did not order closure of the CLASS program, the Secretary might nonetheless conclude that there is no statutorily authorized manner in which the CLASS program could proceed and remain solvent.
Under any of these circumstances, the Secretary might prefer to close the CLASS program to future enrollment while leaving the existing program intact, insofar as it already has enrollees or beneficiaries and could remain solvent. This preference might be motivated by a concern that wholesale closure of the program could leave enrollees or beneficiaries worse off than they would have been had they never enrolled in the CLASS program. In particular, enrollees who would have bought private long-term care insurance in the absence of the CLASS plan might no longer be unable to purchase such insurance after the CLASS program terminates because of health conditions that developed after they had enrolled in the CLASS program, or because their more advanced age at termination may make the premiums that they would now have to pay for private insurance unaffordable. Yet whether the Secretary would be permitted by a court, or has the independent authority to choose, to close the CLASS program only for new enrollments is not clear.
The CLASS Act itself does not define the scope of the Secretarys authority in this context. It specifies only that she must submit an annual report to Congress and include [r]ecommendations for such administrative or legislative action as the Secretary determines is necessary to . . . ensure the solvency of the program. Id. § 300ll-7(d)(5). It is true that the statute has a general provision requiring the Secretary to promulgate such regulations as are necessary to carry out the CLASS program in accordance with this title. Id. § 300ll-7(d)(5). We think that that authority may reasonably be interpreted to include shutting down the program, if the program cannot be made solvent through statutorily authorized changes. It is less clear whether that provision would authorize the Secretary to keep the program operational for existing enrollees or beneficiaries while imposing a moratorium on future enrollments. The statutes express reference to that option as legislative action that the Board of Trustees should recommend, if appropriate, could support the view that continued operation of the program, with the moratorium, requires legislative action.15 In any event, as stated above, the Secretarys authority to allow the continued operation of the program for individuals already enrolled, or in beneficiary status, at the time of the decision would likely depend in part on the features of the program.
Beyond the CLASS Act, other relevant sources also do not illuminate what the Secretary may do, or may be required to do. On the one hand, an argument can be made that, insofar as the government contracts to provide individuals with benefits in exchange for premium payments, it may not unilaterally repeal the contract. On this view, although the CLASS program could halt future enrollment, it would have to honor its contract with enrollees, or at least active beneficiaries, to provide benefits. Lynch v. United States, 292 U.S. 571 (1934), provides some support for this view. There, after Congress enacted the Economy Act, the relevant section of which provided that all laws granting or pertaining to yearly renewable term insurance are hereby repealed, beneficiaries of war risk insurance policies challenged the United States refusal to pay out on their policies. Id. at 575 (quoting 38 U.S.C. § 717). The United States responded by claiming that, through the Economy Act provision, it had withdrawn its consent to suit for claims relating to the insurance policies. Id. The Supreme Court, however, rejected the United States argument, holding instead that the Economy Act repealed laws establishing or governing insurance policies, not laws waiving sovereign immunity for the purpose of making claims under those policies that were otherwise authorized. Id. at 585. In reaching its decision, the Court stated in dicta that Congress [is] without power to reduce expenditures by abrogating contractual obligations of the United States. To abrogate contracts, in the attempt to lessen government expenditure, would be not the practice of economy, but an act of repudiation. Id. at 580.
On the other hand, an argument can also be advanced that the CLASS program may be closed in its entirety. Courts have broad remedial powers and may shut down programs that lack statutory authority. The less the CLASS plan resembles the plan envisioned by the statute, the more reasonable it would be for a court to order the plan shut down in its entirety. Lynch, moreover, does not address whether the government must continue to honor its obligations under an insurance program; it simply interpreted the Economy Act to address the question of sovereign immunity. Even if a court were to conclude that the government was obliged, in some way, to honor its contractual obligations, the court could use its equitable power not to force the program to remain in operation for existing enrollees and beneficiaries, but instead to order the distribution of, or direct the Secretary to distribute, the amounts held in the CLASS Independence Fund among enrollees, beneficiaries, and any other relevant parties. This possibility is heightened by the statutes express prohibition on the use of any federal funds from a source other than premiums to pay for benefits.
The CLASS program, if implemented, might be required to disclose these uncertainties to potential enrollees. Although such disclosures might make marketing the program more challenging and impair the chances that any of the potential plans would be solvent, the disclosures would dispel any claims that the CLASS program had misled the public or had encouraged reliance on its program under false pretenses.
Accordingly, we conclude that there is substantial uncertainty about what would follow if solvency or legal problems prevented the CLASS program, once operational, from continuing to implement the plan. We cannot with any confidence predict that the CLASS program would be able to honor its commitments to individuals who had already enrolled or entered beneficiary status in the program, or avoid leaving them worse off, or that such individuals would be able to recoup their paid premiums.
Notes
-
Memo from Richard S. Foster, CMS Office of the Actuary, April 22, 2010, Estimated Financial Effects of the Patient Protection and Affordable Care Act, as Amended.
-
The initial plan was to set up an independent CLASS Office in HHS. Secretary Sebelius sent letters to key members of Congress alerting them about the organizational change being contemplated. (See Appendix B for copies of the letters.) It was subsequently decided for budget and management reasons to establish the CLASS Office within the Administration on Aging.
-
This occurs for two reasons: first, persons who are likely to go on claim early are unlikely to enroll in an option that pays a small benefit during the initial years of the policy. Second, even if the CLASS Partnership option is selected against, the smaller payouts and three year duration of the benefit significantly bound the actuarial risk.
-
There is a colorable argument that the Secretary could establish active employment as an ongoing requirement during the vesting period. Upon stating the four conditions for enrollment, including the active employment requirement, section 3204(d) states that [n]othing in this title shall be construed as requiring an active enrollee to continue to satisfy one of the four conditions, which concerns taxable income. 42 U.S.C. § 300ll-3(d). In light of that provision, one might argue that the Secretary may require active enrollees to continue to satisfy the other three conditions, including active employment status. However, for the reasons discussed above, we have concerns about whether doing so in order to adopt a minimum earnings requirement for the vesting period would survive a challenge.
-
Section 3203(b)(1)(B) authorizes the Secretary to adjust premiums if certain types of information show that an adjustment is necessary to ensure the solvency of the program. Id. § 300ll-2(b)(1)(B). We do not consider these adjustments in our analysis of this feature.
-
The CLASS Act provides that the per day average benefit amount will increase by CPI-U in years subsequent to the first year in which enrollees receive benefits. 42 U.S.C. § 300ll-4(b)(1)(B). For ease of reference, we refer to the $50 per day average benefit based on the assumption that it takes into account this mandatory statutory increase.
-
Of course, the plan would still have to meet the average $50 per day requirement. However, it could do so, even with a $2 per day limit, by raising the full benefit by a sufficient amount.
-
See id. § 300ll-3(g) (requiring the Secretary to establish enrollment procedures for individuals who opted out of enrolling when they were first eligible, and specifying that the individuals enrollment periods may not occur more frequently than biennially).
-
Because the phased enrollment process would prevent otherwise statutorily-eligible individuals from enrolling immediately in the CLASS program, there is a significant likelihood that such a process would incur a legal challenge.
-
Advice and assistance counseling includes the provision of information about assistive technology, accessing and coordinating services and supports, and accessing other Federal benefit programs for which a beneficiary may be eligible. Id. § 300ll-4(e).
-
Another proposed family of options, the Enhanced CLASS plan plus the Scheduled Increasing Benefit plan, was also presented. The analysis of each of the individual plans and the overall family of plans containing those options reaches the same conclusions as the analysis above. Therefore, we do not present that analysis separately.
-
For clarity, we perform the computations for the 4+ ADL benefit level in footnote 13.
-
The yearly increase amount for the benefit level corresponding to 4+ ADLs is $7.80. This would result in a daily benefit of $39.60 for a beneficiary who claims benefits in year seven of enrollment and $55.20($24 + (7.80 * 3)) in year nine. The maximum daily benefit for a beneficiary with 4+ ADL limitations is $180. All figures are subject to increase by the 3 percent ACI factor in each subsequent year.
-
We note that the proposed waiting period might also be understood to raise civil rights concerns under section 504(a) of the Rehabilitation Act of 1974, which applies to federally conducted programs. That section provides, in relevant part, that [n]o otherwise qualified individual . . . shall, solely by reason of her or his disability, be excluded from the participation in, be denied the benefits of, or be subjected to discrimination under any program or activity receiving Federal financial assistance or under any program or activity conducted by any Executive agency [.] 29 U.S.C. § 794(a). Although section 504 does not explicitly address insurance programs, section 504s prohibition has been interpreted in a manner similar to the prohibition on disability discrimination in the Americans with Disabilities Act (ADA), 42 U.S.C. §§12101 et seq. See, e.g., Bragdon v. Abbott, 524 U.S. 624, 631 (1998) (holding that the ADAs and Rehabilitation Acts discrimination prohibition should be interpreted similarly). Section 501(c) of the ADA explicitly provides that the Act does not prohibit entities that administer bona fide insurance or benefit plans from underwriting, classifying, or administering risks. 42 U.S.C. § 12201(c). Those actions, however, must be based on evidence that distinctions are necessary to ensure a plans viability or to prevent untenable premium increases or benefits decreases, and may not be used as subterfuge to get around the ADAs nondiscrimination provisions. Id.
In its guidance on the applicability of the ADA to employer-provided benefits, the Equal Employment Opportunity Commission (EEOC) stated that not all health-based distinctions are disability-based. See EEOC Compliance Manual, Chapter 3: Benefits (Oct. 3, 2000), available at http://www.eeoc.gov/policy/docs/benefits.html#III.Disability-Based Distinctions. Generally, a health-related distinction in a benefit plan is not disability-based if it broadly applies to a multitude of dissimilar conditions, and constrains both individuals with disabilities and individuals without disabilities. Id. Of particular relevance here, the EEOC provided, as an example of a program that would not involve a disability-based distinction, a long-term disability plan that placed a six-month waiting period for all pre-existing conditions. Id. The waiting period would apply to all individuals who have a pre-existing health condition, regardless of whether it leads to a disability. By contrast, a health-based pre-existing condition requirement that singled out a particular disability (e.g., HIV infection), a discrete group of disabilities (e.g., cancers), or disability in general (all individuals with disabilities) would be a disability-based distinction.
In light of the EEOC guidance, we believe that a reasonable argument can be made that the proposed CLASS plan waiting period does not involve a disability-based distinction and thus does not implicate the Rehabilitation Act. The proposed waiting period broadly applies to a multitude of dissimilar conditions and would be in place for individuals with health conditions that lead to disabilities, regardless of whether the individuals eventually develop those disabilities. In any event, even if the waiting period were understood to involve a disability-based distinction, the waiting period would be permissible if, consistent with section 501, the CLASS program could show that it is necessary to ensure the plans viability or to prevent untenable premium increases or benefit decreases; a showing that the waiting period is necessary to ensure the fiscal solvency of the program would be sufficient.
-
One could counter, however, that that provision has no bearing on the Secretarys authority under the CLASS Act. On this view, while legislative action might be necessary to require the Secretary to freeze enrollment, it would not be necessary to authorize the Secretary, in her judgment, to freeze enrollment.
Appendices
Appendix A: Key Provisions of Title VIII of the ACA, Which Establishes the Class Program
The key provisions of Title VIII of the ACA, which establishes the CLASS program, include:
-
Enrollment:
-
Eligibility: Those eligible to enroll in CLASS include most adults (age 18 and above) who are actively employed. Individuals whose earnings are not subject to the Social Security tax are not eligible to enroll. No underwriting is required for enrollment.
-
Process: Employers may choose to automatically enroll their eligible employees, but must allow those employees to waive enrollment. An alternative enrollment procedure must be established for eligible individuals to whom automatic enrollment is not available, who are self-employed, or who have more than one employer.
-
Subsequent enrollment opportunities: Individuals who waive enrollment during the year of their initial eligibility to enroll may subsequently elect to enroll only during an open enrollment period that may not occur more frequently than biennially.
-
Disenrollment: Enrollees may only disenroll from the program during an annual disenrollment period.
-
Reenrollment: Individuals may reenroll after a lapse in enrollment, but must pay an age-adjusted premium and, in some cases, a penalty.
-
-
Premiums:
-
Basis for setting program-wide premiums: The Secretary must establish premiums to be paid by enrollees that will ensure solvency throughout the next 75 years. In addition, the Secretary is required to adjust premiums if they are projected to be insufficient for the upcoming 20-year period. In determining premiums, the Secretary may factor in an amount not to exceed 3% of all premiums paid during the year for administrative expenses.
-
Basis for setting individual premiums: Premiums may be based on age, but underwriting may not be used to determine premiums.
-
Nominal premium: Enrollees whose income is below the poverty line or who are full-time students under age 22 qualify for a nominal premium of $5 per month (2009 dollars), increasing by the CPI annually.
-
Premium adjustments: In general, the scheduled amount of an individual’s monthly premium is to remain the same for the duration of the individual’s enrollment. However, those premiums may change if required for solvency, or if an individual reenrolls after a lapse in enrollment. Enrollees who are age 65 or older, have been enrolled for at least 20 years, and are not actively employed are exempt from solvency-related premium adjustments; in addition, the Secretary is required to maintain a nominal premium for those eligible.
-
Premium payment: Employers may deduct premium payments from their enrolled employees’ pay; alternative payment methods must also be established for individuals working for employers who chose not to participate in the program and the self-employed.
-
-
CLASS Independence Fund:
-
The Fund is to be established as a trust fund within the U.S. Treasury. All premiums and investment income from the premiums is to be credited to the Fund. The Fund is available to pay benefits and administrative expenses for the CLASS Program.
-
-
Benefit eligibility:
In order to qualify for CLASS benefits, individuals must:
-
Be an active enrollee in the CLASS program;
-
Have paid premiums for at least 60 months. In addition, if the individual has ever had a lapse in premium payments of more than three months since enrollment, at least 24 consecutive months of premium payment are required;
-
Have satisfied a minimum earnings requirement. The law sets this requirement as the amount that an individual must have earned to be credited with a quarter of coverage under Social Security (currently $1,120), to be earned with respect to at least three calendar years that occur during the first 60 months for which the individual has paid premiums for enrollment in the program. However, the law allows the Secretary to specify exceptions to this requirement for certain populations; and
-
Have a functional limitation that is expected to last for a continuous period of more than 90 days. A functional limitations is defined as:
- Inability to perform a minimum number of activities of daily living without substantial assistance from another individual. (The Secretary must determine whether the minimum number is 2 or 3.); or
- Requiring substantial supervision to protect the individual from threats to health and safety due to substantial cognitive impairment; and
- A level of functional limitation similar to either of those described above (as defined by regulation).
-
-
Eligibility assessments:
-
By January 1, 2012, the Secretary must establish an Eligibility Assessment System, which will be the entity that is responsible for providing assessments of CLASS enrollees who apply for benefits. The law designates certain institutionalized enrollees to be presumptively eligible for benefits.
-
-
Designation of benefit plan:
-
The Secretary is required to develop at least three actuarially sound benefit plans and submit them to the CLASS Independence Advisory Council. By October 1, 2012, after taking into account the recommendation from the CLASS Independence Advisory Council, the Secretary must publish her designation, the plan details, and the reasons for the selection in a final rule that allows for a period of public comment.
-
-
Benefit plan:
-
The CLASS Independence Benefit Plan includes a cash benefit, advocacy services, and, if requested by the beneficiary, advice and assistance counseling.
-
The cash benefit must average at least $50/day, based on the expected distribution of benefits among individuals receiving benefits at different benefit levels. The benefit amount will be increased by CPI annually.
-
Benefit amounts are to be determined based on a scale of functional ability, with at least 2 but not more than 6 benefit levels.
-
The benefit may be paid on a daily or weekly basis. Benefits may roll over month-to-month but not year-to-year, and beneficiaries may elect to receive a lump-sum payment of their rolled-over benefits.
-
The benefit is not subject to any lifetime or aggregate limit.
-
The cash benefit is to be paid into a Life Independence Account of an eligible beneficiary. The beneficiary must be allowed to access the account through a debit card.
-
Benefits may be used to purchase nonmedical services and supports that the beneficiary needs to maintain independence, as well as assistance with decision making concerning medical care.
-
Nothing in the law can be interpreted to prevent benefits from being paid to family caregivers.
-
No taxpayer funds may be used to pay benefits.
-
For individuals enrolled in both CLASS and Medicaid, CLASS is the primary payer. The law limits the amount of the cash benefit a Medicaid beneficiary may retain; the rest of the benefit is applied toward the cost of care paid by Medicaid.
-
-
Three advisory groups:
-
The CLASS Independence Advisory Council
- Duties: Evaluate the alternative benefit plans developed by the Secretary and recommend one for designation by the Secretary as the CLASS Independence Benefit Plan, and provide ongoing advice to the Secretary on matters of general policy in the administration of the CLASS Program, including its financial solvency and monthly premium.
- Membership: 15 individuals appointed by the President for a three-year term
-
The Board of Trustees for the CLASS Independence Fund
- Duties: Holding the CLASS Independence Fund, reporting to Congress annually on the operation and status of the Fund, reporting to Congress any time the Fund is not actuarially sound, and reviewing and recommending policies followed in managing the Fund.
- Membership: The Secretaries of Treasury, Labor, and Health and Human Services, and two members of the public who are nominated by the President and confirmed by the Senate for a term a four years.
-
The Personal Care Attendants Workforce Advisory Panel
- Duties: Examine and advise the Secretary and Congress on the broad aspects of workforce issues related to personal care attendant workers in all long term care programs and settings. This panel has responsibilities that go well beyond the CLASS Act per se.
- Membership: Unspecified number of individuals appointed by the Secretary
-
-
Protection and advocacy/advice and assistance counseling:
-
By January 1, 2012, the Secretary must enter into an agreement with the Protection and Advocacy System for each state to provide eligible beneficiaries under CLASS with advocacy services, and enter into agreements with public and private entities to provide eligible beneficiaries under CLASS with advice and assistance counseling upon request from the beneficiaries.
-
Appendix B: HHS Letters to Congress About Intent to Create Independent Class Office
JUL 28, 2010
TO: The Secretary
Through: DS
COS
ES
FROM: Assistant Secretary for Aging
SUBJECT: Establishment of the Office of Community Living Assistance Services and Supports -- ACTION
Action Requested by: ASAP
ISSUE
The Assistant Secretary for Aging requests that the Secretary approve the establishment of a new office within the Office of the Secretary, which will be assigned the following interim name, the Office of Community Living Assistance Services and Supports (CLASS Office). At a later date, HHS may decide to change this name to something that will be “catchier” and reflect key goals of the program.
DISCUSSION
HHS has been entrusted with the responsibility for implementing many major provisions of the Affordable Care Act of 2010, which the President signed into law on March 23, 2010. In order to efficiently and effectively implement the provisions of Title VIII, the Community Living Assistance Services and Supports Act (CLASS), it is necessary to create an office that has as its primary focus the implementation and management of this new and innovative program.
The new office will be responsible for establishing and administering the CLASS program. CLASS is a voluntary, federally administered long-term care financing plan that will be supported by individual premium contributions. CLASS will provide participating adults needing long-term services and supports a flexible source of funds that can be used to purchase goods and services aimed at helping them remain independent. The CLASS Office will establish the national voluntary insurance program, set premiums, set rules for enrollment and eligibility systems, and specify and design the benefit. It will also establish systems for advice and assistance and support a protection and advocacy network to serve beneficiaries of the program. In addition, the CLASS Office will convene and support two Federal Advisory Committees, the Personal Care Attendants Workforce Advisory Panel and the CLASS Independence Advisory Council. It is anticipated that the Office will coordinate with a number of public and private entities including: 1) the Department of Treasury, which will convene and support the Board of Trustees of the CLASS Independence Fund and maintain the CLASS Independence Fund; 2) the Social Security Administration; 3) employers; and 4) state Medicaid agencies.
Initial funding for the new program will come from the funds appropriated to administer health reform activities. Once the program is fully operational, administrative services will be funded from premium income as set out in the statute (under a 3 percent cap).
The CLASS Office will begin with staff detailed on a volunteer basis from HHS and other Departments, along with new federal staff we expect to bring on very quickly. It will work closely with the Office on Disability, the Administration on Aging, the Administration for Children and Families, the Centers for Medicare & Medicaid Services, and other organizations within HHS to ensure coordination with existing programs.
The new CLASS program and the proposed office will play an important role in helping Americans to take steps to protect their independence if they experience disability in the future.
RECOMMENDATION
I recommend that you approve this new Office and indicate your approval below.
Kathy Greenlee
SECRETARIAL DECISION
Approved: X Disapproved: Date: AUG -4 2010
Kathleen Sebelius
August 5, 2010
The Honorable Tom Harkin
Chairman
Subcommittee on Labor, Health and Human Services, Education and Related Agencies
Committee on Appropriations
United States Senate
Washington, D.C. 20510
Dear Chairman Harkin:
I am writing to inform you of the Department of Health and Human Services’ (HHS) plan to establish an office to administer the Community Living Assistance Services and Supports Act (CLASS Office) within the Office of the Secretary.
HHS has been entrusted with the responsibility for implementing many major provisions of the Affordable Care Act of 2010, which the President signed into law on March 23, 2010. In order to efficiently and effectively implement the provisions of Title VIII, the Community Living Assistance Services and Supports Act (CLASS), we find it necessary to create an office that has as its primary focus the implementation and management of this new and innovative program.
The new office will be responsible for establishing and administering the CLASS program. CLASS is a voluntary, federally administered long-term care financing plan that will be supported by individual premium contributions. CLASS will provide participating adults needing long-term services and supports a flexible source of funds that can be used to purchase goods and services aimed at helping them remain independent. The CLASS Office will establish the national voluntary insurance program, set premiums, set rules for enrollment and eligibility systems, and specify and design the benefit. It will also establish systems for advice and assistance to eligible beneficiaries on accessing services, and support a protection and advocacy network to serve beneficiaries of the program. In addition, the CLASS Office will convene and support two Federal Advisory Committees, the Personal Care Attendants Workforce Advisory Panel and the CLASS Independence Advisory Council. It is anticipated that the Office will coordinate with a number of public and private entities including: 1) the Department of Treasury, which will convene and support the Board of Trustees of the CLASS Independence Fund and maintain the CLASS Independence Fund; 2) the Social Security Administration; 3) employers; and 4) state Medicaid agencies.
Initial administrative funding for the new program will come from the funds appropriated to administer health reform activities. Once the program is fully operational, administrative services will be funded from premium income as set out in the statute, with a three percent limit on premium income that can be used for administrative costs.
The CLASS Office will begin with staff detailed on a volunteer basis from HHS and other Departments, along with new federal staff we expect to bring on very quickly. It will work closely with the Administration on Aging, the Office on Disability, the Administration for Children and Families, the Centers for Medicare & Medicaid Services, and other organizations within HHS to ensure coordination with existing programs.
The new CLASS program and the proposed office will play an important role in helping enrollees to take steps to protect their independence if they experience disability.
In appreciate your continued interest in and support of the Department’s programs. I have sent identical letters to Senator Cochran, Chairman Obey, and Representative Tiahrt.
Sincerely,
Kathleen Sebelius
August 5, 2010
The Honorable Thad Cochran
Ranking Minority Member
Subcommittee on Labor, Health and Human Services, Education and Related Agencies
Committee on Appropriations
United States Senate
Washington, D.C. 20510
Dear Senator Cochran:
I am writing to inform you of the Department of Health and Human Services’ (HHS) plan to establish an office to administer the Community Living Assistance Services and Supports Act (CLASS Office) within the Office of the Secretary.
HHS has been entrusted with the responsibility for implementing many major provisions of the Affordable Care Act of 2010, which the President signed into law on March 23, 2010. In order to efficiently and effectively implement the provisions of Title VIII, the Community Living Assistance Services and Supports Act (CLASS), we find it necessary to create an office that has as its primary focus the implementation and management of this new and innovative program.
The new office will be responsible for establishing and administering the CLASS program. CLASS is a voluntary, federally administered long-term care financing plan that will be supported by individual premium contributions. CLASS will provide participating adults needing long-term services and supports a flexible source of funds that can be used to purchase goods and services aimed at helping them remain independent. The CLASS Office will establish the national voluntary insurance program, set premiums, set rules for enrollment and eligibility systems, and specify and design the benefit. It will also establish systems for advice and assistance to eligible beneficiaries on accessing services, and support a protection and advocacy network to serve beneficiaries of the program. In addition, the CLASS Office will convene and support two Federal Advisory Committees, the Personal Care Attendants Workforce Advisory Panel and the CLASS Independence Advisory Council. It is anticipated that the Office will coordinate with a number of public and private entities including: 1) the Department of Treasury, which will convene and support the Board of Trustees of the CLASS Independence Fund and maintain the CLASS Independence Fund; 2) the Social Security Administration; 3) employers; and 4) state Medicaid agencies.
Initial administrative funding for the new program will come from the funds appropriated to administer health reform activities. Once the program is fully operational, administrative services will be funded from premium income as set out in the statute, with a three percent limit on premium income that can be used for administrative costs.
The CLASS Office will begin with staff detailed on a volunteer basis from HHS and other Departments, along with new federal staff we expect to bring on very quickly. It will work closely with the Administration on Aging, the Office on Disability, the Administration for Children and Families, the Centers for Medicare & Medicaid Services, and other organizations within HHS to ensure coordination with existing programs.
The new CLASS program and the proposed office will play an important role in helping enrollees to take steps to protect their independence if they experience disability.
In appreciate your continued interest in and support of the Department’s programs. I have sent identical letters to Chairman Harkin, Chairman Obey, and Representative Tiahrt.
Sincerely,
Kathleen Sebelius
August 5, 2010
The Honorable David R. Obey
Chairman
Subcommittee on Labor, Health and Human Services, Education and Related Agencies
Committee on Appropriations
House of Representatives
Washington, D.C. 20515
Dear Chairman Obey:
I am writing to inform you of the Department of Health and Human Services’ (HHS) plan to establish an office to administer the Community Living Assistance Services and Supports Act (CLASS Office) within the Office of the Secretary.
HHS has been entrusted with the responsibility for implementing many major provisions of the Affordable Care Act of 2010, which the President signed into law on March 23, 2010. In order to efficiently and effectively implement the provisions of Title VIII, the Community Living Assistance Services and Supports Act (CLASS), we find it necessary to create an office that has as its primary focus the implementation and management of this new and innovative program.
The new office will be responsible for establishing and administering the CLASS program. CLASS is a voluntary, federally administered long-term care financing plan that will be supported by individual premium contributions. CLASS will provide participating adults needing long-term services and supports a flexible source of funds that can be used to purchase goods and services aimed at helping them remain independent. The CLASS Office will establish the national voluntary insurance program, set premiums, set rules for enrollment and eligibility systems, and specify and design the benefit. It will also establish systems for advice and assistance to eligible beneficiaries on accessing services, and support a protection and advocacy network to serve beneficiaries of the program. In addition, the CLASS Office will convene and support two Federal Advisory Committees, the Personal Care Attendants Workforce Advisory Panel and the CLASS Independence Advisory Council. It is anticipated that the Office will coordinate with a number of public and private entities including: 1) the Department of Treasury, which will convene and support the Board of Trustees of the CLASS Independence Fund and maintain the CLASS Independence Fund; 2) the Social Security Administration; 3) employers; and 4) state Medicaid agencies.
Initial administrative funding for the new program will come from the funds appropriated to administer health reform activities. Once the program is fully operational, administrative services will be funded from premium income as set out in the statute, with a three percent limit on premium income that can be used for administrative costs.
The CLASS Office will begin with staff detailed on a volunteer basis from HHS and other Departments, along with new federal staff we expect to bring on very quickly. It will work closely with the Administration on Aging, the Office on Disability, the Administration for Children and Families, the Centers for Medicare & Medicaid Services, and other organizations within HHS to ensure coordination with existing programs.
The new CLASS program and the proposed office will play an important role in helping enrollees to take steps to protect their independence if they experience disability.
In appreciate your continued interest in and support of the Department’s programs. I have sent identical letters to Representative Tiahrt, Chairman Harkin, and Senator Cochran.
Sincerely,
Kathleen Sebelius
August 5, 2010
The Honorable Todd Tiahrt
Ranking Minority Member
Subcommittee on Labor, Health and Human Services, Education and Related Agencies
Committee on Appropriations
House of Representatives
Washington, D.C. 20510
Dear Representative Tiahrt:
I am writing to inform you of the Department of Health and Human Services’ (HHS) plan to establish an office to administer the Community Living Assistance Services and Supports Act (CLASS Office) within the Office of the Secretary.
HHS has been entrusted with the responsibility for implementing many major provisions of the Affordable Care Act of 2010, which the President signed into law on March 23, 2010. In order to efficiently and effectively implement the provisions of Title VIII, the Community Living Assistance Services and Supports Act (CLASS), we find it necessary to create an office that has as its primary focus the implementation and management of this new and innovative program.
The new office will be responsible for establishing and administering the CLASS program. CLASS is a voluntary, federally administered long-term care financing plan that will be supported by individual premium contributions. CLASS will provide participating adults needing long-term services and supports a flexible source of funds that can be used to purchase goods and services aimed at helping them remain independent. The CLASS Office will establish the national voluntary insurance program, set premiums, set rules for enrollment and eligibility systems, and specify and design the benefit. It will also establish systems for advice and assistance to eligible beneficiaries on accessing services, and support a protection and advocacy network to serve beneficiaries of the program. In addition, the CLASS Office will convene and support two Federal Advisory Committees, the Personal Care Attendants Workforce Advisory Panel and the CLASS Independence Advisory Council. It is anticipated that the Office will coordinate with a number of public and private entities including: 1) the Department of Treasury, which will convene and support the Board of Trustees of the CLASS Independence Fund and maintain the CLASS Independence Fund; 2) the Social Security Administration; 3) employers; and 4) state Medicaid agencies.
Initial administrative funding for the new program will come from the funds appropriated to administer health reform activities. Once the program is fully operational, administrative services will be funded from premium income as set out in the statute, with a three percent limit on premium income that can be used for administrative costs.
The CLASS Office will begin with staff detailed on a volunteer basis from HHS and other Departments, along with new federal staff we expect to bring on very quickly. It will work closely with the Administration on Aging, the Office on Disability, the Administration for Children and Families, the Centers for Medicare & Medicaid Services, and other organizations within HHS to ensure coordination with existing programs.
The new CLASS program and the proposed office will play an important role in helping enrollees to take steps to protect their independence if they experience disability.
In appreciate your continued interest in and support of the Department’s programs. I have sent identical letters to Chairman Obey, Chairman Harkin, and Senator Cochran.
Sincerely,
Kathleen Sebelius
Appendix C: Federal Register Announcement Establishing CLASS Office
Page 5178 Federal Register / Vol. 76, No. 19 / Friday, January 28, 2011 / Notices
=======================================================================
DEPARTMENT OF HEALTH AND HUMAN SERVICES
Administration on Aging
Statement of Organization, Functions, and Delegations of Authority
This reorganization of AoA establishes the Office of Community Living Assistance Services and Supports (Office of CLASS) and in doing so, capitalizes on the agency’s current administrative structures for purposes of implementing the Community Living Assistance Services and Supports Act (CLASS Act).
FOR FURTHER INFORMATION CONTACT: Dan Berger, Administration on Aging, Washington, DC 20201, telephone 202-357-3419.
This notice amends Part B of the Statement of Organization, Functions, and Delegations of Authority of the Department of Health and Human Services (HHS), Administration on Aging (AoA), as last amended at 75 FR 18219-18228, dated April 9, 2010, as follows:
I. Under Part B, Section B.10 Organization, insert the following: “Office of Community Living Assistance Services and Supports (Office of CLASS) (BC).”
II. Under Part B, Section B.20 Functions, establish a new Chapter BC, “Office of Community Living Assistance Services and Supports (Office of CLASS)” to read as follows:
Chapter BC, Office of Community Living Assistance Services and Supports (Office of CLASS)
BC.00 Mission
BC.10 Organization
BC.20 Functions
BC.00 Mission. The Office of Community Living Assistance Services and Supports (Office of CLASS) is the office with a primary focus on the efficient and effective implementation and management of the provisions of Title VIII of the Affordable Care Act of 2010--the Community Living Assistance Services and Supports Act (CLASS Act).
BC.10 Organization. The head of the Office of CLASS reports to the Assistant Secretary for Aging.
BC.20 Functions. The Office of CLASS will play an important role in helping working adults who meet benefit eligibility requirements protect their independence and remain in the community through a cash benefit to purchase long-term services and supports. The responsibilities of the Office of CLASS include: Establishing the national voluntary insurance program; setting premiums; developing and implementing rules for enrollment and eligibility systems; specifying and designing the benefit; establishing systems for advice and assistance; supporting a protection and advocacy network to serve eligible beneficiaries of the program; paying benefits and handling related responsibilities; convening and supporting two Federal Advisory Committees (the Personal Care Attendants Workforce Advisory Panel and the CLASS Independence Advisory Council); and liaising and coordinating with a number of public and private entities, including the Department of the Treasury, the Social Security Administration, employers, and state Medicaid agencies.
Dated: January 25, 2011.
Kathy Greenlee,
Assistant Secretary for Aging.
[FR Doc. 2011-1903 Filed 1-27-11; 8:45 am]
BILLING CODE 4154-01-P
Appendix D: CLASS Office Organizational Chart
CONFIDENTIAL -- NOT FOR DISTRIBUTION
Office of Community Living Assistance Services and Supports
FIRST (TOP) LEVEL
CLASS Administrator: Kathy Greenlee.
The Office of Actuarial Integrity and Benefit Design and Office of Communications branch off CLASS Administrator.
Program Policy also branches off CLASS Administrator.
SECOND LEVEL
From CLASS Administrator: Chief Operating Officer and Special Advisor
From Program Policy: Advisory Councils and Board
THIRD LEVEL
From Chief Operating Officer and Special Advisor: the Office of Marketing and Employer Outreach; the Office of Benefits Administration and Enrollee Services; the Office of Information Systems; the Office of Program Integrity, Evaluation, and and Compliance; and the Office of Regulatory Affairs
From Advisory Councils and Board: works with Office of Regulatory Affairs
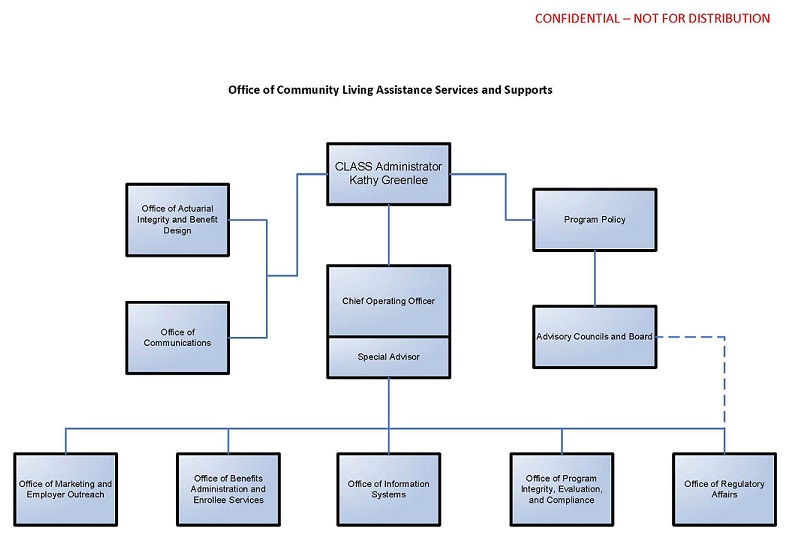
Appendix E: CLASS Process Flow Chart
High-Level CLASS Process Design
CLASS Action: Benefit Design
#1 Hire Actuary; leads to #2.
#2 Design Benefit Plans; leads to #18.
#3 Determine Information to the collected from the system; leads to #13.
CLASS Action: Communication
#4 Determine Communication Platforms and Means; leads to #5.
#5 Develop Communication Tools and Messaging; leads to #6 and #9.
#6 Enact Communication Strategy.
CLASS Action: Marketing
#7 Complete an Needs Assessment; leads to #8 and #11.
#8 Hire a Support Contractor; leads to #9.
#9 Develop an Marketing Strategy; leads to #5 and #10.
#10 Enact Strategy.
CLASS Action: IT
#11 IT System Planning; leads to #7 and #12
#12 Hire a Support Contractor; leads to #13.
#13 Design the system; leads to #14.
#14 Develop the System; leads to #15.
#15 Test the System; leads to #16.
#16 Implement the System; leads to #10.
CLASS Action: Benefits Administration
#17 Conduct Analysis; leads to #18.
#18 Develop Program Details; leads to #19, #21, and #25.
#19 Finalize Program Details; leads to #9 and #23.
CLASS Action: Regulations
#20 Prepare for Regulatory Process; leads to #21.
#21 Issue Draft Regulations/Rules; leads to #22.
#22 Get Pulbic Input; leads to #19, #23, and #29
#23 Isue Final Regulations/Rules; leads to #6 and #16.
CLASS Action: FACA Committee
#24 Name FACA Committee Members; leads to #25.
#25 Receive Updates/Provide input into Program Details.
CLASS Action: Office Administration
#26 Become a Recognized Offie; leads to #27.
#27 Finalize Delegation of Authority; leads to #21.
CLASS Action: Program Integrity
#28 Benchmark Against Similar Programs; leads to #29.
#29 Determine CLASS Policies; leads to #30.
#30 Train CLASS Staff on Policies
CLASS Action: Board of Trustees
#31 Name Trustees
For Internal Discussion Only
Appendix F: Federal Register Announcement for CLASS Independence Advisory Council
Page 70005-70006 Federal Register / Vol. 75, No. 220 / Tuesday, November 16, 2010 / Notices
=======================================================================
DEPARTMENT OF HEALTH AND HUMAN SERVICES
Establishment of the Independence Advisory Council
AGENCY: Department of Health and Human Services.
ACTION: Notice.
-----------------------------------------------------------------------
Authority: The Independence Advisory Council is authorized under section 3207 of the Affordable Care Act, Public Law 111-148. The Council is governed by provisions of Public Law 92-463, as amended, (5 U.S.C. App. 2), which sets forth standards for the formation and use of advisory committees.
SUMMARY: The U.S. Department of Health and Human Services announces establishment of the Independence Advisory Council, as directed by section 3207 of Public Law 111-148.
FOR FURTHER INFORMATION CONTACT: Sue McElheny, U.S. Department of Health and Human Services; Tel (202) 357-3521, Fax (202) 357-3467, classprogram@hhs.gov.
SUPPLEMENTARY INFORMATION: Under the Affordable Care Act, Public Law 111-148, the President directed that the Council shall be established within the Department of Health and Human Services (HHS). To comply with the authorizing directive and guidelines under the Federal Advisory Committee Act (FACA), a charter has been filed with the Committee Management Secretariat in the General Services Administration (GSA), the appropriate committees in the Senate and U.S. House of Representatives, and the Library of Congress to establish the Council as a non-discretionary Federal advisory committee. The Secretary signed the charter on November 9, 2010. The charter was filed on November 9, 2010.
Objectives and Scope of Activities. The CLASS Independence Advisory Council is the Department's statutory public advisory body on matters of general policy in the administration of the CLASS program in the Affordable Care Act. The Council will provide the Secretary of Health and Human Services with advice and guidance on the development of the CLASS Independence Benefit Plan, the determination of monthly premiums under such plan, and the financial solvency of the program. In these matters, the Council shall consult with all components of the Department, other federal entities, and non-federal organizations, as appropriate; and examine relevant data sources.
Membership and Designation. The CLASS Independence Advisory Council shall consist of not more than 15 individuals, not otherwise in the employ of the United States who shall be appointed by the President without regard to the civil service laws and regulations; and a majority of whom shall be representatives of individuals who participate or are likely to participate in the CLASS program, and shall include representatives of older and younger workers, individuals with disabilities, family caregivers of individuals who require services and supports to maintain their independence at home or in another residential setting of their choice in the community, individuals with expertise in long-term care or disability insurance, actuarial science, economics, and other relevant disciplines, as determined by the Secretary.
The members of the CLASS Independence Advisory Council shall serve overlapping terms of 3 years (unless appointed to fill a vacancy occurring prior to the expiration of a term, in which case the individual shall serve for the remainder of the term). A member shall not be eligible to serve for more than 2 consecutive terms. The President shall, from time to time, appoint one of the members of the CLASS Independence Advisory Council to serve as the Chair. All members will serve as special government employees. All members, while so serving away from their homes or regular places of business, may be allowed travel expenses, including per diem in lieu of subsistence, in the same manner as such expenses are authorized by Section 5703, Title 5, U.S. Code, for employees serving intermittently.
Nominations shall be submitted to U.S. Department of Health and Human Services, c/o Administration on Aging, Attn: Class Nominations, Washington, DC, 20201 (or) classprogram@hhs.gov (or) fax (202) 357-3467 no later than December 1, 2010.
Administrative Management and Support. HHS will provide funding and administrative support for the Council to the extent permitted by law within existing appropriations. Staff will be assigned to a program office established to support the activities of the Council. Management and oversight for support services provided to the Council will be the responsibility of the CLASS Office. All executive departments and agencies and all entities within the Executive Office of the President shall provide information and assistance to the Council as the Chair may request for purposes of carrying out the Council's functions, to the extent permitted by law. A copy of the Council charter can be obtained from the designated contacts or by accessing the FACA database that is maintained by the GSA Committee Management Secretariat. The Web site for the FACA database is http://fido.gov/facadatabase/.
Dated: November 10, 2010.
Kathy Greenlee,
Assistant Secretary for Aging.
[FR Doc. 2010-28781 Filed 11-15-10; 8:45 am]
BILLING CODE 4150-05-P
Appendix G: Personal Care Attendants Workforce Advisory Panel
Appendix Ga: Federal Register Announcement for Personal Care Attendants Workforce Advisory Panel
Page 34140-34141 Federal Register / Vol. 75, No. 115 / Wednesday, June 16, 2010 / Notices
=======================================================================
DEPARTMENT OF HEALTH AND HUMAN SERVICES
Establishment of the Personal Care Attendants Workforce Advisory Panel
AGENCY: Community Living Assistance Services and Supports (CLASS) Office, Department of Health and Human Services.
ACTION: Notice.
-----------------------------------------------------------------------
Authority: The Personal Care Attendants Workforce Advisory Panel is authorized under section 8002 of the Affordable Care Act, Pub. L. 111-148. The Committee is governed by provisions of Pub. L. 92-463, as amended, (5 U.S.C. App. 2), which sets forth standards for the formation and use of advisory committees.
SUMMARY: The U.S. Department of Health and Human Services announces establishment of the Personal Care Attendants Workforce Advisory Panel, as directed by section 8002 of Public Law 111-148.
FOR FURTHER INFORMATION CONTACT: Margaret Reiser, Department of Health and Human Services; Telephone (202) 690-7858, Fax (202) 690-7383.
SUPPLEMENTARY INFORMATION: Under the Affordable Care Act, Public Law 111-148, the President directed that the Committee shall be established within the Department of Health and Human Services (HHS). To comply with the authorizing directive and guidelines under the Federal Advisory Committee Act (FACA), a charter has been filed with the Committee Management Secretariat in the General Services Administration (GSA), the appropriate committees in the Senate and U.S. House of Representatives, and the Library of Congress to establish the Commission as a non-discretionary Federal advisory committee. The Secretary signed the charter on June 4, 2010. The charter was filed on June 7, 2010.
Objectives and Scope of Activities. The Personal Care Attendants Workforce Advisory Panel is the Department's statutory public advisory body on personal care attendant workforce issues related to the Community Living Assistance Services and Supports (CLASS) Act in the Affordable Care Act. With sensitivity to policy considerations and priorities, the Committee will provide advice and guidance on issues related to the adequacy of the number of personal care attendant workers, the salaries, wages, and benefits, and access to the services provided by personal care attendant workers. The Committee shall assist and advise the Department on personal care attendant workforce policy as it pertains to the Department, States, local governments and the private sector.
Membership and Designation. The Secretary is soliciting nominations for appointment to the 15-member Advisory Panel from among members of the general public who are individuals who have distinguished themselves in the fields of long-term services and supports; aging and disability populations and services; practices that help reduce high personal care attendant workforce vacancy and turnover rates; Medicaid, Medicare, the Older Americans Act and the Workforce Investment System; community residential services; and policy analysis and development related to the financing, access, provision and quality of health care services. Each member of the Advisory Panel shall be appointed for a term of 2 years. Nominations shall be submitted to Margaret Reiser, U.S. Department of Health and Human Services, Office of the Assistant Secretary for Planning and Evaluation, 200 Independence Avenue, SW., Room 415F, Washington, DC, 20201 no later than June 18, 2010. Any vacancy on the Advisory Panel shall not affect its powers, but shall be filled in the same manner as the original appointment was made. An individual chosen to fill a vacancy shall be appointed for the unexpired term of the member replaced. A Chair will be designated from among its members. Members who are selected from the Federal sector to fill positions on the Committee will be classified as regular government employees. The Committee members who are selected from the public and/or private sector will be classified as special government employees.
Administrative Management and Support. HHS will provide funding and administrative support for the Committee to the extent permitted by law within existing appropriations. Staff will be assigned to a program office established to support the activities of the Committee. Management and oversight for support services provided to the Committee will be the responsibility of the CLASS Office. All executive departments and agencies and all entities within the Executive Office of the President shall provide information and assistance to the Committee as the Chair may request for purposes of carrying out the Committee's functions, to the extent permitted by law.
A copy of the Commission charter can be obtained from the designated contacts or by accessing the FACA database that is maintained by the GSA Committee Management Secretariat. The Web site for the FACA database is http://fido.gov/facadatabase/.
Dated: June 10, 2010.
Donald B. Moulds,
Acting Assistant Secretary for Planning and Evaluation.
[FR Doc. 2010-14447 Filed 6-15-10; 8:45 am]
BILLING CODE 4150-05-P
Appendix Gb: Advisory Panel List of Members
CLASS Personal Care Attendants Workforce Advisory Panel
Contact Roster
Appendix I: CLASS Administration Systems Analysis and RFI
Community Living Assistance Services and Supports (CLASS) Request for Information: Enrollment and Premium Administration System and Services
The Community Living Assistance Services and Supports Office (CLASS) is releasing this Request for Information (RFI) with the intent of soliciting information from well-qualified vendors who are capable of providing high-quality systems and services in the areas of enrollment and premium administration on a large scale. The ideal vendor should possess the skills and ability to provide, configure, integrate and manage business and technology solutions for CLASS.
Responses
Responses should include detailed information about your experience in providing the services discussed in this RFI. Specific examples from your current and past client base are especially helpful. As this is not a Request for Proposals (RFP), partial responses will be accepted so if you have particular expertise in one area (e.g., premium administration) and not others, we encourage you to respond on that one topic.
In addition to the requested information within this document, please include the following information with your response:
- Name and address of your firm.
- Two points of contact, including: name, title, phone, fax and e-mail address.
- Ownership of the firm, indicating whether it is a: large, small, small disadvantaged, 8(a), women-owned, HUBZone, and/or veteran-owned business.
- Number of years in business.
- Please provide up to three current or past (within 5 years) performance references of similar programs or projects. Include the size and type of the contract, if your company was the prime contractor, and a description of services provided.
- What is your experience providing and implementing a national system of this size and scope and what risks are inherent in such implementations? If you do have experience implementing a similar system, please discuss if you have a commercial (including commercially available off-the- shelf with modifications) or non-developmental system that could meet the needs as described in this RFI.
- Specify what types of additional information you would need in order to provide a thorough response to an RFP.
- Please estimate how much time you would need to prepare a response to an RFP.
- Please estimate how much time you would need from the date of award to be ready to accept enrollments in the system.
Interested small businesses are encouraged to respond to this notice and vendors are encouraged to provide evidence that they can comply with FAR 52.219-14 (“Limitations on Subcontracting”).
This is not an RFP. Proposals are not requested at this time and will not be considered or accepted. Do not include any pricing information with your response. A determination on how, or if, to proceed with this requirement will be based in part upon responses to this RFI and will be solely within the discretion of the government and based on its needs and requirements. You do not have to respond to this RFI in order to respond to any future RFP.
The government may request to meet one-on-one with selected respondents who provide responses to this RFI for a more in-depth discussion. We anticipate scheduling one-on-one discussions with firms responding to this RFI within 30 days after the RFI’s due date.
Any information you submit in response to this RFI is voluntary. The information gathered from this RFI will be used to improve and enhance our understanding of the industry’s current capabilities and practices and will potentially help us craft an RFP. Please note that HHS often receives requests under the Freedom of Information Act to publicly disclose information it receives from industry. If you consider anything you provide us to be confidential, proprietary or otherwise protected from public disclosure, you must clearly identify and mark it as such.
We recommend that firms planning to respond to this RFI register their e-mail addresses on the Federal Business Opportunities (FedBizOpps or FBO) website at http://www.fbo.gov to receive notices of any changes as they are uploaded to the website, or information on a future Request for Proposals.
Response Format
Submissions shall be no more than 40 pages (12 pt font) in length. The cover page, table of contents and past performance references are exempted from this requirement.
Please mark all submissions with the RFI reference number, HHS-AOA-RFI-11-001. Submissions are due July 8, 2011 by 4:00 p.m. Eastern Time. We request that 5 copies of your submission be mailed or delivered to:
Cristy Frazier, Contract Specialist
Division of Acquisition Management B
Strategic Acquisition Service, PSC, HHS
Parklawn Building, Room 5C-18
5600 Fishers Lane
Rockville, Maryland 20857
Voice: 301-443-9359
Fax: 301-443-3849
Please also send your submission electronically in Microsoft Word file format to Cristy Frazier at cristy.frazier@psc.hhs.gov; again, please reference the RFI number in the subject line. Please note that excessively large documents and/or numerous attachments may not be deliverable through the HHS email system.
Questions
Please submit in writing any questions related to this RFI to Cristy Frazier, Contract Specialist at cristy.frazier@psc.hhs.gov . Questions must be received by June 20, 2011 by 4:00 p.m. Eastern Time. Responses to all of the questions will be provided to all interested vendors via the FedBizOpps page by June 27, 2011.
Points of Contact for this RFI
Primary point of contact:
Cristy Frazier, Contract Specialist
E-mail: cristy.frazier@psc.hhs.gov
Phone: 301-443-9359
Secondary point of contact:
Jennifer Browning, Contract Specialist
E-mail: jennifer.browning@psc.hhs.gov
Phone: 301-442-3025
Background
HHS is responsible for implementing many of the provisions in the Affordable Care Act of 2010. CLASS is one of those provisions. It is a new national, voluntary, federally-administered insurance program. Within HHS, the Administration on Aging (AoA) will set premiums, benefits, and rules for enrollment and benefit eligibility.
CLASS is not available yet. The law requires the Secretary of Health and Human Services to designate the CLASS benefit plan by October 1, 2012. Enrollment will begin sometime after that announcement. Once CLASS is available, eligible working adults age 18 or older will be able to voluntarily enroll in this new program either directly or through their employers.
Individuals who enroll and meet specific requirements regarding functional limitation, earnings, and premium payment will be eligible to receive benefits to help them remain independent. Details on enrollment, premiums and benefits are being developed and are not available at this time.
Please visit http://www.aoa.gov/class for additional information on CLASS.
Requirements and Requested Information
To accomplish our mission, we are gathering information on three sets of activities: enrollment, premium administration, and program management. In addition, if an RFP is offered in the future, we may include an additional option for claims. In each of the below sections, we describe our anticipated requirements and the requested information for a response to this RFI. The requested information will help us better clarify requirements in the future.
Provide and Administer an Enrollment System
Requirements
- Provide and manage a registration/enrollment process for employers and individuals.
- Provide and administer a web-based enrollment system.
- Interact with external databases during the enrollment process to confirm eligibility status, and on a periodic basis thereafter to update individual enrollee earnings information.
- Interface with participating employers to facilitate/perform enrollments.
- Provide online tools to assist individuals with decision-making, including a premium calculator.
- Manage a free-look/opt-out process where enrollees have a certain number of days to cancel a new enrollment with return of any premiums paid.
- Process changes to existing enrollments.
- Maintain accounting of enrollments, including tracking of individual enrollee vesting and earnings requirement statuses.
- Provide web-based enrollee self-service functionality, to include the ability to view account information (including vesting/earning requirement statuses and claims information) and change demographic information and premium payment methods.
- Manage disenrollment processes.
- Manage reenrollment processes.
- Integrate with the premium administration system and with a future claims system, which may be included as an additional option in a future RFP.
Requested Information
- What is your experience performing large-scale enrollment of individuals and employer-based groups via a web-based enrollment system and phone-based customer service representatives?
- Describe the size, complexity, staffing levels and infrastructure requirements of past efforts.
- Did your approach and methods for enrolling individuals differ from your approach and methods for enrolling employer-based groups?
- What strategies have you found to be most effective in guiding the user experience during enrollment?
- Discuss your approaches for interfacing with employers, brokers, benefit consultants and third-party administrators to conduct enrollments.
- What is necessary to process enrollment files and/or eligibility files received from employers?
- Can you provide insights/thoughts into how group enrollments could take place without receipt of an eligibility file from an employer?
- Employees automatically enrolled through their employer will have the option to waive participation. Discuss your experiences with such a process.
- Discuss possible approaches for interactions with external databases, including government databases, to verify information (e.g., earnings/self-employment income) required to complete an enrollment in real time.
- Discuss your experience in developing decision support tools for insurance benefits. What methods and tools have you found most useful?
- Discuss your experiences in integrating an enrollment system with a claims system, which may be included as an additional option in a future RFP.
Provide and Administer a Premium Administration System
Requirements
- Calculate premium amounts due per enrollee based on premium tables and business rules provided by HHS.
- Collect premiums via employer payroll systems, including transmission of bill files, payment files, and reconciliation files.
- Collect premiums directly from individuals through direct bill, automatic bank withdrawal, credit/debit card, and online electronic funds transfer options.
- Remit premiums collected to the government as directed by HHS.
- Manage premium payment changes, such as in payroll location, payment method, or amount.
- Identify and resolve processing and premium payment errors.
- Maintain accounting of premiums due, collected and remitted, protecting the integrity of premiums from receipt through remittance; while held by contractor prior to remittance, funds must be accounted for separately from any other contractor funds.
- Resolve instances in which requested deductions were not remitted.
- Follow business rules established by HHS for premium payment lapses.
- Perform enrollment and premium reconciliations.
- Integrate the premium administration system with the enrollment system with the future claims system, which may be included as an additional option in a future RFP.
Requested Information
- We are interested in receiving information about your premium administration processes, including payroll deduction interfaces with employers or their benefits administrators or payroll providers.
- What is your experience with providing these services on a large scale?
- Discuss the number and size of the clients you provide these services for.
- Discuss the amount of time it typically takes you to set up payroll deduction with an employer and then start to receive payments.
- Does that time differ significantly by employer size or whether the employer handles its own payroll?
- In your experience, are payroll deductions generally reliable and accurate? Discuss the processes you follow when you do not receive an expected payment from an employer.
- Do you typically require standard file formats or customize per employers’ formats?
- What are the critical interactions with employers/payroll administrators/benefits brokers and their varying systems that you believe must be considered?
- Do you have an automated billing reconciliation process?
- The system will need to collect premiums from individuals by methods other than payroll deduction.
- What are your experiences with other payment methods?
- Which methods are the most popular and produce the most consistently accurate results? Which are the most cost-effective?
- As CLASS enrollments will be portable, enrollees may change payroll deduction locations several times and go in and out of pay status during the course of their enrollment.
- What insights can you provide into ways to manage that scenario?
- Discuss how you manage changes to premium payment methods and amounts, e.g. from payroll deduction to automatic bank withdrawal or from a biweekly payment cycle to a monthly payment cycle, and the necessary adjustments to premium to ensure full payment.
- Discuss how you identify and resolve processing errors.
- Please discuss your approach to missed premiums (via payroll deduction and on an individual basis), partial premiums received, insufficient funds, grace periods, communication to enrollees/employers who owe back premiums, and debt collection methods.
Program Management Activities
Requirements
- Account Management and Customer Service
- Provide and administer self-service and managed service functionality for enrollee and employer accounts, including role-based access to the system.
- Allow users to upload and house documents in their accounts.
- Manage and reply to public inquiries received by phone, mail, and email.
- Provide, staff, and operate a phone-based customer service center with highly-qualified personnel to provide program information, perform enrollments, and assist enrollees with account management problems and questions.
- Document Management and Reports
- Automatically generate necessary forms and correspondence such as:
- Welcome letters
- Opt-out confirmation notification
- Change in status notification
- Generate standard or custom reports pulling from any of the collected data.
- Log and track marketing material or other information requested.
- 3. Systems and Processes
- Provide and administer systems and processes that meet the criteria and rules described in Appendix A: Applicable IT Policies and Standards.
- Provide and administer systems and processes that appropriately account for:
- Authenticating and ensuring data integrity and confidentiality
- Data Redundancy and recovery
- Protecting personally identifiable information (PII)
- System reliability
- Provide and administer systems and processes that are:
- Scalable to account for disproportionate system usage
- Able to link to external (non-CLASS) systems for eligibility verification
- Simple and easy to use for end-users
- Provide and administer storage capacity large enough to retain all enrollee and former enrollee records for decades.
Requested Information
- Account Management and Customer Service
- Discuss how you manage user access to the system.
- Discuss how you manage and reply to public inquiries. How do you ensure that the responses are timely?
- Discuss your ability to provide, staff, and operate a phone-based customer service center.
- Document Management and Reports
- Discuss your ability to generate standard reports and ad hoc reports using any of the collected data elements for deeper data analysis. Discuss how your system accomplishes these reporting needs.
- 3. Systems and Processes
- Discuss how you manage your system so that it is user-friendly but offers the necessary data integrity provisions and protects PII.
- Discuss how your system is scalable for extremely high-usage times.
- Discuss your experiences and expertise in meeting the federal system requirements outlined in Appendix A.
- Discuss what steps you would take to link up your systems with other systems ensuring secure but efficient data transfers for verification purposes.
- Discuss how your system accommodates the large capacity required to hold the records for decades.
Appendix A: Applicable IT Policies and Standards
Security and Privacy
-
Federal Privacy Rule for Personal Health Information - Health Insurance Portability and Accountability Act of 1996 (HIPAA) [ http://www.cms.gov/HIPAAGenInfo/]
-
The Federal Information Security Management Act (FISMA) of 2002 [ http://csrc.nist.gov/drivers/documents/FISMA-final.pdf]
-
Section 208 of the E-Government Act of 2002 (Public Law 107-347) [ http://frwebgate.access.gpo.gov/cgi-bin/getdoc.cgi?dbname=107_cong_public_laws&docid=f:publ347.107]
-
The Privacy Act of 1974, Public Law 93-579, December 31, 1974, (5 U.S.C. 552a) [ http://www.justice.gov/opcl/privstat.htm]
-
Office of Management and Budget (OMB) Memorandum "Protection of Sensitive Agency Information" (OMB M-06-16) [ http://www.whitehouse.gov/sites/default/files/private/omb/memoranda/fy2006/m06-16.pdf]
-
The Federal Enterprise Architecture Security and Privacy Profile [ http://www.cio.gov/documents_details.cfm/uid/480F4A03-BDBE-6B59-FF19F5759D020C31/structure/Information%20Technology/category/IT%20Security-Privacy]
-
National Institute of Standards and Technology (NIST) Special Publication 800-18, "Guide for Developing Security Plans for Information Technology Systems." [ http://csrc.nist.gov/publications/nistpubs/800-18-Rev1/sp800-18-Rev1-final.pdf]
-
Federal Information Processing Standards (FIPS) Publication 197 regarding encryption standards [ http://csrc.nist.gov/publications/fips/fips197/fips-197.pdf]
-
HHS - Policy for IT Security and Privacy Incident Reporting and Response (HHS OCIO Policy 2010-0004) [ http://www.hhs.gov/ocio/policy/hhs_ocio_policy_2010_0004.html]
-
HHS-OCIO-Policy for Machine-Readable Privacy (HHS OCIO Policy 2010-0001) [ http://www.hhs.gov/ocio/policy/hhs-ocio-2010_0001_policy_for_machine-readable_privacy_policies.html]
-
HHS - OCIO Policy for Information Systems Security and Privacy (HHS OCIO Policy 20010-0006) [ http://www.hhs.gov/ocio/policy/policy-hhs-ocio-2010-0006-html.html]
-
HHS Policy for Privacy Impact Assessments (PIA) (HHS OCIO Policy 2009-0002.001) [ http://www.hhs.gov/ocio/policy/20090002.001.html]
-
HHS Policy for Responding to Breaches of Personally Identifiable Information (PII) (HHS OCIO Policy 2008-0001.003) [ http://www.hhs.gov/ocio/policy/20080001.003.html]
Enterprise Architecture and Capital Planning and Investment Control
-
The Federal Enterprise Architecture [ http://www.whitehouse.gov/omb/e-gov/fea]
-
HHS OCIO Policy for IT Performance Baseline Management (HHS OCIO Policy 2010-0007) [ http://www.hhs.gov/ocio/policy/policy_2009-0005_-_ocio.html]
-
HHS OCIO Policy for Information Technology (IT) Enterprise Performance Life Cycle (EPLC) (HHS OCIO Policy 2008-0004.001) [ http://www.hhs.gov/ocio/policy/2008-0004.001.html]
-
HHS Policy for IT Capital Planning and Investment Control (CPIC) (HHS OCIO Policy 2010-0002) [ http://www.hhs.gov/ocio/policy/2010-0002_-_ocio.html]
-
HHS IRM Policy for Conducting Information Technology Alternatives Analysis (HHS OCIO Policy 2003-0002) [ http://www.hhs.gov/ocio/policy/2003-0002.html]
-
HHS OCIO Policy for Management of the Enterprise IT System Inventory (HHS OCIO Policy 2009-0004) [ http://www.hhs.gov/ocio/policy/policy_2009-0004-ocio.html]
-
HHS-OCIO IT Policy for Enterprise Architecture (EA) (HHS OCIO Policy 2008-0003.001) [ http://www.hhs.gov/ocio/policy/2008-0003.001.html]
-
HHS - OCIO Policy for Social Media Technologies (HHS OCIO Policy 2010-0003) [ http://www.hhs.gov/ocio/policy/policy_2010-0003_-_ocio.html]
Records Management and Acceptable Use
-
The Paperwork Reduction Act of 1995, as amended (44 U.S.C. 3501) [ http://www.reginfo.gov/public/reginfo/pra.pdf]
-
Office of Management and Budget (OMB) Circular No. A-130 “Management of Federal Information Resources” [ http://www.whitehouse.gov/omb/circulars_a130]
-
HHS Policy for Records Management for E-mails (HHS OCIO Policy 2008-0002.001) [ http://www.hhs.gov/ocio/policy/2008-0002.html]
-
HHS Policy for Records Management (HHS OCIO Policy 2007-0004.001) [ http://www.hhs.gov/ocio/policy/2007-0004.001.html]
-
HHS Policy for Records Holds (HHS OCIO Policy 2010-0008) [ http://www.hhs.gov/ocio/policy/policy_ocio-2010-0008.html]
-
HHS - OCIO Policy for Social Media Technologies (HHS OCIO Policy 2010-0003) [ http://www.hhs.gov/ocio/policy/policy_2010-0003_-_ocio.html]
-
HHS Rules of Behavior (For Use of Technology Resources and Information) (HHS OCIO Policy 2010-0002.001S) [ http://www.hhs.gov/ocio/policy/hhs-ocio-2010-0002.001s_hhs_rules_of_behavior.html]
Accessibility and Assistive Technology
-
Section 508 of the Rehabilitation Act (29 U.S.C. '794 d), as amended by the Workforce Investment Act of 1998 (P.L. 105 -220) [ http://www.section508.gov/index.cfm?fuseAction=1998Amend]
-
Section 255 of the Telecommunications Act of 1996 [ http://transition.fcc.gov/cib/dro/section255.html]
-
Section 508 Standards for Electronic and Information Technology [ http://www.access-board.gov/sec508/guide/index.htm]
-
HHS for Section 508 Electronic and Information Technology (EIT) [ http://www.hhs.gov/od/508policy/508_policy.html]
Appendix J: Additional Analyses for Early Policy Analysis
A Profile of Declined Long-Term Care Insurance Applicants: A View of Selected Socio-Demographic Characteristics
Prepared for
Department of Health and Human Services
Office of the Assistant Secretary for Planning and Evaluation
Office of Disability Aging and Long-Term Care Policy
Prepared by
LifePlans, Inc.
December 27, 2010 (DRAFT)
Background
The Patient Protection and Affordable Care Act was signed by the President on March 23, 2010. This act establishes a national voluntary insurance program, the CLASS Independence Benefit Plan, to provide community living assistance services and supports to working individuals who have functional limitations and require ongoing assistance in the community. Individuals would pay a premium to participate in the program, and these premiums must be set to assure actuarial solvency for a 75 year period. Because the program is designed to serve working people regardless of functional status at enrollment, the pool of participants is likely to be comprised of a high proportion of employed individuals with disabilities for whom the insurance would be a particularly attractive benefit. Another group who would find the program attractive would be those who have sought to purchase private long-term care (LTC) insurance but been precluded from doing so because of their health status. Current estimates are that slightly less than 20% of all applicants for private LTC insurance are not able to buy policies due to their health status.
A key assumption underlying the development of actuarially fair premiums is that the risk profile of people enrolling in the program matches the profile that has been priced for; put another way, in developing premiums, the Secretary will need to take into account the fact that the population enrolling in CLASS will look very different from a cross-section of the population, or from individuals who enroll in other voluntary insurance programs, like private LTC insurance. This is because in the insurance market, companies are able to underwrite “bad risks” out of the risk pool at the time of application whereas the government will not have the ability to do so. Therefore, obtaining a profile of likely early enrollees and providing descriptive information to inform projections is particularly important for policymakers.
Purpose
The purpose of this project is to provide general background on LTC underwriting practice in the private insurance sector and to obtain a profile of individuals applying for private LTC insurance policies who have not been able to purchase policies due to their health status. More specifically we intend to do the following:
- Describe in general terms underwriting practices in the LTC insurance industry.
- Estimate underwriting rejection rates by specific age classes across the major LTC insurance carriers;
- Identify the primary reasons why individuals are not accepted into the risk pool and develop a distribution based on these reasons. More specifically, we will focus on primary diagnoses, cognitive status, and functional status;
- Understand the relationship between age, gender, marital status and the reasons for decline in order to identify how underwriting declination distributions look for individuals in these various sub-groups.
- Compare the profile of individuals not able to purchase LTC insurance due to health reasons to new purchasers in terms of age, gender and marital status.
Importance of Study
Currently, there is no aggregate industry-wide knowledge about the population of individuals who have applied for LTC insurance but not been able to purchase policies due to health status. Thus, the study makes an important contribution to the knowledge base. Second, obtaining a profile of these individuals would provide important insight into likely CLASS participants. These are individuals who have actively sought to protect themselves against catastrophic LTC costs through an insurance mechanism but have not been able to avail themselves of private alternatives. Given that they understand the risk, they are likely to be among the first to enroll in the CLASS program. Third and closely related, the information provided herein should assist the Department in modeling what early program participants may look like so that there is a more informed basis for setting premiums to assure program solvency. Finally, obtaining a profile of these individuals may also assist in the development of customized benefit eligibility tools for specialized populations that are not typically served by the private long-term care insurance market.
Data
To accomplish these goals, we contacted major private LTC insurance companies currently selling in the market to solicit their participation in the study. We asked them to provide us with data on the total number of individuals that had applied for insurance between January 1, 2009 and June 30th, 2010 and had not been accepted into the risk pool due to reasons related to medical underwriting. For each individual we requested the following:
- Date of application
- Company to which individual is applying for LTC insurance
- Age at application
- Gender
- Marital status at application
- Employment status: A few companies were able to provide this data
- Functional status: Results of any functional screens applied
- ADL status
- IADL status
- Cognitive status: Results of any cognitive screens applied
- Medical Status: Primary and secondary diagnoses identified
The following companies participated in the study and agreed to provide information on as many of the data elements that they capture in their underwriting and policyholder administration systems:
- Bankers Life and Casualty
- Blue Cross and Blue Shield of Alabama
- GenworthFinancial
- John Hancock
- Knights of Columbus
- MedAmerica
- MetLife
- Sterling Life Insurance
These companies accounted for roughly 70% of all new sales over the study period. In total, these companies contributed a sample of 55,070 individuals who applied for LTC insurance and did not pass the medical underwriting screens used by the companies.
This data was also supplemented with contextual information derived from a survey of 21 private LTC insurers focused on their underwriting practices. The study, entitled “Results of the Long-Term Care Underwriting Survey for the Individual Market in 2009” summarizes in detail the way in which companies conduct the business of underwriting.
Table 1 arrays the data elements according to the number of valid cases in the data file. Companies vary in the extent to which they capture all of the data that they actually use in the underwriting decision making process. What is common across all companies however is that information on medical diagnoses is captured. For that reason, while we have some level of detail on all 55,070 individuals, not all information is uniform. Some of the analyses will exclude large numbers of individuals. Even so, given the size of the sample, the smallest cells still contain over 18,000 observations.
| TABLE 1: Sample Size by Data Element | ||
|---|---|---|
| Data Element | Number of Cases With Information |
Percent of All Cases |
| Age | 54,638 | 99% |
| Gender | 46,172 | 84% |
| Marital Status | 34,455 | 63% |
| Employment Status | 18,494 | 33% |
| Functional Status | ||
| ADL Status | 23,006 | 42% |
| IADL status | 21,106 | 38% |
| Cognitive Status | 34,360 | 62% |
| Medical Status (Primary Diagnosis) | 53,782 | 98% |
| Total Cases | 55,070 | 100% |
Because companies do not use conventional standards for summarizing diagnostic information, clinical underwriting staff at LifePlans reviewed all of the cases to assure that appropriate and broad diagnostic categories could be used to characterize the entire sample. In the analyses that follow, thirteen broad diagnostic categories are used, thus ensuring consistency across the entire sample.
Findings
Conclusions
Information from this analysis has clearly demonstrated that individuals who are unable to purchase private LTC insurance due to the medical underwriting process tend to be somewhat older, male and less likely to be employed than the total applicant pool. While few exhibit outward signs of functional impairment or dementia, this is likely the result of agents pre-screening activities. Thus, the pool of applicant declinations is more representative of individuals who are at risk for near term need rather than immediate need. For that reason, the roughly 8% of individuals who are declined for not passing a cognitive screen are likely at the early stages of cognitive decline and for the most part do not have dementia at the time of application.
The distribution of the sample by medical diagnosis suggests that there are a variety of reasons why someone may not be accepted into the risk pool. No single diagnostic category accounts for more than 15% of the declinations and there are clear patterns across age, gender and employment status. Estimating the prevalence of these diagnoses in the general target population for the CLASS Program is an important next step, as it will enable policymakers to begin to characterize with more precision the risk profile of enrollees. As such, this will enable more accurate pricing so that the premiums adequately reflect underlying risk and support ongoing program financial solvency.
Notes
-
Results of the Long-Term Care Underwriting Survey for the Individual Market in 2009. LifePlans, Inc. Waltham, MA November, 2010.
-
Note that in roughly 8% of the cases individuals are still declined based solely on information found in the application alone. This suggests that agent pre-screening is not always effective.
Class Program Benefit Triggers and Cognitive Impairment
Prepared Under Contract by Katie Maslow
For the Office of the Assistant Secretary for Planning and Evaluation,
U.S Department of Health and Human Services
Draft
October 25, 2010
Introduction
The mandated benefit triggers for the Community Living Assistance Services and Support (CLASS) Program legislation are clearly intended to include people with cognitive impairment. One of the two specified benefit triggers explicitly identifies as eligible an individual who “requires substantial supervision to protect the individual from threats to health and safety due to substantial cognitive impairment.” In addition, some people with cognitive impairment will be eligible based on the other specified benefit trigger, inability to perform at least 2 or 3 activities of daily living (ADLs) without substantial assistance from another person. Over time, for example, virtually all people who have progressive neurological diseases and conditions that cause cognitive impairment, e.g., people with Alzheimer’s disease, Huntington’s disease, and Amyotrophic Lateral Sclerosis (ALS), will need assistance from another person with all 6 ADLs listed in the legislation, unless they die first from another cause.
The CLASS Program benefit trigger that identifies individuals as eligible based on need for supervision to protect them from threats to their health and safety was probably intended by Congress to target people with cognitive impairment due to Alzheimer’s disease and other dementias that mainly affect older people. Certainly, however, some adults of all ages who have cognitive impairment due to other diseases and conditions, e.g., people with mental retardation, other intellectual disabilities, severe mental illness, traumatic brain injury and acquired immunodeficiency syndrome, could also be eligible based on this trigger. Likewise, some adults with cognitive impairment due to any of these diseases and conditions could be eligible based on inability to perform ADLs. Adults with cognitive impairment due to diseases and conditions that preclude them from working throughout their adult lives may not be able to enroll in the CLASS Program because of the work and earned income requirements for enrollment. Nevertheless, in developing regulations to operationalize and implement the CLASS Program benefit triggers, it is important to consider the relevance and impact of proposed regulations for adults with cognitive impairment due to diseases and conditions beyond the targeted group of older people with Alzheimer’s and other dementias.
There is currently a very large and growing body of research on cognitive impairment, measurement of cognitive impairment, and the need for and use of long-term services and supports by people with cognitive impairment. This research, as well as clinical and practice-based experience in determining eligibility for long-term services and supports, suggests various approaches for operationalizing and implementing the mandated CLASS Program benefit triggers as they pertain to people with cognitive impairment. To focus the discussion of findings from these sources, this paper begins by identifying the concepts and wording in the CLASS Program benefit triggers that are particularly important for people with cognitive impairment. The paper then compares the wording and concepts in the CLASS Program benefit triggers with the wording and concepts in the required benefit triggers for qualified long term care insurance policies under the Health Insurance Portability and Accountability Act of 1996 (HIPAA) and the Federal Long-Term Care Insurance Program and summarizes the limited amount of published information about individuals with cognitive impairment who receive long-term services and supports funded at least in part through these policies. Later sections of the paper discuss the relationship of cognitive impairment and need for and use of long-term services and supports and approaches for operationalizing and measuring the relevant concepts in the CLASS Program benefit triggers based on need for supervision to protect an individual from threats to health and safety and inability to perform ADLs. The CLASS Program legislation includes a third, unspecified benefit trigger, and the last section of the paper suggests options the Secretary might consider for this benefit trigger. Throughout the paper, recommendations for the Secretary are noted in text boxes.
Part 1: Benefit Triggers in the Class Program and Other Long-Term Care Insurance Programs
As noted above, the CLASS Program legislation includes two specified benefit triggers and one unspecified benefit trigger to be determined by the Secretary. Box 1 shows the language from the CLASS Program legislation that describes the benefit triggers. Four concepts (underlined in the box) are particularly important in considering the implications of the benefit triggers for people with cognitive impairment:
- substantial assistance (as defined by the Secretary) from another individual;
- substantial supervision;
- threats to health and safety; and
- substantial cognitive impairment.
The required benefit triggers for tax qualified long term care insurance policies under HIPAA (1996)1 are similar but not exactly the same as the mandated benefit triggers for the CLASS Program. In specific, the HIPAA benefit trigger based on need for supervision to protect the individual from threats to health and safety states that the threats are due to severe cognitive impairment,” as opposed to “substantial cognitive impairment” in the CLASS Program benefit trigger. In addition, in the HIPAA requirements, the 90-day period applies only to the benefit trigger based on inability to perform ADLs. Also, the words, “due to a loss of functional capacity” are added to the benefit trigger based on ADLs, so that the individual must be “unable to perform (without substantial assistance from another individual) at least 2 activities of daily living, due to a loss of functional capacity.”
The required benefit triggers for the Federal Long-Term Care Insurance Program are similar but not exactly the same as either the mandated benefit triggers for the CLASS Program or the HIPAA benefit triggers. Like the HIPAA benefit trigger based on need for supervision to protect the individual from threats to health and safety, the Federal Long-Term Care Insurance Program benefit trigger based on need for supervision requires that the threats are due to severe cognitive impairment,” as opposed to “substantial cognitive impairment” in the CLASS Program benefit trigger. Also like the HIPAA benefit triggers, the Federal Long-Term Care Insurance Program applies the 90-day period only to the benefit trigger based on inability to perform ADLs, and adds the words, “due to a loss of functional capacity,” to that benefit trigger. Unlike the CLASS Program and HIPAA benefit triggers based on need for supervision, the Federal Long-Term Care Insurance Program benefit trigger on need for supervision does not include the phrase, “to protect the individual from threats to health and safety.”
All three sets of benefit triggers list exactly the same ADLs: eating, toileting, transferring, bathing, dressing and continence. They differ only in that the HIPAA and Federal Long-Term Care Insurance Program benefit triggers specify that the person must need assistance with 2 of the 6 ADLs, while the CLASS Program triggers allow the Secretary to decide whether the person must need assistance with 2 or 3 ADLs.
This contractor has not found any published information about the number of individuals with cognitive impairment that has received long-term services and supports through the Federal Long-Term Care Insurance Program or the proportion of all individuals who have received such services that are individuals with cognitive impairment. One study funded by ASPE found, however, that 41 percent of a random sample of 1,474 individuals who had long-term care insurance and had just begun or were about to begin using paid long-term services and supports were individuals with cognitive impairment (Miller et al., 2008). The proportions of individuals that had cognitive impairment differed across care settings. Among those who had begun receiving paid care at home, 28 percent had cognitive impairment, compared with 63 percent of those who were receiving paid care in an assisted living facility and 64 percent of those who were receiving paid services in a nursing home (Cohen et al., 2006). Among those who had not yet begun receiving paid care, 29% had cognitive impairment.
The ASPE-funded study found that the great majority of individuals in the sample would have been eligible based on the HIPAA benefit triggers (Miller et al., 2008), but the study finding about the proportion of individuals that had cognitive impairment was based on the results of a brief mental status test, the Short Portable Mental Status Questionnaire (SPMSQ) (Pfeiffer et al., 1975), which was administered by research nurses for the study. Thus, it is not clear from the reported findings whether these individuals met the HIPAA benefit trigger based on need for supervision to protect the individual from threats to health and safety, the HIPAA benefit trigger based on ADLs, or both.
Another study funded by the MetLife Mature Market Institute found that 42 percent of a sample of 423 individuals who had long-term care insurance and were receiving paid care in the community were individuals with Alzheimer’s disease or another dementia (MetLife, 2006). Again, it is not clear from the study finding whether these individuals met the HIPAA benefit trigger based on need for supervision, the HIPAA benefit trigger based on ADLs, both triggers, or another benefit trigger used by their long-term care insurance company. Nevertheless, both studies show that substantial proportions of people who are found to be eligible for long-term services and supports through their long-term care insurance policy are people with cognitive impairment.
As of Oct. 5, 2010, Marc A. Cohen, PhD, was completing a report for SCAN Foundation on questions about how the HIPAA benefit trigger based on need for supervision to protect the individual from threats to health and safety is implemented in existing long-term care insurance plans.2 This report should provide valuable ideas about how the CLASS Program benefit trigger based on need for supervision could be operationalized and implemented.
Recommendation. Because of the similarities among the CLASS Program, HIPAA and Federal Long-Term Care Insurance Program benefit triggers and because the CLASS Program benefit triggers are intended for use in long-term care insurance plans, any available information about how the HIPAA and Federal Long-Term Care Insurance Program benefit triggers have been implemented will be useful to the Secretary in operationalizing the CLASS Program benefit triggers. Such information, which could include research findings and/or clinical and practice-based experience in determining eligibility for long-term services and supports, should be obtained in a timely manner.
Part 2: Cognitive Impairment and Need for and Use of Long-Term Services and Supports
The term, cognitive impairment, refers to reduced or impaired cognitive or mental abilities, including memory, thinking, learning, awareness, orientation, understanding, recognition, concentration, reasoning, planning, organizing, solving problems and making judgments and decisions. A wide array of genetic and acquired diseases and conditions can cause cognitive impairment.
Cognitive impairment can result in inability to perform activities that are essential for normal, independent functioning, including self-care activities, usually referred to as ADLs and IADLs (instrumental activities of daily living) in older people, as well as activities that are required for school and work in younger people and activities that are part of normal social interaction for people of all ages. Even if an individual with cognitive impairment is physically able to perform these activities, he or she may be unable to learn or remember how to perform them, know when or where to perform them, or be unable to plan, initiate, or sequence the steps needed to perform them successfully. Depending on the types of activities the individual is unable to perform independently, he or she may need long-term services and supports.
The relationship between cognitive impairment and inability to perform essential self-care and other activities is obvious in a sense, but it is not always fully understood. Two examples pertaining to inability to perform ADLs illustrate the relationship. First, with respect to the ADL, dressing, an individual of any age could be physically unable to dress independently because of weakness or an injury, disease, or condition that makes it impossible for the individual to get out, put on, and fasten clothing. In contrast, an individual could be cognitively unable to dress independently because of inability to learn or remember how to put on clothing; inability to plan, initiate, and sequence the steps in dressing, or inability to understand or remember when to get dressed. Similarly, with respect to the ADL, toileting, which means getting to and using the toilet, an individual could be physically unable to get to or use the toilet independently because of weakness or an injury, disease or condition that makes it impossible walk or otherwise get to the toilet, use it and get back to his or her prior location. In contrast, an individual could be cognitively unable to learn or remember how to use a toilet, unable to recognize a toilet or know what it is for, or unaware of his or her need to use the toilet at a particular time. Although the specific reasons that individuals with cognitive versus physical impairments are unable to perform an ADL differ, and the kinds of help they need to perform the ADL may also differ, the end result with respect to the need for substantial assistance from another person to perform the ADL is often the same.
In addition to inability or reduced ability to perform self-care and other activities that are essential for normal, independent functioning, cognitive impairment can result in behaviors that create threats to the individual’s health and safety. Examples of these behaviors include leaving home alone and getting lost; ingesting spoiled food or toxic substances; using household appliances and sharp objects in an unsafe manner; and failing to follow instructions for needed medical care, e.g. instructions about the amounts of and schedule for taking prescribed medications. Such behaviors can lead to serious injury and death. To avoid these negative outcomes, long-term services and supports, including services often referred to as “supervision” or “monitoring,” may be needed.
The impact of cognitive impairment on an individual’s need for long-term services and supports varies greatly depending on many factors. These factors include how many and which particular cognitive abilities are affected and how severely they are affected; whether the cognitive impairment was present at birth or occurred in childhood or later in life; whether it occurred suddenly or gradually; and whether it is stable, worsening, or improving over time. For a few diseases and conditions that cause cognitive impairment, there is little or no variation among individuals who have the disease or condition with respect to a few of these factors. For example, all people with cognitive impairment due to Down’s syndrome have had the condition since birth. Likewise, almost all people with cognitive impairment due to an accident or a stroke have experienced a sudden onset of cognitive impairment, whereas almost all people with cognitive impairment due to degenerative dementias, such as Alzheimer’s disease, have experienced a gradual onset. As a rule, however, there is considerable variation among individuals with cognitive impairment due to any particular disease or condition in terms of these and other factors that affect the individual’s need for long-term services and supports.
Many individuals with cognitive impairment also have physical impairments. Their cognitive impairment is likely to limit their capacity to compensate for their physical impairments and, therefore, further reduce their ability to perform self-care and other activities that are essential for normal, independent functioning. For these individuals, need for long-term services and supports is affected by both their cognitive and physical impairments and the often complex interactions between the impairments.
Lastly, of course, an individual’s need for long-term services and supports depends on many characteristics of the individual’s family and social environment that are not determined by the disease or condition that is causing his or her cognitive impairment.
The following discussion focuses on the need for and use of long-term services and supports by older people with cognitive impairment and dementia. This focus addresses an important segment of the population of Americans with cognitive impairment, and the segment for which there is the most available information to evaluate the implications of the CLASS Program benefit triggers. Comparable information is needed to evaluate the implications of the triggers for nonelderly adults and people with cognitive impairment due to other diseases and conditions.
Part 3: Options for Measuring Concepts in the CLASS Program Benefit Triggers That Are Important for People with Cognitive Impairment
Many different assessment instruments could be used to measure the concepts in the CLASS Program benefit triggers that are most important for people with cognitive impairment. The CLASS Program legislation says that the eligibility determinations based on the benefit triggers will be made by “a licensed health care practitioner.” Procedures for determining eligibility for CLASS Program services and supports have not yet been developed, and it is unclear whether there will eventually be a single organization that conducts eligibility determinations or, more likely, many organizations and individuals that determine eligibility, as is the case with most existing long-term care insurance plans. In this context, this contractor believes that no specific assessment instruments or procedures should be required to determine eligibility for CLASS Program services and supports. On the other hand, it is important to provide information about such instruments and their use to anyone who is responsible for implementing the CLASS Program benefit trigger. Some organizations and individuals may choose to use certain instruments. Equally important, awareness of the content of the instruments could help such organizations and individuals better understand and implement the intent and meaning of the concepts in the benefit triggers.
This section lists assessment instruments that measure concepts in CLASS Program benefit triggers that are most important for people with cognitive impairment. Further analysis of these instruments will be needed, but the objective of the analysis will differ depending on the decision that is made about whether specific assessment instruments and procedures will be required to determine eligibility for CLASS Program services and supports.
Part 4: Options for the Unspecified Benefit Trigger
The preceding analysis suggests options the Secretary might consider for the unspecified benefit trigger.
-
A trigger that addresses cognitive impairment in people with mental illness, including people with severe depression, who need long-term services and supports but would not be eligible based on the two specified benefit triggers; such a trigger might focus specifically on executive dysfunction.
-
A trigger that addresses cognitive impairment in people with multiple diseases and conditions who need long-term services and supports but would not be eligible based on the specified benefit triggers.
In addition to benefit triggers, this contractor believes it will be important to consider the types of help people with cognitive impairment need to manage the cash benefit they receive through the CLASS Program.
References:
AaltenP; Van Valen E; Clare L; et al. “Awareness in dementia: A review of clinical correlates.” Aging & Mental Health 2005;9(5):414-422.
AARP Public Policy Institute. Issues in the Measurement of Cognitive Impairment for determining Eligibility for Long-Term Care Benefits. MP Keenan (ed.) (Washington DC: AARP Public Policy Institute, Sept. 1990).
Abrams RC; Lachs M; McAvayG; et al. “Predictors of self-neglect in community-dwelling elders.” American Journal of Psychiatry 2002;159(10), 1724–1730.
Adams KB. “The Transition to Caregiving: The Experience of Family Members Embarking on the Dementia CaregivingCareer.” Journal of Gerontological Social Work2006;47(3/4):3-29.
Aguero-Torres H; Fratiglioni L; Guo Z; et al. “Dementia is the major cause of functional dependence in the elderly: 3-year follow-up data from a population-based study.” American Journal of Public Health 1998;88(10):1452-1456.
Alecxih LMB; and Lutzky S. How do Alternative Eligibility Triggers Affect access to Private Long-Term Care Insurance (Washington DC: AARP Public Policy Institute Aug 1996).
Aleman A; Hijman R; deHaan EHF; et al., “Memory impairment in schizophrenia: A meta-analysis.” American Journal of Psychiatry 1999;156(9):1358-1366.
Algase DL; Beck C; Kolanowski A. “Need-driven dementia-compromised behavior: An alternative view of disruptive behavior.” American Journal of Alzheimer’s Disease 1996:10-19.
American Geriatrics Society, British Geriatrics Society, and American Academy of Orthopaedic Surgeons Panel on Falls Prevention. “Guideline for the Prevention of Fallsin Older Persons.” Journal of the American Geriatrics Society 2001;49(5):664-672.
American Health Care Association. Medical Condition--Mental Status, OSCAR Data from the U.S. Centers for Medicare and Medicaid, Current Surveys, 2010.
American Psychiatric Association. Diagnostic and Statistical Manual of Mental Disorders. 4th Edition. (DSM-IV). Text revision. (Washington, DC: American Psychiatric Association, 2000).
Anthony JC; LeResche L; Niaz U; et al. “Limits of the ‘Mini-Mental State’ as a screening test for dementia and delirium among hospital patients.” Psychological Medicine 1982;12(2):397-408.
Auer SR; Sclan SG; Yaffee RA; et al. “The neglected half of Alzheimer disease: Cognitive and functional concomitants of severe dementia.” Journal of the American Geriatrics Society 1994;42(12):1266-1272.
Banaszak-Holl J; Fendrick AM; Foster NL; et al. “Predicting nursing home admission: Estimates from a 7-year follow-up of a nationally representative sample of older Americans.” Alzheimer Disease and Associated Disorders 2004;18(2):83-89.
Banks WA: and Morley JE. “Memories are made of this: Recent advances in understanding cognitive impairment and dementia.” Journal of Gerontology: Medical Sciences 2003;58A(4):314-321.
Bartels SJ. “Caring for the whole person: Integrated health care for older adults with severe mental illness and medical comorbidity.”Journal of the American Geriatrics Society 2004;52(12):S249-S257.
Bauer EJ. “Transitions from home to nursing home in a capitatedlong-term care program: The role of individual support systems.” Health Services Research 31(3):309-326.
Beck C. “Measurement of dressing performance in persons with dementia.” The American Journal of Alzheimer’s Care and Related Disorders and Research 1988;3(3):21-25.
Berg G; Edwards DF; Danzinger WL; et al., “Longitudinal change in three brief assessments of SDAT.” Journal of the American Geriatrics Society 1987;35(3):205-212.
Bharucha AJ; Pandav R; Shen C; et al. “Predictors of nursing facility admission: A 12-year epidemiological study in the United States.” Journal of the American Geriatrics Society 2004;52(3):434-439.
Black BS; Rabins PV; and German PS. “Predictors of nursing home placement among elderly public housing residents.”Gerontologist 1999;39(5):559-568.
Black SA; and Rush RD. “Cognitive and functional decline in adults aged 75 and older.” Journal of the American Geriatrics Society 2002;50(12):1978-1986.
Blessed G; Tomlinson BE; and Roth M. “The association between quantitative measures of dementia and of senile change in the cerebral gray matter of elderly subjects.” British Journal of Psychiatry 1968;114(512):797-811.
Boake C. “The Supervision Rating Scale: A measure of functional outcome from brain injury.” Archives of Physical Medicine and Rehabilitation 1996;77:765-772.
Boise L; Camicioli R; Morgan DL; et al. “Diagnosing dementia: Perspectives of primary care physicians.” Gerontologist 1999;39(4):457-464.
Boise L; Eckstrom E; FagnanL; et al., “The Rural Older Adult Memory (ROAM) Study: A practice-based intervention to improve dementia screening and diagnosis.” Journal of the American Board of Family Medicine2010;23(4):486-498.
Boise L; Neal MB; and Kaye J. “Dementia assessment in primary care: Results from a study in three managed care systems.” Journal of Gerontology: Medical Sciences 2004;59A(6):621-626
Borson S; Scanlan JM; Brush M; et al. “The Mini-Cog: A cognitive ‘vital signs’ measure for dementia screening in multi-lingual elderly.” International Journal of Geriatric Psychiatry. 2001;15:1021-1027.
Borson S; Scanlan JM; Chen P; et al. “The Mini-Cog as a screen for dementia: Validation in a population-based sample.” Journal of the American Geriatrics Society 2003;51(10):1451-1454.
Borson S; Scanlan JM; Watanabe J; et al., “Simplifying detection of cognitive impairment: Comparison of the Mini-Cog and Mini-Mental State Examination in a multiethnic sample.” Journal of the American Geriatrics Society2005;53(5):871-874.
Borson S; Scanlan JM; Watanabe J; et al. “Improving identification of cognitive impairment in primary care.” International Journal of Geriatric Psychiatry 2006;21:349-355.
Branch LG; and Jette AM. “A prospective study of long-term care institutionalization among the aged.” American Journal of Public Health 1982;72(12):1373-1379.
Brandt J; Spencer M; and Folstein M. “The telephone interview for cognitive status.” Neuropsychiatry Neuropsychology and Behavioral Neurology 1988;1:111-117.
Brickman AM; Riba A; Bell K; et al., “Longitudinal assessment of patient dependence in Alzheimer disease.” Archives of Neurology 2002;59(8):;1304-1308.
Brodaty H; Pond D; Kemp NM; et al. “The GPCOG: A new screening test for dementia designed for general practice.” Journal of the American Geriatrics Society 2002:50(3):530-534.
Brody KK; Maslow K; Perrin NA; et al. “Usefulness of a single item in a mail survey to identify persons with possible dementia: a new strategy for finding high-risk elders.” Disease Management 2005;8(2):59-72.
Boustani M; Callahan CM; Unverzagt FW; et al. “Implementing a screening and diagnosis program for dementia in primary care.” Journal of General Internal Medicine. 2005;20:572-577.
Buchner DM; and Larson EB. “Fallsand fractures in patients with Alzheimer-type dementia.” Journal of the American Medical Association 1987;257(11):1492-1495.
Buckwalter KC; and Buckwalter JA, “Acute Cognitive dysfunction (delirium),” Archives of the American Academy of Orthopaedic Surgeons 1998;2(1):9-19.
Buckwalter KC; and Buckwalter JA, “Chronic Cognitive dysfunction (dementia),” Archives of the American Academy of Orthopaedic Surgeons 2(1):20-32, 1998.
Buhr GT; Kuchibhatla M; Clipp EC.“Caregivers’ reasons for nursing home placement: Clues for improving discussions with families prior to the transition.” Gerontologist 2006;46(1):52–61.
Buschke H; Kuslansky G; Katz M; et al. “Screening for dementia with the Memory Impairment Screen.” Neurology 1999;52:231-238.
Butters MA; Whyte EM; Nebes RD; et al., “The nature and determinants of neuropsychological functioning in late-life depression.” Archives of General Psychiatry 2004;61(6):587-595.
Bynum JPW; Rabins PV; Weller W; et al. “The relationship between a dementia diagnosis, chronic illness, Medicare expenditures, and hospital use.” Journal of the American Geriatrics Society 2004;52:187-194.
Callahan CM; Hendrie HC; and Tierney WM. “Documentation and Evaluation of Cognitive Impairment in Elderly Primary Care Patients.” Annals of Internal Medicine 1995;122:422-429.
Carr DB; Shead V; and StorandtM. “Driving cessation in older adults with dementia of the Alzheimer’s type.”Gerontologist 2005;45(6):824-827.
Chopard G; Pitard a; Ferreira S; et al. “Combining the Memory Impairment Screen and the Isaacs Set Test: A practical tool for screening dementias.” Journal of the American Geriatrics Society 2007;55(9):1426-1430.
Chopard G; Vanholsbeeck G; Tio G; et al. “Rapid screening of cognitive change in patients with questionable dementia using the Memory Impairment Screen and the Isaacs Set Test.” Journal of the American Geriatrics Society2009;57(4):703-708.
Clare L; Wilson BA; Carter G; et al. “Assessing awareness in early-stage Alzheimer’s disease: Development and piloting of the Memory Awareness Rating Scale.” Neuropsychological Rehabilitation 2002;12(4):341-362.
Clark CM; and Ewbank DC.“Performance of the Dementia Severity Rating Scale: A caregiver questionnaire for rating severity in Alzheimer disease.” Alzheimer Disease and Associated Disorders 1996;10(1):31-39.
Clark CM; Sheppard L; Fillenbaum GG; et al. “Variability in annual Mini-Mental State Examination score in patients with probable Alzheimer disease: A clinical perspective of data from the Consortium to Establish a Registry for Alzheimer’s Disease.” Archives of Neurology 1999;56:857-862.
Cohen CA; Gold DP; Shulman KI; et al. “Factors determining the decision to institutionalize dementing individuals: A prospective study.” Gerontologist1993;33(6):714–720.
Cohen MA; Miller JS; and Shi X. Service Use and Transitions: Decisions, Choices and Care Management among an Admissions Cohort of Privately Insured Disabled Elders. Report prepared for the Office of Disability, Aging, and Long-Term Care Policy, Office of the Assistant Secretary for Planning and Evaluation, U.S. Department of Health and Human Services, December 2006.
Cohen MA; Miller JS; and Shi X. Following an Admissions Cohort: Care Management, Claim Experience and Transitions Amongan Admissions Cohort of Privately Insured Disabled Elders over a 16-Month Period. Report prepared for the Office of Disability, Aging, and Long-Term Care Policy, Office of the Assistant Secretary for Planning and Evaluation, U.S. Department of Health and Human Services, May 2007.
Cohen-Mansfield J; Werner P; and ReisbergB. “Temporal order of cognitive and functional loss in a nursing home population.” Journal of the American Geriatrics Society 1995;43(9):974-978.
Costa PT; Williams TF; Albert MS; et al. Recognition and Initial Assessment of Alzheimer’s Disease and Related Dementias AHCPR Pub. No. 97-0702 (Rockville, MD: Agency for Health Care Policy and Research, U.S. Department of Health and Human Services, November 1996).
Cotrell V; and Wild K. “Longitudinal study of self-imposed driving restrictions and deficit awareness in patients with Alzheimer disease.” Alzheimer Disease and Associated Disorders 1999;13(3):151-156.
Crooks VC; Buckwalter JG; Petitti DB; et al. “Self-reported severe memory problems as a screen for cognitive impairment and dementia.” Dementia 2005;4(4):539-551.
Crum RM; Anthony JC; Bassett SS; et al. “Population-based norms for the Mini-Mental State Examination by age and education level.” Journal of the American Medical Association1993;269(18):2386-2391.
Davis PB; Morris JC; and Grant E. “Brief screening tests versus clinical staging in senile dementia of the Alzheimer type.” Journal of the American Geriatrics Society1990;38(2):129-135.
DeBettignies BH;Mahurin RK; Pirozzolo FJ; et al. “Insight for impairments in independent living skills in Alzheimer’s disease and multi-infarct dementia.” Journal of Clinical and Experimental Neuropsychology 1990;12(2):355-363.
De Ronchi D; Bellini F; Berardi D: et al., “Cognitive status, depressive symptoms, and health status as predictors of functional disability among elderly persons with low-to-moderate education: The Faenza Community Aging Study.” American Journal of Geriatric Psychiatry, 2005;13(8), 672–685.
Doble SE; Fisk JD; and Rockwood K. “Dementia: Assessing the ADL functioning of persons with Alzheimer’s disease: Comparison of family informants ratings and performance-based assessment findings.” International Psychogeriatrics 1999;11(4):399-409.
Doty P; Cohen MA; Miller J; et al. “Private long-term care insurance: value to claimants and implications for long-term care financing.” Gerontologist 2010;50(5):613-622.
Dyer CB; Pavlik VN; Murphy KP; et al. “The high prevalence of depression and dementia in elder abuse or neglect.”Journal of the American Geriatrics Society 2000;48(2):205-208.
Eastwood MR; Lautenschlaeger E; and Corbin S. “A comparison of clinical methods for assessing dementia.” Journal of the American Geriatrics Society 1983;31(6):342-347.
Edelberg HK; Shallenberger E; Wei JY. “Medication management capacity in highly functioning community-living older adults: Detection of early deficits.” Journal of the American Geriatrics Society 1999;47:592-596.
Farias ST; Mungas D; Reed BR; et al., “The measurement of Everyday Cognition (Ecog): Scale development and psychometric properties.” Neuropsychology 2008;22(4):531-544.
Feher EP; Mahurin RK; Inbody SB; et al. “Anosognosia in Alzheimer’s disease.” Neuropsychiatry, Neuropsychology, and Behavioral Neurology 1991;4(2):136-146.
Fitzgerald JF; Smith DM; Martin DK; et al., “Replication of the multidimensionality of activities of daily living.” Journal of Gerontology: Social Sciences 1993;48(1):S28-S31.
Fillenbaum GG; LandermanLR; and Simonsick EM. “Equivalence of two screens of cognitive functioning: The Short Portable Mental Status Questionnaire and the Orientation-Memory-Concentration Test.” Journal of the American Geriatrics Society 1998;46(12):1512-1518.
Fillenbaum GG; Wilkinson WE; Welsh KA; et al. “Discrimination between stages of Alzheimer’s disease with subsets of Mini-Mental State Examination items.” Archives of Neurology 1994;51:916-921.
Fink M; Green M; Bender MB. “The Face-Hand Test as a diagnostic sign of organic mental syndrome.” Neurology 1952;2:46.
Fitzgerald JF; Smith DM; Martin DK; et al. “Replication of the multidimensionality of activities of daily living.” Journal of Gerontology: Social Sciences 1993;48(1):S28-S31.
Fogel BS; Brock d; GoldscheiderF; et al. Cognitive Dysfunction and the Need for Long-Term Care: Implications for Public Policy. (Washington DC: AARP Public Policy Institute, April 1994).
Foley DJ; Masaki KH; Ross GW; et al. “Driving cessation in older men with incident dementia.” Journal of the American Geriatrics Society 2000;48(8):928-930.
Folstein MF; Folstein SE; McHugh PR. “Mini-Mental State”: A practical method for grading the cognitive state of patients for the clinician.” Journal of Psychiatric Research 1975;12:189-198.
Fortinsky, RH; Fenster, JR; Judge, JO. "Medicare and Medicaid home health and Medicaid waiver services for dually eligible older adults: Risk factors for use and correlates of expenditures." Gerontologist 2004;44(6):739–749.
Fox P; Maslow K; and Zhang X. “Long-term care eligibility criteria for people with Alzheimer’s disease.” Health Care Financing Review 1999;20(4):67-85.
Freedman VA. “Family structure and the risk of nursing home admission.” Journal of Gerontology: Social Sciences 1996;51B(2):S61-S69.
Freels S; Cohen D; Eisdorfer C. “Functional status and clinical findings in patients with Alzheimer’s disease.” Journal of Gerontology: Medical Sciences 1992;47(6):M177-M182.
Fried LP; Bandeen-Roche K; Kasper, JD; et al. “Association of comorbidity with disability in older women: The Women’s Health and Aging Study.” Journal of Clinical Epidemiology 1999;52(1):27-37
Friedman JI; Harvey PD; Coleman T; et al., “Six-year follow-up study of cognitive and functional status across the lifespan in schizophrenia: A comparison with Alzheimer’s disease and normal aging.” American Journal of Psychiatry 2001;158(9):1441-1448.
Froehlich TE; Robinson JT; and Inouye SK. “Screening for Dementia in the Outpatient Setting: The Time and Change Test.” Journal of the American Geriatrics Society 46(12):1506-1511.
Fultz NH; Ofstedal MB; Herzog AR; et al. “Additive and interactive effects of comorbidphysical and mental conditions on functional health.” Journal of Aging and Health 2003;15(3):465-481.
Galasko D; Corey-Bloom J; and Thal LJ. “Monitoring progression in Alzheimer’s disease.” Journal of the American Geriatrics Society 1991;39(9):932-941.
Galvin JE; Fagan AM; Holtzman DM; et al. “Relationship of dementia screening tests with biomarkers of Alzheimer’s disease.” Brain 2010:published online Sept. 7.
Galvin JE; Roe CM; Coats MA; et al. “Patient’s rating of cognitive ability: Using the AD8, a brief informant interview, as a self-rating tool to detect dementia.” Archives of Neurology 2007;64:725-730.
Galvin JE; Roe CM; Xiong C; et al. “Validity and reliability of the AD8 informant interview in dementia.” Neurology 2006;67:1942-1948.
Galvin JE; Roe CM; Powlishta KK; et al., “The AD8: A brief informant interview to detect dementia.” Neurology 2005;65:559-564.
Ganguli M; Rodriguez E; MulsantB; et al. “Detection and Management of Cognitive Impairment in Primary Care: The Steel Valley Seniors Survey.” Journal of the American Geriatrics Society 2004;52:1668-1675.
Ganz DA; Bao Y; Shekelle PG; et al. “Will my patient fall?” Journal of the American Medical Association 2007;297(1):77-86.
Gatz M; Reynolds CA; John R; et al. “Telephone screening to identify potential dementia cases in a population-based sample of older adults.” International Psychogeriatrics2002;14:273-289.
Gill TM; Gahbauer EA; Han L; et al. “Factors associated with prehospital function among older persons admitted to a nursing home with disability after an acute hospitalization.” Journal of Gerontology: Medical Sciences 2009;64(12):1296-1303.
Gill TM; Han L;Allore HG. “Predisposing factors and precipitants for bathing disability in older persons.” Journal of the American Geriatrics Society 2007:55(4):534-540.
Gill TM; Richardson ED; and Tinetti ME.“Evaluating the risk of dependence in activities of daily living among community-living older adults with mild to moderate cognitive impairment.” Journal of Gerontology: Medical Sciences 1995;50A(5):M235-M241.
Gill TM; Robison JT; and Tinetti ME. “Predictors of recovery in activities of daily living among disabled older persons living in the community.” Journal of General Internal Medicine 1997;12(12):757-762.
Gill TM; Williams CS; Richardson ED; et al. “Impairments in physical performance and cognitive status as predisposing factors for functional dependence among nondisabled older persons.” Journal of Gerontology: Medical Sciences 1996;51A(6):M283-M288.
Givens JL; Sanft TB; and Marcantonio, ER. “Functional recovery after hip fracture: The combined effects of depressive symptoms, cognitive impairment, and delirium.” Journal of the American Geriatrics Society 2008;56(6):1075-1079.
Graham DP; KunikME; Doody R; et al. “Self-reported awareness of performance in dementia. Cog Brain Res 2005;25:144-152.
Gurland BJ; Cross P; Chen J; et al., “A new performance test of adaptive cognitive functioning: The Medication Management (MM) Test.” International Journal of Geriatric Psychiatry 1994;9:875-885)
Gurland BJ; Toner JA; Wilder DE; et al. “Impairment of communication and adaptive functioning in community-residing elders with advanced dementia: Assessment methods.” Alzheimer Disease and Associated Disorders 1994;8(Supple.1):S230-A241.
Hall KS; Hendrie HC; BrittainHM; et al. “The development of a dementia screening interview in two distinct languages.” International Journal of Methods in Psychiatric Research1993;3:1-28.
Harris PB. “The experience of living alone with early stage Alzheimer’s disease: What are the person’s concerns?” Alzheimer’s Care Quarterly 2006; 7(2), 84–94.
Heath JM; Brown M; Kobylarz FA; et al., “The prevalence of undiagnosed geriatric health conditions among adult protective services clients.” Gerontologist 2005;45(6), 820–823.
Henry JD; Thompson C; Ruffman T; et al. “Threat perception in mild cognitive impairment and early dementia.” Journal of Gerontology: Psychological Sciences 2009;64B(5):603-607.
Hinton L; Franz CE; Reddy G; et al. “Practice constraints, behavioral problems, and dementia care: Primary care physicians’ perspectives.” Journal of General Internal Medicine 2007;22(11):1487-1492.
Hirdes, JP; Fries, BE; Morris, JN; et al. "Home care quality indicators (HCQIs) based on the MDS-HC." Gerontologist 2004;44(5):665–679.
Hughes CP; Berg L; Donziger WL; et al. “New clinical scale for the staging of dementia.” British Journal of Psychiatry 1982;140:556-572.
Hurley AC; Gauthier MA; Horvath KJ; et al. “Promoting safer home environments for persons with Alzheimer’s disease: The Home Safety/Injury Model.” Journal of Gerontological Nursing 2004;30(6):43-51.
Hyde J; Perez R; and Forester B. “Dementia and Assisted Living,” Gerontologist 2007;47(Special Issue III):51–67.
Inouye SK; Robinson JR; Froehlich TE; et al. “The Time and Change Test: a simple screening test for dementia.” Journal of Gerontology: Medical Sciences 1998;53A(4):M281-M286.
Insel K; Morrow D; Brewer B; et al. “Executive function, working memory, and medication adherence among older adults.” Journal of Gerontology: Psychological Sciences 2006;61B(2):p102-p107.
Isaacs B; and Kennie AT. “The set test as an aid to the detection of dementia in old people.” British Journal of Psychiatry 1973;123:467-470.
Jacobs JW; Bernhard MR; Delgado A; et al. “Screening for organic mental syndromes in the medically ill.” Annals of Internal Medicine 1977;86:40.
Jacova C; Kertesz A; Blair M; et al. “Neuropsychological testing and assessment for dementia.” Alzheimer’s and Dementia 2007;3:299-317.
Jagger C; Matthews R; Matthews F; et al. “The burden of diseases on disability-free life expectancy in later life.” Journal of Gerontology: Medical Sciences 2007;62A(4):408-414.
Janicki MP; Heller T; Seltzer GB; et al. “Practice guidelines for the clinical assessment and care management of Alzheimer’s disease and other dementias among adults with intellectual disability.” Journal of Intellectual Disability Research 1996;40(4):374-382.
Jette AM; Tennstedt S; and Crawford S. “How does formal and informal community care affect nursing home use?” Journal of Gerontology: Social Sciences 1995;50B(1):S4-S12.
Johnson RW; and Wiener, JM. A Profile of Frail Older Americans and Their Caregivers. (Washington, D.C.: Urban Institute, 2006).
Jorm AF. “Methods of screening for dementia: a meta-analysis of studies comparing an informant questionnaire with a brief cognitive test.” Alzheimer Disease and Associated Disorders 1997;11(3):158-62.
Jorm AF. “The Informant Questionnaire on Cognitive Decline in the Elderly (IQCODE): A review.” International Psychogeriatrics 2004;16(3):275-293.
Jorm AF; and Jacomb PA. “The Informant Questionnaire on Cognitive Decline in Elderly (IQCODE): Socio-demographic correlates, reliability, validity and some norms.” Psychological Medicine 1989;19:1015-1022.
Jorm AF; and Korten AE. “Assessment of cognitive decline in the elderly by informant interview.” British Journal of Psychiatry 1988;152(2):209-213.
Jorm AF, Scott R, Jacomb PA. “Assessment of cognitive decline in dementia by informant questionnaire.” International Journal of Geriatric Psychiatry 1989;4:35-39.
Kahn RL; Goldfarb AI; Pollack M; et al. “Brief objective measures for determination of mental status in the aged.” American Journal of Psychiatry 1960;117(4):326-328.
Kales HC; Blow FC; Copeland LA, et al. “Healthcare utilization by older patients with coexisting dementia and depression.” American Journal of Psychiatry 1999;156(4):550-556.
Kapust LR; and Weintraub S. “The Home Visit: Field assessment of mental status impairment in the elderly.” Gerontologist 1988;28(1):112-115.
Katz S; Downs TD; Cash HR; et al. “Progress in the development of the Index of ADL.” Gerontologist 1970:10(1):20-30.
Katz S; Ford AB: Moskowitz RW; et al. “Studies of illness in the aged: The Index of ADL: A standardized measure of biological and psychosocial function.” Journal of the American Medical Association 1963;185:914-919.
Katzman R; Brown T; Fuld P, et al. “Validation of a short orientation-memory-concentration test of cognitive impairment.” American Journal of Psychiatry 1983;140:734-739.
Kawas CH. “Early Alzheimer’s disease.” New England Journal of Medicine 2003;349(11):1056-1063.
Kawas C; Karagiozis H; Resau L; et al. “Reliability of the Blessed Telephone Information-Memory-Concentration Test.” Journal of Geriatric Psychiatry and Neurology 1995;8:238-242.
Kawas C; Segal J; Stewart WF; et al. “A validation study of the Dementia Questionnaire.”Archives of Neurology 1994;51:901-906.
Kemp NM; Brodaty H; Pond D; et al. “Diagnosing dementia in primary care: The accuracy of informant reports.” Alzheimer Disease and Associated Disorders 2002;16(3):171-176.
Kempen GIJM; andSuurmeijer TPBM. “The development of a hierarchical polychotomous ADL-IADL scale for noninstitutionalized elders.” Gerontologist 1990;30(4):497-502.
Kiely DK; Morris JN; and Algase DL. “Resident characteristics associated with wandering in nursing homes. International Journal of Geriatric Psychiatry 2000;15:1013-1020.
Kind AJH; Smith MA; Frytak JR; et al. “Bouncing back: Patterns and predictors of complicated transitions 30 days after hospitalization for acute ischemic stroke.” Journal of the American Geriatrics Society 2007;55(3):365-373.
Kind AJH; Smith MA; Liou J-I; et al. “The price of bouncing back: One-year mortality and payments for acute ischemic stroke patients with 30-day bounce-backs.” Journal of the American Geriatrics Society 2008;56(6):999-1005.
Klein DA; Steinberg M; Galik E; et al. “Wandering behavior in community-residing persons with dementia.” International Journal of Geriatric Psychiatry 1999;14(4):272-279.
Knopman DS; Knudson D; Yoes ME; et al. “Development and standardization of a new telephonic cognitive screening test: the Minnesota Cognitive Acuity Screen (MCAS).” Neuropsychiatry, Neuropsychology, and Behavioral Neurology. 2000;13:286-296.
Knopman DS; Peterson RC; Cha RH; et al., “Incidence and causes of nondegenerative nonvascular dementia: a population-based study.” Archives of Neurology 2006;63:218-221.
Kulansky G; Buschke H; Katz M; et al. “Screening for Alzheimer’s disease: The Memory Impairment Screen versus the conventional 3-word memory test.” Journal of the American Geriatrics Society 2002;50(6):1086-1091.
Lachs MS; Williams C; O’Brien S; et al. “Risk factors for reported elder abuse and neglect: A nine-year observational cohort study.” Gerontologist 1997;37(4):469-474.
Lanska DJ; Schmitt FA; Stewart JM; et al. “Telephone-Assessed Mental State.” Dementia 1993;4:117-119.
Lavery LL; Lu S-Y; Chang C-CH; et al. “Cognitive assessment of older primary care patients with and without memory complaints.” Journal of General Internal Medicine 2007:22:949-954.
Lawton MP; and Brody EM. “Assessment of older people: Self-maintaining and instrumental activities of daily living.” Gerontologist1969;9(3):179-186.
Lehmann SW; Black B; Shore A; et al. “Living alone with dementia: Lack of awareness adds to functional and cognitive vulnerabilities.” International Psychogeriatrics 2010;22(5):778–784.
Lipton RB, Katz MJ, Kuslansky G, et al. “Screening for dementia by telephone using the Memory Impairment Screen.” Journal of the American Geriatrics Society 2003;51:1382-1390.
Logsdon RG; Teri L; McCurry SM; et al., “Wandering: A significant problem among community-residing individuals with Alzheimer’s disease.” Journal of Gerontology: Psychological Sciences1998;53B(5):P294-P299.
Lorentz WJ; Scanlan JM; and Boorson S. “Brief screening tests for dementia.”2002;47(8):723-733.
Lowenstein DA; Arguelles S; Bravo M; et al. “Caregivers’ judgments of the functional abilities of the Alzheimer’s disease patient: A comparison of proxy reports and objective measures.” Journal of Gerontology: Psychological Sciences 2001;56B(2):P78-P84.
Mackinnon A; and Mulligan R. “Combining cognitive testing and informant report to increase accuracy in screening for dementia.” American Journal of Psychiatry 1998;155(11):1529-1535.
Mahoney, DF. “Vigilance: Evolution and definition for caregivers of family members with Alzheimer’s disease.” Journal of GerontologicalNursing 2003;29(8):24–30.
Mahoney DF; Jones RN; Coon DW; et al. “The Caregiver Vigilance Scale: Application and Validation in the Resources for Enhancing Alzheimer’s Caregiver Health (REACH) Project.” American Journal of Alzheimer’s Disease and Other Dementias 2003;18(1):39-48.
Mahoney JE; Eisner J; Havighurst T; et al. “Problems of older adults living alone after hospitalization.” Journal of General Internal Medicine 2000;15:611-619.
Makin RS; Ayalon L; Feliciano L; et al. “The sensitivity and specificity of cognitive screening instruments to detect cognitive impairment in older adults with severe psychiatric illness.” Journal of Geriatric Psychiatry and Neurology 2010;23(2):94-99.
Man-Son-Hing M; Marshall SC; Molnar FJ; et al. “Systematic review of driving risk and the efficacy of compensatory strategies in persons with dementia.” Journal of the American Geriatrics Society 2007;55(6):878-884.
Mattis S. “Mental status examination for organic mental syndrome in the elderly patient.” Geriatric Psychiatry L. Bellackand TB Karasu (eds) (New York: Grune & Stratton 1976:77-121.
McCarten JR; Rottunda SJ; and Kuskowski MA.“Change in the mini-mental state exam in Alzheimer’s disease over 2 years: The experience of a dementia clinic.” Journal of Alzheimer’s Disease 2004;6:11-15.
McDaniel KD; Edland SD; Heyman A; et al. “Relationship between level of insight and severity of dementia in Alzheimer disease.” Alzheimer Disease and Associated Disorders1995;9(2):101-104.
McDowell I; Kristjansson B; Hill GB; et al. “Community screening for dementia: The Mini Mental State Exam (MMSE) and Modified Mini-Mental State Exam (3MS) compared.” Journal of Clinical Epidemiology 1997;50(4):377-383.
McGlynn SM; and Kaszniak AW. “When metacognition fails: Impaired awareness of deficit in Alzheimer’s disease.” Journal of Cognitive Neuroscience 1991;3(2):183-189.
McGuire LC; Ford ES; and Ajani UA. “Cognitive functioning as a predictor of functional disability in later life.” 2006;14(1):36-42.
Mehta KM; Yaffe K; and Covinsky KE. “Cognitive impairment, depressive symptoms, and functional decline in older people.” Journal of the American Geriatrics Society2002;50(6):1045-1052.
MetLife Mature Market Institute. The MetLife Study of Alzheimer’s Disease: The Caregiving Experience. Aug. 2006. Available at http://www.maturemarketinstitute.com.
Miller VS; Shi X; and Cohen MA. Private Long-Term Care Insurance: Following an Admission Cohort over 28 Months to Track Claim Experience, Service Use and Transitions. Report prepared for the Office of Disability, Aging, and Long-Term Care Policy, Office of the Assistant Secretary for Planning and Evaluation, U.S. Department of Health and Human Services, April 2008.
Miller RR; Zhang Y; Silliman RA; et al. “Effect of medical conditions on improvement in self-reported and observed functional performance of elders.” Journal of the American Geriatrics Society 2004;52(2):217-223.
Milne A; Culverwell A; Guss R; et al. “Screening for dementia in primay care: a review of the use, efficacy and quality of measures.”International Psychogeriatrics 2008;20(5):911-926.
Mitchell, G; Salmon, JR; Polivka, L; Soberon-Ferrer, H. "The relative benefits and cost of Medicaid home- and community-based services in Florida." Gerontologist 2006;46(4):483–494.
Mitnitski AB; Graham JE; Mogilner AJ; et al., “The rate of decline in function in Alzheimer’s disease and other dementias.” Journal of Gerontology: Medical Sciences 1999:54A(2):M65-M69.
Mojtabai R; and Olfson M. “Cognitive deficits and the course of major depression in a cohort of middle-aged and older community-dwelling adults.”Journal of the American Geriatrics Society 2004;52(7):1060-1069.
Molnar FJ; Wells GA; and McDowell I. “The derivation and validation of the Ottawa 3D and Ottawa 3DY three- and four-questions screens for cognitive impairment.” Clinical Medicine: Geriatrics 2008;2:1-11.
Moody-Ayers SY; Mehta KM; Lindquist K; et al. “Black-white disparities in functional decline in older persons: The role of cognitive function.” Journal of Gerontology: Medical Sciences 2005;60A(7):933-939.
Moore DJ; Palmer BW; and Jeste DV.“Use of the Mini-Mental State Exam in middle-aged and older outpatients with schizophrenia.” American Journal of Geriatric Psychiatry 2004;12:412-419.
Moritz DJ; Kasl SV; and Berkman LF. “Cognitive functioning and the incidence of limitations in activities of daily living in an elderly community sample.” American Journal of Epidemiology 1995;141(1):41-49.
Morris JC. “Clinical Dementia Rating (CDR): Current version and scoring rules.” Neurology 1993;43:2412-2414.
Morris J. “Clinical dementia rating: a reliable and valid diagnostic and staging measure for dementia of the Alzheimer type.” InternationalPsychogeriatrics 1997;9:177-178.
Moritz DJ; KaslSV; and Berkman LF. “Cognitive functioning and the incidence of limitations in activities of daily living in an elderly community sample.” American Journal of Epidemiology 1995;141(1):41-49.
Mulligan R; Mackinnon A; Jorm AF; et al. “A comparison of alternative methods of screening for dementia in clinical settings.” Archives of Neurology 1996;53(6):532-536.
Mulrow CD; Gerety MB; Cornell JE; et al. “The relationship between disease and function and perceived health in very frail elders.” Journal of the American Geriatrics Society1994;42(4):374-380.
Mundt JC; and Griest JH. “Symptoms of Dementia Screener (SDS): Treatment and Community Screening,” abstract.
Murtaugh C; Peng T; Totten A; et al. “Complexity in geriatric home healthcare.” Journal for Healthcare Quality 2009;31(2):34-43.
Nasreddine ZS; Phillips NA; BedirianV; et al., “The Montreal Cognitive Assessment (MoCA: A brief screening tool for mild cognitive impairment.” Journal of the American Geriatrics Society 2005;53(4):695-699.
Nazem S; Siderowf AD; Duda JE; et al. “Montreal Cognitive Assessment performance in patients with Parkinson’s Disease with ‘normal’ global cognition according to Mini-Mental State Examination Score.” Journal of the American Geriatrics Society 2009;57(2):304-308.
National Alliance for Caregiving/AARP survey on caregiving in the United States, 2009; data were prepared for the Alzheimer’s Association under contract with Matthew Greenwald and Associates, Nov. 11, 2009.
Njegovan V; Man-Son-Hing M; Mitchell SL; et al., “The hierarchy of functional loss associated with cognitive decline in older persons.” Journal of Gerontology: Medical Sciences 2001;56A(10):M638-M643.
Norton MC, Tschanz JAT, Fan X, et al., “Telephone adaptation of the Modified Mini-Mental State Exam (T3MS): The Cache County Study.” Neuropsychiatry, Neuropsychology, and Behavioral Neurology.1999;12:270-276.
O’Keeffe J; Maier J; and Freiman MP.Assistive Technology for People with Dementia and Their Caregivers at Home: What Might Help (Washington DC: Administration on Aging, Sept. 16, 2010).
O’Keeffe J; andSiebenaler K. Adult Day Services: A Key Community Service for Older Adults (Washington DC: U.S. Department of Health and Human Services, Office of the Assistant Secretary for Planning and Evaluation, July 2006).
Olde Rikkert MGM; van der Flier, WM; deLeeuw E; et al. “Multiple diagnostic tests are needed to assess multiple causes of dementia.” Archives of Neurology 2006;63:144-146.
Overall JE; Scott J; Rhoades HM. “Empirical scaling of the stages of cognitive decline in senile dementia.” Journal of Geriatric Psychiatry and Neurology 1990;3:212-220.
Ownby RL. “Medication adherence and cognition.” Geriatrics 2006;61(2):30-35.
Paveza G; VandeWeerd C; and Laumann E. “Elder self-neglect: A discussion of a social typology.” Journal of the American Geriatrics Society 2008;56(Supple. 2):S271-S275.
Pavlik VN; Hyman DJ; Dyer CB; et al., “Quantifying the problem of abuse and neglect in adults—analysis of a statewisedatabase.” Journal of the American Geriatrics Society 2001;49(1):45-48.
Penrod JE; Litke a; Hawkes WG; et al. “The association of race, gender, and comorbidity with mortality and function after hip fracture.” Journal of Gerontology: Medical Sciences2008;63A(8):867-872.
Perkinson MA; Berg-Weger ML; Carr DB; et al. “Driving and dementia of the Alzheimer type: Beliefs and cessation strategies among stakeholders.” Gerontologist 2005;45(5):676-685.
Pia L; and Conway PM. “Anosognosia and Alzheimer’s disease.”Brain Impairment;2008;9(1):22-27
Pfeffer RI; Kurosaki TT; Harrah CH; et al. “Measurement of functional activities in older adults in the community.” Journal of Gerontology 1982;37(3):323-329.
Pfeiffer E. “A short portable mental status questionnaire for the assessment of organic brain deficit in elderly patients.” Journal of the American Geriatrics Society 1975;23(10):433-441.
Prescop KL, Dodge HH, Morycz RK, et al. “Elders with dementia living in the community with and without caregivers: an epidemiological study.”International Psychogeriatrics1999;11:235-250.
Reed AT; Lach HW; Smith L; et al. “Alzheimer’s disease and the need for supervision.” American Journal of Alzheimer’s Care and Related Disorders and Research 1990;5(5): 29-34.
Reed BR; Jagust WJ; and Seab JP. “Mental status as a predictor of daily function in progressive dementia.” Gerontologist 1989;29(6):804-807.
Reisburg B; Ferris SH; de Leon M; et al. “The Global Deterioration Scale for assessment of primary degenerative dementia.” American Journal of Psychiatry 1982;139:1136-1139.
Reisberg B; Ferris SH: FranssenE. “An ordinal functional assessment tool for Alzheimer’s-type dementia.” Hospital and Community Psychiatry 1985;36(6):593-595.
Reisberg B; Schneck MK; Ferris SH; et al. “The Brief Cognitive Rating Scale (BCRS): Findings in primary degenerative dementia (PDD).” Psychopharmacologic Bulletin 1983;19:47-50.
Reuben DB; Roth C; Kamberg C; et al. “Restructuring primary care practices to manage geriatric syndromes: The ACOVE-2 Intervention.” Journal of the American Geriatrics Society2003;51(12):1787-1793.
Ritchie K. “The screening of cognitive impairment in the elderly: A critical review of current methods.” Journal of Clinical Epidemiology 1988;41(7):635-643.
Rockwood K; Strang d; MacKnightc; et al. “Interrater reliability of the Clinical Dementia Rating in a multicenter trial.” Journal of the American Geriatrics Society 2000;48(5):558-559.
Rosen WG; Mohs RC; and Davis KL. “A new rating scale for Alzheimer’s disease.” American Journal of Psychiatry 1984;141(11):1356-1364.
Rowe MA; and Bennett. “A look at deaths occurring in persons with dementia lost in the community.” American Journal of Alzheimer’s Disease and Other Dementias 2003;18(6):343-348.
Rowe MA; and Glover JC. “Antecedents, descriptions and consequences of wandering in cognitively-impaired adults and the Safe Return (SR) program.” American Journal of Alzheimer’s Disease and Other Dementias 2001;16(6):344-352.
Royall DR; Cabello M; and Polk MJ. “Executive dyscontrol: An important factor affecting the level of care received by older retirees.” Journal of the American Geriatrics Society 1998a;46(12):1519-1594.
Royall, DR; Chiodo, LK; and Polk, MJ.“An empiric approach to level of care determinations: The importance of executive measures.” Journal of Gerontology: Medical Sciences 2005a;60A(8):M1059-M1064.
Royall DR; Choido LK; and Polk MJ.“Correlates of disability among elderly retirees with ‘subclinical’ cognitive impairment.” Journal of Gerontology: Medical Sciences 2000;55a(9):M541-M546.
Royall DR; Cordes JA; Polk M. “CLOX: An executive clock drawing task.”Journal of Neurology and Neurosurgery and Psychiatry 1998b;64:588-594.
Royall DR; Mahurin RK; and Gray KF.“Bedside assessment of executive cognitive impairment: The Executive Interview.” Journal of the American Geriatrics Society 1992;40(12):1221-1226.
Royall DR; Mahurin RK; True JE; et al., “Executive impairment among the functionally dependent: Comparisons between schizophrenic and elderly subjects.” American Journal of Psychiatry 1993;150(12):1813-1819.
Royall DR; Palmer R; Chiodo LK; et al. “Executive control mediates memory’s association with change in Instrumental Activities of Daily Living: The Freedom House Study.” Journal of the American Geriatrics Society 2005b;53(1):11-17.
Rymer S; Salloway S; Norton L; et al. “Impaired awareness, behavior disturbance, and caregiver burden in Alzheimer disease.” Alzheimer Disease and Associated Disorders 2002;16(4):248-253.
Salive ME; Collins KS; Foley DJ: et al. “Predictors of nursing home admission in a biracial population.” American Journal of Public Health 1993;83(12):1765-1767.
Sands LP; Yaffe C; CovinskyK; et al. “Cognitive screening predicts magnitude of functional recovery from admission to 3 months after discharge in hospitalized elders.” Journal of Gerontology: Medical Sciences 2003;58A(1):37-45.
Schmeidler J; Mohs RC; Aryan M. “Relationship of disease severity to decline on specific cognitive and functional measures in Alzheimer disease.”Alzheimer Disease and Associated Disorders 1998;12(3):146-151.
Schneider JA; Arvanitakis Z; Bang W; et al. “Mixed brain pathologies account for most dementia cases in community-dwelling older persons.” Neurology 2007;69:2197–2204.
Schonfeld L; King-Kallimanis B; Brown LM: et al. “Wanderers with cognitive impairment in Department of Veterans Affairs nursing home units.” Journal of the American Geriatrics Society 2007;55(5):692-699.
Schulz R; Mendelsohn AB; Haley WE; et al. “End-of-life care and the effects of bereavement on family caregivers of persons with dementia.” New England Journal of Medicine 2003;349(20):1936–42.
Seltzer B; Vasterling JJ; Yoder J; et al. “Awareness of deficit in Alzheimer’s disease: Relation to caregiver burden.” Gerontologist 1997;37(1):20-24.
Shapiro e; and Tate R. “Who is really at risk of institutionalization?” Gerontologist 1988;28(2):237-245.
Shay KA; Duke LW; Conboy T; et al., “The clinical validity of the Mattis Dementia Rating Scale in staging Alzheimer’s dementia.” Journal of Geriatric Psychiatry and Neurology 1991;4:18-25.
Shiroky JS; Schipper HM; Bergman H; et al. “Can you have dementia with an MMSE score of 30.” American Journal of Alzheimer’s Disease and Other Dementias 2007;22(5):406-415.
Shulman KI, Shedletsky R, and Silver IL. “The challenge of time: Clock-drawing and cognitive function in the elderly.” International Journal of Geriatric Psychiatry 1986:1:135-140.
Skurla E; Rogers JC; and Sunderland T. “Direct assessment of activities of daily living in Alzheimer’s disease: A controlled study.” Journal of the American Geriatrics Society1988;36(2):97-103.
Smith AL; Wang P-C; Anger JT; et al. “Correlates of urinary incontinence in community-dwelling older Latinos.” Journal of the American Geriatrics Society 2010;58(6):1170-1176.
Smyer MA; Hofland BF; and Jonas EA. “Validity study of the Short Portable Mental Status Questionnaire for the elderly.” Journal of the American Geriatrics Society 1979;27(6):263-269.
Snow A, Norris M, Doody R, et al. Dementia Deficits Scale: Rating Self-Awareness of Deficits. Alzheimer Disease and Associated Disorders 2004;18:22-31.
Solomon PR; Hirschoff A; Kelly B; et al. “A 7-minute neurocognitive screening battery highly sensitive to Alzheimer’s Disease.” Archives of Neurology 1998;55:349-355.
Solomon PR; and Pendlebury WW.“Recognition of Alzheimer’s Disease: The 7 Minute Screen.” Family Medicine 1998;30(4):265-271.
Spector WD “Measuring functioning in daily activities for persons with dementia.” Alzheimer Disease and Associated Disorders 1997;11(Supple. 6):81-90.
Spector WD; Katz S; Murphy JB; et al. “The hierarchical relationship between activities of daily living and instrumental activities of daily living.” Journal of Chronic Disease 1987;40(6):481-489.
Spector WD; and Kemper P. “Disability and cognitive impairment criteri: Targeting those who need the most home care.” Gerontologist 1994;34(5):640-651.
SpiersNA; Matthews RJ; Jagger C; et al. “Diseases and impairments as risk factors for onset of disability in the older population in England and Wales: Findings from the Medical Research Council Cognitive Function and Ageing Study.” Journal of Gerontology: Medical Sciences 2005;60A(2):248-54.
Staff of the Benjamin Rose Hospital. “Multidisciplinary studies of illness in aged persons: II. A new classification of functional status in activities of daily living.” Journal of Chronic Disease 1959;9:55-62.
Stern Y; Albert SM; Sano M; et al., “Assessing patient dependence in Alzheimer’s disease.” Journal of Gerontology: Medical Sciences 1994;49(5):M216-M222.
Stutts JC; Stewart JR; and Martell C. “Cognitive test performance and crash risk in an older driver population.” Accident Analysis and Prevention 1998;30(3):337-346.
Sunderland T; Hill JL; Mellow AM; et al. “Clock drawing in Alzheimer’s disease: a novel measure of dementia severity.” Journal of the American Geriatrics Society 1989;37:725-729
Teng EL, Hasegawa K, Homma A, et al. “The Cognitive Abilities Screening Instrument: (CASI): A practical test for cross-cultural epidemiological studies of dementia.” International Psychogeriatrics 1994;6:45-58.
Tappen RM. “Development of the Refined ADL Assessment Scale for patients with Alzheimer’s and related disorders.” Journal of Gerontological Nursing 1994;20(6):36-42.
Temkin-Greener H; and Meiners MR. “Transitions in long-term care.”Gerontologist1995;35(2):196-206.
Teng EL; and Chui HC. “The Modified Mini-Mental State (3MS) Examination.” Journal of Clinical Psychiatry 1987:48(8):314-318.
Teng EL; Hasegawa K; Homma a; et al. “The Cogntiive Abilities Screening Instrument: A practical test for cross-cultural epidemiological studies of dementia.” International Psychogeriatrics 1994;6(1):45-58.
Teng EL; Larson EB; Lin KN; et al. “Screening for dementia: The Cognitive Abilities Screening Instrument – Short Version (CASI-Short).” Clinical Neuropsychologist 1998;12:256 (abstract)
Thralow JU; and Rueter MJS. “Activities of daily living and cognitive levels of function in dementia.” The American Journal of Alzheimer’s Care and Related Disorders & Research 1993;September/October:14-19.
Tierney MC; Charles J; Snow WG; et al. “Prediction of use of emergency community services by cognitively impaired seniors who live alone: Preliminary findings of a prospective study.” Alzheimer’s Disease: Advances in Etiology, Pathogenesis and Therapeutics K. Iqbal, S.S. Sisodia, and B. Winblad (eds.) (John Wiley & Sons, 2001).
Tierney MC; Charles J; Naglie G; et al. “Risk factors for harm in cognitively impaired seniors who live alone: A prospective study.” Journal of the American Geriatrics Society2004;52(9):1435-1441.
Tierney MC; Snow G; Charles J; et al. “Neuropsychological predictors of self-neglect in cognitively impaired older people who live alone.” American Journal of Geriatric Psychiatry 2007;15(2):140-148.
Tinetti ME; Doucette J; Claus E. et al. “Risk factors for serious injury during falls by older persons in the community.” Journal of the American Geriatrics Society 1995;43(110:1214-1221.
Tombaugh TN; and McIntyre NJ. “The Mini-Mental State Examination: A comprehensive review.” Journal of the American Geriatrics Society 1992;40(9):922-935.
U.S. Department of Health and Human Services, Centers for Medicare and Medicaid Services. Nursing Home Data Compendium, 2009 Edition, 2010.
Valcour VG; Masaki KH; Curb JD; et al. “The detection of dementia in the primary care setting.” Archives of Internal Medicine 2000;160:2964-2968.
Van Gorp WG; AltshulerL; Theberge DC; et al., “Cognitive impairment in euthymic bipolar patients with and without prior alcohol dependence.” Archives of General Psychiatry1998;55(1):41-46.
Vesterling JJ; Seltzer B; and Watrous WE. “Longitudinal assessment of deficit unawareness in Alzheimer’s disease.” Neuropsychiatry Neuropsychology and Behavioral Neurology 1997;10(3):197-202.
Veterans Health Administration, Office of the Medical Inspector. Final Report: Firearm Access and Automobile Driving Among Veterans with Dementia (Washington DC: Department of Veterans Affairs, June 18, 2004.
Vitaliano PP; Breen AR; Russo J; et al. “The clinical utility of the Dementia Rating Scale for Assessing Alzheimer’ Patients.” Journal of Chronic Disease 1984;37(9/10):743-753.
Wagner MT; Rayls KR; and Bachman DL.“The measurement of unawareness of cognitive loss and its application in AD.” Research and Practice in Alzheimer's Disease 1999;2:162–167.
Wagner MT; Spangenberg KB; Bachman DL; et al. “Unawareness of cognitive deficit in Alzheimer’s disease and related dementias.” Alzheimer’s Disease and Associated Disorders1997; 11(3):125–131.
Waite L; Grayson D; Jorm AF; et al. “Informant-based staging of dementia using the Clinical Dementia Rating.”Alzheimer Disease and Associated Disorders 1999;13(1):34-37.
Wang L; vanBelle G; Kukull WB; et al. “Predictors of functional change: A longitudinal study of nondementedpeople aged 65 and older.” Journal of the American Geriatrics Society 2002;50(9):1525-1534.
Webber PA, Fox P, and Burnette D. “Living alone with Alzheimer’s disease: Effects on health and social service utilization patterns.” Gerontologist 1994;34:8-14.
Weintraub S; Baratz R; and Marsel Mesulam M. “Daily living activities in the assessment of dementia.” Alzheimer’s Disease: A Report of Progress (Aging. Vol. 19) S. Corkin et al. (eds). (New York NY: Raven Press, 1982).
Weissert WG; Elston JM; Koch GG. Risk of Institutionalization: 1977-1985: Final Report. Contract report prepared for the Assistant Secretary for Planning and Evaluation, U.S. Department of Health and Human Services, July 24, 1990.
Welsh KA; Breitner JCS; Magruder-Habib KM. “Detection of dementia in the elderly using telephone screening of cognitive status.” Neuropsychiatry Neuropsychology and Behavioral Neurology 1993;6:103-110.
White N; Scott a; Woods RT, et al. “The limited utility of the Mini-Mental State Examination in screening people over the age of 75 for dementia in primary care.” British Journal of General Practice 2002;52:1002-1003.
Willis SL. “Everyday cognitive competence in elderly persons: Conceptual issues and empirical findings.” Gerontologist 1996;36:595-601.
Winograd CH. “Mental status tests and the capacity for self-care.” Journal of the American Geriatrics Society 1984;32(1):49-55.
Wolf-Klein GP; Silverstone FA; Levy AP; et al. “Screening for Alzheimer’s disease by clock drawing.” Journal of the American Geriatrics Society 1989;37:730-734.
Wolff JL; Bould C; Boyd C; et al. “Newly reported chronic conditions and onset of functional disability.” Journal of the American Geriatrics Society2005;53(5):851-855.
Wolinsky FD; Callahan CM; Fitzgerald JF; et al. “Changes in functional status and the risk of subsequent nursing home placement and death.”Journal of Gerontology: Social Sciences 1993;48(3):S93-S101.
Yaffe K; Fox P; Newcomer R; et al. “Patient and caregiver characteristics and nursing home placement in patients with dementia.” Journal of the American Medical Association 2002;287(16), 2090–2097.
Yaffe K; Lindquist K; Vittinghoff E; et al. “The effect of maintaining cognition on risk of disability and death.” Journal of the American Geriatrics Society 2010;58(5):889-894.
Zanetti O; Vallotti B; Frisoni GB; et al. “Insight in dementia: When does it occur? Evidence for a nonlinear relationship between insight and cognitive status.” Journal of Gerontology: Psychological Sciences 1999;54B(2):P100-P106.
Notes
-
The Health Insurance Portability and Accountability Act of 1996 (HIPAA) created a new federal income tax deduction for premiums for long-term care insurance policies that met requirements defined in the Act, including required benefit triggers.
-
Dr. Cohen indicated that ASPE is aware of the report. This contractor has not seen the report as of Oct. 11, 2010.
-
The ADLs and IADLs listed in the order in which they were lost in the study by Njegovan et al. (2001) are as follows, from those lost first (i.e., in people with less cognitive impairment) to those lost last (i.e., in people with more cognitive impairment): doing housework, shopping, bathing, walking, transportation, meal preparation, toileting, using the telephone, managing money, transferring, managing medications, dressing, grooming, and eating.
-
The FAST scale also includes substages in stages 6 and 7. At least one of these substages is used for determining eligibility for services, in this case, eligibility for Medicare-covered hospice care.
-
The Alzheimer’s Disease Assessment Scale has 11 items to measure “noncognitive behavior,” but these items seem to be rarely used.)
Strategic Analysis of HHS Entry into the Long Term Care Insurance Market
David Dranove1
Cory Capps2
Leemore Dafny1
I. Introduction
Despite the potentially catastrophic costs of long term care, fewer than 3% of Americans have long term care insurance (LTCI). In order to increase LTCI coverage, the CLASS Act authorizes the Department of Health and Human Services HHS to offer a government-sponsored long term care insurance product (henceforth, CLTCI) alongside the offerings of private insurers. A key requirement of the CLASS Act is that projected revenues from CLTCI must equal or exceed expenses; that is, the product should be designed to at least break even. A second key requirement is that CLTCI cannot medically underwrite its basic policies; instead, initial premiums can vary only according to age at enrollment. HHS may be able to offer additional plans not described by the CLASS Act; it is not clear if HHS can medically underwrite these offerings. A third key feature is that employers that participate in the CLASS plan must automatically enroll their employees, who in turn can opt out of the program.3 HHS has asked us to assess whether CLTCI is likely to be financially viable and to provide recommendations that would increase the appeal and viability of CLTCI.
In short, we have been asked to determine whether CLTCI can profitably enter the LTCI market. Although it is tempting to perform such an analysis by projecting revenues and expenses, such projections often prove to be highly speculative. Instead, we perform a strategic analysis of the LTCI market in general and possible CLTCI designs in particular. Strategic analysis, as exemplified by Michael Porter’s Competitive Strategy and Besanko, Dranove, et al’s Economics of Strategy, considers whether the underlying economic conditions of a market enable the participants to prosper and, at the same time, assesses whether there are profitable opportunities for entry.
We employ three classic tools of strategic analysis:
-
Industry Mapping provides a basic set of facts about the industry that are required to understand the nature of competition and the potential for entry.
-
Industry analysis assesses the competitiveness of a market, whether market conditions are likely to support profitability, and how incumbent firms are likely to respond to entry.
-
Positioning analysis of a specific firm assesses the relative strengths and weaknesses of that firm and whether it can prosper by outperforming its rivals.
II. Industry Mapping
Despite the potential value of LTCI for many Americans, the LTCI market is very small.4 Approximately 8 million Americans currently have LTCI; this corresponds to about 2.5% of the total population and 3.5% of the working-age population.5 There have been many theories advanced for the relatively small size of the market, including the high cost of coverage, uncertainty about the need for LTCI, the availability of Medicaid to pay for long term care expenses, and the notion that individuals may be reluctant to forego consumption today in order to protect their estates.6 We will not speculate as to the merits of these theories but will identify ways that existing LTCI products may fail to meet the needs of potential customers.
Table 1 reports total premiums collected (in $millions) for all LTCI policies.7
| TABLE 1: Size of the Long Term Care Insurance Market (in $millions) | |||
|---|---|---|---|
| All Markets | Group (2008) | Individual (2009) | |
| All policies* | $7,065 | $1,043 | $6,022 |
| New policies | $924 | $187 | $737 |
| * Includes renewals | |||
Annual premium revenues from new and existing products exceed $7 billion, which represents less than 3% of overall expenditures on nursing and home health in 2008.8 In contrast, premiums for traditional private health insurance represent approximately 37% of healthcare expenditures (excluding nursing and home health).9 The individual market for LTCI is approximately five times larger than the group market, although the group market has gained on the individual market in terms of new sales. (Prior to the recession, the group growth rate has averaged 18 percent versus 12 percent for the individual market.) This reverses the predominant pattern in private health insurance where, due to tax subsidies and pooling to reduce adverse selection, the group market is far larger than the individual market.
a. Channels
LTCI is typically sold by life insurance companies. This reflects the idea that individuals who purchase LTCI are trying to protect the value of their estates. As seen in Table 1, the vast majority of LTCI is sold in the individual insurance market. These policies are sold by agents for life insurance companies or by independent insurance brokers. These agents and brokers invest considerable effort identifying customers who are interested in protecting their estates and offer LTCI as a natural adjunct to life insurance. LTCI in the group market is usually sold in conjunction with group life insurance.
By all accounts, insurance agents receive substantial commissions. Although we do not have specific information about LTCI, we can gain insight by considering commissions for life insurance.10 While commissions vary somewhat by firm, the typical first year commission for life insurance products is 30-50% (whole life) and 90% (term life). Commissions run 5% per year thereafter.11 Commissions may be higher for independent agents and lower for company agents. Overall, the average commission over the lifetime of an LTCI policy appears to be in the neighborhood of 10 percent.
We are uncertain whether group LTCI commissions are different from individual LTCI commissions. Because the high cost of commissions has a crucial role to play in assessing CLASS insurance viability, and because the group market is growing relative to the individual market, it will be helpful to resolve this uncertainty.
Brokers are uncertain as to how the CLASS Act will affect their business. As might be expected from incumbent firms concerned about a potential entrant, some LTCI companies are encouraging brokers to give negative information about the act.12
b. Characteristics of Policies Sold
Agents and brokers play another important role in the LTCI market; they inform consumers about a myriad of potentially confusing features. Some of these features help protect insurers against adverse selection. These include:
-
Pricing Structure. Premiums for LTCI are intended to be fixed for the duration of the policy. The amount depends largely on the enrollee’s age when they first purchase coverage. Most enrollees are currently in their 50s and 60s. If coverage lapses, an individual may reenroll, but the premium is based on their age at reenrollment. Although it can be very costly for individuals to let coverage lapse, the drop-out rate is considerable and drop-outs are an important source of profits for LTCI carriers.
Notwithstanding the “fixed premium” policy design, all stock companies issuing LTCI have requested and received approval for rate increases for existing policyholders in order to cover “unexpected” increases in projected spending. Increases have ranged up to 40%. (Mutual companies have not done so.)13
-
Maximum Daily Benefit. Nearly all LTCI policies reimburse caregivers up to a maximum pre-specified amount, known as the maximum daily benefit. Most private carriers offer a wide range of maximum daily benefits up to $400 or higher. The CLASS Act requires that HHS offer an LTCI product with a minimum average daily benefit of $50. The minimum benefit is very small relative to private sector LTCI, where the median maximum daily benefit is about $150. Indeed, only 12% of new individual policies and 18% of new group policies have daily benefits of $99 or less.14 Approximately half of all new policies offer at least $150 in daily benefits. 70 percent of individual policies and 90 percent of group policies have some sort of inflation adjustment for benefits.
-
Elimination Period. The number of days that the policy holder must be eligible for long term care before insurance coverage begins. Although most carriers offer a number of options for the elimination period, the typical period for nursing homes is usually 90-100 days. Some policies have a much shorter elimination period for home care. The CLASS Act does not specify any particular elimination period for CLASS insurance.
-
Benefit Period. Benefit periods range in length; many policies will pay benefits for no more than 5 years after the initial claim. Unlike private plan, the CLASS Act does not limit the benefit period for CLASS Act insurance.
There are additional features including inflation adjustments, pricing of spouses’ policies, handling of premiums upon the death of the enrollee, and future purchase options. Customers often ask brokers and agents to price out a very generous policy and then ratchet down the features until the premium fits their budget. The complexity of this process helps explain the important role of the broker/agent.
c. Market Structure
Nearly all of the leading sellers of LTCI are also very active in the life insurance market.
Table 2a lists the leading carriers in the group market measured by share of premiums for new policies written in 2007. Table 2b lists the leading carriers in the individual market for 2009. The tables also indicate the year in which each company (or its corporate predecessor) was founded. We do not know when each firm entered the LTCI market.
| TABLE 2a: National Market Shares and Year of Founding--Group Market, 2007 | ||
|---|---|---|
| Carrier | Share | Year Company Founded |
| John Hancock | .327 | 1862 |
| UNUM1 | .195 | 1863 |
| MetLife | .112 | 1863 |
| CAN | .083 | 1897 |
| Prudential | .071 | 1875 |
| Genworth | .012 | 1871 |
| “Fringe” carriers not surveyed | .200 | n/a |
|
||
| TABLE 2b: National Market Shares and Year of Founding--Individual Market, 2009 | ||
|---|---|---|
| Carrier | Share | Year Company Founded |
| John Hancock | .240 | 1862 |
| Genworth | .222 | 1871 |
| Northwestern | .076 | 1857 |
| MetLife | .075 | 1863 |
| Bankers Life | .055 | 1879 |
| New York Life | .044 | 1841 |
| Prudential | .037 | 1875 |
| MassMutual | .027 | 1851 |
| Mutual of Omaha | .026 | 1909 |
| Berkshire1 | .026 | 1860 |
| State Farm | .023 | 1922 |
| All other carriers combined | .149 | n/a |
|
||
A useful way to assess the competitiveness of a market is by computing a measure of market concentration, such as the Herfindahl-Hirschman Index (HHI), which is commonly used by the Department of Justice and Federal Trade Commission for antitrust enforcement.15 The HHI in the group market is approximately 1700, which under current antitrust guidelines is considered “moderately concentrated”; the HHI in the individual market is approximately 1260, which represents an “unconcentrated” market.16 In other words, both markets appear to have enough competitors to expect reasonably vigorous competition.17 There are other factors besides market structure that contribute to the competitiveness of the market, and we will consider these in the Industry Analysis.
There has been considerably more market share volatility in the group market than in the individual market. In the last few years, John Hancock has remained the leader in the group market but UNUM has supplanted MetLife as the number two seller while CNA and Prudential have both enjoyed substantial market share growth. In the wake of high benefit claims, John Hancock recently decided to exit the group market.18 These “share shifts” may be indicative of a competitive marketplace, or perhaps of adverse selection problems. In the individual market, John Hancock and Genworth have jockeyed for the position of market leader and Northwestern is the only carrier to enjoy a significant uptick in market share. CNA is no longer writing individual policies.
There appears to be considerable entry and exit among fringe competitors. An analysis performed in 2005 found the following:
“In the past 5 years, 18 major companies have sold out their long term care insurance business, may sell out or are gone from the market . . . Probably no one has kept track of the number of smaller companies . . . that have pulled out of the market as well. When the dust settles, if it ever does, 6 companies may represent over 80% of the market . . . .”19
Most churn occurs among fringe competitors; no firm with less than 10 years of experience in the LTCI market has more than a trivial share in the individual market.
d. Pricing
Some LTCI policies have built-in inflation protection; others do not. Policies without inflation protection must be underwritten to anticipate future utilization. Policies with inflation protection must also anticipate future price increases.
Historically, LTCI insurers were required by state regulators (through the National Association of Insurance Commissioners, or NAIC) to have at least a 60% lifetime loss ratio (based on a comparison of the net present value of premiums and claims). This has led to pricing volatility, as expected claims costs have been volatile. In particular, differing expectations with respect to future LTC cost growth can drive differences in premiums offered today. For example, if an insurer expects LTC costs to grow at 5 percent per year, then in order to provide benefits valued at $100 today the insurer will require $551 in 35 years. If an insurer instead expects LTC costs to grow at 5.5 percent, providing those same benefits will require $650 in 35 years. This 1/2 point difference in expectations of cost growth results in an 18% difference in the perceived actuarially fair premium. The observed pricing variation likely reflects variation in cost growth projections both across firms and within firms over time.
III. Industry Analysis
Industry analysis proceeds by considering a series of economic factors that may affect the intensity of competition and thereby affect profitability. When assessing profitability, no single factor is definitive. Nor is there a formula that translates the totality of the analysis into a particular level of profits. The analysis instead provides a qualitative assessment of profitability. Industry analysis also examines trends in these factors, to facilitate a forecast of future profit trends. If several key factors trend in the same direction, then forecasts about trends in profitability are more reliable.
Industry analysis is often associated with the work of Harvard economist Michael Porter, who identified five major forces that affect profitability--Internal Rivalry, Entry, Substitutes, Buyer Power and Supplier Power. In order to organize our analysis, we follow the Template for Doing a Five Forces Analysis that appears in Besanko, Dranove, et al., Economics of Strategy, which slightly modifies and updates the Porter framework. This template consists of a series of factors to be considered in conjunction with each force.
a. Internal Rivalry
Degree of Seller Concentration.As reported above, the LTCI market is relatively unconcentrated. This tends to increase price competition. There has been no pronounced trend in seller concentration. Some smaller players, such as State Farm, may be seeking to gain share.
Despite the relatively large number of competitors, there is substantial heterogeneity in pricing. Broker World conducted an experiment in which it solicited pricing quotes on behalf of a fictitious employer. Plan design was held constant and prices were quoted by age of enrollee and for plans with and without inflation adjustment. Five of the six survey targets responded. For plans without inflation adjustment, the ratio of maximum to minimum price quotes ranged from 116-151% ,withno discernable correlation between price dispersion and enrollee age. For plans with inflation adjustment, the ratio of maximum to minimum price quotes ranged from 121-191%, and dispersion was negatively correlated with enrollee age.20
Rate of Industry Growth. The LTCI market is currently stagnant, perhaps because of the economic downturn. This can intensify pressure on firms to lower prices in order to boost business. As the economy improves, sales of LTCI should improve as well, easing pricing pressure.
Other factors may affect industry growth. The baby boom bubble is entering the prime years for purchasing LTCI, thereby boosting demand. Strains on Medicaid budgets might limit federal and state funding for long term care, thereby increasing the demand for LTCI. Likewise, cutbacks to the Medicare Part C program (i.e., Medicare Advantage) might increase demand for LTCI. On the other hand, the movement of business to health insurance exchanges might reduce employer involvement in providing health benefits, thereby reducing demand for LTCI.
Cost Differences Among Firms. All major players have similar administrative and marketing cost structures. However, plans may have markedly different underwriting policies and selection strategies leading to different cost structures. This is reflected by the evidence on price dispersion reported in Broker World.
Excess Capacity. Capacity, as normally construed, is a nonissue in LTCI. However, firms may be constrained from growth if they lack financial capital. Economic recovery may provide life insurance firms with the cash required to support growth.
Product Differentiation. In one sense, the products are highly homogeneous--the value of a $150 daily benefit is essentially the same regardless of the source of those funds. Homogeneity in certain benefit features is driven by HIPPA regulations, which specify requirements that plans must satisfy in order for premiums to be (partly) tax-deductible and benefits tax-exempt.
LTCI requires a fairly substantial outlay and consumers likely spend considerable time evaluating the product. Thus, one might expect to see strong price sensitivity. Due to the role of the sales agent, however, consumers may be loyal to one product or another. About half of all sales occur through company agents who may already have a relationship with the client through the sale of life insurance. There has recently been a shift of sales to independent agents who may represent several LTCI sellers. If this shift continues, consumers may display less loyalty and pricing pressures may intensify.
Switching costs. Consumers who have already purchased LTCI have enormous switching costs, as the premium is based on the age of initial purchase. Thus, virtually all price competition is largely restricted to new customers.
Observability of prices. Sellers can more easily tacitly collude if they can observe and quickly react to competitor price changes. (The reason is that any effort by one firm to gain market share through a price reduction is easily and quickly mimicked by its rivals.) Pricing in the individual market is customer specific, making “copycat” price matching difficult. Pricing in the group market is also not easily observed. Observabilitymay increase substantially if the LTCI market switches to a Geico/Progressive sales model, as we discuss below.
Use of Facilitating Practices. NAIC regulations may serve to put a floor on insurance rates, anchoring premiums and acting as a “facilitating practice” (In this context, facilitating practices are practices that, by increasing price transparency or creating focal pricing points, may make tacit coordination on pricing more likely or sustainable). NAIC regulations that act as a floor on pricing would limit each LTC insurer’s ability to gain market share by setting an aggressive premium.
Size of sales orders. Sellers price more aggressively when each sale represents a large portion of their business. With the exception of very large employer groups, most sales are a miniscule portion of total business. CLASS may shift more attention to employer-based sales, which could intensify price competition.
Exit Barriers. Price competition is reduced when firms can easily exit markets, as they are more prone to exit than endure bitter price wars. LTCI carriers could face considerable harm to their reputations in the much larger life insurance market if they exited LTCI. They would be more likely to sell their existing policies to another carrier.21 Overall, we would expect LTCI carriers to defend their positions if their survival is threatened.
Industry Elasticity of Demand. The industry elasticity of demand is estimated to be around 0.75 which is not particularly high. Price increases, if they can be sustained, will not drive away so many customers as to drastically affect industry profits.
Overall Assessment of Internal Rivalry. Despite the relatively unconcentrated market, we believe that internal rivalry has been relatively muted, due to the importance of personalized sales contact. If the product were simplified to the point where consumers feel comfortable purchasing LTCI without a sales agent, then the remaining factors tend to weigh towards intense competition.
b. Entry and Exit
All of the major LTCI carriers have considerable experience. This section identifies barriers to entry and growth by newcomers and pays particular attention to potential lowering of entry barriers should LTCI become commoditized.
Economies of Scale and Scope. Traditional production economies associated with the spreading of facilities costs are absent. There are economies of scale and scope in marketing and selling of LTCI, as life insurance companies can efficiently identify potential LTCI customers. If LTCI is commoditized, these selling economies will become much weaker.
Importance of Reputation. As noted in Tables 1a and 1b, all of the major LTCI sellers are established life insurance companies. Ostensibly, consumers purchase from sellers with proven track records, as sellers who exit the market may be unable to fulfill their LTCI contracts. Even if the product is commoditized, consumers will still place a high value on the seller’s financial stability.
Access to Distribution Channels. LTCI is currently sold through life insurance company agents and independent brokers. Distribution through the Internet will be possible if the product is commoditized.
Access to Key Inputs (Technology/Raw Materials/Know-how/Favorable Locations). These are not important entry barriers.
Experience Curve. Incumbents have the benefit of client lists that allow them to more efficiently deploy their sales forces. The actuarial models required for pricing LTCI are available from independent consultants. Still, LTCI companies have varied in the extent to which they are able to successfully model key profit drivers, such as cost growth and drop-out rates, so new entrants may be placed at a disadvantage while they accumulate LTC underwriting expertise.
Strategic Behavior of Incumbents in Response to Entry. Because there has been no major entrant in recent years, there is no evidence one way or the other as to how incumbents would respond to entry. Moreover, a government plan may be viewed as a more committed entrant (e.g., unlikely to be driven out of the market via aggressive pricing) and so would likely generate a different strategic response than a private entrant.
Exit Barriers There are substantial exit barriers. Regulators will protect covered lives, and major carriers will be reluctant to harm their reputations in the much larger life insurance market by withdrawing from the LTCI market in a way that undermines commitments made to their installed base of enrollees.
Overall Assessment of Entry and Exit. Incumbents are protected by their longstanding reputations and access to selling channels. The latter may break down if LTCI is commoditized, but the former may remain important. Consumers may be willing to purchase annual auto insurance from GEICO or Progressive, but will they be willing to purchase LTCI from upstart firms, given payout periods that may be years or decades in the future?
c. Substitutes and Complements
Availability of Close Substitutes. LTCI protects future wealth. Consumers who are worried about the cost of lengthy nursing home stays are likely to have estates worth several hundred thousand dollars and are apt to purchase life insurance, which in this context can be viewed as a substitute for LTCI. This explains why the same channel is used for both insurance products. Consumers who are worried about the costs of short term nursing home stays and home care due to an acute condition are likely to have somewhat smaller estates. There are currently no good substitutes for LTCI for these individuals--we return to this point below.
Medicaid has been an important substitute for individuals of lesser means.
Price-Value Characteristics of Substitutes. Whole life insurance can replenish an estate drained by costly nursing home bills; term life may no longer be active by the time a nursing home is needed. But whole life is an imperfect substitute because the funds are not available until the patient is deceased.22 Medicaid is an imperfect substitute because many long term care providers will not accept it and individuals must meet income thresholds to qualify. Additionally, many individuals may fear that Medicaid will be underfunded in the future, further hampering access to care for beneficiaries.
State Medicaid Partnerships. These programs, which are active in most states, are intended to encourage the middle class to purchase LTCI.23 “In the Partnership model, states offer the guarantee that if benefits under a Partnership policy do not sufficiently cover the cost of care, the consumer will qualify for Medicaid under special eligibility rules that allow a pre-specified amount of assets to be disregarded . . . [t]his is generally referred to as ‘asset protection’.”24 CLASS should obtain similar asset protection for its products.
Availability of Complements. The continued growth in the demand for home health care and assisted living arrangements will place greater financial strains on the elderly and increase the value of LTCI.
Overall Assessment of Substitutes and Complements. As fears about Medicaid’s viability intensify and alternative long term care arrangements multiply, demand for LTCI is likely to grow substantially. This trend is unlikely to be meaningfully offset by growth of the limited set of substitutes or to be hampered by a lack of complements.
d. Buyer and Supplier Power
Supplier power is not an issue for LTCI, as there are no essential raw materials or technology required for sales. Buyer power stems largely from the power of insurance brokers. Brokers in the individual LTCI market have power if LTCI customers have a relationship with their broker and not with the LTCI company. In this case, the broker can command a large commission or threaten to sell competitors’ products. However, about half of sales in the individual market are currently done by company agents, rather than independent brokers.
LTCI group sales rely on a different brokerage channel, but the same considerations apply. Other considerations, such as the size of brokers or their ability to integrate into LTCI sales, are nonissues.
Overall Assessment of Buyer and Supplier Power. Broker power is limited by several factors. First, they are not concentrated, so LTCI firms can switch brokers at will. Second, partial integration allows LTCI companies to credibly threaten to move to a fully integrated sales model should independent brokers seek too much power. In the future, commoditization of LTCI could break the power of brokers even as it fundamentally changes competition among LTCI firms.
e. Summary of Five Forces Assessment
The profitability of the LTCI market depends on the extent to which several factors apply:
- Consumers find it difficult to evaluate the product and rely on the advice of brokers and the reputations of established sellers (+)
- Perceived product complexity limits commoditization and entry by aggressive price cutting firms (+)
- Competition and partial integration by LTCI firms limit broker power (+)
- The viability of Medicaid as a LTCI insurer for those of limited means (–)
IV. Positioning Analysis
Beyond certain requirements described at the outset of this analysis, the ultimate form of the CLASS plan will be determined by the Secretary of the Department of Health and Human Services. Success of the CLTCI plan will likely ultimately be judged on two dimensions. First, does the plan meet the statutory requirement that its premiums cover its costs over a 75-year horizon? Second, does the plan meaningfully expand the size of the population with long term care insurance? Success on these two dimensions will require that the government plan capitalize on the unique strengths of a federal LTCI plan while counteracting the statutory and bureaucratic weaknesses of a federal plan. The performance of LTCI will depend both on its relative strength vis-à-vis private-sector competitors, and on its choices regarding product positioning. For example, should the CLTCI plan attempt to compete directly with private LTC insurers by offering either lower costs or lower benefits? Or should the CLTCI plan avoid direct competition and instead offer a set of features that private LTC insurers are unlikely to match?
a. Strengths
The key strengths of the CLTCI plan are in part inherent to the federal government and in part derive from various provisions of the CLASS Act.
-
Long-term solvency. Table 2a and Table 2b show that all of the substantial private sellers of LTCI are more than 70 years old, which indicates that when it comes to purchasing insurance against risks decades hence, consumers place a premium on the perceived stability of the insurer. The federal government should have an advantage over private insurers on this account.
-
Strategic commitment. Once enacted, it would literally require an act of Congress to eliminate the CLTCI plan. Recognizing this, efforts by incumbents to deter entry or engage in practices to drive the government out are fairly unlikely.25 This ability to commit gives the CLTCI plan a strategic advantage over other potential entrants.
-
Automatic enrollment, opt-out, and payroll deductions. For employers that choose to participate in the CLTCI plan, employees will be automatically enrolled and premiums will be deducted from paychecks. Employees who desire to opt-out are allowed to do so. Inertia may result in fewer opt-out decisions and the opt-out structure is certain to result in higher initial enrollment than would an opt-in structure.26 As we discuss in the Industry Mapping section, the group segment, while smaller in magnitude, is growing more rapidly than the individual segment (18% vs. 12%), which will increase the value of the opt-out structure over time if the trend persists.
-
Low overhead and disintermediation. The CLASS Act restricts administrative costs of the plan to 3% of premiums in each year of the program. The interpretation of administrative costs is broad and includes advice and counseling. This will force the CLTCI program to aggressively manage expenses. If the CLASS plan can meet this mandate while still offering a product that consumers are aware of and interested in purchasing, it will have a significant cost advantage over private LTC insurers, which are dependent upon commissioned brokers.
-
Simplicity and standardization. The CLASS plan will have a simple and easily understood design that features a vesting period of at least 5 years, no elimination period, benefits that last for as long as the enrollee requires them, and inflation-adjusted benefits. This should complement the low overhead mandate by lessening the need for intermediaries to explain the various benefit options and configurations.
-
Access to the over-65 population. Medicare is a popular entitlement program with frequent contact with its 45+ million beneficiaries. Were CMS to directly advertise the fact that Medicare does not cover most home health and nursing home costs, and include literature on CLASS in its annual Medicare and You booklet as well as information on Medicare.gov, the CLTCI program could realize a substantial boost in enrollment.27 Of course, only seniors with earned incomes are permitted to purchase the product, so this strategy could generate confusion among retirees; targeting still-working seniors or those who are about to turn 65 could reduce this confusion.
-
State governments would benefit from greater CLASS enrollment. For individuals with both CLTCI and Medicaid coverage, 95% of the CLTCI payments for institutional care and 50% of the CLTCI payments for in-home or community-based care will be directed to the state program, with the remainder retained by the CLTCI/Medicaid enrollee.28 Accordingly, the states will have a direct financial incentive to promote CLTCI enrollment.29
b. Weaknesses
-
The break-even requirement. The CLASS Act requires the CLTCI plan to set premiums to cover costs over a 75-year period and the relevant language in the ACA prohibits the use of “taxpayer funds” for payment of benefits.30 If consumers expect Congress to maintain this commitment and not subsidize CLTCI coverage then the early success of CLTCI is critical to its long-term success. If early failures lead consumers to believe CLTCI will fail, then the opt-out rate is likely to be higher. This reaction will in turn undermine the success of CLTCI. Thus, there is a strong element of path dependence in the success or failure of CLTCI that implies a very large premium on a successful initial launch of the program. If, however, consumers expect Congress to offset any shortfalls, then this factor may not be as important.
-
No medical underwriting. Any CLTCI plan can set premiums that vary according to the age of the enrollee but cannot vary the premium by health status, as is commonly done by private LTC insurers. This creates the clear possibility that the CLTCI plan will become the LTCI plan of last resort, purchased only by those that have private information that they are likely to require LTC services. This would increase premiums further and could in the limit result in the collapse of the program--a result referred to as an “adverse selection death spiral.”
Adverse selection remains the greatest threat to the long-term viability of CLTCI. CLTCI’s solvency will be highly dependent upon effective use of the tools allowed by statute for combating adverse selection. These include the 5-year vesting period; the requirement of earned income in excess of the Social Security minimum wage during 3 of the 5 years immediately following purchase; and the steepness of the age-premium curve. All else equal, a steeper curve will benefit those who enroll earlier and act as a tax on those who enroll later.
-
Premium subsidies. Premiums will be subsidized for employed full-time students and for those with incomes below the federal poverty level. The initial premium for both groups will be $5, an amount that will grow over time with inflation.31 The subsidy expense must be covered out of the CLTCI’s premiums. This will worsen the actuarial value for higher income potential enrollees and improve the value for lower income potential enrollees. If this induces the former to opt-out and the latter to remain in, the size of the required subsidy will increase and the fracture will grow. In the limit, this could also cause the CLTCI plan to collapse. Several factors may mitigate this concern. A $5.00 premium may be not be far from the actuarially fair premium for students; if this induces continued enrollment following graduation (or drop-out), then this subsidy may function as a loss-leader that brings in attractive customers. Similarly, to the extent that poverty is a transitory status, income-based subsidies may also act as a loss-leader that expands the pool of favorable risk enrollees.32
-
Other features that may draw an adversely selected risk pool. Unlike the typical private plan design, the CLTCI plan is structured to vary the benefit level in proportion to the degree of impairment of the enrollees. Enrollees who expect to have a high degree of impairment will receive a higher level of benefits, though they will not pay more than other enrollees of the same age. Additionally, unlike most private plans, which feature maximum benefit periods, the CLASS program does not limit the duration of the benefit. This will, all else equal, attract enrollment by those who expect to have LTC needs of greater duration and cost. We expect this to expose CLTCI to adverse selection. To the extent that some consumers are attracted by this design feature and willing to pay its actuarially fair cost, private firms will find this aspect easy to replicate and will not work to the advantage of CLTCI.
-
Inability to pair LTCI with life insurance. The need for life insurance as part of wealth protection is readily understood; LTCI covers additional, related risks that whole and term life policies do not. There are likely economies of scope from joint production, particularly with respect to marketing costs.33 It is no surprise that, to date, the largest sellers of LTCI are all significant sellers of life insurance. The CLTCI plan will have no comparable targeted access to the population most interested in LTC.
-
Mistaken perceptions that Medicare covers LTC costs. A 2006 survey by the AARP found that only 25% of respondents over the age of 45 knew that Medicare would not pay for a long-term care stay in a nursing home.34 Thus, 75% of the core target market segment is, apparently, unaware that they may need LTCI. This is a challenge that the CLTCI plan will share with private LTCI companies. Those private companies keep potential customers informed through the relationships they have from life insurance sales and on networks of affiliated and independent brokers. The CLTCI plan, which is restricted to 3% overhead (advocacy and counseling are considered administrative expenses), will not be able to match that network.
-
Minimal allowances for marketing and administrative expenses.Misperceptions about LTCI are common and brokers have historically played a central role in distributing correct information. The administrative expenses restrictions on the CLASS plan leave little room for marketing to increase consumer awareness. While, as described above, CMS and the states may provide some degree of free marketing, this is not guaranteed.
-
Lower investment returns. The CLASS plan is required to invest its premiums in government-issued securities and so will likely earn a lower return on the float between premiums and expenditures than private LTC insurers.
c. Implications
The greatest strengths of the CLTCI plan are the automatic enrollment of employees of firms that choose to participate in the CLASS program and the associated reduction in selling expenses. The greatest threat to the success of the CLASS program is the inability to medically underwrite premiums, which does raise the real possibility of an adverse selection death spiral and insolvency. Simply put, if the CLASS plan primarily attracts those for whom private LTC insurance is a bad value, it is likely to fail. This outcome is most likely if the CLASS plan is structured to simply mimic private plans but without underwriting and to appeal to the same set of consumers (primarily, those who purchase life insurance through a broker, a higher-income group).
The CLASS plan will better leverage its strengths by developing a plan structure that (1) appeals to a different set of consumers (lower and middle income) and (2) encourages enrollment by the relatively young and healthy members of that set of consumers. In section VI, we analyze a set of products that meet these criteria.
V. Competitor Responses to Entry: What Does the Literature Say?
CLASS insurance will represent a major new entrant into the LTCI market. It is therefore important to anticipate how incumbent sellers will respond. There is a large theoretical literature and substantially smaller empirical literature on incumbent responses to entry. Thomas (1999) reviews the literature and provides some evidence from the breakfast cereal industry.35 Simon (2005) also reviews the literature and adds evidence from magazine subscriptions.36 We review both of these papers below.
a. Thomas
Thomas notes that early research focused on the use of price to deter entry. Incumbents could set a “limit price” below the short term profit maximizing level in order to make the market less attractive to entrants. Game theorists were skeptical of the limit pricing strategy because it assumes that the entrant is myopic and believes that the pre-entry price will prevail after entry. In fact, once entry occurs, the incumbent might accommodate the newcomer by, for example, tacitly colluding on price. Or incumbents might be better served by slashing prices after entry occurs, a strategy known as predatory pricing. This might drive out the entrant and deter future entry. But the strategy is costly in the short run and there is no guarantee that future entrants will be deterred.
Thomas identifies other entry deterring strategies, including product proliferation in differentiated goods markets to limit opportunities for entrants to fill product niches; increases in capacity, perhaps as a way to credibly threaten price reductions after entry; and advertising to build consumer loyalty to branded products.
The costs of advertising can dictate the structure of a market.37 He observes that in many consumer products markets, there appear to be a small number of firms with recognizable brands, as well as several fringe “off-brand” competitors. The firms that advertise heavily attract customers who prefer to sample branded products while the fringe firms split the remainder of the market. The substantial sunk costs of creating a brand dictate the market structure. Entrants face the choice of duplicating the sunk advertising costs and splitting the branded market, or avoiding advertising costs and sharing the unbranded market. If sunk advertising costs are large relative to the market size, the number of branded firms will be limited, and entrants will be restricted to the unbranded segment.
Thomas also mentions the idea of “judo economics.” Small entrants may not attract the interest of incumbents. It may even be in the interest of entrants to try to commit to remaining small.
Thomas finds few empirical studies of entry deterrence. Entrants report in surveys that they rarely perceive responses by incumbents. There is some observational evidence that incumbents do occasionally add capacity or advertise more heavily after entry. Thomas’ own empirical research focuses on breakfast cereals. He divides the data into different category segments (e.g., bran cereals.) He finds that incumbent firms in a segment tend to increase prices after entry into their segment by other incumbents, but reduce prices after entry by newcomers. Conversely, incumbents seem to increase advertising after entry by newcomers, but they do increase advertising when an established firm enters their segment.
b. Simon
Simon’s discussion of the theoretical literature on entry deterrence largely covers the same ground as Thomas. Simon does make the critical observation that responses to entry may depend on the characteristics of the incumbent. This is the main theme of his empirical work. He posits that an incumbent’s age, corporate scope, and market structure all predict the incumbent’s response. Established firms are protected by reputations and their customers are less price sensitive. Thus, established firms are less likely to cut prices than younger incumbents. Firms that operate in multiple markets can extend a “reputation for toughness” across product lines and therefore benefit more from price cutting. Finally, firms in relatively unconcentrated markets may be reluctant to take the lead in price cutting.
Simon extends Thomas’ review of the prior empirical literature. He finds fairly consistent evidence that incumbents reduce prices in the face of entry. Airlines cut prices in response to entry, especially entry by low cost carriers. Supermarkets cut prices in response to entry by warehouse clubs; tire retailers cut price in response to entry; some auto makers cut prices. Drug companies, in contrast, often do not cut prices in response to entry, preferring instead to increase prices and target a price insensitive niche. Overall, Simon’s research does suggest a pattern of price cutting by incumbents. It is particularly noteworthy that we see price cutting in airlines and supermarkets, as airlines traditionally have low returns on investment and supermarkets traditionally have low returns on sales. Even so, incumbents are willing to sacrifice short term profits to combat entry.
Simon’s studies responses to entry in magazines. He finds that older incumbents cut prices by 1-4 percent after entry while newer incumbents cut prices by 12 percent. Multimarket contact increases price cutting by 0.7 percent per “market”; The effect is present for new entrants but not for diversifying entrants. Finally, concentration does not, by itself, seem to matter.
Taken as a whole, the literature suggests that incumbents often cut prices after entry and may increase advertising after entry by new firms. However, incumbents in the LTCI market have several characteristics that might temper price cutting in response to CLASS entry. First, they are old and have long established reputations. Second, they are not very diversified and do not face the threat of entry in their core market of life insurance. Incumbent LTCI firms may increase advertising after CLASS entry. There is already some mention of encouraging sales agents to make negative comments about CLASS insurance.
Despite the theory and evidence of price cutting, it is not clear that LTCI sellers would also reduce prices to combat CLASS entry, for five reasons.
-
The market is already fairly competitive; there may not be much room for further price reductions.
-
State underwriting requirements require prices be set to cover expected future costs.
-
Price cutting is not likely to drive HHS from the market.
-
There is no further deterrence effect from price cutting, since other entry barriers remain high.
-
CLTCI is likely to expand enrollment rather than draw business away from established sellers.
VI. Entry Opportunities for CLASS ACT Insurance
The CLASS Act authorizes the government to sell a traditional LTCI product with a set of rules governing product design, notably a $50 per day minimum average benefit. Our strategic analysis suggests that entry by almost any newcomer would be difficult. The government has some advantages over other entrants, in particular it need not establish a reputation for long-term solvency and it can establish distribution channels through employers by fiat, rather than incurring the selling costs of commercial insurers. Even with access to employers, the government is unlikely to successfully compete without incurring substantial costs educating consumers about LTCI, the same kinds of costs currently incurred by commercial firms.
Rules in the CLASS Act governing enrollment put the government product at a competitive disadvantage. An actuarial forecast made on behalf of HHS suggests that the government would have to charge a premium for its $50/day plan that is commensurate with that charged by commercial insurers for their plans offering $150/day benefits.38 (This comparison does not appear to account for the fact that CLASS benefits do not terminate while private plans typically pay benefits only for 3-5 years.39) Offering only this product puts CLTCI at a high risk for failure.
An important option for the government is to offer additional products that might prove to be profitable. We now consider several such products. When evaluating these alternatives, it is important to remember that CLASS has two related advantages over commercial carriers. It has the ability to introduce its products through the workplace and it does not have to pay substantial selling expenses to agents and brokers. But the value of these advantages would be greatly diminished if CLASS products were complex.
The first two options are motivated by the basic economics of insurance risk pools. In a nutshell, insurance works because low risk enrollees cross-subsidize high risk enrollees. This model is viable only if low risk enrollees are willing to participate; if the cross-subsidy is too large, low risks drop out and the pool falls apart. Commercial insurers are able to sign up low risk enrollees through medical underwriting (offering lower prices to low risk individuals), selling to employer groups where all or most employees are expected to agree to purchase coverage (more important for traditional health insurance), imposing waiting periods (so that individuals are less sure of their risks at the time they enroll) and other benefit restrictions that limit the cross-subsidy. The options we offer provide alternatives for CLASS to limit (but not eliminate) the extent of cross-subsidization, thereby encouraging low risk individuals to sign up for CLASS.
Both of the core options take advantage of CLASS’ access to sales through employers. A key issue is whether CLASS should implement the “opt out” feature of selling through employers (if an employer chooses to offer the product, employees receive the product by default unless they opt out), use an “opt in” approach (employers make the product available but employees must opt in to receive it), or use an “active choice” model (employees must complete a form indicating whether they want to participate in the plan). Given that the individual market will be somewhat foreclosed to CLASS, it is essential that CLASS gets this decision right.
a. Core options to address adverse selection
1. Extended Vesting Period Long Term Care Insurance
Through plan design, CLTCI can reduce the effects of adverse selection. For example, CLTCI could offer a plan design that features a lower premium and an extended vesting period of more than five years. Individuals are less likely to have private information regarding their expected LTC needs in, say, 10 years. Nevertheless, the lower premium and the ability to lock in a premium schedule would provide an incentive for the young and healthy to purchase.
However, if “traditional CLTCI”, with a five-year vesting period and no underwriting, is also available then individuals would have little incentive to purchase the extended vesting period product. They can simply wait until the need is less distant and then purchase the traditional product. Therefore, for the “long vesting period” product to be successful, the age-premium curve must be steeper than actuarial tables so that those who enroll later in life would subsidize those who buy earlier, creating an incentive to join early. For example, the premium at age 50 for a person who enrolled in an extended vesting period plan at age 40 should be below the premium for a person at age 50 who enrolled in the standard 5-year vesting period plan at age 40. Alternatively, “traditional CLTCI” can be limited to a minimum benefits package of $50 daily, while the “vested CLTCI” can be a more generous plan. Alternatively, CLASS could combat adverse selection by limiting enrollment in all CLASS products to individuals under age 50 (in year 1).
Advantages
-
Minimizes adverse selection, thereby offsetting a major advantage of commercial LTCI firms.
-
Commercial LTCI firms are unlikely to offer a similar product and will instead rely on their strengths in medical underwriting and sales to minimize selection.
-
Simple benefit design keeps education costs low
-
Large potential market.
Disadvantages
-
Product offers greatest benefit to those individuals who also benefit from commercial LTCI. Commercial insurers have made significant inroads in selling LTCI through relationships in the individual life insurance market. Some commercial insurers can also be expected to encourage selling agents in the individual market to disparage the CLASS product. CLASS will therefore be heavily dependent on reaching new customers through employers.
-
Even with a simple plan design, CLASS would need to educate consumers about future long term care needs. This may require considerable sales and marketing effort.
-
Because the product will necessarily have a simple design and sales process, success by CLASS has the potential to commodify LTCI. We discuss the implications of commidification in section VI.b.4.
Among the options discussed in this section, we are very optimistic about the potential success of this product. It has broad appeal, is well-protected against adverse selection, and can exploit CLASS’ access to employers.
2. A “Tontine” Plan for Long Term Care Insurance
Two centuries ago, many individuals invested in Tontines. The money was pooled and invested in various assets, where the money remained until all but one investor had passed away. The last surviving investor received the entire investment. This idea of rewarding individuals for remaining healthy can be used to limit adverse selection against CLTCI. Consider a “Tontine” LTCI plan that gives “rebates” each year (possibly after a fixed or age-based number of years of payment of premiums) to individuals who do not use LTC services. The rebates are paid for through increased premiums. In this way, the Tontine reverses some of the cross-subsidy inherent in insurance and encourages low risks to participate in the plan.
The Tontine plan can succeed against commercial insurers if it threads the needle in terms of pricing. Remember that CLTCI has a substantial cost advantage due to minimal selling expenses. If these savings (which are realized for all enrollees) exceed the cross-subsidy on high risk enrollees (which has been reduced by virtue of the higher premium), then CLTCI can offer low risk individuals a net price (premium less rebate) that beats anything offered in the private sector.40
While this structure may at first glance appear to be a variant on medical underwriting, there is an important distinction. With underwriting, net premiums vary only on initial health conditions. A Tontine structure, however, varies net premiums over the life of coverage in accordance with realized health conditions. Among other distinctions, this creates an incentive at the margin--an incentive not present with underwriting--for enrollees to take measures to reduce the likelihood that they will require LTC.
Advantages
-
Tontine feature serves a similar role as medical underwriting: the effective premium decreases for low risks and increases for high risks.
-
Tontine feature immediately communicates value to low risk enrollees.
-
Commercial LTCI firms are unlikely to offer a similar product.
-
Large potential market.
-
Encourages positive health behaviors.
Disadvantages
-
Commercial insurers can still rely on relationships between selling agents and consumers to enhance medical underwriting. Thus, CLASS can never fully equal underwriting capabilities of commercial plans.
-
Commercial sellers may price plans to low risks more aggressively.
-
CLASS will need considerable underwriting skills and demand modeling to determine the size of rebates and implications for profitability.
-
Product is more complicated than the “extended vesting period” product.
-
Success by CLASS has the potential to commodify LTCI.
The Tontine product shares many of the advantages and disadvantages of the “vesting period” product. It is also likely to rely on access to enrollees through employers. We believe the rebate has strong marketing potential and will draw in low risk individuals. However, this product seems more complex than the “vesting period” product. CLASS would need to limit plan features so as to minimize the sales effort and CLASS will require more sophisticated demand modeling. To the extent that the “vesting period” product is a “belt” and the Tontine is “suspenders”, we lean toward the belt or some combination of the two.
b. Additional Options
1. “Short-term” Long Term Care Insurance
There is currently a gap in the insurance market to provide insurance for short-term assisted living at old age. Currently, Medicare does not cover non-hospital institutional care or home nursing care unless it immediately follows hospitalization. Such care can last days or weeks, at a cost of tens of thousands of dollars. Individuals with substantial assets, who are purchasing both life insurance and LTCI, may not be interested in purchasing protection against such expenses. But consumers with modest retirement savings who are not eligible for Medicaid may also be fearful of becoming impoverished by long term care spending. (The average American retires with less than $100,000 of non-housing wealth.) There are two reasons why traditional LTCI sellers may not be serving this market. First, LTCI sellers come from the life insurance market and they are skilled at identifying individuals who wish to protect estates worth hundreds of thousands of dollars. Second, a product that offers modest, short-term protection might be seen as a cheap substitute for other LTCI products that would cannibalize more profitable lines.
Such a product could cover assisted care of all forms for a short period (30-90 days). Premiums paid by someone who enrolls early in life would be very low. The product is a hedge against needing assistance for a short period of time, not insurance for someone who will live out their days in a nursing home. This product would be require some modest vesting period so that individuals do not purchase insurance immediately upon finding out that they require care
This product has several advantages and disadvantages.
Advantages
-
Does not compete directly against existing LTCI products.
-
Current LTCI sellers are unlikely to offer their own versions of this product inasmuch as it targets a different audience.
Disadvantages
-
Limited market size. Medicare covers “short term” long term care needs if there is a hospitalization, so this product is restricted to patients who are not hospitalized.
-
Amount of coverage is much smaller than for traditional LTCI, so that the risk premium and profits are commensurately smaller as well.
-
Requires educating consumers about Medicare coverage limitations.
Overall, we believe that this product is promising but unlikely to generate significant financial returns to the CLASS program.
2. Linkages to the Private LTCI plans
HHS could seek to encourage the development of private sector plans that would supplement the CLASS program in a fashion similar to the way in which Medicare Supplemental plans fill in the gaps of Medicare Part A and Part B coverage. The availability of supplemental plans could increase the attractiveness of the CLASS plan. At the same time, encouraging the emergence of private supplemental products could lessen private insurers’ resistance to the CLASS plan. This could also open a channel to consumers that would impose minimal administrative costs on the CLASS plan.
However, the structure of such plans would need to be carefully considered in terms of both selection effects and marginal incentives. For example, supplemental coverage could increase the appeal of the CLASS plan to individuals with private information that their LTC needs are eventually likely to be substantial. At the margin, private supplemental coverage could make nursing homes a more attractive option relative to formal or informal home health care, with potential budgetary implications for programs such as Medicaid.
Advantages
-
Could increase appeal of basic CLASS coverage.
-
Could induce private plans to market CLASS coverage.
Disadvantages
-
Adds further complexity to the market, working against strengths of the CLASS product.
-
Not a short term solution to CLASS’ budget problems.
3. A Note on Commoditization of LTCI
Because CLTCI will be offered through the workplace with a minimum of selling effort, it will necessarily have to have a simplified plan design. This stands in contrast with existing LTCI products that have many dimensions that a consumer only comes to understand through lengthy consultation with an agent. If CLTCI becomes successful, then the simplified design could become a template for standardized product offerings. In other words, we may see the commoditization of LTCI.
Ironically, the success of CLTCI could sow the seeds of its destruction. If LTCI is commoditized, selling agents will no longer be required and if they disappear, their commissions will disappear with them. LTCI could then be sold by companies like Progressive and Geico, which have miniscule selling expenses (other than advertising to establish brand credibility.) Such companies can continue to medically underwrite, giving them the best of both worlds so to speak: protection against selection and low costs. While this could greatly expand LTCI coverage, it might come at the expense of the viability of CLTCI.
VII. Summary and recommendations
The market for traditional LTCI succeeds because of a reliance on personal sales effort and sophisticated medical underwriting. Not only do these features allow commercial carriers to avoid adverse selection, they minimize internal rivalry and raise entry barriers. But these features come at a cost; selling expenses in LTCI are considerable. The creation of the CLASS program provides a unique opportunity to break down entry barriers. But this alone will not guarantee the success of CLTCI.
CLASS must also devise ways to avoid adverse selection. If CLASS can minimize selection and exploit access to employers to minimize entry barriers, then its considerable cost advantage could allow it to more than effectively compete in the LTCI market. We have described two products--“vesting period” and “Tontine”--that we believe can compete successfully against commercial LTCI. Of the two, the former is simpler and therefore offers a greater chance of success. Ironically, the success of either product could break down entry barriers and allow other low cost insurers to successfully compete. Even so, this would be a win-win for consumers, and should not stand in the way of CLASS’ entry into the LTCI market.
Notes
-
Kellogg School of Management, Northwestern University, Evanston, IL
-
Bates White Economic Consulting, Washington, DC
-
Summaries are available at http://www.classactprovisions.com/PDF/CRS_Class%20Act_May_2010.pdf, http://www.cahealthadvocates.org/advocacy/2010/class.html and http://www.ncoa.org/independence-dignity/class-act-summary.html.
-
Much of the information about the industry is taken from Brokers World magazine’s 2009 survey of the individual market and 2008 survey of the group market. (These are the most recent surveys available.) Most surveyed sellers are life or health insurance companies selling LTCI as riders to health insurance or as stand-alone products. The group survey covers 6 carriers who account for approximately 80 percent of annual sales in the group market. The individual survey covers 19 carriers that account for 90 percent of sales. We account for the incompleteness of the surveys when reporting on market size and structure; our analysis of concentration assumes that firms excluded from the survey are of negligible size. We acknowledge that market share data derived from such surveys can be inaccurate. We therefore rely on these data for qualitative inferences only.
-
Anne Tergesen and Leslie Scism, “Long-Term-Care Premiums Soar,” Wall Street Journal, October 16, 2010; U.S. Census Bureau 2009 population estimates, http://quickfacts.census.gov/qfd/states/00000.html. See also, Paula span, “A New Long-Term Care Insurance Program,” New York Times, March 24, 2010.
-
Jeffrey Brown and Amy Finkelstein, “Why is the market for long-term care insurance so small?” Journal of Public Economics 91 (2007): 1967-1991.
-
It is not clear if these figures include life insurance policies that permit the beneficiary to convert some of the insurance benefit to cash to pay for long term care. At death, the beneficiaries receive the balance of the insured amount less the long term care payout. Such policies seem to have been widely publicized about ten years ago.
-
In 2008, nursing home expenditures were $138.4 billion and home health care expenditures were $64.7 billion. CMS, 2008 National Health Expenditures, Table 2. http://www.cms.gov/NationalHealthExpendData/downloads/tables.pdf.
-
In 2008, healthcare expenditures excluding nursing and home health care amounted to $2.136 trillion. Total premiums for private health insurance were $783.2 billion. CMS, 2008 National Health Expenditures, Tables 2 and 12.
-
We obtained this information through a combination of Internet search and interviews with a life insurance salesperson. See http://www.lifeinsuranceadvisorsinc.com/articles/individuals/HowToReduceCommissions.pdf; http://www.ehow.com/about_6509638_kind-do-insurance-agents-get_.html; http://www.insure.com/articles/generalinsurance/agent-commissions-2.html; http://insurance.hirby.com/what-is-the-average-life-insurance-commission/; Interview with Barry Finkelstein, 11/4/2010.
-
See http://personalinsure.about.com/od/life/f/lifefaq3.htm. These figures do not include “expense allowances,” which companies grant to larger sellers (called “general agents” and can add 10% or more to the total commissions paid).
-
See http://blog.empowerltci.com/2010/08/17/7-facts-benefit-brokers-need-to-know-about-selling-ltci/
-
Source: Interview with Barry Finkelstein, 11/4/2010
-
Broker World does not separately report the percentage of policies with $50 daily benefits.
-
The HHI equals 10,000 times the sum of the squared market shares of each firm. For example, if the market consists of three firms with market shares of 0.5, 0.3, and 0.2, the HHI = 10,000 x (.25 + .09 + .04) = 3800.
-
FTC and DOJ, Horizontal Merger Guidelines, issued August 19, 2010, § 5.3. http://www.ftc.gov/os/2010/08/100819hmg.pdf. Under the guidelines in effect prior to August of 2010, both the group market and the individual market would have been deemed moderately concentrated.
-
National market shares will accurately describe the competitive conditions in local markets under either of the following conditions. The first is that the market for the sale of LTCI is national, which would mean that most consumers are able to purchase policies from most LTCI insurers. The second is that, even if most of these firms do not compete in most markets, they could readily do so.
-
MetLife recently announced that it would stop selling new LTCI policies, though it will continue servicing existing enrollees. Erik Holm and Anne Tergeson, “MetLife Discontinues Sales Of Long-Term Care Coverage,” Wall Street Journal, November 11, 2010.
-
As we note above, differences in the expected growth rate of LTC costs will drive differences in the premiums firms quote today. Sellers of LTCI are likely to have more consistent projections over a shorter time horizon than a longer time horizon, which could explain why dispersion is lower for older enrollees.
-
While it is discontinuing sales of new LTCI policies, MetLife is apparently planning to continue servicing existing enrollees. Erik Holm and Anne Tergesen, “MetLife Discontinues Sales OfLong-Term Care Coverage,” Wall Street Journal, November 11, 2010.
-
Viatical settlements can allow individuals with life insurance to access funds prior to death. However, the value of life insurance policies do not affect Medicaid eligibility whereas the income from a viatical settlement could. See, e.g., http://www.kantrowitz.com/cancerpoints/ftcviatical.html.
-
The initial Partnership states are California, Connecticut, Indiana, and New York. Provisions in Deficit Reduction Act of 2005 allow any state to implement LTC Partnership programs and more than 30 states now offer such a program.
-
Mark Meiners, “Medicaid Eligibility Issues for Long-Term Care Insurance Partnership Programs,” Center for Health Care Strategies, Inc., Issue Brief, March 2008.
-
This refers solely to actual competition. Private LTC insurers are likely to lobby Congress to change various aspects of the CLTCI plan.
-
For example, consider that Medicare Part B uptake is nearly universal.
-
In fact, 2011 Medicare and You booklet includes sections titled “Plan for Long-Term Care” and “Paying for Long-Term Care.” The former section directly warns seniors: “At least 70% of people over 65 will need long-term care services at some point. Medicare and most health insurance plans, including Medigap (Medicare Supplement Insurance) policies don’t pay for this type of care. . .” (Emphasis in original.) See http://www.medicare.gov/publications/pubs/pdf/10050.pdf. The section on paying for LTC includes a “Coming soon” section that describes the CLASS program. However, LTC information does not begin until page 110.
-
Medicaid funded 49% of LTC costs in 2005; while the percentage varies by state, the federal government provides half or more of state Medicaid funding. Long-Term Care Financing Project, “National Spending for Long-Term Care,” February 2007, http://ltc.georgetown.edu/pdfs/natspendfeb07.pdf.
-
Note that this incentive is not limited to current Medicaid enrollees. Many LTC recipients end up on the Medicaid rolls because of the costs of LTC, so slowing the arrival rate of such enrollees would generate savings to the states.
-
Mulvey and Colello (2010), p. 12.
-
Mulvey and Colello (2010), p. 5.
-
Iceland and Bauman (2004), “Income Poverty and Material Hardship: How Strong Is the Association?” National Poverty Center Working Paper Series, #04-17, at http://papers.ssrn.com/sol3/papers.cfm?abstract_id=648341. Based on a review of the literature on poverty dynamics, the authors conclude that “longitudinal data show that a majority of poor individuals in the U.S. actually remain poor for only short periods of time and relatively high proportion of people have experienced poverty at one point or another.” However, cycling in and out of poverty status is also common. Whether this is a desired property or not, such cycling could improve the solvency of the CLTCI plan if it causes disenrollment and reenrollment in the plan.
-
JDPower.com reports that 60% of adult Americans have at least some life insurance. http://www.jdpower.com/insurance/articles/Lack-of-Life-Insurance-Coverage/.
-
AARP, “The Costs of Long-Term Care: Public Perceptions Versus Reality in 2006,” December 2006, http://assets.aarp.org/rgcenter/health/ltc_costs_2006.pdf, at 32.
-
Thomas, L. (1999) “Incumbent Firms’ Response to Entry: Price, Advertising, and New Product Introduction” International Journal of Industrial Organization 17: 527-55.
-
Simon, D. (2005), “Incumbent Pricing Responses to Entry”, Strategic Management Journal, 26: 1229-48.
-
This theory is attributed to Sutton (1991).
-
Mulvey and Colello, pp. 5-7. The CBO and CMS have both estimated the average premiums necessary to provide a $50/day average benefit level, with the CBO estimating premiums of $123 per month and CMS estimating $240. The difference is attributable to more pessimistic projections of adverse selection by CMS.
-
In particular, the Congressional Research Service estimates that the “monthly premium for a $50 per day policy in the private LTC insurance market for a five-year policy would be about $94 a month.” This is $29 per month below the CBO-estimated CLASS premium. In exchange for the additional $29 per month, the CLASS plan offers benefits of unlimited duration. Under the CMS estimates, the additional cost is much greater, $146 per month. Id.
-
In a recent report, Milliman recommends a structure that would have a tontine-like element: “Individuals could be encouraged to preserve their benefits by offering them a faster benefit growth rate if they do not access their benefits until a certain age.” Bob Darnell et al., “Perspectives on the Community Living Assistance Services and Support (CLASS) Act,” Milliman Research Report, September 2010.
Managing a Cash Benefit Design in Long Term Care Insurance
7-27-10
Introduction
The use of cash benefits in long term care insurance has a long and varied history. Contrary to popular belief, cash benefits were more prevalent in the early days of the product’s history -- in the late 1980’s and early 1990’s -- than they are today. With the emphasis of the CLASS Act on a pure cash benefit payment model, it is important to review the history of the use of cash benefits and address key issues in best practices when managing such a policy.
We begin with some basic terminology used to describe the basis on which long term care insurance pays benefits since the terminology is not always used consistently. We provide some level-setting definitions:
Cash (Disability) Benefit -- the insurer pays a pre-defined cash benefit for each day the insured satisfies the “Chronically Ill” definition of needing help with 2 or more activities of daily living (ADLs) or having a severe cognitive impairment. The cash payment is made without regard to whether the claimant receives either paid services or informal care.
Reimbursement Benefit -- the insurer reimburses (or pays directly with assignment to a provider) expenses incurred for covered services, up to the daily or monthly maximum amount selected by the insured for that service. Payments are made for each day the claimant is Chronically Ill and receives a covered service.
Indemnity Benefit -- same as the above however, instead of paying expenses up to a set dollar amount, the insurer pays the set dollar amount without regard to the actual cost of services incurred. They may pay in excess of the cost of the care received. But it is required that the insured both be Chronically Ill and incur covered expenses.
History of Cash Benefits
Cash benefits first emerged largely because of the flexibility they provided for both insurers and the insured and for the enhanced market appeal of a broadly flexible benefit. It is important to keep in mind that, at the time cash benefits emerged, most long term care policies did not include benefits beyond the basic home health care (sometimes even limited to skilled home care) and nursing home care. In contrast, today’s coverage includes a vast array of alternative care settings and providers (discussed in greater detail below).
The use of a pure cash benefit began in the late 1980’s to early 1990’s primarily with two insurers. Aetna -- exclusively in the group market -- initiated a pure disability benefit model which, at that time, paid for loss in 2 of 5 Activities of Daily Living, with bathing being the ADL not counted. The net impact of that, given the highly predictable order of ADL loss, with bathing and dressing most typically the first two losses, is that an insured would in effect need to have a deficit in 3 ADLs (bathing, dressing and toileting) in order to satisfy the benefit trigger and receive benefits. At the time that Aetna offered this product, it was not entirely uncommon for insurers to have a variety of benefit triggers with some using the same approach of excluding bathing as a countable ADL. Fortunately, this is no longer the case and all six of the basic ADLs are almost exclusively used today as the basis on which loss is determined.
At about the same time, UNUM began development of a retirement community-based insurance product with a cash benefit payment. One reason for this model for this specific market was that Continuing Care Retirement Communities (CCRCs) usually do not employ agency staff or have care facilities that would have satisfied prevailing policy definitions. Since CCRC services and facilities are often exclusively used by residents, they may not be traditionally licensed. The cash benefit was relatively small because it was meant to “gap fill” the differential in costs when residents in a CCRC move out of independent living to a higher (more costly) level of care; they would continue to pay their independent living fee but would use the insurance to pay the additional costs of assisted living or nursing home care. UNUM then expanded the cash benefit model to the individual and group markets. Nursing home care, with both Aetna and UNUM, was paid for on either an indemnity or a reimbursement basis.
Both companies subsequently moved to a hybrid approach. In about late 1990’s, Aetna developed a service-based (reimbursement) policy in part for competitive reasons and also because they were not satisfied with the experience on their disability-based model. Interestingly, Aetna continued to use the 2/5 ADL loss requirement for its cash benefit but used the more generous and more prevailing 2/6 ADL loss requirement for the service reimbursement model. The choice of which benefit model to offer was typically made at the employer level. Similarly, UNUM began with just a disability model and shortly thereafter added what they call the professional services option (reimbursement payment).
Today, cash as a component of coverage is prevalent. There is also a great deal of diversity with respect to the number of carriers offering a cash benefit component as well as with the ways in which the benefit is fashioned.
Categories of Cash Benefits
Today there are four approaches to offering cash benefits. Of these, what we call “All Cash” is the most akin to CLASS. The others offer various modifications with a cash benefit that is not as comprehensive as the “All Cash” approach. With these variations, it seems the industry is looking for ways to offer some of the additional flexibility of cash while also offering a more cost-competitive product. (Tables 1 and 2 show the prevalence of the various cash benefit types across both the individual and group markets.) The specific design variations offered within the family of “cash benefits” are summarized below.
All Cash
This type of product generally pays exclusively a cash benefit in specified amounts once eligibility triggers have been met. The cash benefit can be paid only when the insured is not confined in a care facility (with the facility-based benefit paid on a reimbursement or indemnity basis), or the policy can pay a cash benefit for any level of care need. At present, none of the “All Cash” products vary the benefit amount by degree of disability as CLASS is contemplating. Management of the “all cash” benefit varies (as discussed below), but generally insurers offering these types of products do not require proof of the receipt of either paid or unpaid long term care services. Sometimes, insurers that provide the “All Cash” model do not include other “ancillary” benefits like respite care, hospice care, informal caregiver training, equipment or home modification as the “cash” can be used for those types of services, and more.
Four companies have been associated with this type of benefit; Aetna, MedAmerica, Metropolitan Life and UNUM. Of these, only MedAmerica and UNUM are actively selling this product today. Aetna offered this product in the group market, as noted above, but no longer sells long term care insurance and has transferred some of its group cases to other carriers (most notably Prudential). MetLife recently stopped selling its “all cash” policy although they continue to administer the policies of this type which are in-force.
MedAmerica offers “All Cash” products that feature cash benefits paid on a monthly basis. Insureds who meet the benefit triggers must submit a form each month certifying that they continue to have the condition (or reside in the same care facility) as when they were initially assessed as benefit eligible. MedAmerica seems to be using this monthly form as the plan of care required of tax-qualified long term care insurance products under HIPAA.
Unum offers both a cash product (called Total Home Care) and a service reimbursement product (Professional Home Care). In the group market, the choice of which to offer is generally made at the sponsoring employer level. Although they are no longer selling in the individual market, previously the insured could select at time of purchase the approach they prefered. Unum’s target market includes numerous small businesses many of which include some amount of employer contribution. This serves in effect as a way of lowering the price of the “All Cash” product to the insured.
Cash Benefit as a Rider.
Some companies offer a cash benefit as a rider to a traditional expense reimbursement policy. The rider, obtained for an additional premium cost, allows insureds to receive the full amount of their home care benefit in cash assuming they meet all of the benefit triggers. The rider must have been selected at time of purchase. This option is offered as a part of a service reimbursement policy but changes how the home care benefits are paid. The prevailing approach is one where insureds decide on a month-to-month basis whether to elect benefits in the form of cash or as an expense reimbursement. Insureds using this benefit are more frequently assessed for benefit eligibility than those with the service reimbursement benefit. Some insurers have stopped offering this rider on policies with a lifetime duration and/or with high daily benefit amounts. And others have stopped using this approach entirely and instead use a “Built-in Cash Component” described below.
Built-in Cash Component.
Some carriers build in to the policy a provision for a cash benefit offered at less than the full home care benefit amount as an option at the time of claim. If the insured so chooses, they can elect to receive cash (typically on a month to month basis) in lieu of home health care benefits. The cash benefit may be paid at anywhere from 10% to 50% of the home care reimbursement amount. (Most carriers offer a home care benefit equal to the facility care benefit, and some even allow the home care benefit to be set at 150% of the facility care benefit amount.)
The idea behind this approach is to design the product to include a cash feature which is “premium neutral” thus mitigating some of the risk management issues associated with the “all cash” model. This model is also easier to sell since it offers the flexibility of cash without the “sticker shock” of the higher premium of the rider approach or “all cash” approach. In some cases, insurers put lifetime limits on the use of the cash benefit option and in other cases they do not.
Remainder or Ancillary Cash.
Two companies at present have a different approach. For both, the cash benefit is integral to the policy and not offered as an additional-cost rider. One company allows the insured to access cash if there are benefits remaining in their monthly home care reimbursement benefit at the end of the month. It is essentially an expense reimbursement policy with an added cash feature. Insureds who meet the benefit trigger and are receiving home care receive a traditional expense reimbursement benefit, however, if at the end of the month there are any funds remaining in their monthly home care benefit allowance (an amount chosen by them at time of purchase), they can elect to receive reimbursement for a wide array of long term care related expenses not covered in the policy, including family care, at up to 50% of that unused portion in the form of cash. The “cost” for family care is based on the number of hours of care that will be provided and prevailing rates for that type of care when provided by a home health aide or similar provider type in the area. They can also elect to leave the unused balance in their “pool of benefits” thereby conserving their lifetime maximum for future use.
Another insurer offers cash as a separate benefit that can be accessed by insureds who have met specific conditions. To be eligible for this benefit, the insured must: 1) meet the eligibility triggers; 2) satisfy the elimination period; 3) receive care at home; and 4) receive at least one day of home care during the month. Further, the insured must not have resided in a nursing home or assisted living facility during the calendar month. The cash benefit does not reduce the insured’s lifetime maximum benefit and can be continued as long the insured continues to meet these conditions. The cash amount is equal to 15% of the monthly service benefit to be used as the insured’s discretion; no proof of services or other verification of how the funds were used is required. The benefit is paid as a supplement to the regular service reimbursement benefit.
The Extent of Cash Benefits in Today’s Marketplace
There are no data on the percent of policies in-force with a cash benefit. Given the variability in the types of cash benefits offered, an overall percentage would not have much meaning; some carriers offer a pure cash model, while others have cash as a more modest component of the coverage. Since almost all the insurers offering a cash benefit also offer a reimbursement policy option, we can’t even derive a meaningful estimate of how much “cash” benefit is in-force based on carrier market share. For example, data from Broker World, 2009 indicate that in 2008, 38% of insuredshad coverage with a company that offers a cash benefit option (either at point of sale or at time of claim) while about two-thirds of insuredshave coverage with insurers not offering any cash component. Sales of cash benefits range from 1-3% of a company’s business to about 40%, based on anecdotal estimates provided by companies that sell both types of policies. So while we can say that less than one-third of today’s insuredshave a policy with a cash component, we cannot provide more specific market penetration estimates.
Data are available based on annual sales figures in the individual market only. As a percent of new lives in 2008, 3% of 2008 buyers in the individual market purchased a policy with a cash benefit as a base feature in the policy. Similarly, an additional 3% of new buyers bought a policy with a rider providing some type of cash benefit. These numbers, however, mask a significant amount of variation by company. Observe the following variation based on 2008 new lives in the individual market:
-
Not surprisingly, MedAmericaand UNUM, both of which offer a cash benefit as an integral component of the policy, had the largest share of buyers with a cash benefit -- over 80% of their new sales.
-
Other companies that offer a cash benefit as a policy component had a smaller percent of their 2008 sales selecting a cash-based benefit plan (ranging from 2% for one insurers and as much as 39% for another, with sales levels in between those amounts for the other insurers.
Closer Look at Cash Benefits
Table 3 shows the variation in the types of cash benefits offered. Of 13 policies with a cash component, nine have a cash benefit as a built-in feature of the product. Four offer a cash benefit only through a rider to the base policy. And three offer both a built-in cash benefit and an optional rider for an enhanced cash benefit. As noted previously, insurers tend to base the cash benefit on a percentage of either the monthly home care benefit or the monthly maximum for all levels of care if the policy has the same amount for all. Options range from 10% to 50%, but the most common percentage is 40%. Riders, however, tend to give insureds options for higher percentages, such as 50% and even 100%.
With built-in optional cash benefits, insuredsinform the insurer at claim whether they wish to receive cash. Most policies let the insured change between cash and reimbursement from month to month. Cash benefit riders typically must be purchased at time of application and cannot be added later even with underwriting. The insured is typically not permitted to receive other home care or facility benefits while receiving a cash benefit.
Many policies with cash benefits, whether built-in or offered through riders, do not place restrictions on how insuredsspend the cash, nor do they require that the insured prove receipt of care or services. Most policies with cash benefits reduce the overall pool of benefits “dollar for dollar,” though one insurer offers a cash benefit rider of 15% of the home care benefit over and above the other benefits and does not apply the cash payouts towards the overall pool. Most policies pay either cash or expense reimbursement, but one or two provide an additional small cash pool on top of the expense reimbursement (although the total amount paid is limited to the monthly maximum).
Advantages of the Cash Benefit Model
The Cash Benefit model presents advantages for both the insurer and for the insured.
Advantages for the Insured
-
Flexibility. The most obvious advantage for the insured is the flexibility in how funds can be used. This allows the insured to use the cash payment for nontraditional providers of care, informal caregivers, non-licensed providers, home modifications, help with instrumental activities of daily living (IADLs) like meal preparation, housekeeping, transportation and other services that are either not covered or are covered on a more limited basis under a traditional reimbursement product. Another advantage for the insured is the flexibility to “save up” the daily cash benefit payments and use them only on days when paid care is needed. For many people, paid care needs are “lumpy” in the sense that one might need full-time care during the weekday but no care at night or on weekends when family care is available. A fixed daily benefit reimbursement amount does not accommodate that type of expenditure pattern but a cash benefit which can be “banked” until needed can better match the uneven pattern of care needs. A cash benefit also can provide value to family members who may incur costs associated with caregiving. For example, a daughter who needs to hire child care or quit her job in order to provide personal care for her mother can use the cash benefit to offset those costs.
-
Product “Shelf Life.” Another advantage to insureds is that cash benefits have more flexibility to remain useful and contemporary as new types of services and providers evolve. For someone buying a policy today which they likely won’t use for 20 to 30 years, this flexibility can be important. If the policy benefits and covered services are defined based on what is known about today’s service environment, without flexibility to upgrade, the policy can more quickly become obsolete.
Advantages for the Insurer.
-
Compliance. A cash-based product is easier for the insurer to develop, file and maintain policy language since there is no need for provider or service definitions. Additionally, this means fewer state variations which also expedites the state regulatory approval process. A cash benefit also has a longer “shelf life” which benefits the insurer as they do not need to design and file product updates as often in order to keep pace with a changing service system.
-
Administration. A cash benefit policy can be easier to administer in the sense that the insurer does not need to verify provider or service eligibility -- only that a qualifying disability and the need for long term care exists and that other policy provisions are met. One carrier mentioned that benefit payments are facilitated with a cash policy because they are typically transmitted via electronic funds transfer.
-
Competitive Advantage. There is also a competitive advantage when a policy pays a cash benefit -- all else being equal -- because of the flexibility and appeal of cash. (While this is offset by the fact that a cash policy is more expensive, it is possible to design the cash benefit so that it is premium neutral with a competitor’s product.)
Disadvantages of the Cash Benefit Model
Cost.
One of the primary disadvantages, both for consumers and insurers, is that this benefit approach is more expensive, with estimates ranging from about 20% to 35% to as much as 60% to 100% higher cost for a cash benefit. The range depends on the pricing assumptions and the type of cash benefit and other features of the policy and the age of the insured at time of purchase. (Table 4 shows premium differentials across insurers with and without a cash features for some sample policy designs.)
The greater level of expense is due in part simply to the fact that benefits are paid more often than they would be with a reimbursement policy; specifically they are paid whether or not the insured receives paid care and the benefit is available to be paid every day the insured is disabled, compared with a more intermittent payment schedule (e.g., 4-5 times a week) for someone with a reimbursement policy since that reflects the more typical pattern of paid service use. There are additional factors playing in to the higher costs of the cash model including greater administrative costs relative to functions around benefit determination, re-certification and fraud management. These are discussed in a later section.
Another concern with cash benefits is a higher claims denial rate which in turn generates greater administrative costs; this will become even more of an issue as a growing number of states require independent third party review of claim denials.
Another cost disadvantage for the insured is the fact that a cash benefit typically has little or no “salvage” value. Salvage refers to the pricing concept whereby the insurer assumes that neither the full benefit amount per day nor the lifetime maximum will be fully utilized; this is especially true with high daily benefit amounts. With a cash benefit, the experience is that there is little or no “salvage.” Thus, insuredsare not able to “conserve” their lifetime benefit maximum if they have coverage of less than “lifetime” duration because they will receive a cash payment on every day they are disabled even if they are not incurring expenses; these payments would “draw down” on their lifetime maximum. Of course, the individual can choose not to make a claim for benefits under the cash model as a way of conserving benefits but that is more difficult to do (logistically and practically) with a cash benefit. The appeal of receiving cash (perhaps to be used later if needed) is a strong incentive to make the claim rather than “holding off” just in case more care is needed later.
One carrier cited the “hassle factor” as a reason that a reimbursement benefit costs less than a cash benefit -- meaning that the more documentation that is required to make a benefit claim (e.g., providing documentation of covered expense), the less likely the individual is to make the claim. The lack of a “hassle factor” with a cash benefit therefore can be another factor making it more expensive.
Managing the Benefits.
Another disadvantage for the insured is that they have to manage their cash benefit dollars and take sole responsibility for finding, arranging and verifying the appropriateness and “quality” of the care providers they elect to use. I don’t find this argument very compelling at all. In the Lifeplans LTCI admission cohort survey, it was clear that claimants very rarely relied on insurance company case managers to identify specific providers or “arrange” services for them. They picked their own providers (NF, ALF, home care) based on their own criteria. For NF, ALF it was reputation in the community, physician or other medical provider recommendations, and proximity. For home care, it is less clear what criteria claimants used to pick specific providers were chosen, but two thirds of claimants used agencies and one third hired individual providers. Let’s just imagine that an insurance company provides a “recommended” plan of care. The operative word here is “recommended.” Is a home care agency going to follow that plan to the letter? I doubt it because the schedule of service (e.g. how many days a week, hours, morning vs. evening) and tasks to be performed (baths on which days) will be worked out between the claimant and the agency (or individually hired aides). If the insured has given power of attorney to a caregiver or family member, there is no guarantee that the cash payments will be used as they should be to provide and pay for care. Some carriers provide a detailed plan of care that makes recommendations with regard to the nature and type of care insureds need to best meet their situation. Following this plan of care can help insuredsmake the most of their cash benefits.
Insureds may also use up total benefit dollars faster since benefits can be paid out even if they are not incurring expenses (e.g., if family or friend are providing care at no charge). Unless the insured “saves” those cash benefit payments for later use when paid/formal care is the only alternative (e.g., nursing home care perhaps), the benefits available at that time might be greatly reduced.
Tax Implications.
While likely, there may be negative tax consequences for the insured with a high pay out cash policy. HIPAA imposes a limit on the amount of cash benefit relative to the amount of long term care expenses that can be received tax-free with a tax-qualified policy. In contrast, there is no limit on the amount of reimbursement for expenses that can be received tax-free. Some cash benefit options today can have a rather high daily benefit amount so it is not entirely unlikely that someone could receive, say, a $500/day cash benefit and incur no long term care costs -- in which case they could face a tax liability based on the amount in excess of the IRS cap (today set at $290). This would mean that $210/day (or over $76,000/year) could be considered taxable income for the insured. This concern is less critical for CLASS given the significantly lower benefit amounts being considered.
Higher Administrative Costs.
One of the most important disadvantages for the insurer is the fact that a cash benefit is more costly for the insurer to administer (which translates into higher premium costs) because of the need for more in-person assessments and more frequent reassessments. Without the service records or provider input the insurer would receive under a reimbursement model, the insurer cannot assess continued benefit eligibility without doing costly in-person assessments more frequently than they would otherwise do. There is also considerable potential for fraud and abuse given the incentive for someone to “stay on claim” even when they are no longer chronically ill -- an incentive that is much greater when they are receiving a cash payment, without a requirement to receive services. Surprisingly, there is a fairly significant “recovery” rate in long term care -- one estimate cited by a large third party administrator finds that 30 to 40% of those who meet the benefit triggers and receive benefits eventually recover. So the ability to continually re-assess eligibility status is critical to the accurate payment of benefits. Additionally, without service records or provider input, the insurer cannot assess continued benefit eligibility without doing costly in-person assessments more frequently than they would otherwise do so.
Consumer Response to Cash
Most carriers offering a cashbenefit indicated that insureds articulate a preference for a cash benefit because of the flexibility of the offer. However, whether they elect such an option or not depends upon how competitively it is priced. In one insurer’s experience, initial “take up” of their cash rider (month-to-month option to elect 100% cash) was high -- about 40%. But when the product was re-rated at about 28% higher premium, take up dropped significantly to about 3%. That was the motivation for this insurer to move to a “built-in” premium neutral approach to cash.
Aside from this anecdotal information, data on the extent to which insureds elect a cash benefit -- either as an optional rider -- or to use on a month-by-month basis is not known. Similarly, information is not available on how insuredstypically use cash. Aside from a few company-specific studies over the year, most insurers do not track how the cash benefit is used.
Alternatives to a Cash Benefit: Flexibility of Today’s Long Term Care Insurance Products with a Reimbursement Model.
The biggest advantage of the cash disability model, when first introduced, was the flexibility for the insured to use non-traditional providers or less costly providers for non-institutional care and to cover services not typically covered at that time (e.g., assisted living facility care, caregiver training, devices, respite or hospice care). However, reimbursement type policies have significantly diversified to accommodate a vast array of new types of providers, services and benefits. One of the most important -- coverage for care in an assisted living facility -- while virtually unknown as a benefit in the 1990s is universally covered in today’s policies, usually at the same benefit level as nursing home care.
Other benefit provisions which offer much of the same flexibility of a cash benefit are discussed below. The prevalence of these features in policies being sold today (based on data from 2008 sales) is strong. These data, exclusively for the individual market, are summarized in Figure 1 and discussed below.
Caregiver training typically provides a total benefit amount (sometimes expressed as a multiple of the nursing home DBA -- e.g., 5 x DBA) to teach an informal caregiver how to safely provide personal care and supervision. The vast majority of plans offer this as a base feature in the policy, but one company does offer it as a rider. As a result, 99% of buyers in 2008 had this feature as part of their coverage.
Informal Caregiver Benefits allow payment to an informal (non-licensed) caregiver. Definitions of who qualifies as an informal caregiver may vary; some policies include family under any circumstances and some may limit the use of the benefit to family not living with the claimant on a regular basis. Nine of the 23 companies surveyed in 2008 include an informal caregiver benefit -- most as a feature in the base policy. Overall, just under over 70% of all buyers had a policy with this feature.
Monthly Home Care: Since most people do not receive the same amount of care on a daily basis, having a monthly home care maximum instead of a daily limit gives the flexibility to “stack services” on days when people need more care and to preserve benefits on days when they do not need paid care. While once fairly unique, most policies today do offer a monthly home care. Only four companies selling in 2008 do not have a monthly home care benefit. As a result, over 50% of all buyers in 2008 obtained a policy and/or rider that provides the flexibility of a monthly home care benefit.
An Indemnity Benefit pays a flat dollar amount when covered expenses are incurred, even if the benefit payment exceeds the amount of expenses. The insured can then use the difference essentially as a cash benefit to pay for some items not otherwise covered under the policy (e.g., private duty nurse in a nursing home stay). About half the companies selling in the individual market offer an indemnity benefit payment either as integral to the policy or through the offer of a rider. Of 2008 buyers, 7% obtained this provision as a base feature of the policy while 4% purchased it as a rider.
Respite care provides time off for informal caregivers, generally by providing benefits (home care, ALF or other services) without requiring that the elimination period be satisfied. This provision is included as an integral policy feature in nearly all policies; only one company selling in 2008 did not include respite care (although that carrier may have other policy features that serve a similar purpose -- e.g, a 0 day elimination period for home care);
An Alternative Plan of Care provides flexibility for the insured to request the insurer to approve coverage for providers, treatments, services and care settings not otherwise covered under the policy. While most carriers do not authorize a cash payment under this provision, it is used to provide flexibility to pay for home modification, equipment, transportation, informal caregivers, family care and many other things. Overall, 80% of 2008 buyers obtained a policy with an APC as a base feature of their coverage.
Home Modification and Equipment benefits are designed to enhance independence when someone has ADL impairments and typically include things like wheelchair ramps, tub rails, and other adaptive devices. Access to this benefit is also widespread. Over 84% of buyers in 2008 had a policy with this feature either as an integral component of the coverage, or (2%) as a rider.
International Care. Many policies now pay for care abroad, either as a routine policy feature or on a limited/defined basis. Over 80% of buyers in 2008 had a policy with this feature as an integral component of their coverage.
[INSERT FIGURE 1 HERE]
Data on the extent of these flexible benefits in the group market is less readily available. However, Broker World 2009 indicates that six carriers in the group market include coverage for informal care and/or family care. Sometimes the option is made at the employer level when they select the package of benefit features to offer and sometimes it may be an integral policy component. The Federal Long Term Care Insurance Plan also includes a benefit for informal and family caregivers and CalPERS has a provision for coverage for independent providers who are not licensed or agency-affiliated.
Best Practices in Managing a Cash Benefit
As discussed above, the major disadvantage of a cash benefit is the added cost due to a variety of factors. The most “manageable” of these pertain to the following: managing utilization, accurate and timely benefit determination and re-assessments and monitoring and addressing potential fraud and abuse. This section summarizes the “best practices” insurers use to maintain as competitive and cost-effective cash benefit as possible, as well as to ensure that benefits are provided equitably and appropriately.
Underwriting.
While the CLASS Act will be offered without underwriting, most of the insurers offering a cash product underwrite to varying degrees. All insurers in the individual market employ underwriting. If an insured is requesting a high daily/monthly benefit amount and/or a large lifetime maximum where a cash benefit component is included, the insurer will generally take in to account the risk posed by that applicant relative to the coverage they are seeking. Some insurers make a “counter offer” of reduced coverage than what was applied for rather than declining an applicant or issuing them coverage on a sub-standard (higher premium) basis.
On the group side, one carrier offering an all cash option does not offer guaranteed issue. However, they use both case-level and individual underwriting although a shortform may be used in this market. Another insurer with an “all cash” benefit offers coverage on a guaranteed issue basis but does case level underwriting, limits the benefit amounts and durations, and sets either minimum participation levels and/or requires an employer contribution which significantly enhances participation. In earlier policy forms with its cash benefit, this insurer offered coverage on a guaranteed issue basis but had a policy provision which indicated that benefits would be triggered by a loss of 2 additional ADLs to whatever the applicant had at time of enrollment; the result of this is that if someone was already impaired in 2 ADLs at the time of enrollment, benefits would not begin until they reached a 4 ADL level of loss. While we would not, for many reasons, consider this a “best practice,” it was being used at one point in time to manage the risk of not using underwriting with an “all cash” product.
Another carrier offers a cash benefit rider in the group market without underwriting however, as is typically the case with guaranteed issue, it is limited to a defined enrollment period and a meaningful “actively at work” definition. Also, the maximum daily benefit offered on a guaranteed issue basis is under $350/day. Anything over that (coverage goes up to $500/day in this case) must be underwritten. While it is rare, one carrier that does offer a lifetime benefit in the group market with a cash rider would only do so with full underwriting.
Benefit Design.
While some insurers offer lifetime coverage, most do not allow a policy to be issued with both lifetime coverage and a cash benefit option. This is more true for those offering a cash benefit rider or an all cash benefit than for those carriers which have “ancillary cash” or a built-in cash provision. Those two approaches are another alternative strategy for using benefit design to manage the risk of the cash benefit. Insurers also impose limits on the amount of daily or monthly benefit available with a cash benefit. Some do so within a cash rider by allowing a benefit amount less than the full amount that can be sold on an indemnity or reimbursement basis (e.g., a $350/day maximum on the cash rider but a $500 maximum on the reimbursement benefit).
With respect to the “built-in” cash benefit, several insurers indicated that the “built-in” cash benefit was designed to be “premium neutral,” which is why it pays at a lower rate (10% to 50%) than when benefits are elected on an expense reimbursement basis.
Additionally, most insurers offering a monthly benefit -- whether cash or reimbursement -- do so on a pro-rated basis.The amount of monthly benefit available to the claimant is equal to the percentage of days of the month on which they satisfied the benefit eligibility criteria. For example, someone who becomes disabled on June 1st and remains disabled the entire month would receive their entire monthly benefit amount (whether cash or reimbursement) but someone becoming disabled on June 15th would receive only half of their monthly benefit allowance.
A few insurers impose an “inner limit” on the amount of benefits that can be paid with cash. So someone with a lifetime policy maximum of $150,000 might only be allowed to receive 10 x the monthly maximum or $60,000 in the case of a $6,000/month benefit amount. When a smaller lifetime limit is imposed, it might be offered as an “ancillary” benefit and may or may not draw down on the lifetime maximum although it is unusual to have any benefit payment fall “outside” the lifetime policy maximum -- whether it is a cash benefit or not.
Benefit Determination & Recertification.
Appropriate and timely benefit assessments and re-assessments were cited universally by those administering cash benefits as one of the most important risk management tools. The additional challenge of administering a cash benefit policy is that it is more difficult to determine benefit eligibility (i.e., the nature and degree of functional or cognitive loss) without records of expenses incurred, services provided or other medical or care notes. Therefore, an in-person assessment is typically required either more frequently or all the time (it differs by carrier practice) in the case of a cash benefit where it is used less frequently in a reimbursement benefit when other information is available and adequate to substantiate the loss.
Similarly, given the not insignificant (30 to 40%) recovery rate in long term care, it is very important to do timely re-assessments. One study found that 70% of claimants had at least one “transition” in terms of nature and degree of disability over the course of their disability. At a minimum, some carriers mentioned conducting re-assessments every 90 days. Receipt of a cash benefit is a powerful incentive for an insured or their family to maintain the receipt of benefits when the insured may no longer be benefit eligible; this is especially true if the cash benefit is being used for basic living expenses and not for the provision of paid care which of course would no longer be needed upon recovery. One carrier said that the need to do more frequent on-site assessments with a cash policy likely resultsin assessments costs which are two or four times as much as they would be under a reimbursement policy.
Some of the tools carriers use to assist in gathering needed information for benefit reassessment include structures questionnaires to physicians about the claimant’s need for supervision and support, ADL questionnaires for providers and informal caregivers, medical management tools, and the like. Telephone-based assessments can be helpful but only when there is other corroborating information like care notes or provider records.
Plan of Care.
A tax-qualified LTC policy must provide benefits in accordance with an approved Plan of Care developed by a Licensed Health Care Practitioner. While all TQ policies do this, the interpretation of what constitutes a Plan of Care and how it can be used varies widely. Some insurers see the Plan of Care merely as an articulation and description of the nature and degree of loss such that the insured is benefit eligibility and do not go further to specify recommended or prescribed service types or frequencies. Other Plans of Care do go into further detail about care options and service settings, including both those covered under the plan as well as other community or free resources that might be available to the insured to help support their care needs. Some insurers monitor that benefits are provided in accordance with the Plan of Care by reviewing expenses submitted under a reimbursement policy. In a cash policy, the insurer interested in maintaining care consistent with the Plan of Care must rely upon care notes provided by either formal or informal caregivers. Some companies provide a format and guidelines by which families can document care notes while others do not. One unique approach by a company that offers an “ancillary cash” benefit is to use the Plan of Care to define the type, amount and allowable expenses associated with the amount of the unused monthly benefit maximum which can be spent on long term care that isn’t covered in the policy -- be it family care, equipment and devices or other items. They consider this a “cash and counseling” type model. It is also important to note that the Plan of Care is never a “hard and fast” document – it changes as insureds’ care needs and their options for receiving care change. If family care is initially available, a Plan of Care may reflect that in its recommendations; if that situation changes (e.g., a family helper becomes ill or moves), then the Plan of Care is modified to identify an alternative appropriate option for care.
In creating the Plan of Care, some insurers take care to assess the adequacy and competency of informal supports and unlicensed caregivers to provide care. This is an important factor whether those individuals provid care as a supplement to a reimbursement policy or as the primary source of care within a cash benefit plan. One carrier identified instances where the insured’s desired plan of care was to rely upon a spouse who was disabled to the point of being unable to provide the care needed.
Based on the claimant study mentioned above, for about one-third of all claimants, there is a recommendation for some type of change to the plan of care as indicated by the insured’s needs and personal situation. This figure remains fairly constant over time underscoring the need for on-going monitoring of care needs to help insuredsget the most value of their coverage. And over 90% of claimants at all points in their disability cited that care management was helpful to them.
Fraud Investigation.
A focused and active fraud investigative unit is universally cited as an integral component critical to a cash benefit plan. While fraud investigation is also important for any policy, there is a significantly heightened potential/incentive for fraud with a cash benefit. Most insurers have a dedicated fraud unit, they might use a vendor for the service and it typically involves hiring private investigators. Insurers tend to focus on situations where an insured has an especially high daily benefit amount and where the initial assessment and subsequent reassessments suggest a high likelihood of recovery. One carrier indicated that they are successful in documenting fraud in about 50% of the suspected cases. One carrier mentioned that fraud investigations typically costs about $2,000 to $4,000 per case, sometimes higher.
Carriers indicated that fraud is also a more significant concern with a younger claimant population, which has obvious implications for CLASS. One insurer suggested that the fraud rates found in LTD might be a good proxy for estimating anticipated fraud in a cash-based benefit, in part because both are focusing on a younger, at work population. With older populations, the concern focuses more on fraud against the claimant and not by the claimant. Some carriers said that in general there is more evidence of fraud perpetrated by the family of the claimant than by the claimant themselves.
Experience Monitoring.
As with all LTCI, experience monitoring against pricing assumptions is critical. Insurers say it is very important to know the actuarial assumptions with regard to utilization and recovery and to evaluate actual practice against that.
Premium Impact
Table __ compares premiums under varying types of cash benefit provisions. Some companies offer more than one option so the data provided represent multiple offerings of multiple insurers. Samples ages of 45, 55, 65, and 75 are used. The “base plan” chosen for analysis is one with a $6,000/month benefit ($200/day), a 90-100 day elimination period, built-in 5% compound inflation protection and a lifetime maximum roughly equal to 5 years. In most cases, these policies pay the same amount for home care as facility care. Obviously, there will be other minor benefit differences (e.g., one policy may have a more generous bed reservation benefit than another), but for the most part the important coverage elements are the same. We used only standard, nondiscounted rates.
Obviously, for policies with a cash rider, the additional premium cost of that rider depends on whether it pays 20% of the home care reimbursement amount or 100%. For the smaller benefits (20% - 25%), the additional cost is roughly 13 to 30%. At the other extreme, the 100% cash benefit can add as much as 70% to the premium, although insurers vary considerable in how they price this rider.
The additional premium cost for the ancillary cash design is more modest -- roughly 7% to 17% depending on company, cash amount and issue age.
For companies with a “built-in” cash benefit, we show actual annual premium amounts since those companies do not have a “no cash” option against which to compare the premium cost. There are few consistent patterns; for the most part the higher the built-in cash amount, the higher the premium, but in some cases, a more limited policy design has a higher premium cost. Other plan design and price assumption differs are likely to be a factor.
Finally, we compare two “all cash” policies with 4 “no cash” policies. The premiums and the premium differentials are both shown. Again, there are differences by carrier. The additional cost for an “all cash” vs “no cash” policy ranges from 20% at the oldest ages to 100% nearly across all ages for one company.
Implications for Class Act
One of the primary concerns for CLASS is the premium cost impact of a cash benefit design and whether CLASS can be competitive with other private insurance offerings and thus attract a significant and healthy risk pool based on the premiums associated with the plan design. A cash benefit -- all else equal -- adds 20% to 100% to the premium cost of a “no-cash benefit” plan. Yet many of the competing plans in the private market without a cash benefit have significant benefit flexibility as shown in the summary of “ancillary” benefits included in today’s coverage.
While a cash benefit has strong consumer appeal because of its flexibility, the experience shows that, given a choice, most people prefer the more affordable non-cash or limited cash benefit plan. A concern for CLASS is whether the cash benefit will be more attractive to the population most at risk of being heavy users of benefit -- those with current disabilities -- and might not be price-competitive to attract a broad and healthy risk pool as well.
Unfortunately, the prevailing risk management techniques which are critical with a cash benefit design in order to maintain appropriate and cost-competitive coverage at the same time add to administrative costs. So it will be a challenge for CLASS to maintain the 3% of premium allowance for administrative costs while also having as robust and appropriate risk management infrastructure as will be needed. There are already concerns with the 3% premium allowance and the additional considerations needed to appropriately manage a cash benefit within that margin only make that more challenging.
It will be important for CLASS to anticipate the need for in-person assessments and appropriately scheduled re-assessments based on presenting condition of the claimant as part of its administrative cost structure. Establishing a strong benefit determination, review and appeal process and robust protocols for timely reassessments is the single most important challenge for CLASS in order to maintain the cost competitiveness and rate stability of the all-cash model. The infrastructure, risk management tools, training and staffing are all necessary to provide the required structure and process to support the cash benefit. There will be an additional administrative burden if the level of the cash benefit is varied with degree of disability; this will strengthen the incentives for insuredsto maintain benefit eligibility and may encourage what is called “ADL-creep” where higher degrees of loss than are actually found are claimed. All this means additional risk management measures will be needed even beyond those that are already being brought to bear on LTCI in general and a cash benefit in particular; today, there are no products that pay a higher benefit level based on degree of loss alone.
Similarly, utilizing the plan of care to help guide claimants to appropriate services and providers and to help them manage care costs is also important. The language of CLASS seems to provide for an ability to monitor expenses and determine benefit payouts accordingly. One of the most promising best practices we observed would be the model where the plan of care takes in to account actual expenses and imputed expenses for unpaid/informal care and bases the approved cash allowance on those expenses.
There are few plan design strategies that CLASS can utilize to manage the costs of the all cash approach. The coverage is already defined as unlimited/lifetime. To some extent, the lower daily benefit amounts will help mitigate the costs of the cash approach. It is not clear whether there is any flexibility to include variations on “all cash” -- e.g., a full benefit payout for expense reimbursement and then a portion of the balance up to the pro-rated monthly maximum paid in cash, rather than all of the balance paid in cash.
The industry has other “best practices” applicable to CLASS. Specifically, CLASS should consider some of the tools carriers use to assist in gathering needed information for benefit reassessment include structures questionnaires to physicians about the claimant’s need for supervision and support, ADL questionnaires for providers and informal caregivers, medical management tools, and the like. Telephone-based assessments can be helpful but only when there is other corroborating information like care notes or provider records.
Finally, with respect to marketing and education, if CLASS is more costly relative to the private market competition, it will need to focus specifically on the advantages of the cash benefit and how a smaller cash benefit provides more flexibility than a larger benefit amount paid on a reimbursement benefit. Helping consumers see the product advantages associated with a higher premium may help but this is still a challenge in such a highly price sensitive market. The concern, of course is that this message may work for those who have current or anticipated care needs but be less persuasive with a broader and healthier risk pool.
| TABLE 1: Types of Cash Benefits in Long Term Care Insurance -- Individual Market and Multi-life Market (companies are listed in order of market share in terms of in-force policies) |
|||||
|---|---|---|---|---|---|
| Company | No Cash Component |
All Cash |
Cash Rider |
Built-in Cash Component |
Ancillary/ Remainder Cash |
| Genworth Financial | X | ||||
| John Hancock | X | ||||
| Bankers Life | |||||
| Transamerica | X | X | |||
| MetLife | X | X | |||
| UNUM | X | ||||
| River Source (IDS) | |||||
| Thrivent | |||||
| Penn Treaty | |||||
| Allianz | X | X | X | ||
| State Farm | X | ||||
| Fortis | |||||
| New York Life | X | ||||
| Northwestern LTC | X | X | |||
| Mutual of Omaha | X | ||||
| MedAmerica | X | X | |||
| Prudential | X | X | |||
| Mass Mutual | X | ||||
| Ability Resources | |||||
| Physician’s Mutual | X | X | |||
| Equitable Life & Casualty | X | ||||
| Knights of Columbus | |||||
| CUNA Mutual | X | ||||
| Guarantee Trust | X | ||||
| Country Life | X | ||||
| State Life | X | ||||
| AIG Life | X | ||||
| Berkshire Life | X | ||||
| Standard Life & Accident | |||||
| Minnesota Life | X | ||||
| AssurityLife | X | ||||
| Other companies with cash benefits: LifeSecure (Ancillary); United of Omaha (Built-in). Does not include companies no longer selling in the individual market. | |||||
| TABLE 2: Types of Cash Benefits in Long Term Care Insurance -- Group and Association Market (listed in order of market share in terms of in-force policies) |
|||||
|---|---|---|---|---|---|
| Company | No Cash Component |
All Cash |
Cash Rider |
Built-in Cash Component |
Ancillary/ Remainder Cash |
| UNUM | X | ||||
| Met Life | X | ||||
| John Hancock | |||||
| C.N.A. | X | ||||
| Federal LTC Insurance Program | X | ||||
| CalPERS | X | ||||
| Prudential | X | ||||
| Genworth Financial | |||||
| WEA | X | ||||
| (Aetna) -- not selling | X | ||||
| TABLE 3. Summary of LTC Insurance Policies with Cash Benefit | |||||||
|---|---|---|---|---|---|---|---|
| Product | Policy Type |
Classification | How Benefit is Implemented |
Level of Cash Benefit Options |
Is There a “Lifetime Limit” Specific for the Cash Benefit |
Limits on Receipt of Other Benefits |
Limits on Use How Cash Can be Benefit |
| Allianz Generation Protector II | Individual | Cash Rider | Not clear if have to select % at purchase or at time of claim | Can elect 10%, 25% or 50% through monthly rider or 100% daily benefit in cash through full rider (up to $250 per day). Assume the amount is based on the home and community benefit which is set at a pre-selected % of NH. | No | Only for 100% cash benefit | None |
| American General | Individual | Ancillary Cash | 40% of pre-selected monthly maximum (and can switch between cash and reimbursement) | No | Yes, in lieu of HCC and Facility Case benefits | None | |
| C.N.A. | Group | ||||||
| John Hancock Custom Care II Enhanced | Individual | Rider | Automatic at time of claim | 15% of HCC monthly benefit | No info | Assume can’t use with NF or AL benefits | None |
| LifeSecure | Individual | Ancillary | Automatic at time of claim | Up to 50% of unused portion of monthly benefit | No | No | Yes subject to plan of care specifics and documented expenses but family care allowed |
| MEDAmerica Simplicity | Individual | All Cash | Consumer must submit benefit request form each month | Selected by consumer at purchase | N/A (this is a cash-only policy) | No | None |
| MetLife Premier | Individual | Built into policy All Cash |
No info | Selected by consumer at purchase | N/A (this is a cash-only policy) | No | None |
| MetLife LTC LifeStage Advantage | Individual | As rider (not available for $1m total benefit) | At initial application | Full monthly benefit | No | No | None |
| Mutual of Omaha Mutual Care My Way | Individual | Built into policy | At time of claim (can stop and restart cash benefit) | 35% of HC monthly included, but option to increase to 40% or 50% (not sure if requires rider) | No | Yes, no other benefits payable | None |
| Mutual of Omaha Mutual Care 3 & 5 | Individual | Built into policy | At time of claim (can stop and restart cash benefit) | 35% of HC monthly | No | Yes, no other benefits payable | None |
| Physicians Mutual | Individual | As rider at time of purchase only | At initial application (must receive HHC at least 1 day during the month) | 20% of home and community care benefit | No | Yes, does not apply to people living in NF or ALF or hospice | None |
| Prudential GLTC 3.5 | Group | 50% Cash Alternative | |||||
| Prudential LTC3 (Prudential Evolution offers a “starter” cash benefit of $1,500 per month for a year) | Individual | Built into policy and available in two riders: one for 50% of benefit and one for 100% cash. | At time of claim and requested monthly | 40% of HC Daily Benefit (see note in previous column on riders). | No | Yes, must receive HC benefit only | None |
| Prudential LTC3 | Group | Built into policy and available as rider | No info | No info | No info | No info | No info |
| Transamerica Transcare | Individual | Built into policy | No info | 10 times the daily benefit (30%) | No info | No info | No info |
| United of Omaha -- Assured Solutions & Assured Solutions Plus | Individual | Built into policy and option for larger cash benefit (50% of home care) | Option at time of claim | 40% of the Basic Home Care Services1 Monthly Benefit Amount selected |
No | Yes -- in lieu of other services | None |
|
|||||||
| TABLE 4: Premium Impact of Cash Benefit Under Alternative Approaches* | ||||||||||
|---|---|---|---|---|---|---|---|---|---|---|
| CASH BENEFIT RIDERS -- Cash Rider Additional Premium Cost by Cash Amount and By Company | ||||||||||
| Age | 20% Cash |
25% Cash |
50% Cash |
50% Cash |
75% Cash |
75% Cash |
75% Cash |
100% Cash |
100% Cash |
100% Cash |
| 45 | 13% | 30% | 13% | 41% | 28% | 50% | 59% | 39% | 70% | 70% |
| 55 | 13% | 30% | 11% | 41% | 25% | 50% | 59% | 36% | 70% | 70% |
| 65 | 13% | 30% | 8% | 50% | 20% | 49% | 59% | 33% | 66% | 70% |
| 75 | 13% | 30% | 7% | 50% | 19% | 49% | 59% | 30% | 66% | 70% |
| Notes: $200/day, 5 year lifetime maximum, 5% compound inflation protection for life, 90-100 day elimination period. These riders all provide cash benefit in lieu of home care reimbursement and cash paid reduces the lifetime maximum. For 20% rider, insured must receive at least one day of paid home care in the month in order to receive the cash benefit and the cash benefit does not reduce the lifetime maximum. | ||||||||||
| CASH BENEFIT RIDERS -- Ancilliary/Additional Cash Model Additional Premium Cost by Cash Amount and By Company | ||
|---|---|---|
| Age | 15% Cash |
25% Cash |
| 45 | 10% | 7% |
| 55 | 10% | 13% |
| 65 | 10% | 11% |
| 75 | 8% | 17% |
| Notes: Same coverage amounts as above however the 15% cash benefit is an “additional” amount to expense reimbursement and does not count against the lifetime maximum. For the 25% cash plan, cash benefit only paid if covered expenses also received and only if the maximum benefits paid (reimbursement plus cash) do not exceed the policy’s maximum monthly/daily benefit for home care. | ||
| Premium Comparisons under Alternative Built-in Cash Benefit Payment Scenarios | |||||||
|---|---|---|---|---|---|---|---|
| Age | 10x DBA per Month |
10 x DBA per Month |
35% Cash |
40% Cash |
40% Cash |
40% Cash |
50% Cash |
| 45 | $4,330 | $2,766 | $3,313 | $3,379 | $2,918 | $3,328 | $3,750 |
| 55 | $5,927 | $3,409 | $3,770 | $3,845 | $3,702 | $3,938 | $4,267 |
| 65 | $8,157 | $5,710 | $6,338 | $6,465 | $5,885 | $6,314 | $7,175 |
| 75 | $15,913 | $12,544 | $13,975 | $14,254 | $14,244 | $15,017 | $15,820 |
| Note: Similar benefit design as above. Benefits paid reduce lifetime maximum. | |||||||
| Premium Comparisons: All Cash vs. No Cash Component | ||||||
|---|---|---|---|---|---|---|
| Age | All Cash* | All Cash | No Cash | No Cash | No Cash | No Cash |
| 45 | $4,273 | $3,888 | $3,180 | $5,688 | $2,052 | $2,160 |
| 55 | $5,745 | $5,440 | $3,840 | $6,972 | $3,024 | $3,300 |
| 65 | $8,599 | $10,152 | $5,880 | $9,696 | $4,692 | $5,640 |
| 75 | $16,031 | $19,008 | $13,380 | $16,932 | $7,800 | $10,560 |
| Premium Comparisons: All Cash vs. No Cash Component -- by Percentage Difference in Premium All Cash / No Cash | |||||
|---|---|---|---|---|---|
| Age | All Cash* | No Cash | No Cash | No Cash | No Cash |
| 45 | $4,273 / $3,888 | 1.3 / 1.2 | 0.75 / 0.68 | 2.1 / 1.9 | 1.9 / 1.8 |
| 55 | $5,745 / $5,440 | 1.5 / 1.4 | 0.82 / 0.78 | 1.9 / 1.8 | 1.7 / 1.8 |
| 65 | $8,599 / $10,152 | 1.5 / 1.7 | 0.89 / 1.05 | 1.8 / 2.2 | 1.5 / 1.8 |
| 75 | $16,031 / $19,008 | 1.2 / 1.4 | 0.95 / 1.12 | 2.1 / 2.4 | 1.5 / 1.8 |
| Note: Same as table above but percents rather than pure premiums. | |||||
* NOTE: All plans were run, when possible, with monthly benefit maximums of $6000, 100% home care, 5 year benefit length, 5% automatic compound inflation, standard health rating, no discounts. Possible exceptions follow:
- One insurer offers a lifetime maximum of 5.5 years equivalent as closest option to the “standard plan” used.
- Another insurer offers only a daily, not a monthly maximum.
- The “ALL CASH” plan column one is for a lesser lifetime maximum -- $300,000 which equates to roughly 4.17 years; this was the closest approximation to a 5 year plan.
- The other “ALL CASH” plan is for a 5 year lifetime maximum.
Appendix K: Early Meetings with Stakeholders
Early Meetings with Stakeholders*
* - All meetings, unless otherwise noted, are general information on CLASS and were attended by Dr. Richard Frank, Deputy Assistant Secretary for Disability, Aging and Long-Term Care Policy in the Office of the Assistant Secretary for Planning and Evaluation (ASPE) at HHS and his staff.
- September 3, 2009 with Connie Garner of Senate HELP
- September 8, 2009 with staff from Social Security Administration including Angela Arnett and Thomas Parrott and Meena Seshamaniof the Office of Health Reform (OHR)
- September 14, 2009 with Ann Tumlinson of AvalereHealth
- September 21, 2009 with the Lewin Group
- September 22, 2009 with the Lewin Group
- November 3, 2009 call with Judy Feder of Georgetown University
- December 16, 2009 Meeting with Bob Glover of the National Association of State Medicaid Directors
- December 17, 2009 Meeting with Gretchen Alkema of the Scan Foundation and Judy Feder
- December 21, 2009 Meeting with Robyn Stone of AAHSA
- January 5, 2010 Meeting with Nancy Thaler and Chas Moseley from the National Association of State Directors of Developmental Disabilities Services
- March 9, 2010 Meeting with Stephen Goss of SSA
- March 23, 2010 Meeting with Stephen Goss of SSA
- April 7, 2010 Meeting with Univita Health
- April 14, 2010 Meeting with the Public Sector CEO Association Meeting including Bob Glover and Meighan Haupt
- April 21, 2010 Meeting with Connie Garner of Senate HELP and Bruce King
- April 22, 2010 Meeting on Regulations on the CLASS Act with Cori Uccello of the American Academy of Actuaries
- May 4, 2010 Meeting with Janet Forlini of NCOA
- May 12, 2010 Meeting with Lee Goldberg of SEIU
- May 13, 2010 Meeting with National Association of Insurance Commissioners
- May 14, 2010 Meeting on CLASS and Medicaid with OGC
- May 17, 2010 Meeting with Karl Polzer of the National Center for Assisted Living in AHCA
- June 3, 2010 Meeting with Larry Rubin, Eric Trowbridge and Laura Cox Kaplan of Pricewaterhouse Cooper
- June 15, 2010 Meeting with Rhonda Richards of AARP
- June 23, 2010 Meeting with Marc Cohen of LifePlans, Inc.
- June 25, 2010 Meeting on Cash Benefits under CLASS with Paul Van de Water with the Center on Budget and Policy Priorities
- June 25, 2010 Meeting with Kathy Greenlee (AoA) and Gretchen Alkemafrom SCAN Foundation
- June 30, 2010 Meeting with Jeremy Pincus of the Forbes Consulting Group
- June 30, 2010 Meeting with Pete Isberg with ADP (Automatic Data Processing Inc.)
- July 12, 2010 Meeting with Katie Maslow of the Alzheimer’s Association
- July 15, 2010 Meeting on Administrative Expenses under the CLASS Program with John Wilkin from the Actuarial Research Corporation (ARC)
- July 20, 2010 Meeting with Gretchen Alkema from SCAN Foundation
- July 22, 2010 Meeting on the CLASS Model with John Wilkin from ARC
- August 13, 2010 Meeting to discuss the CLASS model with John Wilkin, Gordon Trapnell, Eddie Armentrout and Mike Sandler of ARC
- August 19, 2010 Meeting with Jay Greenberg from NCOA
- August 20, 2010 Meeting with Jim Firman from NCOA
- August 24, 2010 Meeting with Bruce Chernoff and Gretchen Alkema from SCAN Foundation
- September 2, 2010 Meeting with David Dranove from Northwestern University
- September 14, 2010 Meeting with Brian Burwell (Thomson Reuters) and LinaWalker of AARP
- September 22, 2010 CLASS Act Models Meeting (See Appendix N for more detail)
- September 28, 2010 Meeting with Jeremy Pincus of the Forbes Consulting Group
- October 5, 2010 Meeting on CLASS Model with John Wilkin (ARC)
- October 8, 2010 Meeting with Avalere Health including Ann Tumlinson and Elana Stair
- October 22, 2010 Meeting with David Dranove of Northwestern University
- October 26, 2010 Meeting with Peter Arno from New York Medical College
- November 3, 2010 Meeting with ARC staff on CLASS Model
- November 9, 2010 Meeting with Gretchen Alkema from the SCAN Foundation
- November 9, 2010 Meeting with Marc Cohen from LifePlans, Inc.
- November 17, 2010 Meeting with AARP including Alyson Burns, Susan Lutz, Milagros Lunaria and Rhonda Richards
- November 18, 2010 Meeting with Allison Siegwarth from Bazelon Center for Mental Health Law
- November 18, 2010 Meeting with Avalere Health including Anne Tumlinson, Eric Hammelman, Ng Weiwen and Elana Stair
- November 19, 2010 Meeting with Connie Garner from Senate HELP
- November 22, 2010 Interview on Bloomberg News with Peggy Collins
- November 23, 2010 Meeting with David Dranove of Northwestern University
- November 29, 2010 Meeting with Pete Isberg from ADP
- November 30, 2010 Meeting with David Dranove, Cory Capps and Lenore Daffny from Northwestern University
- December 3, 2010 Meeting with Connie Garner and AdvanceCLASS board members
- December 9, 2010 Speech at LongTerm Care Discussion Group (AHIP)
- December 9, 2010 Meeting with SCAN Foundation
- December 10, 2010 Meeting with ARC Staff
- December 15, 2010 Meeting on Avalere Health CLASS Model with Avalere Health staff
- January 3, 2011 Meeting with ARC Staff
- January 3, 2011 Meeting with Richard Johnson of Urban Institute
- January 6, 2011 Participated in Webinar on Adults Ages 5064 and the ACA
- January 14, 2011 Meeting with Connie Garner and AdvanceCLASSboard
- January 21, 2011 Meeting with ARC Staff
- January 28, 2011 Meeting with ARC Staff
- January 31, 2011 Meeting with Judy Feder
- February 3, 2011 Meeting with Connie Garner
- February 3, 2011 CLASS Briefing for Hill Staff (Rayburn 2122)
- February 4, 2011 CLASS Briefing for Hill Staff (Dirksen 211)
- February 8, 2011 Meeting with Avalere Health staff
- February 8, 2011 Meeting with Gretchen Alkema from SCAN Foundation
- February 10, 2011 CLASS models’ Actuarial Meeting with AvalereHealth and ARC staff
- February 16, 2011 Meeting with SCAN Foundation
- February 17, 2011 Interview with Robert Pear of the New York Times
- February 18, 2011 CLASS Briefing for Senator Durbin’s staff (Hart 711)
- February 23, 2011 Meeting with SCAN Foundation
- March 4, 2011 CLASS Briefing for Senator Thune and Congressman Boustany’s staff (Russell 493)
Appendix L: In-Depth Description of ARC Model
ACTUARIAL RESEARCH CORPORATION’S LONG-TERM CARE PREMIUM MODEL
By
John C. Wilkin, F.S.A.
Michael Sandler
Eddie Armentrout
Ken Thierer
June 13, 2011
Actuarial Research Corporation
I. Introduction
The ARC Long-Term Care Model is designed to calculate long-term care insurance premiums and project cash flow to assist policymakers in their efforts to design a government-sponsored program. It can model various benefit structures under user-selected assumptions on participation, utilization, mortality, interest, lapse, and expense loading. Input and output are in Microsoft Excel Worksheets with program calculations performed in Visual Basic for Applications (VBA). The computer code underlying these calculations is clearly written and organized and may be viewed by any user by simply opening Excel’s Visual Basic Editor.
ARC’s model is specifically designed to examine the implementation of the long-term care program described in the Patient Protection and Affordable Care Act (ACA), passed by Congress in March 2010. Title VIII of this act contains a program know as the Community Living Assistance Services and Supports (CLASS) Act. This provision of the bill would establish a government-operated long-term care insurance program.
II. Summary of the CLASS Act
The CLASS Act establishes a national voluntary insurance program for purchasing community living assistance services and support, with the aim of helping individuals with functional limitations to achieve personal and financial independence while alleviating burdens on family caregivers.
Employed individuals who are at least age 18 may be eligible to participate in the CLASS program, generally through their employer. There is no underwriting and premiums vary only by age. A five-year vesting period is required to receive benefits, and an individual must have earned at least enough income to be credited with a quarter of coverage under Social Security rules ($1,120 for both 2010 and 2011)1 for three out of the five vesting years. At the time of enrollment, individuals must also not be in jail or a patient in a hospital, nursing facility, or similar institution.
Under the CLASS program, a cash benefit that averages a minimum of $50/day will be paid to eligible beneficiaries that meet vesting requirements, with no lifetime limit. The cash benefit is paid daily or weekly into a beneficiary’s Life Independence Account and may be used to buy nonmedical services and supports needed to maintain independence at home, including: home modifications, assistive technology, accessible transportation, personal assistance services, home care aides, and nursing support. Services may be provided by a family member.
Benefits are expected to be scaled from 2 to 6 levels based on the beneficiary’s level of functioning, and payments are triggered by a minimum level of functional impairment. Functional impairment will be defined by the inability to perform 2 or 3 activities of daily living (ADLs) without substantial assistance; or by substantial cognitive impairment requiring supervision for the individual’s health and safety; or by other similar conditions as determined by regulation. There are six ADLs that are defined: eating, toileting, transferring, bathing, dressing, and continence. Functional limitations must be expected to last for a continuous period of more than 90 days and must be certified by a licensed health care professional. There is presumptive eligibility for active enrollees that are discharged from certain institutions that provide long-term care.
Benefits are intended to supplement rather than supplant other health care benefits, and program participation does not affect eligibility for other governmental benefits. For those institutionalized beneficiaries who are enrolled in Medicaid, however, only 5 percent of the cash benefit goes to the enrollee and 95 percent goes toward the facility cost of care. This has the effect of reducing Medicaid expenditures. For Medicaid beneficiaries receiving Home and Community-Based Services (HCBS) or in Programs of All-Inclusive Care for the Elderly (PACE), the split is 50-50 between the enrollee and the Medicaid program. In all cases, Medicaid provides secondary coverage for the remainder of costs incurred.
The CLASS Act requires the Secretary to develop at least three actuarially sound benefit plans, with premiums established so as to assure solvency over a 75-year period. The program establishes a nominal premium of $5, indexed to the CPI, for individuals with income below the poverty line and for full-time students under age 22 who are actively employed. The premium is to be loaded by no more than 3 percent to cover administrative expenses.
The monthly premiums determined for an individual at the time of enrollment in the CLASS program may remain the same for as long as the individual is an active enrollee except that they may increase (1) to keep the program solvent or (2) for an individual who has a 3-month or more lapse in payment of premiums. In the case of a lapsing policyholder, the amount of the premium adjustment would depend on the timeframe before reenrollment. If the individual reenrolls within 5 years of the beginning of the lapse, his premium will be age-adjusted as if for an initial enrollment, but the individual would receive credit for prior months of paid premiums. If the individual reenrolls after 5 years from the start of the lapse, the individual does not receive credit for prior months of premiums paid, and is subject to a penalty on top of a new issue-age premium, with the penalty being the greater of 1 percent of the issue-age premium for each lapsed month, or an amount the Secretary determines to be actuarially sound. Full-time students paying the nominal premium will also be subject to a new age-adjusted premium upon ceasing full-time student status.
Although premiums are intended to remain the same for an individual with continuous enrollment, the Secretary may adjust premiums for enrollees if the 20-year projection of premium and benefit outlays indicates an imbalance that threatens program solvency. Exempt from such increases would be active enrollees who meet all three of the following criterion: (1) are age 65 or older, (2) have paid premiums for at least 20 years, and (3) are not actively employed. Any unpaid benefits as a result of death or failure of a beneficiary to elect to receive benefits before the end of a 12-month period (benefits cannot be rolled over from year to year) revert back to the CLASS Independence Fund.
The CLASS Independence Fund may be held only for: (1) investment, (2) to pay administrative expenses, and (3) to pay cash benefits. No taxpayer funds are to be used to pay benefits, although the law is silent on whether taxpayer funds may be used to pay administrative expenses. Similar to Social Security and Medicare, the CLASS Independence Fund will have a Trust Fund, a Board of Trustees, a Trustee’s Report (with 75-year projections), actuarial opinion provided by the CMS Chief Actuary, and an Advisory Council. If the program is determined to be not sound, premiums may be increased and/or new enrollment may be stopped, or legislative action may be recommended.
III. Data Sources
This section describes the data sources used to create input for the ARC CLASS Program Model. The main data sources include the 2011 OASDI Trustees Report, the Current Population Survey (CPS), the National Health Interview Survey (NHIS), the National Long Term Care Survey (NLTCS), and the National Nursing Home Survey (NNHS).
Trustees Report
The annual Trustees Report presents the current and financial status of the Federal Old-Age and Survivors Insurance and Federal Disability Insurance Trust Funds. The report is put out by the Social Security Administration’s Office of the Chief Actuary.2 Supplemental tables for single years are provided and used as the source for:
- Unemployment rate and labor force participation rate projections by age group, sex, and year
- U.S. population projections by age, sex, and year
- Mortality assumptions projected by age, sex, and year
Labor force data are critical to the calculation of program cash flow. The labor force participation rates and unemployment rates are used to calculate the number of workers that may participate in the program, pay premiums into the system, and ultimately will be eligible for benefits. The default labor force participation and unemployment rates vary by age, sex, and year.
Current Population Survey
The CPS is a monthly survey of households providing data on the labor force, employment, unemployment, hours worked, earnings, and other demographic and labor force characteristics. The CPS is collected each month from a probability sample of approximately 60,000 households through personal and telephone interviews and is designed to be representative of the civilian noninstitutionalpopulation of the US. It is conducted by the Bureau of the Census for the Bureau of Labor Statistics.3 The March 2009 CPS is used in the model for the annual income interval distribution by sex and age group. Below is a table that shows the income distribution of workers for all ages.
| 2009 CPS Income Distribution | |||||
|---|---|---|---|---|---|
| Yearly Income Interval | % Workers Below High End Threshold |
CPS Population Weight (000) | |||
| Low End | High End | Total | Males | Females | |
| $1.00 | $1,000 | 2% | 3,939 | 1,656 | 2,284 |
| $1,000.01 | $2,000 | 5% | 3,371 | 1,371 | 2,000 |
| $2,000.01 | $3,000 | 7% | 3,004 | 1,248 | 1,756 |
| $3,000.01 | $4,000 | 8% | 2,652 | 1,130 | 1,522 |
| $4,000.01 | $5,000 | 10% | 3,194 | 1,424 | 1,770 |
| $5,000.01 | $6,000 | 12% | 2,394 | 1,016 | 1,377 |
| $6,000.01 | $7,000 | 13% | 2,017 | 788 | 1,229 |
| $7,000.01 | $8,000 | 15% | 2,673 | 1,159 | 1,514 |
| $8,000.01 | $9,000 | 16% | 1,769 | 744 | 1,025 |
| $9,000.01 | $10,000 | 18% | 3,819 | 1,747 | 2,071 |
| $10,000.01 | $11,000 | 19% | 1,629 | 620 | 1,009 |
| $11,000.01 | $12,000 | 21% | 3,187 | 1,342 | 1,845 |
| $12,000.01 | $15,000 | 26% | 7,825 | 3,396 | 4,429 |
| Total Workers | 100% | 158,162 | |||
The income distribution is used in the model to estimate the population that is eligible to participate in the CLASS program, which requires an individual to earn in one year more than the amount needed to earn one quarter of coverage under the Social Security program. This amount is $1,120 in both 2010 and 2011, but it was $1,090 in 2009, the year of the CPS used in the model. The model uses the distribution of workers by income to estimate the number of eligiblescorresponding to the income requirement selected by the user. The level of the premium depends on the total number of eligiblescompared to the number of eligibles that could immediately qualify for benefits. The cash flow projections also depend on the number of individuals who participate in the program. When the user selects a subsidy for the premiums for low-income individuals, the model calculates the number of individuals receiving the subsidy as the number of workers whose income is above the income requirement and below the poverty line.
National Nursing Home Survey
The NNHS is a nationwide sample survey of nursing homes, residents, discharges, and staff. Nursing homes included in the survey are freestanding or nursing care units of hospitals, retirement centers, or other similar entities, with at least three beds. They must be Medicare or Medicaid certified or state licensed to operate as a nursing home. The survey is conducted by the National Center for Health Statistics, part of the Centers for Disease Control and Prevention. Estimates from the 1999 survey are based on roughly 1,400 responding facilities out of approximately 18,000 nursing homes in the United States.4 The 2004 survey uses 1,174 responding facilities. Prevalence rates and Admission rates are graduated by age using the Whittaker-Henderson graduation algorithm, which maximizes a function that measures both “fit” and “smoothness.” The fit is measured by the sum of the squares of the difference between the graduated prevalence rates and the original prevalence rates and the “smoothness” is measured by the sum of the second differences of the graduation rates by age. The model uses NNHS Survey resident and discharge data by age and sex from the 1985 and 2004 surveys and is the source for:
- Nursing Home Incidence Rates
- Nursing Home Prevalence Rates,
- Average Lengths of Stay, and
- Distributions of lengths of nursing home stays (i.e., continuance tables)
The 1985 survey is used as base information for incidence rates and average length of stay because it analyzed nursing home behavior in more detail than the 1999 or 2004 surveys. There is a difference in how nursing home admissions and lengths of stay are defined in the surveys and how they are used for purposes of insurance. The surveys count every admission to a nursing home, while insurance would concatenate multiple stays into one benefit period whenever there is a transfer between nursing homes or a stay that is briefly interrupted by a hospital stay. The 1985 survey had information that made it possible to concatenate stays, while the more recent surveys do not contain the information to make this possible. In general, it is more difficult to determine accurately admission rates and lengths of stays than it is to determine the number of nursing home residences at a point in time. The ratio of the number of admissions to the population is referred to as the admission rate, while the ratio of the number of residents to the population is referred to as the prevalence rate. There is a loose relationship between prevalence rates (PR), admission rates (AR), and average lengths of stay (ALOS) such that the following equation is approximately true:
PR = AR * ALOS
All of the NNHSs provide relatively accurate counts of the resident population and therefore of prevalence rates. We used the ratio of the prevalence rates obtained from the 2004 survey to those obtained from the 1985 survey to project the admission rates from the 1985 survey up to 2004. We did not project the average lengths of stay.
| 1985 NNHS Utilization Rates and Average Length of Stay by Age and Sex | ||||||
|---|---|---|---|---|---|---|
| Age | Prevalence Rate | Admission Rate | Average Length of Stay | |||
| Male | Female | Male | Female | Male | Female | |
| 20 | 0.01% | 0.01% | 0.05% | 0.02% | 947 | 898 |
| 30 | 0.05% | 0.03% | 0.05% | 0.02% | 947 | 898 |
| 40 | 0.07% | 0.07% | 0.06% | 0.02% | 880 | 956 |
| 50 | 0.18% | 0.14% | 0.17% | 0.07% | 791 | 1,066 |
| 60 | 0.39% | 0.44% | 0.28% | 0.20% | 767 | 975 |
| 70 | 1.17% | 1.34% | 0.85% | 1.15% | 535 | 697 |
| 80 | 4.76% | 7.26% | 4.39% | 5.16% | 370 | 630 |
| 90 | 16.24% | 25.65% | 14.38% | 15.52% | 369 | 556 |
| 100 | 37.41% | 46.66% | 40.04% | 24.27% | 300 | 503 |
| 2004 NNHS Prevalence, Ratio of 2004 to 1985 and Calculated 2004 Incidence | ||||||
|---|---|---|---|---|---|---|
| Age | 2004 Prevalence Rate | Ratio of Prevalence 2004 to 1985 |
Calculated 2004 Incidence |
|||
| Male | Female | Male | Female | Male | Female | |
| 20 | 0.01% | 0.01% | 0.05% | 0.02% | 947 | 898 |
| 30 | 0.05% | 0.03% | 0.05% | 0.02% | 947 | 898 |
| 40 | 0.07% | 0.07% | 0.06% | 0.02% | 880 | 956 |
| 50 | 0.18% | 0.14% | 0.17% | 0.07% | 791 | 1,066 |
| 60 | 0.39% | 0.44% | 0.28% | 0.20% | 767 | 975 |
| 70 | 1.17% | 1.34% | 0.85% | 1.15% | 535 | 697 |
| 80 | 4.76% | 7.26% | 4.39% | 5.16% | 370 | 630 |
| 90 | 16.24% | 25.65% | 14.38% | 15.52% | 369 | 556 |
| 100 | 37.41% | 46.66% | 40.04% | 24.27% | 300 | 503 |
National Long-Term Care Survey
The NLTCS is a nationally representative longitudinal survey of Medicare beneficiaries designed to study changes in health and functional status of Americans age 65 and over, in both community and institutional settings. The NLTCS defines an institutional setting as one having a full-time medical professional (doctor, nurse, physician assistant, or psychiatrist) on its staff. Data from this survey exist for years 1982, 1984, 1989, 1994, 1999, and 2004. The survey population consists of roughly 36,000 people originally drawn from Medicare enrollment files in 1982 with new people entering each successive survey. With each survey about 5,000 people passing age 65 between each wave are added to replace those that have died. In this way, the NLTCS represents all Medicare beneficiaries age 65 and over both institutionalized and noninstitutionalized(although it excludes individuals in correction facilities). The NLTCS has many components, including disability measures, cognitive test results, medical conditions, education levels, and income. It tracks health expenditures, Medicare service use, and the availability of personal, family, and community resource caregiving. The survey was administered by the U.S. Census Bureau and Duke University.5
Longitudinal data from 1984 to 1989 are used to identify incidence rates according to the methods of Eric Stallard and Robert Yee as presented in their paper Noninsured Home and Community-Based Long-Term Care Incidence and Continuance Tables6 (2000). Data from the 1984 through 2004 NLTC surveys are used to identify prevalence rates of frailty to both community and institutional respondents. These results are graduated using the Whittaker-Henderson formula according to both respondent age and data year. The rates of change for the prevalence rates are used to trend the incidence rates calculated by Stallard and Yee through 2004 by age, sex, and ADL level.
The NLTCS asks each respondent if he has trouble with each of six ADLs, and follows up by asking if he gets help from a person. Those getting help from a person are counted as needing assistance with that ADL. Continence is also assessed by the NLTCS, but separately with the general medical questions. Cognitive impairment is calculated by a mini-mental status exam in each survey except for the 1999 survey, where it is calculated by a more detailed SPMSQ test, which we have calibrated to the mini-mental exams in the other years. The mini-mental status exam has ten simple questions, and answering three or more of those questions incorrectly identifies the respondent as cognitively impaired. Persons interviewed through a proxy are marked as cognitively impaired if they are reported to have Alzheimer’s, dementia, or senility. The community survey for this group is used to obtain the trends in frailty prevalence among those 65 and older. This is used to adjust the Stallard and Yee incidence rates to a more current year.
| Prevalence Rates of Frail Persons Aged 65 and Over Receiving Home Care | ||||||
|---|---|---|---|---|---|---|
| Age/Sex Adjusted Frailty Rates |
1984 | 1989 | 1994 | 1999 | 2004 | Prevalence Rate Increase |
| 1 or more ADLs | 8.62% | 9.25% | 9.77% | 10.23% | 10.72% | 0.1052% |
| 2 or more ADLs | 4.42% | 4.94% | 5.44% | 5.95% | 6.52% | 0.1052% |
| 3 or more ADLs | 3.09% | 3.59% | 4.09% | 4.66% | 5.33% | 0.1117% |
The model calculates 2004 home care incidence rates using the 1984-1989 Stallard/Yee incidence rates and ratio of home care prevalence in 1989 and 2004 from the National Long Term Care Survey (NLTCS). The 2004 incidence rates are projected to be the 1984-1989 incidence rates multiplied by the ratio of 2004 prevalence to 1989 prevalence. The model does not project average lengths of stay.
| 1984-1989 Stallard/Yee Utilization Rates and Average Length of Stay by Age and Sex | ||||
|---|---|---|---|---|
| Age | Admission Rate | Average Length of Stay | ||
| Male | Female | Male | Female | |
| 70 | 2.01% | 1.69% | 1,259 | 1,246 |
| 80 | 4.06% | 5.12% | 1,306 | 1,169 |
| 90 | 8.22% | 12.29% | 896 | 934 |
| 100 | 10.19% | 13.62% | 896 | 934 |
| NLTCS Prevalence, Ratio of 2004 to 1989 and Calculated 2004 Incidence | ||||||||
|---|---|---|---|---|---|---|---|---|
| Age | 1989 Prevalence Rate | 2004 Prevalence Rate | Ratio of Prevalence 2004 to 1989 | Calculated 2004 Incidence | ||||
| Male | Female | Male | Female | Male | Female | Male | Female | |
| 70 | 2.56% | 2.89% | 3.01% | 3.31% | 1.17 | 1.15 | 2.35% | 1.93% |
| 80 | 6.12% | 6.56% | 7.85% | 8.79% | 1.28 | 1.34 | 5.21% | 6.85% |
| 90 | 11.83% | 13.78% | 17.56% | 20.84% | 1.48 | 1.51 | 12.21% | 18.59% |
| 100 | 17.95% | 18.75% | 26.00% | 33.55% | 1.45 | 1.79 | 14.76% | 24.37% |
| Note: All values in both tables assume 2+ ADL threshold. Analogous calculations are performed if there is a different ADL requirement. | ||||||||
National Health Interview Survey
The NHIS is a cross-sectional household interview survey begun in 1957 and conducted annually. It provides data on a broad range of health-related topics for the civilian noninstitutionalized population of the U.S. The NHIS has an expected sample size of approximately 35,000 households each year, and provides information on the amount, distribution, and effects of illness and disability and the services rendered for or because of such conditions. The data include numerous demographic and socioeconomic characteristics. In particular, this study focuses on age, gender, earnings level, cognitive impairments, and ADL limitations that are used to determine eligibility rates for the CLASS model. The survey is conducted by the National Center for Health Statistics.7
In the survey, respondents are asked several times if they have some kind of limitation in their daily life. They are asked separately if they are limited in the work they can do, or if they are limited in daily living, or if they are limited in any way. Those who report some kind of limitation are then asked about specific limitations.
We have set up our CLASS model so that the user can select from among utilization rates based on several possible interpretations of cognitive impairments. Senility (which includes Alzheimer’s and dementia and is denoted by the letter “S” in the model) is always included as a cognitive impairment. A second interpretation also includes mental retardation and developmental disabilities (denoted by “SRD” in the model). The third category also includes ADD, Schizophrenia, bipolar disorder, and other mental disabilities, which are all kept together because they are represented by the same variable in the survey. When all mental impairments are included, the model refers to this option as the “SRDA” option. The survey asks everyone if they have difficulty performing ADLs, including: eating, dressing, transferring, bathing, and using the toilet. However, the survey does not ask about continence as an ADL or in any other fashion.
The 2007-2009 NHIS was the source in the model for frailty prevalence rates for the under 65 population by age and sex. Frailty rates are calculated separately for all three interpretations of cognitive impairment and for one, two, and three ADLs aggregating data from the three years. In addition, frailty rates are calculated for individuals at several income levels. These rates are independently graduated using the Whittaker-Henderson formula by respondent age. Users can select the utilization rates used in the model calculation from among the three interpretations of cognitive impairment and 1+, 2+, or 3+ ADLs. The choice of the interpretation of cognitive impairment has a significant impact on the results because including ADD, Schizophrenia, Mental Retardation, and developmental disabilities more than doubles the frailty rate. Changing between 2 and 3 ADLs has a much smaller effect on the initial frailty rate among those who work, but has a significant impact on frailty for the population as a whole.
| Frailty Prevalence Rate and Population (000) based on 2007-09 NHIS Data among Ages 18-65 | |||||||
|---|---|---|---|---|---|---|---|
| All Cognitive | Without ADD | Senility Only | |||||
| 2 or More ADLs |
3 or More ADLs |
2 or More ADLs |
3 or More ADLs |
2 or More ADLs |
3 or More ADLs |
||
| Whole Population | Number Frail | 2,651 | 2,005 | 1,865 | 1,589 | 1,155 | 830 |
| Prevalence Rate | 1.39% | 1.05% | 0.98% | 0.83% | 0.60% | 0.43% | |
| Income Earners Only | Number Frail | 623 | 571 | 480 | 428 | 234 | 176 |
| Prevalence Rate | 0.35% | 0.33% | 0.27% | 0.24% | 0.13% | 0.10% | |
| $10,000 or More in Earned Income | Number Frail | 412 | 374 | 315 | 277 | 173 | 99 |
| Prevalence Rate | 0.30% | 0.27% | 0.23% | 0.20% | 0.12% | 0.07% | |
| $15,000 or More in Earned Income | Number Frail | 314 | 308 | 262 | 229 | 148 | 112 |
| Prevalence Rate | 0.24% | 0.24% | 0.20% | 0.18% | 0.11% | 0.09% | |
The following table shows how the incidence rates used in the ARC Model for 2+ ADLs and the senility plus developmental disabilities (SRD) interpretation of mental impairment compare with the intercompany study from the Society of Actuaries (SOA).
| Comparison of Model Incidence Rates to Intercompany Study | |||
|---|---|---|---|
| Age | ARC Male Incidence Rate |
ARC Female Incidence Rate |
SOA (Both Genders) with no elimination period |
| 45 | 0.22% | 0.09% | 0.13% |
| 55 | 0.28% | 0.19% | 0.14% |
| 62 | 0.44% | 0.53% | 0.23% |
| 67 | 2.06% | 2.34% | 0.47% |
| 72 | 3.99% | 4.03% | 1.18% |
| 77 | 6.89% | 8.19% | 2.81% |
| 82 | 12.41% | 14.35% | 5.61% |
| 87 | 20.16% | 23.63% | 9.62% |
In addition, we take NHIS data from every year from 1997 to 2009 to identify how frailty prevalence rates have changed over time according to age and gender (but not earnings level). Rates are calculated according to the same method and attributes as for the prevalence rates calculated from 2009. These prevalence rates over time are graduated using the Whittaker-Henderson formula by data year and respondent age. The average rate of growth over the 1997-2009 timespan is summarized in the table below.
| Frailty Growth Rate Adjusted for Age and Sex | |||
|---|---|---|---|
| 1997 | 2009 | Average Annual Rate of Growth |
|
| 1 or More ADL, SRDA | 0.24% | 0.61% | 0.031% |
| 2 or More ADL, SRDA | 0.18% | 0.53% | 0.029% |
| 3 or More ADL, SRDA | 0.12% | 0.48% | 0.030% |
| 1 or More ADL, SRD | 0.23% | 0.49% | 0.022% |
| 2 or More ADL, SRD | 0.17% | 0.41% | 0.021% |
| 3 or More ADL, SRD | 0.10% | 0.35% | 0.021% |
| 1 or More ADL, S | 0.27% | 0.38% | 0.010% |
| 2 or More ADL, S | 0.20% | 0.29% | 0.007% |
| 3 or More ADL, S | 0.13% | 0.20% | 0.006% |
The increase in frailty rates over time has mostly occurred because of cognitive factors, and the more restrictive the cognitive assumption, the less reported growth there is. For the most generous interpretation of cognitive impairment, frailty grows among all age groups, where if only senility is included, then frailty increases only among older people.
| Frailty Rates by Age, Sex, with 2 or More ADL, SRDA | Frailty Rates by Age, Sex, with 2 or More ADL, Senility Only | ||||||
|---|---|---|---|---|---|---|---|
| Age | 1997 | 2009 | Average Annual Rate of Growth |
Age | 1997 | 2009 | Average Annual Rate of Growth |
| 25 | 0.11% | 0.47% | 0.030% | 25 | 0.09% | 0.09% | 0.000% |
| 35 | 0.14% | 0.48% | 0.028% | 35 | 0.11% | 0.09% | -0.001% |
| 45 | 0.20% | 0.55% | 0.029% | 45 | 0.17% | 0.22% | 0.004% |
| 55 | 0.24% | 0.58% | 0.028% | 55 | 0.24% | 0.38% | 0.012% |
| 65 | 0.48% | 0.66% | 0.015% | 65 | 0.48% | 0.53% | 0.004% |
IV. Arc Model Description
This technical description of the ARC Long-Term Care Model will explain the inputs and assumptions necessary to run the model, describe the formulas used by the model, and explain the outputs and results returned by the model.
A. Control Panel
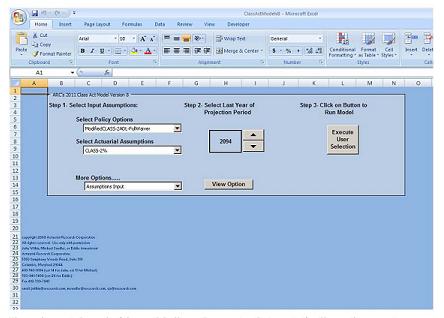
The main control panel of the model allows the user to select a set of policy options, a set of actuarial assumptions and the duration of the projection. Once these parameters are selected, the user can run the model by pressing the “Execute User Selection” button.
B. Inputs
Before the model can be used, there are a variety of input parameters that must be selected to create a scenario. These inputs include policy options and actuarial assumptions that influence the results of the model. A given set of policy options and a given set of actuarial assumptions can be saved and retrieved so that runs can be replicated easily and accurately.
In this section, the input parameters will be described along with the sensitivity of the premium level to choices in the parameters. In order to do this, we have chosen (somewhat arbitrarily) a set of parameters as a baseline. The baseline estimate will be a modified version of the CLASS Act with the following choice of input parameters (which will be discussed below):
- 5 years vesting and work requirement
- $12,000 income requirement for 5 years (no low income premium)
- Benefit trigger of 2+ ADLs or cognitive impairment of senility, mental retardation, or developmental disability (SRD)
- $50 daily benefit (nursing home and home care)
- No deductible or lifetime maximum
- Benefits and premiums increase at 2.8% per year, except for those who are aged 65+ and of policy duration 20+
- Full waiver of premium while on claim.
- Participation of 2%
- Administrative expense factor of 3% of premium
1. Policy Options
The policy options are inputs related to the law, regulations, and specifications that would be present under a government-run long-term care program. These assumptions allow the user to define coverage regulations, benefit eligibility requirements, descriptions of the program benefits, and premium expense factors. Coverage regulations include the timeframe during which policies are issued, the number of years of required employment after enrollment, and the number of years required for vesting of the policy. Benefit eligibility requirements (sometimes referred to as “benefit triggers”) include criteria based on cognitive ability and the ability to perform activities of daily living (ADLs), which are used as benchmarks to determine whether a policyholder is eligible to start drawing long-term care benefits. The model allows for the user to change the number of ADLs necessary to trigger the benefit and the definition of cognitive impairment that will qualify a beneficiary for benefits. The user can also define the average daily benefit, deductible, lifetime maximum, and level of inflation protection. The user can enter other policy parameters to model variations of the standard CLASS benefits. These variations include various forms of a return of premium provision and daily benefits that start low and increase substantially.
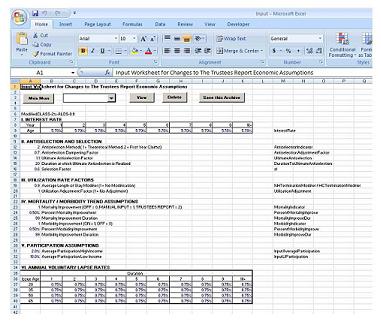
Scenario
The first section of the policy input worksheet is a place to name the scenario. This name will appear at the top of each output table.
Coverage (including vesting)
The second section of user inputs describes the conditions under which an individual may participate in the program. Coverage includes the years during which the model assumes new policies will be issued, the ages at which new policies will be issued, and the income required for participation.
First Year of Premiums and Last Year of Issue
It is currently assumed that the first year of premiums will be 2012, which is also the first year of issue. The model will calculate the premiums for this cohort of participants to fully finance their expected benefits. If the user chooses to set the last year of issue also equal to 2012, then the cash flow output from the model will show the cash flow for just this one cohort. If the user elects to set the last year of issue equal to 2094 (the last year of projection), then the model will show the cash flow under conditions of continuous enrollment.
Years Vesting Requirement and Years Required at Income Level
The user may specify any number of years of vesting. No benefits are paid during the vesting period. Under the theoretical antiselection formula, the effect of antiselection decreases each year from issue, regardless of whether benefits are payable. Thus, the vesting period reduces benefits not only for the years of no benefit payments but also because of the waning effects of antiselection during the vesting period. Under the additional first-year claims antiselectionmethod, all antiselecting enrollments survive the vesting period and become beneficiaries.
The user may also set the number of years of work required for vesting. The model assumes that the frailty rates of the working population apply during the years of required work, but that the rates will transition to the total population rates over the 10-year period after the required work period. This 10-year period is known as the “select” period. Decreasing the Years Vesting Requirement increases premiums because antiselection will have a greater effect closer to the purchase of a policy. As the duration from the purchase of a policy increase, antiselection decreases. The following table shows that premiums decrease by about 16% by increasing the vesting period from 5 years to 7 years.
| Years Vesting Requirement, 7 years vs 5 years in baseline | |
|---|---|
| Issue Age | % change in premium |
| 35 | -18% |
| 40 | -17% |
| 45 | -16% |
| 50 | -15% |
| 55 | -14% |
| 60 | -17% |
| 65 | -18% |
| Average | -16% |
Years required at income level allows the user to change the number of years during the vesting period that a policyholder must earn the minimum required income in order to be eligible to participate in the CLASS program. Decreasing this value increases premiums, because it shortens the select period. The example below changes this parameter from the baseline value of 5 to the 3 (which is the number of years required in the CLASS Act), resulting in a 3% increase in average premiums. The model calculates this effect by decreasing the select effect of the work requirement by two years.
| Years Required at Income Level, 3 vs 5 baseline | |
|---|---|
| Issue Age | % change in premium |
| 35 | +0% |
| 40 | +0% |
| 45 | +0% |
| 50 | +1% |
| 55 | +3% |
| 60 | +5% |
| 65 | +3% |
| Average | +3% |
Income Threshold for Program Eligibility and Subsidized Premium
This input variable allows the minimum income required to be eligible for the program to be changed by the user. Decreasing the income threshold below the poverty line ($10,830) increases premiums because policyholders below the poverty line are charged a lower premium and their benefits must be subsidized by the premiums of policyholders who earn an income above the poverty line. Above the poverty line, changes in the income threshold for eligibility have a very small effect on the level of premiums. This small effect, however, is the result of the use by the model of different sets of incidence rates that vary by income level. These rates (which are tabulated from the NHIS) vary for those under 65 and in home care, not for the over 65 or for those in nursing homes. In the coverage section, the user also specifies whether a subsidized premium for low-income individuals exists and the income requirement for this subsidized premium. Dropping the income requirement from $12K to $1,090 increases premiums by about 86%.
| Income Threshold for Eligibility, $1,090 vs $12K | |
|---|---|
| Issue Age | Sensitivity Value = $1,090 |
| 35 | +93% |
| 40 | +90% |
| 45 | +89% |
| 50 | +87% |
| 55 | +86% |
| 60 | +85% |
| 65 | +85% |
| Average | +86% |
Benefit Options
The third section of user input is to specify the benefits that will be paid under the CLASS program. Several long-term care benefit options are included and may be run in any combination:
- Number of ADLs to trigger benefits
- Separate trigger for cognitive impairment
- Definition of what is included as a cognitive impairment
- Daily benefit (may be specified as any dollar amount separately for nursing home or home care)
- Return of Premium options
- Low initial daily benefit with rapid increases
- Deductible in calendar days
- Lifetime maximum in service days
- Level of inflation protection
- Percent of days on which services are received
- Waiver of premium options
- Indexation of premiums
- Maximum age of a beneficiary for which premiums can be increased
- Maximum duration of time that a beneficiary’s premiums can be increased
- Low Income Premium
Benefit Eligibility Requirement (Benefit Trigger): Number of ADLs and Definition of Cognitive Impairment
The number of ADLs that a person needs in order to be eligible to draw benefits can be changed by the user. A higher requirement for the number or ADLs necessary to draw benefits will lower premiums because it makes the requirements for benefit eligibility stricter. The model has stored utilization rates by ADL from both the NHIS (for the under 65) and the NLTCS (for the over 65). The model always uses all NH admissions regardless of the benefit eligibility requirement. The model assumes that 25% of those with one ADL less than the benefit trigger requirement will also receive benefits. By going from a 2-ADL requirement to a 3-ADL requirement, the average premium decreases by about 13%.
| ADLs Needed to Qualify for Benefits | |
|---|---|
| Issue Age | Sensitivity Value of going from 2 ADLs to 3 ADLs |
| 35 | -10% |
| 40 | -13% |
| 45 | -14% |
| 50 | -13% |
| 55 | -13% |
| 60 | -13% |
| 65 | -12% |
| Average | -13% |
The definition of cognitive impairment can be changed by the user in order to change the utilization rates for the under 65 population. The definitions available for modeling are to define cognitive impairment as:
- Senility (denoted by S and including Alzheimer’s and dementia)
- Senility, Retardation, and Developmental Disabilities (SRD)
- Senility, Retardation, and Developmental Disabilities, “ADD, Bipolar, Schizophrenia, etc.” (SRDA)
By changing the definition of cognitive impairment to include more conditions, premiums will increase. The table below shows that excluding mental retardation and developmental disabilities from the baseline option decreases premiums by about 4%, but by a much greater amount for the younger ages. On the reverse side, including ADD, bipolar, and schizophrenia to the baseline option increase premiums by about 3%, but by much more at younger ages.
| Definition of Cognitive Impairment | ||
|---|---|---|
| Issue Age | Sensitivity Value = S (excludes mental retardation and developmental disabilities from the baseline) |
Sensitivity Value = SRDA (includes ADD, bipolar, and schizophrenia to baseline) |
| 35 | -20% | +10% |
| 40 | -13% | +7% |
| 45 | -7% | +6% |
| 50 | -3% | +4% |
| 55 | -2% | +1% |
| 60 | -0% | +0% |
| 65 | -0% | +0% |
| Average | -4% | +3% |
Maximum Daily Benefit (separately for nursing home and home care)
The maximum daily benefit can be set to any amount specified by the user. As the daily benefit is increased for both nursing home and home care, premiums increase proportionately. The benefit can be changed for Nursing Home and Home Care independently. In this example, the Nursing Home and Home Care benefit were $50 increased by 2.8% per year in the baseline run. Decreasing the Home Care benefit has a greater downward effect on premiums because more beneficiaries receive home care benefits than nursing home benefits.
| Maximum Daily Benefit | ||
|---|---|---|
| Issue Age | Sensitivity Value: NH=50, HC=25 |
Sensitivity Value: NH=25, HC=50 |
| 35 | -43% | -8% |
| 40 | -43% | -9% |
| 45 | -42% | -10% |
| 50 | -41% | -11% |
| 55 | -41% | -12% |
| 60 | -41% | -12% |
| 65 | -40% | -12% |
| Average | -41% | -11% |
Return of Premium Options
The model can calculate premiums for two forms of a return of premium benefit. The first form is a periodic cash benefit paid to policyholders who have not filed a claim during a predetermined period of time. The user may enter the time period between cash benefit payments as well as the cash benefit amount expressed as a percentage of premiums paid during the specified time period. For example, the user may select a 10-year periodic return of 10% of premiums (essentially returning one year’s premium for every 10 years paid). Under this option, every tenth year that a policyholder has not made a claim, he will be paid 10% of the premiums that he has paid during that 10-year period. This benefit has the effect of increasing premiums because it increases the benefits paid to policyholders.
| Periodic Return of Premium Benefit | |
|---|---|
| Issue Age | Sensitivity Value = Benefit, 10% of premium every 10 Years with no claim |
| 35 | +7% |
| 40 | +7% |
| 45 | +7% |
| 50 | +6% |
| 55 | +6% |
| 60 | +5% |
| 65 | +5% |
| Average | +6% |
The other form of a return of premium benefit is the payment of a death benefit, expressed as a percentage of premiums paid. The death benefit is an amount paid to the beneficiary of a policyholder who dies before a certain age and before ever submitting a claim. This benefit is paid to a beneficiary of the policyholder’s choosing. Under the death benefit structure being modeled, a policyholder will receive the input percentage until he reaches age 65. From age 66 to 75, the death benefit percentage decreases by 10% per year until reaching 0% at age 75. Below is an example of a death benefit schedule with the benefit specified at 80%.
| Death Benefit by Age as a Percentage of Premiums Paid (Death Benefit = 80%) | |||
|---|---|---|---|
| Age | Death Benefit | Age | Death Benefit |
| <=65 | 80% | 71 | 32% |
| 66 | 72% | 72 | 24% |
| 67 | 64% | 73 | 16% |
| 68 | 56% | 74 | 8% |
| 69 | 48% | 75 | 0% |
| 70 | 40% | 75+ | 0% |
This death benefit will have the effect of increasing premiums because it increases the benefits being paid to policyholders.
| Death Benefits | |
|---|---|
| Issue Age | Sensitivity Value = 80% Death Benefit |
| 35 | +3% |
| 40 | +3% |
| 45 | +3% |
| 50 | +3% |
| 55 | +3% |
| 60 | +1% |
| 65 | +1% |
| Average | +2% |
When modeling a periodic cash benefit, an additional situation that needs to be considered is the behavior of policyholders who will delay filing a claim in order to collect a cash benefit. Some policyholders may delay going on claim if they are scheduled to receive a cash benefit payment in the near future and then file the claim immediately after the cash payment has been received. To model this behavior, assumptions of the percentage of claimants who will delay filing a claim for each of the four years prior to a cash benefit payment are entered in the “Assumptions” worksheet of the Input workbook. The model then applies these percentages to new claimants in each of those four years leading up to the cash benefit. This calculates the number of beneficiaries who wait to go on claim until after the cash benefit payment. Once the benefit is paid, the policyholders who delayed their claims are added to the pool of beneficiaries and begin drawing benefits.
Increasing Daily Benefit Option (faster than inflation)
An increasing daily benefit policy is a CLASS policy that would pay a benefit that starts small but increases substantially in real terms over the first 25 years that the policies are held. After 25 years, the daily benefit covered by the CLASS policy would reach a high ultimate level designed to cover a substantial portion of the costs of providing long-term care services. An input parameter is provided that sets the maximum real daily benefit paid by the CLASS policy at year 25 under this scenario. Another parameter specifies the daily benefit amount for the first year that benefits are paid. After this 25 year-period, benefits increase by the standard benefit increase to account for inflation.
The Increasing Benefit Option models a daily benefit payment that starts small and then increases rapidly in real terms. The benefit starts at the user-defined maximum daily benefit, and is increased until the real daily benefit reaches the user-defined maximum daily benefit at year 25. After year 25, the benefit is increased by the standard yearly benefit increase. The real benefit increase schedule (i.e., excluding inflation protection) between the first year policies are sold and the twenty-fifth year at which the target maximum daily benefit is reached is as follows:
-
Years 1-10: No increase in benefit.
-
Years 11-15: Daily Benefit is increased by 5% per year.
-
Years 15-20: Daily Benefit is increased by 10% per year.
-
Years 21-25: Daily Benefit is increased by the factor necessary to raise the maximum daily benefit to the target value at year 25.
The premiums for this option depend on the starting and 25-year values of the maximum benefit being modeled.
| Increasing Daily Benefit Policy | |
|---|---|
| Issue Age | Sensitivity Value = $20 Benefit Increasing to $150 at Year 25 |
| 35 | 68% |
| 40 | 70% |
| 45 | 75% |
| 50 | 73% |
| 55 | 58% |
| 60 | 25% |
| 65 | -4% |
| Average | 44% |
Deductible
By changing the deductible, the user changes the length of time that a beneficiary must wait to start receiving benefits after going on claim. Increasing the deductible will decrease premiums as it decreases the benefit payments.
| Deductible | |
|---|---|
| Issue Age | 50-day deductible vs 0 days |
| 35 | -5% |
| 40 | -6% |
| 45 | -5% |
| 50 | -5% |
| 55 | -5% |
| 60 | -5% |
| 65 | -5% |
| Average | -5% |
Lifetime Maximum Benefit
The lifetime maximum benefit allows the user to input the maximum number of days that a beneficiary may receive benefit payments after going on claim. Decreasing the maximum number of days that a beneficiary can draw benefits will decrease premiums.
| Lifetime Maximum Benefit | |
|---|---|
| Issue Age | 3-Years Maximum vs Lifetime in Baseline |
| 35 | -37% |
| 40 | -36% |
| 45 | -35% |
| 50 | -34% |
| 55 | -33% |
| 60 | -33% |
| 65 | -31% |
| Average | -34% |
Inflation Protection
Inflation Protection (i.e., annual increases to daily benefit amount and sometimes to the premium amount) can be specified as either a fixed amount per year or a variable amount that varies by age of the policyholder. The baseline premiums assume that both benefits and premiums will be indexed by 2.8% every year (which is the ultimate rate of inflation assumed in the 2011 Trustees Reports). If both benefits and premiums were index by 4% per year the resulting premiums would increase as shown in the following table:
| Inflation Protection (Indexing of Benefits and Premiums) | |
|---|---|
| Issue Age | 4% vs 2.8% |
| 35 | +13% |
| 40 | +13% |
| 45 | +13% |
| 50 | +12% |
| 55 | +9% |
| 60 | +5% |
| 65 | +4% |
| Average | +8% |
If benefits are indexed at 2.8% but premiums are level (instead of also being indexed by 2.8%), then the initial premiums would be significantly higher as shown in the following table:
| Inflation Protection at 2.8% But With a Level Premium | |
|---|---|
| Issue Age | Level Premium vs 2.8% indexed premium |
| 35 | +43% |
| 40 | +37% |
| 45 | +32% |
| 50 | +31% |
| 55 | +29% |
| 60 | +25% |
| 65 | +22% |
| Average | +28% |
In addition to the initial premiums being much higher when premiums are level than when they are indexed, the error in the premium of missing the inflation assumption is also much higher. When both benefits and premiums are indexed, the premium assuming 4% indexation is (on average) 8% higher than when assuming 2.8% indexation. With level premiums, the initial premium is 28% higher than when indexed by 2.8% (assuming a 2.8% indexation of benefits). But if benefits are indexed by 4%, then the level premium increases by an average of 23% instead of by 8%.
| Inflation Protection (Indexation of Benefits) With Level Premiums | |
|---|---|
| Issue Age | 4% vs 2.8% |
| 35 | +34% |
| 40 | +31% |
| 45 | +29% |
| 50 | +26% |
| 55 | +22% |
| 60 | +18% |
| 65 | +14% |
| Average | +23% |
The variable inflation protection schedule offers greater inflation protection at younger ages. The reduced inflation protection at higher ages (where it is not as important) is a way to reduce premiums. Under this option, inflation protection is determined by age, with younger policyholders acquiring more inflation protection. This schedule is outlined below:
| Age | Inflation Schedule at Each Age |
|---|---|
| <45 | 4.0% |
| 45-55 | 3.5% |
| 55-65 | 3.0% |
| 65-75 | 2.5% |
| 75-85 | 2.0% |
| 85+ | 1.5% |
| Inflation Protection with Reduced Protection at Higher Ages (Both benefits and premiums are indexed) | |
|---|---|
| Issue Age | Varies by Age at a fixed rate |
| 35 | -27% |
| 40 | -24% |
| 45 | -22% |
| 50 | -19% |
| 55 | -16% |
| 60 | -12% |
| 65 | -12% |
| Average | -16% |
Percent of Days on which Benefits are Received
The model assumes that benefits are paid in cash and that the daily maximum benefit is received every day while in claim. However, it is possible to model a service benefit. The model can also handle the situation where a claimant is given a choice between a (smaller) cash benefit and a (larger) service benefit. For example, the cash benefit could be equal to half of the service benefit payment. To model the effect of this benefit offering, the model first assumes that all Nursing Home and Assisted Living beneficiaries would receive the service benefit amount for every day in claim. To determine the portion of home care beneficiaries who elect to receive cash, data was used from an Institute for the Study of Labor (IZA) publication concerning the German long-term care model as well as data from the NLTCS. Once the proportions of home care beneficiaries who receive the cash and service benefit are determined, a factor can be applied to the home care benefit for each year to adjust the average daily benefit actually paid down to account for beneficiaries receiving the cash benefit.
According to the IZA publication, in 2003, 15% of German LTC beneficiaries not in a nursing home chose to receive the service benefit and 85% received the cash benefit. Of the 85%, those who are in assisted living would receive the service benefit under ARC’s assumption. This portion of the beneficiaries is calculated using frailty data obtained from the NLTCS 1999 survey. Once the proportions of beneficiaries choosing the cash benefit and service benefit are determined, they can be weighted together assuming a benefit of 1 for service and 0.5 for cash. The resulting factor is applied to the home care benefits paid each year to estimate the decrease in benefit payments.
The percent of days for which a beneficiary receives benefits while in the community can be adjusted between 0% and 100%. Decreasing the percent of days in which a beneficiary receives benefits decreases premiums.
| Percent of Days on which Benefits are Received | |
|---|---|
| Issue Age | Sensitivity Value = 80% vs 100% |
| 35 | -17% |
| 40 | -17% |
| 45 | -16% |
| 50 | -16% |
| 55 | -15% |
| 60 | -16% |
| 65 | -15% |
| Average | -16% |
Premium Waiver while on Claim
The decision about whether or not to waive premium payments for CLASS beneficiaries will have a direct impact on the level of premiums needed to sustain the CLASS program. The premium waiver can be set to four scenarios:
-
No waiver of premium for any beneficiaries, i.e., all beneficiaries continue to pay premiums while on claim.
-
No waiver of premium for Home Care beneficiaries, only for Nursing Home beneficiaries.
-
No waiver of premium for Nursing Home beneficiaries, only for Home Care beneficiaries.
-
Waiver of premium for all beneficiaries.
The baseline premium includes a full waiver of premium for all beneficiaries. By lifting this waiver, premiums decrease because the number of policyholders paying premiums will increase to include those who are currently on claim. Waiving premium payments for all beneficiaries would lead to the highest level of CLASS premiums. A partial waiver results in lower premiums, and no waiver leads to the lowest level of premiums.
| Premium Waiver While on Claims | |||
|---|---|---|---|
| Issue Age | HC Waiver Only vs Full Waiver |
NH Waiver Only vs Full Waiver |
No Waiver vs Full Waiver |
| 35 | -0% | -3% | -3% |
| 40 | -1% | -4% | -4% |
| 45 | -1% | -4% | -5% |
| 50 | -1% | -4% | -5% |
| 55 | -2% | -5% | -7% |
| 60 | -3% | -8% | -10% |
| 65 | -3% | -10% | -13% |
| Average | -2% | -6% | -8% |
The level of premium payments is not the only implication of a premium waiver. The uncertainly in the premium level in the future is affected by the decision to waive premiums. CLASS legislation grants the Secretary the authority to raise premiums in order to preserve the viability of the CLASS program. Premiums would need to be raised if the projected income is not enough to cover projected benefit payments. If the pricing of the CLASS policy is incorrect because of interest rate or utilization assumptions, the premium correction necessary to maintain program viability is less if there is no waiver of premium. The necessary premium correction increases for a policy with a partial premium waiver and is the greatest for a policy with a full premium waiver.
For example, suppose utilization is greater than anticipated, and after 10 years of operation, the decision is made to raise premiums in order to keep the program solvent. Below is a comparison of the necessary premium increase for each of the three waiver scenarios.
| Necessary Percentage Increase in Premiums after Year 10 | ||
|---|---|---|
| Utilization is 10% Greater than Anticipated |
Utilization is 50% Greater than Anticipated |
|
| No Waiver | 15% | 74% |
| Partial Waiver | 16% | 78% |
| Full Waiver | 18% | 90% |
Maximum Age and Duration of Policy for Premium Increase
The ARC CLASS model contains input parameters that allow the premiums to stop being increased for policyholders who have reached a specified age AND have held their policy for a specified duration. In the baseline run, policyholders must be age 65 and have held their policy for 20 years in order to stop receiving premium increases. For options that include indexed premiums, increasing the age or duration necessary to qualify for a level premium will decrease premiums because policyholder premiums will increase for a longer duration. The following table shows the reduction in premiums when the age requirement for level premiums is increased from 65 to 75. Premiums for those aged 55 or older do not change because the 20-year requirement goes to age 75 or higher.
| Maximum Age for Premium Increase | |
|---|---|
| Issue Age | Age 75 vs Age 65 |
| 35 | -2% |
| 40 | -4% |
| 45 | -4% |
| 50 | -2% |
| 55 | 0% |
| 60 | 0% |
| 65 | 0% |
| Average | -1% |
The following tables shows the premium reductions when the 20-year requirement for a level premium is increased to 30 years. The premiums for those issued policies aged 35 or younger do not change because it takes 30 or more years to meet the age 65 requirement.
| Maximum Duration for Premium Increase | |
|---|---|
| Issue Age | 30 years vs 20 Years |
| 35 | 0% |
| 40 | -3% |
| 45 | -4% |
| 50 | -3% |
| 55 | -3% |
| 60 | -2% |
| 65 | -1% |
| Average | -2% |
Expense Factors
The model contains two parameters that can be used to load expenses into the premium calculation: one is a load as a percent of benefits, and the other is a load as a percent of premiums. The expenses as a percent of benefits variable allows the user to input a percentage load on premiums for expenses. This load will follow the pattern of benefit payments, such as the expenses related to the administration of claims. Increasing the percentage will have the effect of increasing premiums. For example, a 4% load on benefits will increase premiums by 4%.
The expenses as a percent of premiums variable allows the user to input a percentage load on premiums for expenses. This load would follow the pattern of premium payments related to the collection of premiums, such as expenses related to premium billing and collection and for maintaining policies in force. Increasing this percentage will increase premiums by the reciprocal of one minus the load. For example, the 3% load in the baseline premiums results in a 3.1% (= 1/(1-3%)) increase in premiums. If this parameter were increased to 10%, then the increase from the baseline premium would be 7.8% (=.97/.9).
2. Actuarial Assumptions
The model has the capability to estimate results with various sets of actuarial assumptions. The “Assumptions” input worksheet allows a user to specify the average annual return on investment, antiselectionfactors, utilization rate factors, participation assumptions, and voluntary lapse assumptions. These assumptions do not vary according to the policy options, but are parameters used in the formulas to calculate premiums.
Expected Rate of Return (Interest Rate)
The expected rate of return can be set to any value by the user. Increasing the expected rate of return decreases premiums because benefits paid in the future are discounted at a greater rate. The increase in investment return means that fewer premium dollars are required to finance benefit payments. As can been seen below, the assumed expected rate of return has a significant impact on the premium level.
| Expected Rate of Return | ||
|---|---|---|
| Issue Age | 3% vs 5.7% | 7% vs 5.7% |
| 35 | +47% | -14% |
| 40 | +44% | -14% |
| 45 | +43% | -14% |
| 50 | +41% | -14% |
| 55 | +35% | -13% |
| 60 | +27% | -11% |
| 65 | +24% | -9% |
| Average | +34% | -12% |
Antiselectionand Selection Factors
Adverse selection is the idea that an individual’s propensity to enroll in an insurance program is positively correlated to their risk. This means that individuals who are more likely to draw benefits from an insurance policy are more likely to enroll in the program than people who are healthy. This would imply that the insured population is frailer than the general population. In order to account for this increased frailty, adverse selection factors are used to increase the likelihood that a policyholder will draw benefits.
The model can use one of two approaches to antiselection: a theoretical approach or a first-year assumption regarding additional claims. The theoretical approach assumes that adverse selection is greatest at the time of issue, so the adverse selection factors for an individual decrease as the policy moves further from the enrollment date. This is true for two reasons: First, an individual’s ability to predict their future health is greatest for the near future and becomes less accurate for the distant future. Second, if an individual does not go onto claim for many years after issue, it is an indication that their own perceived disabilities were not significantly greater than that of other policyholders.
The antiselection factor in the model varies by duration, the participation rate, and the prevalence rate of frailty. The model calculates antiselection factors dimensioned by sex, issue age, and duration and multiplies these factors by the respective incidence rates derived from general population survey data when calculating nursing home admissions and home care incidence, as described in Chapter VII on Benefit Payments. Perfect antiselectionwould mean that every single eligible person who is already frail and immediately eligible for benefits would purchase a policy. Using both the actual prevalence rates and assumed participation for a given age and gender, we can construct an upper bound for antiselection as the reciprocal of the maximum of prevalence and participation. This maximum antiselectionapplies at duration zero.
The model also allows the user to build in a level of conservatism by not allowing the antiselection factor to fall below an ultimate value (set at 1.1 for the baseline) for all durations at and above a specified number (set at 20 for the baseline). This means that ultimately the average policyholder is assumed to be 10% more likely than the general population to become frail. For durations 1 through 19, the model does a geometric interpolation between the duration zero antiselection factor and the duration 20 antiselection factor.
The factor is further dampened to take into account that antiselection will not be perfect. The dampening takes the form of raising the antiselection factor to a user-specified power (set at 0.7 in the baseline). The CLASS Act has a 5-year vesting period before a policy holder is eligible for benefits, so the first relevant antiselection factor is that at duration 5.
Below is an example of the antiselectionfactor at duration 5 when the participation and prevalence rates are both 1%. The reciprocal of 1% is 100, which when raised to the 0.7 power equals 25.12. The geometric interpolation of 25.12 and 1.1 at duration 5 gives the antiselection factor (ASF, as used in Chapter VII):
ASF(1%, 5) = 25.12 ^ 0.75 * 1.1 ^ 0.25 = 11.49
Thus, the incidence rates for the appropriate age and sex would be increased by a factor of 11.49 in order to calculate the new claims at duration 5 when the participation rate is 1%. The 0.75 exponent is equal to 15 / 20, which is the fraction of the distance from 0 to 20 represented by the distance from 5 to 20, while the exponent 0.25 is the ratio of 5/20. The table below shows the effect of increasing the antiselectiondamping factor from 0.7 to 0.85 when the participation rate is 2%.
| Antiselection Dampening Factor (0.85 vs 0.70 baseline) | ||
|---|---|---|
| Issue Age | 2% Participation Rate | 6% Participation Rate |
| 35 | +23% | +15% |
| 40 | +20% | +12% |
| 45 | +17% | +9% |
| 50 | +14% | +8% |
| 55 | +13% | +6% |
| 60 | +15% | +7% |
| 65 | +16% | +7% |
| Average | +16% | +8% |
An alternative method for estimating the impact of antiselection is to estimate the number of people who are immediately eligible to enroll in the program and also meet the ADL or cognitive requirement to qualify for benefits. This method relies on counts of frail individuals in survey data as opposed to a comparison of prevalence rates from data and an assumed participation rate in the theoretical antiselection calculations. Under this alternative method, it is assumed that 100% of this frail population would: (1) choose to enroll in the CLASS Act the first year policies are offered, (2) survive the 5-year vesting period, (3) meet the work requirements, and (4) file a claim as soon as possible. After the first year in which benefits are paid, incidence rates for policyholders are assumed to be the same as general population incidence.
NHIS 2007-2009 survey data were used to determine the number of policyholders who would be eligible to file a claim in the first year that benefits are paid. Frailty prevalence rates for people age 18 to 64 are distributed by income, category of cognitive impairment, and number of ADLs. The number of first-year claims is then determined based on the user-defined input for these three categories. Once the number of first year claims is determined, the claims must be distributed by age, sex, and poverty status to be used in the model.
| TABLE: NHIS 2007-2009 Survey Data Frailty Prevalence Rate and Population (000) based on NHIS Data 2007-2009 -- Ages 18 to 64 | |||||||
|---|---|---|---|---|---|---|---|
| All Cognitive | Without ADD | Senility Only | |||||
| 2 or More ADLs |
3 or More ADLs |
2 or More ADLs |
3 or More ADLs |
2 or More ADLs |
3 or More ADLs |
||
| Whole Population | Frail Population | 2,651 | 2,005 | 1,865 | 1,589 | 1,155 | 830 |
| Prevalence Rate | 1.39% | 1.05% | 0.98% | 0.83% | 0.60% | 0.43% | |
| Income Earners Only | Frail Population | 623 | 571 | 480 | 428 | 234 | 176 |
| Prevalence Rate | 0.35% | 0.33% | 0.27% | 0.24% | 0.13% | 0.10% | |
| $10K+ Earned Income | Frail Population | 412 | 374 | 315 | 277 | 173 | 99 |
| Prevalence Rate | 0.30% | 0.27% | 0.23% | 0.20% | 0.12% | 0.07% | |
| $15K+ Earned Income | Frail Population | 314 | 308 | 262 | 229 | 148 | 112 |
| Prevalence Rate | 0.24% | 0.24% | 0.20% | 0.18% | 0.11% | 0.09% | |
| Method of Antiselection | |
|---|---|
| Issue Age | Additional First Year Claims vs Formula |
| 35 | -8.55% |
| 40 | -9.58% |
| 45 | -11.07% |
| 50 | -14.66% |
| 55 | -18.39% |
| 60 | -17.41% |
| 65 | -18.24% |
| Average | -14.99% |
This table illustrates how premiums are affected when using the additional first-year claims method of estimating antiselection versus the formula approach. Premiums for all ages decrease under the first year claims method of antiselection. This decrease is because the first-year additional claims method adds fewer additional claims over the life of the policy than the formula method. The first year additional claim method does result in a greater number of claims during the first year benefits are paid, however this method does not impact incidence in subsequent years. In contrast, the formula antiselection method increases incidence rates for the first 20 years of program operation.
The number of first-year claims above the income eligibility threshold and below the subsidy threshold is considered the number of below poverty claims. The remaining claims above the subsidy threshold are standard claims. The claim distribution resulting from the NNHS nursing home and the NLTCS home care incidence rates was used to distribute the number of first-year claims between nursing home and home care claims by age and sex. The distribution of claims by age and sex is the same for the above poverty population and below poverty population. The resulting claim distributions are used to calculate nursing home and home care incidence for the first year that benefits are paid.
Selection
Selection is the idea that the rules set up by the issuer of an insurance policy will allow only lower-risk individuals to participate. This would imply that the insured population is less frail than the general population. The CLASS Act requires that a policyholder earn income above a certain threshold during at least three years out of their five-year vesting period. The model uses a select period of ten years after the completion of the years of income requirement or age 75, whichever comes first. The model has an initial selection factor as an input and then uses a linear interpolation with a selection factor of 1.0 (i.e., no selection) as the ultimate selection factor to populate the array of selection factors by issue age and duration. The initial selection factor can be set by the user (it is 0.6 for the baseline) for ages under 65 (where the work requirement applies), but 1.0 for ages 65 and over. The 0.6 factor is based on tabulations of the HIS that show the prevalence of frailty for those that earn at least $1 per year is about 60% of the prevalence for the total population. The model then multiplies these selection factors, all of which are less than or equal to 1, by the relevant incidence rates when calculating nursing home admissions and home care incidence.
In theory, the selection factor of 0.6 should apply to any individual in a year when he is working. The selection factor should begin moving toward 1.0 in the year that the individual stops working. The model begins the trend toward 1.0 in the year after the work requirement ends, rather than when actual work stops. Thus, if there is a requirement for three years of work, then the selection factor would begin moving toward 1.0 in the fourth year after issue. The table below shows the change in the premium if the selection factor is set to 0.8 instead of 0.6.
| Selection Factor | |
|---|---|
| Issue Age | 0.8 vs 0.6 |
| 35 | +1% |
| 40 | +1% |
| 45 | +1% |
| 50 | +1% |
| 55 | +4% |
| 60 | +8% |
| 65 | +6% |
| Average | +4% |
Utilization Rate Factors
There are two factors that can be used to change the general level of the utilization rates: one adjusts the level of the incidence rate and the other adjusts the average length of stay (for nursing home stays) and average lengths of episode (for home care stays). The input variable, Percent Morbidity Improvement, is provided to adjust the overall level of utilization for a given group of policyholders. This factor is applied to incidence rates and can be used to adjust the overall level of utilization up or down. When the average length of stay (episode) is changed, the model adjusts the continuance tables to match the new lengths of stay.
Mortality and Morbidity Trend Assumptions
Mortality Improvement can be: (1) manually set to a yearly rate of improvement, (2) read from the trustees report assumptions, (3) or turned off. If the user sets the annual rate of mortality improvement to be 0.5%, for example, then the age-sex specific mortality rate in one year is equal to the corresponding rate in the prior year multiplied by .995. The user may also limit the number of years of mortality improvement. Rates after this number of years become constant. Increasing mortality improvement increases life expectancy and therefore raises premiums because more policyholders live to higher ages where frailty rates increase.
When the parameter is set to use the Trustees Report assumptions, the model reads year-by-year the life tables used in the 2011 Trustees Report. These life tables result in rates of improvement that vary through time and by age and sex. The mortality rates at age 65 and the resulting average annual rate of improvement are shown in the following table:
| Mortality Rates at Age 65 from the 2011 Trustees Report Alternative II Assumptions | |||
|---|---|---|---|
| Gender | 2011 | 2085 | Annual Rate of Improvement |
| Male | .015689 | .007420 | 0.78% |
| Female | .010363 | .005049 | 0.54% |
| Mortality Improvement | |||
|---|---|---|---|
| Issue Age | .025% vs 0.50% baseline |
Trustees Report vs 0.50% |
No Improvement vs .050% |
| 35 | -2% | +3% | -5% |
| 40 | -3% | +1% | -6% |
| 45 | -2% | +2% | -5% |
| 50 | -2% | +2% | -4% |
| 55 | -2% | +2% | -4% |
| 60 | -2% | +1% | -3% |
| 65 | -1% | +1% | -2% |
| Average | -2% | +1% | -4% |
The duration of mortality improvement can be set by the user. The baseline premiums assume mortality improves over the entire projection period (which is 82 years for issue age 18). Shortening the duration of the mortality improvement will shorten life expectancy and decrease premiums.
| Mortality Improvement Duration (with 0.5% annual improvement) | |
|---|---|
| Issue Age | 30 years of improvement vs no limit |
| 35 | -2% |
| 40 | -1% |
| 45 | -1% |
| 50 | -1% |
| 55 | -1% |
| 60 | -1% |
| 65 | -0% |
| Average | -1% |
Morbidity improvement is applied to utilization and decreases utilization of benefits because of assumed decrease in incidence of disease. Annual morbidity improvement works in a similar fashion to mortality improvement. For example, if the morbidity improvement factor is 0.5%, then the age-sex specific incidence rates (one for nursing home admissions and one for home care incidence) for a given year are equal to the corresponding rates for the prior year times .995. Morbidity improvement can be turned off or set to a manually input value. Increasing morbidity improvement will decrease premiums because it decreases the number of claimants.
| Morbidity Improvement | ||
|---|---|---|
| Issue Age | No improvement vs 0.5% baseline |
0.25% vs 0.50% |
| 35 | +15% | +7% |
| 40 | +13% | +6% |
| 45 | +12% | +6% |
| 50 | +12% | +5% |
| 55 | +11% | +5% |
| 60 | +9% | +4% |
| 65 | +8% | +4% |
| Average | +10% | +5% |
The duration of morbidity improvement can also be set by the user. The baseline premiums assume morbidity improves until the end of the projection period. Shortening the duration of the morbidity improvement will increase incidence and increase premiums.
| Mortality Improvement Duration | |
|---|---|
| Issue Age | 30 years vs no limit |
| 35 | 3% |
| 40 | 1% |
| 45 | 1% |
| 50 | 1% |
| 55 | 0% |
| 60 | 0% |
| 65 | 0% |
| Average | 1% |
Average Participation
Assumed average participation can be entered for both low income and high income populations. The participation rates by age and sex for individuals above the poverty line are stored in the “Data” workbook. The low income participation rates are assumed to be constant by age and sex. Increasing participation decreases antiselection and increases program income. This results in lower premiums.
| Average Participation | ||
|---|---|---|
| Issue Age | 4% vs 2% baseline | 6% vs 2% baseline |
| 35 | -8% | -13% |
| 40 | -10% | -14% |
| 45 | -10% | -14% |
| 50 | -10% | -14% |
| 55 | -11% | -15% |
| 60 | -15% | -21% |
| 65 | -16% | -24% |
| Average | -9% | -15% |
Lapse Rates
Lapse rates can be manually entered by the user for multiple issue ages and durations. The durations for which lapse rates are entered cover the first ten years of enrollment, and ages for which lapse rates are entered are 20, 35, 50, and 65. These rates are then interpolated across the range of issue ages. The baseline premiums assume a 0.75% lapse rate for all ages and duration. Increased lapse rates will decrease premiums because policyholders who lapse have paid more in premiums than they have received in benefits, and no benefits will be paid in the future. This excess of premiums over benefits can then be used to pay for benefits to continuing policyholders.
| Lapse Rates | ||
|---|---|---|
| Issue Age | 0.5% vs 0.75% | 0.25% vs 0.75% |
| 35 | +3% | +5% |
| 40 | +2% | +5% |
| 45 | +2% | +5% |
| 50 | +2% | +5% |
| 55 | +2% | +4% |
| 60 | +1% | +3% |
| 65 | +1% | +3% |
| Average | +2% | +4% |
Under the law, an enrollee is considered to have lapsed from the CLASS program if they fail to pay premiums for three months. If the enrollee fails to pay premiums for less than five years, then they can reenroll but premiums will be set at the same level as a newly enrolled person. To become eligible for benefits, the enrollee will need to continue to make payments for the larger of A) The number of months left to pay before the lapse and B) 24 months. If the lapse lasts longer than five years, the person may reenroll, but will have to pay for the full 60 months to achieve eligibility and will have to pay premiums equal to a new enrollee of the same age plus a 1% penalty for every month of the lapse.
There are currently no provisions to return benefit reserves to lapsed or otherwise disenrolled participants. Therefore, when someone lapses or disenrolls and does not return to the program those benefit reserves are kept by the CLASS Independence Fund, which can reduce the overall premiums necessary to sustain the CLASS program. In addition, anyone who has a lapse of more than 5 years but returns will not keep their benefit reserves and will pay punitive premiums that are higher than someone who enrolls for the first time at the same age. People who lapse for less than five years and return will earn coverage with a shorter deferral period than someone entering the program for the first time (though no less than 24 months). This person will be more expensive to insure than someone entering the program for the first time, but they will still be paying the same premium. In the case of someone who lapses and returns in less than five years, the CLASS Independence Fund cannot keep the entire benefit reserve from the original lapse as a mechanism of reducing premiums.
Lapse-supported premiums rely on the assumption that lapse allows the CLASS Independence Fund to retain the benefit reserves from lapsed people. Expected benefits paid out are reduced by the noncoverageof people who lapse and then become frail. However, the people whose lapses are most significant are those who become frail shortly after they lapse. These are also going to be the most difficult to keep out of the program politically.
C. Outputs
Upon each run of the model, five primary output tables are produced: premiums, fund operations, detailed nursing home benefit projections, detailed home health care benefit projections, and program demographic projections. Just as input settings can be saved, output results can be saved along with the corresponding inputs. This is convenient for keeping records of previous model runs, as well as comparing differences in outputs among different scenarios.
Premium Output
There are a few tables describing the premium calculation and resulting cohort premiums. One premium table shows the estimated present value of benefits and premiums by issue age for the first year’s issues from which the issue-age premiums are derived. This table includes the calculated premium and cohort income, which can be compared to the expected benefit. Another table shows premiums by age at issue that result from the given input assumptions. These premiums are given for all ages within the specified issue age limits and all years within the specified years of issue. After the first year of issue, succeeding year’s premiums are calculated by increasing the prior year’s premium (at the same issue age) by the rate of increase in benefits, as opposed to projecting benefits and premiums.
Fund Balance Output
The cash flow table shows the year-by-year operations of the LTC trust fund, including income, outgo, and balance. Income is shown separately for premiums, interest, and (if applicable) other. Outgo is shown separately for benefits and expenses. The premium income is the result of the participation assumptions for each age by year and the premiums at each age. The fund is described by the change in the fund balance from the previous year and the overall fund balance at the end of the year. Premiums generally increase each year for any given age at issue, while premiums for past purchasers may or may not increase depending on the specifications of the law or regulations. Interest is a function of the assumed interest rate and the size of the trust fund. Benefits are based on a combination of incidence rates and average length of episode.
Cash flow is projected year-by-year for the policies issued in the first year by issue age and sex. The cash flow for each subsequent year is based on the cash flow from the first year of issue adjusted for increases in benefits, increases in premiums, changes in the inforceat each duration, and changes in the claim rates. The fund balance table accumulates the cash flow for all issue years.
Nursing Home and Home Health Benefits
The detailed nursing home benefits table shows the number of nursing home residents, the average yearly benefit, and total yearly benefits separately for males and females. The detailed home health care benefit table shows similar statistics for those residing in the community. This table also includes the daily maximum benefit amount for each year during program operation.
Demographic Projections
The demographic table shows premium payers and beneficiaries in nursing home and in home care. The premium payers are reported in total as well as broken out into those who pay the subsidized and unsubsidized premiums. Deaths, lapses, and new issues are shown by year, and the beneficiaries are reported as new incidences for the year as well as by the total number of current beneficiaries for nursing home and home care.
V. Participants
Participants (also called policyholders) are calculated by multiplying the eligible population times an assumed participation rate. Participation rates are assumed to vary by age and sex. The relative value of participation rates by age and sex were obtained from the participation rates observed in the Federal Government’s and the California state government’s LTC programs. The user can adjust the average level of these rates with an input parameter. Below are participation rates for 20, 40, and 60 year olds given average participation rates of 2%, 4%, and 6%.
| Age | Average Participation | ||
|---|---|---|---|
| 2% | 4% | 6% | |
| 20 | 0.46% | 0.53% | 0.60% |
| 40 | 1.29% | 2.40% | 3.51% |
| 60 | 5.26% | 11.33% | 17.40% |
The eligible population is considered to be those workers aged 18 or over who earn above the required amount for participation. Workers are obtained by multiplying the US population times the labor force participation rate times one minus the unemployment rate. These calculations are performed by age, sex, and year. All of these assumptions are taken from the 2011 Trustees Report. The percentage of the workers who earn above a specified threshold is determined from data from the CPS.
Although the CLASS Act provides for a special premium for full-time students who work, the model does not take this provision of the law into account. Because students lose the right to the special premium once they are no longer students, it is assumed that the number of students taking advantage of this provision would be small.
Eligible Population
In order for a working individual to qualify for enrollment in the CLASS program, he must have earned at least an amount equal to that necessary to be credited with a quarter of coverage under the Social Security Act. In the ARC model, the income threshold for eligibility to the CLASS program can be adjusted to any level desired. The March 2009 CPS was used to obtain an income distribution of the United States labor force. This distribution contains counts of workers in various income bands by age and sex, and was used to estimate the proportion of workers who earn income greater than or equal to the defined income threshold. Once the segment of workers who fall below the income threshold is removed, the eligible population has been defined. The ARC model allows the user to set a second (higher) income threshold to determine the population eligible for a premium subsidy for low-income individuals. The law specifies that this level is the poverty line.
New Issues
CLASS program participants are calculated from the eligible population using program participation rates for each age and sex. Participation rates can be input at any level, from a fraction of 1% to 100%. Based on the data from the Federal and California LTC programs, the participation rates increase with age. Because of the 3-year work requirement, we calculate premiums up to issue age 65, although there may be a few issues at higher ages. Age limits may be entered to specify the upper and lower bounds of the individuals that may participate in the program.
The first year that individuals may participate in the CLASS program, the model calculates new issues as the assumed participation rate times the eligible population (for each age and sex separately). In all future years, the model first calculates the increase in the participation rate from each age to the next higher age. This increase in the participation rate is then multiplied by the eligible population to determine new issues.
Inforce Policies
Continuing policyholders are calculated using the mortality and lapse rates in the input assumptions for the model: the rates of survival and of lapsing on the policy are applied to the new issues and inforce policies each year to determine the policies inforce for the subsequent year. In this manner, each age cohort is “followed” in the model through to the end of life, which is assumed to be 100.
Lapses
In any insurance program, enrollees may stop making payments on a policy. When this happens, coverage terminates and the policy is said to have “lapsed.” In order to take this behavior into account, the model allows the user to input lapse rates that are used to model current enrollees who drop out of the insurance pool. The model allows the lapse rates to vary by issue age and duration.
Lapse rates in private industry have proved to be very low (often about 1% or less per year). There should be some concern regarding lapse-supported products. The assumption of lapse reduces premium levels, because much of the premiums paid in the years just after issue are not needed to pay benefits but are set aside in the form of reserves for future benefit payments. The reserve can be thought of as investment by policyholders in the policy. Once they lapse, this investment is lost and returned either to the fund or to other policyholders in the form of lower premiums. If actual lapses turn out to be less than assumed, then premiums may have to be increased. The concept of losing one’s investment upon lapse may also result in politicians creating some form of nonforfeiture benefit at a later date.
The model calculates the persistency of each cohort of policyholders from one year to the next taking into account both lapse and mortality. The persistency rate is one minus the decrement rate. Thus, the number of policyholders persisting from one year (at age x) to the next year (at age x+1) is projected according to the following formula:
P(x+1) = P(x) * (1-lr) * (1-dr)
Where:
P(x) = the number of policyholders in force at age x
lr = the lapse rate (which is specific to age at issue and duration)
dr = the death rate (which is specific to age and sex)
The number of lapses is calculated as a proportionate share of the total difference in inforce policies for an age cohort from one year to the next, i.e., P(x) – P(x+1).
Deaths
When an enrollee dies, they are removed from the insurance pool. Participant deaths are modeled based on the mortality assumptions obtained from the 2011 Trustees Report, which vary by age, sex, and year. Alternatively, mortality can start with the 2011 TR mortality table and then be trended by user specified annual rates of decline.
VI. Trust Fund Income (Premium Payments and Interest)
The model simulates trust fund operations over the period from 2012 to 2094. Several properties of the fund are tracked and reported by year to illustrate fund activity. Total fund income is calculated each year as the sum of premiums collected and interest income. Fund expenditures for each year are calculated as the sum of benefit payments and administrative expenses. The increase in the fund for the year is measured as the fund income less fund expenditures, and this amount is added to the fund balance from the beginning of the calendar year to obtain the end of year balance.
Premium income is calculated as the sum of all premiums paid by inforce members for a given year. The model varies premiums by issue age, issue year, and income status. According to the CLASS Act, premiums may be specific to an individual if he has lapsed for more than 3 months and then reenrolled. The model does not take this behavior into account. Premiums for the first year of issue (i.e., 2012) are calculated for each cohort (i.e., each issue age) by projecting benefit payments and premium payments for each year until the end of life (assumed to be age 100).
Once the premiums are estimated by age for the first year of issue, they are projected for new issues in future years at the same rate as the increase in benefit levels (which is the CPI-U for the CLASS Act). This assumption ignores trends in any other factors, such as: mortality, utilization rates, and participation rates. Because premiums vary by age and issue year, the number of policies inforce is tracked by age and issue year as well. Thus, premium income for each year the program is equal to the number of premium-paying policyholders in a given year (remember some policyholders in claim status may have premiums waived) disaggregated by year of issue and age at issue times the appropriate premium. Thus, the general formula for premium income is calculated according to the following formula summed over all issue years and issue ages:
PI(ia, dur) = PRM(ia, iy) * (1 + prm index) ^ dur * number of premium payers
When there is a low-income subsidized premium, then the above formula is applied separately to the low-income participants using the low-income premium.
Interest income is calculated as the interest rate for a given year multiplied by the starting fund plus half of the change in fund balance (income – expenditures). This assumes that program income is uniformly distributed by month over the course of each year.
VII. Benefit Payments
Benefit payments are calculated by multiplying the number of beneficiaries times the average number of days in an episode of care times the daily benefit amount. Benefit payments are split into years by the use of continuance tables. This allows for the proper indexation of benefits and the discounting for present values. These calculations are done separately for those in a nursing home and those in home care. For those in a nursing home an episode of care is referred to as the length of stay and the beginning of the episode is marked by the admission into a nursing home. Key to the calculation of beneficiaries is the concept of an incidence rate, which is the number of persons with a new episode of care during the year divided by the number exposed to such an incident in the middle of the year. This is as opposed to a prevalence rate, which is the number of beneficiaries at any point in time divided by the total number of participants at that time.
The number of new beneficiaries each year is calculated as the number of policyholders not already in claim status times the incidence rate of new episodes of care. The incidence rate is adjusted for the effects ofantiselection and selection. Thus, the general equation for the number of new beneficiaries each year is:
NHA = (P – NHC) * IR * ASF * SF
Where:
NHA = the number of admissions to a nursing home each year
NHC = the number of beneficiaries already in a nursing home, i.e., in claim status
P = the number of policyholders in force
IR = the incidence rate
ASF = the antiselectionfactor
SF = the selection factor
The term (P - NHC) is referred to as the exposure to admission. The number of beneficiaries in claim status in home care is not subtracted from the number of policies to determine the exposure to admission because those in home care could transfer into a nursing home, just as those not yet in claim status could be admitted directly to a nursing home.
A similar equation is used to calculate the number of new beneficiaries that start an episode of care at home or in the community.
HCE = (P – HCC) * IR * ASF * SF
Where:
HCE = the number of episodes of care that start in home care each year
HCC = the number of beneficiaries already in home care, i.e., already in claim status
The ARC Model keeps track of new claims by age, sex, year of claim, issue year, and subsidy status. The dimensions of age, sex, and year of claim are necessary for projection purposes, because the continuation in claim depends on age, sex, and duration in claim. The dimension of issue year is kept track of for purposes of calculating premiums. Each year of issue must be charged a premium that will support that cohort from issue until the end of life. Therefore, the experience of each cohort of new policy issues is kept track of separately, and each is charged a unique premium. The dimension of subsidy status is kept track of separately because those with subsidized premiums (i.e., those whose income is below the poverty line) pay only $5 per month, while everyone else must pay for themselves plus subsidize the premiums for those with low income.
Therefore, in the ARC Model, the variables for new beneficiaries would look like this:
NHA(age, sex, claim year, issue year, subsidy status) and
HCE(age, sex, claim year, issue year, subsidy status)
The incidence rates vary by age, sex, and the number of activities of daily living (ADLs) needed to qualify for benefits, which is either 2+ or 3+ ADLs. There are six ADLs listed in the law: eating, toileting, transferring, bathing, dressing, and continence. Participants may also qualify for benefits based on cognitive impairment. Although this is taken into account in the model’s incidence rates, the rates of cognitive impairment do not vary with the level of ADLs needed to trigger benefit payments.
Total benefit payments for each new episode of care (i.e., for each new claim) is determined by disaggregating the average length of episode into up to 25 calendar years. The disaggregation is done by using a continuance table, which gives the fraction of total days that occur above selected durations in each episode of care. For example, for a new episode of home care that starts at age 65, the average length of care for a female with 2+ ADL is 1,328 days. The continuance table for an episode of care that starts at age 65 shows that .886 of the days of care are above the 6th month, .691 are above the 18th month, .535 are above the 30th month, etc. Thus, the number of days of care in the first several calendar years from incidence would be determined as follows:
D(0) = ALOE * (1 - CT(6)) = 1328 * (1 - .886) = 1328 * .114 = 151.4
D(1) = ALOE * (CT(6) – CT(18)) = 1328 * (.886 - .691) = 1328 * .195 = 259.0
D(2) = ALOE * (CT(18) – CT(24)) = 1328 * (.691 - .535) = 1328 * .156 = 207.2
…
Where,
D(0) = the average number of days of benefit payments in the calendar year of incidence (assuming that new claims occur on average at the midpoint of the year)
D(1) = the average number of days of benefit payments in the calendar year after incidence
D(2) = the average number of days of benefit payments in the second calendar year after incidence
ALOE = average length of episode
CF(n) = the value from the continuance table at duration n months
It can be seen that eventually the value in the continuance table will reach zero, and that the summation of all fractions applied to the ALOE will equal 1.0, so that all days in the ALOE will be allocated to a calendar year. The user may also specify a deductible period and / or a lifetime maximum. In such cases, the continuance table also determines whether the day of frailty is a day in benefit status.
Continuance Table Adjustments
An input is provided in the “Assumptions” tab of the input workbook that allows the user to manually adjust the average length of stay. This factor, referred to as the “Average Length of Stay Modifier,” allows the user to scale the average length of stay up or down to simulate longer or shorter long-term care stays. When the user modifies the average length of stay the Model adjusts the continuance table to match the new length of stay by adjusting the probabilities of termination between thresholds in the table. Specifically, this adjustment is performed by first transforming the continuance probabilities into termination rates by dividing the probabilities at each threshold by the probability at the prior threshold and subtracting from 1. After the termination rates are obtained between each threshold, they are multiplied by factor to get adjusted termination rates. The factor that produces the assumed average length of stay is found and used to adjust the termination rates. The continuance table is then reconstructed using these modified termination rates.
VIII. Premium Formula
The model calculates long-term care premiums on a closed-group basis until the end of life for each cohort separately beginning in the year 2012. A cohort represents all policies issued in a single year to a single year of age. This is the actuarially accepted practice for individually equitable premiums (as opposed to premiums with built-in cross subsidies) for policies sold on a voluntary basis. Premiums calculated in this manner do not rely on premiums from future purchasers to support the benefit payments to past purchasers, as is the practice for social insurance programs such as Social Security and Medicare. A common practice for judging the financing of social insurance programs is to do a 75-year open group projection.
It is important to realize that a premium cannot be precisely calculated for a LTC policy that increases premiums or benefits by some index (such as the CPI) that cannot be known for all future years at the time of the premium calculation. The premium calculation can use assumptions about these indices for the future. However, if these assumptions turn out not to be realized (which will occur 100 percent of the time) then the premiums will not be accurate. Premiums can be precisely calculated in an actuarial manner if assumptions used to represent these indices are specified (such as 2.8 percent per year), and then in the actual operation of the program, the premiums and benefits are increased at the rate of the stated assumption and not by the actual index.
The premium calculation starts by projecting the cash flow separately for each issue age until the end of life (assumed to be age 100) for the last remaining individual in the cohort. Cash flow includes premium payments, nursing home and home health care benefit payments, and administrative expenses.
Administrative expenses are those costs that are not included in the cost of benefits paid to policyholders: wages for the government workers that administer the program, processing fees, the provision for office space, and computers are examples of administrative costs. The law specifies that premiums cannot be loaded by more than 3% for administrative expenses, although it does not rule out the financing of administrative expenses from other sources. The loading percentage is a user input.
Because the level of the premium payment stream cannot be know before the level of the premiums are calculated, the premium stream is initially calculated using a premium of $1 per month (which is indexed if so specified by the user). The premiums are then calculated by determining the level of premiums such that the present value of premiums is equal to the present value of benefits and expenses for each issue age separately. Administrative expenses are specified by the user as a percent of premiums. The equation for the premium for a given issue age cohort is as follows:
Premium = PVCohortBenefit / [(1 – PPAdmin) * PVCohortIncome]
Where,
PVCohortBenefit = the present value of the estimated stream of future benefit payments
PVCohortIncome = the present value of the estimated stream of future premium payments starting at $1 per month
PPAdmin = the percent of premium load for administrative expenses
Premium Indexing Options
Under the federal long-term care program outlined in the CLASS Act, there are certain triggers that will stop premium increases for inforce policies. An enrollee’s premium will cease to increase after an enrollee has paid premiums in the program for at least 20 years, is aged 65 or over, and is unemployed. It is not clear if these provisions of the law apply only to unexpected increases, as opposed to those that are specified at the time of issue. The model user can specify whether automatic, planned increases stop at a specified age or specified duration. If activated, these premium indexing parameters are taken into account when accumulating the stream of future premium payments. Of course, a level premium can also be modeled by entering 0.0% in the premium indexing input parameter.
Low-Income Premium
The CLASS Act guarantees a low premium to individuals whose income falls below the poverty line, as well as employed students who are less than twenty two years of age. This low-income premium starts at $5 per month and can be indexed upward for each year after 2012. Taking this lower premium into account results in increased premiums for enrollees above the poverty threshold, because their premiums must subsidize the difference between the low-income premium and the actuarially fair premium. The model allows the user to specify an income level different than the poverty line for eligibility for the low-income premium. If this level is set higher than the amount required to be eligible for the CLASS program, then no one would qualify for the low-income premium.
March 2009 CPS data were used to determine the proportion of workers who fall below the poverty line and the model sets the participation percent for the low-income population by age as input parameters. The premium adjustment to account for the low-income subsidy is calculated on an aggregate basis (i.e., across all ages) with all unsubsidized policyholders having their premiums increased by the same percent. The model first calculates the present value of the total shortfall for the low-income policyholders by accumulating the difference between the PVCohortBenefit and the PVCohortIncome (assuming a $5 initial premium) across all years of birth. After also accumulating the present value of the total benefits for the above poverty threshold participants across all years of birth the premium adjustment is calculated as follows:
PremiumAdjustment = (PVShortfallTotal + PVBenefitsTotalAbove) / PVBenefitsTotalAbove
The calculated preliminary premiums for all issue ages are multiplied by this Premium Adjustment Factor to determine the actuarially balanced premiums for the above poverty population including the low-income subsidy.
Premiums with Periodic Cash Benefit and Death Benefit
To calculate premiums when modeling a periodic cash benefit or death benefit that is a function of the premium, the present value of the benefit is calculated as a percentage of the present value of the total cohort premium payments (i.e., cohort income). This factor is then applied in the denominator of the premium calculation in a manner similar to that for the percent of premium administrative expense load as follows:
CashBenefitFactor = pvCashBenefit/pvCohortIncome
DeathBenefitFactor = pvDeathBenefit/pvCohortIncome
Premium = PVCohortBenefit / (0.97 * (1-CashBenefitFactor-DeathBenefitFactor)*PVCohortIncome)
In this way, the premiums are increased to account for the additional benefits being paid for the cash benefit and/or death benefit. These benefits can be modeled independently or concurrently.
Premiums for Initial Issue Year by Issue Age
The premium calculation starts by projecting the cash flow separately for each issue age from the age at issue until the end of life. Cash flow includes premium payments, nursing home and home health care benefit payments, and expenses. Premiums are calculated so that the present value of premiums is equal to the present value of benefits and expenses for each issue age separately. The premium calculation can be characterized as being on a closed-group basis until everyone in the group has died. This is the actuarially accepted practice for individually equitable premiums (as opposed to premiums with built-in cross subsidies) for policies sold on a voluntary basis. Premiums calculated in this manner do not rely on premiums from future purchasers to support the benefit payments to past purchasers, as is done for social insurance programs such as Social Security and Medicare.
Premiums for All Issue Years by Issue Age
The premiums obtained for the initial issue year are projected to all other issue years using the CPI-U. These premiums are used in the simulation of the long-term care program over the specified time period. The premiums are the basis for calculating the fund balance over the length of the simulation.
IX. Fund Operations
After the premiums are calculated, the second iteration of the model simulates the operation of the trust fund for the long-term care program for an eighty-three year period, from 2012 to 2094. This is long enough for those participating at age 18 in 2012 to reach age 100. The fund output worksheet summarizes the year-by-year cash flow of the program over the long-range projection period. Income includes premiums and interest earned on the fund balance and outgo includes all benefits and administrative expenses.
The premium stream and benefit stream for new issues after 2012 are based on the projected stream for those issued policies in 2012, adjusted for the size of the new issue cohort and increases in premium and benefit levels. The projections are done separately by issue age, sex, and subsidized/unsubsidized premium groups.
In the second iteration, the number of new participants in each calendar year is determined by issue age, sex, and subsidized/unsubsidized premium group. Each new cohort is projected through time by applying death rates and lapse rates. Thus, for every calendar year, each age and each sex, the number of policies inforce is stored by the year of issue.
Premium Income
Premium income to the trust fund is based on the premiums calculated in the first iteration of the model (as opposed to a $1 premium). In the first iteration, premiums are determined for each issue age for new policy issues in 2012 (the first year of premium payments) for those in the low-income and the unsubsidized income groups. For those who are issued policies in 2012, these initial premiums are indexed according to user specifications (i.e., no indexing, indexing for life, or indexing up to some specified age and / or duration). For those who are issued new policies after 2012, the premiums calculated for 2012 are indexed up to the new issue year at the same rate as benefits are indexed (reflecting the higher benefit payments for each new year of issue) and then indexed after the new issue year in the same manner as specified by the user in the policy options.
Aggregate (or total) premium payments in each calendar year are then the result of the sum product of the number of premium payers classified by issue age, issue year, and subsidized/unsubsidized times the appropriate annual premium level.
Benefit Outgo
For each calendar year, the first iteration of the model calculates by issue age, sex, and subsidized/unsubsidized premium groups the number of new claims, the number of beneficiaries on claim, and the amount of benefit payments for those in a nursing home and those in home care. In the second iteration of the model, these numbers are used to project the cash flow for subsequent cohorts, adjusted for the size of each cohort and the indexing of benefit levels.
Notes
-
See http://www.icpsr.umich.edu/icpsrweb/ICPSR/studies/09681/detail
-
Stallard, E. and R. K. W. Yee. 2000. Non-Insured Home and Community-Based Long-Term Care Incidence and Continuance Tables, Long-Term Care Experience Committee. Schaumburg, IL: Society of Actuaries.
Appendix M: In-Depth Description of AvalereHealth Model
AvalereHealth CLASS Model Technical Specifications
June 2011
Technical Specifications for the Avalere Long-Term Care Policy Simulator Modified for the Assistant Secretary for Planning & Evaluation to Estimate the CLASS Program
Introduction
The Patient Protection and Affordable Care Act (ACA) contains a provision that supporters hope will help strengthen the United States’ system of financing long-term care (LTC). This new program, established under Title VIII, Section 8002 of the ACA has attracted attention and support because it has the potential to add a new funding source to a system that current relies heavily on Medicaid and provides little insurance coverage.
In the absence of increasing public or private LTC coverage, this country’s long-term care system and the people who use it will continue to experience significant funding and delivery gaps. Individuals who need LTC rely on unpaid family members and friends or dip into their home equity, personal savings, and other out-of-pocket dollars to finance home care, assisted living, or nursing home care. Medicaid has become the country’s long-term care safety net for individuals who exhaust their individual and family resources. However, the federally and state-funded program pays for nursing home care but does not guarantee access to home and community-based services. Only seven percent of Americans currently have private long-term care insurance coverage.
Congress designed the CLASS program to address these gaps. It is a public, voluntary long-term care (LTC) insurance program that will be open to all actively employed adults. Following a five-year vesting period, individuals who become disabled in two or three of the Activities of Daily Living (or have a similar level of cognitive impairment) will be eligible to receive benefits and will receive a lifetime, cash benefit, averaging $50 per day. As written in statute, the CLASS program offers level, age-based premiums and includes subsidies for low-income individuals and full-time students. The Secretary may raise premiums only to preserve program solvency. The CLASS program will be entirely premium-funded and must be solvent over a 75-year period.
In creating the CLASS program, Congress also created unique challenges for financial evaluation and implementation. It prohibited two common front-end actuarial risk and cost controls employed by nearly all other insurance programs: mandatory enrollment and underwriting. Without these, program sustainability depends on encouraging adequate enrollment of healthy individuals to offset the effects of adverse selection. Adequate enrollment, however, depends on an attractive premium, which must be set in advance by the Secretary of the Department of Health and Human Services (HHS).
The ACA requires the Secretary to evaluate the financial viability of this premium-based program and to promulgate regulations to develop an expedited eligibility determination process, an appeals process, and a redetermination process, including whether an enrollee is eligible for a cash benefit under the program as well as the level of cash benefit. Because of the unique nature of the program, there are few real-life experiences of behavior to draw upon to evaluate the potential for adverse selection and to subsequently set premium levels.
To assist the Secretary of HHS, Avalerehas modified a long-term care actuarial model it previously constructed under a grant from The SCAN Foundation. Avalere has designed the new model to evaluate key assumptions about the CLASS program and their effects on premiums over a 75-year window. The model estimates the impact on premiums of adverse selection, different benefit triggers and benefit amounts, program enrollment rates, low-income subsidies, and various benefit structures (including cash vs. services).
The remainder of this paper is laid out as follows: Section II outlines the steps taken for the full Model. Section III details the construction of our general population estimates. Section IV illustrates the process of estimating participation in the CLASS program. Section V outlines the construction of the disability rates. Section VI deals in depth with modeling of adverse selection. Section VII details the Medicaid estimates in the Model. Section VIII lists several of the limitations of the Model. Appendix 1 lists each of the data sources used in the Model. Appendix 2 describes in further detail some of the key data sets that we utilized.
Finally, we referenced countless articles on this subject published over the past 30 years. That contributed to our analysis. Instead of attempting to identify the precise contribution of each article, we have included a full bibliography of these sources at the end of the paper.
Section II: The Long-Term Care Policy Simulator
Avalere Health has modified its existing Long-Term Care Policy Simulator (LTC-PS) model to more closely reflect the specifications of the CLASS program as included in the ACA. The LTC-PS is an Excel-based model that tracks age-specific groups of CLASS program enrollees for 75 years. This paper describes many of the key assumptions and modeling options that we incorporated into the LTC-PS in order to provide estimates of premiums for variations of the CLASS program that may be under consideration by the Secretary of HHS.
The LTC-PS creates enrollment groups from the overall population and calculates the expected costs and premiums for each enrollment group separately by age. For the most part, the same process is repeated for each consecutive group of annual enrollees. We make exceptions to this repetition with estimates for expected enrollment, adverse selection, and premiums.
The CLASS program is required to be actuarially balanced over a 75-year window. This, in short, means that the present value of total expected costs of the program, including benefit payments, administrative costs, and subsidies, must equal the present value of total expected income of the program, including premiums and interest payments. The estimated premium represents the average premium required in the initial year for each age of estimated enrollment to accomplish an actuarially balanced model.
In order to construct these expected costs and expected income, we estimate for each enrollment group the number of people participating in the program and receiving benefits as well as the number of people participating in the program and paying premiums. Depending on the policy options selected, these may or may not be mutually exclusive categories. In order to calculate the total costs of the program and the total income, the steps described in this paper are applied to each age group above 18 years old for 75 consecutive years. In addition, each enrollment year is modeled separately.
The following provides an overview of the major functions of the model and the conceptual sequence of these functions. It is followed by a more detailed explanation of each of the major functions.
Estimating Program Enrollment. In order to determine costs and income, we first estimate how many people are enrolled in the program. There are two key analyses associated with program enrollment: the eligibility requirement and voluntary participation.
-
Eligibility requirement. The CLASS program is available to individuals over the age of 18 who have at least 3 years of active work experience. At the onset of the program, we assume that the work requirement will prevent most of the currently disabled population from being able to participate. We make an exception for individuals who have a severe disability and are currently working (approximately 5 percent to 7 percent of the severely disabled population is currently employed). We incorporate these individuals through our estimates of adverse selection, discussed in Section VI.
-
Voluntary participation. The CLASS program is a voluntary benefit. As such, enrollment is based on the expected value for each individual relative to the estimated premium. The assumptions used to estimate participation are described in detail in Section IV.
Estimating Benefit Eligibility. After determining the enrolled population, we determine the proportion of individuals who are eligible to receive benefits (i.e., who are vested). The CLASS program has a 5-year vesting requirement with an earnings threshold. In the model, we assume any individual who has been enrolled for five consecutive years will be eligible to receive benefits.
Estimating Individuals Qualified to Receive Benefits. Once the Model has calculated the enrolled population and those eligible to receive benefits, we must estimate how many enrolled and eligible people have a disability that qualifies them to receive benefits. Section V details our method for constructing estimates of severe disability. For each age and year in the Model, there are two components of the disabled population: newly disabled and continuing disabled.
-
Newly disabled. Using age-specific incidence rates we calculate the number of individuals who are eligible to receive benefits who develop a severe disability in a given year. The calculated incidence rates are for an entire calendar year, but for modeling purposes we only want to track the average number of people who would receive benefits in their first year of need. We therefore discount a portion of the incident population in each year, and include the remaining incident population in our total estimates for the following calendar year.
-
Continuing disabled. We also adjust the prior-year age-specific population with a disability to account for both the estimated number of individuals who cease to be severely disabled, either through death or improvement in condition. This is done via the continuance estimates as described later.
Estimating the Disabled Who Are Receiving Benefits. While a person might be enrolled in the program and meet the vesting as well as the disability requirements to receive benefits, that person might have exhausted benefits in a program that pays for a specified period of time less than lifetime (i.e., one or three years). For any CLASS options with a limited benefit of less than lifetime, we apply a factor to account for people with disabilities who have already received the maximum amount of allowable benefits in the program. To estimate these factors, we use the continuance estimates as described in section V.
- As an example, if the CLASS program were to have a one-year benefit, the Model calculates for each age the number of persons with a severe disability who are still disabled for more than one year. We remove them from the count of total disabled to construct the premium estimate for this program variation.
- One of the limitations of the Model lies in the interaction of a limited benefit and the non-continuance population. We are not able to estimate the number of persons who develop a disability, receive benefits for a short time, stop receiving benefits due to an improvement in their condition, but then develop a disability a second time and start receiving benefits again. While an actual long-term care program would be able to track these individuals and stop benefits in a limited-benefit situation, we are unable to do the same from a modeling perspective.
- We do not model the impact of a delayed receipt of benefit in the CLASS program, either under a lifetime or limited benefit. We assume that once a person enrolled in the program has developed a disability severe enough to qualify for benefits, he will begin receiving payments from the program.
Amount of benefit payment. After determining the number of people receiving benefits, the Model next calculates the amount paid for each recipient. There are two options for the user to select: a cash benefit or a services benefit.
-
Cash benefit. Users can select a cash benefit amount of $50 per day, $75 per day, or $100 per day. This amount is increased by the estimated annual increase in the CPI-U, set at the first year that benefits are paid in the program. The cash benefit is paid to all of the “disabled receiving benefits” population in the Model.
In the aggregate, we assume that every beneficiary receives the full amount of the average cash payment. However, it is possible to alter the amount of benefit received based on the level of disability or setting of care. We incorporate these differences for each age-specific estimate of disability and setting.
-
Service benefit. We used the estimates of paid utilization from each of the main surveys (SIPP and NNHS) to determine approximate service utilization. For any given year, we assume the ratio of community care to institutional care for each age remains constant. Any shift in the overall mix of services is caused by a shift in the average age of beneficiaries. We assume that annual costs increase by the expected growth in nominal wages.
Low-income subsidy. The low-income subsidy in the CLASS program is internally financed. The cost of the subsidy is paid for by higher premiums to non-subsidized participants. The amount of the subsidy is based on the number of low-income participants less any low-income premium. The estimated number of individuals receiving the low-income subsidy is modeled separately, and discussed in section III.
Administrative costs. Any insurance program has administrative costs associated with marketing, premium collection, benefit payments, and other operational costs. The law requires a 3 percent administrative cost level, which we estimate based on the annual premium amounts.
Fund balance. For most insurance programs, there is an annual difference between premiums collected and benefits paid. Given that the CLASS program is a new program that pays for a relatively low occurrence but high cost event, the program will collect significant amounts of premiums in the early years. As the program, and the population, ages, it then pays out these funds. For any annual excess collections, our baseline assumptions use the current expectations for Treasury bonds rates to calculate the interest income of surplus funds.
Premium calculations. Finally, after making all of the above calculations, we have the total expected cost of the program for the next 75 years for each enrollment group and each age. These values are adjusted to 2012 dollars (or first year of the program) via the expected rate of inflation for each of the next 75 years. Once the total present value of all spending is estimated, we estimate the level of premiums required over the course of the same 75 years such that the 2012 present value of these payments equal the total costs.
-
Premium increases. The Model allows a user to test the impact of increasing premiums by inflation on an annual basis.
-
Age-adjusted premiums. Since each age is separately modeled, each age also has an actuarially-balanced premium. Note, given the interactions with adverse selection, low-income, and other items that will impact the first enrollment group more than subsequent enrollment groups, we require each subsequent round of enrollees to pay the same age-specific premium as individuals already enrolled in the program. Without this requirement, it would be possible for future years’ enrollees to have lower age-specific premiums than prior years’ enrollees.
Section III: Estimating the Premium Paying, Benefit Eligible Population
In order to estimate the first group that would be enrolling in the program we start with an estimate of the overall population. From that, we estimate the enrolled population by determining the overall population that is eligible to enroll through attachment to the work force. We then derive the population that would be eligible to pay premiums and receive benefits. The following provides the steps involved in creating the estimate of people eligible to enroll.
-
Estimating the Overall Population. Our first step was to estimate the entire population, by age, from 2010 through 2100. We started with Social Security estimates of population, which contain all residents of the United States, and account for the agency’s expectations for changes in nativity, mortality, immigration and emigration.
-
Estimating Attachment to Work Force. Next, we subdivided the population according to work status. We used estimates of the labor force (people working or looking for work) as well as an estimation of retirement by age, in order to account for individuals who are participating in the program for three or more years and retire but continue to pay premiums.
-
Working. To calculate employment, we used data from ACS. To identify workers, we used the variables for “Employed-at work” and “Employed, with a job but not at work,”1 which combined we called “Working.” This was approximately 48 percent of the total population in 2007.
-
Looking for Work. We also created, as an initial calculation, estimates of the number of unemployed persons as recorded in ACS. Using the initial estimate of approximately 6 percent unemployment,[2]we varied this rate annually by the projected unemployment rate as published by the CBO. This unemployment rate is a percentage of the labor force. When expressed as a percentage of the total population, the same figure is only 3 percent.
-
Labor Force. The labor force, which is the combination of people working, unemployed or “looking for work,” comprises approximately 51 percent of the total population. For future estimates of the size of the labor force, we assumed the percentage of people at each age in the labor force remains constant at the initially estimated rate over the entire course of our projections.
-
-
Low-Income Individuals. After constructing these basic groups of individuals by age, we also needed to determine how many individuals would be above the minimum earnings threshold but below the low-income earnings threshold. These estimates are necessary to estimate the impact of varying the program’s low-income subsidy on premiums as well as calculate the impact on Medicaid spending. We created various levels of income thresholds to mirror possible options of the CLASS program.
We model the enrollment of low-income individuals separate from overall enrollment, given the different motives of this population. We assume a good portion of individuals eligible for the low-income subsidy will enroll in the program, although not the entire population. While there is a relationship between income and age, we estimate that in the initial years of the program, new enrollment of low-income eligible individuals will likely include a higher percentage of older individuals. For subsequent years’ enrollment, we estimate a larger portion of the low-income subsidized individuals will be younger.
Given the general relationship between age and income, most individuals lose low-income eligibility as they age. We assume the average low-income enrollee does not remain in the program after they lose eligibility, given the expected increase in premiums. In addition, we do not include any estimation of individuals gaining low-income premium eligibility in retirement, given the uncertainty in the CLASS program with this option.
-
Vesting. Since each enrollment group is modeled and tracked separately, we are able to directly estimate the impact of vesting by requiring each group to complete five years of participation before they are eligible to receive benefits. We include two factors that result in an individual not reaching their vesting threshold: mortality and policy lapse.
- Mortality: we use the overall population mortality estimates as published by the Social Security Trustees. We do not assume that CLASS program enrollees differ in their average mortality rate than non-CLASS enrollees.
- Policy lapse: For a baseline estimate, we assume that 0.5 percent of participants allow their policies to lapse each year for the first 20 years, after which we assume there are no additional policy cancellations. We also vary the lapse assumptions to determine the potential impact on premiums for each enrollment group.
Section IV: Estimating Participation in the CLASS Program
One of the most challenging aspects of constructing a model that estimates voluntary participation in a new long-term care insurance product is the relationship between premiums and participation. We believe the level of participation in a voluntary, federally run long-term care insurance program will largely be based on the premium. To estimate premiums in an actuarially balanced insurance program, we must estimate both expected costs as well as expected income. Both costs and premium income are directly estimated via the participation in the program, putting us back where we started. As a result, premiums depend on participation, but participation depends on premiums.
From an economic standpoint, we would expect rational individuals to enroll in the program if the expected value of the benefit were greater than the expected cost of premiums over the course of enrollment. Once we determined this relationship, we could use observed rates of elasticity for long-term care insurance to vary enrollment for each age group based on the actual premium calculated by the Model. However, for the CLASS program we must also factor in the interaction with private long-term care insurance as well as general uncertainty about the need for any long-term care insurance.
Most of the observed elasticity rates are based on varying levels of benefits from different private long-term insurance programs, with different sub-populations of enrollment. To use these elasticity rates properly, we would need to anchor each age group to an external participation and premium level, which is difficult given the differences in benefits offered by traditional long-term care insurance. In addition, enrollees in private long-term care insurance may react differently than the general public to the need for long-term insurance, given the expected differences in demographic profiles. Both of these factors are likely to make enrollment in the CLASS program lower than it would be otherwise.
There is little evidence to determine the willingness to enroll in a program such as CLASS, although most experts tend to believe enrollment will be between one and six percent of eligible individuals. As such, we use a baseline assumption that two percent of the working population will enroll in the CLASS program in the first year, not including individuals eligible for the low-income subsidy. We assume subsequent years’ enrollment will be a fraction of this amount, with declining enrollment rates for the next 5 years, reaching a steady annual enrollment rate of approximately 0.1 percent of the eligible population. For the baseline model, these assumptions lead to non-low income enrollment of 2.2 million individuals in the first year, declining to 145 thousand new enrollees in 2017, and total enrollment by 2020 of 3.5 million individuals.
After estimating an overall participation rate, we applied age-adjusted participation rates. Since it is highly likely that participation will increase with age as individuals approach and begin to plan for retirement, we allow our participation estimate to also increase with age. We used two separate methods to estimate participation by age:
- Smooth enrollment expectation: One approach to enrollment that we modeled applied a constant rate of increase or decrease based on an inflection point. We chose the age of 50 as our inflection point, assuming that the average participation would equal participation at age 50. We then increased participation at a rate of 2 percent for each age above 50, and decreased participation at a rate of 1 percent for each age below 50. This adjustment was applied as a growth rate. For example, with the baseline model assumption of 2 percent overall participation,we used this rate for enrollment at age 50. Using the smooth curve process, estimated participation at age 49 is 1.98 percent (2 percent x 0.99) and participation at age 51 is 2.04 percent (2 percent x 1.02). After experimenting with different factors, we chose these growth rates because they maintain an overall participation rate equal to our estimated rate.
- Federal Long-Term Care Insurance Participation: In addition to the smooth estimation process, we modeled a separate enrollment expectation rate based on the observed enrollment rates in the federal long-term care insurance program (FLTCIP). Using the actual enrollment rates by age for in-force policies, we constructed a curve that starts with the total estimate of enrollment and distributes the enrollment by age mimicking the actual experience of the FLTCIP.
Exhibit 1 displays the enrollment distribution under these two options. Under the FLTCIP option, enrollment is much more heavily weighted towards individuals aged 50-60, while the smooth enrollment estimation has a higher proportion of enrollees aged 25-40.
EXHIBIT 1: Enrollment Estimation Methods
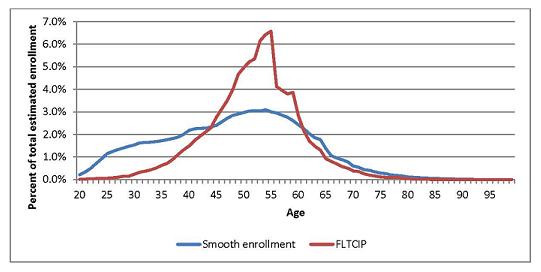
Section V: Estimating Incidence, Prevalence and Continuance
The LTC-PS uses estimates of the total number of people with a disability in any given year (prevalence), the number of people newly disabled in a given year (incidence), and the length of time they remain disabled (continuance). Incidence is important because the program will not cover all individuals with a disability at any given point. Continuance allows users to test the impact of varying the amount of time over which benefits will be paid.
The creation of incidence and continuance estimates is inherently difficult because there are few sources of information on the number of people who develop a disability as well as the length of time they remain disabled. Therefore, we estimated prevalence, incidence and continuance by combining four disparate data sets: the 2004 Survey of Income and Program Participation (SIPP), Wave 5, for disability prevalence in the community; the 2004 National Nursing Home Survey (NNHS) for disability prevalence in a nursing home; the Individual Disability Experience Commission (IDEC) table of disability incidence and continuation for the under-65 population; and transition matrixes as published by Eric Stallard/Yee/Manton using the 1984, 1989, and 1994 National Long-Term Care Survey (NLTCS). The following describes our method in more detail.
-
Prevalence. We first estimated disability prevalence for individuals in the community by age using the 2004 SIPP. Specifically, we defined a person as ‘severely disabled’ if he needed help with two or more activities of daily living (ADL); had Alzheimer’s Disease or any other serious problem with confusion or forgetfulness; or had a mental retardation or a developmental disability such as autism or cerebral palsy. This definition most closely matches the HIPPA disability requirement. In total, we estimated 3 percent of the over-15 population in the community has a severe disability.
We next estimated disability prevalence for individuals in a nursing home by age in the 2004 NNHS. Specifically, we defined a person as ‘severely disabled’ if he needed limited, extensive, or total assistance with two or more ADLs; was in an Alzheimer’s or dementia specialty unit in the nursing home or had impaired decision making ability; or was admitted to the nursing home directly from an intermediate care facility for the mentally retarded (ICF/MR). In total, we estimated 91 percent of the over-15 population residing in a nursing home has a severe disability.
Since these two surveys represent distinct populations (SIPP does not include individuals in an institution such as a nursing home, and NNHS excludes individuals outside of the nursing home), we felt comfortable combining the estimates to develop a total HIPPA-equivalent disability prevalence estimate. When combined, we estimate slightly over 3 percent of the total US population has HIPPA-eligible disability. Of this group, 18 percent reside in a nursing home and 82 percent reside in the community.
There has been considerable debate concerning an apparent decline in disability prevalence over the last decade, including the magnitude and cause of the decline. Given this uncertainty, we chose to model as baseline a continued modest decline in the overall prevalence, at a rate of 0.5 percent per year through 2025, after which we allow the overall prevalence of disability to change with the age of the population. As a result, when the effect of the aging population is combined with this assumed decline in the prevalence rate, our average disability prevalence remains at slightly above 3 percent from 2010 through 2025, at which point it begins to increase slightly, reaching 4.6 percent by 2085.
In addition, it is possible that a higher percentage of individuals would be able to qualify for an additional measure of disability under the CLASS program given the economic incentives. To account for these individuals, we assume that a portion of the people who currently have one less measure of disability would qualify for the program. For a CLASS program that pays benefits to individuals with 2 or more ADLs, we assume 50 percent of individuals with only 1 ADL would qualify: all nursing home residents and a portion of the community population. For a CLASS program that pays benefits to individuals with 3 or more ADLs, we assume 50 percent of individuals with only 2 ADLs would qualify: all nursing home residents with 2 ADLs and a portion of the community population.
-
Incidence and Continuance. For the continuation rates, we built separate tables for the under-65 and over-65 population. We constructed a disability continuance table for the under-65 population using the IDEC continuance worksheet. We used the published 90-day continuance rates from IDEC, again to use the HIPPA requirement that the disability be long-term in nature. For the over-65 population, we developed continuance rates using a series of transition matrices developed by Stallard & Yee via the NLTCS data, which uses the HIPPA definition of disability.
After constructing continuance rates from both of these sources, we created non-continuance rates, or the percentage of individuals with a disability in a given year that ceased to be disabled in the following year. There are two reasons a person ceases to be disabled: mortality and recovery. We separated our non-continuance rate into an estimate of mortality and an estimate of recovery, using the same data sources we used to construct the overall continuance rates. We capped our annual modeled mortality rate at the age-specific mortality rate for all individuals (disabled and non-disabled) as published by the SSA, to ensure that total population mortality was never greater than our modeled mortality.
After constructing prevalence and continuance estimates for each age, we were able to estimate individual age incidence rates via the following formula: Prevalence in year 2 (P2) = Prevalence in year 1 (P1) + Incidence in year 2 (I2) minus non-continuance in year 2 (NC2). Rearranging the terms, we solve for incidence: I2=P2-P1+NC2. We apply the incidence and continuance rates calculated via the surveys to individuals in each program by age.
Section VI: Adverse Selection
In a mandatory long-term care insurance program, the rate of disability for participants will match the overall population average. Premiums will reflect the mix of people with disabilities and people without disabilities in the overall population. However, in a voluntary program, there is the possibility that certain individuals will have better knowledge of their own likelihood for disability. Those with knowledge that they will definitely require some sort of long-term care will be more likely to enroll in a program that pays these costs. This leads to higher than average costs for the program, which in turn leads to higher premiums, which can lead to lower participation among those with lower probability of disability. Called adverse selection and sometimes referred to as a death spiral, this effect at its worst results in an insurance program that is financially unsustainable.
The inverse of this situation is termed advantageous selection. Individuals may lack knowledge of their future expected need for long-term care, but may instead be risk averse and wish to sign up for the protection offered by long-term care insurance. Many times this risk aversion can also lead to a less risky lifestyle, which can lower the probability of certain types of disability.
The amount of adverse and advantageous selection in the current long-term care insurance market is a subject of debate. While some individuals likely do have better knowledge of potential future needs as a result of personal medical information or family history, the studies done to date have failed to show higher probability of disability among insured individuals. There are three factors that can account for much of this: risk underwriting by private long-term care insurance companies, the offsetting factors of adverse and advantageous selection, and the role of Medicaid as a safety-net program for low-income individuals which makes them less likely to purchase private long-term care insurance. Each of these factors has been cited in research as a possible reason for a lack of evidence of adverse selection.
For the CLASS program, the impact of adverse selection becomes more acute because there is no risk underwriting in this federal program. We treat the availability of this new federal program in much the same manner as the general Medicare program. Individuals are eligible to receive benefits as long as they have contributed for the required length of time, and the level of contribution is not determined by personal health factors. While participants must be attached to the workforce and contribute to the program for five years before becoming eligible for benefits, neither of these requirements can completely eliminate the effect of adverse selection.
While we can expect some amount of advantageous selection would partially offset this risk, we also now have to consider the impact of the private long-term care insurance market. That market could potentially “cherry-pick” the low risk individuals, thus exacerbating the impact of adverse selection in the program. Finally, we believe there are likely a number of individuals who desire this form of insurance but are unable to purchase it due to lack of affordability in the private market. We believe this pent-up demand could also increase the potential impact of adverse selection in the program relative to the current private LTC insurance market.
In order to estimate the role of adverse selection in the program, we first developed an estimate of the number of people by age that will develop a severe disability over the next five years. Next, for a given rate of assumed overall participation in the program, we compared the number of people that we assumed would enroll in the program against the total estimated incidence of disability for the entire eligible population over the next five years. Under a pure adverse selection scenario, people who would develop a severe disability over the next five years would all enroll in the program, which we termed “perfect knowledge”. To calculate the impact of this “perfect knowledge” scenario, we created alternate incidence rates using the individuals who develop a severe disability over the next five years in the numerator and the estimated enrollment in the program (which we calculated separately) in the denominator. As the total estimated enrollment increases, the alternate incidence rate declines until it reaches the overall population incidence rate for a program enrollment of 100 percent.
To address the unlikely nature of “perfect knowledge”, we dampened these alternate incidence rates downward to account for a portion of the population that would not have “perfect knowledge”, but would instead represent the overall average incidence rate. We also changed this dampening factor over time, to account for the likely pent-up demand in the early years of this new social program. For the first enrollment group, we assume the impact of adverse selection will be the greatest, with an initial weight of 75 percent towards the “perfect knowledge” incidence and 25 percent towards average incidence. This weighting declines for the first enrollment group over time as the effect of the initial pent-up demand wanes. For subsequent enrollment groups, we assume the impact of adverse selection will be muted but still present given the nature of the CLASS program.
Finally, we vary the starting impact of adverse selection based on a number of variables associated with earnings and work requirements for the program. Based on an analysis of the ACS, we determined that there is a higher prevalence of modest disability with lower-wage workers. If the earnings requirement is raised, it is possible that the initial impact of adverse selection on the overall CLASS program would be reduced. Therefore, we lower the starting weight for the “perfect knowledge” situation for higher levels of earnings requirement. Similar to the overall adverse selection calculations, this impact is also dampened for estimates of future enrollment groups.
Our baseline estimates do not make any adjustment to continuance rates based on program enrollment. In other words, we assume the average disabled person in the CLASS program will remain disabled for the same length of time as the average disabled person who is not enrolled in the CLASS program. If one of the results of adverse selection is not only a higher incident rate but also a higher continuance rate, the program could cost even more than our model currently estimates.
Section VII: Estimating the Medicaid Impact
One of our key underlying policy assumptions for the LTC-PS is that the CLASS program would provide benefits for eligible participants before Medicaid payments. Effectively Medicaid would remain a “payer of last resort”. As such, we needed to create estimates of current spending estimates by Medicaid for the population in question (the baseline), how this spending would be impacted by CLASS policy options, and how many CLASS enrollees would otherwise have Medicaid as their primary payer of long-term care services. The following describes the steps we undertook to estimate the impact of policy choices on Medicaid spending.
-
Determining Medicaid Utilization. For the baseline estimates, we first estimated the number of people receiving Medicaid payment for care provided in either a nursing home or home and community-based setting. We began with information in both SIPP and NNHS. Each of these surveys has information on the source of payment for any care received. We utilized this detail from the surveys to estimate the percentage of people with severe disabilities in each setting that had Medicaid as a payer. According to the surveys, approximately 61 percent of the disabled population residing in a nursing home and 7 percent of the disabled population residing in the community and receiving paid help had Medicaid as a payer. Using these rates, we calculated that nearly 0.9 million nursing home residents with a severe disability and 0.5 million persons with a severe disability living in the community were receiving help for their disability and had Medicaid as a primary payer.
While we were fairly comfortable with the nursing home estimate, we believed the community estimate was too low. Specifically, we felt that due to the nature of the paid help question in SIPP--a potential response to the survey question “Who is the primary provider of assistance with your disability?”--respondents were likely reporting family members. It is possible that they were also receiving paid help from the Medicaid program via either Medicaid home health or personal care services, or a Home and Community Based Services (HCBS) Medicaid waiver program, but not reporting this care due to the nature of the survey question.
To address the apparent underreporting of Medicaid utilization, we referenced the total estimated population receiving Medicaid home and community based services as published by the Kaiser Commission on Medicaid and the Uninsured. Using the same base year as the SIPP data (2004), Kaiser reported an estimated 2.7 million individuals received home-based care from Medicaid at some point during the year. To adjust this figure to represent a single point-in-time estimate comparable to the data from SIPP as well as remove any non-disabled individuals who qualify for Medicaid home care via alternate mechanisms, we applied a ratio slightly higher than the average relationship between Kaiser-estimated rates of average monthly Medicaid enrollment in June 2004 and total Medicaid enrollment in all of 2004. This ratio is approximately 71 percent, which if applied directly to the Medicaid home-based care recipient estimate of 2.7 million would still overestimate for purposes of the Model. That’s because some individuals could qualify for Medicaid home-based care and not qualify for community care in the Model. We removed an additional 5 percent to account for these individuals, leaving an estimated 1.8 million persons receiving home-based care paid for by Medicaid. We therefore inflated our initial estimates of 0.5 million persons with a severe disability in the community to 1.8 million.
We then re-calculated the ratio of Medicaid beneficiaries to total beneficiaries for the community setting, resulting in a revised estimate of 26 percent of persons with a disability residing in the community who receive paid help for their disabilities from Medicaid.3 We applied this revised community estimate along with the nursing home estimate of 61 percent to each year’s estimated disabled population in each setting to calculate the number of individuals with a disability in any given year at any given age who would be receiving Medicaid-financed assistance with their disability.
-
Determining Medicaid Spending. After creating estimates of the size of each Medicaid population, we also needed to determine the average per capita Medicaid spending for these residents. This estimate of Medicaid costs allows us to determine the potential for savings to Medicaid from the implementation of this federally run, long-term care insurance program.
Having previously determined the size of the Medicaid population in each setting, we constructed a national average cost for these patients. For nursing home patients, we combined data from A Report on Shortfalls in Medicaid Funding for Nursing Home Care, October 2008, published by the American Health Care Association (AHCA) and adjusted this data to match the total estimated spending by Medicaid in nursing homes as published by the National Health Expenditures (NHE). In the nursing home setting, we assumed the per diem is equal to the national average per diem (approximately $125 per day in 2010). For the community setting, we utilized data published in the same Kaiser report we used to develop the estimated size of this population. This report estimates 2006 annual Medicaid payments for an individual receiving home care was $13,320. We adjusted this community setting data to 2010 rates using the growth in nominal wages as published by the BLS from 2006 to 2010.
Once we determined the average Medicaid spending per person, we were able to develop an estimate of total Medicaid spending for the population with severe disabilities included in the Model. For purposes of calculating Medicaid savings in the Model, we estimated the portion of the baseline applicable to participants in the specific scenario (adjusted for the low-income subsidy interaction described previously).4 Since the CLASS program offers a cash benefit, we calculated the difference between expected Medicaid spending on the beneficiary and cash payments from the program. If expected Medicaid spending was higher than the cash payment, the Medicaid savings equaled the amount of cash paid, and if expected spending was lower than the cash payment, the Medicaid savings equaled total estimated Medicaid spending. We did not allow for a “personal care allowance” portion of the cash payment in the Model.
-
Estimating Medicaid participation for CLASS enrollees: The final step in estimating the impact of the CLASS program on Medicaid spending is to estimate the number of CLASS enrollees who would have had Medicaid payment for their long-term care needs. To estimate this group, we worked with Medicaid experts to determine the relationship between the low-income subsidy, premium amount, and participation of future Medicaid enrollees. The basic relationship worked as follows: participation of individuals who would otherwise be eligible for Medicaid was higher for more generous low-income subsidies and lower premiums. We constructed a matrix of participation based on input from these Medicaid experts, shown in Exhibit 2.
| EXHIBIT 2: Low-Income Subsidy and Premium Interaction Matrix | |||
|---|---|---|---|
| Premiums | Low-Income Subsidy | ||
| None | 100% FPL | 150% FPL | |
| >50 | 25% | 50% | 75% |
| 50-80 | 20% | 45% | 70% |
| 81-100 | 15% | 40% | 65% |
| 101-120 | 10% | 35% | 60% |
| 121-150 | 5% | 30% | 55% |
| 150+ | 0% | 25% | 50% |
Section VIII: Limitations
Due to the significant number of disparate data sets and assumptions used to create the LTC-PS, there are a number of limitations regarding the analysis. Beyond the issues already highlighted in this paper, we note the following points:
- Disability estimates. Throughout the course of creating the Model, the single biggest issue we encountered was the lack of consistent estimates regarding the number of individuals with severe disabilities. Many of the data sets we examined had different ways of measuring disability, which in turn led to different estimates of total prevalence. In addition, there is no single data set that has information containing incidence and continuance of disability, the key measures needed for the Model. In order to develop the Model, we combined four data sets, which could have created certain biases in our parameters.
- Adverse selection. Another inherently complex estimation centers on the level of adverse selection. There is considerable debate among researchers regarding the magnitude of adverse selection and its impact on expected costs of a long-term care insurance program. We followed what we believe to be fairly standard actuarial assumptions regarding the magnitude of adverse selection, but acknowledge that different analysts could reach different conclusions.
- Medicaid interactions. One of the assumptions regarding potential Medicaid savings we used in our model is that the introduction of the new program will not lead to a delay of Medicaid eligibility for any individual. Most states set Medicaid eligibility partly based on income and assets, and the introduction of a long-term care insurance program could delay people from having to use personal savings to pay for this care. Therefore, the program could result in delayed eligibility for Medicaid, leading to higher savings. However, given the complexity of the interactions between income, assets, and Medicaid eligibility, we chose not to address this issue. We instead assumed any individual who would qualify for Medicaid without the long-term care insurance program would continue to qualify with the program.
Appendix 1: Data sources
To construct this model, we used the following data sources:
- 2004 Survey of Income and Program Participation (SIPP) Wave 5
- 2004 National Nursing Home Survey (NNHS)
- Society of Actuaries (SOA) Individual Disability Experience Commission (IDEC) Incidence and Continuance Tables
- Disability Transition Matrices as constructed by Eric Stallard, Robert Yee, and Ken Manton from the National Long Term Care Survey (NLTCS)
- Social Security Trustees Report population estimates for 2000-2085
- Social Security Administration Life Tables
- Social Security Administration Estimated Number of Fully Insured Workers
- 2008 American Community Survey (ACS)
- 2008 Census Bureau Current Population Survey (CPS) Annual Social and Economic Supplement (ASEC)
- Long-Term Economic Projections from the Congressional Budget Office (CBO)
- Center for Medicare and Medicaid, Office of the Actuary National Health Expenditures
- 2008 MetLife Mature Market Institute The MetLife Market Survey of Nursing Home and Assisted Living Costs
- 2008 MetLife Mature Market Institute The MetLife Market Survey of Adult Day Services and Home Care Costs
- 2009 LifePlans Inc. Cognitive and Functional Disability Trends for Assisted Living Facility Residents
- 2009 Kaiser Commission on Medicaid and the Uninsured Medicaid Home and Community-Based Service Programs: Data Update
Appendix 2: Description of key data sources
Of the data sources listed in Appendix 1, there are four that provided the inputs to allow us to construct our incidence, prevalence, and continuance factors that are key to the Model. We describe each of these data sources in greater detail below.
2004 Survey of Income and Program Participation (SIPP), Wave 5
- Use in the Avalere LTC Model: SIPP provided estimates of prevalence of disability in the community setting, as well as Medicaid coverage and amount of paid help
- Source: US Census Bureau
- Design: Annual survey of 14,000 to 36,700 households
- Demographics: U.S. civilian noninstitutionalized population over the age of 15
- Measuring disability: To construct our estimates of severe disability, we relied on the following data in SIPP:
- Count of activities of daily living (ADL) that the person needs the help of another person. ADLs include transfer, bathing, dressing, walking, eating, and toileting.
- We included an individual under cognitive impairment if they were not included under the ADL definition and SIPP indicated they had “Alzheimer’s disease or any other serious problem with confusion or forgetfulness”.
- We included an individual under mental retardation/development disability if they were not included under the ADL definition or the cognitive impairment definition and SIPP indicated the person had a mental retardation or a developmental disability such as autism or cerebral palsy.
2004 National Nursing Home Survey (NNHS)
- Use in the Avalere LTC Model: NNHS provided estimates of prevalence of disability in the nursing home setting
- Source: US Centers for Disease Control
- Design: Survey conducted every 5 years of 1,174 nationally representative nursing homes
- Demographics: All current residents of US nursing homes
- Measuring disability: To construct our estimates of severe disability, we relied on the following data in NNHS:
- Count of activities of daily living (ADL) that the person needs limited, extensive, or total assistance. ADLs include transfer, bathing, dressing, walking, eating, and toileting.
- We included an individual under cognitive impairment if they were not included under the ADL definition and NNHS indicated the person was either in specialty unit within the nursing home dedicated to Alzheimer’s disease or dementia or if the person had an impaired decision making ability.
- We included an individual under mental retardation/development disability if they were not included under the ADL definition or the cognitive impairment definition and NNHS indicated the person was either directly admitted to the nursing home from an intermediate care facility for the mentally retarded (ICF/MR) or the person was in a specialty unit within the nursing home dedicated to MR/DD.
Society of Actuaries (SOA) Individual Disability Experience Commission (IDEC)
- Use in the Avalere LTC Model: We used the IDEC tables to construct disability continuance estimates for the under-65 population
- Source: Society of Actuaries
- Design: Claim incidence and termination study of twelve individual disability income carriers. Claim experience used in analysis covers 1990-1999 time period.
- Demographics: Covered lives from twelve long-term care insurance carriers, representing approximately 64% of the US individual disability income market in 1995.
- Notes on IDEC: The IDEC tables are presented in spreadsheet format, which allow users to select key variables concerning the population in question, including age, gender, occupation, type and nature of disability, and any elimination period. Once a user selects these options, the Model provides estimated continuance rates until the person reaches the age of 65. We gathered these continuance rates for each age between 18 and 65 and each gender, allowing for any type of severe disability, requiring a 90-day elimination period (to exclude any short-term disabilities), and setting occupation to a equal mix of class 1 (white collar, professional, executive occupation) and class 2 (supervisory and other skilled clerical and skilled technical people). We then created a single continuance estimate for each age by weighting the output by the overall population.
National Long-Term Care Survey (NLTCS)
- Use in the Avalere LTC Model: We used transition matrices prepared by Eric Stallard, Robert Yee, and Ken Manton using different waves of the NLTCS to construct disability continuance estimates for the over-65 population
- Source: NLTCS is administered by the US Census Bureau and published by the National Institute of Aging and Duke University
- Design: The NLTCS is a longitudinal survey that tracks the same individuals every 5 years to determine health and functional status, health expenditures, Medicare service use, and the availability of personal, family and community resources for care giving.
- Demographics: NLTCS surveys a sample of over 35,000 US residents over the age of 65. As individuals in any survey drop from the sample due to mortality, NLTCS replaces with new individuals.
- Notes on NLTCS: Stallard, Yee and Manton have prepared a series of analyses using the subsequent waves of the NLTCS to estimate disability incidence, prevalence, and continuance. The continuance estimates are largely presented by the authors as transition matrices, which we have used in the Model to construct overall continuance estimates.
References:
Public Health Service Act, 42 U.S.C. 201
Cohen, M.A., Shi, X., and Miller, J.S. 2009. Cognitive and Functional Disability Trends for Assisted Living Facility Residents. Society of Actuaries.
Stallard, E. 2008. Estimates of the Incidence, Prevalence, Duration, Intensity and Cost of Chronic Disability among the U.S. Elderly.Society of Actuaries.
Manton, K.G., Corder, L.S., and Stallard, E. 1993. “Estimates of Change in Chronic Disability and Institutional Incidence and Prevalence Rates in the U.S. Elderly Population From the 1982, 1984, and 1989 National Long Term Care Survey.” Journal of Gerontology: Social Sciences 8(4): S153-66.
Kemper, P., Komisar, H.L., and Alexcih, L. 2005. “Long-Term Care Over an Uncertain Future: What Can Current Retirees Expect?” Journal of Inquiry 42: 335-350.
Wang, H., Zhang, L., Yip, W., and Hsiao, W. 2006. “Adverse selection in a voluntary Rural Mutual Health Care health insurance scheme in China”.Social Science and Medicine 63: 1236-1245.
De Donder, P., and Hindriks, J. 2008. “Adverse selection, moral hazard and propitious selection”. Journal of Risk and Uncertainty 38(1): 73-86.
Belli, P. Year.How Adverse Selection Affects the Health Insurance Market. Harvard School of Public Health.
American Health Insurance Plans. 2007 Who Buys Long-Term Care Insurance: A 15-year Study of Buyers and Non-Buyers, 1990-2005.
Burman, L.E., and Johnson, R.W. 2007. A Proposal to Finance Long-Term Care Services Through Medicare With an Income Tax Surcharge. Working Paper No. 8, Georgetown University Long-Term Care Financing Project.
Manton, K.G., Corder, L., and Stallard, E. 1997. Chronic disability trends in elderly United States populations: 1982-1994. Proceedings of the National Academy of Sciences 94: 2593-98.
American Academy of Actuaries. 1999. Long-term Care: Actuarial Issues in Designing Voluntary Federal-Private LTC Insurance Programs.Public Policy Monograph.
Social Security Administration. 2008. Characteristics of Disabled-Worker Beneficiaries Receiving Workers’ Compensation or Public Disability Benefits Compared With Disabled-Worker Beneficiaries Without These Additional Benefits. Office of Policy: Office of Disability and Income Assistance Policy. Research and Statistics Note No. 2008-01.
Oster, E., Shoulson, I., Quiad, K., and Dorsey, E.R. 2009. Genetic Adverse Selection: Evidence From Long-Term Care Insurance and Huntington Disease. National Bureau of Economic Research: Working Paper 15326.
Stallard, E., and Yee, R.K.W. 1999. Non-Insured Home and Community-Based Long-Term Care Incidence and Continuance Tables. Prepared for the Non-Insured Home and Community Experience Subcommittee of the Long-Term Care Experience Committee.
Rupp, K., Davies, P.S., and Strand, A. 2008. Disability Benefit Coverage and Program Interactions in the Working-Age Population. Social Security Bulletin: Vol 68, No. 1.
Spillman, B.C. 2005. Assistive Device Use Among the Elderly: Trends, Characteristics of Users, and Implications for Modeling. Prepared for Office of Disability, Aging and Long-Term Care Policy, Office of the Assistant Secretary for Planning and Evaluation, U.S. Depart of Health and Human Services. Contract #HHS-100-97-0010.
Fang, H., Keane, M.P., and Silverman, D. 2008. “Sources of Advantageous Selection: Evidence from the Medigap Insurance Market”. Journal of Political Economy 116(2): 303-350.
Miller, J.S., Shi, X., and Cohen, M.A. 2008. Private Long-Term Care Insurance: Following an Admission Cohort over 28 Months to Track Claim Experience, Service Use and Transitions. Prepared for Office of Disability, Aging and Long-Term Care Policy, Office of the Assistant Secretary for Planning and Evaluation, U.S. Depart of Health and Human Services. Contract #HHS-100-02-0014.
Spillman, B.C. 2005. The Impact of Disability Trends on Medicare Spending. Prepared for Office of Disability, Aging and Long-Term Care Policy, Office of the Assistant Secretary for Planning and Evaluation, U.S. Depart of Health and Human Services. Contract #HHS-100-97-0010.
Greene, V.L., Lovely, M.E., Miller, M.D., and Ondrich, J.I. 1995. “Reducing Nursing Home Use Through Community Long-Term Care: An Optimization Analysis.” Journal of Gerontology: Social Sciences 50B(4): S259-268.
Purushotham, M. and Muise, N. 2006. Long-Term Care Insurance Persistency Experience. LIMRA International and Society of Actuaries.
Davey, A., Femia, E.E., Zarit, S.H., Shea, D.G., Sundstrom, G., Berg, S., Smyer, M.A., and Savla, J. 2005. “Life on the Edge: Patterns of Formal and Informal Help to Older Adults in the United States and Sweeden”. Journal of Gerontology: Social Sciences 60B(5): S281-288.
Freedman, V.A.,Crimmins, E., Schoeni, R.F., Spillman, B.C., Aykan, H., Kramarow, E., Land, K., Lubitz, J., Manton, K., Martin, L.G., Shinberg, D., and Waidmann, T. 2004. “Resolving Inconsistencies in Trends in Old-Age Disability: Report from the Technical Working Group”. Demography 41(3): 417-441.
Finkelstein, A., and McGarry, K. 2006. “Multiple Dimensions of Private Information: Evidence from the Long-Term Care Insurance Market”. The American Economic Review 96(4): 938-958.
Murtaugh, C.M., and Litke, A., 2002. “Transitions Through Postacuteand Long-Term Care Settings: Patterns of Use and Outcomes for a National Cohort of Elders.” Medical Care 40(3): 227-236.
Brown, J.R., and Finkelstein, A. 2008. “The Interaction of Public and Private Insurance: Medicaid and the Long-Term Care Insurance Market.” The American Economic Review 93(3): 1083-1102.
McNeil, J.M. 2000. Employment, Earnings, and Disability. Prepared for the 75th Annual Conference of the Western Economic Association International.
ElJay, LLC. 2008. A Report on Shortfalls in Medicaid Funding for Nursing Home Care. Prepared for the American Health Care Association.
Kaiser Commission on Medicaid and the Uninsured. 2009. Medicaid Home and Community-Based Service Programs: Data Update. Issue Paper #7720-03.
Mollica, R.L. 2009. State Medicaid Reimbursement Policies and Practices in Assisted Living. Prepared for the National Center for Assisted Living and the American Health Care Association.
2009 Overview of Assisted Living. A collaborative research project of the American Association of Homes and Services for the Aging; American Seniors Housing Association; Assisted Living Foundation of America; National Center for Assisted Living; and National Investment Center for the Seniors Housing and Care Industry.
The MetLife Market Survey of Adult Day Services & Home Care Costs: 2008. MetLife Mature Market Institute.
The MetLife Market Survey of Nursing Home & Assisted Living Costs: 2008. MetLife Mature Market Institute.
Notes
-
"Employed, with a job but not at work” is approximately 1 percent of the total population, and largely represents persons on temporary leave such as maternity.
-
This figure represents the unemployment rate in the 2007 ACS survey.
-
Johnson and Wiener, using the 2002 HRS, found approximately 27 percent of older people with severe disabilities were Medicaid eligible, and approximately 35 percent of older people with severe disabilities received paid home care.
-
As further explained in section VIII, we did not make any assumptions about delayed entry into Medicaid as a result of the program. If a participant in theAvalere LTC Model was estimated to have Medicaid as a payer, we assumed that person would continue to qualify for Medicaid benefits despite receiving benefits from the new federally run, long-term care insurance program.
Appendix N: September 22, 2010 Technical Experts Meeting
Appendix Na: Agenda, List of Participants, and Speaker Bios
CLASS Act Models Meeting
Agenda
September 22, 2010
9:00 am - 12:00 pm
Hubert H. Humphrey Building, Room 505A
200 Independence Avenue, SW
Washington, DC 20201
Contact: Marie Belt or Goldwyn Smith at 202 690 6443
9:00 - 9:15: Welcome and Introductions
- Richard Frank, PhD: Deputy Assistant Secretary for Disability, Aging and Long-Term Care Policy, HHS
9:15 - 9:45: Actuarial Research Corporation (ARC) CLASS Model
- John Wilkin: Senior Actuary, Actuarial Research Corporation
9:45 - 10:00: Review of the ARC CLASS Model
- Steve Goss: Chief Actuary, Social Security Administration
10:00 - 10:15: Questions and Comments on the ARC CLASS Model
10:15 - 10:45: Avalere Long-Term Care Policy Simulator (LTC-PS)
- Anne Tumlinson, Senior Vice President, Avalere Health
- Eric Hammelman, Director, Avalere Health
10:45 - 11:00 – Review of the Avalere LTC-PS
- Richard Johnson: Senior Fellow and Director, Program on Retirement Policy, Urban Institute
11:00 - 11:15: Questions and Comments on the Avalere LTC-PS
11:15 - 12:00: Structured Discussion
- Do the models incorporate realistic assumptions related to incidence/continuance of functional limitations and trends in disability? Are the assumptions related to the prevalence and trends in cognitive impairment reasonable?
- Are there alternative approaches to modeling the relationship between CLASS participation and premiums?
- Is potential adverse selection adequately incorporated into the models?
12:00: Adjourn
CLASS Act Models Meeting
September 22, 2010
Jim Baumgardner
Deputy Assistant Director
Health and Human Resources Division
Congressional Budget Office
2nd & D Sts., SW
Washington, DC 20515
202-225-0810
Jim.baumgardner@cbo.gov
Jason Brown
Acting Director
Office of Economic Policy
U.S. Department of the Treasury
Jason.brown@do.treas.gov
202 622 1757
Rick Foster
Chief Actuary
Centers for Medicare and Medicaid Services
US Department of Health and Human Services
Richard.Foster@cms.hhs.gov
Richard Frank, PhD
Deputy Assistant Secretary
Disability, Aging and Long-Term Care Policy
HHS / ASPE
200 Independence Avenue, SW
Room 424E
Washington, D.C. 20201
202-690-6443
Richard.Frank@hhs.gov
Stephen Goss
Chief Actuary
Office of the Chief Actuary
Social Security Administration
6401 Security Blvd.
Rm. 700 Altmeyer Bldg
Baltimore, MD 21235
410-965-3000
Stephen.C.Goss@ssa.gov
Robert Gordon
Associate Director for Education, Income Maintaince and Labor
Office of Management and Budget
rgordon@omb.eop.gov
Sherry Glied
Assistant Secretary for Planning and Evaluation
U. S. Department of Health and Human Services
200 Independence Avenue, SW Room 415-F
Washington, D.C. 20201
202-690-7858
sherry.glied@hhs.gov
Kathy Greenlee
Assistant Secretary for Aging
Administration on Aging
Department of Health and Human Services
Washington, DC 20201
202-401-4541
Kathy.Greenlee@aoa.hhs.gov
Stuart Hagan
Senior Analyst
Health and Human Resources Division
Congressional Budget Office
2nd & D Sts., SW
Washington, DC 20515
202-226-2666
Stuart.hagan@cbo.gov
Eric Hammelman, CFA
Senior Manager, Data Analytics
Avalere Health LLC
1350 Connecticut Avenue, NW, Suite 900
Washington, DC 20036
202.207.1303 (tel)
202.467.4455 (fax)
ehammelman@avalerehealth.net
Richard W. Johnson
Senior Fellow and Director, Program on Retirement Policy
The Urban Institute
2100 M Street, N.W.
Washington, D.C. 20037
Voice: 202-261-5541
rjohnson@urban.org
Jake Kaplan
Program Examiner
Income Maintenance Branch
Office of Management and Budget
202-395-7798
Jacob_Kaplan@omb.eop.gov
Ruth Katz
Associate Deputy Assistant Secretary
Disability, Aging and Long-Term Care Policy
HHS / ASPE
200 Independence Avenue, SW
Room 424E
Washington, D.C. 20201
202-690-6443
Ruth.Katz@hhs.gov
Richard Kronick
Deputy Assistant Secretary
Office of Health Policy
HHS / ASPE
200 Independence Avenue, SW
Room 447D
Washington, D.C. 20201
202-690-6870
Richard.Kronick@hhs.gov
Helen Levy
Senior Economist
Council of Economic Advisers
hlevy@cea.eop.gov
(202) 395 - 1410
Christen Linke-Young
Office of Health Reform
US Department of Health and Human Services
Hubert Humphrey Building 749-D
202 690 5488
Christen.Young@hhs.gov
Timothy P. Love
White House
Timothy_P_Love@who.omb.eop.gov
Barbara Manard, PhD
Vice President
LTC/Health Strategies
American Association of Homes and Services for the Aging
202.508.9835
BManard@aahsa.org
Randall Mariger
Senior Economist
Office of Economic Policy
U.S. Department of the Treasury
Randall.mariger@do.treas.gov
202-622-0542
William Marton
Director
Division of Disability and Aging Policy
HHS / ASPE
200 Independence Avenue, SW
Room 424E
Washington, D.C. 20201
202-690-6443
William.Marton@hhs.gov
Alexandre Mas
Alexandre_Mas@omb.eop.gov
(Assistant) Emily Langner
Assistant phone: 202 395 1264
Assistant e-mail: elangner@omb.eop.gov
Gordon Mermin
Senior Economist
Office of Management and Budget
202 395 3423
Gmermin@omb.eop.gov
Don Moulds
Principal Deputy Assistant Secretary for Planning and Evaluation
U. S. Department of Health and Human Services
200 Independence Avenue, SW Room 415-F
Washington, D.C. 20201
202 690 7858
donald.moulds@hhs.gov
Emma Sandoe
Budget Analyst
U. S. Department of Health and Human Services
Assistant Secretary for Financial Resources
200 Independence Avenue, SW Room 529-G-50
Washington, DC 20201
202 690 6788
Emma.sandoe@hhs.gov
John Shatto, F.S.A.
Director, Medicare and Medicaid Cost Estimates Group
Office of the Actuary, CMS
410 786 0706
John.shatto@cms.hhs.gov
Samuel Shipley
Program Analyst
HHS / ASPE / DALTCP
200 Independence Avenue, SW, 424E
Washington, D.C. 20201
202-690-6443
Samuel.shipley@hhs.gov
Jack Smalligan
Branch Chief
Income Maintenance Branch
Office of Management and Budget
202 395 7759
JSmalligan@omb.eop.gov
Paul Spitalnic
Director, Parts C & D Actuarial Group
Office of the Actuary, CMS
410 786 2328
Paul.spitalnic@cms.hhs.gov
Anne Tumlinson
Senior Vice President
Avalere Health LLC
1350 Connecticut Avenue, NW
Suite 900
Washington, DC 20036
202 207 1314 (p)
atumlinson@avalerehealth.net
Pat Vinkenes
Program Examiner
Income Maintenance Branch
Office of Management and Budget
202-395-3602
PVinkenes@omb.eop.gov
John Wilkin
Senior Actuary
Actuarial Research Corporation
410 740 9194
jwilkin@aresearch.com
John Wren
Deputy Assistant Secretary for Planning, Policy and Evaluation
Administration on Aging
U.S. Department of Health and Human Services
Phone: 202-357-3460
John.Wren@aoa.hhs.gov
Robert Yee, FSA, MAAA
Director of Consulting Services
Strategic Health Management Corporation
272 Santa Paula Avenue
San Francisco, CA 94127
415-425-1980
bob.yee@shmcorp.net
CLASS Act Models Meeting
September 22, 2010
Speaker Bios
STEPHEN C. GOSS
Chief Actuary, Social Security Administration
Steve Goss is currently Chief Actuary at the Social Security Administration. Mr. Goss joined the Office of the Chief Actuary in 1973 after graduating from the University of Virginia with a Masters Degree in Mathematics. He graduated from the University of Pennsylvania in 1971 with a Bachelors degree in mathematics and economics. He has worked in areas related to health insurance as well as pension, disability, and survivor protection. Mr. Goss has written articles and actuarial studies on several topics and has made presentations and participated in panel discussions at numerous conferences. He has worked closely with members of the executive branch, members of Congress and their staff, and numerous commissions, as well as with private organizations. Mr. Goss is a member of the Society of Actuaries, the American Academy of Actuaries, the National Academy of Social Insurance, the Social Insurance Committee of the American Academy of Actuaries, and the Social Security Retirement and Disability Income Committee of the Society of Actuaries.
ERIC HAMMELMAN
AvalereHealth
Eric Hammelman, Director, provides data-driven analysis of the impact of various legislative and policy changes on the healthcare industry, with a specific focus on reimbursement for providers. Prior to joining Avalere, Eric was an Associate Analyst with J.P.Morgan, where he analyzed healthcare service companies and provided investment advice to institutional investors. He built financial and industry models for hospitals, nursing homes, dialysis, hospice, ambulatory surgery centers, clinical labs, inpatient rehab, long-term acute care, and physician groups. He also analyzed payment policies for each of these areas, including Medicare, Medicaid, and private payers.
Eric has a Bachelors of Music Performance from the University of Illinois at Urbana-Champaign. He also earned an M.B.A. from the Marshall School of Business (University of Southern California), as well as a Masters of Music Performance from the Mannes College of Music in New York, N.Y. Eric has passed all three levels of the CFA exam.
RICHARD JOHNSON
Urban Institute
Richard W. Johnson, is a senior fellow at the Urban Institute, where he directs the Program on Retirement Policy. An economist specializing in health and income security at older ages, he has written extensively about the availability and cost of health insurance in later life, particularly retiree health benefits, and has projected health care cost burdens for future generations of retirees. His long-term care research includes studies of family care’s impact on nursing home admissions, decisions to purchase private long-term care insurance, and the effects of demographic change on the future demand for paid care services. He has testified before Congress about the family costs of elder care and about gaps in health insurance coverage among older adults who have not yet qualified for Medicare. Dr. Johnson is also an expert on older Americans’ employment and retirement decisions. He received an A.B. from Princeton University and a Ph.D. from the University of Pennsylvania, both in economics.
ANNE TUMLINSON
AvalereHealth
Anne Tumlinson, Senior Vice President, leads projects and advises clients on a variety of post-acute and long-term care issues. These issues include private financing of long-term care, expansion of home- and community-based care, unification of the Medicare post-acute care benefit, integration of acute and long-term care, and reform of the U.S. long-term care system. Anne established the Post-Acute and Long-Term Care Practice at Avalere and, for several years, directed the firm's post-acute and long-term care portfolio of engagements with government, foundation, and commercial clients.
Prior to Avalere, Anne led Medicaid and long-term care policy for the federal Office of Management and Budget (OMB). Before joining OMB, Anne conducted health services research as a Senior Research Associate for LifePlans, Inc., and before that served as a legislative assistant on health and long-term care policy in the office of Rep. John Lewis (D-GA).
Anne holds a B.A. in Psychology from Furman University in Greenville, S.C., and a M.M.H.S. from the Heller School at Brandeis University.
JOHN WILKIN
Actuarial Research Corporation
John Wilkin has been with Actuarial Research Corporation since 1987 and he has been involved in long-term care insurance ever since. During the late 1980s and the 1990s, Mr. Wilkin worked with several insurance companies on designing, pricing, and reserving their long-term care insurance products. He also was an active member in several professional organizations concerned with the development of long-term care insurance, including the Society of Actuaries (SOA) Long-Term Care Section Council, the SOA Long-Term Care Experience Committee, the SOA Long-Term Care Valuation Committee, and the NAIC Ad Hoc Actuarial Group. Through the Experience Committee, his actuarial analysis of utilization rates from the 1985 National Long Term Care Survey was published in the Transactions, Reports 1988-89-90, through the Long-Term Care Valuation Committee he contributed to the Transactions XLVII article Long-Term Care Valuation Insurance Methods, and through the NAIC Ad Hoc Group he worked with a team of actuaries in the preparation of three reports to the NAIC on inflation protection and non-forfeiture benefits in long-term care insurance. Mr. Wilkin is responsible for the development of the ARC Long Term Care Pricing and Reserving Model, which was used by the U.S. Federal Office of Personnel Management (OPM) to help in the review of offerors of long-term care insurance to federal employees. Since 2000, Mr. Wilkin has done several studies on LTC insurance as well as served as an expert witness in class-action law suits involving the pricing of LTC insurance policies. Examples of the studies include one on claims experience by diagnosis at underwriting and another on the effect of lapse experience on coverage at time of claim. Mr. Wilkin is a Fellow of the Society of Actuaries and has a B.A. degree from The Johns Hopkins University.
Appendix Nb: Presentation Entitled "Actuarial Research Corporation's Long Term Care Insurance Model"
Actuarial Research Corporation’s Long Term Care Insurance Model
September 22, 2010
Actuarial Basis For Premium Formula
- For each issue age, projections of benefits, expenses, and premium income are made until age 100 (presumed to be the end of life for all individuals in the cohort).
- The Premium for each issue age is set so that the present value of benefits and expenses is equal to the present value of premium income.
Caveats
- No one can foresee how this program will operate, therefore premiums cannot be guaranteed to be adequate.
- Unknowns include level of participations, level of antiselection, and the effectiveness of regulations and procedures to determine “actively at work,” qualifications for benefits, and the effect of providing advocacy services
- Opinions on the reasonableness of the assumptions used to calculate premiums can be made.
- Premiums are indeterminate under variable indexing provisions.
Assumptions
- There will no subsidy across years of issue or age at issue, as is typical of social insurance.
- There is a subsidy for low-income individuals.
- Premiums are based on a set of assumptions:
- Interest Rates
- Mortality Rates
- Lapse Rates
- Expense Levels
- Utilization Rates
Source of Assumptions
- Interest rates and mortality rates are taken from the 2010 OASI Trustees Reports
- Lapse Rates are assumed to be zero.
- Premium load for expenses is assumed to be 3%.
- Utilization from survey data with several adjustments.
Utilization Assumptions: Data Sources
- For nursing home prevalence rates, incidence rates, average length of stay, and continuance table: 1985 and 1999 National Nursing Home Surveys.
- For home care ages 65 and over prevalence rates, incidence rates, average length of episode, and continuance table: 1982-1999 National Long-Term Care Surveys as analyzed by Eric Stallard and Bob Yee.
- For home care ages under 65 prevalence rates from the 2009 National Health Interview Survey. Average length of episode is extrapolated from the over 65. Continuance table is from the over 65. Incidence rates are derived from the formula:
- PR = IR * ALOS, which is equivalent to IR = PR / ALOS
Utilization Assumptions: Adjustments
- Utilization data are tabulated by age, gender, and ADL level
- Utilization of the under 65 are also tabulated by income level (our model has not yet incorporated all of these data)
- We assume that 25% of those with one ADL less than the requirement will receive benefits
- We calculate the number of new beneficiaries in the first year of benefit payment (2017) by using prevalence rates rather than incidence rates
Utilization Assumptions: Selection and Antiselection
- Selection: Provisions that result in participants being healthier than average (average is based on survey data for the whole population)
- The 3-year work requirement
- HIS data shows that ADL level of those that work (even at the rate of $1) have significantly lower utilization than the total population
- Antiselection: Those in need of services are the most likely to participate in an unsubsidized / voluntary program.
Utilization Assumptions: Selection
- Selection Factor: incidence rates in the last year of required work = 60% of ultimate
- Work is required for 3 out of the 5-year vesting period
- Selection wears off over 10-year period
Utilization Assumptions: Antiselection
- Antiselection Factor (AF): A function of the participation rates and prevalence rates and assumed to reach ultimate value of 110% over 20-year period.
- Different factor at each age and sex.
Utilization Assumptions: Antiselection - Examples
- Example 1: participation & prevalence rates = 1%
- AF = 1/.01 = 100 (perfect antiselection)
- AF = 100^0.7 = 25.12 (imperfect antiselection)
- AF(5) = 11.49 (interpolated value at duration 5)
- Example 2: participation = 2%, prevalence = 1%
- AF = 1/.02 = 50 (perfect antiselection)
- AF = 50^0.7 = 15.46 (imperfect antiselection)
- AF(5) = 8.82 (interpolated value at duration 5)
Policy Options That Can Be Modeled
- Earnings requirement
- Years of work required (3)
- Level for participation (quarter of coverage = $1,090 in 2009)
- Level for subsidy (poverty line = $10,830 in 2009)
- Benefit trigger (ADL requirements)
- Dollars per day of benefit including indexing options
- Indexing of premium
- Waiver of premium while in claim status
- While in nursing home
- And / or while in home care
- Deductible period
- Lifetime maximum
Premium Sensitivity
- Final set of assumptions for calculating premiums have not yet been determined.
- Premiums are very sensitive to some assumptions:
- Subsidy
- Participation rates
- Income requirements
- Premiums also can be sensitive to waiver of premium and indexing.
Premium Sensitivity to Low Income Subsidy
- Data on workers by earnings levels for 2009 Current Population Survey.
- Roughly 28 million workers above QOC ($1,090) and below poverty ($10,830) in 2009 dollars.
- Roughly 130 million above poverty.
- Premiums for unsubsidized group is affected more by the dependency ratio than by utilization.
| Low Income PR | High Income PR | Dependency Ratio (Total / Unsubsidized) |
|---|---|---|
| 10% | 1% | 3.2 |
| 10% | 6% | 1.4 |
| 20% | 1% | 5.3 |
| 20% | 6% | 1.7 |
Premium Sensitivity to Participation Rates
- Participation rates affect the level of antiselection assumed in the model, and thus the level of the premiums.
- The level of the premiums affects the level of antiselection.
- Once premium levels go above private insurance alternatives, participation drops and antiselectionincreases.
- We use participation rates that vary by age and gender according to the patterns from the Federal and California LTC programs.
Premium Sensitivity to Income Requirements
- Model determines selection effect from NHIS data that shows ADL levels crossed with income levels.
- Model varies selection factor by level of earnings requirement and by years of work requirement.
- Selection effect stays in place until work requirement stops.
- Utilization rates decline as income requirement increases.
Premium Sensitivity to Waiver of Premium
- Waiver of premium is also affected by the dependency ratio (beneficiaries divided by premium payers).
- If beneficiaries do not pay premiums, then the burden on premium payers increases.
- This provision interacts with the level of antiselection to destabilize premiums.
- Example: ratio of beneficiaries to premium payers when beneficiaries are 10% and 50%:
- 10% / 90% = 11% vs 50% / 50% = 100%
- Note: Ceiling on premium with waiver of premium = infinity. Ceiling on premium with no waiver of premium = $1500 (=$50/day for 30 days).
Premium Sensitivity to Indexation of Premium
- If benefits are indexed to inflation and premiums are level, premiums are highly sensitive to the actual level of inflation
- Example: The difference between 2.8% inflation and 5.6% inflation could more than double premiums at younger ages and increase them by 50% at older ages.
- Indexing premiums at the same rate as benefits greatly reduces the sensitivity, but does not eliminate it.
- Example: The difference between 2.8% inflation and 5.6% inflation could increase premiums at younger ages by 25% and increase them at older ages by 15%.
| Parameter | Premium SENSITIVITY to an Increase in parameter |
|---|---|
| Low-Income Subsidy | + + + + + |
| Participation Rates (much more sensitive at low participation rates) | - - - |
| Income Requirement (while reducing low income group and sheltered workshop workers) | - - - - - |
| Income Requirement (while above low income group and sheltered workshop wage levels) | - |
| Waiver of Premium (while in nursing home) | + |
| Waiver of Premium (while in home care, but effect compounds with antiselection) | + + + |
| Indexing of Premium | - - - - |
| Lapse | - - - |
Appendix Nc: Presentation Entitled "The Long-Term Care Policy Simulator Model"
The Long-Term Care Policy Simulator Model
September 22, 2010
Avalere Health LLC
Presentation Purpose and Agenda
- The purpose of this presentation is to describe an approach for estimating the premiums for a voluntary, public long-term care insurance program.
- Agenda
- Provide brief project background
- Summarize overall modeling approach
- Highlight key issues/challenges
- Adverse selection
- Enrollment rates
- Benefit qualification
- Questions/Discussion
Description of the Long-Term Care Policy Simulator (LTC-PS)
Purpose
- In 2009, before health reform, The SCAN Foundation funded construction of a model that would estimate average premiums for four different long-term care public insurance reform approaches
Proposals to Model
- Mandatory or voluntary social insurance programs
- Either a cash benefit or services benefit
- Note: None of the proposals would allow underwriting other than age. Users could elect to require attachment to the workforce
Basic Overview
- The LTC-PS is an Excel-based spreadsheet model
- It has an inputs page that allows users to vary the key policy options
- The model then calculates the premiums necessary to have an actuarially-balanced program over 75 years
| LTC-PS Input Options | ||||||||
|---|---|---|---|---|---|---|---|---|
| Choice | Benefit Description | Population Covered | Minimum Premium Payment Period | Length Of Benefit | Elimination Period | Cross Subsidies To Low-income Individuals1 | Program Costs Funded Through Premiums2 | |
| Mandatory | Cash Benefit | $50 / day | Workers and Their Spouses May Participate | Zero Years | Lifetime | Zero Days | 150% of the Federal Poverty Level | 100% |
| $75 / day | ||||||||
| 5 Years | ||||||||
| $100 / day | 75% | |||||||
| 4 Years | 100% of the Federal Poverty Level | |||||||
| Voluntary | Services Benefit | No Cost Sharing | All Over Age 18 May Participate3 | 5 Years | 90 Days | |||
| 3 Years | ||||||||
| $500 Deductible. 20% Copayment | 1 Year | No cross subsidy | 50% | |||||
| Options shaded in yellow are the closest to CLASS legislative specifications but there are a number of key CLASS inputs that were not included in this model | ||||||||
|
||||||||
Key Differences between the LTC-PS and the CLASS Act
- CLASS prohibits non-working spouses from enrolling, but LTC-PS does not
- CLASS has a minimum income and work requirement, but LTC-PS simulates that anyone at work regardless of income could enroll
- CLASS applies the work and income requirement to low-income individuals, but LTC-PS simulates full participation by anyone below the subsidy threshold
- CLASS has a variable ADL trigger for payment of benefits, but the LTC-PS simulates a trigger of slightly below 2 ADLs
- CLASS has a minimal $5 premium for students and low-income individuals, but the LTC-PS has a $0 premium for low-income individuals and excludes students
- CLASS-Medicaid dual beneficiaries retain some of their CLASS payout1, but LTC-PS simulates entire payout going to Medicaid
- CLASS has level premiums once a person enrolls, but LTC-PS uses inflation-adjusted premiums for all enrollees
- CLASS has the ability to require payment of premiums by enrollees receiving benefits, but LTC-PS simulates enrollees will either be paying premiums or receiving benefits, not both
- Public Health Service Act, §3205(c)(1)(D)(i) and (ii) specify that institutional and certain HCBS Medicaid beneficiaries retain 5 percent and 50 percent of their CLASS payouts.
Model Overview
Model Description
- We use an incidence and continuance model
- Track enrollees by age
- Model incidence and continuance of disability to determine when a person becomes disabled and how long he or she remains disabled
Data Sources
- Point-in-time surveys for prevalence of disability in the community (Survey of Income and Program Participation, American Community Survey, Current Population Survey) and in nursing homes (National Nursing Home Survey)
- Longitudinal survey for continuance rates among elderly aged 65+ (National Long Term Care Survey) and actuarial data for continuance rates among disabled aged 18 to 65
- Data Issues
- No national, longitudinal data for disability across age spectrum
- Aggregation of data from multiple surveys
- No single accepted method to estimate adverse selection
Model Overview
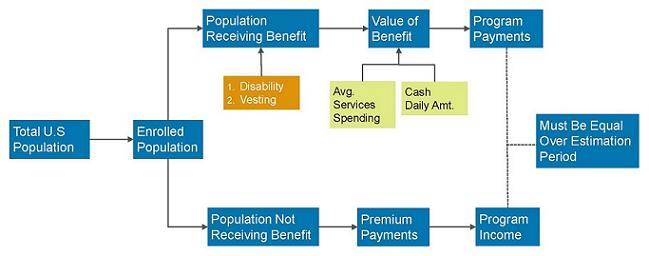
Modeling Enrollment: Population and Program Eligibility
- We use Social Security estimates of the total population by age through 2085.
- Eligibility can be extended to:
- All workers: we estimate attachment to workforce from American Community Survey.
- All over age 18: we exclude people currently disabled unless they are currently working (regardless of reported income).
- We estimate 5 to 7 percent of people with 2+ ADL disabilities in the community setting are currently working (approximately 400,000 people).
Modeling Enrollment: Participation
- We modeled participation using a points system
- We constructed a points system based on plausible upper and lower bounds for participation.
- Options that reduce cost, like adding a deductible or elimination period, or reducing benefit amount or length, increase participation
- Typical enrollment rates for CLASS like program: 12 to 18 percent
- We age-adjust participation rates
- Participation at age 50 is same as overall estimate
- Participation increases at a 2 percent growth rate for individuals aged over 50
- Participation decreases at a 1 percent growth rate for individuals aged under 50
We plan on refining the participation methodology for ASPE using assumptions about employer adoption and demand elasticity
Participation by Age*
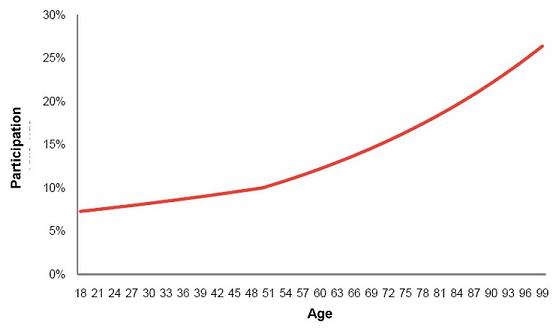
* Assumes 10 percent average enrollment
Modeling Enrollment: Vesting
- We estimate compliance with the 5 year vesting period using SSDI vesting as an analog
- We do not model the effect of lapses
- In our Excel-based model, we only need to know the percent of people in any given year that would be eligible to receive benefits
- Ineligibility could be related to vesting or lapses
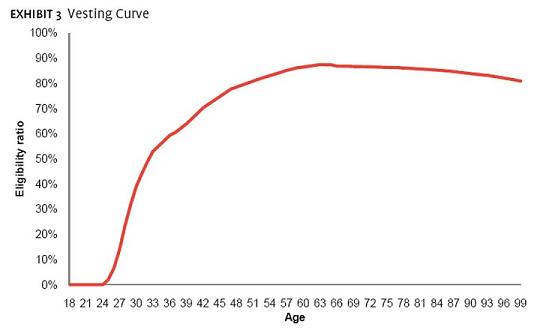
Modeling Disability: Prevalence
- We estimated prevalence from:
- 2004 SIPP for community setting
- 2004 NNHS for institutional setting
- We collected data on percent of individuals in each setting with:
- Only 1 ADL
- 2 or more ADLs
- 3 or more ADLs
- We assumed 50 percent of individuals with only 1 ADL would become eligible for the program
- Any individual in a nursing home with only 1 ADL would be eligible
- 48 percent of individuals in the community with only 1 ADL would be eligible
- We also adjust the SIPP data to account for individuals in an assisted-living facility
- Only the 65+ population
- We add these people to the ‘institutional’ estimates
- Shifts approximately 700k people from the community to institution estimates
Modeling Disability: Continuance
- To estimate continuance, or how long someone remains severely disabled, we used two data sets
- Over age 65: transition matrices from National Long Term Care Survey1
- Under age 65: continuance tables from IDEC survey2
- Non-continuance can be caused by two factors: mortality or improvement in condition
- Tend to see improvement at younger ages: these individuals are returned to the population eligible to pay premiums
- Mortality is higher for all ages of disabled individuals compared to non-disabled individuals
- We required non-continuance to always be at least as high as age-specific mortality from SSA
- Stallard, E. and Tee, R.K.W. 1999. “Non-insured Home- and Community- Based Long-Term Care Incidence and Continuance Tables.” Society of Actuaries
- Society of Actuaries. 2005. “Experience Studies in Individual Disability.”
Modeling Disability: Incidence
- Incidence can be computed once we have estimated prevalence and continuance
- Prevalence T2 = Prevalence T1 + Incidence T2 - Non Continuance T2
- We constructed a single cohort of individuals at all ages and tracked them for 100 years to develop incidence rates
- Population as of 2000, according to SSA
- Used age-specific prevalence and continuance
- Applied age-specific mortality estimates from SSA to non-disabled population
- After computing incidence by age, we accounted for an expected decline in prevalence through 2025
- We modeled a 0.5% decline in age-specific prevalence until 2025, at which point we hold prevalence constant
- We also hold continuance constant, which results in a decline in age-specific incidence
- A debatable proposition
Modeling Disability: Adverse Selection
- We increased incidence of participants in the LTC-PS to account for adverse selection
- Enrolled population in voluntary program has higher disability than general population
- Under the extreme scenario, every individual who would develop disability within 5 years would enroll -- this is the “perfect knowledge” scenario
- For the LTC-PS, we assumed enrollment in the initial years was weighted 75% to perfect knowledge scenario
- This declines to 25% weighting within 10 years
- Mimics pent up initial demand with continuing adverse selection
- Impact of adverse selection much higher for low-enrollment options
2010 Incidence Curve Adjusted for Adverse Selection*
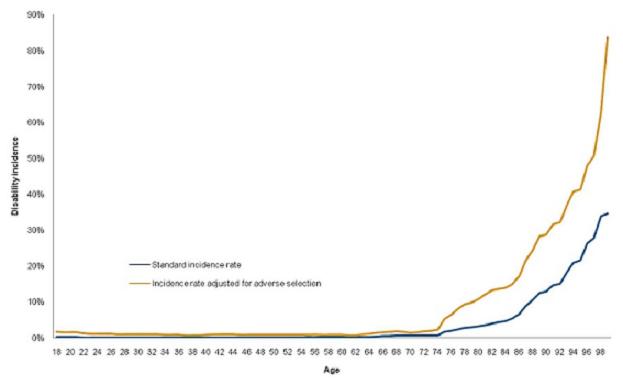
* Assumes 10 percent average enrollment
Modeling Costs: Medicaid Interactions
- We model the impact on Medicaid based on an assumption about participation by people who would eventually become Medicaid enrollees and the low-income subsidy.
- We model of Medicaid baseline using data from SIPP and NNHS, supplemented by information published by Brian Burwell and Josh Wiener.
- Even with a low-income subsidy, some future Medicaid beneficiaries would still be unlikely to enroll
- Not all future Medicaid beneficiaries are currently below the Federal Poverty Limit (FPL)
- The table below shows our estimated participation rates by people who would eventually become Medicaid beneficiaries by the different low-income subsidy levels.
- We apply these participation rates to our Medicaid baseline to develop estimates of Medicaid savings.
| Premiums | None | 100% FPL | 150% FPL |
|---|---|---|---|
| <$50 | 25% | 50% | 75% |
| $50-80 | 20% | 45% | 70% |
| $81-100 | 15% | 40% | 65% |
| $101-120 | 10% | 35% | 60% |
| $121-150 | 5% | 30% | 55% |
| >$150 | 0% | 25% | 50% |
Limitations of the Model
- Disability estimates: The data sets used have somewhat different ways of measuring disability
- Participation rates: Estimating participation for such a novel program is complex. Participation will be driven by many factors, premiums being a large one. Our points system is an approximation.
- Adverse selection: Estimating adverse selection is complex. We followed a method used by actuaries and the CBO. However, there is considerable debate among researchers.
- Impact to Federal budget: Interactions with the federal budget, specifically around the tax implications of the program, are beyond the current scope of the model.
Questions and Answers
Appendix Nd: Presentation Entitled "Comments on 'the Long-Term Care Policy Simulator Model'"
Comments on
“The Long-Term Care Policy Simulator Model”
Richard W. Johnson
Urban Institute
CLASS Act Models Meeting
September 22, 2010
What Does Avalere LTC Policy Simulator Model Say About CLASS?
- Plan parameters
- only workers may participate
- 5-year vesting
- $50/day lifetime cash benefit
- No elimination period
- those in poverty pay zero premiums
- premiums cover all costs
- Model output
- participation rate = 15% (approx)
- avg monthly premiums = $116 (in 2010)
Generic Model Structure
- Establish pool of eligible participants
- Set benefits and premium schedule
- Identify those who choose to enroll
- Model their receipt of benefits
- Check that premiums cover costs
- Iterate
Avalere Developed a Cell-Based Model
- Start with SSA population forecasts
- Use 2007 ACS data to compute number of workers by age
- Assign enrollment rate based on benefits that plan provides
- more generous plan reduces participation (because it raises premiums)
- Estimate benefits received by enrollees
- attempt to account for adverse selection
- Set premiums to cover benefit payments
Participation Rates Seem Somewhat Arbitrary
- Assign points based on plan parameters
- Assume participation rates increase with number of points
- More generous plans get fewer points, because they charge higher premiums
- exception: low-income subsidy
- Participation rates range from 5% to 35%
- where do these rates come from?
- Implicit assumption is that enrollees minimize cost, not maximize utility
Participation Rates Increase with Age
- Increase participation rates by 2% per year above age 50 (not pct. points)
- Decrease participation rates by 1% for each year below age 50
- Example
- age 30: 16%
- age 50: 20%
- age 65: 26%
- age 90: 36%
- Should participation rates in CLASS increase in retirement?
| Examples of Participation Rates at Age 50 | |||
|---|---|---|---|
| (1) | (2) | (3) | |
| Cash benefit | $100 | $75 | $50 |
| Length of benefit | lifetime | 3 yrs | 1 year |
| Vesting | none | 5 yrs | 5yrs |
| Waiting period | none | none | 90 days |
| Eligibility | all | all | workers |
| Subsidy level | none | 100% pl | 150% pl |
| Funded by govt | 0% | 25% | 50% |
| Participation rate | 5% | 20% | 35% |
Adverse Selection
- Economists assume that people who will use more services will be more likely to purchase coverage
- Assumes policyholders have private knowledge of their disability risk
- Problem is likely to be especially severe in program that does not underwrite risk
- Model assumes that those with “perfect knowledge” that they will need LTC risk enroll
- In the long-run (10 years after program inception) assume that 25% of population has perfect knowledge
- In short-run, assume 75% has perfect knowledge
Model Limitations
- No role for income in the enrollment decision
- Does not account for heterogeneity in the population
- income and disability are correlated
- Does not account for population changes over time (other than age)
- i.e., income growth
- How will automatic enrollment affect enrollment?
DynamicMicrosimulation Modeling Is an Alternative to the Cell-Based Approach
- Start with a nationally representative sample of the population
- Age population year by year
- Estimate equations of disability onset and duration
- Estimate equations of program enrollment
- Feedback to check that premiums cover benefit payouts
| Relative Merits of Cell-Based vs. Dynamic Microsimulation Apporaches | ||
|---|---|---|
| Cell-Based | Dynamic Microsim | |
| Tractability | X | |
| Transparency | X | |
| Development cost | X | |
| Projecting chars. of future population | X | |
| Capturing heterogen. of population | X | |
Summary
- The Avalere LTC model carefully simulates plan participation and costs
- May be best option currently available to model CLASS
- But it relies heavily on assumptions that have not been thoroughly tested
- Alternative approaches would be expensive to develop
Appendix O: Actuarial Report on the Development of CLASS Benefit Plans
for
Kathy Greenlee
Assistant Secretary for Aging
Administration on Aging
Bob Yee, FSA, MAAA
CLASS Office Chief Actuary
Department of Health and Human Services
Robert.Yee@hhs.gov
Gregory Kissel, ASA, EA, MAAA
Senior Actuary
Office of Personnel Management
Greg.Kissel@opm.gov
September 20, 2011
Purpose and Disclosure
This report describes our development of the proposed CLASS benefit plans in the Office of CLASS. It is written for the general audience with a basic knowledge of the CLASS Act1.
The CLASS Office was given the task to develop benefit plan alternatives that are:
- Actuarially sound and sustainable over a 75-year period,
- Based on reasonable assumptions as certified by Chief Actuary of the Centers for Medicare & Medicaid Services,
- Legally permissible, and
- Marketable to a large number of employers and employees.
Provisions of the CLASS Act form the basis for development of the proposed benefit plans. We believe we have adhered to relevant professional actuarial guidelines and recommendations2.
This report represents the contributions of its authors to plan development process as of its release date. Final proposed benefit plans may be different from the ones discussed here. We have sought guidance from experts in the CLASS Office. Interpretations and views expressed in this report are the professional opinions of its authors3 and may not be consistent with the opinions of the Office of CLASS, the Office of the General Counsel or the Department of Health and Human Services (HHS). Throughout this report, the word “we” refers to the authors of this report and on one else.
Reasons for CLASS
There is an unmet need to protect working Americans against the high costs4 of long-term care services5. Few of them have financial protection against the significant risk of eventually using the services6. This is especially true for workers with modest income who are vulnerable to become future Medicaid beneficiaries.
Insurers have been exiting or curtailing their long-term care insurance business. Recent development in the interest rate environment, accounting standards and regulation on the use of genetic information suggest a dim future. Well publicized significant premium increases have shaken consumers’ confidence in the product. Currently only three major insurers7 are actively offering group long-term care insurance. Opportunity is therefore limited for working Americans in seeking cost-effective protection against the risk of high long-term care costs.
CLASS is designed to be a voluntary, affordable long-term care insurance program for the American workers. It will provide a modest level of benefits to help qualified beneficiaries to live independently in the community. Beneficiaries will have considerable freedom to dictate the appropriate services and supports for themselves. Benefits are paid entirely through enrollees’ premiums without any taxpayer subsidy. Compared to private insurance, the CLASS Program has been transparency and accountability because of its certification process.
Long-term care is as much a problem for the young as it is a problem for the old. With most working Americans unprotected, Medicaid will continue to be the payer of last resort for their future long-term care services. This is an escalating burden particularly for our future generation of taxpayers who are becoming fewer in number compared to the older generation8. Enrollment in the CLASS Program could delay and reduce future dependence on Medicaid. Thus the CLASS Program promotes individual responsibility and less reliance on government for support.
The Class Program has the potential to have a seminal effect on long-term care financing in this country. It could significantly increase public awareness of the risk of long-term care. Future Medicaid spending could materially be reduced if more Americans seek insurance protection, whether through CLASS or the private market. Tight controls on Medicaid long-term care spending become more acceptable when programs such as CLASS are available as an alternative. The CLASS Program could be the catalyst for a much needed national aging policy to improve the quality of life for older Americans.
The CLASS Act Statute
Due to the lack of conference reports and other explanatory documents, we effectively relied only on the text of the statute for benefit plan design.
The following provisions in the statute have significant influence on benefit plan design:
-
The CLASS program is a voluntary insurance program9. An insurance program allows a group of individuals to share the risks by collecting premiums from everyone and paying benefits only to those for whom the risk materializes. An insurance program operates under the law of large numbers. That is, the individuals in the program form a sufficiently large homogeneous group with relatively the same risk so that the actual claim results will be close to that assumed in the premiums. In a voluntary insurance program, the group must be relatively free of asymmetric information where certain insureds have better information about their risk of claiming benefits than the insurer. Otherwise, premiums will be high and unattractive to lower risk individuals. This situation would render the program unworkable.
-
Actuarial soundness is mentioned in at least in four occasions10. Adapting from a number of sources11, we have developed the following working definition for the CLASS Program:
A CLASS benefit plan is actuarially sound if, at any time, the balance on the trust fund, all future anticipated premiums and investment income, in aggregate, are adequate to provide for all reasonable and appropriate anticipated future costs, including plan benefits, benefit-related expenses, marketing and administrative expenses.
Several comments regarding this definition:
- Actuarial soundness is a prospective determination of projected income covering projected outgo with a certain comfort level.
- This definition implicitly satisfies the stipulation that no public funds can be used to pay CLASS benefits12.
- An actuarially sound benefit plan encompasses not only the benefit design that makes if sound but also other rules of the plan that serve to minimize moral hazard13. These rules affect the procedures for enrollment and reenrollment, conditions for enrollment and benefits, etc.
The statute also requires the CLASS Program be sustainable over a 75-year period such that their will be sufficient funds to pay future benefits. A plan that is deemed actuarially sound would provide good assurance (though not absolute guarantees since future events are uncertain) that the Program is sustainable. On the other hand, a program where the projected income barely covers the projected expenses may be sustainable but it is not actuarially sound because there is insufficient margin for future unfavorable experience.
-
The CLASS Independence Advisory Council will recommend a benefit plan for designation as the CLASS Independence Benefit Plan that “best balances price and benefits while optimizing the probability of long-term sustainability of the Program”14 (emphasis added). These two phrases epitomized the value proposition of CLASS to the American workers. In order for the Plan to be attractive to the consumers, it needs to be competitive with private insurance. Ensuring long-term sustainability will result in stable premiums for the enrollees.
-
While the statute prescribes certain conditions and restrictions, in no way does it define a specific plan. In fact, the statute requires at least 3 actuarially sound plan choices for consideration15. The statute thus anticipates alternative plan designs to be developed within its confine. Being actuarially sound does not satisfy all of the design goals. The designated plan still needs to be attractive to the consumers.
-
No underwriting can be used to determine premiums or to prevent enrollment16. Taken together with the voluntary nature of the Program, this restriction poses potential adverse selection risk.
-
The Secretary is authorized to set premiums, designate the benefit plan and promulgate regulations regarding enrollment, benefit eligibility, claim payment, etc.
Implementing the statute involves interpretations that may be subject to challenges. Certain provisions in the statute appear to be in conflict with each other, specifically, with the premise of voluntary insurance. We discuss this further in the section below on Adverse Selection.
What CLASS Is Not
The statute explicitly contemplates an actuarially sound plan that “maximizes the probability of long-term sustainability”. Thus it would appear that, if a designated plan exists at all, it will unlikely be an entitlement program.
Similar to social insurance such as Social Security and Medicare, the CLASS Program is administered by the federal government, the benefits and eligibility criteria are established by statute, the accounting of income and expenses is through a trust fund (CLASS Independence Fund) and premiums are paid by the participants. Nevertheless, major distinctions exist between social insurance and the CLASS Program. Participation in social insurance is either compulsory or it is heavily subsidized so that the majority of eligible individuals choose to participate. Social insurance is generally not fully funded in that monies are not set aside to ensure that all future promises will be met. CLASS is voluntary and the majority of the eligible workers are not expected to enroll. It is fully funded by premiums collected from the enrollees, except for the initial program start-up costs.
In certain aspects, CLASS is closer to private insurance than social insurance. Both private insurance and CLASS are fully funded by premiums. Both call for margins in the premiums to protect from a certain level of unfavorable experience17. The CLASS trust fund acts like a reserve fund for private insurance; both funds are backed by the credit-worthiness of the insuring entities.
In order to be competitive with private insurance, one perceived gap between CLASS and private long-term care insurance may need to be narrowed. That is, benefits in private insurance are contractual; they can be altered only if the insurer is insolvent. This is not the case in the CLASS Program. However, we believe a hierarchy could possibly be established to adjust premiums and other factors first before adjusting benefits.
Adverse Selection
A precept of the statute is that no underwriting, other than age, can be used to set premiums or prevent enrollment into the Program. Because the CLASS Program is voluntary, there is a strong potential for the Program to attract a disproportionate number of high risk workers who are likely to need long-term care services. This adverse selection violates the principle for a sound insurance program. Private long-term care insurance generally requires underwriting and therefore can expect to have lower claim costs than that for the CLASS Program. Other things being equal, CLASS premiums may have to be considerably higher than the premiums for private insurance.
If CLASS premiums are uncompetitive against private insurance’s premiums, healthy workers who can meet underwriting requirements would likely pick private insurance over the CLASS Program. As well, employers have a fiduciary responsibility to look out for the best interest of their employees. They would also decline to offer CLASS if the premiums are too high. This exacerbates the problem of a higher than expected concentration of unhealthy enrollees. There may also be organized efforts to encourage workers with functional limitations to enroll. All these factors make it very difficult to determine the correct premiums.
The following simple example illustrates the challenge in such a situation. Suppose there is a 10% chance for a normal worker to have a toothache during a single year. An insurance plan will pay $1,000 if the participants have a toothache. This plan is offered on a voluntary basis to a group of workers in which 5 of them already had a toothache. Suppose there are only 6 workers enrolled. Ignoring expenses, the range of possible premiums that are expected to be sufficient to meet the benefit obligation is as follow:
| Number of Workers with Toothache Enrolled |
Premium |
|---|---|
| 0 | (5 x .10% x $1,000) ÷ 6 = $83 |
| 1 | (1 + 5 x 10%) x $1,000 ÷ 6 = $250 |
| 2 | (2 + 4 x 10%) x $1,000 ÷ 6 = $400 |
| 3 | (3 + 3 x 10%) x $1,000 ÷ 6 = $550 |
| 4 | (4 + 2 x 10%) x $1,000 ÷ 6 = $700 |
| 5 | (5 + 1 x 10%) x $1,000 ÷ 6 = $850 |
Estimating premiums with this high level of variability is akin to gambling with the enrollees’ funds; gambling is clearly not the role of the insuring entity.
Initial premiums with likely be inadequate if the enrollment of healthy workers turns out to be lower than was assumed in the pricing. Subsequent premiums would need to increase. This action would tend to drive out the healthy enrollees who can get lower premiums through private insurance. With fewer healthy enrollees, there may be more premium increases. This rate spiral can lead to program insolvency. Because of the potential for adverse selection, a number of experts have opined that the CLASS Program is unworkable.
In order to compete with private group long-term care insurance for enrollment, CLASS premiums need to be on par with the premiums for private insurance. Group long-term care insurance generally has a 65% loss ratio. That is, the present value of future benefits is projected to be 65% of the present value of future premiums18. The balance of 35% is essentially earmarked for profits and expenses. A realistic and reasonable projected loss ratio for the CLASS Benefit Plan is 80%19. If the CLASS premiums for the CLASS plan exactly matched private group long term care insurance’s premiums for identical features and benefits, the CLASS Program will have an approximately 23% (80% ÷ 65% - 1) claim allowance over private insurance that can be used to account for the adverse selection effect. The challenge is to control the impact of adverse selection within this allowance20.
Without any mitigation for adverse selection, premiums for an actuarially sound CLASS plan will need to anticipate that virtually every enrollee will qualify for benefits shortly after the 5 year vesting period. Thus the premiums will be set to pre-pay the benefits21. This scenario produces an estimated $3,000 monthly premium22. The Program will be sustainable even with a very small number of enrollees. Of course, there is virtually no market for it.
Thus, without control for adverse selection, there is little chance for success.
Plan Designs
At the beginning of the development process, we endeavored to generate a list of all possible designs we could think of. We ranked them into 3 groups:
- those that do not address adverse selection and have no market appeal,
- those that address adverse selection but have no market appeal, and
- those that have both23.
From the last group, we refined the concepts and came up with the following plan designs. They are presented from an actuarial, not legal, perspective.
Limited Initial Benefits
This plan pays a low benefit (for example, $5 daily) if claimed during the first 20 years and a regular benefit (for example, $50 daily benefit, indexed) otherwise. Because the benefit in the early years is quite low relative to the premiums, the Program may be less attractive to the high risk workers. Thus this approach can moderate adverse selection. The disadvantage of this design is that it may also be unattractive to the healthy workers, especially older workers who, as a whole, are closer to claim.
Phased Enrollment
Before discussing Phased Enrollment, it is helpful to review the types of risk mitigation practices typically used in the group long-term care insurance market. Insurers offer group coverage in the workplace with endorsement from the employers. Premiums are usually collected through payroll deduction. For large employee groups of over 500, insurers would generally offer guaranteed issue to full-time active workers during a limited enrollment period (1-2 months). Some form of underwriting is required for those enrolled outside of this period and for spouses and other immediate family members. New hires can enroll without underwriting during a short period following hire. Presumably, insurers are protected by the very limited window of opportunity for enrollment as opposed to a situation where the workers can join whenever it is to their advantage24. Enrollees tend to be white-collared workers who have available discretionary income for insurance and who are generally in better health status than the average worker. To date, premium rate increase filings for group long-term care insurance are uncommon. The overall claim experience appears to be close to the anticipated claim costs in the development of the premiums.
The statute specifies two methods for workers to voluntarily enroll. Workers can enroll either through their participating employers or through an alternative individual method. Individual enrollment is for the self-employed, individuals with more than one employer, and for those workers whose employers are not participating in the Program. The statute is silent regarding the manner and timing for implementing either method.
The Phased Enrollment design adopts certain risk mitigating practices from group long-term care insurance. Under this design, enrollments with be phased according to a pre-determined risk tolerance. Initial enrollments will first be limited to the group setting through employers with a specified minimum number of employees. The initial enrollment period will be 1 to 2 months. Subsequent enrollment periods will be indeterminate. This is similar to the current practice for guaranteed issue group long-term care insurance.
Such practice is workable in mitigating adverse selection because:
-
High risk workers cannot seek insurance. Only those whose employers participate can enroll.
-
Enrollment period is short. There is little opportunity for a working individual becoming unhealthy to enroll at will.
-
The relatively large size of the groups provides a spread of risk.
The alternative individual enrollment method allows any workers not included in group enrollments to sign up. Without a way to temper high risk workers to enroll as in the case for group enrollment, we expect most of adverse selection to come through this method. Accordingly, individual enrollment will commence in a controlled manner to ensure solvency of the Program.
Premiums will be set with a specific margin that provides for a reasonable allowance for individual enrollment in the future. The annually required actuarial analysis25 will specify the number of future individual enrollments.
The following is an example of how Phased Enrollment works. A 20% load is added to the premiums for CLASS specifically for expected higher claims through individual enrollments. Suppose we determined that enrollees from individual enrollment can be expected to be 5 times more likely to claim than those through group enrollment26. When the number of enrollees reaches 200,000 and provided that the claim assumption remains unchanged, we would allow up to 10,000 (= 200,000 x 20%/400%) new enrollees through individual enrollment.
Thus, under the Phased Enrollment design, the degree of adverse selection is rationed based on what is available to accommodate the expected higher claims. Individual enrollment starts when the group enrollment meets a pre-set threshold. We will allow a pre-determined number of workers to enroll during a limited individual enrollment period. In order to validate the adverse selection assumption, we plan to evaluate individual enrollees’ medical records but naturally would not use them to deny enrollment. Lessons learned from the evaluation will help us to devise subsequent individual enrollments, including enrollments of employees from smaller sized employers.
The advantage of this design is that the impact of adverse selection is controlled. Note that this design does not materially alter our expectation of the ultimate number of enrollees in the CLASS Program since we expect that the majority of enrollees would come from group enrollment anyway. Phased Enrollment therefore does not mean the CLASS Program will necessarily be small. The disadvantage is that the margins designated for individual enrollments could be depleted due to overall unfavorable experience of the Program. The timing and the allotted number of individual enrollments are not guaranteed. There may be public pressure to expand individual enrollments thus causing harm to the Program. Finally, additional legal analysis will be required to determine whether the Phased Enrollment plan must be available to all employers.
Temporary Exclusion
This design aims to control the impact of adverse selection through the claim process rather than the enrollment process. Under this design, no benefits will be paid during the first 15 years27 of an individual’s enrollment if the qualifying ADL (Activities of Daily Living) or cognitive deficiencies can be determined to be the result of a prevailing serious medical condition that existed at the time of enrollment. At the time of enrollment, the enrollees will have access to a list of such conditions and acknowledge that they understand this restriction, if applicable. This list would be similar to the list of uninsurable conditions in private insurance’s field underwriting manual. We will not collect medical information at time of enrollment. At time of claim, medical records will be reviewed to determine whether a serious medical condition existed at enrollment caused the deficiencies. If no determination can be made, or medical records are not available, we will pay the claim. From experience of the private group market, we expect that the majority of the enrollees will be relatively young (in their 40s). Because of this expectation, we believe the vast majority of beneficiaries with functional limitations during the first 15 years of their enrollment will have a medical origin, rather than due to frailty.
Qualifying deficiencies due to conditions not on the list or conditions developed after enrollment are eligible for benefits after the 5 year vesting period, assuming other benefit eligibility requirements have been met. This design puts the high risk enrollees on equal footing with the other enrollees, enabling the law of large numbers to work.
Temporary exclusion is a risk mitigating technique used in life and disability insurance. We expect claims under this design to be estimable even though they would still be higher than claims from guaranteed issue group plans.
The advantage of this design is that all workers are treated fairly under the principle that enrollees insure only their unknown risk. The degree of subsidization among the workers is expected to be acceptable. The disadvantage is that this design could be perceived as a pre-existing condition exclusion where the insured is denied coverage or permanently excluded from claiming under the condition. Covering pre-existing conditions is possibly workable in an insurance program where there is substantial participation (for example, over 80%) to spread the extra risk. It violates the insurance principle of homogeneity of the insured group in programs such as CLASS where participation is expected to be low (typically less than 10%)28.
Scheduled Increasing Benefits
This design is similar to the Limited Initial Benefits. If the enrollee qualifies for benefits, it pays a $20 daily benefit if claimed during the 6th years of enrollment. The $20 daily benefit increases by $6.50 each year of enrollment to an ultimate of $150 at the 26thyear and thereafter. The benefit will pay for a maximum of 36 months only. The intent is to discourage high risk individuals to enroll given the relatively low benefits in the early years. In order to comply with the statute, we believe the potential enrollees must choose between this design and the pre-paid plan as described in the Adverse Selection section.
In order to attract workers who desire a richer benefit, this design can work in conjunction with a private insurance offering. Together with coverage from the private plan, the total benefits of the package will pay a level $150 from the first year of enrollment. Thus the private plan will provide coverage during the vesting period of the CLASS plan and the coverage will decrease each year to no coverage after 25 years of enrollment. To provide inflation protection, all daily benefits described for this design will increase by 3% each enrollment year.
The advantage of this design is that the effect of adverse selection is controlled to a certain degree but not eliminated. To be actuarially sound, this design will probably be more expensive than private insurance. It will be a challenge to compete with the more straightforward $150 daily benefit private insurance plan. Another disadvantage is the complexity of the benefit schedule and the offering the pre-paid plan as well as the private insurance supplemental plan.
Actuarially Sound Plans
The above plan designs are not mutually exclusive. A plan combining these concepts can address the shortcomings of the individual design. According to the statute, the Secretary will present at least 3 actuarially sound plans to the CLASS Independence Advisory Council for review. The Council will recommend one of them to the Secretary for designation as the CLASS Independence Benefit Plan. For consideration, we propose the following 6 candidates for actuarially sound plans29, some of which are combinations of the plan designs presented above:
-
Phased Enrollment as described above.
-
Phased Enrollment with Temporary Exclusion for Individual enrollment.
-
Phased Enrollment with Limited Initial Benefit for Individual enrollment.
-
Temporary Exclusion as described above.
-
Scheduled Increasing Benefits as described above.
-
Pre-paid plan as described in the Adverse Selection section.
This proposal is tentative since we have not yet completed our plan development process which will include final premium determination and further legal clearance.
In order to ensure success of the CLASS Program, all designs will also need to pass the marketability criterion. For example, the pre-paid plan assumes that there is no barrier to prevent or discourage who might be attracted to the program. Such a plan can be made actuarially sound if we assume that virtually everyone enrolled will claim. Thus the premiums (estimated to be $3,000 per month) become that of a pre-paid arrangement. There will obviously be few enrollees.
Premium Illustration
The first 5 proposed plans are designed to mitigate the risk for adverse selection to a certain extent. Premiums for some of these plans can be made competitive with private insurance because the expense and profit savings could partially offset the anticipated extra claims.
Using comparable plan features, the following preliminary comparison illustrates the pricing position specifically of the Phased Enrollment plan relative to the offerings from three current group insurers30:
| Monthly Premium Illustration $50 Initial Daily Benefit - 5 Year Benefit Period - 30 Day Elimination Period 3% Annual Benefit Increasea |
||||
|---|---|---|---|---|
| Prudentialb Level Premium |
UNUMb Level Premium |
Genworth Level Premium |
CLASSc Initial Premium |
|
| 25 | $37 | $38 | $41 | $32 |
| 30 | $37 | $38 | $43 | $35 |
| 35 | $41 | $45 | $45 | $39 |
| 40 | $44 | $51 | $46 | $42 |
| 45 | $56 | $57 | $46 | $46 |
| 50 | $70 | $68 | $51 | $55 |
| 55 | $81 | $85 | $61 | $72 |
| 60 | $107 | $119 | $88 | $116 |
| 65 | $139 | $156 | $122 | $181 |
| 70 | $195 | $223 | $196 | $334d |
Note:
|
||||
The CLASS premium estimates for the Phased Enrollment design above are derived from Genworth’s net premium rates (net of anticipated expenses and profits) adjusted for:
- CLASS-specific expenses,
- a loading for adverse selection from individual enrollment,
- a margin for unfavorable experience, and
- an increasing premium methodology (see Increasing Premium section below).
Genworth’srates are chosen because we believe that the associated pricing morbidity, mortality, lapse and investment assumptions are the most current among the three insurers. It is important to recognize that these are preliminary illustrations of premiums, not final pricing. As noted in the Next Steps section, premium estimation needs to be further refined with experience claim data, among other steps.
Since the Phased Enrollment process is similar to the enrollment process for guaranteed issue group plans, we expect that claim assumptions for the CLASS plans to closely reflect the claim experience of that segment of the private group market. As discussed earlier, residual effect of adverse selection from private insurance’s guaranteed issued group enrollment is already embedded in group long-term care insurance’s claim experience and their premiums. There are approximately 1.5 million certificates of group long-term care insurance currently in force. A survey is underway to collect recent claim assumptions for guaranteed issue group plans from six insurers that have group in-force business. This data source can provide considerable confidence in setting claim assumptions for a number of the proposed CLASS plans.
Summary on Plan Design
Having a competitive CLASS plan also creates an incentive for private insurance to work side-by-side, rather than directly compete, with the CLASS Program. Co-marketing with insurers (discussed below in Marketing Considerations section) should reach more workers and provide a better spread of risk.
The proposed plans provide a potential array of choices to achieve the goals set forth in the statute: “balance price and benefits while optimizing the probability of long-term sustainability of the Program”31. As will be covered in the following section, besides adverse section, other issues need to be addressed such that the proposed plans are competitive and relatively free from moral hazard.
Other Design Issues
Daily Benefit Amounts and Triggers
At least two and up to six levels of benefits are required for the CLASS plan32. We propose two levels of benefits:
- $50 initial daily benefit at 2-3 ADL deficiencies
- $60 initial daily benefit at 4+ ADL deficiencies or cognitive impairment.
The amounts are chosen to discourage beneficiaries from claiming a higher level of disability than is warranted.
After the first year of an individual’s enrollment, the daily benefit will increase according to the increase in the Consumer Price Index for Urban Consumers (CPI-U, or simply CPI). This is more generous than the required benefit increase in the statute. One potential interpretation of the statutory language is that the increase in the benefit amount begins only when a beneficiary receiving benefits (that is, everyone who claims starts with a $50 daily benefit). Another potential interpretation is that the increase in the benefit amount starts from the 6th year of the CLASS Program. Note that increases in long-term care service costs have been historically higher than the CPI33. While this proposed benefit indexing method may not cover future inflation increases fully, it does help to keep the premiums affordable.
In addition to the ADL and cognitive impairment triggers, the Secretary is authorized to define another similar benefit eligibility trigger34. A possible third trigger would be one for mental illness. We believe the cognitive trigger already accommodates beneficiaries with mental retardation and some people with intellectual disability. As well, there is no established test similar to the standardized test for cognitive impairment. A standardized test with sufficient experience data is a highly desirable for estimating claim incidence rates in an insurance setting. Adding this third trigger at this time will make the CLASS Benefit Plan more expensive and increase the likelihood of inadequate premiums for the Program. If the Program shows favorable results, we should revisit this issue.
Reduced Benefit Amounts
According to the statute, benefits are “not subject to any lifetime or aggregate limit.”35 As private insurance has painfully learned, because beneficiaries have no incentive to preserve their benefits when there is no lifetime limit, unlimited benefit plans are expensive and risky. Most policies with lifetime benefits had significantly unfavorable experience. Premiums for lifetime benefits can be more than 50% higher than the corresponding premiums for a limited benefit period plan. The vast majority of group long-term care insurance policies today have a limited benefit period.
Our recommendation is to satisfy that statute by paying 100% of the daily benefit for the first five years and then only 20% thereafter, without limiting the aggregate amount of duration. This feature is intended to meet the requirements in the statute, keep CLASS premiums reasonably close to that for private insurance, and minimize one potential source for claim variability.
Cash Benefits
With regard to the form of benefits for the eligibility beneficiaries, the statute states the following (emphasis added): “Cash benefits paid into a Life Independence Account of an eligible beneficiary shall be used to purchase nonmedical services and supports that the beneficiary needs to maintain his or her independence at home or in another residential setting of their choice in the community…”36. Accordingly, we question whether payments of straight cash are required. Instead, cash equivalents in individual accounts could be used to purchase services and supports for the beneficiaries. The provisions of the statute appear to grant a great degree of autonomy to the beneficiaries on the choice and specifics of the services and supports.
We are not opposed to paying cash when it is appropriate. We believe it is difficult to determine whether it is appropriate or not. Sound insurance systems require a demonstration of a real loss. With cash payments as benefits without limitations, the enrollees are incented to claim whether there is a real loss or not. Unfortunately, we believe the statute gives conflicting messages regarding benefits. On one hand, it appears to limit the usage of the benefits. One the other hand, it appears to suggest cash payments without accounting for its use.
We utilized some of the learning from Cash and Counseling demonstration projects in the following proposed benefit structure. A counselor will be assigned to provide advice and assistance in planning of services and support, in particular, assistance in developing a plan of care. The cost of counseling will be part of claim administrative expenses and will not reduce the benefit amounts. Funds will be deposited into an individual account (the Life Independence Account) of the beneficiary on a weekly basis. Under the plan of care and the advice of the counselor, the beneficiary can direct available funds in the account to obtain the services and supports needed as long as they are not on a list of exclusions. This list would include items such as food, rent, liquor and luxury items. Within guidelines set by the CLASS Office, the counselor can make exceptions to the list. Associated with the account, the beneficiary will receive a debit card with which permissible services and supports can be purchased. Cash could not be withdrawn from the account via the debit card.
The CLASS Office will establish a process to train, monitor and evaluate the performance of the counselors. If beneficiaries need direct-paid care services (for example, unlicensed home health aide), they must use a fiscal manager to handle various employment and reporting requirements. The expenses associated with the fiscal manager will be deducted from the account balance. Specific activities and time spent by the paid direct care worker (including paid family members) must be fully documented.
Our goal is to strike a balance between beneficiary-directed benefits and the potential for induced demand from the perception of a free-flow of cash. According to the statute, “nothing in this title shall be construed as prohibiting benefits paid under the CLASS Independence Benefit Plan from being used to compensate a family caregiver…”37 We remain concerned regarding unwarranted payments to family members, in particular, the spouse. It is difficult to differentiate spouse’s free time from the time spent that needs to be compensated. Moreover, payments to a spouse are effectively cash to the beneficiaries. We are considering a reduced payment amount to a spouse (for example, $10 daily).
Regardless of our concerns, the proposed benefit structure is a significant departure from typical long-term care insurance benefits and should be viewed as an attractive feature of the CLASS plan.
Increasing Premiums
Long-term care insurance claim patterns are typically characterized by very few claims in the early years of a program and a significantly higher number of claims in the later years. Level premiums develop a relatively high fund balance in the early years when premiums exceed claims and expenses. This relationship reverses in later years.
For the CLASS Program, an increasing premium schedule provides several advantages:
-
Increasing premiums make the initial premiums lower than the corresponding level premiums. This may result in higher enrollments. This, in turn, increases the spread of risk and improves the chance for program sustainability.
-
An increasing premium plan provides less inflow to the trust fund in the early years than a level premium plan. The Program is subjected to less investment risk in matching the cash flow from assets with the cash flow from claim and expense obligations. Lower cash inflow also places less reliance on the expected relatively moderate fund returns available to the CLASS Program which is limited to an investment portfolio of Treasury Securities.
-
As increasing premium schedules are still uncommon in private insurance, they could give the CLASS Program a temporary competitive advantage.
From the enrollees’ perspective, an increasing premium schedule starts out significantly lower than the corresponding level premium but eventually exceeds it in later years. Lower initial premiums mean more efficient use of enrollees’ discretionary dollars. Premiums go up relatively in line with increases in plan benefits and general wages. Also, if enrollees decide to lapse, their cumulative outlays would be less than their cumulative outlays for level premiums for the same period of coverage. However, a potential disadvantage of an increasing premium schedule is that enrollees may not be able to afford the premiums in their later years when the enrollees’ income is relatively fixed. This can be addressed by exempting enrollees from scheduled premium increases after a certain age or period of enrollment.
One method of implementing an increasing premium schedule is to index the premium by the CPI in the same manner as the daily benefit amount increases by the index. This has the undesirable feature of ever-increasing premiums beyond the retirement years. Also, there will be uncertainty each year regarding the amounts of future increases.
We propose an increasing premium schedule with a 4% compounded annual increase that stops at age 70 (or after 5 years of enrollment, whichever is later). Premiums are level thereafter38. The 4% is chosen to provide an attractive entry price point to most enrollees. Other increasing premium schedules, such as indexing up to a specific age, are also under consideration.
After enrollment, if an enrollee finds the increasing premium schedule unaffordable, the enrollee will have the option to freeze future premium increases with a corresponding freeze in benefits. However, if premiums need to increase for other reasons (not related to the set annual increase), enrollees who have frozen their premiums will still be subject to those increases.
Other Plan Features
Waiver of premiums during the time a beneficiary is receiving benefits is not a statutory requirement but is common in private long-term care insurance. To be competitive, the CLASS plan should also include this feature, except when the Limited Initial Benefit provision applies.
Premium discount for spouse coverage is also common in private insurance in recognition that couples tend to have lower claim costs than singles. However, we believe that premiums can only vary by the age at enrollment in CLASS. A response to the premium discount would be to allow a couple to share their benefits. If a spouse is a beneficiary for more than 5 years, the benefit amounts would not be reduced (that is, to 20%) to the extent that the other spouse’s 5 year period has not been used up.
Certain group and most individual long-term care insurance plans have preferred risk discounts. We believe the CLASS Program has no apparent answer to this feature.
Expenses
The statute contains the following provision regarding administrative expenses (emphasis added): “In determining the monthly premiums for the CLASS program the Secretary may factor in costs for administering the program, not to exceed … an amount equal to 3 percent of all premiums paid during the year.”39 Expenses for protection and advocacy services and advice and assistance counseling are counted as administrative expenses40.
It is our opinion that there is no explicit restriction on the actual administrative expenses. Other than the initial roll-out, there is no guarantee of additional federal funding in support of these services. It would be unrealistic and undesirable to limit actual administrative expenses to only 3% of premiums (see our estimate below). Such a limitation would allow for little or no advocacy services or advocacy and assistance counseling. Claim payments might not be made on time. Enrollment might have to be curtailed. Experience monitoring might not be done to ensure timely premium adjustments in order to maintain solvency. Fraud and abuse prevention and monitoring might be limited or non-existent. These events would adversely affect the integrity and ultimate existence of the Program.
There is an important distinction between expense assumption in the premium development and actual future expenses which are not guaranteed to be realized. The process of determining premiums involves making assumptions regarding future claims, investment returns, persistency, as well as expenses. None of these assumptions can be guaranteed to hold during the lifetime of the enrollees in the Program. In order for the plan to be actuarially sound and the Program to be sustainable, these assumptions must be realistic. In selecting these assumptions, we anticipate that favorable experience for one of these factors may offset unfavorable experience for another such that the plan is overall actuarially sound. For example, favorable claim experience can offset unfavorable investment experience, leaving the Program actuarially sound overall. The statutory provision may necessitate choosing assumptions that are expected to be reasonable in the aggregate, with some conservative margin incorporated into the other assumptions to compensate for the aggressive 3% expense assumption.
Our current estimates of Program expenses expressed as percentages of premiums are as follow:
| Current estimates of Program expenses | |
|---|---|
| Enrollment and enrollee services | 5.5% |
| Claim administrative expenses | 10.0% |
| Counseling expenses | 3.0% |
| CLASS Office overhead | 1.5% |
| Total | 20.0% |
These expenses are derived from a survey of the pricing expense assumptions of group long-term care insurance and experience from the Federal Long Term Care Insurance Program. We expect that these expenses will rise according to the CPI. Because certain components of these costs are fixed or not a function of premiums, these percentages reflect the relatively low estimated average premium (under $1,000 annual premium) compared to other forms of insurance (for example, health insurance). Thus metrics from other insurance are not always directly transferrable to the CLASS Program.
The statute is silent on the use of investment returns from the trust fund. Because premiums collected are expected to exceed benefits and expenses in the early years, we expect considerable build-up of the balance in the trust fund. Investment returns from the trust fund are a source of revenue in addition to premiums. This revenue can be used to cover expenses.
Rather than modeling expenses solely as a percentage of premiums, a more appropriate set of expense assumptions would delineate the following:
- fixed expenses,
- expenses that vary by the number of enrollees,
- expenses that vary by the number of beneficiaries and the length of the claims, and
- expenses by vary by premiums.
Compared to this simplistic assumption based on premiums alone, this approach will minimize the likelihood of actual expenses exceeding expected expenses due to incorrect estimation of the average premium per enrollee.
Minimum Earnings Requirement and Nominal Premium
Under the statute, eligible beneficiaries must meet a minimum earnings requirement for 3 out of the first 5 years of enrollment equal to the amount of wages to be credited with one quarter of Social Security coverage41. This amount is $1,120 for 2011. However, the Secretary is authorized to make exceptions to this rule for certain population42. A low minimum earnings requirement allows enrollment of low-income workers who, as a group, are generally in poorer health43.
Furthermore, the statute requires a $5 nominal monthly premium for enrollees whose income is below the poverty line or who are full-time students under age 2244. This provision poses a potential threat to the financial viability of the CLASS Program. Without any mitigation for adverse selection, this is a tremendous incentive for a poor worker, who is near or already met the benefit triggers, to enroll. The ‘returns’ in the form of benefits (approximately $18,000 a year for the first year and indexed higher thereafter) far exceed the ‘investments’ of 5 years of $5 monthly premiums ($300). Because other enrollees will be subsidizing the poor, the overall premiums will need to be higher than without this subsidy. This adds to the competitive issue with private insurance. In addition, estimation of the appropriate premiums will not be reliable due to the unpredictable mix of nominal and regular premiums.
In order to mitigate this threat, raising the minimum earnings requirement for certain enrollees so that it is always above the poverty level could be explored. This should be somewhat effective in controlling adverse selection by those who expect to receive a high level of benefits for very little premium.
As stated above, the Secretary is authorized to promulgate regulations on exceptions to the minimum earnings requirement for certain populations. Under the Phased Enrollment plan design, those enrolled through individual enrollment are certainly a population that needs special attention since most of the adverse selection is expected to come from this group. Under the Temporary Exclusion design, the potential problem is less severe but not entirely eliminated. In either case, raising the minimum earnings requirement on this group would help. In addition, since it is not explicitly prohibited, defining “actively employed” to require a minimum number of work hours at time of enrollment can also help mitigate adverse selection. Finally, there should be a specific regulation to prevent companies from forming for the sole purpose of enrolling employees into the CLASS Program.
Reenrollment after Lapse
For reenrollment after a lapse from the CLASS Program, the statute prescribes separate treatments based on the time period between lapse and reenrollment:
- less than 90 days,
- 90 days to 5 years, and
- over 5 years45.
Potential for gaming exists for reenrollment after 90 days. For lapse period between 90 days and 5 years, the statute merely requires 2 years of continuous payments (of premiums for a new enrollee at the same attained age at reenrollment) and the initial 5 year vesting period before claiming. This encourages a ‘skip-and-go’ scheme where an enrollee would lapse, reenroll within 5 years from lapse, pay a premium, lapse again, and reenroll permanently only when his or her health deteriorates. If the lapse period is over 5 years, a similar but slightly less devious gaming opportunity also exists if no control is in place.
We propose the following rules in order to treat the reenrolled individuals and the in-force enrollees equitably. If the lapse period is less than 90 days, payment of due premiums is required to maintain enrollment. If the lapse period is between 90 days and 5 years, the individual must:
- Pay all back premiums except for the first lapse,
- Pay future premiums based on the attained age at reenrollment, and
- Meet the minimum earnings requirement again, or restart the 15 year exclusion period if the plan included Temporary Exclusion.
If the lapse period is over 5 years:
- Meet the minimum earnings requirement again,
- Pay future premiums based on the attained age, and
- Pay an actuarially sound premium that anticipates the enrollee will be very likely to claim or restart the 15 year exclusion period if the plan included Temporary Exclusion.
Minimum $50 Average Daily Benefit
The statute requires that the daily benefits paid be at least $50 on average as determined based on the reasonably expected distribution of beneficiaries receiving benefits at various benefit levels46. There are numerous ways to interpret this requirement. The $50 minimum could apply to each year’s claims and the averages could be determined on a present value basis. We have identified the following 6 methods of calculations that can fit this requirement:
-
At the beginning of each year, the present value of all expected future benefits from all enrollees divided by the total expected future days of claims from all enrollees.
-
At the beginning of each year, the present value of all expected future benefits of new beneficiaries during the past year divided by the corresponding total number of claim days.
-
At the beginning of each year, the present value of all expected future benefits of all beneficiaries during the year divided by the corresponding total number of claim days.
-
The total expected daily benefits available each year for all beneficiaries divided by the total expected number of claim days.
-
For each new beneficiary, the expected total future payments divided by the expected total number of days in claim.
-
The expected total future payments to each beneficiary for each 12 month period divided by the expected future number of days in claim during such period.
Another related issue is whether the minimum $50 is indexed by CPI or not. While it is clear that benefits are indexed after claim, it is not clear that benefits are required to be indexed while the enrollee is active past the first 5 years of the program, but not in claim status47. Note that we have proposed the benefit amounts starts indexing on the second year of an individual’s enrollment, which is the most liberal interpretation.
We take the position that the $50 minimum average is not indexed and elects the first calculation method described above. We plan to monitor actual results and adjust benefits if necessary in order to comply with the requirement.
Actuarial Modeling
The Office of the Assistant Secretary for Planning and Evaluation (ASPE) in HHS contracted Actuarial Research Corporation and Avalere Health to independently develop financial models for the CLASS Program. Both models can determine premiums and project financial results of various CLAS plan designs. Both models are capable of estimating the impact of adverse selection on the premiums and program results. This impact is made a function of the expected enrollment rate of all the workers in the workplace. The higher the enrollment rate, the lesser in the adverse selection effect and vice versa. Each model uses a different source of population data to estimate prevalence, incidence and continuance rates of the use of long-term care services. Entry age premiums are determined by equaling the present value of premiums with the present value of benefits and expenses over the expected lifetime of the enrollees. Program financial results are then derived from projections of the total premiums, investment returns, benefits and expenses. The two models produced consistent and similar results.
A technical expert panel comprised of economists and actuaries was assembled in September, 2010 to provide inputs and comments to the model construction. Another panel convened in June, 2011 to discuss model assumptions and alternative CLASS plan designs. These meetings, together with the results from the models, have been helpful in formulating the direction of the CLASS Office regarding plan designs.
Subsequent to the expert panel meetings, the HHS actuaries and actuaries from the Social Security Administration met in late June, 2011 to review plan design alternatives. This group agreed that certain plans, designed to mitigate the adverse selection risk (Phased Enrollment, for example), can be actuarially sound and attractive to the consumers.
Marketing Considerations
Product design and marketing go hand-in-hand together. Without an attractive product, marketing efforts would be fruitless. Consumer expectation and competition set the requirements for a marketable product design. We believe certain proposed plan designs and the proposed features described in this report have the ingredients for an attractive product. It remains to be seen how the designated plan can be successfully marketed in the worksite marketplace.
There are approximately 140 million workers in the United States. The market in the worksites can be roughly divided into 3 categories: large employers with over 5,000 employees, medium-sized employers with 1,000 to 5,000 employees and the remaining are small employers. There are approximately 8,500 employers with more than 1,000 employees. Included are public employee groups. These three categories deserve distinctive marketing approaches. Workers to be enrolled through individual enrollment would also need special attention.
We intend to assist in developing marketing tactical plans with the intention to leverage the CLASS Program’s position in the following areas.
Product Differentiation
The most distinguishing feature of the CLASS plan will be the benefit features. Most private insurance’s benefits are rule-based where limits and restrictions are specifically designated to control claim costs. Recognizing that each beneficiary’s needs are unique, CLASS benefits are beneficiary-driven. Beneficiaries can expect to have greater control on how benefit dollars are spent than in private plans.
A relatively novel feature is the increasing premium schedule. We believe it has a clear advantage over level premium plans because of its low entry price point. Compared with many group long-term care insurance programs where the option for benefit increases requires increasingly expensive premiums (commonly known as Guaranteed Purchase Option), the scheduled premiums in CLASS are known in advance and level in later ages. Thus CLASS offers more affordable inflation protection because there is no price pressure during retirement.
Lastly, unlike private insurance, CLASS plan’s benefits will vary by the level of disability.
Existing Group Plans
Approximately half of the large employers already have group long-term care insurance in place. A significant number of them no longer enroll workers. This can present an opportunity for the CLASS Program to be the successor insurer for future enrollments. CLASS can be the sole insurer by offering an optional number of units of insurance, with a $50 daily benefit as one unit. Alternatively, CLASS can partner with a private insurer to offer a packaged program.
Relationship with Private Insurance
The CLASS Program can compete directly against private insurance or work in concert with it. As a competitor in the private insurance’s space, the CLASS Program can offer coverage of multiple units of a $50 initial daily benefit. However, CLASS may be at a disadvantage because we currently have no intention to factor in significant marketing costs. Driven by commissions, insurance brokers would likely sell against CLASS.
As an alternative approach, the CLASS Program can focus on the low to middle income workers where private insurance has generally been unsuccessful. However, since they have limited discretionary income for insurance, enrollments will likely be low. Moreover, it is our impression that claim experience in other types of insurance has been generally unfavorable for these workers.
A better approach would be for private insurance to be a supplemental plan to the CLASS plan. The CLASS plan would provide the first layer of coverage. If the enrollee desires more coverage and is insurable (this may or may not be a requirement), he or she can purchase the private plan at the same time or in the future. The CLASS Program would benefit because the package will be co-marketed. The CLASS Program would gain a broader spread of risk by attracting higher income workers. Private insurance would benefit from the publicity and awareness generated by the CLASS Program.
A potential issue is having private insurance conforms to the CLASS plan’s features regarding benefit eligibility, benefits, etc. The CLASS Program can set up plan feature criteria whereby private plan can receive a “seal of approval” to market along with the CLASS plan. The list would include features that make the private plan resemble the CLASS plan as closely as possible. Another potential issue is the coordination of enrollment and premium administration.
Still another idea is for the insurers act as reinsurers for CLASS. Insurers would assume the morbidity risk while CLASS retains to persistency, investment return, inflation and expense risks. For the consumers, a partnership might be a stronger brand than the individual competing entities. The product would be seamless and premium rate stability could be enhanced. The CLASS Program would reduce its exposure for morbidity risk, get more enrollments than by it alone, and possibly achieve certain administrative cost savings. For the insurers, this partnership could ensure their future growth in the morbidity risk segment of their business where they have sufficient experience and is less problematic than other risks (for example, investment risk). It could revitalize their sales.
Internally, the reinsurance arrangement would be a yearly assessment of the actual claim experience to the expected claims in the premiums (with a long period of commitment). The arrangement would have the insurer pay claims up to, say, 160% of actual to expected claims. Beyond 160%, CLASS will have to absorb the risk, meaning there would likely be a premium rate increase at that point. Externally, the plan could possibly take on certain design differences by the insurers (such as benefit period, premium schedule, etc.) while keeping the basic CLASS features. We expect that the CLASS plan premiums will be slightly more expensive with this arrangement due to reinsurance costs.
Volume Illustration
Without a designated plan and a specific marketing strategy, it is premature to project volume for the CLASS Program. However, it would be useful to understand the financial implication of various scenarios.
We constructed a simplified model for this exercise. The model divides the current working population by size of employee groups. It assumes certain penetration rates by group size over a 10-year period based on the differences between expected ultimate penetration rates and current penetration rates. The expected ultimate penetration rates are based on other lines of voluntary insurance such as life and disability income insurance. The current penetration rates are based on private long-term care insurance data. From the penetration rates, enrollments are projected over a 10-year period. The model also contains assumptions regarding premium rates, expenses, benefits, investment returns and persistency. With these assumptions, we generated financial results for the first 10 years of the CLASS Program.
We developed results for 3 volume scenarios: minimum, expected and optimistic. In the minimum scenario, we solved for the minimum number of enrollments so that the Program is self-supporting by covering the cost of the CLASS Office staff and other expenses. The optimistic scenario depicts what may happen in an ideal market environment. The expected scenario is what may happen with a reasonable marketing effort but with no change to the current market environment.
| Minimum | Expected | Optimistic | |
|---|---|---|---|
| Number of Enrollees | 124,000 | 2,137,000 | 14,018,000 |
| % of Work Force | 0.1% | 1.5% | 10.1% |
| Fund @ End of 10 years ($B) | $0.6 | $11.8 | $66.3 |
The projected fund balance for the optimistic scenario is close to the Congressional Budget Offices’ (CBO) $72 billion estimate48. The CBO’s estimate was based on a $123 average monthly premium. In contrast, all 3 scenarios assumed an $80 average initial monthly premium. The optimistic scenario is possible, for instance, if there are cuts in Medicaid and Medicare long-term care benefits coupled with a tax incentive to encourage CLASS participation.
Actuarial Oversight
Actuarial oversight plays a significant role according to the statute. “The Secretary, in consultation with appropriate actuaries and other experts, shall develop at least 3 actuarially sound benefit plans as alternatives for consideration for designation by the Secretary as the CLASS Independence Benefit Plan”49.
With respect to actuarial analysis, the statute requires:
(III) “a statement of the actuarial status of the CLASS Independence Fund for the current fiscal year, each of the next 2 fiscal years, and as projected over the 75-year period beginning with the current fiscal year; and
(IV) an actuarial opinion by the Chief Actuary of the Centers for Medicare & Medicaid Services certifying that the techniques and methodologies used are generally accepted within the actuarial profession and that the assumptions and cost estimates used are reasonable;”50.
With regard to the CMS Chief Actuary’s responsibility, there is a wide range of what can be considered as ‘reasonable’ assumptions. Because of the sensitivity of results from changes in assumptions and the potential negative impact from mispricing, reasonableness should have a stringent connotation. The assumptions chosen for the CLASS plan should produce premiums that have a good chance to be stable. This applies both to assumption settings for the purpose of developing plan premiums and for assessment of actuarial soundness of the Program in the future.
Accordingly, we believe it is prudent that the process of assumption setting follows these guidelines:
-
Recognizing the extreme difficulty in estimating the effect of adverse selection, plan designs should avoid the potential for adverse selection and moral hazard as much as possible.
-
Assumptions must be chosen with extreme care and after considerable deliberation. Obtain as much relevant experience as possible from multiple sources. Appropriate credibility standards should be followed.
-
Include margins for adverse deviation in the assumptions. Use sensitivity testing of projected financial results to evaluate the margins.
Pricing Risks
It should be noted that long-term care insurance programs are characterized by low incidence rates and relatively high benefit amounts. Claim costs are typically low at the early ages of the enrollees but increase substantially at later ages beyond retirement. The typical time to claim from enrollment is over 10 years. Consequently, small changes in assumptions regarding future events will have a large effect on premiums. As experience from private long-term care insurance has revealed, the likelihood for misjudging future costs is significant.
Even though efforts will be made to mitigate adverse selection and to use private group insurance data as a base for claim assumptions, several mispricing opportunities remain:
- The impact of adverse selection for the CLASS Program may not be identical to that for guaranteed issue group long-term care insurance.
- Long-term interest return and future benefit inflation rate are difficult to forecast.
- The induced demand due to payments to family members, especially spouses, is largely unknown.
- The additional claims due to Temporary Exclusion over the base claim assumption has not been quantified.
- The $5 subsidized premium has not been completely removed.
- Possibilities exist for organized efforts to enroll workers with functional limitations.
Next Steps
We will continue our actuarial work in two phases. We will complete plan development first and then turn our attention to plan implementation.
Development
- Conduct a survey of long-term care insurance experience on group business,
- Obtain legal clearance on plan designs and features,
- Assist in finalizing proposed plan features,
- Assist in developing marketing strategic and tactical plans, including potential for co-marketing with insurers,
- Develop recommended premiums and project financial results,
- Perform sensitivity analysis including stochastic modeling, and
- Obtain external review on premium adequacy.
Implementation
- Assist in the rule-making process,
- Assist in the procurement process for administrative services,
- Develop a risk management process for Program implementation,
- Design a study of health status of enrollees,
- Develop an actuarial review process, and
- Develop a process to determine enrollees’ individual equity for the purpose of program termination or transfer.
Summary
We believe the CLASS Benefit Plan can be designed to be a value proposition to the American workers as the CLASS Act prescribed it. Much work remains to be done on plan development. The ultimate size of its enrollment will depend on marketing efforts to produce wide public acceptance of the CLASS Program.
Attachment 1: Adverse Selection Memo
Memo: Adverse Selection
From: Bob Yee
To: Kathy Greenlee
Date: April 27, 2011
In order to use the model developed under contract by ARC as the tool to develop premiums for CLASS, I have conducted a review of the model. It takes a portion of the general working population and determines the premiums that will be sufficient to pay future benefits and expenses. I find the model performs the projection calculations correctly given a set of specific assumptions. These assumptions of future events (claim rates, claim severity, mortality rates, lapse rates, expenses and investment yields) are derived mostly from population data and related experience in private long-term care insurance.
A major departure from the experience of private insurance is the effect of adverse selection arising from the lack of underwriting in CLASS. Private insurance provides little help as it is almost always underwritten. The ARC’s model expresses the adverse selection effect as a load to the normal expected claim costs without adverse selection. This load represents the anticipated higher proportion of unhealthy enrollees than in a normal mix of healthy and unhealthy workers.
The initial load is assumed to be a function of the enrollment rate and the prevalence rate of severely disabled (i.e. benefit qualifying) enrollees. The load decreases monotonically in time to no less than 10% (see attached exhibit for a more detailed description). While this formula is plausible, the resulting load to the normal expected claim costs is subjective and not supported by actual experience. Moreover, this is only one possible approach and may not even be correct. One can argue that the load may be increasing in the future when all unhealthy enrollees, initially qualified for benefits or not, are taken into account.
In order to illustrate the possible range of the adverse selection effect, I calculated the two end points of the range using the model. The monthly premium for an enrollee age 50 at time of enrollment is $60 with no adverse selection51. The corresponding monthly premium with full adverse selection (i.e. all enrollees are qualified for benefits at time of enrollment) is $564, or 9 times. It would even be much higher if claim severity is appropriately adjusted for these enrollees. The model generates a monthly premium of $93 using its adverse selection formula. This wide range bracketing the model premium suggests that the extreme sensitivity of the adverse selection assumption needs to be considered when developing the CLASS premiums.
Our task at hand is not merely to produce ‘best-guess’ premiums from a set of assumptions. The proposed plan(s) must be actuarially sound. In conjunction with other provisions, the CLASS Act imposes a rather severe condition for actuarial soundness. That is, the CMS actuary must certify that the assumptions associated with the premiums are reasonable in order to ensure that the CLASS program is sustainable over 75 years.
In practice, this is perhaps a more formidable task than the corresponding financial oversight in private insurance. From a solvency perspective, private long-term care insurers are typically multi-lined insurers and their solvency is spread over other lines of business, such as life insurance, annuities, disability insurance, etc. CLASS has only one line; it has no other apparent sources for support. Besides the various underwriting techniques to mitigate adverse selection, insurers control their risk exposure by phased roll-outs over a period of time and by adjusting premiums for newly issued policies. The CLASS program will be made available with limited restrictions through both individual and employer-based enrollment. It will be exposed to an unknown degree of adverse selection at the onset. Premium revision for future enrollees may be too little and too late to temper a larger premium deficiency already in the program. Quick premium revision may be seen as a sign of program instability, thus affecting subsequent enrollment results. CLASS essentially has only one shot to get it right.
As we have discussed previously, if the premiums are not set properly, the required premium rate increase may be substantial. In private long-term care insurance, large rate increases have often led to disastrous rate spirals. This is so because the increases are driving out the healthy insureds as premiums become increasingly unaffordable. This is an unacceptable scenario for CLASS.
The impact of adverse selection on claim experience is driven by the proportion of unhealthy enrollees in the program. Low enrollment generally means greater likelihood of an unfavorable proportion of unhealthy enrollees. It is a basic insurance principle that any sound insurance program has a good spread of risk. That is, there is an appropriate mixture of healthy and unhealthy enrollees to keep the premiums reasonable and stable.
Success in CLASS enrollment will largely depend on the price point and actions from private insurance. CLASS premiums must be attractive relative to the perceived value of the benefits. They will be compared to the respective premiums of private plans. We have previously shown that the premiums from the model are approximately twice that of private group plans with similar benefits. Moreover, agents will be inclined to sell against CLASS to the healthy workers. The proportion of unhealthy enrollees will be dependent on the mixture of individual and worksite enrollment. This proportion is subject to systematic encouragement for enrollment by certain organizations. Because the CLASS program allows individuals to enroll directly, it cannot effectively control the influx of unhealthy workers. The actual results for enrollment and proportion of unhealthy enrollees are highly unpredictable.
To illustrate this another way, there are approximately 200,000 workers with 2+ ADLS or cognitive impairment out of approximately 100,000,000 workers52. The normal annual claim rate is less than 2% but it is 100% for these severely disabled workers. Thus these workers are more than 50 times more likely to claim than the average workers in a given year. Suppose we decided that a 20% load53 for adverse selection is marketable against private insurance that has no such load. It would then take 22 healthy enrollees over a 10 year period to support one such disabled enrollee who can readily claim54. In 2010, there were approximately 187,000 policies issued under group long-term care insurance primarily to workers55. Even if we are wildly successful by enrolling half of this figure in one year, we can only allow up to 4,300 workers (less than 3% of the total) who have 2+ ADLs or cognitively impaired to enroll before the loaded premiums are inadequate.
Without a valid value proposition to the healthy workers, empirical evidence or any risk mitigating measures, there is great uncertainty in quantifying the adverse selection effect. With its theoretical formula, the ARC model is useful in demonstrating its impact on premiums. However, the model, by itself, should not be relied upon for prudent rate setting.
Uncertainty calls for conservatism. My current professional opinion is that the actuarially sound premiums for the basic CLASS plan in the statute, as well as the so called ‘Modified’ CLASS plan, are that of a pre-paid plan56.
It is not a coincidence that many experts have maintained that adverse selection is the major obstacle for the CLASS program. Any workable design must address it in order to receive certification as an actuarially sound plan.
Attachment 2: Plan Design Alternatives
| PLAN ALTERNATIVES Category I: Adverse selection issue not addressed |
||
|---|---|---|
| Design | 1 CLASS Basic |
2 Modified CLASS |
| Description | This is the plan closest to CLASS specs | This plan incorporated the proposed Senate amendments |
| Benefits | $50 daily benefit indexed to CPI every year only after claim and not while active 5 year waiting period |
$50 daily benefit indexed to CPI 5 year waiting period |
| Premium Schedule | Level premium | Premium indexed to CPI |
| Price Competitive | X | X |
| Benefit Attractive | X | ✓ |
| Compatible with Private Insurance | Not compatible | Not compatible |
| Remark | Premium will be unstable because private insurance will be much cheaper The stable premium will be at a pre-paid plan level |
Include higher earning threshold for first 5 years The stable premium will be at a pre-paid plan level |
| Note: All alternatives assumed that earnings and re-enrollment issues have been addressed. | ||
| PLAN ALTERNATIVES Category I: Adverse selection issue not addressed |
||
|---|---|---|
| Design | 3 Short & Fat Option |
4 Wellness Option |
| Description | Choice of CLASS Senate or a plan that provides substantial benefits for a short period | Choice of CLASS Senate or a plan that provides an incentive to stay out of claim |
| Benefits | $150 daily benefit indexed to CPI (e.g.) 2 year benefit period (e.g.) 5 year waiting period |
$150 daily benefit indexed to CPI (e.g.) If there is no prior claim, 1 year of premium is refunded for every 10 year period (e.g.) 4 year benefit period (e.g.) 5 year waiting period |
| Premium Schedule | Premium indexed to CPI | Premium indexed to CPI |
| Price Competitive | X | X |
| Benefit Attractive | ✓ | ✓ |
| Compatible with Private Insurance | Compete directly with private insurance but at higher premium | Compete directly with private insurance but at higher premium |
| Remark | Does not address disabled workers with < 2+ ADLs | Marginal improvement on anti-selection |
| PLAN ALTERNATIVES Category II: Adverse selection issue somewhat addressed but low product appeal |
||
|---|---|---|
| Design | 5 Rising Benefit Option |
6 Shadow Benefit |
| Description | Choice of CLASS Senate or a plan that provides minimal benefits during an initial period | Lower benefits for the fist 20 years |
| Benefits | $25 initial daily benefit indexed to CPI in years 1-10, $50 indexed for years 11-20, $150 indexed thereafter (e.g.) 4 year benefit period (e.g.) 5 year waiting period |
After 20 years, pays $50 indexed to CPI; pays $10 level during the first 20 years (e.g.) 4 year benefit period (e.g.) 5 year waiting period Sold in units of $50 daily benefit; can buy up to 8 units |
| Premium Schedule | Premium indexed to CPI | Premium indexed to CPI |
| Price Competitive | X | ✓ |
| Benefit Attractive | ✓? | X |
| Compatible with Private Insurance | Relying on private insurance to provide meaningful coverage to most workers | Opportunity for private insurance to supplement (if limited to 1 to 2 units) but compete directly if up to 8 units |
| Remark | More expensive package than private insurance Less anti-selection buy uncertain to the exact degree |
Less anti-selection but uncertain to the exact degree More attractive to younger workers who are tougher to convince to enroll |
| PLAN ALTERNATIVES Category II: Adverse selection issue somewhat addressed but low product appeal |
||
|---|---|---|
| Design | 7 Waiting Period Option |
8 Life Cycle Option |
| Description | Choice of CLASS Senate or a plan that has a 15 year waiting period (e.g.) | Choice of Delay Benefit plan or a Critical Illness (CI) and LTC combination plan |
| Benefits | Pays $50 daily benefit indexed to CPI 4 year benefit period (e.g.) 15 year waiting period (e.g.) Sold in units of $50 daily benefit; can buy up to 8 units |
Intended for young workers - enrollment ages < 50 CI requires simplified underwriting 100% of private critical illness insurance & 20% of CLASS LTC benefits until age 60, 100% LTC and 20% CI at age 65, graded in between (e.g.) Benefits indexed to CPI |
| Premium Schedule | Premium indexed to CPI | Premium indexed to CPI |
| Price Competitive | ✓ | ✓ |
| Benefit Attractive | ✓? | ✓ |
| Compatible with Private Insurance | Opportunity for private insurance to supplement | Require private CI insurance for the initial CI coverage |
| Remark | Less anti-selection but uncertain to the exact degree A more restrictive version of Shadow |
Attract young buyers by addressing current needs Suitable as an option for young workers in addition to a standard CLASS offer |
| PLAN ALTERNATIVES Category II: Adverse selection issue somewhat addressed but low product appeal |
||
|---|---|---|
| Design | 9 CLASS with Long Elimination Period I |
10 CLASS with Long Elimination Period II |
| Description | CLASS as 2nd payer after private insurance | CLASS as 2nd payer after private insurance or self funding |
| Benefits | Require private insurance purchase After first 2 years, CLASS will pay for 3 years if claim lasts past 3 years (e.g.) Sold in units of $50 daily benefit; can buy up to 8 units |
After first 2 years, CLASS will pay for 3 years if claim lasts past 3 years (e.g.) Sold in units of $50 daily benefit; up to 8 units Alternative:If claim during the first 15 years, the deductible equals to the difference in cumulative premiums of a pre-paid plan and the premiums paid. |
| Premium Schedule | Premium increases 5% each year until age 70 | Premium indexed to CPI |
| Price Competitive | X | X |
| Benefit Attractive | ✓ | ✓ |
| Compatible with Private Insurance | Require private insurance as the 1st payer | Private insurance can be the 1st payer |
| Remark | Must pass underwriting of private insurance plan CLASS plan may be viewed as superfluous |
Less anti-selection but uncertain to the exact degree CLASS plan may be viewed as superfluous |
| PLAN ALTERNATIVES Category III: Adverse selection issue addressed with reasonable product appeal |
|||
|---|---|---|---|
| Design | 11 Temporary Period Exclusion |
12 Phased Enrollment |
13 Underwriting Option |
| Description | Delay benefits for certain enrollees under certain conditions | Group enrollment first, individual enrollment later after sufficient reserve built up to allow a controlled level of adverse selection. | Choice of CLASS Senate or a plan that requires underwriting |
| Benefits | Pays $50 average daily benefit indexed to CPI but no benefits for first 15 years if ADL or cognitive deficits are results of condition at time of enrollment (e.g.) Unlimited but 20% after 4 years (e.g.) 5 year waiting period Sold in units of $50 daily benefit; up to 8 units |
Pays $50 average daily benefit indexed to CPI Unlimited but 20% after 4 years (e.g.) 5 year waiting period Sold in units of $50 daily benefit; up to 8 units |
Underwritten plan pays $50 daily benefit indexed to CPI Unlimited but 20% after 4 years (e.g.) 5 year waiting period Sold in units of $50 daily benefit; up to 8 units |
| Premium Schedule | Premium indexed to CPI | Premium indexed to CPI | Premium indexed to CPI |
| Price Competitive | ✓ | ✓ | ✓ |
| Benefit Attractive | ✓ | ✓ | ✓ |
| Compatible with Private Insurance | Opportunity for private insurance to supplement (if limited to 1 to 2 units) but compete directly if up to 8 units | Opportunity for private insurance to supplement (if limited to 1 to 2 units) but compete directly if up to 8 units | Opportunity for private insurance to supplement (if limited to 1 to 2 units) but compete directly if up to 3 to 4 units |
| Remark | Less anti-selection but uncertain to the exact degree Potential claim adjudication issues |
Less anti-selection but uncertain to the exact degree Individual enrollment may be very restrictive, far into the future or never happen |
Competitive and attractive alternative to private insurance |
Attachment 3: Summary of Proposed Plans
| SUMMARY OF PROPOSED CLASS BENEFIT PLANS | ||||||
|---|---|---|---|---|---|---|
| Proposed Plan 1 Phased Enrollment |
Proposed Plan 2 Phased Enrollment + Temporary Exclusion |
Proposed Plan 3 Phased Enrollment + Limited Initial Benefits |
Proposed Plan 4 Temporary Exclusion |
Proposed Plan 5 Scheduled Increasing Benefits |
Proposed Plan 6 Pre-Paid |
|
| Description | Group enrollments first, number of individual enrollments based on number of enrollees through group enrollment | Phased enrollment as with Proposed Plan 1 plus temporary exclusion of benefits for the first 15 years of the beneficiary’s enrollment due to a serious prevailing medical condition at time of enrollment that caused the functional limitation. Waived for group enrollment. | Phased enrollment as with Proposed Plan 1 plus low daily benefit for duration of claim, if claimed during the first 20 years of the beneficiary’s enrollment. Waived for group enrollment. | Temporary exclusion of benefits for the first 15 years of the beneficiary’s enrollment due to a serious prevailing medical condition at time of enrollment that caused the functional limitation. | Scheduled increasing benefits for this 23 years, can be packaged with private insurance so that the total benefits at the same level as the ultimate benefit. Require offer of a basic CLASS plan (i.e. Proposed Plan 6 -- Pre-Paid Plan). | No restriction on benefits from enrollment methods, from time of claim or medical condition at time of enrollment. |
| Benefit Eligibility & Amounts |
|
Same as Proposed Plan 1 |
|
Same as Proposed Plan 1 |
|
|
| Benefit Duration | 100% of benefit amounts for first 5 claim years, 20% thereafter | Same as Proposed Plan 1 | Same as Proposed Plan 1 | Same as Proposed Plan 1 | 100% of benefit amounts for first 3 claim years, none thereafter | Same as Proposed Plan 1 |
| Other Benefit Features |
|
|||||
| Spousal Shared Benefit | If a couple is enrolled, no benefit reduction after 5 claim years up to the unused portion of the other spouse’s first 5 claim years (e.g., the couple shares up to 10 years worth of benefits, up to 6 years for Scheduled Increasing Benefits) | None | ||||
| Premiums |
|
|
|
|||
| Waiver of Premiums | Premiums waived during time eligible beneficiaries are receiving benefits | Same as Proposed Plan 1 | Premiums waived only if claimed after 20 years | Same as Proposed Plan 1 | Premiums waived only if claimed after 25 years | Premiums not waived |
| Reenrollment |
|
|
Same as Proposed Plan 1 | Same as Proposed Plan 2 | Same as Proposed Plan 1 | Same as Proposed Plan 1 |
Notes
-
The CLASS Act was enacted as Title VIII of the Patient Protection and Affordable Care Act, P.L. 111-148 (March 23, 2010), which amended the Public Health Service Act, 42 U.S.C. section 201 et seq., by adding the CLASS Act as Title XXXII.
-
They include: Actuarial Standards of Practice No. 12: Risk Classification, American Academy of Actuaries, updated May 2011, Actuarial Standards of Practice No. 18: Long Term Care Insurance, updated May 2011, and Health Practice Council Practice Note: Long-Term Care Insurance, August 2003.
-
As of the release date of this report, Gregory Kissel is on loan from the Office of Personnel Management on a part-time basis.
-
Current long-term care cost ranges from an average of approximately $16,000 per year for home and community care (assuming 3 hours per day, 5 days a week) to $70,000 for nursing home care -- 2010 Market Survey of Long-Term Care Costs, MetLife Mature Market Institute.
-
Even though the CLASS Program emphasizes care in the community, benefits will be paid regardless of the setting. In this report, community care and long-term care have the same meaning.
-
Less than 8% of Americans under age 65 has private long-term care insurance -- Who Purchase Long Term Care Insurance?Richard W. Johnson and Janice S. Park, Urban Institute, March, 2011. However, approximately 1 out of 2 persons over age 65 will need some formal care in the remaining lifetime. See Long-Term Care Over an Uncertain Future: What can Current Retirees Expect?, Peter Kemper, Harriet L. Komisar and Lisa Alecxih, Inquiry, Volume 42, Winter 2005/2006.
-
UNUM, Genworth Financial and Prudential Insurance Company.
-
Annual Medicaid long-term care spending is projected to grow from $64 billion to $101 billion in 2030 -- Lewin Group, 2010, while the ratio of persons under 65 to persons 65 and over is 4.6 for 2010 and the corresponding projected ratio is 2.8 in 2030 -- U.S. Census Bureau.
-
CLASS Act, Sec. 3201.
-
CLASS Act, Sec. 3203(a)(1), Sec. 3203(a)(2)(B), Sec. 3203(b)(1)(E)(i), Sec. 3206(b)(2)(A)(iii).
-
Actuarial Standards of Practice No. 26: Compliance with Statutory and Regulatory Requirements for the Actuarial Certification of Small Employer Health Benefit Plans, May 2011 and Health Practice Council Practice Note: Actuarial Certification of Rates for Medicaid Managed Care Programs, August 2005.
-
CLASS Act, Sec. 3208(b).
-
In insurance, moral hazard occurs when certain insured’s behavior results in unfavorable overall experience for the insurance program. For example, spend more insurance benefits than reasonably needed if they have to be paid out-of-pocket.
-
CLASS Act, Sec. 3203(a)(2)(B).
-
CLASS Act, Sec. 3202(a)(1).
-
CLASS Act, Sec. 3203(b)(3).
-
Actuarial soundness for the CLASS plans suggests a margin for unfavorable experience built into the premiums, similar to the specific margin for adverse experience required in long-term care insurance since 2003.
-
The discount rate equals to a fixed interest rate used for statutory reserving.
-
This assumes a 20% expense ratio for CLASS. See later section for a discussion on expenses.
-
We recognize that certain enrollees’ attributes may partially offset the effect of asymmetric information. For example, risk-averse individuals tend to be attracted to insurance and are healthy. However, this attribute is already embedded in private insurance’s experience. See Multiple Dimensions of Private Information: Evidence from the Long-Term Care Insurance Market, Amy Finkelstein and Kathleen McGarry, American Economic Review, September 2006.
-
In the toothache insurance example, this is analogous to charging $1,000 premium. Because the expected number of claims is highly dependent on the number of enrolled workers who already had a toothache, we suggest that this is the only prudent premium that ensures a high likelihood of program sustainability.
-
See Adverse Selection, Memo to Kathy Greenlee from Bob Yee, April 27, 2011 (Attachment 1).
-
See Design Alternatives, May 6, 2011 (Attachment 2).
-
Clearly high risk employees can still select against the insurance plans even with a short enrollment period. Although one insurer no long in the group business is in the process of filing for premium increase, the overall experience to date suggests that this adverse effect from group enrollment is manageable and insurers have adjusted their claim expectation accordingly.
-
CLASS Act, Sec. 3206(c)(2)(B)(i)(III - IV).
-
Thus individual enrollment would have 400% extra claims than group enrollment. The initial estimation of expected increase in claim costs can be quantified through a study of disability status of individuals declined for private long-term care insurance.
-
Depending on the cost estimates for this provision, the 15 years may have to extend to 20 years in order to keep the CLASS premiums competitive.
-
In the toothache insurance example, a high participation rate helps to keep the premium relatively reasonable. If 80 workers (including all 5 workers already had a toothache) enrolled, the premium of $156 [(5 + 75 x 10%) x $1,000 ÷ 80] is a more tolerable and predictable premium compared with the prospect if only 6 workers enrolled.
-
See Attachment 3 for a summary of the proposed plans.
-
The purpose of this comparison is to merely illustrate the possibility of developing a CLASS plan that is reasonably price competitive with private group insurance. The CLASS premiums have not been finalized. Note in particular that the comparison is between the level premiums of private group insurance plans and the initial premium for the CLASS plan with an increasing premium schedule. In addition, this premium illustration is not derived from models provided by Actuarial Research Corporation and Avalere Health as described in the Actuarial Modeling section below.
-
CLASS Act, Sec. 3203(a)(2)(B).
-
CLASS Act, Sec. 3203(a)(1)(D)(ii).
-
U.S. Consumer Price Index for Urban Nursing Home and Urban Adult Day Care Costs, National Care Planning Council, http://www.longtermcarelink.net/eldercare/ref_cpi_inflation_rate.htm.
-
CLASS Act, Sec. 3202(a)(1)(C)(iii).
-
CLASS Act, Sec. 3203(a)(1)(D)(iv).
-
CLASS Act, Sec. 3205(c)(1)(B).
-
CLASS Act, Sec. 3205(g).
-
The entire schedule can move up or down according to experience of the program.
-
CLASS Act, Sec. 3203(b)(2).
-
CLASS Act, Sec. 3205(b)(4).
-
CLASS Act, Sec. 3202(6)(A)(iii).
-
CLASS Act, Sec. 3202(6)(C).
-
See, for example, Low-Income Workers and Their Employers -- Characteristics and Challenges, Gregory Acs and Austin Nichols, Urban Institute, 2007.
-
CLASS Act, Sec. 3203(a)(1)(A)(ii).
-
CLASS Act, Sec. 3203(b)(1)(C) and Sec. 3203(b)(1)(E).
-
CLASS Act, Sec. 3203(a)(1)(D)(i).
-
CLASS Act, Sec. 3205((b)(1)(a).
-
CBO letter to Rep. George Miller from Douglas Elmendorf, November 25, 2099.
-
CLASS Act, Sec. 3203(a)(1).
-
CLASS Act, Sec. 3206(c)(2)(B)(i)(III - IV).
-
The plan tested is the ‘Modified’ CLASS with waiver of premium and 2% enrollment rate. ‘Modified’ here refers to the CLASS plan with the proposed Senate amendments (in particular, allowed for indexing of premiums).
-
2009 National Health Interview Survey and 2009 Current Population Survey (PINC-05) people age 15+ with annual income greater than $12,500.
-
We can expect that any load much above 20% will dramatically reduce enrollment to a point where the proportion of unhealthy enrollees is intolerable.
-
This illustration conservatively ignored those enrollees who are disabled but do not yet qualify for benefits under CLASS.
-
2011 LifePlans estimate.
-
A pre-paid plan, such as a dental plan, anticipates that nearly everyone who enrolled will claim. Thus the premiums approach the value of the benefits.
Appendix P: June 22, 2011 Technical Experts Meeting
Appendix Pa: Agenda and Discussion Issues and Questions
Technical Expert Panel Meeting
On
Actuarial Modeling of the Community Living Assistance Services and Supports (CLASS) Program
Agenda
June 22, 2011
9:00 am - 3:30 pm
Hubert H. Humphrey Building, Room 705A
200 Independence Avenue, SW
Washington, DC 20201
Contact: Marie Belt or Goldwyn Smith at 202-690-6443
9:00 - 9:15 Welcome and Introductions
Ruth Katz
Acting Deputy Assistant Secretary for Disability, Aging, and Long-Term Care PolicyKathy Greenlee
Assistant Secretary for Aging
9:15 - 9:45 Overview of CLASS and Major Modeling Issues
William Marton
Director, Division of Disability and Aging PolicyBob Yee
Actuary, CLASS Program Office
9:45 - 10:15 Actuarial Research Corporation (ARC) CLASS Model
John Wilkin
Senior Actuary, ARC
10:15 - 10:45 Questions and Comments on the ARC CLASS Model
10:45 - 11:00 Break
11:00 - 11:30 Avalere Long-Term Care Policy Simulator (LTC-PS)
Anne Tumlinson
Senior Vice President, Avalere HealthEric Hammelman
Director, Avalere Health
11:30 - 12:00 Questions and Comments on the Avalere LTC-PS
12:00 - 12:45 Lunch
12:45 - 2:00 Review and Discussion of Core Assumptions and Model Output
John Wilkin
Senior Actuary, ARCEric Hammelman
Director, Avalere Health
2:00 - 2:15 Break
2:15 - 3:30 Presentation and Discussion of Alternative Approaches
William Marton
Director, Division of Disability and Aging PolicyBob Yee
Actuary, CLASS Program Office
3:30 Adjourn
ISSUES AND QUESTIONS TO DISCUSS AT THE JUNE 22nd TEP MEETING
Thank you for your participation on the Technical Expert Panel on Actuarial Modeling of the Community Living Assistance Services and Supports (CLASS) Program. The agenda for the meeting is organized around addressing six major questions (below) and our efforts to develop estimates of premiums, participation and other important aspects of the CLASS program. Please review the questions and materials prior to the meeting. After the meeting, we would very much appreciate it if you could provide follow up comments or thoughts within a week so that we can incorporate them into our future modeling efforts.
-
Who is likely to enroll in the CLASS program?
- Do you think that the models’ approach to adverse selection is reasonable?
- Can you suggest approaches to validate the models with regards to their treatment of adverse selection?
- What alternative approaches would you recommend?
-
What is the future long-term care utilization of enrollees likely to be?
- Do you think that the approach for estimating future claim costs is reasonable?
- What are the strengths and weaknesses of the survey data that are the basis for estimating future claim costs?
- What other data could be used to model future claims?
-
Are other key assumptions reasonable?
- Are the interest rate assumptions reasonable (e.g., 4.7%, 5.7%, 6.7% average annual rate of return)?
- Are the annual voluntary lapse assumptions reasonable (e.g., .5%, .75%, 1% per year)?
- How should the progression of disability among workers be modeled during their working years and beyond?
- Are the assumptions of morbidity improvement reasonable (.25%, .5%, .75% per year for 20 years; 0% thereafter)?
- Are the mortality improvement assumptions reasonable (e.g., 1.31%, .78%, .32% per year)?
-
What level of participation should we expect?
- What are reasonable lower and upper bounds to participation? What do you think is the best point estimate of participation?
- Do you think the models reasonably reflect the dynamic between participation and adverse selection?
- How should we model the interaction between program demand and premium levels?
-
What alternative designs would put the program on stronger financial footing?
- Other than underwriting and mandatory enrollment, what features would you suggest to mitigate adverse selection?
- What aspects of the program should be changed to maximize participation?
-
Other than specific changes to the benefit plan, what strategies should we pursue to mitigate program risk?
| Summary of CLASS | |
|---|---|
| Program Features | CLASS Benefit in Statute |
| Enrollment Requirements: | |
| Age 18+ | Yes |
| Taxable Wages/Income | Yes |
| Actively Employed | Yes |
| Not in Institution | Yes |
| Coverage Benefits: | |
| Primary Benefit | Cash |
| Daily Benefit Amount (DBA) | $50 (Average) |
| Unit of Payment | Daily or Weekly |
| Minimum Duration in Years | NA - Lifetime |
| Total Value | TBD |
| Inflation Protection | CPI-U |
| Advocacy Services | Yes |
| Advice and Asst. Counseling | Yes |
| Eligibility for Benefits: | |
| 5 Year Vesting Period | Yes |
| Work Req. Over Vesting Period | At Least 3 Years |
| Earnings Req. Over Vesting Period | $1,120/Year |
| 24 Months of Prior Prem. Payment | Yes |
| Minimum Benefit Trigger | 2 or 3 of 6 ADLs1 |
| Tiered Benefit | Yes |
| Elimination Period in Days | 0 |
| Presumptive Eligibility | Yes - if in Inst.2 |
| Administrative Expenses | 3% |
| Monthly Premium: | |
| Underwritten (Other Than Age) | No |
| Indexed to Inflation | No |
| Low Income Premium | Yes |
| Full Time Student Premium | Yes |
| Waiver of Premium | TBD |
| Level Premium | After Age 653 |
| Return of Premium | TBD |
CLASS: Issues for Discussion
- Who is likely to enroll in the CLASS program?
- Modeling adverse selection/antiselection
- Data limitations
- What is the future long-term care utilization of enrollees likely to be?
- Modeling future claim costs
- Data limitations
- Are other key assumptions reasonable?
- Return on Investment (4.7%, 5.7%, 6.7% average annual rate of return)
- Lapsation (.5%, .75%, 1% per year)
- Morbidity Improvement (.25%, .5% .75% per year for 20 years; 0% thereafter)
- Mortality Improvement (1.31%, .78%, .32% per year)
CLASS: Issues for Discussion
- What level of participation should we expect?
- Range of 1% to 4%
- Premium-demand interaction
- What alternative program designs would put the program on stronger financial footing?
- Minor changes (e.g., higher earnings requirements, indexed premiums, etc.)
- Major changes (e.g., “family of options”; phased enrollment)
- What strategies should we pursue to mitigate program risk?
- Waiver of premium
- Cross-subsidization
- Other strategies?
| Summary of CLASS Plans | ||
|---|---|---|
| Program Features | CLASS Benefit in Statute | Modified |
| Enrollment Requirements: | ||
| Age 18+ | Yes | Yes |
| Taxable Wages/Income | Yes | Yes |
| Actively Employed | Yes | Yes |
| Not in Institution | Yes | Yes |
| Coverage Benefits: | ||
| Primary Benefit | Cash | Cash |
| Daily Benefit Amount (DBA) | $50 (Average) | $50 (Average) |
| Unit of Payment | Daily or Weekly | Daily or Weekly |
| Minimum Duration in Years | NA - Lifetime | NA - Lifetime |
| Total Value | TBD | TBD |
| Inflation Protection | CPI-U | CPI (2.8%) |
| Advocacy Services | Yes | Yes |
| Advice and Asst. Counseling | Yes | Yes |
| Eligibility for Benefits: | ||
| 5 Year Vesting Period | Yes | Yes |
| Work Req. Over Vesting Period | At Least 3 Years | 5 Years (or 40 Qs)1 |
| Earnings Req. Over Vesting Period | $1,120/Year | $12,000/Year |
| 24 Months of Prior Prem. Payment | Yes | Yes |
| Minimum Benefit Trigger | 2 or 3 of 6 ADLs2 | TBD |
| Tiered Benefit | Yes | Yes |
| Elimination Period in Days | 0 | 0 |
| Presumptive Eligibility | Yes - if in Inst.3 | Yes - if in Inst.3 |
| Administrative Expenses | 3% | 3% |
| Monthly Premium: | ||
| Underwritten (Other Than Age) | No | No |
| Indexed to Inflation | No | Yes (2.8%) |
| Low Income Premium | Yes | Yes |
| Full Time Student Premium | Yes | Yes |
| Waiver of Premium | TBD | TBD |
| Level Premium | After Age 654 | After Age 654 |
| Return of Premium | TBD | TBD |
Appendix Pb: Presentation Entitled "Core Assumptions and Model Outputs"
Core Assumptions and Model Outputs
John Wilkin, ARC
Eric Hammelman, Avalere Health
| CLASS Benefit in Statute | Modified CLASS | |
|---|---|---|
| Enrollment Requirements | ||
| Age 18+ | Yes | Yes |
| Taxable Wages/Income | Yes | Yes |
| Actively Employed | Yes | Yes |
| Not in Institution | Yes | Yes |
| Coverage Benefits | ||
| Primary Benefit | Cash | Cash |
| Daily Benefit Amount (DBA) | $50 (Average) | $50 (Average) |
| Unit of Payment | Daily or Weekly | Daily or Weekly |
| Minimum Duration in Years | NA - Lifetime | NA - Lifetime |
| Total Value | TBD | TBD |
| Inflation Protection | CPI-U | CPI-U |
| Advocacy Services | Yes | Yes |
| Advice and Asst. Counseling | Yes | Yes |
| Eligibility for Benefits | ||
| 5 Year Vesting Period | Yes | Yes |
| Work Req. Over Vesting Period | At Least 3 Years | 5 Years (or 40 Qs)* |
| Earnings Req. Over Vesting Period | $1,120/Year | $12,000/Year* |
| 24 Months of Prior Prem. Payment | Yes | Yes |
| Minimum Benefit Trigger | 2 or 3 of 6 ADLs | TBD |
| Tiered Benefit | Yes | Yes |
| Elimination Period in Days | 0 | 0 |
| Presumptive Eligibility | Yes - if in Inst. | Yes - if in Inst. |
| Administrative Expenses | 3% | 3% |
| Monthly Premium | ||
| Underwritten (Other Than Age) | No | No |
| Indexed to Inflation | No | Yes (2.8%)* |
| Low Income Premium | Yes | Yes |
| Full Time Student Premium | Yes | Yes |
| Waiver of Premium | TBD | TBD |
| Level Premium | After Age 65 | After Age 65 |
| Return of Premium | TBD | TBD |
| * Modified CLASS changes these three options. | ||
Average Premium for CLASS in Statute vs. CLASS Modified with Full Waiver of Premium, 2+ ADL trigger, and 2% Participation
| CLASS Modeling Assumptions: 3 Scenarios | ||||
|---|---|---|---|---|
| Scenario | I Worse than Expected |
II Expected |
III Better than Expected |
Description |
| Antiselection: ARC | 0.85 | 0.70 | 0.55 | Dampening factor: 1=perfect antiselection |
| Antiselection: Avalere | 0.85 | 0.70 | 0.60 | |
| Relative Claim Costs | 1.2 | 1.1 | 1.0 | Increased incidence from survey data |
| Return on Investment | 4.70% | 5.70% | 6.70% | Average annual rate of return |
| Lapsation | 0.50% | 0.75% | 1.00% | Percentage lapse per year |
| Morbidity Improvement | 0.25% | 0.50% | 0.75% | Annual percentage improvement for first 20 years; 0% thereafter |
| Mortality Improvement | 1.31% | 0.78% | 0.32% | Annual percentage improvement over the 75 year period |
| Participation | 1% | 2% | 4% | |
Average Premium for Scenarios I, II and III
Full Waiver of Premium, 2+ ADL trigger, and 2% Participation
Average Premium for Scenario II by Selection
1% and 4% Participation with Full Waiver of Premium, 2+ ADL trigger
Average Premium for Scenario II by Claim Costs at 1% and 4% Participation with Full Waiver of Premium, 2+ ADL trigger
(ARC)
Average Premium for Scenario II by Claim Costs
1% and 4% Participation with Full Waiver of Premium, 2+ ADL trigger
(Avalere)
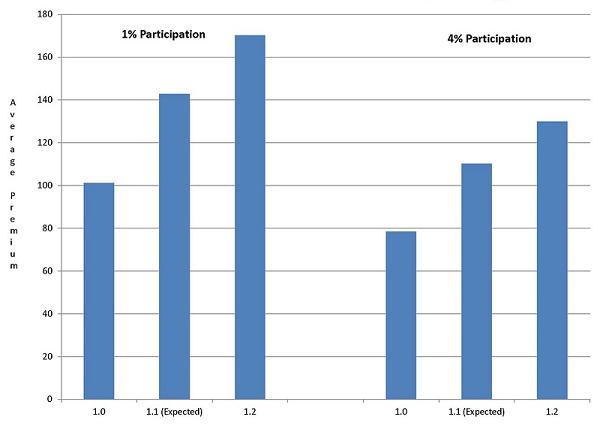
Average Premium for Scenario II by Participation Rate
Full Waiver of Premium and 2+ ADL trigger
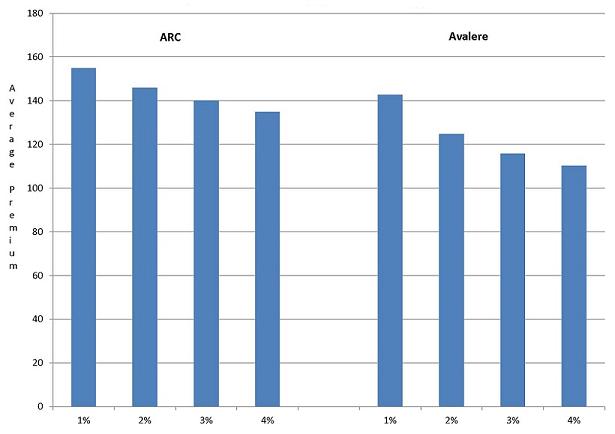
Average Premium for Scenario II by ADL Trigger
Full Waiver of Premium and 2% Participation
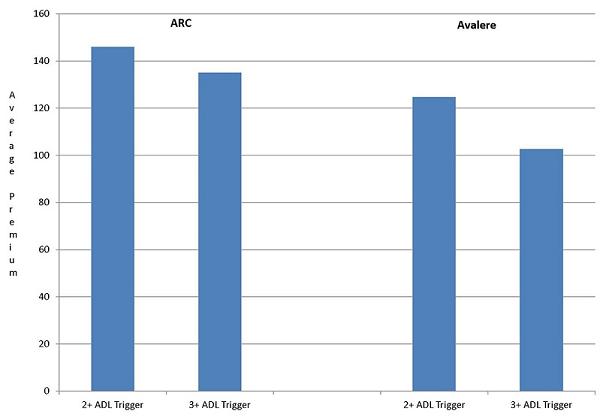
Average Premium for Scenario II by Waiver
2+ ADL Trigger and 2% Participation
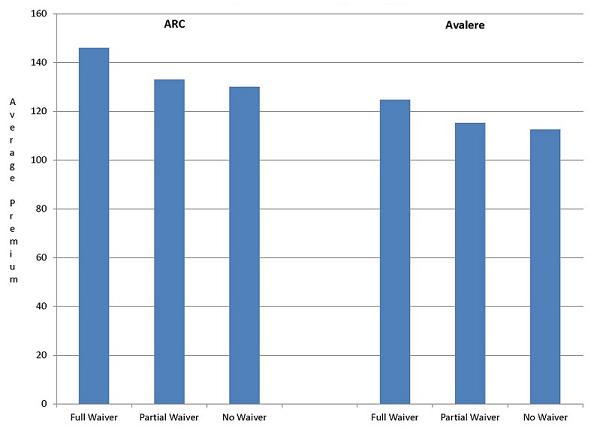
Average Premium by Return on Investment
Full Waiver of Premium, 2+ ADL Trigger, and 2% Participation
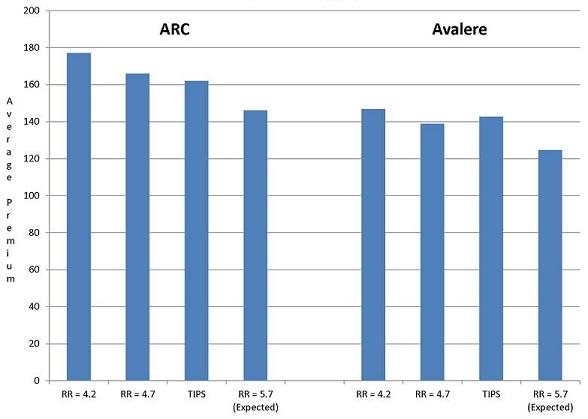
Appendix Pc: Presentation Entitled "Actuarial Research Corporation's Long Term Care Insurance Model"
Actuarial Research Corporation’s Long Term Care Insurance Model
June 22, 2011
Caveats
- No one can foresee how this program will operate, therefore premiums cannot be guaranteed to be adequate.
- Unknowns include level of participation, level of antiselection, and the effectiveness of procedures to determine earnings, “actively at work,” and qualifications for benefits, and the effect of providing advocacy services
- Level premiums cannot be determined for benefits linked to an index (CPI), because future benefits are unknown at the time that premiums are calculated.
- Adequacy of premium cannot be guaranteed when premium levels are unknown such as would be the case if premiums bounce up and down with income.
Actuarial Basis For Premium Formula
- For each issue age, projections of benefits, expenses, and premium income are made until age 100 (presumed to be the end of life for all individuals in the cohort).
- The Premium for each issue age is set so that the present value of benefits and expenses is equal to the present value of premium income.
Assumptions
- Premiums are calculated such that there is no subsidy across years of issue or age at issue, as is typical of social insurance.
- Premiums are based on a set of assumptions:
- Interest Rates
- Mortality Rates
- Lapse Rates
- Expense Levels
- Utilization Rates
Source for Assumptions
- All assumptions may be modified b the user.
- Interest rates and mortality rates are taken from the 2011 OASDI Trustees Reports.
- Lapse Rates are assumed to be 0.75% per year.
- Premium load for expenses is assumed to be 3%.
- Utilization comes from survey data with several adjustments.
Mortality Assumptions
- 2011 Trustees Report
- Mortality rates decline by roughly 0.8% per year
- Compared to 1994 GAM:
- Male GAM rates are about 99% of TR rates in 2011
- Male TR rates go below 1994 GAM in 2012
- Female GAM rates are about 83% of TR rates in 2011
- Female TR rates go below 1994 GAM in 2033
Utilization Assumptions: Data Sources for Nursing Home Rates
- For NH prevalence rates, incidence rates, average length of stay, and continuance table: 1985 National Nursing Home Surveys (NNHS), trended to 2004 NNHS (generally about 20% to 40% reduction depending on age and sex).
Utilization Assumptions: Data Sources for Home Care Rates
- For HC ages 65+, incidence rates, average length of episode, and continuance table: 1982-1989 National Long-Term Care Surveys (NLTCS) as analyzed by Eric Stallard and Bob Yee, trended to 2004 by change in prevalence rates from the 1989 to 2004 NLTCSs (generally about 20% to 50% increase depending on age and sex).
- For HC ages <65, home care prevalence rates from the 2009 National Health Interview Survey (NHIS). Average length of episode is extrapolated from the over 65 (increased by 1% for each age, which is from about 3 1/2 years at age 65 to about 5 3/4 years at age 18). Continuance table is from the over 65. Incidence rates are derived from the formula:
- PR = IR * ALOS, which is equivalent to IR = PR / ALOS
| Utilization Assumptions: Comparison of ARC Model Incidence Rates to SOA Data for 2+ ADLs | |||
|---|---|---|---|
| Age | ARC Model (before adjustments)* |
SOA 2004 Intercompany Data |
Ratio |
| 45 | .155% | .13% | 1.2 |
| 55 | .235% | .14% | 1.7 |
| 67 | 2.20% | .47% | 4.7 |
| 77 | 7.54% | 2.81% | 2.7 |
| 87 | 21.90% | 9.62% | 2.3 |
| * Excluded adjustments are for selection, antiselection, trend, and ADL creep. Incidence rates are the sum of NH + HC incidence rates average of male and female. | |||
Utilization Assumptions: Adjustments
- Utilization data are tabulated by age, gender, and ADL.
- Utilization of the under 65 are also tabulated by income level and definition of cognitive impairment.
- We assume that 25% of those with one ADL less than the requirement will receive benefits.
- We calculate the number of new beneficiaries in the first year of benefit payments (2017) by using prevalence rates rather than incidence rates.
Utilization Assumptions: Selection and Antiselection
- Selection: Provisions that result in participants being healthier than average (average is based on survey data for the whole population).
- The 3-year work requirement
- NHIS data shows that ADL level of those that work ($1+ per year $1) have significantly lower utilization than the total population
- Antiselection: Those in need of services are the most likely to participate in an unsubsidized / voluntary program.
Utilization Assumptions: Selection
- Selection Factor: incidence rates in the last year of required work = 60% of ultimate
- Work is required for 3 out of the 5-year vesting period
- Selection wears off over 10-year period
Utilization Assumptions: Antiselection -- Two Methods
- Antiselectino Factor (AF) -- We model two different methods (and other methods are possible):
- Formula based on a comparison of participation rates and prevalence rates
- Estimate of additional 1st-year claims
- Additional First Year Claims
Formula Method of Antiselection
- A function of the participation rates and prevalence rates, assumed to diminish over a 20-year period.
- Starts by first calculating a factor that represents the maximum amount of antiselection and then dampens this factor.
- Maximum factor = 1/prevalence rate, if prevalence > participation.
- Maximum factor = 1/(prevalence / participation), if participation > prevalence.
- Different factor at each age and sex
Utilization Assumptions: Antiselection -- Examples
- Example 1 -- Male age 35 2+ ADLs: participation = 0.81% & prevalence rates = 0.13%
- AF = 1/.0081 = 124 (perfect antiselection)
- AF = 100^0.7 = 29.2 (imperfect antiselction)
- AF(5) = 12.8 (interpolated value at duration 5)
- Example 2 -- Male age 55: participation = 3.43%, prevalence = 0.24%
- AF = 1/.034 = 29.2 (perfect antiselection)
- AF = 29.2^0.7 = 10.6 (imperfect antiselection)
- AF(5) = 6.0 (interpolated value at duration 5)
Additional First Year Claims Method of Antiselection
- Tabulate NHIS number of individuals that meet criteria for participation and benefit eligibility.
- Assume that they all receive benefits in 2017 possible.
- * All = Dementia, developmental disabilities, mental retardation, ADD, schizophrenia, bipolar.
- ** SRD = 1st 3 in list above
| Income | All* Cognitive or 2+ ADLs (000) |
All* Cognitive or 3+ ADLs (000) |
SRD** Cognitive or 2+ ADLs (000) |
SRD** Cognitive or 3+ ADLs (000) |
|---|---|---|---|---|
| $0+ | 2,651 | 2,005 | 1,865 | 1,589 |
| $1+ | 623 | 571 | 480 | 428 |
| $10k+ | 412 | 374 | 315 | 277 |
Policy Options That Can Be Modeled
- Earnings requirement (parameter in law)
- Years of work required (3)
- Level for participation (quarter of coverage = $1,090 in 2009)
- Level for subsidy (poverty line = $10,830 in 2009)
- Benefit trigger (ADL requirement)
- Dollars per day of benefit including indexing options
- Indexing of premium
- Waiver of premium while in claim status
- While in nursing home
- And / or while in home care
- Deductible period
- Lifetime maximum
Assumptions That Can Be Modified
- Strength of antiselection
- Level of utilization
- Trend in utilization
- Lapse
- Interest
- Expense load
- Level of mortality
- Trend in mortality
Premium Sensitivity
- Final Set of assumptions for calculating premiums have not yet been determined.
- Premiums are very sensitive to some assumptions.
- Low Income Subsidy / Income requirements
- Participation rates (1% to 4% decreases premiums by 13% to 18%)
- Indexing of premium (20+% reduction in initial premium)
- Interest (14% increase in premium for 4.7% interest vs 5.7% interest with no change in CPI)
- Lapse (8% increase in premium for 0% lapse from 0.75%)
- Trends in mortality (4.3% decrease in premium by changing annual trend from 0.75% to 0.25%) and morbidity
Appendix Pd: Presentation Entitled "The Avalere Long-Term Care Policy Simulator Model"
The Avalere Long-Term Care Policy Simulator Model
June 22, 2011
Avalere Health LLC
Presentation Purpose and Agenda
- The purpose of this presentation is to describe Avalere’s approach for estimating the premiums for the CLASS Act, as written and with modifications
- Agenda
- Provide brief project background
- Summarize overall modeling approach
- Highlight key issues/challenges
- Adverse selection
- Enrollment rates
- Questions/Discussion
Long-Term Policy Simulator (LTC-PS) Overview
Basic Overview
- The LTC-PS is an Excel-based spreadsheet model
- Originally built to allow policy makers to test a broad array of public insurance policy options and subsequently modified for ASPE to allow for testing CLASS-specific implementation policy options
- The LTC-PS is an incidence and continuance model
- Creates enrollment groups and calculates the age-specific costs and premiums over a 75 year window
- Models incidence and continuance of disability to determine when an individual becomes disabled and how long he or she remains disabled
LTC-PS Overview (cont.)
Data Sources
- Point-in-time surveys for prevalence of disability in the community (Survey of Income and Program Participation, American Community Survey, Current Population Survey) and in nursing homes (National Nursing Home Survey)
- Longitudinal survey for continuance rates among elderly aged 65+ (National Long Term Care Survey) and actuarial data for continuance rates among disabled aged 18 to 65
- Data issues:
- No national, longitudinal data for disability across age spectrum
- Aggregation of data from multiple surveys
- No single accepted method to estimate adverse selection
Model Overview
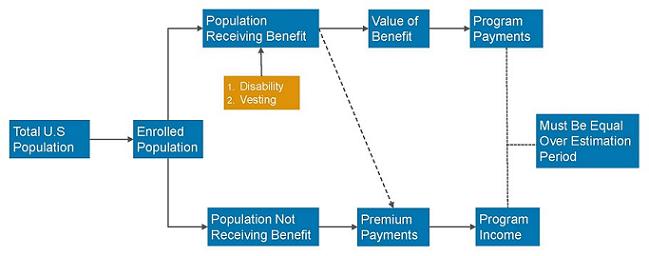
Modeling Enrollment: Population and Program Eligibility
Overall Population
- We use Social Security estimates of the total population by age from 2010 through 2100 accounting for the agency’s expectations for changes in nativity, mortality, immigration, and emigration
Estimating Attachment to Workforce
- All workers: using data from the American Community Survey (ACS), we calculate employment, unemployment, and the total labor force (includes people who are working, unemployed individuals, and individuals “looking for work”)
- Program eligible workforce: the CLASS program is open to all individuals over 18 who have at least 3 years of working experience. We exclude people who are disabled at the outset of the program unless they are currently working (regardless of reported income)
- We estimate 5 to 7 percent of people with 2+ ADL disabilities in the community setting are currently working (approximately 400,000 people)
Modeling Enrollment: Vesting
- We estimate compliance with the 5 year vesting period
- We consider two factors that result in an individual not meeting the vesting requirements:
- Mortality: we use mortality estimates from the Social Security Trustees report
- Policy Lapse: we assume a 0.5 percent lapse rate each year for the first 20 years and after that we assume there are no additional policy cancellations
Modeling Enrollment: Participation
Overall Participation
- Experts believe enrollment in CLASS will be between one and six percent of eligible individuals
- We assume as a baseline that two percent of the working population will enroll in the first year
- In subsequent years, we assume enrollment will be a fraction of the baseline with declining enrollment rates for the next five years and finally reaching a steady enrollment rate of 0.1 percent of the eligible population
- These estimates lead to non-low income enrollment of 2.2 million in the first year; 145 thousand new enrollees in 2017; and total enrollment of 3.5 million in 2020.
- We then apply age-adjusted participation rates using two separate methods: smooth enrollment and Federal Long-Term Care Insurance Participation
Modeling Enrollment: Participation
Smooth Enrollment
- We set an enrollment inflection point at age 50 in the assumption that the average participation would equal participation at age 50
- Increase participation at a rate of two percent for each age above 50 and decrease participation at a rate of one percent for each age below 50
- We use this method as our primary enrollment estimation
Federal Long-Term Care Insurance Participation
- We model a separate enrollment expectation rate based on the observed enrollment rates in the federal long-term care insurance program (FLTCIP)
- We use the actual enrollment rates by age for in-force policies
Enrollment Estimation Methods
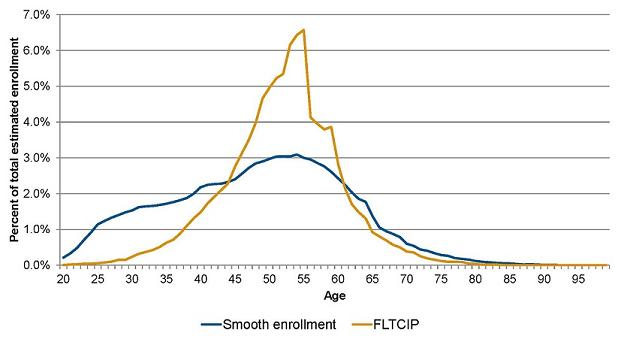
Modeling Disability: Prevalence
Community Setting
- We estimate age-related prevalence from the 2004 Survey of Income and Program Participation (SIPP)
- We define severe disability as needing help with two or more ADLs; having Alzheimer’s Disease or another serious problem with forgetfulness or confusion; having mental retardation or developmental disability (i.e. autism, cerebral palsy)
- We estimate that 3 percent of the over-15 population in the community has a severe disability
Nursing Home Setting
- We estimate age-related prevalence from the 2004 National Nursing Home Survey (NNHS)
- We define severe disability as needing limited, extensive, or total assistance with two or more ADLs; living in an Alzheimer’s or dementia unit or having impaired decision making ability; was admitted to the nursing home directly from an intermediate care facility for the mentally retarded (ICF/MR)
- We estimate that 91 percent of the over-15 population residing in a nursing home has a severe disability
Modeling Disability: Prevalence (cont.)
Prevalence OverTime
- Given the uncertainty about declining disability rates, we include a decline of disability rates of 0.5 percent per year through 2025
- Overall disability prevalence is slightly above 3 percent from 2010 to 2025 and increases slightly after that to reach 4.6 percent by 2085
ADL creep
- In a CLASS program with a benefit trigger of 2 or more ADLs, we assume that:
- 50 percent of individuals with just one ADL will qualify: all nursing home residents and a portion of community residents
- In a CLASS program with a benefit trigger of 3 or more ADLs, we assume that:
- 50 percent of individuals with 2 or more ADLs will qualify: all nursing home residents with 2 ADLs and a portion of community residents
Modeling Disability: Continuance
- To estimate continuance, or how long someone remains severely disabled, we use two data sets
- Over age 65: transition matrices from National Long Term Care Survey1
- Under age 65: continuance tables from IDEC survey2
- Non-continuance can be caused by two factors: mortality or improvement in condition/recovery
- Tend to see improvement at younger ages: these individuals are returned to the population eligible to pay premiums
- Mortality is higher for all ages of disabled individuals compared to non-disabled individuals
- We required non-continuance to always be at least as high as age-specific mortality from SSA
- Stallard, E and Yee, R.K.W. 1999. “Non-insured Home- and Community- Based Long-Term Care Incidence and Continuance Tables.” Society of Actuaries
- Society of Actuaries. 2005. “Experience Studies in Individual Disability.”
Modeling Disability: Incidence
- Incidence can be computed once we have estimated prevalence and continuance
- Prevalence P2 = Prevalence P1 + Incidence I2 - Non Continuance NC2
- We apply incidence and continuance rates to individuals in each program by age
Incidence Comparisons, 2+ ADLs
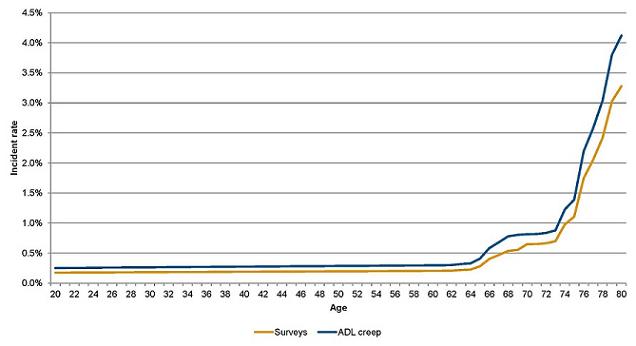
Modeling Disability: Adverse Selection
- We increased incidence of participants in the LTC-PS to account for adverse selection
- Enrolled population in voluntary program has higher disability than general population
- Under the extreme scenario, every individual who would develop disability within 5 years would enroll -- this is the “perfect knowledge” scenario
- For the LTC-PS, we include a dampening factor to address the unlikely nature of “perfect knowledge”:
- For the first enrollment group, we assume enrollment is weighted at 75% to perfect knowledge scenario in the first year of benefit eligibility
- We assume this ratio will decline over 20 years, reaching a final weight of around 10%
- The starting weights are lower at a higher earnings requirement and also dampened for estimates of future enrollment groups
Impact of Adverse Selection on Incidence, 2+ ADLs
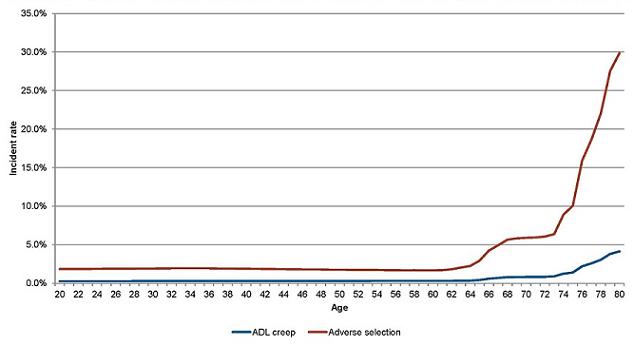
Adverse selection assumes 2 percent participation
Modeling Costs: Medicaid Interactions
- We model the impact on Medicaid based on an assumption about participation by people who would eventually become Medicaid enrollees and the low-income subsidy
- We model a Medicaid baseline using data from SIPP and NNHS, supplemented by information published by the Kaiser Commission on Medicaid and the Uninsured
- Even with a low-income subsidy, some future Medicaid beneficiaries would still be unlikely to enroll
- Not all future Medicaid beneficiaries are currently below the Federal Poverty Limit (FPL)
- The table below shows our estimated participation rates by people who would eventually become Medicaid beneficiaries by the different low-income subsidy levels
- We apply these participation rates to our Medicaid baseline to develop estimates of Medicaid savings
| Premiums | None | 100% FPL | 150% FPL |
|---|---|---|---|
| <$50 | 25% | 50% | 75% |
| $50-80 | 20% | 45% | 70% |
| $81-100 | 15% | 40% | 65% |
| $101-120 | 10% | 35% | 60% |
| $121-150 | 5% | 30% | 55% |
| >$150 | 0% | 25% | 50% |
Questions and Answers
Appendix Pe: Presentation Entitled "Alternative Approaches to CLASS Benefit Design: The Class Partnership"
Alternative Approaches to CLASS Benefit Design:
The CLASS Partnership
William Marton
Office of the Assistant Secretary for Planning and Evaluation
June 22, 2011
CLASS Independence Benefit Plan
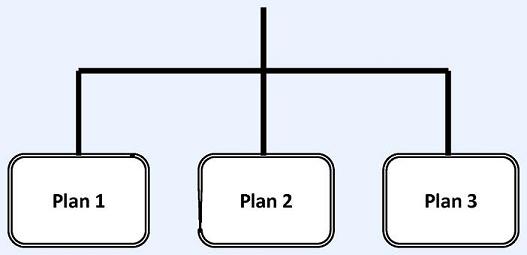
CLASS Independence Benefit Plan
October 1, 2012
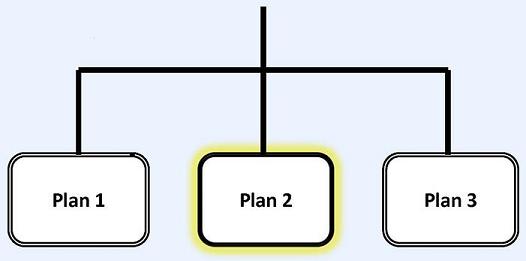
CLASS Independence Benefit Plan
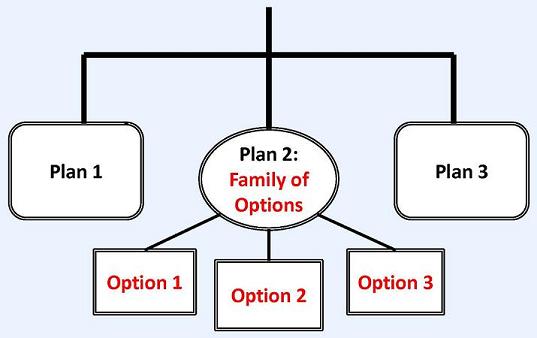
Family of Options
- A set of benefit plans that are marketed as one plan with multiple options
- One of the options must follow the CLASS statute fairly closely (e.g., the Modified CLASS Plan)
- The structure of the other options can vary more extensively, but still must maintain certain core features of the CLASS statute such as similar requirements for enrollment; a primary benefit that is cash; a five year vesting period; and no underwriting except for age
- The options are designed to appeal to different market segments of the population that (hopefully) vary by the risk of adverse selection
- The family of options has to be actuarially sound, either at the individual option level or in their entirety
CLASS Independence Benefit Plan
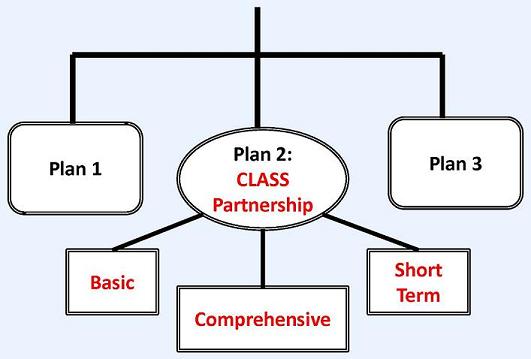
CLASS Partnership
Basic: Incorporates the major features of the CLASS statute (e.g., a primary benefit that is cash; no limit on duration; a vesting period; and no underwriting except for age), but changes key components to mitigate, although not likely eliminate, adverse selection.
Comprehensive: Provides much more comprehensive coverage (e.g., a three-year $150 daily benefit) designed to appeal to people who want to insure against future risk of long-term care that they will likely face at very old ages. Structure of the benefit reduces the likelihood of adverse selection.
Short Term: Provides very short-term (e.g., one year), high dollar coverage to persons with high functional needs. The premiums for this product should be substantially lower than those for the Basic and Comprehensive options, with the goal of appealing to persons who want some level of coverage but cannot afford something more comprehensive. Similar benefit structure as for the Comprehensive Option
Whyis this plan called the “CLASS Partnership”?
The structure of the benefit is designed to provide an opportunity for private insurers to develop products that would naturally “wrap around” and supplement the underlying core benefit. (Note: The supplement would be underwritten.)
Specifically, the daily benefit amount increases the longer the policy is held, rising from a nominal amount after the vesting period to an amount of coverage similar to what is commonly purchased from long-term care insurers.
However, unlike the CLASS Basic Plan, the duration of coverage for the Comprehensive and Short Term options is limited.
Figure 1. Changes in Daily Benefit Amount for the Comprehensive Option
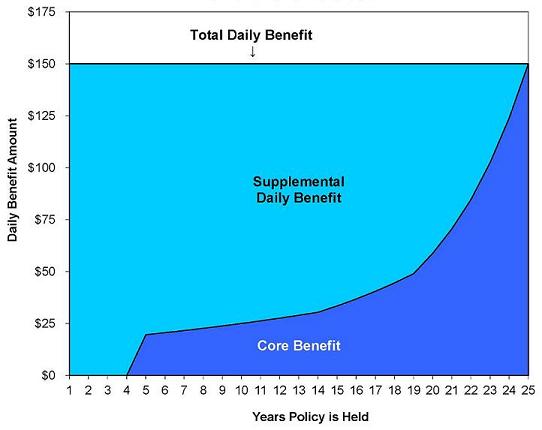
| Summary of CLASS Partnership Plan | ||||
|---|---|---|---|---|
| Program Features | CLASS Benefit in Statute |
CLASS Partnership Plan | ||
| Basic (Modified) |
Comprehensive | Short Term | ||
| Enrollment Requirements: | ||||
| Age 18+ | Yes | Yes | Yes | Yes |
| Taxable Wages/Income | Yes | Yes | Yes | Yes |
| Actively Employed | Yes | Yes | Yes | Yes |
| Not in Institution | Yes | Yes | Yes | Yes |
| Coverage Benefits: | ||||
| Primary Benefit | Cash | Cash | Cash | Cash |
| Daily Benefit Amount (DBA) | $50 (Average) | $50 (Average) | Varies - Up to $1502 | Varies - Up to $2002 |
| Unit of Payment | Daily or Weekly | Daily or Weekly | TBD | TBD |
| Minimum Duration in Years | NA - Lifetime | NA - Lifetime | 3 Years | 1 Year |
| Total Value | TBD | TBD | $164,250 | $73,000 |
| Inflation Protection | CPI-U | CPI (2.8%) | Variable4 | Variable4 |
| Advocacy Services | Yes | Yes | TBD | TBD |
| Advice and Asst. Counseling | Yes | Yes | TBD | TBD |
| Eligibility for Benefits: | ||||
| 5 Year Vesting Period | Yes | Yes | Yes | Yes |
| Work Req. Over Vesting Period | At Least 3 Years | 5 Years (or 40 Qs)5 | 5 Years (or 40 Qs)5 | 5 Years (or 40 Qs)5 |
| Earnings Req. Over Vesting Period | $1,120/Year | $12,000/Year | $12,000/Year | $12,000/Year |
| 24 Months of Prior Prem. Payment | Yes | Yes | Yes | Yes |
| Minimum Benefit Trigger | 2 or 3 of 6 ADLs6 | TBD | HIPAA - 2+ ADLs6 | HIPAA - 3+ ADLs6 |
| Tiered Benefit | Yes | Yes | No | No |
| Elimination Period in Days | 0 | 0 | 0 | 0 |
| Presumptive Eligibility | Yes - if in Inst.7 | Yes - if in Inst.7 | TBD | TBD |
| Administrative Expenses | 3% | 3% | TBD | TBD |
| Monthly Premium: | ||||
| Underwritten (Other Than Age) | No | No | No | No |
| Indexed to Inflation | No | Yes (2.8%) | Yes (3%) | Yes (3%) |
| Low Income Premium | Yes | Yes | No | No |
| Full Time Student Premium | Yes | Yes | No | No |
| Waiver of Premium | TBD | TBD | TBD | TBD |
| Level Premium | After Age 658 | After Age 658 | After Age 759 | After Age 759 |
| Return of Premium | TBD | TBD | Yes10 | Yes10 |
| Indexed Monthly Premiums for CLASS Partnership: Comprehensive Option (Scenario II - Expected) | |||
|---|---|---|---|
| Age | Core1 | Supplement2 | Total |
| 35 | $109 | $23 | $132 |
| 40 | $121 | $32 | $153 |
| 45 | $138 | $44 | $182 |
| 50 | $153 | $73 | $226 |
| 55 | $162 | $103 | $265 |
| 60 | $166 | $144 | $309 |
| 65 | $168 | $203 | $371 |
| Average | $148 | $99 | |
|
|||
| Comparison of Comprehensive Level Premiums Against Private LTC Insurance Plans | ||||||
|---|---|---|---|---|---|---|
| Age | Comprehensive (Total) |
MedAmer. Simplicity II1 |
Prudential LTC32 |
United of Omaha AS Gold3 |
NW QCare4 |
FLTCIP5 |
| 35 | $199 | $238 | $192 | $182 | $232 | $74 |
| 40 | $224 | $270 | $202 | $193 | $237 | $87 |
| 45 | $258 | $308 | $227 | $201 | $256 | $104 |
| 50 | $308 | $356 | $256 | $214 | $276 | $125 |
| 55 | $351 | $415 | $290 | $234 | $303 | $153 |
| 60 | $398 | $498 | $330 | $280 | $349 | $187 |
| 65 | $464 | $621 | $421 | $402 | $433 | $238 |
|
||||||
| Indexed Monthly Premiums for CLASS Partnership: Short Term Option (Scenario II - Expected) | |||
|---|---|---|---|
| Age | Core1 | Supplement2 | Total |
| 35 | $72 | $11 | $83 |
| 40 | $81 | $15 | $96 |
| 45 | $92 | $22 | $114 |
| 50 | $101 | $37 | $138 |
| 55 | $106 | $52 | $158 |
| 60 | $105 | $75 | $180 |
| 65 | $101 | $108 | $208 |
| Average | $96 | $51 | |
|
|||
Appendix Q: Table 2: Actuarial and Demographic Assumptions
| Table 2. CLASS Modeling Assumptions Under Three Scenarios | |||
|---|---|---|---|
| I. Worse than Expected |
II. Expected |
III. Better than Expected |
|
| Antiselection: ARC1 | 0.85 | 0.7 | 0.55 |
| Antiselection: Avalere2 | High | Moderate | Low |
| Relative Claim Costs3 | 1.2 | 1.1 | 1.0 |
| Return on Investment4 | 4.70% | 5.70% | 6.70% |
| Lapsation5 | 0.50% | 0.75% | 1.00% |
| Morbidity Improvement6 | 0.25% | 0.50% | 0.75% |
| Mortality Improvement7 | 1.31% | .78% | .32% |
| Participation | 1% | 2% | 4% |
|
|||
Appendix R: Figure 1: Daily Benefit Amount for Increased Benefit
Figure 1. How the Daily Benefit Amount for a CLASS Partnership Policy Changes Over Time
Total Daily Benefit: $150
Total Value of Policy: $164,250
Daily Benefit Amount = $0 to $175
Years Policy is Held = 1 to 25
Supplemental Daily Benefit -- Available With Underwriting = decreases over time years 1-24, not on figure year 25 [actual numbers unavailable on figure]
Basic Daily Benefit -- Available Without Underwriting = increases over time beginning with year 5 [actual numbers unavailable on figure]
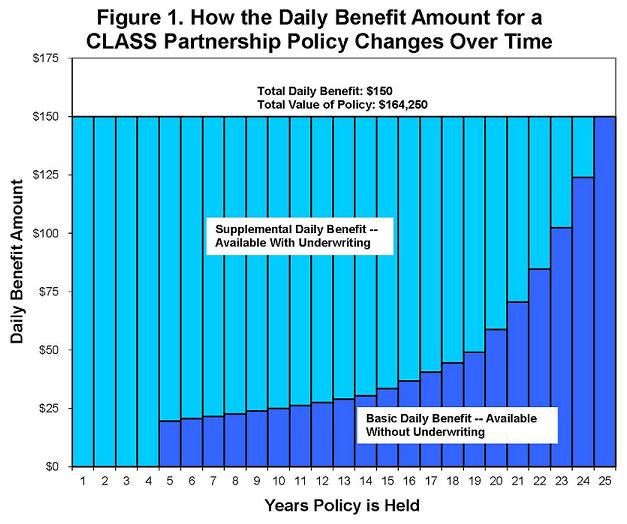
Files Available for This Report
Main Report
HTML http://aspe.hhs.gov/daltcp/reports/2011/class/index.shtml
PDF http://aspe.hhs.gov/daltcp/reports/2011/class/index.pdf [48 PDF pages]
APPENDIX A: Key Provisions of Title VIII of the ACA, which Establishes the CLASS Program
HTML http://aspe.hhs.gov/daltcp/reports/2011/class/appA.htm
PDF http://aspe.hhs.gov/daltcp/reports/2011/class/appA.pdf [6 PDF pages]
APPENDIX B: HHS Letters to Congress About Intent to Create Independent CLASS Office
HTML http://aspe.hhs.gov/daltcp/reports/2011/class/appB.htm
PDF http://aspe.hhs.gov/daltcp/reports/2011/class/appB.pdf [11 PDF pages]
APPENDIX C: Federal Register Announcement Establishing CLASS Office
HTML http://aspe.hhs.gov/daltcp/reports/2011/class/appC.htm
PDF http://aspe.hhs.gov/daltcp/reports/2011/class/appC.pdf [2 PDF pages]
APPENDIX D: CLASS Office Organizational Chart
HTML http://aspe.hhs.gov/daltcp/reports/2011/class/appD.htm
PDF http://aspe.hhs.gov/daltcp/reports/2011/class/appD.pdf [2 PDF pages]
APPENDIX E: CLASS Process Flow Chart
HTML http://aspe.hhs.gov/daltcp/reports/2011/class/appE.htm
PDF http://aspe.hhs.gov/daltcp/reports/2011/class/appE.pdf [2 PDF pages]
APPENDIX F: Federal Register Announcement for CLASS Independence Advisory Council
HTML http://aspe.hhs.gov/daltcp/reports/2011/class/appF.htm
PDF http://aspe.hhs.gov/daltcp/reports/2011/class/appF.pdf [3 PDF pages]
APPENDIX G: Personal Care Attendants Workforce Advisory Panel
Full Appendix
HTML http://aspe.hhs.gov/daltcp/reports/2011/class/appG.htm
PDF http://aspe.hhs.gov/daltcp/reports/2011/class/appG.pdf [6 PDF pages]
Ga: Federal Register Announcement for Personal Care Attendants Workforce Advisory Panel
PDF http://aspe.hhs.gov/daltcp/reports/2011/class/appGa.pdf [3 PDF pages]
Gb: Advisory Panel List of Members
PDF http://aspe.hhs.gov/daltcp/reports/2011/class/appGb.pdf [2 PDF pages]
APPENDIX H: Policy Papers Discussed by the LTC Work Group
HTML http://aspe.hhs.gov/daltcp/reports/2011/class/appH.htm
PDF http://aspe.hhs.gov/daltcp/reports/2011/class/appH.pdf [36 PDF pages]
APPENDIX I: CLASS Administration Systems Analysis and RFI
HTML http://aspe.hhs.gov/daltcp/reports/2011/class/appI.htm
PDF http://aspe.hhs.gov/daltcp/reports/2011/class/appI.pdf [10 PDF pages]
APPENDIX J: Additional Analyses for Early Policy Analysis
Full Appendix
HTML http://aspe.hhs.gov/daltcp/reports/2011/class/appJ.htm
PDF http://aspe.hhs.gov/daltcp/reports/2011/class/appJ.pdf [150 PDF pages]
Ja: A Profile of Declined Long-Term Care Insurance Applicants
PDF http://aspe.hhs.gov/daltcp/reports/2011/class/appJa.pdf [23 PDF pages]
Jb: CLASS Program Benefit Triggers and Cognitive Impairment
PDF http://aspe.hhs.gov/daltcp/reports/2011/class/appJb.pdf [65 PDF pages]
Jc: Strategic Analysis of HHS Entry into the Long-Term Care Insurance Market
PDF http://aspe.hhs.gov/daltcp/reports/2011/class/appJc.pdf [33 PDF pages]
Jd: Managing a Cash Benefit Design in Long-Term Care Insurance
PDF http://aspe.hhs.gov/daltcp/reports/2011/class/appJd.pdf [28 PDF pages]
APPENDIX K: Early Meetings with Stakeholders
HTML http://aspe.hhs.gov/daltcp/reports/2011/class/appK.htm
PDF http://aspe.hhs.gov/daltcp/reports/2011/class/appK.pdf [4 PDF pages]
APPENDIX L: In-Depth Description of ARC Model
HTML http://aspe.hhs.gov/daltcp/reports/2011/class/appL.htm
PDF http://aspe.hhs.gov/daltcp/reports/2011/class/appL.pdf [62 PDF pages]
APPENDIX M: In-Depth Description of AvalereHealth Model
HTML http://aspe.hhs.gov/daltcp/reports/2011/class/appM.htm
PDF http://aspe.hhs.gov/daltcp/reports/2011/class/appM.pdf [23 PDF pages]
APPENDIX N: September 22, 2010 Technical Experts Meeting
Full Appendix
HTML http://aspe.hhs.gov/daltcp/reports/2011/class/appN.htm
PDF http://aspe.hhs.gov/daltcp/reports/2011/class/appN.pdf [37 PDF pages]
Na: Agenda, List of Participants, and Speaker Bios
PDF http://aspe.hhs.gov/daltcp/reports/2011/class/appNa.pdf [7 PDF pages]
Nb: Presentation Entitled "Actuarial Research Corporation's Long Term Care Insurance Model"
PDF http://aspe.hhs.gov/daltcp/reports/2011/class/appNb.pdf [11 PDF pages]
Nc: Presentation Entitled "The Long-Term Care Policy Simulator Model"
PDF http://aspe.hhs.gov/daltcp/reports/2011/class/appNc.pdf [11 PDF pages]
Nd: Presentation Entitled "Comments on 'The Long-Term Care Policy Simulator Model'"
PDF http://aspe.hhs.gov/daltcp/reports/2011/class/appNd.pdf [7 PDF pages]
APPENDIX O: Actuarial Report on the Development of CLASS Benefit Plans
HTML http://aspe.hhs.gov/daltcp/reports/2011/class/appO.htm
PDF http://aspe.hhs.gov/daltcp/reports/2011/class/appO.pdf [47 PDF pages]
APPENDIX P: June 22, 2011 Technical Experts Meeting
Full Appendix
HTML http://aspe.hhs.gov/daltcp/reports/2011/class/appP.htm
PDF http://aspe.hhs.gov/daltcp/reports/2011/class/appP.pdf [46 PDF pages]
Pa: Agenda and Discussion Issues and Questions
PDF http://aspe.hhs.gov/daltcp/reports/2011/class/appPa.pdf [8 PDF pages]
Pb: Presentation Entitled "Core Assumptions and Model Outputs"
PDF http://aspe.hhs.gov/daltcp/reports/2011/class/appPb.pdf [7 PDF pages]
Pc: Presentation Entitled "Actuarial Research Corporation's Long Term Care Insurance Model"
PDF http://aspe.hhs.gov/daltcp/reports/2011/class/appPc.pdf [11 PDF pages]
Pd: Presentation Entitled "The Avalere Long-Term Care Policy Simulator Model"
PDF http://aspe.hhs.gov/daltcp/reports/2011/class/appPd.pdf [11 PDF pages]
Pe: Presentation Entitled "Alternative Approaches to CLASS Benefit Design: The CLASS Partnership"
PDF http://aspe.hhs.gov/daltcp/reports/2011/class/appPe.pdf [8 PDF pages]
APPENDIX Q: Table 2: Actuarial and Demographic Assumptions
HTML http://aspe.hhs.gov/daltcp/reports/2011/class/appQ.htm
PDF http://aspe.hhs.gov/daltcp/reports/2011/class/appQ.pdf [2 PDF pages]
APPENDIX R: Figure 1: Daily Benefit Amount for Increased Benefit
HTML http://aspe.hhs.gov/daltcp/reports/2011/class/appR.htm
PDF http://aspe.hhs.gov/daltcp/reports/2011/class/appR.pdf [2 PDF pages]