
ABSTRACT
This project studied the delivery of Medicare and Medicaid-funded services to dually eligible beneficiaries aged 65 and older in Minnesota. It compared fully-integrated managed care to service delivery when Medicare and Medicaid-funded services are delivered independently. The fully integrated Medicare-Medicaid managed care plans had greater primary care physician use and lower inpatient hospital and emergency department use. Similarly, home and community-based services use was greater and nursing home use was no greater. Once enrolled in the fully integrated plan, nearly all beneficiaries chose to remain, rather than switch to the alternative. In Minnesota, the fully integrated plan appears to be an improvement over the fragmented delivery systems of separate Medicare and Medicaid programs, yielding improved consumer satisfaction and service use.
DISCLAIMER: The opinions and views expressed in this report are those of the authors. They do not necessarily reflect the views of the Department of Health and Human Services, the contractor or any other funding organization.
Acknowledgment
The authors wish to thank staff from the Minnesota Department of Human Services for consultation on Minnesota programs and data access that made this project possible, and to JEN Associates in Cambridge, Massachusetts for providing access to the data and technical support for using it.
Acronyms
The following acronyms are mentioned in this report and/or appendices.
| ACA | Affordable Care Act |
|---|---|
| ADL | Activity of Daily Living |
| AOR | Adjusted Odds Ratio |
| CMS | Centers for Medicare and Medicaid Services |
| COPD | Chronic Obstructive Pulmonary Disease |
| DHS | Minnesota Department of Human Services |
| ED | Emergency Department |
| FAI | Financial Alignment Initiative |
| HCBS | Home and Community-Based Services |
| IRR | Incidence Rate Ratio |
| LTSS | Long-Term Services and Supports |
| MACPAC | Medicaid and CHIP Payment and Access Commission |
| MCO | Managed Care Organization |
| MDS | Minimum Data Set |
| MedPAC | Medicare Payment Advisory Commission |
| MSC+ | Minnesota Senior Care Plus |
| MSHO | Minnesota Senior Health Option |
| OLS | Ordinary Least Square |
| PCA | Personal Care Assistance |
| PCP | Primary Care Physician |
| SNF | Skilled Nursing Facility |
Executive Summary
This study tests the hypothesis that delivery of Medicare-funded and Medicaid-funded services to dually eligible beneficiaries aged 65 and older via fully integrated managed care plans is associated with stronger community-based service utilization patterns compared to service delivery when Medicare- and Medicaid-funded services are delivered independently. The hope is that integrated Medicare-Medicaid managed care plans will emphasize primary care physician (PCP) visits versus specialty physician visits, reduce preventable hospital stays and emergency department (ED) visits, and enable chronically disabled elders to obtain services at home or in "assisted living" settings in preference to long-stay nursing home use--strategies that are not easily accomplished under the fragmented delivery systems of separate Medicare and Medicaid programs.
To test the hypothesis, we compare service delivery patterns among elderly dually eligible beneficiaries enrolled in two alternative managed care service delivery systems in Minnesota: Minnesota Senior Care Plus (MSC+) and the Minnesota Senior Health Option (MSHO). MSC+ is a Medicaid-only program, while MSHO is a fully integrated Medicare-Medicaid program. With few exceptions, elderly dual eligible beneficiaries in Minnesota are required to enroll in an MSC+ managed care plan for their Medicaid-covered services or, if they choose, enroll in an MSHO managed care plan that provides both Medicare-funded and Medicaid-funded services in one program. MSC+ members are assigned a case manager who helps them with their Medicaid-funded services (largely long-term care services and supports), while MSHO members are assigned a care coordinator who helps them with all of their Medicare-funded and Medicaid-funded services. MSC+ enrollees receive their Medicare-funded services through traditional fee for service Medicare or a Medicare Advantage plan, along with a Medicare Part D prescription drug plan, and must coordinate their own Medicare services.
Because dual eligibles in Minnesota can choose to enroll in MSHO rather than MSC+, and can switch between MSHO and MSC+, we examine MSHO enrollment rates and changes in MSHO enrollment over time as well as the beneficiary characteristics and community factors that are associated with the decision to enroll in MSHO. Subsequent comparisons of service use patterns across MSC+ and MSHO control for differences in beneficiary characteristics and community factors to estimate the effects of MSHO relative to MSC+ on service use patterns for similar individuals. We also explore the potential impact of unmeasured differences in the characteristics of those making a choice between the MSHO and MSC+ on the estimated differences in MSHO and MSC+ service use. Finally, we briefly describe characteristics that differentiate Medicare-only beneficiaries and dual eligibles enrolled in MSC+ and MSHO and then examine differences in their service use patterns. The study used an extensive dataset that measures beneficiary characteristics, enrollment status, and service use.
In recent years, Minnesota has increased the number of people served under MSHO while also reducing nursing home use.1 Analyses that shed light on how this has been accomplished and whether MSHO enrollment and reduced nursing home use are related may be useful to Centers for Medicare and Medicaid Services (CMS) as it partners with states to test various Medicare-Medicaid integrated care options, some as part of the Affordable Care Act implementation.
Data and Methods
We created person-year level files containing three years (2010-2012) of data from the person-month file provided by JEN Associates to create the following measures. We created a variable reflecting yearly MSHO enrollment, coded 1 if in the MSHO program throughout the year, and 0 otherwise (that is, in the MSC+ program throughout the year). We created nine measures of service utilization pertaining to any hospital inpatient care, outpatient ED use, long-term care nursing home use, overall physician use, PCP use, specialist use, home and community-based services (HCBS), assisted living, and hospice care. We also created five count measures for levels of use reflecting the number of hospital inpatient stays, outpatient ED visits, overall physician visits, PCP visits, and specialist visits. We performed descriptive and multivariate analyses controlling for characteristics of the individuals and their communities.
Key Results
Enrollment Analysis Highlights
-
MSHO enrollees tended to be older, female, to have more medical conditions and disabilities, to have died during the year, and were slightly more likely to live in rural areas of the state.
-
Very few MSHO enrollees ever switched to MSC+ during a year, but 12.8 percent of MSC+ enrollees switched to MSHO after the beginning of a year.
Outcomes Analyses Highlights
-
Controlling for differences in observed individual-level and area-level characteristics of MSHO and MSC+ enrollees, MSHO enrollees were:
- 48 percent less likely to have a hospital stay, and if so, had 26 percent fewer stays than if in MSC+.
- 6 percent less likely to have an outpatient ED visit, and if so, had 38 percent fewer visits than if in MSC+.
- 2.7 times more likely to have a PCP visit, but if so, had 36 percent fewer visits than in MSC+.
- No more likely to have a specialist visit, but if so, had 36 percent fewer visits than in MSC+.
- No more likely to have a long-term nursing home admission than in MSC+.
- 13 percent more likely to have any HCBS than in MSC+.
- 16 percent less likely to have any assisted living services than in MSC+.
- 9 percent more likely to have any hospice care use than in MSC.
- In urban areas, less likely to have inpatient care and more likely to have PCP care over time between 2010 and 2012.
- In rural areas, no more likely to have assisted living facility use.
Discussion
-
Minnesota dual eligibles electing MSHO enrollment differed from those remaining in the MSC+ program on a range of individual characteristics. MSHO enrollees tended to be older, female, to have more medical conditions and disabilities, to have died during the year, and were slightly more likely to live in rural areas of the state.
-
Although MSC+ enrollees were increasingly likely to enroll in MSHO over time, MSHO enrollees rarely opted out of the MSHO program once enrolled. Very few of those who were in MSHO in January of a year ever switched to MSC+ during that year, but 12.8 percent of those who were in MSC+ in January of a year switched to MSHO by the end of the year. Although MSHO enrollees can disenroll from MSHO and elect MSC+ effective at the beginning of the next month, the finding that almost none do suggests high satisfaction with services received under MSHO.
-
Compared to MSC+ enrollees, MSHO enrollees had lower hospital and ED use, but greater prevalence of primary care service use. Both before and after controlling for differences in observed individual- and area-level characteristics, MSHO enrollees received less care in hospital settings than MSC+ enrollees. This finding that hospital use was lower even prior to controlling for differences in MSC+ and MSHO enrollee's characteristics was unexpected because MSHO enrollees were somewhat older and had somewhat greater prevalence of selected medical conditions and disabilities. MSHO enrollees also had a much higher prevalence of primary care use both before and after controlling for differences in MSC+ and MSHO enrollees' characteristics.
-
Prior to controlling for enrollee differences, MSHO enrollees were more likely than MSC+ enrollees to have a long-term nursing home stay as would be expected based on their being older, more female, and having more complex medical conditions. They were also more likely to have any HCBS and assisted living facility use. After controlling for differences in enrollee characteristics, MSHO enrollees continued to be more likely to use HCBS but were less likely to use assisted living services compared to enrollees in MSC+ and no more likely to have a long-term nursing home stay.
-
Finally, it is always important to consider the potential for selection bias in analyses comparing enrollees in different programs. Our ability to quantitatively assess the potential for selection bias due to unobserved characteristics in our impact estimates using the method developed by Oster (2015) is an advancement from prior studies. We found that, if we had been able to incorporate the unmeasured variables, our estimates of MSHO effects would be unlikely to change direction, and, in many cases, could potentially be much larger in magnitude.
Conclusion
These findings suggest that adopting fully integrated care models similar to MSHO may have merit for other states. CMS and 12 states (including Minnesota) are currently participating in the Financial Alignment Initiative to improve care for dual eligibles using either managed fee for service or fully capitated models. This study found that one type of capitated model, as represented by the MSHO program, is associated with improved patterns of care which has the potential for improving health and health care outcomes for dual eligibles.
1. Introduction
1.1. Background and Purpose of Study
Roughly 10 million Americans are eligible for both Medicare and Medicaid (e.g., dual eligibles) and so obtain their health care under the two separate programs (MACPAC, 2016). Because Medicare is the first payer for all Medicare-covered medical and post-acute services, dual eligibles rely on Medicare for much of their acute and post-acute care services and Medicaid for services not covered by Medicare, which are primarily long-term services and supports (LTSS). With the Medicare program and individual state Medicaid programs governed by their own policies and procedures, relying on separate care delivery systems, and imposing differing financial incentives, dual eligibles with medical, behavioral, and/or LTSS needs are often served by multiple providers with few incentives for appropriate care coordination across them. This fragmentation results in unnecessary, duplicative, or missed services, raising concerns about quality of care and poor outcomes for dual eligibles and inefficiency in care delivery across Medicare and Medicaid (Polniaszek, Walsh, & Wiener, 2011; MedPAC, 2010; Grabowski, 2009; Walsh et al., 2010). The poor coordination of Medicare and Medicaid benefits have long been problems for the dual eligible population (Grabowski, 2007; Ryan & Super, 2003), and have led to frequent proposals to integrate care across the programs.
By integrating the administration, financing, and delivery of primary, acute, behavioral health, and LTSS in the Medicare and Medicaid programs, Medicare-Medicaid integrated care models offer a significant opportunity to improve care for dual eligibles and control costs for both the Medicare and Medicaid programs. Person-centered care delivery models that offer the full range of medical, behavioral health, and LTSS services in an efficient and cost-effective integration model have the potential to address the current problems associated with the lack of coordination of Medicare and Medicaid benefits, financing, and incentives. However, there have long been barriers to developing and implementing Medicare-Medicaid integration models, including issues associated with sharing of cost savings. Integrated Medicare-Medicaid models that rely on capitated care provide a way to internalize such cost savings across programs. Currently, states rely on a range of capitated models, from capitation of limited Medicaidbenefits, to capitation for comprehensive Medicaid benefits, to capitation for comprehensive Medicare and Medicaid benefits. With the authorization of the Affordable Care Act (ACA) and the commitment of federal leadership to remove longstanding obstacles to integration and promote innovative models of care between Medicare and Medicaid, there is a greater opportunity for states to make real progress on improving care for dual eligibles. According to a fall 2012 survey of the 50 states and the District of Columbia, two-thirds of states were interested in launching new initiatives to better coordinate care for dual eligibles, with most of the initiatives quite broad in scope (Walls et al., 2013).
Many of these state initiatives build upon existing state Medicaid managed care programs and Medicare managed care plans. The latter include Medicare Advantage plans that accept all Medicare beneficiaries as members and special needs plans that exclusively serve Medicare beneficiaries with chronic conditions or dual eligibles. Managed care plans, which deliver needed medical and related services under a capitated payment already have incentives to provide care in the most cost-effective way to assure service use that is necessary and appropriate, albeit only within the services included under Medicaid (for Medicaid managed care plans) and Medicare (for Medicare managed care plans). Although some managed care organizations (MCOs) may offer both Medicaid-only and Medicare-only managed care plans and may seek to coordinate Medicare and Medicaid-covered services for dual enrollees, with few exceptions, they must do so while administering each plan separately and, in particular, maintaining separate financial accounting with no co-mingling of Medicare and Medicaid funding.
This study tests the hypothesis that delivery of Medicare-funded and Medicaid-funded services to dually eligible beneficiaries aged 65 and older via fully integrated managed care plans is associated with stronger community-based service utilization patterns compared to service delivery when Medicare-funded and Medicaid-funded services are delivered independently. The hope is that integrated Medicare-Medicare managed care plans will emphasize primary care physician (PCP) visits vs. specialty physician visits, reduce preventable hospital stays and emergency department (ED) visits, and enable chronically disabled elders to obtain services at home or in "assisted living" settings in preference to long-stay nursing home use, strategies that are not easily accomplished under the fragmented delivery systems of separate Medicare and Medicaid programs.
To test the hypothesis, we compare service delivery patterns among elderly dually eligible beneficiaries enrolled in two alternative managed care service delivery systems in Minnesota: Minnesota Senior Care Plus (MSC+) and the Minnesota Senior Health Option (MSHO). MSC+ is a Medicaid-only program, while MSHO is a fully integrated Medicare-Medicaid program. With few exceptions, elderly dual eligible beneficiaries in Minnesota are required to enroll in an MSC+ managed care plan for their Medicaid-covered services or, if they choose, enroll in an MSHO managed care plan that provides both Medicare-funded and Medicaid-funded services in one program. MSC+ members are assigned a case manager who helps them with their Medicaid-funded services (largely LTSS), while MSHO members are assigned a care coordinator who helps them with all of their Medicare-funded and Medicaid-funded services. MSC+ enrollees receive their Medicare-funded services through traditional fee for service Medicare or a Medicare Advantage plan, along with a Medicare Part D prescription drug plan, and must coordinate their own Medicare services.
The study used an extensive dataset that includes beneficiary characteristics, enrollment status, and service use. In recent years Minnesota has increased the number of people served under MSHO while also reducing nursing home use.2 Analyses that shed light on how this has been accomplished and whether MSHO enrollment and reduced nursing home use are related may be useful to Centers for Medicare and Medicaid Services (CMS) as it partners with states to test various integrated care options, some as part of ACA implementation.
RTI International and its subcontractor, The Urban Institute, addressed five research questions to assess the two Minnesota managed care programs for dual eligibles to better understand who enrolls in MSHO and MSC+ and the relative effects of the two programs on service use. The research questions were:
-
What are the characteristics that differentiate elderly Medicare-Medicaid beneficiaries who choose to have Medicare-covered services provided through the fully integrated Medicare-Medicaid (MSHO) plans rather than through Medicare fee for service in conjunction with the MSC+ program?
-
What methodologies or approaches have the potential to differentiate the impact of integrated care from differences in the measured and unmeasured characteristics of those making their enrollment choice between the MSHO and MSC+ programs?
-
How do acute medical and LTSS use patterns differ between elderly beneficiaries in the MSHO and MSC+ programs? Do these service use patterns persist after controlling for diagnoses and disability?
-
How do MSHO and MSC+ service use patterns vary by demographic characteristics and level of disability?
-
How do dual eligibles compare with other elderly non-dual eligible Medicare beneficiaries in terms of frailty?
1.1.1. Minnesota Context
Minnesota has been a national leader in innovation in health care delivery for elderly people and adults with disabilities. The state had an early (1981) Section 1115 waiver to expand the use of home and community-based care as an alternative to nursing home care. Since that time, Minnesota has continued to move aggressively to expand the use of home and community-based services (HCBS) for both the elderly and disabled populations via Section 1115 waivers and, more recently, 1915(a) authority.
Minnesota has also used its assessment process and managed care to reduce nursing home use. The state has designed assessment tools to help "shut the back door" to unnecessary nursing home stays by assessing all Medicaid seniors to assure access to HCBS when needed. The state has also worked to "shut the front door" to such admissions by promoting access to and availability of cost-effective HCBS to reduce the prevalence of spending down to Medicaid through longer nursing home stays. The expansion of alternative service provision venues in the state, such as assisted living, may also have played a role in reducing spenddown to Medicaid eligibility by reducing long nursing home stays.
Health care and LTSS services are provided to elderly people through managed care arrangements under the MSC+ or MSHO programs. The MSC+ program, a 1915(b)(c) combination, is mandatory for elderly Medicaid enrollees who do not enroll in the MSHO program. The MSC+ program originated from the earlier MSC program in the mid-1980s under which Minnesota required elderly Medicaid beneficiaries to receive all Medicaid state plan services (except state plan personal care assistance [PCA] services) through MCOs and LTSS on a fee for service basis. PCA services were not added into managed care until the mid-1990s. From 2005-2009 the state phased in managed LTSS waiver services to create MSC+ through a 1915(b)(c) waiver authority. During this phase-in period, the state continued to have a significant number of people in the MSC program in metro areas who continued to get waiver services under fee for service. In July 2013, 11,147 dual eligibles were enrolled in MSC+ plans.
Starting in 1997, Minnesota operated MSHO under a Section 1115 Medicaid waiver of the Social Security Act and a Medicare payment demonstration waiver under Section 402 of the Social Security Act in selected areas of the state. MSHO expanded statewide in 2005. The DHS reports that under the MSHO program nearly all enrollees have annual assessments, and individualized care coordination (DHS, 2016 ). MSHO plans are at risk for nursing facility use up to 180 days, and then are reimbursed on a fee for service basis. They are also responsible for all Medicare skilled nursing facility (SNF) stays. In July 2013, 35,361 were enrolled in MSHO plans.3
The LTSS benefit and qualification for it is largely the same across the MSHO and MSC+ programs. HCBS, which is delivered under a 1915(c) waiver, provides homemaker, chore, and respite services, adult day care, transportation, assistive technologies, home modifications, and assisted living. PCA services under the elderly waiver are minimal due to Minnesota's large state plan personal care program.
The choice of health plans available to dual eligibles under the MSC+ and MSHO programs vary across the counties in the state. Under state contract requirements, these managed care plans offer different model designs, care management type and focus, and different provider networks, so consumers in counties with more than one plan have a choice of care systems.
Because of their recent successes with reducing costs under the MSHO program, Minnesota has elected to not participate fully in CMS's Financial Alignment Initiative (FAI). Over the years, the state has reduced costs to the extent where the rate setting process for integrated Medicare Medicaid Plans is not viable for the state. Instead, Minnesota's FAI demonstration is addressing a variety of administrative approaches to foster Medicare and Medicaid integration under MSHO.
Minnesota's experiences with both the MSHO and MSC+ programs are relevant to other states as they explore alternative strategies to begin to integrate Medicare and Medicaid, including under FAI. The MSC+ program provides an example of a model that relies on coordination while the MSHO program employs a fully integrated model. The analyses in this study also will be beneficial to the evaluation of CMS's FAI, providing an earlier look at key outcomes that will be examined, and potentially helping identify areas on which to focus in assessing changes in utilization.
2. Methods
As noted above, there are three components of the study: (1) the analysis of MSHO and MSC+ enrollment decisions for elderly dual eligibles; (2) the analysis of service use under MSHO and MSC+ by elderly dual eligibles; and (3) the comparison of elderly Medicare-only adults to the dual eligibles enrolled in MSHO and MSC+. This section describes the populations studied, data sources, measure construction, and statistical analyses performed.
2.1. Populations Studied
The sample for the principal analyses of utilization of dual eligibles is limited to 121,696 observations on full dual eligibles (having both Medicare Parts A and B and full Medicaid benefits) ages 65 and older who were consistently enrolled in either the MSHO or MSC+ program during any of the three years over 2010–2012 (excluding those who switched plans in a given year). Persons with intellectual or developmental disabilities or those who qualified for Medicaid as medically needy were excluded. Analyses were limited to adults in counties that offered at least one plan in each program in each year. A separate analysis was conducted of 25,162 dual eligibles who switched from MSC+ to MSHO.
One secondary set of analyses compares those dual eligibles to Medicare beneficiaries in Minnesota who were not dual eligibles as an additional comparison group. Sample size for this group ranged from 600,438 in 2010 to 612,052 in 2011 and 631,132 in 2012 (1,843,622 beneficiaries across three years).
2.2. Data
Data for the study were obtained from three sources for the State of Minnesota:
-
Dataset on dual eligibles containing fee for service claims, managed care encounters, and enrollment data.
-
Dataset on (Medicare-only) non-dual eligibles containing fee for service claims, and enrollment data.
-
Minimum Data Set (MDS) data containing nursing home assessments on dual eligible.
Claims and encounter data included information on inpatient, ED, outpatient, hospice, HCBS, and nursing home services. Acquisition of these data required two separate data use agreements with CMS and one with the State of Minnesota.
2.2.1. Dual Eligibles Data
These data were needed to address all research questions in the original Request for Proposal except for the single research question pertaining to non-dual eligible (Medicare-only beneficiaries). The data were in the possession of JEN Associates for supporting the State of Minnesota in its administration of the Medicaid program. JEN Associates made two datasets available--one at the person-month level and another at the claims/encounter-level.
2.2.2. Non-Dual Eligibles Data
These data were needed to address the research question pertaining to differences in individual characteristics and utilization between MSHO and the non-dual eligible population. These data were also provided by JEN Associates who produced both person-month and claims/encounter-level datasets.
2.2.3. Minimum Data Set Assessment Data
These data were used to assess differences in frailty across the MSHO and MSC+ populations at the time of nursing home entry. We had also sought to analyze State of Minnesota LTSS assessment data but learned in conversations with the state that some assessments were not routinely performed on all individuals and that some information of interest was not available on the assessments. Therefore, we decided not to analyze these data.
2.3. Measure Construction
We created person-year level files containing three years (2010-2012) of data from the person-month file provided by JEN Associates to create the following measures.
2.3.1. Enrollment
We created a dummy variable reflecting yearly enrollment, coded 1 if in the MSHO program throughout the year, and zero otherwise (that is, in the MSC+ program throughout the year).
2.3.2. Outcomes
We created nine measures of service utilization pertaining to any hospital inpatient care, outpatient ED use, long-term care nursing home use, overall physician use, PCP use, specialist use, HCBS (inclusive of assisted living facility use), assisted living, and hospice care. These measures were coded 1 if there was any use of each respective service, and zero otherwise, annually. We also created five count measures for levels of use reflecting the number of hospital inpatient stays, outpatient ED visits, overall physician visits, PCP visits, and specialist visits. Data on the level of long-term nursing home, HCBS, assisted living, and hospice use were complicated and construction of reliable count measures was beyond the scope of this project. Before using the count measures in regression analysis, we deleted extreme outliers at the far right tail of the distribution for the outpatient ED visit, overall physician visit, PCP visit, and specialist visit measures, which constituted only 0.05 percent of the overall sample for each measure. We did not delete any observations from the inpatient stay measure before regression analysis because no extreme outliers in the count of inpatient stays were observed in the data.
2.3.3. Individual Characteristics
Five dummy variables were created reflecting age groups (65-69 as the reference group, 70-74, 75-79, 80-84, 85-89, and 90+) and dummy variables for female gender and whether a person died during the year.
Five dummy variables were created for the following disability and medical conditions:
-
Mental illness (any diagnosis for Alzheimer's disease or dementia, chronic mental illness, depression, psychosis, or schizophrenia).
-
Neurological disability (any diagnosis for neurologic impairment or Parkinson's disease).
-
Physical disability (any diagnosis for physical impairment).
-
Sensory disability (any diagnosis for sensory impairment).
-
Other medical disability or chronic disease (diagnoses for selected medical disability or chronic diseases such as arthritis, chronic respiratory disease (chronic obstructive pulmonary disease [COPD], asthma, emphysema, or bronchitis), congestive heart failure, coronary heart disease, stroke, or diabetes).
2.3.4. Area-Level Characteristics
For regression analysis, we created and used either five area-specific measures or county fixed effects, to see if model estimates varied across these two formulations. The five area-specific covariates (all measured at the county level) were:
- Number of PCPs per 1,000 population;
- Percent of population 65+ who do not live in community;
- Percent of population 65+ who live in community with others;
- Percent of population 65+ with college education;
- Percent of population 65+ who are married.
2.3.5. Minimum Data Set Measure Construction
In each year, we merged individuals in our analytic sample to nursing home resident assessments data from the MDS to identify newly admitted nursing home residents during the year. Specifically, a new nursing home admission was determined by the availability of an MDS assessment during a given year that is indicated as either an admission or a Medicare five-day or 14-day assessment. In addition, we looked retrospectively at the MDS data for each person to make sure the person had no prior nursing home use during the 100-day period before the date of admission to allow for "clearance" of prior nursing home use and establishing a new nursing home admission.
We focused on measures of cognitive impairment and limitations in performing five activities of daily living (ADLs): eating, toileting, transferring, bathing, and dressing. Changes for many MDS items, following the transition from MDS Version 2.0 to Version 3.0 in the last quarter of 2010, required that we separate results before and after 2010. Definitional differences between V2.0 and V3.0 posed a challenge for comparing MDS data over time between the two versions. For this descriptive analysis, the focus is on cross-sectional comparison of new nursing home admissions between individuals in the MSHO vs. MSC+ group, rather than differences over time.
2.4. Statistical Analyses
We analyzed the enrollment choice of MSHO and MSC+ enrollees and the impact of enrollment in a MSHO plan vs. in a MSC+ plan on the range of outcome measures for which data were available. We used logistic regression models for dichotomous outcome variables (enrollment choice and any use of each specific type of service). For count outcomes, we estimated negative binomial regression models that account for dispersion in the count data. In presenting the multivariate analysis results, we report odds ratios from logistic regression models and incidence rate ratios (IRRs) (which have a similar interpretation to odds ratios) from negative binomial regression models.
For both the enrollment choice and outcomes analyses we present descriptive statistics comparing MSHO and MSC+ enrollees to identify differences across the two groups. We performed multivariate regression analyses to determine the independent effect of the policy variable of interest (e.g., MSHO enrollment) on the outcome (e.g., any inpatient stay) after controlling for other individual and area-level characteristics. Regressions were performed on the 2010–2012 sample as a whole, controlling for calendar year effects, using 2010 as the omitted (reference) year in analyses. The regression models were run three times with the list of covariates differing each time. The three configurations of covariates were:
-
Beneficiary-level covariates only (Model 1 in tables).
-
Add specific area-level covariates to the Model 1 beneficiary-level covariates (Model 2).
-
Add county fixed effects (in place of specific area-level covariates) to the Model 1 beneficiary-level covariates (Model 3) (used for summary-level results when comparing the overall sample to urban and rural subgroups).
In multivariate analyses, we estimate a main model using the entire sample and the three versions listed above, but also estimate the same three models separately for urban counties and for rural counties. We anticipated that there would be some differences between urban and rural counties in terms of not only the populations, but also area-level factors. In reporting findings, we focus on Model 3, which provides the best goodness-of-fit measures across the three models. However, there is little difference in the findings across the three models, which yield a consistent assessment of the outcomes under MSHO relative to MSC+. The detailed model results for all outcomes are included in the Appendix.
For the MDS descriptive analysis, we assessed differences between MSHO and MSC+ nursing home admits in each year in physical and cognitive functions at the time of nursing home admission. We computed and compared the percentages of newly admitted nursing home residents with each of the select characteristics between residents in the MSHO group vs. those in the MSC+ group. We did this overall and stratified by age-sex groupings, where age is categorized into three broad groups (65-74, 75-84, and 85+) to ensure adequate sample size in each stratum. To increase sample size for robust descriptive statistics, we pooled data from 2011 and 2012 (based on MDS 3.0) for one set of analysis and data from 2008 and 2009 (based on MDS2.0) for a separate set of analysis. In addition, for 2008-2009 we added a third group--new nursing home admits among non-dual Medicare beneficiaries (hereafter also referred to as Medicare-only)--for comparison with new admits who were dual eligibles in the MSHO or MSC+ group.
There are likely to be unmeasured differences between MSHO and MSC+ enrollees that affect their health care utilization and, thus, have the potential to bias any comparison of outcomes under the two programs, making it difficult to assess the impacts of MSHO vs. MSC+. Therefore, we tested for potential effects of selection bias due to unobserved variables using a procedure developed for this purpose that presents upper and lower bounds for possible impact estimates had we been able to fully control for both observed and unobserved characteristics (Oster, 2015). In particular, we hypothesized that these omitted variables, which could include, for example, additional components of health and disability status, such as severity of chronic conditions and frailty, and family circumstances, such as marital status, living arrangements, and availability of informal caregivers, the potential to bias the estimates of the impacts of MSHO relative to MSC+ based on data available to this study.
3. Results
3.1. Enrollment Choice Results
3.1.1. Descriptive Results
Who are the MSHO and MSC+ Enrollees?
| TABLE 3-1. Sample Description: Characteristics of MSHO and MSC+ Enrollees, 2010-2012 | |||
|---|---|---|---|
| Characteristic | All | MSC+ | MSHO |
| Age group: | |||
| 65-69 (reference) | 16.8 | 27.6 | 14.4 |
| 70-74 | 17.0 | 17.6 | 16.9 |
| 75-79 | 15.8 | 13.4 | 16.3 |
| 80-84 | 16.4 | 14.4 | 16.9 |
| 85-89 | 16.1 | 13.4 | 16.7 |
| 90+ | 18.0 | 13.6 | 18.9 |
| Female | 72.4 | 68.4 | 73.3 |
| Died during year | 14.2 | 12.8 | 14.4 |
| Disabilities/conditions: | |||
| Cognitive/Mental illnessa | 60.1 | 58.8 | 60.4 |
| Neurological disabilityb | 48.0 | 43.3 | 49.0 |
| Physical disabilityc | 31.5 | 32.1 | 31.4 |
| Sensory disabilityd | 8.1 | 7.8 | 8.2 |
| Other medical disability or chronic diseasee | 85.6 | 82.4 | 86.2 |
| Calendar year: | |||
| 2010 (reference) | 32.4 | 31.8 | 32.5 |
| 2011 | 34.1 | 33.1 | 34.3 |
| 2012 | 33.5 | 35.1 | 33.2 |
| N | 121,696 | 21,935 | 99,761 |
NOTE: Numbers shown in table are percentages of enrollees with each characteristic.
|
|||
MSHO and MSHO-eligible MSC+ enrollees differed on a number of key dimensions over the 2010–2012 period, as shown in Table 3-1. Most notably, MSHO enrollees tended to be older than the MSC+ enrollees. Only 14.4 percent of MSHO enrollees were under age 70 compared to 27.6 percent of the MSC+ enrollees, while 18.9 percent of MSHO enrollees were age 90 or older compared to 13.6 percent of the MSC+ enrollees. Consistent with their higher average age, MSHO enrollees were more likely to have many of the health problems and disabilities examined (up to 5.7 percentage points more likely) and were slightly more likely to have died during the year (14.4 vs. 12.8 percent). MSHO enrollees were somewhat more likely to be female (73.3 vs. 68.4 percent), which may also reflect their older age given women's longer life span on average.
3.1.2. Where do the MSHO and MSC+ Enrollees Live?
As with the overall Minnesota population, MSHO and MSC+ enrollees were more concentrated in urban areas of the state. Comparatively though, a smaller proportion of MSHO enrollees (65.6 percent) were in urban counties, as compared to 69.6 percent of MSC+ enrollees (Table 3-2). Among urban counties only, Hennepin and Ramsey counties comprised 31.1 percent and 16.4 percent of MSHO enrollees, respectively, which was almost half (47.5 percent) of all urban MSHO enrollees. A larger proportion of the MSC+ population in urban areas was in these two counties (51.8 percent). On average, MSHO enrollment was higher than MSC+ enrollment in rural counties--at 34.4 percent vs. 30.4 percent.
| TABLE 3-2. Sample Description: Location of MSHO and MSC+ Enrollees, 2010-2012 | ||||
|---|---|---|---|---|
| Urban Counties MCOUNTY |
Urban Counties COUNTY_NAME |
Urban Counties All (%) |
Urban Counties MSC (%) |
Urban Counties MSHO (%) |
| Total Urban | Total Urban | 66.3 | 69.6 | 65.6 |
| MN002 | Anoka | 5.1 | 4.2 | 5.3 |
| MN005 | Benton | 1.3 | 1.2 | 1.3 |
| MN007 | Blue Earth | 1.7 | 0.8 | 1.9 |
| MN009 | Carlton | 1.6 | 0.6 | 1.8 |
| MN010 | Carver | 1.2 | 1.2 | 1.2 |
| MN013 | Chisago | 1.0 | 1.1 | 0.9 |
| MN014 | Clay | 1.8 | 0.9 | 2.0 |
| MN019 | Dakota | 6.0 | 8.1 | 5.5 |
| MN020 | Dodge | 0.6 | 0.3 | 0.6 |
| MN023 | Fillmore | 1.2 | 1.3 | 1.2 |
| MN027 | Hennepin | 31.4 | 32.4 | 31.1 |
| MN028 | Houston | 0.7 | 0.2 | 0.8 |
| MN030 | Isanti | 0.8 | 0.5 | 0.9 |
| MN040 | Le Sueur | 0.8 | 0.4 | 0.9 |
| MN048 | Mille Lacs | 1.1 | 0.4 | 1.2 |
| MN052 | Nicollet | 0.7 | 0.4 | 0.7 |
| MN055 | Olmsted | 3.6 | 5.4 | 3.2 |
| MN060 | Polk | 1.8 | 1.6 | 1.8 |
| MN062 | Ramsey | 16.9 | 19.4 | 16.4 |
| MN069 | St. Louis | 8.0 | 8.1 | 7.9 |
| MN070 | Scott | 1.9 | 2.3 | 1.8 |
| MN071 | Sherburne | 1.1 | 0.7 | 1.2 |
| MN072 | Sibley | 0.6 | 0.3 | 0.7 |
| MN073 | Stearns | 3.5 | 2.4 | 3.7 |
| MN079 | Wabasha | 0.7 | 0.4 | 0.8 |
| MN082 | Washington | 2.9 | 3.4 | 2.8 |
| MN086 | Wright | 2.1 | 1.8 | 2.2 |
| Total N, Urban | 80,673 | 15,263 | 65,410 | |
| Rural Counties | Rural Counties | Rural Counties | Rural Counties | Rural Counties |
| Total Rural | Total Rural | 33.7 | 30.4 | 34.4 |
| MN001 | Aitkin | 1.7 | 1.0 | 1.8 |
| MN003 | Becker | 2.9 | 3.0 | 2.9 |
| MN004 | Beltrami | 3.0 | 13.6 | 0.9 |
| MN006 | Big Stone | 0.8 | 0.2 | 0.9 |
| MN008 | Brown | 2.0 | 2.7 | 1.9 |
| MN011 | Cass | 1.8 | 1.7 | 1.9 |
| MN012 | Chippewa | 1.6 | 0.6 | 1.8 |
| MN015 | Clearwater | 1.2 | 4.2 | 0.6 |
| MN016 | Cook | 0.3 | 0.1 | 0.3 |
| MN017 | Cottonwood | 1.3 | 0.5 | 1.5 |
| MN018 | Crow Wing | 4.0 | 2.6 | 4.3 |
| MN021 | Douglas | 2.9 | 1.3 | 3.3 |
| MN022 | Faribault | 1.4 | 0.8 | 1.5 |
| MN024 | Freeborn | 2.3 | 6.3 | 1.5 |
| MN025 | Goodhue | 2.7 | 2.1 | 2.9 |
| MN026 | Grant | 0.6 | 0.2 | 0.6 |
| MN029 | Hubbard | 1.3 | 5.8 | 0.4 |
| MN031 | Itasca | 2.6 | 3.4 | 2.4 |
| MN032 | Jackson | 0.8 | 0.6 | 0.8 |
| MN033 | Kanabec | 1.2 | 0.9 | 1.2 |
| MN034 | Kandiyohi | 2.8 | 1.6 | 3.1 |
| MN035 | Kittson | 0.6 | 0.5 | 0.6 |
| MN036 | Koochiching | 1.4 | 1.4 | 1.4 |
| MN037 | Lac Qui Parle | 1.1 | 0.3 | 1.2 |
| MN038 | Lake | 0.6 | 0.7 | 0.6 |
| MN039 | Lake of the Woods | 0.4 | 2.1 | 0.0 |
| MN041 | Lincoln | 0.8 | 0.7 | 0.8 |
| MN042 | Lyon | 2.1 | 0.9 | 2.4 |
| MN043 | McLeod | 2.2 | 1.2 | 2.4 |
| MN044 | Mahnomen | 0.6 | 0.2 | 0.7 |
| MN045 | Marshall | 1.2 | 0.4 | 1.4 |
| MN046 | Martin | 2.1 | 0.6 | 2.3 |
| MN047 | Meeker | 1.9 | 0.9 | 2.1 |
| MN049 | Morrison | 3.3 | 4.6 | 3.0 |
| MN050 | Mower | 2.8 | 5.2 | 2.3 |
| MN051 | Murray | 0.9 | 0.2 | 1.0 |
| MN053 | Nobles | 1.8 | 1.1 | 1.9 |
| MN054 | Norman | 1.1 | 0.9 | 1.1 |
| MN056 | Otter Tail | 5.6 | 2.8 | 6.2 |
| MN057 | Pennington | 1.4 | 0.4 | 1.6 |
| MN058 | Pine | 2.3 | 1.6 | 2.4 |
| MN059 | Pipestone | 1.1 | 0.8 | 1.2 |
| MN061 | Pope | 1.4 | 0.3 | 1.6 |
| MN063 | Red Lake | 0.5 | 0.3 | 0.6 |
| MN064 | Redwood | 1.3 | 1.1 | 1.3 |
| MN065 | Renville | 1.0 | 0.5 | 1.1 |
| MN066 | Rice | 2.7 | 3.7 | 2.5 |
| MN067 | Rock | 0.7 | 0.1 | 0.8 |
| MN068 | Roseau | 1.4 | 0.6 | 1.6 |
| MN074 | Steele | 2.0 | 3.4 | 1.7 |
| MN075 | Stevens | 0.8 | 0.4 | 0.8 |
| MN076 | Swift | 1.6 | 0.8 | 1.7 |
| MN077 | Todd | 3.2 | 2.4 | 3.3 |
| MN078 | Traverse | 0.7 | 0.2 | 0.8 |
| MN080 | Wadena | 1.8 | 0.7 | 2.0 |
| MN081 | Waseca | 1.1 | 1.2 | 1.1 |
| MN083 | Watonwan | 0.9 | 0.4 | 1.0 |
| MN084 | Wilkin | 0.7 | 0.3 | 0.7 |
| MN085 | Winona | 2.9 | 2.5 | 3.0 |
| MN087 | Yellow Medicine | 1.2 | 0.4 | 1.3 |
| Total N, Rural | 41,023 | 6,672 | 34,351 | |
| Grand Total, Percent | 100.0 | 18.0 | 82.0 | |
| Grand Total , N | 121,696 | 21,935 | 99,761 | |
| NOTE: Numbers shown in table are percentages of enrollees in each county. | ||||
As would be expected given the wide dispersion of MSHO and MSC+ enrollees across the 87 counties in Minnesota, there were differences in the communities in which MSHO and MSC+ enrollees were living over the 2010-2012 period (Table 3-3). As shown, the counties of MSHO enrollees tended to be very similar to those of MSC+ enrollees, with only very small differences across measures of primary care availability and measures of the living arrangements, marital status, and education of adults 65 and older.
| TABLE 3-3. Sample Description: Characteristics of County of Residence for MSHO and MSC+ Enrollees, 2010-2012 | |||
|---|---|---|---|
| County Characteristics | All | MSC+ | MSHO |
| # PCPs per 1,000 population | 0.80 | 0.85 | 0.79 |
| % Population 65+ who do not live in community | 5.1 | 4.8 | 5.2 |
| % Population 65+ who live in community with others | 64.9 | 64.9 | 64.9 |
| % Population 65+ with college education | 21.7 | 23.0 | 21.4 |
| % Population 65+ who are married | 57.5 | 57.0 | 57.6 |
| N | 121,696 | 21,935 | 99,761 |
| NOTE: Numbers shown in table are mean numbers of percentages. | |||
What Plans are Available to MSHO and MSC+ Enrollees?
Over the 2010-2012 period there were eight different MCOs serving MSHO and/or MSC+ in Minnesota's 87 counties, including Blue Plus, HealthPartners, Itasca Medical Care, Medica, Metropolitan Health Plan, Primewest, South Country Health Alliance, and UCare. On average, the Minnesota counties with at least one MSHO and one MSC+ plan had 2.2 MSHO and 2.2 MSC+ plans over the period, generally operated by the same MCOs. In general, the urban counties had a larger number of plans in both MSHO and MSC+ than did rural counties.
How often do MSHO Enrollees Disenroll from MSHO?
There was very little disenrollment from MSHO over the 2010-2012 period. We estimate that less than 0.4 percent of MSHO enrollees who were in the program in January of any year had subsequently left the program during that same year (excluding those who died).
How often do MSC+ Enrollees Disenroll from MSC+? What are Their Characteristics?
On average, 12.8 percent of MSC+ enrollees at the beginning of any year subsequently switched to MSHO during the same year. Those who switch are slightly younger, are less likely to die, and have a slightly higher prevalence of medical conditions and disabilities (Table 3-4).
| TABLE 3-4. Comparison of Consistent MSHO Enrollees and Those Who Switched to MSC+ During the Year, 2010-2012 | ||||
|---|---|---|---|---|
| Characteristics | Overall (%) |
MSC+ Only Enrollees (%) |
MSC+ to MSHO Switchers (%) |
Statistical Significance |
| Age Group | *** | |||
| 65-69 | 28.0 | 27.6 | 30.4 | |
| 70-74 | 17.7 | 17.6 | 18.4 | |
| 75-79 | 13.6 | 13.4 | 15.0 | |
| 80-84 | 14.4 | 14.4 | 14.5 | |
| 85-89 | 13.1 | 13.4 | 11.7 | |
| 90+ | 13.1 | 13.6 | 10.0 | |
| Sex Group | *** | |||
| Female | 68.1 | 68.4 | 66.1 | |
| Male | 31.9 | 31.6 | 33.9 | |
| Died during year | *** | |||
| Alive | 87.9 | 87.2 | 93.0 | |
| Died | 12.1 | 12.8 | 7.0 | |
| Disabilities/conditions | ||||
| Cognitive/mental illness | 58.9 | 58.8 | 59.3 | |
| Neurological disability | 43.6 | 43.3 | 45.4 | * |
| Physical disability | 33.0 | 32.1 | 39.3 | *** |
| Sensory disability | 8.0 | 7.8 | 9.8 | *** |
| Other medical disability | 82.6 | 82.5 | 83.3 | |
| N | 25,162 | 21,935 | 3,227 | |
| (%) | (100.0) | (87.2) | (12.8) | |
| NOTE: Numbers shown in table are percentages of enrollees with each characteristic. */**/*** means statistically significant at p<0.10, 0.05, 0.01, respectively. |
||||
Are there differences in MSHO Enrollees and MSC+ Enrollees in Urban and Rural Areas?
The MSHO eligible population in urban areas is similar to the MSHO eligible population in rural areas on many dimensions, as shown in Table 3-5. Of note, however, the urban population tends to be younger than the rural population. For example, 16.1 percent of the MSHO eligible population in urban counties is under age 70 as compared to 11.0 percent in rural counties.
There are many more differences in the characteristics of the counties in which the urban and rural MSHO eligible population is living, with the population in urban counties having access to almost 50 percent more PCPs per capita than the population in rural counties. The population aged 65 and older in urban counties is also more likely to have a college education and less likely to be married than the rural population 65 and older.
| TABLE 3-5. Sample Description: Characteristics of MSHO and MSC+ Enrollees and Their County of Residence by Urban/Rural Status, 2010-2012 | ||||||
|---|---|---|---|---|---|---|
| Characteristics | Alla | MSC+a | MSHOa | Alla | MSC+a | MSHOa |
| Age group: | ||||||
| 65-69 (reference) | 18.4 | 28.5 | 16.1 | 13.4 | 25.7 | 11.0 |
| 70-74 | 18.7 | 18.6 | 18.7 | 13.7 | 15.3 | 13.3 |
| 75-79 | 16.6 | 13.6 | 17.4 | 14.0 | 13.0 | 14.2 |
| 80-84 | 16.1 | 14.5 | 16.5 | 17.0 | 14.3 | 17.6 |
| 85-89 | 14.9 | 12.9 | 15.3 | 18.5 | 14.4 | 19.3 |
| 90+ | 15.2 | 12.0 | 16.0 | 23.3 | 17.2 | 24.5 |
| Female | 71.9 | 68.4 | 72.7 | 73.3 | 68.3 | 74.3 |
| Died during year | 13.0 | 12.2 | 13.2 | 16.5 | 14.3 | 16.9 |
| Disabilities/conditions: | ||||||
| Cognitive/mental illnessc | 59.5 | 59.4 | 59.5 | 61.2 | 57.5 | 61.9 |
| Neurological disabilityd | 48.4 | 44.7 | 49.2 | 47.2 | 40.2 | 48.5 |
| Physical disabilitye | 32.4 | 33.3 | 32.2 | 29.7 | 29.3 | 29.8 |
| Sensory disabilityf | 8.7 | 8.5 | 8.8 | 6.8 | 6.2 | 7.0 |
| Other medical disability or chronic diseaseg | 84.9 | 82.0 | 85.5 | 86.9 | 83.5 | 87.6 |
| Calendar year: | ||||||
| 2010 (reference) | 32.2 | 31.6 | 32.3 | 32.8 | 32.2 | 33.0 |
| 2011 | 34.1 | 33.1 | 34.3 | 34.1 | 33.2 | 34.3 |
| 2012 | 33.7 | 35.3 | 33.4 | 33.0 | 34.6 | 32.7 |
| County characteristics: | ||||||
| # PCPs per 1,000 population | 0.90 | 0.94 | 0.88 | 0.61 | 0.63 | 0.61 |
| % Population 65+ who do not live in community | 5.0 | 4.8 | 5.0 | 5.4 | 4.9 | 5.5 |
| % Population 65+ who live in community with others | 64.4 | 64.5 | 64.4 | 65.7 | 65.8 | 65.7 |
| % Population 65+ with college education | 25.0 | 25.9 | 24.8 | 15.2 | 16.5 | 14.9 |
| % Population 65+ who are married | 55.5 | 55.2 | 55.6 | 61.4 | 60.9 | 61.5 |
| N | 80,673 | 15,263 | 65,410 | 41,023 | 6,672 | 34,351 |
NOTE: Numbers shown in table are percentages of enrollees with each characteristic.
|
||||||
Notwithstanding these urban and rural population differences, the differences between the MSHO and MSC+ enrollees within the urban and rural areas tended to mirror the differences for the overall population. For example, MSHO enrollees tend to be older and are more likely to be female than MSC+ enrollees in both urban and rural counties.
3.1.3. Multivariate Results
What Factors are Associated with MSHO Enrollment?
Among the MSHO eligible population in the 87 counties that had at least one MSHO and one MSC+ plan during the 2010-2012 period, the probability of MSHO enrollment is higher for women than men and increases with age in the model that controls for individual characteristics (Table 3-6, Model 1). As shown, adults age 70 and older are more likely to enroll in MSHO than adults under age 70 (the reference group), with odds ratios ranging from 1.82 for adults age 70-74 to 2.53 for adults age 90 or older. The odds ratio of 1.82 means a person having the characteristic described (in this case, age 70 or older), is 82 percent more likely to enroll in MSHO than those under age 70. The increase in the odds of enrolling in MSHO as the eligible population ages is consistent with a cumulative effect of outreach and enrollment efforts over time and, as noted above, very little disenrollment from MSHO for those who do enroll. Perhaps also reflecting the influence of time, eligible adults who die during the year are somewhat less likely to be MSHO enrollees after controlling for other factors.
| TABLE 3-6. Logistic Regression Results on Enrollment in a MSHO Plan (vs. MSC+), 2010-2012: Overall Sample, Model 1 | ||
|---|---|---|
| Characteristic | β | AOR |
| Age group (Ref.=65-69): | ||
| 70-74 | 0.600 *** | 1.822 |
| 75-79 | 0.824 *** | 2.280 |
| 80-84 | 0.774 *** | 2.169 |
| 85-89 | 0.826 *** | 2.283 |
| 90+ | 0.927 *** | 2.527 |
| Female | 0.147 *** | 1.159 |
| Died during year | -0.058 * | 0.943 |
| Disabilities/conditions: | ||
| Mental illnessa | -0.038 * | 0.963 |
| Neurological disabilityb | 0.057 ** | 1.059 |
| Physical disabilityc | -0.009 | 0.991 |
| Sensory disabilityd | 0.060 * | 1.061 |
| Other medical disability or chronic diseasee | 0.176 *** | 1.192 |
| Calendar year (Ref.=2010): | ||
| 2011 | 0.021 | 1.021 |
| 2012 | -0.065 *** | 0.937 |
| County characteristics: | ||
| # PCPs per 1,000 population | --- | |
| % Population 65+ who do not live in community | --- | |
| % Population 65+ who live in community with others | --- | |
| % Population 65+ with college education | --- | |
| % Population 65+ who are married | --- | |
| County fixed effects | NO | |
| N | 121,696 | |
NOTE: Model predicting the probability of being an MSHO enrollee (i.e., MSHO=1, MSC+=0).
Statistical significance: * p<0.05, ** p<0.01, *** p<0.001. |
||
The association between health and disability status and MSHO enrollment is somewhat mixed. Primarily, adults with other chronic disease/medical disabilities (beyond the specific categories of illness and disability listed in the table) are almost 20 percent more likely to enroll in MSHO than MSC+, all else equal. Otherwise, there was no significant difference in MSHO enrollment for adults with a physical disability, while adults with a sensory disability, neurological disability, or other chronic disease/medical disabilities are somewhat more likely to enroll in MSHO and those with a mental disability or illness are somewhat less likely. MSHO enrollment varied modestly over time, with enrollment somewhat higher in 2011 and lower in 2012 relative to 2010.
Adding controls for county characteristics improves the explanatory power of the model but has little impact on the key findings as the basic relationship between the characteristics of the eligible adults and the likelihood MSHO enrollment remains stable (Table 3-7, Model 2). As with the model with only individual-level covariates, we see increased MSHO enrollment for women and older adults, and a mixed pattern for adults with different health conditions and disabilities after adding controls for county characteristics (Model 2).
Similarly, replacing the area-level covariates with county fixed effects also improves the explanatory power of the model over the base model with little effect on the relationship between the characteristics of the eligible adults and the likelihood of MSHO enrollment (Table 3-8, Model 3). As with the base model and the models with county-level characteristics, the odds of MSHO enrollment increase for women and older adults, while the pattern remains mixed for adults with different health conditions and disabilities, all else equal.
Are there Differences in the Factors Associated with MSHO Enrollment in Urban and Rural Areas?
As was true for the overall population, the probability of MSHO enrollment is higher for women than men and increases with age in both urban counties (Table 3-9, Model 1; Table 3-10, Model 2; Table 3-11, Model 3) and rural counties (Table 3-12, Model 1; Table 3-13, Model 2; Table 3-14, Model 3). As was true for the overall population results in Table 3-6, the addition of county-level characteristics (Model 2) or county fixed effects (Model 3) in Table 3-7 and Table 3-8, although the area-level characteristics improved the overall explanatory power of the model, had little impact on the core findings.
The enrollment analyses identified differences between MSHO and MSC+ enrollees and their communities and highlights the need to control for these characteristics in analyses comparing health care use among those in the MSHO and MSC+ programs. The odds of MSHO enrollment are significantly higher for women, older adults, and adults with certain medical conditions and disabilities, as well as for adults in some Minnesota communities. Controlling for those differences areimportant in determining whether there are significant improvements in health care use for MSHO enrollees relative to similar individuals who remain in MSC+.
| TABLE 3-7. Logistic Regression Results on Enrollment in a MSHO Plan (vs. MSC+), 2010-2012: Overall Sample, Model 2 | ||
|---|---|---|
| Characteristic | β | AOR |
| Age group (Ref.=65-69): | ||
| 70-74 | 0.603 *** | 1.827 |
| 75-79 | 0.817 *** | 2.264 |
| 80-84 | 0.735 *** | 2.086 |
| 85-89 | 0.765 *** | 2.148 |
| 90+ | 0.848 *** | 2.335 |
| Female | 0.143 *** | 1.154 |
| Died during year | -0.070 ** | 0.932 |
| Disabilities/conditions: | ||
| Mental illnessa | -0.053 ** | 0.949 |
| Neurological disabilityb | 0.079 *** | 1.083 |
| Physical disabilityc | 0.012 | 1.012 |
| Sensory disabilityd | 0.077 ** | 1.080 |
| Other medical disability or chronic diseasee | 0.164 *** | 1.178 |
| Calendar year (Ref.=2010): | ||
| 2011 | 0.100 *** | 1.105 |
| 2012 | -0.013 | 0.987 |
| County characteristics: | ||
| # PCPs per 1,000 population | -0.155 *** | 0.856 |
| % Population 65+ who do not live in community | 0.081 *** | 1.085 |
| % Population 65+ who live in community with others | 0.015 *** | 1.016 |
| % Population 65+ with college education | -0.019 *** | 0.981 |
| % Population 65+ who are married | -0.011 *** | 0.989 |
| County fixed effects | NO | |
| N | 120,815g | |
NOTE: Model predicting the probability of being an MSHO enrollee (i.e., MSHO=1, MSC+=0).
Statistical significance: * p<0.05, ** p<0.01, *** p<0.001. |
||
| TABLE 3-8. Logistic Regression Results on Enrollment in a MSHO Plan (vs. MSC+), 2010-2012: Overall Sample, Model 3 | ||
|---|---|---|
| Characteristic | β | AOR |
| Age group (Ref.=65-69): | ||
| 70-74 | 0.643 *** | 1.902 |
| 75-79 | 0.861 *** | 2.364 |
| 80-84 | 0.772 *** | 2.163 |
| 85-89 | 0.798 *** | 2.221 |
| 90+ | 0.881 *** | 2.413 |
| Female | 0.153 *** | 1.165 |
| Died during year | -0.070 ** | 0.933 |
| Disabilities/conditions: | ||
| Mental illnessa | -0.050 ** | 0.951 |
| Neurological disabilityb | 0.050 ** | 1.051 |
| Physical disabilityc | -0.007 | 0.993 |
| Sensory disabilityd | 0.053 | 1.054 |
| Other medical disability or chronic diseasee | 0.166 *** | 1.180 |
| Calendar year (Ref.=2010): | ||
| 2011 | 0.043 * | 1.044 |
| 2012 | -0.049 * | 0.952 |
| County characteristics: | ||
| # PCPs per 1,000 population | --- | |
| % Population 65+ who do not live in community | --- | |
| % Population 65+ who live in community with others | --- | |
| % Population 65+ with college education | --- | |
| % Population 65+ who are married | --- | |
| County fixed effects | YESf | |
| N | 121,696 | |
NOTE: Model predicting the probability of being an MSHO enrollee (i.e.,MSHO=1, MSC+=0).
Statistical significance: * p<0.05, ** p<0.01, *** p<0.001. |
||
| TABLE 3-9. Logistic Regression Results on Enrollment in a MSHO Plan (vs. MSC+), 2010-2012: Urban Sample, Model 1 | ||
|---|---|---|
| Characteristic | β | AOR |
| Age group (Ref.=65-69): | ||
| 70-74 | 0.564 *** | 1.758 |
| 75-79 | 0.794 *** | 2.211 |
| 80-84 | 0.669 *** | 1.952 |
| 85-89 | 0.699 *** | 2.012 |
| 90+ | 0.807 *** | 2.241 |
| Female | 0.143 *** | 1.154 |
| Died during year | -0.078 ** | 0.925 |
| Disabilities/conditions: | ||
| Mental illnessa | -0.083 *** | 0.921 |
| Neurological disabilityb | 0.054 * | 1.055 |
| Physical disabilityc | -0.033 | 0.968 |
| Sensory disabilityd | 0.039 | 1.040 |
| Other medical disability or chronic diseasee | 0.178 *** | 1.195 |
| Calendar year (Ref.=2010): | ||
| 2011 | 0.023 | 1.023 |
| 2012 | -0.066 ** | 0.937 |
| County characteristics: | ||
| # PCPs per 1,000 population | --- | |
| % Population 65+ who do not live in community | --- | |
| % Population 65+ who live in community with others | --- | |
| % Population 65+ with college education | --- | |
| % Population 65+ who are married | --- | |
| County fixed effects | NO | |
| N | 80,673 | |
NOTE: Model predicting the probability of being an MSHO enrollee.
Statistical significance: * p<0.05, ** p<0.01, *** p<0.001. |
||
| TABLE 3-10. Logistic Regression Results on Enrollment in a MSHO Plan (vs. MSC+), 2010-2012: Urban Sample, Model 2 | ||
|---|---|---|
| Characteristic | β | AOR |
| Age group (Ref.=65-69): | ||
| 70-74 | 0.570 *** | 1.768 |
| 75-79 | 0.796 *** | 2.216 |
| 80-84 | 0.647 *** | 1.910 |
| 85-89 | 0.665 *** | 1.944 |
| 90+ | 0.762 *** | 2.144 |
| Female | 0.132 *** | 1.141 |
| Died during year | -0.085 ** | 0.918 |
| Disabilities/conditions: | ||
| Mental illnessa | -0.095 *** | 0.909 |
| Neurological disabilityb | 0.054 * | 1.056 |
| Physical disabilityc | -0.015 | 0.985 |
| Sensory disabilityd | 0.047 | 1.048 |
| Other medical disability or chronic diseasee | 0.171 *** | 1.187 |
| Calendar year (Ref.=2010): | ||
| 2011 | 0.094 *** | 1.099 |
| 2012 | 0.001 | 1.001 |
| County characteristics: | ||
| # PCPs per 1,000 population | -0.300 *** | 0.741 |
| % Population 65+ who do not live in community | 0.024 *** | 1.024 |
| % Population 65+ who live in community with others | -0.011 * | 0.990 |
| % Population 65+ with college education | -0.014 *** | 0.987 |
| % Population 65+ who are married | 0.000 | 1.000 |
| County fixed effects | NO | |
| N | 80,063g | |
NOTE: Model predicting the probability of being an MSHO enrollee.
Statistical significance: * p<0.05, ** p<0.01, *** p<0.001. |
||
| TABLE 3-11. Logistic Regression Results on Enrollment in a MSHO Plan (vs. MSC+), 2010-2012: Urban Sample, Model 3 | ||
|---|---|---|
| Characteristic | β | AOR |
| Age group (Ref.=65-69): | ||
| 70-74 | 0.582 *** | 1.790 |
| 75-79 | 0.798 *** | 2.221 |
| 80-84 | 0.651 *** | 1.918 |
| 85-89 | 0.662 *** | 1.938 |
| 90+ | 0.757 *** | 2.131 |
| Female | 0.140 *** | 1.150 |
| Died during year | -0.083 ** | 0.920 |
| Disabilities/conditions: | ||
| Mental illnessa | -0.101 *** | 0.904 |
| Neurological disabilityb | 0.047 * | 1.048 |
| Physical disabilityc | -0.024 | 0.977 |
| Sensory disabilityd | 0.045 | 1.046 |
| Other medical disability or chronic diseasee | 0.171 *** | 1.187 |
| Calendar year (Ref.=2010): | ||
| 2011 | 0.025 | 1.025 |
| 2012 | -0.062 ** | 0.940 |
| County characteristics: | ||
| # PCPs per 1,000 population | --- | |
| % Population 65+ who do not live in community | --- | |
| % Population 65+ who live in community with others | --- | |
| % Population 65+ with college education | --- | |
| % Population 65+ who are married | --- | |
| County fixed effects | YESf | |
| N | 80,673 | |
NOTE: Model predicting the probability of being an MSHO enrollee.
Statistical significance: * p<0.05, ** p<0.01, *** p<0.001. |
||
| TABLE 3-12. Logistic Regression Results on Enrollment in a MSHO Plan (vs. MSC+), 2010-2012: Rural Sample, Model 1 | ||
|---|---|---|
| Characteristic | β | AOR |
| Age group (Ref.=65-69): | ||
| 70-74 | 0.694 *** | 2.002 |
| 75-79 | 0.896 *** | 2.450 |
| 80-84 | 0.998 *** | 2.712 |
| 85-89 | 1.060 *** | 2.886 |
| 90+ | 1.112 *** | 3.040 |
| Female | 0.157 *** | 1.170 |
| Died during year | -0.026 | 0.974 |
| Disabilities/conditions: | ||
| Mental illnessa | 0.054 | 1.055 |
| Neurological disabilityb | 0.098 ** | 1.103 |
| Physical disabilityc | 0.052 | 1.053 |
| Sensory disabilityd | 0.155 ** | 1.167 |
| Other medical disability or chronic diseasee | 0.175 *** | 1.192 |
| Calendar year (Ref.=2010): | ||
| 2011 | 0.018 | 1.018 |
| 2012 | -0.063 | 0.939 |
| County characteristics: | ||
| # PCPs per 1,000 population | --- | |
| % Population 65+ who do not live in community | --- | |
| % Population 65+ who live in community with others | --- | |
| % Population 65+ with college education | --- | |
| % Population 65+ who are married | --- | |
| County fixed effects | NO | |
| N | 41,023 | |
NOTE: Model predicting the probability of being an MSHO enrollee.
Statistical significance: * p<0.05, ** p<0.01, *** p<0.001. |
||
| TABLE 3-13. Logistic Regression Results on Enrollment in a MSHO Plan (vs. MSC+), 2010-2012: Rural Sample, Model 2 | ||
|---|---|---|
| Characteristic | β | AOR |
| Age group (Ref.=65-69): | ||
| 70-74 | 0.710 *** | 2.033 |
| 75-79 | 0.909 *** | 2.482 |
| 80-84 | 1.016 *** | 2.762 |
| 85-89 | 1.063 *** | 2.895 |
| 90+ | 1.096 *** | 2.992 |
| Female | 0.157 *** | 1.170 |
| Died during year | -0.023 | 0.978 |
| Disabilities/conditions: | ||
| Mental illnessa | 0.083 ** | 1.087 |
| Neurological disabilityb | 0.106 ** | 1.112 |
| Physical disabilityc | 0.043 | 1.043 |
| Sensory disabilityd | 0.161 ** | 1.175 |
| Other medical disability or chronic diseasee | 0.166 *** | 1.180 |
| Calendar year (Ref.=2010): | ||
| 2011 | -0.034 | 0.967 |
| 2012 | -0.145 *** | 0.865 |
| County characteristics: | ||
| # PCPs per 1,000 population | 0.083 | 1.087 |
| % Population 65+ who do not live in community | 0.209 *** | 1.232 |
| % Population 65+ who live in community with others | 0.059 *** | 1.061 |
| % Population 65+ with college education | -0.065 *** | 0.937 |
| % Population 65+ who are married | 0.022 *** | 1.022 |
| County fixed effects | NO | |
| N | 40,752g | |
NOTE: Model predicting the probability of being an MSHO enrollee.
Statistical significance: * p<0.05, ** p<0.01, *** p<0.001. |
||
| TABLE 3-14. Logistic Regression Results on Enrollment in a MSHO Plan (vs. MSC+), 2010-2012: Rural Sample, Model 3 | ||
|---|---|---|
| Characteristic | β | AOR |
| Age group (Ref.=65-69): | ||
| 70-74 | 0.847 *** | 2.332 |
| 75-79 | 1.080 *** | 2.945 |
| 80-84 | 1.145 *** | 3.142 |
| 85-89 | 1.185 *** | 3.271 |
| 90+ | 1.215 *** | 3.369 |
| Female | 0.183 *** | 1.201 |
| Died during year | -0.036 | 0.964 |
| Disabilities/conditions: | ||
| Mental illnessa | 0.095 ** | 1.100 |
| Neurological disabilityb | 0.060 | 1.062 |
| Physical disabilityc | 0.041 | 1.042 |
| Sensory disabilityd | 0.110 | 1.116 |
| Other medical disability or chronic diseasee | 0.165 *** | 1.180 |
| Calendar year (Ref.=2010): | ||
| 2011 | 0.092 * | 1.096 |
| 2012 | -0.015 | 0.985 |
| County characteristics: | ||
| # PCPs per 1,000 population | --- | |
| % Population 65+ who do not live in community | --- | |
| % Population 65+ who live in community with others | --- | |
| % Population 65+ with college education | --- | |
| % Population 65+ who are married | --- | |
| County fixed effects | YESf | |
| N | 41,023 | |
NOTE: Model predicting the probability of being an MSHO enrollee.
Statistical significance: * p<0.05, ** p<0.01, *** p<0.001. |
||
3.2. Outcomes Analyses
We present results for facility/institutional measures first, followed by results for community-based care, including physician care, HCBS, assisted living and hospice care.
Hospital Care and Long-Term Nursing Home Care. Looking first at simple differences between the MSHO and MSC+ enrollees, we find that MSHO enrollees were less likely than MSC+ enrollees to have had an inpatient stay in a given year (18.6 percent vs. 27.4 percent) (Table 3-15). Further, among those enrollees with an inpatient stay, MSHO enrollees tended to have somewhat fewer stays than MSC+ enrollees over the year (1.8 vs. 2.5 stays). By contrast, MSHO and MSC+ enrollees were equally likely to have had an outpatient ED visit during a given year, at about 30 percent. However, among enrollees who used the ED, MSHO enrollees had less than two annual visits on average, while MSC+ enrollees had almost three visits per year. In contrast to their lower levels of hospital use, a higher proportion of MSHO enrollees than MSC+ enrollees had a long-term nursing facility stay over the year, as derived from a yes/no indicator of long-term nursing home use in the encounter data (30.6 percent vs. 24.9 percent).
| TABLE 3-15. Descriptive Statistics on Hospital Care, Long-Term Nursing Home Care, and Community-Based Care by MSHO and MSC+ Enrollees, 2010-2012 | ||||
|---|---|---|---|---|
| Outcome Measure | Total Sample Size |
Enrollees MSHO |
Enrollees MSC+ |
Difference |
| Hospital Care | ||||
| Any hospital stay (%) | 121,696 | 18.6 | 27.4 | -8.9 |
| Number of stays among those with a stay (mean) | 24,067 | 1.8 | 2.5 | -0.7 |
| Any outpatient ED visit (%) | 121,696 | 30.0 | 30.5 | -0.5 |
| Number of visits among those with a visit (mean) | 36,541 | 1.7 | 2.8 | -1.1 |
| Long-Term Care Nursing Home Care | ||||
| Any long-term nursing facility stay (%) | 121,696 | 30.6 | 24.9 | 5.7 |
| Community-Based Care | ||||
| Any physician visit (%) | 121,696 | 94.6 | 91.5 | 3.1 |
| Number of visits among those with a visit (mean) | 114,371 | 12.3 | 19.0 | -6.7 |
| Any PCP visit (%) | 121,696 | 85.2 | 71.9 | 13.3 |
| Number of visits among those with a visit (mean) | 100,622 | 7.2 | 11.5 | -4.3 |
| Any specialist visit (%) | 121,696 | 83.7 | 84.4 | -0.7 |
| Number of visits among those with a visit (mean) | 101,830 | 6.5 | 10.8 | -4.3 |
| Any HCBS use (%) | 121,696 | 55.7 | 52.4 | 3.3 |
| Any assisted living use (%) | 121,696 | 17.3 | 16.9 | 0.4 |
| Any hospice use (among those who died during the year) (%) | 17,221 | 42.7 | 40.9 | 1.8 |
| NOTE: This analysis relies on measures of the number of visits that delete extreme outliers, which involves dropping less than 0.05% of the overall sample from all outpatient physician measures. | ||||
As noted above, MSHO enrollees tend to be older, are more likely to be female, have more health problems, and are more likely to live in rural areas than MSC+ enrollees, all of which could contribute to differences in health care use. After controlling for the differences between MSHO and MSC+ enrollees, we find significantly lower use of hospital care for both inpatient stays and outpatient ED visits, and no significant difference in long-term nursing home care (derived from an encounter data indicator) for MSHO enrollees relative to similar MSC+ enrollees (Table 3-16). As shown, MSHO enrollees were substantially less likely than similar MSC+ enrollees to have a hospital stay or an outpatient ED visit and, among enrollees who used that care, fewer episodes of care. Controlling for the effects of covariates in all outcomes analyses greatly matters. For example, for hospital stays, the unadjusted odds ratio calculated from the descriptive statistics in Table 3-15 is 0.604 (not shown above) vs. the adjusted odds ratio (AOR) of 0.515 in Table 3-16.
| TABLE 3-16. Regression-Based Estimates of Effect of MSHO Relative to MSC+ on Hospital Care, Long-Term Nursing Home Care, and Community-Based Care, 2010-2012 | |||
|---|---|---|---|
| Outcome Measure | Sample Size | Logit Model for Any Use: Odds Ratio |
Count Model for Level of Use Among Users: IRR |
| Hospital Care | |||
| Any hospital stay | 121,696 | 0.515 *** | |
| Number of stays among those with a stay | 24,067 | 0.744 *** | |
| Any outpatient ED visit | 121,696 | 0.938 *** | |
| Number of visits among those with a visit | 36,541 | 0.616 *** | |
| Long-Term Nursing Home Care | |||
| Any long-term nursing facility stay | 121,696 | 1.015 | |
| Community-Based Care | |||
| Any physician visit | 121,696 | 1.604 *** | |
| Number of visits among those with a visit | 114,371 | 0.679 *** | |
| Any PCP visit | 121,696 | 2.705 *** | |
| Number of visits among those with a visit | 100,622 | 0.633 *** | |
| Any specialist visit | 121,696 | 0.964 | |
| Number of visits among those with a visit | 101,830 | 0.641 *** | |
| Any HCBS use | 121,696 | 1.134 *** | |
| Any assisted living use | 121,696 | 0.842 *** | |
| Any hospice use (among those who died during the year) | 17,221 | 1.087 * | |
| NOTE: This analysis relies on measures of the number of visits that delete extreme outliers, which involves dropping less than 0.05% of the overall sample from outpatient physician measures. */**/*** Statistically significant at the 0.10/0.05/0.01 level, two-tailed test. |
|||
Community-Based Care. Looking at the simple differences in community-based care between MSHO and MSC+ enrollees, we find that both groups of enrollees were equally likely to have had a specialist visit over the past year (roughly 84 percent), while MSHO enrollees were more likely than MSC+ enrollees to have had a PCP visit (85.2 percent vs. 71.9 percent) and, due to that, somewhat more likely to have had any physician visit over the year (94.6 percent vs. 91.5 percent) (Table 3-15). However, among those who used any physician care over the past year, MSHO enrollees had an average of almost seven fewer visits than MSC+ enrollees, including an average of four fewer PCP visits among those who saw a PCP and four fewer specialist visits among those who saw a specialist (Table 3-15). Along with the higher level of PCP use, MSHO enrollees were more likely to use HCBS (55.7 percent vs. 52.4 percent) and hospice care over the past year (42.7 percent vs. 40.9 percent). There was little difference between the two groups in the use of assisted living, approximately about 17 percent among both MSHO and MSC+ (Table 3-15).
Controlling for the differences between MSHO and MSC+ enrollees, MSHO enrollees are rough 1.6 times as likely as similar MSC+ enrollees to have had any physician visit over the past year, driven by the greater use of PCPs (Table 3-16). MSHO enrollees are almost three times as likely as similar MSC+ enrollees to have had a PCP visit and equally likely to have had a specialist visit over the past year. Further, among those using each type of care examined, MSHO enrollees had fewer visits than similar MSC+ enrollees, with the incidence rate for MSHO enrollees relative to MSC+ enrollees roughly two-thirds for the number of visits to any physician, to PCPs, and to specialists. MSHO enrollees were also significantly more likely to have used HCBS care and less likely to have been in assisted living than similar MSC+ enrollees during the year. MSHO enrollees who died during the year were marginally more likely to have used hospice care than similar MSC+ enrollees. (The incidence rate for MSHO enrollees relative to similar MSC+ enrollees based on negative binomial models that estimate the impact of MSHO enrollment on the full sample and not just users of a service yield a similar pattern, with MSHO enrollees estimated to have fewer visits than similar MSC+ enrollees (data not shown).
| TABLE 3-17. Non-MSHO/MSC+ Changes in Minnesota in Overall Levels of Care, 2010-2012 | ||
|---|---|---|
| Service Type | Likelihood of Any Use |
Amount of Use if Any |
| Hospital use | -15% | -3% |
| ED use | +6% | +2% |
| Long-term nursing home use | -14% | Not assessed |
| HCBS use | +10 | Not assessed |
| Assisted living use | +6% | Not assessed |
| Any type of physician | -10% | +5% |
| PCP use | -4% | -1% |
| Specialist physician use | No change | +13% |
| Hospice use | +25% | Not assessed |
Beyond differences in the impacts of MSHO, the analysis also provides evidence of changes in overall levels of care in the state over time (evident via time dummy variables comparing year 2012 to year 2010). As shown in Table 3-17, between 2010 and 2012, hospital and long-term nursing home use was greatly decreasing, and ED, HCBS, and assisted living facility use was increasing.
| FIGURE 3-1. Effect of MSHO Relative to MSC+ on the Probability of Health Care and Long-Term Care Use: Logistic Regression Model Estimates |
|---|
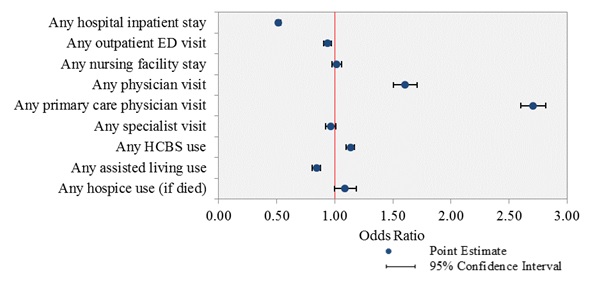 |
We visualize the estimated effects of enrollment in MSHO relative to MSC+, in the form of AORs and their 95 percent confidence intervals from logistic regression analyses, on each of the binary utilization outcomes (Figure 3-1). Statistically significant effects are indicated by AORs whose 95 percent confidence intervals do not encompass the value of 1.00 (as demarcated by a vertical line on the graph).
Similarly, we graph the estimated effects of enrollment in MSHO relative to MSC+, in the form of IRRs and their 95 percent confidence intervals from negative binomial regression analyses, on each of the utilization count outcomes (Figure 3-2). As shown, in all cases the estimated IRRs and their 95 percent confidence intervals are below 1.00, indicating lower levels of utilization (fewer inpatient stays, ED visits and physician visits) by MSHO enrollees than MSC+ enrollees. As an example of interpreting these IRRs, the ratio for hospital stays is 0.744, which means that MSHO enrollees had approximately 25.6 percent (1 minus 0.744 equals 0.256) fewer stays than MSC+ enrollees who had any hospital admissions.
| FIGURE 3-2. Effect of MSHO Relative to MSC+ on the Count of Health Care Utilizations: Negative Binomial Regression Model Estimates |
|---|
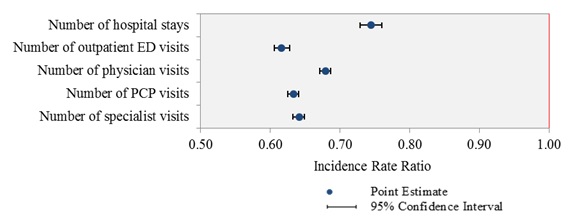 |
Table 3-18 contains summary-level estimates of the effect of MSHO enrollment (compared to MSC+) for the overall sample and separately for those enrollees in urban vs. rural areas (no other covariates shown) using Model 3.
Appendix Tables A-1 through A-9 in the Appendix contain complete Logistic regression output results for the nine settings examined, presenting the results on the three models listed in the Methods section (individual-level only, individual plus specific area-level covariates, and individual-level plus county-fixed effects).
Tables A-10 through A-14 in the Appendix contain complete negative binomial regression output results for five settings for which we were able to create count measures, again presenting the results on the three models listed in the Methods section.
| TABLE 3-18. Estimated Effect of MSHO Relative to MSC+ on Health Care and Long-Term Care Use by Overall, and for Urban and Rural Subgroups, 2010-2012 | ||||||
|---|---|---|---|---|---|---|
| Outcome | Overall | Urban | Rural | |||
| Any use (logit models) | β | AOR | β | AOR | β | AOR |
| Any hospital stay | -0.663 | 0.515 *** | -0.722 | 0.486 *** | -0.517 | 0.597 *** |
| Any outpatient ED visit | -0.064 | 0.938 *** | -0.094 | 0.910 *** | -0.005 | 0.995 |
| Any nursing facility stay | 0.015 | 1.015 | 0.011 | 1.011 | 0.031 | 1.031 |
| Any physician visit | 0.473 | 1.604 *** | 0.551 | 1.736 *** | 0.340 | 1.405 *** |
| Any PCP visit | 0.995 | 2.705 *** | 1.245 | 3.474 *** | 0.476 | 1.610 *** |
| Any specialist visit | -0.036 | 0.964 | -0.079 | 0.924 *** | 0.065 | 1.067 |
| Any HCBS use | 0.126 | 1.134 *** | 0.120 | 1.127 *** | 0.150 | 1.161 *** |
| Any assisted living use | -0.171 | 0.842 *** | -0.251 | 0.778 *** | 0.022 | 1.022 |
| Any hospice use | 0.083 | 1.087 * | 0.032 | 1.033 | 0.217 | 1.243 ** |
| Count of visits, among users only (negative binomial models) | β | IRR | β | IRR | β | IRR |
| Number of hospital stays | -0.296 | 0.744 *** | -0.277 | 0.758 *** | -0.341 | 0.711 *** |
| Number of outpatient ED visits | -0.484 | 0.616 *** | -0.551 | 0.577 *** | -0.335 | 0.715 *** |
| Number of physician visits | -0.387 | 0.679 *** | -0.401 | 0.670 *** | -0.346 | 0.708 *** |
| Number of PCP visits | -0.458 | 0.633 *** | -0.468 | 0.626 *** | -0.424 | 0.655 *** |
| Number of specialist visits | -0.446 | 0.641 *** | -0.473 | 0.623 *** | -0.354 | 0.702 *** |
| NOTE: */**/*** Statistically significant at the 0.10/0.05/0.01 level, two-tailed test. | ||||||
3.3. Minimum Data Set Results Comparing Level of Function for New Nursing Home Admissions
In Appendix Table A-15, we specify the definition and coding of select MDS measures, including demographics, physical functioning as measured by ADLs, and cognitive impairments, separately for years before 2010 (based on MDS 2.0) and years after 2010 (based on MDS 3.0). New nursing home admissions were identified in MDS data using the methods described in Section 2.3.5 and include both Medicare-reimbursed (short stay) and Medicaid-reimbursed (long-stay) admissions.
In Appendix Table A-16 we present select characteristics of newly admitted nursing home residents, by MSHO vs. MSC+ and further stratified by gender and age group, for 2011-2012. Overall, there is little or minimal difference between newly admitted nursing home residents from the MSHO group compared with those from the MSC+ group (last two data columns). For example, upon admission, 90.0 percent of newly admitted residents in the MSC+ group were totally dependent or required extensive assistance with performing at least one ADLs, compared to 92.7 percent in the MSHO group. The prevalence of severe cognitive impairment at admission was 24.3 percent for the MSC+ group and 25.2 percent for the MSHO group. A slightly higher percentage of new nursing home admissions in the MSC+ group (83.7 percent) were admitted from an acute care hospital than in the MSHO group (79.6 percent); conversely, a lower percentage in the MSC+ group (9.2 percent) were admitted from the community than in the MSHO group (13.3 percent). There is a notable racial difference among new nursing home admissions between the MSC+ and MSHO groups, with a higher percentage of newly admitted residents being minorities (non-White) in the MSC+ group (15.5 percent) than in the MSHO group (9.6 percent). (The proportion of minorities in the MSC+ program is slightly larger than in the MSHO program.)
A similar pattern was seen in 2008-2009, as shown in Appendix Table A-17. It is noteworthy that there was a higher percentage of minorities among new nursing home admissions in the MSC+ group than in the MSHO group: 6.6 percent vs. 3.2 percent in 2008-2009 (15.5 percent vs. 9.6 percent in 2011-2012). In addition, the rate of new nursing home admissions was by and large comparable between MSC+ and MSHO enrollees and it decreased in both groups from 2008-2009 (13.7 percent vs. 15.8 percent) to 2011-2012 (11.1 percent vs. 11.8 percent).
Appendix Table A-17 also reveals sharp differences in all the select characteristics between newly admitted nursing home residents among Medicare-only beneficiaries compared to MSHO or MSC+ dual eligibles. New nursing home admits from the Medicare-only group were notably healthier, as indicated by a much lower prevalence of short-term memory problems (46.1 percent for Medicare-only vs. 62.5 percent for MSC+ and 65.4 percent for MSHO), long-term memory problems (17.1 percent vs. 30.4 percent and 35.1 percent), and total dependence on others or need for extensive assistance with the five ADLs (e.g., 11.5 percent vs. 20.6 percent and 21.6 percent, with respect to eating). Moreover, new admits from the Medicare-only group were more likely to be married (41.1 percent vs. 20.0 percent for MSC+ and 18.4 percent for MSHO) and admitted from an acute care hospital (89.4 percent vs. 85.3 percent and 84.3 percent) but were much less likely to be non-Whites (0.9 percent vs. 6.6 percent and 3.2 percent). Overall, the rate of new nursing home admissions is much lower in the Medicare-only group (4.9 percent) than in the MSC+ (13.7 percent) or MSHO group (15.8 percent). Since Medicare does not cover long-term nursing facility care, we suspect that most (if not all) of the new admits from the Medicare-only group entered the facility for short-term rehabilitation under the Medicare SNF care benefit. Thus, the observed differences in their functional impairment levels as compared with the duals at the time of nursing home admission would be as expected.
3.4. Comparison of MSHO and Medicare-Only Beneficiaries
The differences between the two populations are substantial (Table 3-19). The Medicare-only beneficiaries were considerably younger, healthier, less likely to died, and had less service use on the range of outcome measures analyzed. MSHO enrollees are more similar to MSC+ enrollees than they are to Medicare-only beneficiaries.
| TABLE 3-19. Comparison of Medicare-Only and Dual Eligible Beneficiaries on Selected Characteristics, 2010-2012 | ||||||||
|---|---|---|---|---|---|---|---|---|
| Characteristic | Medicare-Only | Dual Eligibles Total |
Dual Eligibles MSC+ |
Dual Eligibles MSHO |
||||
| N | % or Mean |
N | % or Mean |
N | % or Mean |
N | % or Mean |
|
| Age: | ||||||||
| 65-69 | 1,843,622 | 30.5 | 121,696 | 16.8 | 21,935 | 27.6 | 99,761 | 14.4 |
| 70-74 | 1,843,622 | 23.3 | 121,696 | 17.0 | 21,935 | 17.6 | 99,761 | 16.9 |
| 75-79 | 1,843,622 | 18.1 | 121,696 | 15.8 | 21,935 | 13.4 | 99,761 | 16.3 |
| 80-84 | 1,843,622 | 14.2 | 121,696 | 16.4 | 21,935 | 14.4 | 99,761 | 16.9 |
| 85-89 | 1,843,622 | 9.0 | 121,696 | 16.1 | 21,935 | 13.4 | 99,761 | 16.7 |
| 90+ | 1,843,622 | 4.8 | 121,696 | 18.0 | 21,935 | 13.6 | 99,761 | 18.9 |
| Female | 1,843,622 | 45.4 | 121,696 | 72.4 | 21,935 | 68.4 | 99,761 | 73.3 |
| Died during year | 1,843,622 | 3.5 | 121,696 | 14.2 | 21,935 | 12.8 | 99,761 | 14.4 |
| Disabilities/conditions: | ||||||||
| Mental illnessa | 1,843,622 | 15.0 | 121,696 | 60.1 | 21,935 | 58.8 | 99,761 | 60.4 |
| Neurological disabilityb | 1,843,622 | 7.2 | 121,696 | 48.0 | 21,935 | 43.3 | 99,761 | 49.0 |
| Physical disabilityc | 1,843,622 | 16.0 | 121,696 | 31.5 | 21,935 | 32.1 | 99,761 | 31.4 |
| Sensory disabilityd | 1,843,622 | 3.5 | 121,696 | 8.1 | 21,935 | 7.8 | 99,761 | 8.2 |
| Other medical disability or chronic diseasee | 1,843,622 | 45.0 | 121,696 | 85.6 | 21,935 | 82.5 | 99,761 | 86.2 |
| Service utilization: | ||||||||
| Any hospitalization | 1,843,622 | 13.4 | 121,696 | 20.2 | 21,935 | 27.4 | 99,761 | 18.6 |
| # Hospitalizations, if any | 246,356 | 1.40 | 24,067 | 1.96 | 5,621 | 2.46 | 18,446 | 1.80 |
| Any outpatient ED visit | 1,843,622 | 11.6 | 121,696 | 30.1 | 21,935 | 30.5 | 99,761 | 30.0 |
| # ED visits, if any | 214,311 | 1.43 | 36,541 | 1.94 | 6,639 | 2.85 | 29,902 | 1.74 |
| Any PCP visit | 1,843,622 | 39.0 | 121,696 | 82.8 | 21,935 | 71.9 | 99,761 | 85.2 |
| # PCP visits, if any | 717,250 | 4.74 | 100,622 | 7.88 | 15,684 | 11.50 | 84,938 | 7.21 |
| Any specialist visit | 1,843,622 | 44.0 | 121,696 | 83.8 | 21,935 | 84.4 | 99,761 | 83.7 |
| # Specialist visits, if any | 809,740 | 5.07 | 101,830 | 7.28 | 18,426 | 10.78 | 83,404 | 6.51 |
| Any physician visit | 1,843,622 | 51.8 | 121,696 | 94.0 | 21,935 | 91.5 | 99,761 | 94.6 |
| # Physician visits, if any | 953,784 | 7.90 | 114,371 | 13.44 | 20,051 | 19.02 | 94,320 | 12.25 |
| Any hospice use | 1,843,622 | 2.0 | 121,696 | 7.9 | 21,935 | 6.7 | 99,761 | 8.1 |
| Any hospice, among deceased only | 64,255 | 46.4 | 17,221 | 42.4 | 2,813 | 40.9 | 14,408 | 42.7 |
| Calendar year: | ||||||||
| 2010 | 1,843,622 | 32.6 | 121,696 | 32.4 | 21,935 | 31.8 | 99,761 | 32.5 |
| 2011 | 1,843,622 | 33.2 | 121,696 | 34.1 | 21,935 | 33.1 | 99,761 | 34.3 |
| 2012 | 1,843,622 | 34.2 | 121,696 | 33.5 | 21,935 | 35.1 | 99,761 | 33.2 |
| County characteristics: | ||||||||
| Rural county | 1,843,622 | 31.9 | 121,696 | 33.7 | 21,935 | 30.4 | 99,761 | 34.4 |
| # PCPs per 1,000 population | 1,842,801 | 0.80 | 120,815 | 0.80 | 21,692 | 0.85 | 99,123 | 0.79 |
| % Population 65+ who do not live in community | 1,842,801 | 4.9 | 120,815 | 5.1 | 21,692 | 4.8 | 99,123 | 5.2 |
| % Population 65+ who live in community with others | 1,842,801 | 65.5 | 120,815 | 64.9 | 21,692 | 64.9 | 99,123 | 64.9 |
| % Population 65+ with college education | 1,842,801 | 21.6 | 120,815 | 21.7 | 21,692 | 23.0 | 99,123 | 21.4 |
| % Population 65+ who are married | 1,842,801 | 58.1 | 120,815 | 57.5 | 21,692 | 57.0 | 99,123 | 57.6 |
|
||||||||
3.5. Assessing the Potential Effect of Differences in Unobserved Characteristics on the Estimates of MSHO Impacts
The multivariate analyses presented above compares the health care and long-term care outcomes of MSHO and MSC+ enrollees, controlling for differences in the observed characteristics of the two groups of enrollees. To the extent there are differences in unmeasured characteristics of the enrollees that affect both their MSHO enrollment and their health care and long-term care outcomes the estimated impacts of MSHO will be biased. These omitted variables could include, for example, additional components of health and disability status, such as severity of chronic conditions and frailty, and family circumstances, such as marital status, living arrangements, and availability of informal care givers.
We use a method developed by Oster (2015) to assess the sensitivity of impact estimates to potential omitted variable bias. Oster's method draws on the explanatory power of the regression model (as measured by R2) based on the observed characteristics and the maximum potential explanatory power of the regression model, to predict the maximum potential impact of omitted variables on the estimated effect under the assumption that the selection on the observed characteristics is proportional to the selection on the unobserved characteristics.4 If the estimated effects would remain consistent in the face of the high levels of potential omitted variable bias we can be more confident in the reliability of the findings reported above.
Table 3-20 summarizes our application of Oster's method using her Stata command, psacalc. In applying the method, we consider three scenarios for the maximum R2 possible in a study of health care and long-term care outcomes: 0.30, 0.50 and 0.70. As would be expected, the higher the potential R2 for the analysis the greater the potential effects of omitted variables on the estimate of the effect of MSHO. For example, we estimate a 10.2 percentage point reduction in the probability of an inpatient stay due to MSHO. Oster's bounding method finds that that reduction would likely be even larger if we were able to control for omitted variables, ranging from 12.8 percentage points if the maximum R2 for the model were 0.30-18.2 percentage points if the maximum R2 were 0.70. In all three R2 scenarios, the potential effect of omitted variable bias on the MSHO impact estimate would be to produce a stronger negative effect. This suggests that the reduction in inpatient use reported above would likely hold up in the face of omitted variable bias and, in fact, our analysis may underestimate the impact of MSHO on inpatient stays relative to MSC+ for otherwise similar individuals based on unobserved characteristics.
| TABLE 3-20. Assessment of Potential Impact of Omitted Variable Bias to Change Estimated MSHO Impacts on Utilization | |||||
|---|---|---|---|---|---|
| Outcome | Estimate of MSHO Impact |
Estimates of Potential MSHO Impact After Accounting for Possible Omitted Variable Bias Under Alternative Assumptions About Maximum Possible R2 |
Potential Implication of Omitted Variable Bias |
||
| Max R2 =0.3 |
Max R2 =0.5 |
Max R2 =0.7 |
|||
| Any inpatient stay | -0.102 *** | -0.128 | -0.155 | -0.182 | Stronger effect |
| Any ED visit | -0.012 *** | -0.031 | -0.049 | -0.066 | Stronger effect |
| Any nursing facility use | 0.002 | -0.001 | -0.040 | -0.079 | Negative effect |
| Any HCBS use | 0.029 *** | 0.015 | 0.003 | -0.009 | Eliminate positive effect |
| Any assisted living use | -0.021 *** | -0.091 | -0.154 | -0.218 | Stronger effect |
| Any PCP visit | 0.140 *** | 0.149 | 0.160 | 0.172 | Stronger effect |
| Any specialist visit | -0.004 | 0.000 | 0.005 | 0.010 | Little change |
| Any physician visit | 0.027 *** | 0.019 | 0.012 | 0.005 | Eliminate positive effect |
| Number of inpatient stays | -0.255 *** | -0.159 | -0.075 | 0.009 | Eliminate negative effect |
| Number of ED visits | -0.468 *** | -0.460 | -0.448 | -0.436 | Little change |
| Number of PCP visits | -0.445 *** | -0.445 | -0.445 | -0.445 | Little change |
| Number of specialist visits | -0.388 *** | -0.355 | -0.299 | -0.243 | Reduce negative effect |
| Number of overall physician visits | -0.310 *** | -0.299 | -0.267 | -0.235 | Reduce negative effect |
| SOURCE: RTI analysis of 2010-2012 Minnesota claims and encounter data. */**/*** Statistically significant at the 0.10/0.05/0.01 level, two-tailed test. |
|||||
Overall, the findings in Table 3-20 suggest that the impacts of MSHO on the key health care and long-term care outcomes are robust to alternative assumptions about the extent of omitted variable bias, with the potential impacts likely even larger if we were able to control for those variables. This would include the potential for even greater reductions in inpatient stays, ED use, and assisted living, and greater increases in visits to PCPs under MSHO relative to MSC+.
In some cases the potential omitted variable bias would have little effect--any specialist visit, number of ED visits, and number of PCP visits. In a few cases it could potentially change the direction of the estimate of the impact of MSHO on the outcome. Controlling for the unobserved characteristics could potentially eliminate the effect of MSHO on any physician visit, reduce the negative effect of MSHO on the number of specialist visits, and reduce the negative effect of MSHO on the number of overall physician visits.
4. Discussion
In order to investigate the effects of MSHO enrollment as compared to MSC+ enrollment on a range of utilization outcome measures, this study analyzed 2010-2012 data from an extensive database containing individual-level characteristics and claims/encounter data. We conducted both descriptive analyses and multivariate analyses of the enrolment choice and service utilization, with additional stratification by urban vs. rural area. These results provide a detailed assessment of utilization differences that can be achieved with an integrated care model (MSHO) vs. a coordinated but not fully integrated care model (MSC+). This final section of the report highlights the study's principal findings, discusses policy implications, notes study limitations and outlines potential areas for additional research.
4.1. Findings and Policy Implications
First, Minnesota dual eligibles electing MSHO enrollment differed from those remaining in the MSC+ program on a range of individual characteristics. MSHO enrollees tended to be older, female, to have more medical conditions and disabilities, to have died during the year, and were slightly more likely to live in rural areas of the state. These differences were relatively minor except for age. The proportion of MSHO enrollees in the age 65-69 age group were roughly half that of MSC+ enrollees (14.4 percent vs. 27.6 percent), and MSHO enrollees were more likely found in the 90+ age group (18.9 percent vs. 13.6 percent). While most dual eligibles eventually enroll in MSHO, they do not necessarily do so upon turning age 65. Unless they explicitly choose MSHO, they will be placed in MSC+. Most dual eligibles probably have little experience with being in two plans for their care prior to becoming dually eligible, and may not understand the benefits, or even the concept, of an integrated plan. The continued educational outreach by the state and managed care plans regarding the MSHO option to dual eligibles over time reaches a greater proportion of dual eligibles, with beneficiaries age 75-79 being the first 5-year age group with a majority in the MSHO vs. MSC+ program.
Second, although MSC+ enrollees were increasingly likely to enroll in MSHO over time, MSHO enrollees rarely opted out of the MSHO program once enrolled. Very few of those who were in MSHO in January of a year ever switched to MSC+ during that year, but 12.8 percent of those who were in MSC+ in January of a year switched to MSHO by the end of the year. Although MSHO enrollees can disenroll from MSHO and elect MSC+ effective at the beginning of the next month, the finding that almost none do suggests high satisfaction with services received under MSHO. Conversely, switching to enrollment in MSHO from MSC+ increases with age, which suggests that dual eligibles may become more aware of the potential choice of MSHO or place more value on the benefits available under MSHO relative to MSC+ as they get older, particularly after attempting to coordinate care between Medicare and Medicaid themselves.
Third, compared to MSC+ enrollees, MSHO enrollees had lower hospital and ED use but greater prevalence of primary care service use. Both before and after controlling for differences in observed individual-level and area-level characteristics, MSHO enrollees received less care in hospital settings than MSC+ enrollees. This finding was in spite of MSHO enrollees being somewhat older and having somewhat greater prevalence of selected medical conditions and disabilities. At the same time, MSHO enrollees had a much higher prevalence of primary care use. Although these analyses could not assess whether more frequent primary care use led to lower hospital-based care, it is consistent with the goal of connecting those who rely more heavily on inpatient and ED use to community-based providers as a strategy to reduce reliance on hospital-based care for care more appropriately provided in the community. With the joint capitation of Medicare and Medicaid under MSHO, health plans have a strong financial incentive to expand community-based care to reduce ambulatory-care sensitive inpatient and ED use since they reap the financial benefits of any reduced hospital-based care. While we don't have individual-level data on the receipt of care coordination, such coordination is a core component of the MSHO model, including coordination across care settings (e.g., from the hospital to home) and between care providers (e.g., home and community-based care providers and PCPs). Beyond the program model that encourages an investment in care coordination, health plans may provide additional financial incentives to providers as part of their contracts to encourage greater investment in care coordination strategies to reduce potentially avoidable hospital and ED visits, including hospital readmissions.
Curiously, MSHO enrollees, while having a greater prevalence of any primary care visits, if they had any, had 36 percent fewer visits than MSC+ enrollees, and, for those with a specialist visit, 36 percent fewer specialist visits. One reason for fewer visits may be that the PCP and their affiliated staff were able to provide more comprehensive, coordinated care during each visit, resulting in the need for fewer visits over time. Conversely, dual eligibles in MSC+ may have elected that program to continue to see a greater number of specialists, or to have more visits with certain specialists with whom they had long-term relationships.
Fourth, compared to MSC+ enrollees, MSHO enrollees were no more likely to have a long-term nursing home admission, were more likely to have any HCBS but less likely to have any assisted living facility use. These findings took the greater age and slightly greater prevalence of medical conditions and disabilities among MSHO enrollees into account. Potentially, the greater prevalence of HCBS and assisted living facility use helped prevent some long-term nursing home use. Even though MSHO enrollment was slightly more prevalent in rural areas, the urban/rural analyses conducted as part of the study showed there were no differences over time in the use of assisted living in rural areas resulting from MSHO enrollment, so there did not seem to be a substitution effect of assisted living for nursing home use.
The lower use of inpatient and ED services among MSHO enrollees when compared to MSC+ enrollees, and no greater prevalence of nursing home use, policymakers may question why MSHO enrollees were only 13 percent more likely to have any HCBS use and not much greater. Presumably, this likely resulted in substantial costs savings that could have been used to provide HCBS to even more enrollees, given their greater relative age and disability. However, one reason Minnesota staff gave for the MSHO HCBS use rate not being even higher was that the first assessment at age 65 is made by county-based long-term care consultation services staff as opposed to the managed care plans and, as a result, both MSHO and MSC+ enrollees with similar care needs have a common LTSS benefit package. It is possible, however, that MSHO enrollees receive higher levels of HCBS services over time if the MSHO care coordination activities are more likely to identify higher HCBS needs over time. Unfortunately, data on the level of HCBS use was not available to this study.
While the primary analysis of LTSS service use examined the average effects of MSHO over the 2010-2012 period, the estimates of the temporal trends in use that are reflected in the year dummy variables (e.g., year 2011 and year 2012 as compared to year 2010) in the logistic regression models are also informative. Independent of MSHO and MSC+ enrollment, any long-term nursing facility use was 9 percent lower in 2011 than in 2010 and 15 percent lower in 2012 than in 2010. Similarly, compared to 2010, any HCBS use was higher (5 percent and 10 percent respectively for 2011 and 2012) and any assisted higher living use was also higher (5 percent and 6 percent respectively for 2011 and 2012). These results are consistent with unpublished tabulations computed by Minnesota staff for program management5 that show declining nursing home use and increasing HCBS use over time, and likely reflect, at least in part, the state's efforts to rebalance the LTSS system toward community living.
Minnesota's overall efforts to reduce nursing home use are impressive. Minnesota staff reported as potential contributing factors to this reduction over time some market place changes for senior living in the state (e.g., expanded private investment in elderly housing, including assisted living) as well as policy changes implemented by the Minnesota Aging Division and the Minnesota Board on Aging, including initiatives to reduce nursing facility beds, education campaigns about alternatives to nursing homes and initiatives such as Return to Community which provides advice/assistance to all enrollees in nursing homes (both private pay and Medicaid) to avoid long-stays.
The MDS results showed little or minimal difference between MSHO and MSC+ enrollees in the levels of physical and cognitive impairments. A high proportion (over 90 percent) of new nursing home admissions from both the MSHO and MSC+ groups are totally dependent or require extensive assistance in at least one ADL, and about a quarter of them in both groups have severe cognitive impairment upon admission. It is likely that the use of various HCBS by MSHO and MSC+ enrollees has helped to delay nursing home entry until the declines in their health and functional status necessitate nursing home admission. We also found that a higher proportion of newly admitted nursing home residents among MSC+ enrollees are racial/ethnic minorities than among MSHO enrollees, which is most likely related to a slightly greater percentage of minorities in MSC+.
Fifth, MSHO program dual eligibles, compared with other elderly non-dual eligible Medicare beneficiaries, differed on important individual characteristics. Medicare-only enrollees were more likely to be younger, healthier, less likely to die, and to have much less service use on all outcome measures examined than MSHO enrollees. Although we do not have a specific measure of income in our datasets, MSHO enrollees, who must meet Medicaid income-eligibility standards, will also have much lower income than Medicare-only enrollees. MSHO enrollees are much more similar to MSC+ enrollees, who are also dual eligibles, than they are to Medicare-only beneficiaries. Dual eligibles overall are much different than Medicare-only beneficiaries.
Finally, it is always important to consider the potential for selection bias in analyses comparing enrollees in different programs. The risk of selection bias is a common limitation of such research, and methods for assessing its effects on impact estimates are nascent. This study lacked observed data on important individual and family characteristics that would likely affect both enrollment in MSHO and the service use measures examined here, leading to potential bias in the estimates of the direction and magnitude of MSHO effects. Our ability to quantitatively assess the potential for selection bias due to unobserved characteristics in our impact estimates using the method developed by Oster (2015) is an advancementfrom prior studies. We found that, if we had been able to incorporate the unmeasured variables, our estimates of MSHO effects would be unlikely to change direction, and, in many cases, could potentially be larger in magnitude. Overall, our findings should provide encouragement to policymakers that an MSHO-like model, applied to a similar population and system of health care, would provide strong reductions in hospital-based care.
4.1.1. Limitations of Analyses
This study faced six limitations, most related to data issues. First, we lacked data for some important individual and family characteristics that would likely be important predictors of MSHO enrollment and care utilization. For example, although our sensitivity analysis for potential selection bias indicated that the omission of unobserved characteristics would be unlikely to change the substance of the findings reported above, data on family composition and availability of non-paid helpers would have been helpful to better estimate the MSHO program impact service use. In addition, we lacked a reliable indicator of dual eligibility status prior to age 65, which is likely to be an important factor in the decision to move from MSC+ to MSHO. Additional individual characteristics for which we lacked data were race/ethnicity and a broader set of medical conditions and severity of medical conditions for case mix controls.
Second, data limitations prohibited developing as many outcome measures as desired for a complete assessment of the impacts of MSHO on health care and LTSS use. For example, we were not able to construct a measure for non-physician providers such as nurse practitioners and physician assistants, who may have been additional primary care service providers that are not captured in our data.
We also lacked data for intensity of LTSS measures. Count measures reflecting service intensity for HCBS such as hours per user for PCA service, homemaker/chore, or home health aide, or months of assisted living facility use, were not possible to calculate, given the resources of this project. Therefore, it was not possible to assess whether HCBS users in MSHO were also getting more HCBS hours for PCA services or months of assisted living services than HCBS users in MSC+. Therefore, an outstanding question regards whether the intensity of HCBS use may be associated to some degree to the lower hospital and ED service use in MSHO. In this respect, Minnesota staff suggested that higher intensity of use for HCBS in MSHO for individuals with similar needs was not likely given the uniform assessment protocol and the standard LTSS benefit package for both the MSHO and MSC+ programs; however, if the greater care coordination in MSHO results in identifying those needs more quickly MSHO enrollees could obtain HCBS services more quickly, thereby increasing HCBS services use over time.
Third, we were not able to analyze the years 2007-2009, because of a lack of consistent data over the period due to the phase-in of aspects of the program during this period. Therefore, we restricted our data analysis to 2010-2012, which corresponds to a period in which MSC+ and MSHO were both fully-phased in across the state. Our 2010-2012 year-level covariates did show interesting trends even across these three years (e.g., nursing home use across both programs was decreasing, HCBS use was increasing), which highlights the importance of analyzing multiple years of data during period of program and policy change.
Fourth, it is important to qualify these findings in terms of their generalizability to other states. The MSHO program and encounter data used in this analysis obviously are relevant for Minnesota, and they may well be generalizable to others states with similar populations, health care systems, and program and provider characteristics. Minnesota has long been a leader in health care service delivery, so may be unlike other states in their programs and policies. That said, other states that are in need of greater LTSS rebalancing and care coordination may obtain higher or lower effects from an MSHO-style program than this study found in Minnesota.
Fifth, the Office of the Assistant Secretary for Planning and Evaluation had requested that the study use LTSS assessment data maintained by the State of Minnesota. The LTSS assessment is conducted in the community annually for people who need or may need LTSS, but not for others in the community, and it is not administered in the nursing home. Furthermore, Minnesota staff said there is not a consistent criteriaabout who would receive an LTSS assessment because they can be requested by providers, plans, or a consumer. Consequently, we did not attempt to use the state's assessment data, given that program enrollees may have had different probabilities of being assessed.
Finally, the study had ambitious goals, and included some research questions for which we lacked data or high quality data to address, including the following:
-
Data on MSHO program and organizational features such as types and intensity of care coordination activities were not available. Such data would have helped highlight managed care plan and provider level activities related to the dramatic reductions in inpatient use.
-
We could not address a research question on how service use patterns changed as MSC+ and MSHO plans evolved because of the lack of data quality for the 2007-2009 during the MSC+ phase-in period.
-
The research question concerning differential program use and patterns of service use according to race/ethnicity (after controlling for disability) could not be analyzed because of lack of consistent race/ethnicity data.
-
The research question on the characteristics and service use patterns of beneficiaries who become dual eligibles before vs. at age 65 could not be addressed because of data quality concerning pre-age 65 dual eligibility status.
4.2.1. Future Analyses
The dataset used for this study, while providing a rich source of individual and service-level outcomes, had the limitations noted in the prior section. The State of Minnesota is making further improvements in their individual-level and service-level dataset on elderly programs, and future work using that data would be important to add to the contributions of this study. As noted earlier, additional analyses could be performed on LTSS service intensity for those receiving such services, and additional outcomes could be developed for nurse practitioner, physician assistant, various therapies, preventable and avoidable hospitalizations, hospital readmission, and importantly, managed care plan and provider level care coordination activities to understand how MSHO achieved the success found in this study. The state's dataset could also be used to construct additional measures of individual characteristics that would improve the analysis, including additional measures of current health and disability status as well as historical measures, such as Medicaid and Medicare eligibility prior to age 65.
Additional years of data beyond the 2010-2012 period of analysis in this study would also be important to see how the MSHO and MSC+ programs evolve in a period of great change in health care service organization with the adoption of accountable care organizations and other innovations. More recent data potentially could also be used to better understand the state's FAI with CMS that began in September 2013. Additional years of data could also be used to assess the state's continuing efforts to rebalance its LTSS system toward community living, which complements any MSHO impacts.
This study's methodology using reduced form (regression-based) analyses provided important understanding of MSHO impact, but additional, formative analyses could also be undertaken using structural equation modeling to understand the pathways through which reductions in hospital and ED use occurred. While it could not be tested as part of this study, we hypothesize that greater access to and coordination of care by PCPs, and perhaps non-physician providers, led to the finding of no difference in long-stay nursing home use between MSHO and MSC+, even though MSHO enrollees were older and had somewhat more medical conditions and disabilities. Structural equation models would allow identifying causal factors and their role and effects on downstream outcomes so that the State of Minnesota could know the relative impact of various program and provider level activities on health service outcomes. For example, this analysis potentially would show whether greater intensity of HCBS use among MSHO enrollees kept long-term nursing home use no higher and hospital (inpatient and ED) use lower than that of MSC+ enrollees.
Finally, although precluded by data constraints in the study dataset, important subgroup analyses where sample size permits could be investigated. In particular, data on those eligible for Medicaid and Medicare prior to age 65 would allow distinguishing the impacts of MSHO on those who became disabled prior to 65 from the impacts on the aged population, a potentially important distinction for understanding LTSS needs over time. Data on physician use and HCBS patterns across the two programs and over time, as well as the nature of inpatient admissions (and readmissions) and ED use would improve the understanding of the differences between a fully integrated care model represented by MSHO vs. a coordinated but not integrated care model (MSC+).
5. Conclusion
This study found that, after accounting for differential case mix, the MSHO program resulted in lower prevalence and intensity of inpatient and ED use, and greater outpatient primary care access. Importantly, the study also found no difference in long-term nursing home use between MSHO and MSC+ in spite of the case mix differences. We also found that our findings on the impacts of MSHO are robust to alternative assumptions about the extent of selection bias due to omitted variables, with the potential impacts of MSHO likely even larger if we were able to control for those variables. Thus, if anything, we likely underestimate the impacts of MSHO.
Minnesota staff had previously reported using simple descriptive statistics of MSHO service use measures that did not account for differential case mix and other unobserved factors that MSHO led to lower inpatient setting use, but this study provided an objective, scientifically rigorous assessment of the level of impact. In addition, the MSHO program also resulted in greater access to HCBS, compared to the MSC+ program. These findings suggest that additional initiatives that use fully integrated care models similar to the MSHO program may have merit for other states. CMS and 12 states (including Minnesota) are currently participating in the FAI to improve care for dual eligibles using either managed fee for service or fully capitated models. This study found that one type of capitated model represented by the MSHO program has great potential for improving outcomes for dual eligibles.
References
Grabowski, D.C. (2007). Medicare and Medicaid: Conflicting incentives for long-term care. Milbank Quarterly, 85(4), 579-610.
Grabowski, D.C. (2009). Special needs plans and the coordination of benefits and services for dual eligibles. Health Affairs, 28(1), 136-146.
Medicare Payment Advisory Commission (MedPAC). (2010). Coordinating the care of dual-eligible beneficiaries. http://medpac.gov/documents/Jun10_EntireReport.pdf.
Medicaid and CHIP Payment and Access Commission (MACPAC). Data book: Beneficiaries dually eligible for Medicare and Medicaid--January 2016. https://www.macpac.gov/publication/medpac-and-macpac-data-book-beneficiaries-dually-eligible-for-medicare-and-medicaid/.
Minnesota Department of Human Services (DHS). (2012). Minnesota Senior Health Options. http://mn.gov/dhs/people-we-serve/seniors/health-care/health-care-programs/programs-and-services/msho.jsp.
Oster, E. (2015). Unobservable selection and coefficient stability: Theory and evidence. Brown University and National Bureau of Economic Research. https://www.brown.edu/research/projects/oster/sites/brown.edu.research.projects.oster/files/uploads/Unobservable_Selection_and_Coefficient_Stability.pdf.
Polniaszek, S., Walsh, E.G., & Wiener, J. M. (2011).Hospitalizations of nursing home residents: Background and options. Washington, DC: Office of the Assistant Secretary for Planning and Evaluation, U.S. Department of Health and Human Services. https://aspe.hhs.gov/basic-report/hospitalizations-nursing-home-residents-background-and-options.
Ryan, J., & Super, N. (2003). Dually eligible for Medicare and Medicaid: Two for one or double jeopardy. National Health Policy Forum (NHPF Issue Brief No. 794), 1-24.
Walls, J., Fox-Grage, W., Ujvari, K., Scully, D., Cho, E., & Hall, J.M. (2013). Two-thirds of states integrating Medicare and Medicaid services for dual eligibles. AARP Public Policy Institute. http://www.aarp.org/content/dam/aarp/research/public_policy_institute/health/2013/states-integrating-medicare-and-medicaid-AARP-ppi-health.pdf.
Walsh, E.G., Freiman, M.P., Haber, S., Bragg, A., Ouslander, J., & Wiener, J.M. (2010). Cost drivers for dually eligible beneficiaries: Potentially avoidable hospitalizations from long-term and post-acute care settings. Report for the Centers for Medicare and Medicaid Services. Waltham, MA: RTI International.
Appendix A. Additional Tables
| TABLE A-1a. Logistic Regression Results on Having Any Hospital Stay, 2010-2012: Overall Sample, Model 1 | ||
|---|---|---|
| Characteristic | β | AOR |
| Enrolled in an MSHO plan | -0.616 | 0.540 *** |
| Age group (Ref.=65-69): | ||
| 70-74 | -0.019 | 0.981 |
| 75-79 | 0.077 | 1.080 *** |
| 80-84 | 0.078 | 1.081 *** |
| 85-89 | 0.068 | 1.070 ** |
| 90+ | -0.207 | 0.813 *** |
| Female | -0.074 | 0.929 *** |
| Died during year | 0.912 | 2.488 *** |
| Disabilities/conditions: | ||
| Mental illnessa | 0.604 | 1.829 *** |
| Neurological disabilityb | 0.107 | 1.113 *** |
| Physical disabilityc | 0.579 | 1.785 *** |
| Sensory disabilityd | 0.216 | 1.241 *** |
| Other medical disability or chronic diseasee | 1.989 | 7.305 *** |
| Calendar year (Ref.=2010): | ||
| 2011 | -0.033 | 0.968 * |
| 2012 | -0.169 | 0.844 *** |
| County characteristics: | ||
| # PCPs per 1,000 population | --- | |
| % Population 65+ who do not live in community | --- | |
| % Population 65+ who live in community with others | --- | |
| % Population 65+ with college education | --- | |
| % Population 65+ who are married | --- | |
| County fixed effects | NO | |
| N | 121,696 | |
|
||
| TABLE A-1b. Logistic Regression Results on Having Any Hospital Stay, 2010-2012: Overall Sample, Model 2 | ||
|---|---|---|
| Characteristic | β | AOR |
| Enrolled in an MSHO plan | -0.655 | 0.519 *** |
| Age group (Ref.=65-69): | ||
| 70-74 | -0.017 | 0.983 |
| 75-79 | 0.065 | 1.067 ** |
| 80-84 | 0.039 | 1.039 |
| 85-89 | 0.003 | 1.003 |
| 90+ | -0.293 | 0.746 *** |
| Female | -0.084 | 0.919 *** |
| Died during year | 0.907 | 2.477 *** |
| Disabilities/conditions: | ||
| Mental illnessa | 0.593 | 1.809 *** |
| Neurological disabilityb | 0.143 | 1.154 *** |
| Physical disabilityc | 0.605 | 1.832 *** |
| Sensory disabilityd | 0.247 | 1.280 *** |
| Other medical disability or chronic diseasee | 1.990 | 7.319 *** |
| Calendar year (Ref.=2010): | ||
| 2011 | -0.003 | 0.997 |
| 2012 | -0.165 | 0.848 *** |
| County characteristics: | ||
| # PCPs per 1,000 population | 0.206 | 1.228 *** |
| % Population 65+ who do not live in community | 0.012 | 1.012 *** |
| % Population 65+ who live in community with others | -0.007 | 0.993 * |
| % Population 65+ with college education | -0.019 | 0.982 *** |
| % Population 65+ who are married | 0.024 | 1.024 *** |
| County fixed effects | NO | |
| N | 120,815g | |
|
||
| TABLE A-1c. Logistic Regression Results on Having Any Hospital Stay, 2010-2012: Overall Sample, Model 3 | ||
|---|---|---|
| Characteristic | β | AOR |
| Enrolled in an MSHO plan | -0.663 | 0.515 *** |
| Age group (Ref.=65-69): | ||
| 70-74 | -0.012 | 0.988 |
| 75-79 | 0.068 | 1.071 ** |
| 80-84 | 0.040 | 1.041 |
| 85-89 | -0.003 | 0.997 |
| 90+ | -0.306 | 0.737 *** |
| Female | -0.079 | 0.924 *** |
| Died during year | 0.918 | 2.504 *** |
| Disabilities/conditions: | ||
| Mental illnessa | 0.603 | 1.827 *** |
| Neurological disabilityb | 0.136 | 1.146 *** |
| Physical disabilityc | 0.620 | 1.859 *** |
| Sensory disabilityd | 0.251 | 1.286 *** |
| Other medical disability or chronic diseasee | 1.999 | 7.381 *** |
| Calendar year (Ref.=2010): | ||
| 2011 | -0.021 | 0.979 |
| 2012 | -0.160 | 0.852 *** |
| County characteristics: | ||
| # PCPs per 1,000 population | --- | |
| % Population 65+ who do not live in community | --- | |
| % Population 65+ who live in community with others | --- | |
| % Population 65+ with college education | --- | |
| % Population 65+ who are married | --- | |
| County fixed effects | YESf | |
| N | 121,696 | |
|
||
| TABLE A-2a. Logistic Regression Results on Having Any Outpatient ED Visit, 2010-2012: Overall Sample, Model 1 | ||
|---|---|---|
| Characteristic | β | AOR |
| Enrolled in an MSHO plan | -0.038 | 0.963 ** |
| Age group (Ref.=65-69): | ||
| 70-74 | -0.067 | 0.935 *** |
| 75-79 | -0.056 | 0.945 ** |
| 80-84 | -0.083 | 0.920 *** |
| 85-89 | -0.140 | 0.869 *** |
| 90+ | -0.252 | 0.777 *** |
| Female | -0.052 | 0.950 *** |
| Died during year | 0.057 | 1.059 *** |
| Disabilities/conditions: | ||
| Mental illnessa | 0.471 | 1.601 *** |
| Neurological disabilityb | 0.030 | 1.031 ** |
| Physical disabilityc | 0.681 | 1.977 *** |
| Sensory disabilityd | 0.319 | 1.375 *** |
| Other medical disability or chronic diseasee | 1.071 | 2.919 *** |
| Calendar year (Ref.=2010): | ||
| 2011 | 0.042 | 1.043 *** |
| 2012 | 0.048 | 1.049 *** |
| County characteristics: | ||
| # PCPs per 1,000 population | --- | |
| % Population 65+ who do not live in community | --- | |
| % Population 65+ who live in community with others | --- | |
| % Population 65+ with college education | --- | |
| % Population 65+ who are married | --- | |
| County fixed effects | NO | |
| N | 121,696 | |
|
||
| TABLE A-2b. Logistic Regression Results on Having Any Outpatient ED Visit, 2010-2012: Overall Sample, Model 2 | ||
|---|---|---|
| Characteristic | β | AOR |
| Enrolled in an MSHO plan | -0.073 | 0.930 *** |
| Age group (Ref.=65-69): | ||
| 70-74 | -0.066 | 0.936 *** |
| 75-79 | -0.071 | 0.932 *** |
| 80-84 | -0.133 | 0.875 *** |
| 85-89 | -0.218 | 0.804 *** |
| 90+ | -0.353 | 0.703 *** |
| Female | -0.063 | 0.939 *** |
| Died during year | 0.043 | 1.044 ** |
| Disabilities/conditions: | ||
| Mental illnessa | 0.456 | 1.578 *** |
| Neurological disabilityb | 0.068 | 1.070 *** |
| Physical disabilityc | 0.711 | 2.036 *** |
| Sensory disabilityd | 0.350 | 1.419 *** |
| Other medical disability or chronic diseasee | 1.067 | 2.906 *** |
| Calendar year (Ref.=2010): | ||
| 2011 | 0.075 | 1.078 *** |
| 2012 | 0.073 | 1.075 *** |
| County characteristics: | ||
| # PCPs per 1,000 population | 0.015 | 1.015 |
| % Population 65+ who do not live in community | 0.000 | 1.000 |
| % Population 65+ who live in community with others | -0.021 | 0.980 *** |
| % Population 65+ with college education | -0.016 | 0.984 *** |
| % Population 65+ who are married | 0.030 | 1.030 *** |
| County fixed effects | NO | |
| N | 120,815g | |
|
||
| TABLE A-2c. Logistic Regression Results on Having Any Outpatient ED Visit, 2010-2012: Overall Sample, Model 3 | ||
|---|---|---|
| Characteristic | β | AOR |
| Enrolled in an MSHO plan | -0.064 | 0.938 *** |
| Age group (Ref.=65-69): | ||
| 70-74 | -0.065 | 0.937 *** |
| 75-79 | -0.072 | 0.931 *** |
| 80-84 | -0.142 | 0.867 *** |
| 85-89 | -0.244 | 0.783 *** |
| 90+ | -0.383 | 0.682 *** |
| Female | -0.057 | 0.945 *** |
| Died during year | 0.037 | 1.038 * |
| Disabilities/conditions: | ||
| Mental illnessa | 0.460 | 1.585 *** |
| Neurological disabilityb | 0.069 | 1.071 *** |
| Physical disabilityc | 0.728 | 2.07 *** |
| Sensory disabilityd | 0.367 | 1.444 *** |
| Other medical disability or chronic diseasee | 1.070 | 2.914 *** |
| Calendar year (Ref.=2010): | ||
| 2011 | 0.045 | 1.046 *** |
| 2012 | 0.057 | 1.058 *** |
| County characteristics: | ||
| # PCPs per 1,000 population | --- | |
| % Population 65+ who do not live in community | --- | |
| % Population 65+ who live in community with others | --- | |
| % Population 65+ with college education | --- | |
| % Population 65+ who are married | --- | |
| County fixed effects | YESf | |
| N | 121,696 | |
|
||
| TABLE A-3a. Logistic Regression Results on Having Any Long-Term Nursing Facility Use, 2010-2012: Overall Sample Model 1 | ||
|---|---|---|
| Characteristic | β | AOR |
| Enrolled in an MSHO plan | 0.079 | 1.082 *** |
| Age group (Ref.=65-69): | ||
| 70-74 | 0.445 | 1.561 *** |
| 75-79 | 0.781 | 2.183 *** |
| 80-84 | 1.192 | 3.295 *** |
| 85-89 | 1.653 | 5.220 *** |
| 90+ | 2.166 | 8.721 *** |
| Female | -0.119 | 0.888 *** |
| Died during year | 0.701 | 2.015 *** |
| Disabilities/conditions: | ||
| Mental illnessa | 1.427 | 4.164 *** |
| Neurological disabilityb | 0.874 | 2.396 *** |
| Physical disabilityc | -0.289 | 0.749 *** |
| Sensory disabilityd | 0.157 | 1.171 *** |
| Other medical disability or chronic diseasee | 0.747 | 2.111 *** |
| Calendar year (Ref.=2010): | ||
| 2011 | -0.104 | 0.902 *** |
| 2012 | -0.161 | 0.851 *** |
| County characteristics: | ||
| # PCPs per 1,000 population | --- | |
| % Population 65+ who do not live in community | --- | |
| % Population 65+ who live in community with others | --- | |
| % Population 65+ with college education | --- | |
| % Population 65+ who are married | --- | |
| County fixed effects | NO | |
| N | 121,696 | |
|
||
| TABLE A-3b. Logistic Regression Results on Having Any Long-Term Nursing Facility Use, 2010-2012: Overall Sample Model 2 | ||
|---|---|---|
| Characteristic | β | AOR |
| Enrolled in an MSHO plan | 0.030 | 1.030 |
| Age group (Ref.=65-69): | ||
| 70-74 | 0.448 | 1.566 *** |
| 75-79 | 0.772 | 2.164 *** |
| 80-84 | 1.160 | 3.191 *** |
| 85-89 | 1.603 | 4.967 *** |
| 90+ | 2.101 | 8.178 *** |
| Female | 0.121 | 0.886 *** |
| Died during year | 0.694 | 2.002 *** |
| Disabilities/conditions: | ||
| Mental illnessa | 1.426 | 4.162 *** |
| Neurological disabilityb | 0.915 | 2.496 *** |
| Physical disabilityc | -0.277 | 0.758 *** |
| Sensory disabilityd | 0.191 | 1.210 *** |
| Other medical disability or chronic diseasee | 0.748 | 2.112 *** |
| Calendar year (Ref.=2010): | ||
| 2011 | -0.046 | 0.955 ** |
| 2012 | -0.078 | 0.925 *** |
| County characteristics: | ||
| # PCPs per 1,000 population | -0.291 | 0.748 *** |
| % Population 65+ who do not live in community | 0.001 | 1.001 |
| % Population 65+ who live in community with others | -0.040 | 0.961 *** |
| % Population 65+ with college education | -0.010 | 0.990 *** |
| % Population 65+ who are married | 0.022 | 1.022 *** |
| County fixed effects | NO | |
| N | 120,815g | |
|
||
| TABLE A-3c. Logistic Regression Results on Having Any Long-Term Nursing Facility Use, 2010-2012: Overall Sample Model 3 | ||
|---|---|---|
| Characteristic | β | AOR |
| Enrolled in an MSHO plan | 0.015 | 1.015 |
| Age group (Ref.=65-69): | ||
| 70-74 | 0.445 | 1.561 *** |
| 75-79 | 0.762 | 2.143 *** |
| 80-84 | 1.148 | 3.153 *** |
| 85-89 | 1.586 | 4.882 *** |
| 90+ | 2.077 | 7.984 *** |
| Female | -0.118 | 0.889 *** |
| Died during year | 0.703 | 2.019 *** |
| Disabilities/conditions: | ||
| Mental illnessa | 1.437 | 4.206 *** |
| Neurological disabilityb | 0.978 | 2.658 *** |
| Physical disabilityc | -0.270 | 0.764 *** |
| Sensory disabilityd | 0.189 | 1.208 *** |
| Other medical disability or chronic diseasee | 0.751 | 2.119 *** |
| Calendar year (Ref.=2010): | ||
| 2011 | -0.092 | 0.912 *** |
| 2012 | -0.145 | 0.865 *** |
| County characteristics: | ||
| # PCPs per 1,000 population | --- | |
| % Population 65+ who do not live in community | --- | |
| % Population 65+ who live in community with others | --- | |
| % Population 65+ with college education | --- | |
| % Population 65+ who are married | --- | |
| County fixed effects | YESf | |
| N | 121,696 | |
|
||
| TABLE A-4a. Logistic Regression Results on Using Any HCBS, 2010-2012: Overall Sample, Model 1 | ||
|---|---|---|
| Characteristic | β | AOR |
| Enrolled in an MSHO plan | 0.086 | 1.089 *** |
| Age group (Ref.=65-69): | ||
| 70-74 | 0.305 | 1.356 *** |
| 75-79 | 0.429 | 1.536 *** |
| 80-84 | 0.368 | 1.445 *** |
| 85-89 | 0.152 | 1.164 *** |
| 90+ | -0.217 | 0.805 *** |
| Female | 0.214 | 1.239 *** |
| Died during year | 0.132 | 1.141 *** |
| Disabilities/conditions: | ||
| Mental illnessa | -0.191 | 0.826 *** |
| Neurological disabilityb | 0.217 | 1.243 *** |
| Physical disabilityc | 0.620 | 1.859 *** |
| Sensory disabilityd | 0.014 | 1.014 |
| Other medical disability or chronic diseasee | 0.679 | 1.971 *** |
| Calendar year (Ref.=2010): | ||
| 2011 | 0.051 | 1.053 *** |
| 2012 | 0.103 | 1.108 *** |
| County characteristics: | ||
| # PCPs per 1,000 population | --- | |
| % Population 65+ who do not live in community | --- | |
| % Population 65+ who live in community with others | --- | |
| % Population 65+ with college education | --- | |
| % Population 65+ who are married | --- | |
| County fixed effects | NO | |
| N | 121,696 | |
|
||
| TABLE A-4b. Logistic Regression Results on Using Any HCBS, 2010-2012: Overall Sample, Model 2 | ||
|---|---|---|
| Characteristic | β | AOR |
| Enrolled in an MSHO plan | 0.110 | 1.116 *** |
| Age group (Ref.=65-69): | ||
| 70-74 | 0.308 | 1.360 *** |
| 75-79 | 0.438 | 1.549 *** |
| 80-84 | 0.404 | 1.497 *** |
| 85-89 | 0.206 | 1.229 *** |
| 90+ | -0.155 | 0.857 *** |
| Female | 0.221 | 1.247 *** |
| Died during year | 0.146 | 1.157 *** |
| Disabilities/conditions: | ||
| Mental illnessa | -0.184 | 0.832 *** |
| Neurological disabilityb | 0.193 | 1.213 *** |
| Physical disabilityc | 0.608 | 1.837 *** |
| Sensory disabilityd | -0.011 | 0.989 |
| Other medical disability or chronic diseasee | 0.692 | 1.998 *** |
| Calendar year (Ref.=2010): | ||
| 2011 | 0.029 | 1.029 * |
| 2012 | 0.070 | 1.072 *** |
| County characteristics: | ||
| # PCPs per 1,000 population | 0.124 | 1.132 *** |
| % Population 65+ who do not live in community | 0.001 | 1.001 |
| % Population 65+ who live in community with others | 0.034 | 1.035 *** |
| % Population 65+ with college education | 0.001 | 1.001 |
| % Population 65+ who are married | -0.035 | 0.965 *** |
| County fixed effects | NO | |
| N | 120,815g | |
|
||
| TABLE A-4c. Logistic Regression Results on Using Any HCBS, 2010-2012: Overall Sample, Model 3 | ||
|---|---|---|
| Characteristic | β | AOR |
| Enrolled in an MSHO plan | 0.126 | 1.134 *** |
| Age group (Ref.=65-69): | ||
| 70-74 | 0.306 | 1.358 *** |
| 75-79 | 0.453 | 1.573 *** |
| 80-84 | 0.426 | 1.531 *** |
| 85-89 | 0.233 | 1.262 *** |
| 90+ | -0.119 | 0.888 *** |
| Female | 0.215 | 1.24 *** |
| Died during year | 0.149 | 1.16 *** |
| Disabilities/conditions: | ||
| Mental illnessa | -0.180 | 0.835 *** |
| Neurological disabilityb | 0.183 | 1.201 *** |
| Physical disabilityc | 0.613 | 1.846 *** |
| Sensory disabilityd | -0.008 | 0.992 |
| Other medical disability or chronic diseasee | 0.700 | 2.014 *** |
| Calendar year (Ref.=2010): | ||
| 2011 | 0.044 | 1.045 *** |
| 2012 | 0.093 | 1.098 *** |
| County characteristics: | ||
| # PCPs per 1,000 population | --- | |
| % Population 65+ who do not live in community | --- | |
| % Population 65+ who live in community with others | --- | |
| % Population 65+ with college education | --- | |
| % Population 65+ who are married | --- | |
| County fixed effects | YESf | |
| N | 121,696 | |
|
||
| TABLE A-5a. Logistic Regression Results on Having Any Assisted Living Facility Use: 2010-2012: Overall Sample, Model 1 | ||
|---|---|---|
| Characteristic | β | AOR |
| Enrolled in an MSHO plan | -0.126 | 0.882 *** |
| Age group (Ref.=65-69): | ||
| 70-74 | 0.290 | 1.336 *** |
| 75-79 | 0.569 | 1.766 *** |
| 80-84 | 0.978 | 2.658 *** |
| 85-89 | 1.176 | 3.242 *** |
| 90+ | 1.146 | 3.146 *** |
| Female | 0.247 | 1.280 *** |
| Died during year | -0.252 | 0.778 *** |
| Disabilities/conditions: | ||
| Mental illnessa | 0.336 | 1.400 *** |
| Neurological disabilityb | 0.369 | 1.447 *** |
| Physical disabilityc | 0.019 | 1.019 |
| Sensory disabilityd | -0.229 | 0.796 *** |
| Other medical disability or chronic diseasee | 0.058 | 1.059 ** |
| Calendar year (Ref.=2010): | ||
| 2011 | 0.051 | 1.053 *** |
| 2012 | 0.060 | 1.062 *** |
| County characteristics: | ||
| # PCPs per 1,000 population | --- | |
| % Population 65+ who do not live in community | --- | |
| % Population 65+ who live in community with others | --- | |
| % Population 65+ with college education | --- | |
| % Population 65+ who are married | --- | |
| County fixed effects | NO | |
| N | 121,696 | |
|
||
| TABLE A-5b. Logistic Regression Results on Having Any Assisted Living Facility Use: 2010-2012: Overall Sample, Model 2 | ||
|---|---|---|
| Characteristic | β | AOR |
| Enrolled in an MSHO plan | -0.168 | 0.845 *** |
| Age group (Ref.=65-69): | ||
| 70-74 | 0.286 | 1.331 *** |
| 75-79 | 0.550 | 1.734 *** |
| 80-84 | 0.926 | 2.525 *** |
| 85-89 | 1.097 | 2.996 *** |
| 90+ | 1.044 | 2.841 *** |
| Female | 0.242 | 1.273 *** |
| Died during year | -0.265 | 0.767 *** |
| Disabilities/conditions: | ||
| Mental illnessa | 0.320 | 1.377 *** |
| Neurological disabilityb | 0.411 | 1.509 *** |
| Physical disabilityc | 0.042 | 1.043 ** |
| Sensory disabilityd | -0.192 | 0.825 *** |
| Other medical disability or chronic diseasee | 0.057 | 1.059 ** |
| Calendar year (Ref.=2010): | ||
| 2011 | 0.083 | 1.086 *** |
| 2012 | 0.059 | 1.061 *** |
| County characteristics: | ||
| # PCPs per 1,000 population | 0.277 | 1.319 *** |
| % Population 65+ who do not live in community | 0.031 | 1.031 *** |
| % Population 65+ who live in community with others | -0.023 | 0.977 *** |
| % Population 65+ with college education | -0.006 | 0.994 *** |
| % Population 65+ who are married | 0.055 | 1.056 *** |
| County fixed effects | NO | |
| N | 120,815g | |
|
||
| TABLE A-5c. Logistic Regression Results on Having Any Assisted Living Facility Use: 2010-2012: Overall Sample, Model 3 | ||
|---|---|---|
| Characteristic | β | AOR |
| Enrolled in an MSHO plan | -0.171 | 0.842 *** |
| Age group (Ref.=65-69): | ||
| 70-74 | 0.313 | 1.368 *** |
| 75-79 | 0.588 | 1.801 *** |
| 80-84 | 0.971 | 2.641 *** |
| 85-89 | 1.127 | 3.087 *** |
| 90+ | 1.077 | 2.934 *** |
| Female | 0.224 | 1.250 *** |
| Died during year | -0.286 | 0.752 *** |
| Disabilities/conditions: | ||
| Mental illnessa | 0.326 | 1.386 *** |
| Neurological disabilityb | 0.372 | 1.450 *** |
| Physical disabilityc | 0.066 | 1.069 *** |
| Sensory disabilityd | -0.160 | 0.852 *** |
| Other medical disability or chronic diseasee | 0.048 | 1.049 * |
| Calendar year (Ref.=2010): | ||
| 2011 | 0.045 | 1.046 ** |
| 2012 | 0.054 | 1.055 *** |
| County characteristics: | ||
| # PCPs per 1,000 population | --- | |
| % Population 65+ who do not live in community | --- | |
| % Population 65+ who live in community with others | --- | |
| % Population 65+ with college education | --- | |
| % Population 65+ who are married | --- | |
| County fixed effects | YESf | |
| N | 121,696 | |
|
||
| TABLE A-6a. Logistic Regression Results on Having Any Visit to a PCP, 2010-2012: Overall Sample, Model 1 | ||
|---|---|---|
| Characteristic | β | AOR |
| Enrolled in an MSHO plan | 0.802 | 2.231 *** |
| Age group (Ref.=65-69): | ||
| 70-74 | -0.027 | 0.974 |
| 75-79 | -0.033 | 0.968 |
| 80-84 | -0.070 | 0.933 ** |
| 85-89 | -0.034 | 0.967 |
| 90+ | -0.032 | 0.969 |
| Female | 0.158 | 1.171 *** |
| Died during year | -0.770 | 0.463 *** |
| Disabilities/conditions: | ||
| Mental illnessa | 0.449 | 1.566 *** |
| Neurological disabilityb | 0.421 | 1.523 *** |
| Physical disabilityc | 0.403 | 1.497 *** |
| Sensory disabilityd | 0.313 | 1.367 *** |
| Other medical disability or chronic diseasee | 0.971 | 2.641 *** |
| Calendar year (Ref.=2010): | ||
| 2011 | 0.015 | 1.015 |
| 2012 | -0.044 | 0.957 ** |
| County characteristics: | ||
| # PCPs per 1,000 population | --- | |
| % Population 65+ who do not live in community | --- | |
| % Population 65+ who live in community with others | --- | |
| % Population 65+ with college education | --- | |
| % Population 65+ who are married | --- | |
| County fixed effects | NO | |
| N | 121,696 | |
|
||
| TABLE A-6b. Logistic Regression Results on Having Any Visit to a PCP, 2010-2012: Overall Sample, Model 2 | ||
|---|---|---|
| Characteristic | β | AOR |
| Enrolled in an MSHO plan | 0.879 | 2.408 *** |
| Age group (Ref.=65-69): | ||
| 70-74 | -0.033 | 0.967 |
| 75-79 | -0.015 | 0.985 |
| 80-84 | -0.004 | 0.996 |
| 85-89 | 0.070 | 1.072 ** |
| 90+ | 0.106 | 1.112 *** |
| Female | 0.167 | 1.182 *** |
| Died during year | -0.767 | 0.464 *** |
| Disabilities/conditions: | ||
| Mental illnessa | 0.482 | 1.620 *** |
| Neurological disabilityb | 0.373 | 1.452 *** |
| Physical disabilityc | 0.373 | 1.452 *** |
| Sensory disabilityd | 0.283 | 1.326 *** |
| Other medical disability or chronic diseasee | 1.018 | 2.766 *** |
| Calendar year (Ref.=2010): | ||
| 2011 | -0.061 | 0.941 *** |
| 2012 | -0.162 | 0.850 *** |
| County characteristics: | ||
| # PCPs per 1,000 population | 0.091 | 1.095 *** |
| % Population 65+ who do not live in community | 0.014 | 1.014 *** |
| % Population 65+ who live in community with others | 0.087 | 1.091 *** |
| % Population 65+ with college education | 0.014 | 1.014 *** |
| % Population 65+ who are married | -0.062 | 0.940 *** |
| County fixed effects | NO | |
| N | 120,815g | |
|
||
| TABLE A-6c. Logistic Regression Results on Having Any Visit to a PCP, 2010-2012: Overall Sample, Model 3 | ||
|---|---|---|
| Characteristic | β | AOR |
| Enrolled in an MSHO plan | 0.995 | 2.705 *** |
| Age group (Ref.=65-69): | ||
| 70-74 | -0.056 | 0.945 ** |
| 75-79 | -0.013 | 0.987 |
| 80-84 | 0.005 | 1.005 |
| 85-89 | 0.110 | 1.116 *** |
| 90+ | 0.161 | 1.174 *** |
| Female | 0.141 | 1.151 *** |
| Died during year | -0.809 | 0.446 *** |
| Disabilities/conditions: | ||
| Mental illnessa | 0.515 | 1.674 *** |
| Neurological disabilityb | 0.389 | 1.475 *** |
| Physical disabilityc | 0.402 | 1.495 *** |
| Sensory disabilityd | 0.303 | 1.353 *** |
| Other medical disability or chronic diseasee | 1.081 | 2.947 *** |
| Calendar year (Ref.=2010): | ||
| 2011 | 0.025 | 1.025 |
| 2012 | -0.042 | 0.959 ** |
| County characteristics: | ||
| # PCPs per 1,000 population | --- | |
| % Population 65+ who do not live in community | --- | |
| % Population 65+ who live in community with others | --- | |
| % Population 65+ with college education | --- | |
| % Population 65+ who are married | --- | |
| County fixed effects | YESf | |
| N | 121,696 | |
|
||
| TABLE A-7a. Logistic Regression Results on Having Any Visit to a Specialist, 2010-2012: Overall Sample, Model 1 | ||
|---|---|---|
| Characteristic | β | AOR |
| Enrolled in an MSHO plan | -0.045 | 0.956 ** |
| Age group (Ref.=65-69): | ||
| 70-74 | -0.045 | 0.956 |
| 75-79 | -0.113 | 0.893 *** |
| 80-84 | -0.234 | 0.792 *** |
| 85-89 | -0.411 | 0.663 *** |
| 90+ | -0.710 | 0.492 *** |
| Female | 0.084 | 1.088 *** |
| Died during year | -1.086 | 0.338 *** |
| Disabilities/conditions: | ||
| Mental illnessa | 0.415 | 1.514 *** |
| Neurological disabilityb | -0.052 | 0.949 *** |
| Physical disabilityc | 0.951 | 2.587 *** |
| Sensory disabilityd | 1.555 | 4.737 *** |
| Other medical disability or chronic diseasee | 1.199 | 3.318 *** |
| Calendar year (Ref.=2010): | ||
| 2011 | 0.012 | 1.012 |
| 2012 | 0.013 | 1.013 |
| County characteristics: | ||
| # PCPs per 1,000 population | --- | |
| % Population 65+ who do not live in community | --- | |
| % Population 65+ who live in community with others | --- | |
| % Population 65+ with college education | --- | |
| % Population 65+ who are married | --- | |
| County fixed effects | NO | |
| N | 121,696 | |
|
||
| TABLE A-7b. Logistic Regression Results on Having Any Visit to a Specialist, 2010-2012: Overall Sample, Model 2 | ||
|---|---|---|
| Characteristic | β | AOR |
| Enrolled in an MSHO plan | -0.017 | 0.983 |
| Age group (Ref.=65-69): | ||
| 70-74 | -0.046 | 0.955 |
| 75-79 | -0.105 | 0.901 *** |
| 80-84 | -0.195 | 0.822 *** |
| 85-89 | -0.349 | 0.705 *** |
| 90+ | -0.632 | 0.531 *** |
| Female | 0.089 | 1.092 *** |
| Died during year | -1.082 | 0.339 *** |
| Disabilities/conditions: | ||
| Mental illnessa | 0.431 | 1.539 *** |
| Neurological disabilityb | -0.085 | 0.919 *** |
| Physical disabilityc | 0.937 | 2.552 *** |
| Sensory disabilityd | 1.542 | 4.672 *** |
| Other medical disability or chronic diseasee | 1.214 | 3.366 *** |
| Calendar year (Ref.=2010): | ||
| 2011 | -0.025 | 0.976 |
| 2012 | -0.044 | 0.957 ** |
| County characteristics: | ||
| # PCPs per 1,000 population | -0.082 | 0.921 *** |
| % Population 65+ who do not live in community | 0.030 | 1.030 *** |
| % Population 65+ who live in community with others | 0.047 | 1.048 *** |
| % Population 65+ with college education | 0.015 | 1.015 *** |
| % Population 65+ who are married | -0.033 | 0.968 *** |
| County fixed effects | NO | |
| N | 120,815g | |
|
||
| TABLE A-7c. Logistic Regression Results on Having Any Visit to a Specialist, 2010-2012: Overall Sample, Model 3 | ||
|---|---|---|
| Characteristic | β | AOR |
| Enrolled in an MSHO plan | -0.036 | 0.964 |
| Age group (Ref.=65-69): | ||
| 70-74 | -0.046 | 0.955 |
| 75-79 | -0.113 | 0.893 *** |
| 80-84 | -0.203 | 0.816 *** |
| 85-89 | -0.353 | 0.703 *** |
| 90+ | -0.637 | 0.529 *** |
| Female | 0.090 | 1.095 *** |
| Died during year | -1.103 | 0.332 *** |
| Disabilities/conditions: | ||
| Mental illnessa | 0.452 | 1.571 *** |
| Neurological disabilityb | -0.115 | 0.892 *** |
| Physical disabilityc | 0.935 | 2.546 *** |
| Sensory disabilityd | 1.541 | 4.669 *** |
| Other medical disability or chronic diseasee | 1.245 | 3.474 *** |
| Calendar year (Ref.=2010): | ||
| 2011 | 0.014 | 1.014 |
| 2012 | 0.009 | 1.009 |
| County characteristics: | ||
| # PCPs per 1,000 population | --- | |
| % Population 65+ who do not live in community | --- | |
| % Population 65+ who live in community with others | --- | |
| % Population 65+ with college education | --- | |
| % Population 65+ who are married | --- | |
| County fixed effects | YESf | |
| N | 121,696 | |
|
||
| TABLE A-8a. Logistic Regression Results on Having Any Hospice Use Among those Who Died in the Year, 2010-2012: Overall Sample, Model 1 | ||
|---|---|---|
| Characteristic | β | AOR |
| Enrolled in an MSHO plan | 0.069 | 1.071 |
| Age group (Ref.=65-69): | ||
| 70-74 | 0.092 | 1.096 |
| 75-79 | 0.079 | 1.082 |
| 80-84 | 0.158 | 1.171 ** |
| 85-89 | 0.080 | 1.083 |
| 90+ | -0.089 | 0.915 |
| Female | 0.263 | 1.301 *** |
| Disabilities/conditions: | ||
| Mental illnessa | 0.084 | 1.087 ** |
| Neurological disabilityb | 0.144 | 1.154 *** |
| Physical disabilityc | 0.064 | 1.066 * |
| Sensory disabilityd | 0.062 | 1.064 |
| Other medical disability or chronic diseasee | 0.067 | 1.069 |
| Calendar year (Ref.=2010): | ||
| 2011 | 0.058 | 1.059 |
| 2012 | 0.221 | 1.248 *** |
| County characteristics: | ||
| # PCPs per 1,000 population | --- | |
| % Population 65+ who do not live in community | --- | |
| % Population 65+ who live in community with others | --- | |
| % Population 65+ with college education | --- | |
| % Population 65+ who are married | --- | |
| County fixed effects | NO | |
| N | 17,221 | |
|
||
| TABLE A-8b. Logistic Regression Results on Having Any Hospice Use Among those Who Died in the Year, 2010-2012: Overall Sample, Model 2 | ||
|---|---|---|
| Characteristic | β | AOR |
| Enrolled in an MSHO plan | 0.106 | 1.112 ** |
| Age group (Ref.=65-69): | ||
| 70-74 | 0.092 | 1.096 |
| 75-79 | 0.089 | 1.093 |
| 80-84 | 0.192 | 1.212 ** |
| 85-89 | 0.123 | 1.131 |
| 90+ | -0.034 | 0.967 |
| Female | 0.252 | 1.287 *** |
| Disabilities/conditions: | ||
| Mental illnessa | 0.086 | 1.090 ** |
| Neurological disabilityb | 0.109 | 1.115 *** |
| Physical disabilityc | 0.061 | 1.063 |
| Sensory disabilityd | 0.018 | 1.018 |
| Other medical disability or chronic diseasee | 0.063 | 1.065 |
| Calendar year (Ref.=2010): | ||
| 2011 | 0.020 | 1.020 |
| 2012 | 0.149 | 1.161 *** |
| County characteristics: | ||
| # PCPs per 1,000 population | 0.172 | 1.187 *** |
| % Population 65+ who do not live in community | 0.004 | 1.004 |
| % Population 65+ who live in community with others | 0.054 | 1.055 *** |
| % Population 65+ with college education | 0.000 | 1.000 |
| % Population 65+ who are married | -0.040 | 0.961 *** |
| County fixed effects | NO | |
| N | 17,182g | |
|
||
| TABLE A-8c. Logistic Regression Results on Having Any Hospice Use Among those Who Died in the Year, 2010-2012: Overall Sample, Model 3 | ||
|---|---|---|
| Characteristic | β | AOR |
| Enrolled in an MSHO plan | 0.083 | 1.087 * |
| Age group (Ref.=65-69): | ||
| 70-74 | 0.087 | 1.090 |
| 75-79 | 0.116 | 1.122 |
| 80-84 | 0.212 | 1.236 *** |
| 85-89 | 0.165 | 1.180 ** |
| 90+ | 0.020 | 1.020 |
| Female | 0.256 | 1.292 *** |
| Disabilities/conditions: | ||
| Mental illnessa | 0.076 | 1.079 * |
| Neurological disabilityb | 0.089 | 1.093 ** |
| Physical disabilityc | 0.037 | 1.038 |
| Sensory disabilityd | -0.030 | 0.970 |
| Other medical disability or chronic diseasee | 0.067 | 1.070 |
| Calendar year (Ref.=2010): | ||
| 2011 | 0.065 | 1.067 * |
| 2012 | 0.219 | 1.245 *** |
| County characteristics: | ||
| # PCPs per 1,000 population | --- | |
| % Population 65+ who do not live in community | --- | |
| % Population 65+ who live in community with others | --- | |
| % Population 65+ with college education | --- | |
| % Population 65+ who are married | --- | |
| County fixed effects | YESf | |
| N | 17,221 | |
|
||
| TABLE A-9a. Logistic Regression Results on Having Any Visit to a PCP or Specialist, 2010-2012: Overall Sample, Model 1 | ||
|---|---|---|
| Characteristic | β | AOR |
| Enrolled in an MSHO plan | 0.422 | 1.525 *** |
| Age group (Ref.=65-69): | ||
| 70-74 | -0.006 | 0.994 |
| 75-79 | 0.040 | 1.040 |
| 80-84 | 0.012 | 1.012 |
| 85-89 | -0.003 | 0.997 |
| 90+ | -0.161 | 0.851 *** |
| Female | 0.234 | 1.263 *** |
| Died during year | -1.566 | 0.209 *** |
| Disabilities/conditions: | ||
| Mental illnessa | 0.889 | 2.433 *** |
| Neurological disabilityb | 0.435 | 1.546 *** |
| Physical disabilityc | 1.110 | 3.034 *** |
| Sensory disabilityd | 1.594 | 4.922 *** |
| Other medical disability or chronic diseasee | 1.636 | 5.133 *** |
| Calendar year (Ref.=2010): | ||
| 2011 | -0.101 | 0.904 *** |
| 2012 | -0.109 | 0.897 *** |
| County characteristics: | ||
| # PCPs per 1,000 population | --- | |
| % Population 65+ who do not live in community | --- | |
| % Population 65+ who live in community with others | --- | |
| % Population 65+ with college education | --- | |
| % Population 65+ who are married | --- | |
| County fixed effects | NO | |
| N | 121,696 | |
|
||
| TABLE A-9b. Logistic Regression Results on Having Any Visit to a PCP or Specialist, 2010-2012: Overall Sample, Model 2 | ||
|---|---|---|
| Characteristic | β | AOR |
| Enrolled in an MSHO plan | 0.457 | 1.579 *** |
| Age group (Ref.=65-69): | ||
| 70-74 | -0.014 | 0.987 |
| 75-79 | 0.050 | 1.051 |
| 80-84 | 0.061 | 1.062 |
| 85-89 | 0.075 | 1.078 |
| 90+ | -0.059 | 0.942 |
| Female | 0.242 | 1.274 *** |
| Died during year | -1.559 | 0.210 *** |
| Disabilities/conditions: | ||
| Mental illnessa | 0.909 | 2.483 *** |
| Neurological disabilityb | 0.402 | 1.495 *** |
| Physical disabilityc | 1.090 | 2.974 *** |
| Sensory disabilityd | 1.616 | 5.033 *** |
| Other medical disability or chronic diseasee | 1.668 | 5.300 *** |
| Calendar year (Ref.=2010): | ||
| 2011 | -0.148 | 0.863 *** |
| 2012 | -0.178 | 0.837 *** |
| County characteristics: | ||
| # PCPs per 1,000 population | -0.153 | 0.858 *** |
| % Population 65+ who do not live in community | 0.026 | 1.026 *** |
| % Population 65+ who live in community with others | 0.068 | 1.070 *** |
| % Population 65+ with college education | 0.015 | 1.015 *** |
| % Population 65+ who are married | -0.055 | 0.946 *** |
| County fixed effects | NO | |
| N | 120,815g | |
|
||
| TABLE A-9c. Logistic Regression Results on Having Any Visit to a PCP or Specialist, 2010-2012: Overall Sample, Model 3 | ||
|---|---|---|
| Characteristic | β | AOR |
| Enrolled in an MSHO plan | 0.473 | 1.604 *** |
| Age group (Ref.=65-69): | ||
| 70-74 | -0.031 | 0.969 |
| 75-79 | 0.042 | 1.042 |
| 80-84 | 0.055 | 1.057 |
| 85-89 | 0.084 | 1.088 * |
| 90+ | -0.052 | 0.949 |
| Female | 0.228 | 1.257 *** |
| Died during year | -1.582 | 0.206 *** |
| Disabilities/conditions: | ||
| Mental illnessa | 0.942 | 2.564 *** |
| Neurological disabilityb | 0.391 | 1.478 *** |
| Physical disabilityc | 1.088 | 2.969 *** |
| Sensory disabilityd | 1.606 | 4.985 *** |
| Other medical disability or chronic diseasee | 1.706 | 5.507 *** |
| Calendar year (Ref.=2010): | ||
| 2011 | -0.093 | 0.911 *** |
| 2012 | -0.104 | 0.902 *** |
| County characteristics: | ||
| # PCPs per 1,000 population | --- | |
| % Population 65+ who do not live in community | --- | |
| % Population 65+ who live in community with others | --- | |
| % Population 65+ with college education | --- | |
| % Population 65+ who are married | --- | |
| County fixed effects | YESf | |
| N | 121,696 | |
|
||
| TABLE A-10a. Negative Binomial Regression Results on the Count of Hospital Stay, 2010-2012: Sample with Service Use, Model 1 | ||
|---|---|---|
| Characteristic | β | IRR |
| Enrolled in an MSHO plan | -0.296 | 0.744 *** |
| Age group (Ref.=65-69): | ||
| 70-74 | 0.008 | 1.008 |
| 75-79 | -0.035 | 0.965 ** |
| 80-84 | -0.054 | 0.948 *** |
| 85-89 | -0.103 | 0.902 *** |
| 90+ | -0.152 | 0.859 *** |
| Female | -0.021 | 0.979 ** |
| Died during year | 0.041 | 1.042 *** |
| Disabilities/conditions: | ||
| Mental illnessa | 0.078 | 1.081 *** |
| Neurological disabilityb | 0.009 | 1.009 |
| Physical disabilityc | 0.085 | 1.089 *** |
| Sensory disabilityd | 0.037 | 1.037 ** |
| Other medical disability or chronic diseasee | 0.150 | 1.161 *** |
| Calendar year (Ref.=2010): | ||
| 2011 | -0.028 | 0.972 ** |
| 2012 | -0.028 | 0.972 ** |
| County characteristics: | ||
| # PCPs per 1,000 population | --- | |
| % Population 65+ who do not live in community | --- | |
| % Population 65+ who live in community with others | --- | |
| % Population 65+ with college education | --- | |
| % Population 65+ who are married | --- | |
| County fixed effects | NO | |
| N | 24,067 | |
|
||
| TABLE A-10b. Negative Binomial Regression Results on the Count of Hospital Stay, 2010-2012: Sample with Service Use, Model 2 | ||
|---|---|---|
| Characteristic | β | IRR |
| Enrolled in an MSHO plan | -0.298 | 0.742 *** |
| Age group (Ref.=65-69): | ||
| 70-74 | 0.011 | 1.011 |
| 75-79 | -0.035 | 0.966 ** |
| 80-84 | -0.056 | 0.945 *** |
| 85-89 | -0.106 | 0.899 *** |
| 90+ | -0.157 | 0.855 *** |
| Female | -0.021 | 0.980 ** |
| Died during year | 0.041 | 1.042 *** |
| Disabilities/conditions: | ||
| Mental illnessa | 0.077 | 1.080 *** |
| Neurological disabilityb | 0.012 | 1.012 |
| Physical disabilityc | 0.087 | 1.091 *** |
| Sensory disabilityd | 0.039 | 1.039 ** |
| Other medical disability or chronic diseasee | 0.152 | 1.165 *** |
| Calendar year (Ref.=2010): | ||
| 2011 | -0.026 | 0.974 ** |
| 2012 | -0.025 | 0.976 ** |
| County characteristics: | ||
| # PCPs per 1,000 population | 0.005 | 1.005 |
| % Population 65+ who do not live in community | -0.001 | 0.999 |
| % Population 65+ who live in community with others | -0.002 | 0.998 |
| % Population 65+ with college education | -0.001 | 0.999 |
| % Population 65+ who are married | 0.002 | 1.002 |
| County fixed effects | NO | |
| N | 23,879g | |
|
||
| TABLE A-10c. Negative Binomial Regression Results on the Count of Hospital Stay, 2010-2012: Sample with Service Use, Model 3 | ||
|---|---|---|
| Characteristic | β | IRR |
| Enrolled in an MSHO plan | -0.296 | 0.744 *** |
| Age group (Ref.=65-69): | ||
| 70-74 | 0.007 | 1.007 |
| 75-79 | -0.041 | 0.960 ** |
| 80-84 | -0.061 | 0.941 *** |
| 85-89 | -0.114 | 0.892 *** |
| 90+ | -0.165 | 0.848 *** |
| Female | -0.020 | 0.980 * |
| Died during year | 0.041 | 1.042 *** |
| Disabilities/conditions: | ||
| Mental illnessa | 0.078 | 1.081 *** |
| Neurological disabilityb | 0.013 | 1.013 |
| Physical disabilityc | 0.086 | 1.090 *** |
| Sensory disabilityd | 0.039 | 1.039 ** |
| Other medical disability or chronic diseasee | 0.153 | 1.165 *** |
| Calendar year (Ref.=2010): | ||
| 2011 | -0.027 | 0.973 ** |
| 2012 | -0.027 | 0.973 ** |
| County characteristics: | ||
| # PCPs per 1,000 population | --- | |
| % Population 65+ who do not live in community | --- | |
| % Population 65+ who live in community with others | --- | |
| % Population 65+ with college education | --- | |
| % Population 65+ who are married | --- | |
| County fixed effects | YESf | |
| N | 24,067 | |
|
||
| TABLE A-11a. Negative Binomial Regression Results on the Count of Outpatient ED Visits, 2010-2012: Sample with Service Use, Model 1 | ||
|---|---|---|
| Characteristic | β | IRR |
| Enrolled in an MSHO plan | -0.475 | 0.622 *** |
| Age group (Ref.=65-69): | ||
| 70-74 | -0.072 | 0.931 *** |
| 75-79 | -0.101 | 0.904 *** |
| 80-84 | -0.115 | 0.892 *** |
| 85-89 | -0.152 | 0.859 *** |
| 90+ | -0.177 | 0.838 *** |
| Female | -0.065 | 0.937 *** |
| Died during year | -0.013 | 0.987 |
| Disabilities/conditions: | ||
| Mental illnessa | 0.180 | 1.198 *** |
| Neurological disabilityb | 0.012 | 1.012 |
| Physical disabilityc | 0.179 | 1.196 *** |
| Sensory disabilityd | 0.108 | 1.114 *** |
| Other medical disability or chronic diseasee | 0.231 | 1.259 *** |
| Calendar year (Ref.=2010): | ||
| 2011 | -0.005 | 0.995 |
| 2012 | 0.017 | 1.017 * |
| County characteristics: | ||
| # PCPs per 1,000 population | --- | |
| % Population 65+ who do not live in community | --- | |
| % Population 65+ who live in community with others | --- | |
| % Population 65+ with college education | --- | |
| % Population 65+ who are married | --- | |
| County fixed effects | NO | |
| N | 36,541 | |
|
||
| TABLE A-11b. Negative Binomial Regression Results on the Count of Outpatient ED Visits, 2010-2012: Sample with Service Use, Model 2 | ||
|---|---|---|
| Characteristic | β | IRR |
| Enrolled in an MSHO plan | -0.482 | 0.618 *** |
| Age group (Ref.=65-69): | ||
| 70-74 | -0.070 | 0.932 *** |
| 75-79 | -0.104 | 0.901 *** |
| 80-84 | -0.120 | 0.887 *** |
| 85-89 | -0.162 | 0.851 *** |
| 90+ | -0.191 | 0.826 *** |
| Female | -0.067 | 0.935 *** |
| Died during year | -0.019 | 0.982 |
| Disabilities/conditions: | ||
| Mental illnessa | 0.175 | 1.191 *** |
| Neurological disabilityb | 0.019 | 1.019 ** |
| Physical disabilityc | 0.183 | 1.201 *** |
| Sensory disabilityd | 0.111 | 1.118 *** |
| Other medical disability or chronic diseasee | 0.225 | 1.253 *** |
| Calendar year (Ref.=2010): | ||
| 2011 | 0.004 | 1.004 |
| 2012 | 0.022 | 1.022 ** |
| County characteristics: | ||
| # PCPs per 1,000 population | 0.038 | 1.039 *** |
| % Population 65+ who do not live in community | 0.003 | 1.003 |
| % Population 65+ who live in community with others | 0.001 | 1.001 |
| % Population 65+ with college education | -0.005 | 0.995 *** |
| % Population 65+ who are married | 0.001 | 1.001 |
| County fixed effects | NO | |
| N | 36,253g | |
|
||
| TABLE A-11c. Negative Binomial Regression Results on the Count of Outpatient ED Visits, 2010-2012: Sample with Service Use, Model 3 | ||
|---|---|---|
| Characteristic | β | IRR |
| Enrolled in an MSHO plan | -0.484 | 0.616 *** |
| Age group (Ref.=65-69): | ||
| 70-74 | -0.067 | 0.935 *** |
| 75-79 | -0.098 | 0.907 *** |
| 80-84 | -0.119 | 0.888 *** |
| 85-89 | -0.164 | 0.849 *** |
| 90+ | -0.196 | 0.822 *** |
| Female | -0.066 | 0.937 *** |
| Died during year | -0.021 | 0.980 * |
| Disabilities/conditions: | ||
| Mental illnessa | 0.178 | 1.195 *** |
| Neurological disabilityb | 0.018 | 1.018 ** |
| Physical disabilityc | 0.186 | 1.205 *** |
| Sensory disabilityd | 0.115 | 1.122 *** |
| Other medical disability or chronic diseasee | 0.223 | 1.250 *** |
| Calendar year (Ref.=2010): | ||
| 2011 | -0.002 | 0.998 |
| 2012 | 0.021 | 1.021 ** |
| County characteristics: | ||
| # PCPs per 1,000 population | --- | |
| % Population 65+ who do not live in community | --- | |
| % Population 65+ who live in community with others | --- | |
| % Population 65+ with college education | --- | |
| % Population 65+ who are married | --- | |
| County fixed effects | YESf | |
| N | 36,541 | |
|
||
| TABLE A-12a. Negative Binomial Regression Results on the Count of Visits to a PCP, 2010-2012: Sample with Service Use, Model 1 | ||
|---|---|---|
| Characteristic | β | IRR |
| Enrolled in an MSHO plan | -0.460 | 0.631 *** |
| Age group (Ref.=65-69): | ||
| 70-74 | 0.029 | 1.030 *** |
| 75-79 | 0.040 | 1.040 *** |
| 80-84 | 0.027 | 1.027 *** |
| 85-89 | 0.000 | 1.000 |
| 90+ | -0.061 | 0.941 *** |
| Female | -0.011 | 0.989 ** |
| Died during year | -0.355 | 0.701 *** |
| Disabilities/conditions: | ||
| Mental illnessa | 0.147 | 1.158 *** |
| Neurological disabilityb | 0.056 | 1.058 *** |
| Physical disabilityc | 0.256 | 1.292 *** |
| Sensory disabilityd | 0.150 | 1.162 *** |
| Other medical disability or chronic diseasee | 0.531 | 1.700 *** |
| Calendar year (Ref.=2010): | ||
| 2011 | -0.035 | 0.966 *** |
| 2012 | -0.009 | 0.991 |
| County characteristics: | ||
| # PCPs per 1,000 population | --- | |
| % Population 65+ who do not live in community | --- | |
| % Population 65+ who live in community with others | --- | |
| % Population 65+ with college education | --- | |
| % Population 65+ who are married | --- | |
| County fixed effects | NO | |
| N | 100,622 | |
|
||
| TABLE A-12b. Negative Binomial Regression Results on the Count of Visits to a PCP, 2010-2012: Sample with Service Use, Model 2 | ||
|---|---|---|
| Characteristic | β | IRR |
| Enrolled in an MSHO plan | -0.460 | 0.632 *** |
| Age group (Ref.=65-69): | ||
| 70-74 | 0.028 | 1.029 *** |
| 75-79 | 0.040 | 1.041 *** |
| 80-84 | 0.030 | 1.030 *** |
| 85-89 | 0.005 | 1.005 |
| 90+ | -0.053 | 0.948 *** |
| Female | -0.012 | 0.988 ** |
| Died during year | -0.353 | 0.703 *** |
| Disabilities/conditions: | ||
| Mental illnessa | 0.149 | 1.160 *** |
| Neurological disabilityb | 0.053 | 1.054 *** |
| Physical disabilityc | 0.254 | 1.289 *** |
| Sensory disabilityd | 0.147 | 1.158 *** |
| Other medical disability or chronic diseasee | 0.531 | 1.701 *** |
| Calendar year (Ref.=2010): | ||
| 2011 | -0.042 | 0.959 *** |
| 2012 | -0.026 | 0.974 *** |
| County characteristics: | ||
| # PCPs per 1,000 population | -0.002 | 0.998 |
| % Population 65+ who do not live in community | 0.004 | 1.004 *** |
| % Population 65+ who live in community with others | 0.012 | 1.012 *** |
| % Population 65+ with college education | -0.001 | 1.000 |
| % Population 65+ who are married | -0.008 | 0.992 *** |
| County fixed effects | NO | |
| N | 99,949g | |
|
||
| TABLE A-12c. Negative Binomial Regression Results on the Count of Visits to a PCP, 2010-2012: Sample with Service Use, Model 3 | ||
|---|---|---|
| Characteristic | β | IRR |
| Enrolled in an MSHO plan | -0.458 | 0.633 *** |
| Age group (Ref.=65-69): | ||
| 70-74 | 0.033 | 1.033 *** |
| 75-79 | 0.043 | 1.044 *** |
| 80-84 | 0.033 | 1.034 *** |
| 85-89 | 0.012 | 1.012 |
| 90+ | -0.046 | 0.955 *** |
| Female | -0.016 | 0.984 *** |
| Died during year | -0.349 | 0.705 *** |
| Disabilities/conditions: | ||
| Mental illnessa | 0.151 | 1.163 *** |
| Neurological disabilityb | 0.052 | 1.053 *** |
| Physical disabilityc | 0.253 | 1.287 *** |
| Sensory disabilityd | 0.142 | 1.153 *** |
| Other medical disability or chronic diseasee | 0.529 | 1.696 *** |
| Calendar year (Ref.=2010): | ||
| 2011 | -0.036 | 0.965 *** |
| 2012 | -0.011 | 0.989 ** |
| County characteristics: | ||
| # PCPs per 1,000 population | --- | |
| % Population 65+ who do not live in community | --- | |
| % Population 65+ who live in community with others | --- | |
| % Population 65+ with college education | --- | |
| % Population 65+ who are married | --- | |
| County fixed effects | YESf | |
| N | 100,622 | |
|
||
| TABLE A-13a. Negative Binomial Regression Results on the Count of Visits to a Specialist, 2010-2012: Sample with Service Use, Model 1 | ||
|---|---|---|
| Characteristic | β | IRR |
| Enrolled in an MSHO plan | -0.460 | 0.631 *** |
| Age group (Ref.=65-69): | ||
| 70-74 | -0.052 | 0.950 *** |
| 75-79 | -0.101 | 0.904 *** |
| 80-84 | -0.201 | 0.818 *** |
| 85-89 | -0.330 | 0.719 *** |
| 90+ | -0.540 | 0.583 *** |
| Female | -0.015 | 0.985 ** |
| Died during year | -0.298 | 0.742 *** |
| Disabilities/conditions: | ||
| Mental illnessa | 0.223 | 1.250 *** |
| Neurological disabilityb | 0.016 | 1.016 *** |
| Physical disabilityc | 0.387 | 1.473 *** |
| Sensory disabilityd | 0.279 | 1.322 *** |
| Other medical disability or chronic diseasee | 0.466 | 1.593 *** |
| Calendar year (Ref.=2010): | ||
| 2011 | 0.018 | 1.018 *** |
| 2012 | 0.122 | 1.130 *** |
| County characteristics: | ||
| # PCPs per 1,000 population | --- | |
| % Population 65+ who do not live in community | --- | |
| % Population 65+ who live in community with others | --- | |
| % Population 65+ with college education | --- | |
| % Population 65+ who are married | --- | |
| County fixed effects | NO | |
| N | 101,830 | |
|
||
| TABLE A-13b. Negative Binomial Regression Results on the Count of Visits to a Specialist, 2010-2012: Sample with Service Use, Model 2 | ||
|---|---|---|
| Characteristic | β | IRR |
| Enrolled in an MSHO plan | -0.441 | 0.643 *** |
| Age group (Ref.=65-69): | ||
| 70-74 | -0.052 | 0.949 *** |
| 75-79 | -0.098 | 0.907 *** |
| 80-84 | -0.186 | 0.831 *** |
| 85-89 | -0.306 | 0.736 *** |
| 90+ | -0.506 | 0.603 *** |
| Female | -0.011 | 0.990 * |
| Died during year | -0.294 | 0.745 *** |
| Disabilities/conditions: | ||
| Mental illnessa | 0.228 | 1.255 *** |
| Neurological disabilityb | 0.000 | 1.000 |
| Physical disabilityc | 0.378 | 1.460 *** |
| Sensory disabilityd | 0.270 | 1.310 *** |
| Other medical disability or chronic diseasee | 0.471 | 1.602 *** |
| Calendar year (Ref.=2010): | ||
| 2011 | -0.004 | 0.996 |
| 2012 | 0.096 | 1.101 *** |
| County characteristics: | ||
| # PCPs per 1,000 population | -0.005 | 0.995 |
| % Population 65+ who do not live in community | -0.005 | 0.995 *** |
| % Population 65+ who live in community with others | 0.007 | 1.007 *** |
| % Population 65+ with college education | 0.008 | 1.008 *** |
| % Population 65+ who are married | -0.006 | 0.994 *** |
| County fixed effects | NO | |
| N | 101,078g | |
|
||
| TABLE A-13c . Negative Binomial Regression Results on the Count of Visits to a Specialist, 2010-2012: Sample with Service Use, Model 3 | ||
|---|---|---|
| Characteristic | β | IRR |
| Enrolled in an MSHO plan | -0.446 | 0.641 *** |
| Age group (Ref.=65-69): | ||
| 70-74 | -0.053 | 0.949 *** |
| 75-79 | -0.096 | 0.909 *** |
| 80-84 | -0.182 | 0.834 *** |
| 85-89 | -0.300 | 0.741 *** |
| 90+ | -0.501 | 0.606 *** |
| Female | -0.010 | 0.990 * |
| Died during year | -0.291 | 0.747 *** |
| Disabilities/conditions: | ||
| Mental illnessa | 0.229 | 1.257 *** |
| Neurological disabilityb | -0.007 | 0.993 |
| Physical disabilityc | 0.376 | 1.457 *** |
| Sensory disabilityd | 0.268 | 1.307 *** |
| Other medical disability or chronic diseasee | 0.472 | 1.603 *** |
| Calendar year (Ref.=2010): | ||
| 2011 | 0.017 | 1.017 *** |
| 2012 | 0.118 | 1.126 *** |
| County characteristics: | ||
| # PCPs per 1,000 population | --- | |
| % Population 65+ who do not live in community | --- | |
| % Population 65+ who live in community with others | --- | |
| % Population 65+ with college education | --- | |
| % Population 65+ who are married | --- | |
| County fixed effects | YESf | |
| N | 101,830 | |
|
||
| TABLE A-14a. Negative Binomial Regression Results on the Count of Visits to a PCP or Specialist, 2010-2012: Sample with Service Use, Model 1 | ||
|---|---|---|
| Characteristic | β | IRR |
| Enrolled in an MSHO plan | -0.405 | 0.667 *** |
| Age group (Ref.=65-69): | ||
| 70-74 | -0.018 | 0.982 ** |
| 75-79 | -0.042 | 0.959 *** |
| 80-84 | -0.102 | 0.903 *** |
| 85-89 | -0.178 | 0.837 *** |
| 90+ | -0.313 | 0.731 *** |
| Female | -0.005 | 0.995 |
| Died during year | -0.410 | 0.664 *** |
| Disabilities/conditions: | ||
| Mental illnessa | 0.211 | 1.235 *** |
| Neurological disabilityb | 0.047 | 1.048 *** |
| Physical disabilityc | 0.358 | 1.431 *** |
| Sensory disabilityd | 0.256 | 1.292 *** |
| Other medical disability or chronic diseasee | 0.584 | 1.793 *** |
| Calendar year (Ref.=2010): | ||
| 2011 | -0.005 | 0.995 |
| 2012 | 0.053 | 1.054 *** |
| County characteristics: | ||
| # PCPs per 1,000 population | --- | |
| % Population 65+ who do not live in community | --- | |
| % Population 65+ who live in community with others | --- | |
| % Population 65+ with college education | --- | |
| % Population 65+ who are married | --- | |
| County fixed effects | NO | |
| N | 114,371 | |
|
||
| TABLE A-14b. Negative Binomial Regression Results on the Count of Visits to a PCP or Specialist, 2010-2012: Sample with Service Use, Model 2 | ||
|---|---|---|
| Characteristic | β | IRR |
| Enrolled in an MSHO plan | -0.391 | 0.677 *** |
| Age group (Ref.=65-69): | ||
| 70-74 | -0.018 | 0.982 ** |
| 75-79 | -0.038 | 0.963 *** |
| 80-84 | -0.088 | 0.916 *** |
| 85-89 | -0.155 | 0.856 *** |
| 90+ | -0.280 | 0.756 *** |
| Female | -0.003 | 0.997 |
| Died during year | -0.406 | 0.667 *** |
| Disabilities/conditions: | ||
| Mental illnessa | 0.217 | 1.242 *** |
| Neurological disabilityb | 0.035 | 1.035 *** |
| Physical disabilityc | 0.350 | 1.419 *** |
| Sensory disabilityd | 0.246 | 1.279 *** |
| Other medical disability or chronic diseasee | 0.588 | 1.800 *** |
| Calendar year (Ref.=2010): | ||
| 2011 | -0.027 | 0.974 *** |
| 2012 | 0.018 | 1.018 *** |
| County characteristics: | ||
| # PCPs per 1,000 population | 0.015 | 1.015 ** |
| % Population 65+ who do not live in community | 0.003 | 1.003 * |
| % Population 65+ who live in community with others | 0.016 | 1.016 *** |
| % Population 65+ with college education | 0.005 | 1.005 *** |
| % Population 65+ who are married | -0.011 | 0.989 *** |
| County fixed effects | NO | |
| N | 113,562g | |
|
||
| TABLE A-14c. Negative Binomial Regression Results on the Count of Visits to a PCP or Specialist, 2010-2012: Sample with Service Use, Model 3 | ||
|---|---|---|
| Characteristic | β | IRR |
| Enrolled in an MSHO plan | -0.387 | 0.679 *** |
| Age group (Ref.=65-69): | ||
| 70-74 | -0.018 | 0.983 ** |
| 75-79 | -0.035 | 0.965 *** |
| 80-84 | -0.084 | 0.919 *** |
| 85-89 | -0.148 | 0.863 *** |
| 90+ | -0.271 | 0.762 *** |
| Female | -0.008 | 0.993 |
| Died during year | -0.399 | 0.671 *** |
| Disabilities/conditions: | ||
| Mental illnessa | 0.220 | 1.246 *** |
| Neurological disabilityb | 0.030 | 1.031 *** |
| Physical disabilityc | 0.348 | 1.416 *** |
| Sensory disabilityd | 0.243 | 1.275 *** |
| Other medical disability or chronic diseasee | 0.587 | 1.798 *** |
| Calendar year (Ref.=2010): | ||
| 2011 | -0.006 | 0.994 |
| 2012 | 0.048 | 1.050 *** |
| County characteristics: | ||
| # PCPs per 1,000 population | --- | |
| % Population 65+ who do not live in community | --- | |
| % Population 65+ who live in community with others | --- | |
| % Population 65+ with college education | --- | |
| % Population 65+ who are married | --- | |
| County fixed effects | YESf | |
| N | 114,371 | |
|
||
| TABLE A-15. Definition and Coding of Select MDS Variables | |||
|---|---|---|---|
| Variable Description | MDS 2.0 Coding (before Quarter 4, 2010) | MDS 3.0 Coding (before Quarter 4, 2010 and after) | Note |
| Non-White | =1, if AA4 in ('1','2','3','4') =0, if AA4 = '5' |
=1, if A1000F = '0' =0, if A1000F = '1' |
MDS2.0 has 1 single variable with 5 race/ethnicity categories. MDS3.0 has 6 separate variables 1 for each race/ethnicity. |
| Married | =1, if A5 = '2' =0, otherwise |
=1, if A1200 = '2' =0, otherwise |
Same. |
| Admitted from acute care hospital | =1, if AB2 = '5' =0, otherwise |
=1, if A1800 = '03' =0, otherwise |
Same for this particular category. |
| Admitted from communitya | =1, if AB2 in ('1','2','3') =0, otherwise |
=1, if A1800 = '01' =0, otherwise |
MDS2.0 has separate categories for private home/apt. with no home health services; private home/apt. with home health services; and board and care/assisted living/group home. MDS3.0 has a single category for community (private home/apt., board/care, assisted living and group home). |
| Short-term memory problem | =1, if B2A = '1' =0, if B2A = '0' |
(See Note column) | This item is in both MDS2.0 and MDS3.0. Difference: In MDS2.0 it is assessed entirely by staff/proxy, whereas in MDS3.0 it is a combination of self assessment (if resident is able) and staff/proxy assessment (if resident is unable). This, it is not comparable. |
| Long-term memory problem | =1, if B2B = '1' =0, if B2B = '0' |
(See Note column) | This item is in both MDS2.0 and MDS3.0. Difference: In MDS2.0 it is assessed entirely by staff/proxy, whereas in MDS3.0 it is a combination of self assessment (if resident is able) and staff/proxy assessment (if resident is unable). This, it is not comparable. |
| Cognitive skills for daily decision making: moderately or severely impaired | =1, if B4 in ('2','3') =0, otherwise |
(See Note column) | This item is in both MDS2.0 and MDS3.0. Difference: In MDS2.0 it is assessed entirely by staff/proxy, whereas in MDS3.0 it is a combination of self assessment (if resident is able) and staff/proxy assessment (if resident is unable). This, it is not comparable. |
| Severe cognitive impairment | (See NOTE column) | =1, if (C1000 = '3' and C0700 = '1') or ('00' <= C0500 <= '07') =0, otherwise |
For MDS2.0, we choose 3 individual items to measure the extent of cognitive impairment (which are not comparable with MDS3.0). For MDS3.0, we define severe cognitive impairment as those who are severely impaired in daily decision making (i.e., never/rarely made decisions) and has short-term memory problems per staff assessment OR who has a Brief Interview for Mental Status (BIMS) score below 7 (on a scale of 0-15). |
| Total dependence or extensive assistance with each of the following ADLs: | |||
| Eating | =1, if G1HA in ('3','4') =0, otherwise |
=1, if G0110H1 in ('3','4') =0, otherwise |
Same, by and large. However, there are some nuanced differences in coding instructions between MDS2.0 and MDS3.0, which could potentially lead to differences in response. |
| Toileting | =1, if G1IA in ('3','4') =0, otherwise |
=1, if G0110I1 in ('3','4') =0, otherwise |
Same, by and large. However, there are some nuanced differences in coding instructions between MDS2.0 and MDS3.0, which could potentially lead to differences in response. |
| Transferring | =1, if G1BA in ('3','4') =0, otherwise |
=1, if G0110B1 in ('3','4') =0, otherwise |
Same, by and large. However, there are some nuanced differences in coding instructions between MDS2.0 and MDS3.0, which could potentially lead to differences in response. |
| Bathing | =1, if G2A in ('3','4') =0, otherwise |
=1, if G0120A in ('3','4') =0, otherwise |
Same, by and large. However, there are some nuanced differences in coding instructions between MDS2.0 and MDS3.0, which could potentially lead to differences in response. |
| Dressing | =1, if G1GA in ('3','4') =0, otherwise |
=1, if G0110G1 in ('3','4') =0, otherwise |
Same, by and large. However, there are some nuanced differences in coding instructions between MDS2.0 and MDS3.0, which could potentially lead to differences in response. |
|
|||
| TABLE A-16. Select Characteristics of Newly Admitted Nursing Home Residents in the MSHO vs. MSC+ Groups, by Age-Sex Grouping, 2011-2012 | ||||||||||||||
|---|---|---|---|---|---|---|---|---|---|---|---|---|---|---|
| Percentage of Residents (within column) with each Characteristic | Age 65-74 Female MSC+ |
Age 65-74 Female MSHO+ |
Age 65-74 Male MSC+ |
Age 65-74 Male MSHO+ |
Age 75-84 Female MSC+ |
Age 75-84 Female MSHO+ |
Age 75-84 Male MSC+ |
Age 75-84 Male MSHO+ |
Age 85+ Female MSC+ |
Age 85+ Female MSHO+ |
Age 85+ Male MSC+ |
Age 85+ Male MSHO+ |
All MSC+ | All MSHO |
| Non-White | 23.5 | 15.4 | 25.6 | 16.7 | 11.5 | 10.5 | 19.3 | 13.6 | 8.8 | 5.4 | 12.5 | 6.1 | 15.5 | 9.6 |
| Married | 15.1 | 16.4 | 23.1 | 25.4 | 22.0 | 16.8 | 36.9 | 38.3 | 5.9 | 7.5 | 39.8 | 41.7 | 19.3 | 18.2 |
| Admitted from acute care hospital | 89.3 | 85.0 | 86.2 | 81.3 | 79.6 | 80.3 | 87.2 | 80.9 | 80.9 | 77.4 | 84.4 | 76.2 | 83.7 | 79.6 |
| Admitted from community | 6.7 | 9.3 | 5.6 | 9.4 | 13.6 | 13.1 | 8.0 | 12.5 | 10.1 | 14.9 | 5.5 | 17.2 | 9.2 | 13.3 |
| Severe cognitive impairment | 10.1 | 10.2 | 9.7 | 14.8 | 21.5 | 21.1 | 31.6 | 25.1 | 36.8 | 33.1 | 31.3 | 35.7 | 24.3 | 25.2 |
| Total dependence or extensive assistance with:a | 84.9 | 87.0 | 82.1 | 86.1 | 91.1 | 92.4 | 91.4 | 92.2 | 94.1 | 95.9 | 93.0 | 95.2 | 90.0 | 92.7 |
| Eating | 9.7 | 10.5 | 15.9 | 14.1 | 16.5 | 14.3 | 20.9 | 17.0 | 20.6 | 22.2 | 20.3 | 25.1 | 17.2 | 17.9 |
| Toileting | 67.4 | 66.7 | 61.0 | 67.3 | 76.7 | 76.3 | 80.7 | 74.9 | 83.6 | 83.6 | 83.6 | 82.5 | 76.2 | 77.5 |
| Transferring | 63.8 | 62.2 | 56.4 | 60.5 | 70.7 | 69.3 | 74.9 | 69.0 | 78.6 | 77.6 | 77.3 | 75.2 | 71.0 | 71.3 |
| Bathing | 70.1 | 72.9 | 66.2 | 70.8 | 75.7 | 78.6 | 72.2 | 78.1 | 80.5 | 83.9 | 78.9 | 82.2 | 74.8 | 79.5 |
| Dressing | 67.8 | 67.1 | 62.6 | 68.1 | 75.7 | 76.7 | 79.7 | 76.8 | 83.2 | 82.5 | 82.0 | 82.9 | 75.8 | 77.5 |
| n (Nursing home admissions) | 298 | 1,081 | 195 | 562 | 382 | 1,935 | 187 | 758 | 476 | 2,925 | 128 | 709 | 1,666 | 7,970 |
| % (Nursing home admissions of N) | 6.9 | 7.8 | 7.4 | 7.6 | 14.2 | 12.3 | 14.0 | 11.4 | 15.1 | 14.9 | 16.0 | 17.4 | 11.1 | 11.8 |
| N (All persons in study sample) | 4,344 | 13,824 | 2,638 | 7,407 | 2,692 | 15,752 | 1,339 | 6,667 | 3,150 | 19,567 | 800 | 4,079 | 14,963 | 67,296 |
|
||||||||||||||
| TABLE A-17. Select Characteristics of Newly Admitted Nursing Home Residents in the MSHO vs. MSC+ Groups, by Age-Sex Grouping, 2008-2009 | ||||||||||||
|---|---|---|---|---|---|---|---|---|---|---|---|---|
| Percentage of Residents (within column) with each Characteristic | Age 65-74 Female MSC+ |
Age 65-74 Female MSHO |
Age 65-74 Female Medicare Only |
Age 65-74 Male MSC+ |
Age 65-74 Male MSHO |
Age 65-74 Male Medicare Only |
Age 75-84 Female MSC+ |
Age 75-84 Female MSHO |
Age 75-84 Female Medicare Only |
Age 75-84 Male MSC+ |
Age 75-84 Male MSHO |
Age 75-84 Male Medicare Only |
| Non-White | 11.8 | 8.2 | 1.4 | 15.0 | 7.8 | 1.9 | 5.1 | 3.1 | 0.9 | 9.4 | 4.1 | 1.0 |
| Married | 17.7 | 20.0 | 48.6 | 28.6 | 25.3 | 66.2 | 21.8 | 17.0 | 34.3 | 42.2 | 42.1 | 66.7 |
| Admitted from acute care hospital | 89.2 | 84.5 | 94.2 | 88.7 | 82.5 | 93.4 | 83.7 | 83.0 | 91.0 | 87.5 | 83.4 | 89.2 |
| Admitted from community | 7.0 | 10.6 | 4.4 | 5.3 | 12.4 | 4.3 | 10.9 | 12.7 | 6.8 | 10.9 | 11.3 | 8.2 |
| Short-term memory problem | 45.7 | 43.3 | 21.2 | 47.4 | 53.7 | 32.9 | 59.3 | 57.3 | 38.1 | 69.5 | 67.1 | 48.9 |
| Long-term memory problem | 17.7 | 16.9 | 5.6 | 24.8 | 26.9 | 10.9 | 25.3 | 27.5 | 13.2 | 32.0 | 36.0 | 18.4 |
| Total dependence or extensive assistance with: a | 89.2 | 88.6 | 81.5 | 82.0 | 86.5 | 82.5 | 94.6 | 93.0 | 86.7 | 96.1 | 93.4 | 87.9 |
| Eating | 17.2 | 13.2 | 8.5 | 13.5 | 16.4 | 11.6 | 18.6 | 17.7 | 9.2 | 21.9 | 25.0 | 13.5 |
| Toileting | 65.6 | 67.7 | 54.4 | 62.4 | 64.2 | 56.5 | 80.1 | 74.4 | 62.9 | 78.1 | 74.3 | 66.4 |
| Transferring | 63.4 | 62.4 | 51.5 | 54.1 | 58.1 | 52.2 | 72.8 | 67.2 | 58.3 | 70.3 | 66.3 | 59.8 |
| Bathing | 77.4 | 78.9 | 65.3 | 66.2 | 76.6 | 66.9 | 81.7 | 84.8 | 71.9 | 85.2 | 83.8 | 73.1 |
| Dressing | 67.7 | 68.0 | 57.1 | 60.2 | 68.2 | 58.3 | 80.1 | 74.6 | 64.9 | 82.8 | 78.6 | 68.3 |
| n (New nursing home admissions) | 186 | 870 | 4,733 | 133 | 475 | 3,183 | 312 | 1,942 | 10,931 | 128 | 724 | 7,370 |
| % (New nursing home admissions of N) | 8.2 | 9.4 | 2.0 | 9.5 | 9.4 | 1.4 | 15.5 | 15.5 | 6.5 | 14.1 | 15.3 | 5.5 |
| N (ALL persons in study sample) | 2,260 | 9,296 | 239,114 | 1,400 | 5,040 | 223,766 | 2,017 | 12,521 | 167,155 | 911 | 4,734 | 133,185 |
| TABLE A-17 (continued) | |||||||||
|---|---|---|---|---|---|---|---|---|---|
| Percentage of Residents (within column) with each Characteristic | Age 85+ Female MSC+ |
Age 85+ Female MSHO |
Age 85+ Female Medicare Only |
Age 85+ Male MSC+ |
Age 85+ Male MSHO |
Age 85+ Male Medicare Only |
All MSC+ | All MSHO | All Medicare Only |
| Non-White | 3.2 | 1.6 | 0.5 | 1.0 | 1.4 | 0.6 | 6.6 | 3.2 | 0.9 |
| Married | 6.9 | 6.8 | 14.8 | 36.1 | 42.8 | 53.6 | 20.0 | 18.4 | 41.1 |
| Admitted from acute care hospital | 82.9 | 85.5 | 86.7 | 85.6 | 83.7 | 86.4 | 85.3 | 84.3 | 89.4 |
| Admitted from community | 12.0 | 9.8 | 10.8 | 10.3 | 11.4 | 11.3 | 10.1 | 11.0 | 8.3 |
| Short-term memory problem | 71.8 | 74.8 | 57.0 | 75.3 | 74.0 | 63.0 | 62.5 | 65.4 | 46.1 |
| Long-term memory problem | 38.3 | 43.3 | 21.7 | 41.2 | 41.9 | 25.7 | 30.4 | 35.1 | 17.1 |
| Total dependence or extensive assistance with:a | 94.7 | 95.5 | 91.2 | 95.9 | 96.0 | 90.3 | 92.8 | 93.5 | 87.7 |
| Eating | 22.6 | 25.5 | 12.3 | 32.0 | 23.1 | 14.0 | 20.6 | 21.6 | 11.5 |
| Toileting | 82.0 | 79.9 | 72.3 | 84.5 | 79.5 | 71.6 | 77.0 | 75.9 | 65.8 |
| Transferring | 75.3 | 73.9 | 66.3 | 76.3 | 73.5 | 64.1 | 70.4 | 69.5 | 60.3 |
| Bathing | 81.5 | 88.0 | 78.3 | 85.6 | 88.5 | 76.9 | 80.1 | 85.3 | 73.4 |
| Dressing | 78.8 | 81.8 | 72.7 | 82.5 | 81.7 | 72.4 | 76.3 | 77.6 | 67.2 |
| n (New nursing home admissions) | 433 | 3,404 | 11,576 | 97 | 835 | 5,980 | 1,289 | 8,250 | 43,773 |
| % (New nursing home admissions of N) | 18.9 | 19.9 | 14.7 | 18.7 | 23.6 | 14.0 | 13.7 | 15.8 | 4.9 |
| N (ALL persons in study sample) | 2,294 | 17,090 | 78,734 | 520 | 3,540 | 42,770 | 9,402 | 52,221 | 884,724 |
|
|||||||||
Notes
-
Unpublished tabulations from Minnesota Department of Human Services Medicaid Management Information System Data Warehouse as of October 15, 2013. Provided by Pam Parker on August 24, 2015.
-
Unpublished tabulations from Minnesota Department of Human Services (DHS) Medicaid Management Information System Data Warehouse as of October 15, 2013. Provided by Pam Parker on August 24, 2015.
-
Minnesota Health Care Programs Managed Enrollment Totals, July 2013. Available at: http://www.dhs.state.mn.us/main/idcplg?IdcService=GET_DYNAMIC_CONVERSION&RevisionSelectionMethod=LatestReleased&dDocName=dhs16_141529.
-
Oster's method was developed in the context of ordinary least squares (OLS) regression. We re-estimate our models using OLS in order to apply her method. For outcomes based on the level of use, we estimate OLS models for log(use) to reduce the level of skewness of the count variables.
-
Unpublished tabulations from Minnesota DHS Medicaid Management Information System Data Warehouse as of October 15, 2013. Provided by Pam Parker on August 24, 2015.
Project and Report Information
This report was prepared under contract #HHSP23320100021WI between the U.S. Department of Health and Human Services (HHS), Office of Disability, Aging and Long-Term Care Policy (DALTCP) and Research Triangle Institute. For additional information about this subject, you can visit the DALTCP home page at http://aspe.hhs.gov/office-disability-aging-and-long-term-care-policy-daltcp or contact the ASPE Project Officers, John Drabek and Pamela Doty, at HHS/ASPE/DALTCP, Room 424E, H.H. Humphrey Building, 200 Independence Avenue, S.W., Washington, D.C. 20201; John.Drabek@hhs.gov, Pamela.Doty@hhs.gov.