
Abstract
The Affordable Care Act includes several provisions that are expected to significantly improve health outcomes for Asian Americans and Pacific Islanders. New estimates from RAND suggest that 2.0 million Asian Americans who would otherwise be uninsured will be covered or eligible for coverage by 2016 through the expansion of Medicaid eligibility and the creation of Affordable Insurance Exchanges. Many other valuable benefits, including coverage for young adults and preventive services without cost-sharing, are already in effect and benefiting Asian Americans and Pacific Islanders across the country.
Racial and ethnic disparities in health and health care in the United States are pervasive and well-documented. Racial and ethnic minorities still lag behind their White counterparts across a range of health indicators, including life expectancy, prevalence of chronic diseases, and access to quality care.1,2 In addition, individuals from racial and ethnic minority groups make up about one-third of the nation’s population, but are at higher risk than the general population of being uninsured, making up over half of the estimated 50 million Americans with no health insurance coverage.3
Asian Americans and Pacific Islanders make up 4.9 percent of the population, with a total of 15.2 million.4 This population grew faster than any other racial group in the United States between 2000 and 2010, an increase of 43 percent.5 The largest Asian American and Pacific Islander subgroups in 2010 were Chinese (3.5 million), Asian Indian (2.9 million), Filipino (2.6 million), Vietnamese (1.6 million), Korean (1.5 million), Japanese (0.8 million), and Native Hawaiian and Other Pacific Islanders (0.5 million).6
Overall, an estimated 18.1 percent of Asian Americans and Pacific Islanders are uninsured, compared with 16.3 percent of all Americans.7 However, the extent of uninsurance varies considerably by Asian American and Pacific Islander subgroup, with rates of 6.6 percent for Japanese Americans, 10.9 percent for Filipino Americans, 11.8 percent for Asian Indian Americans, 13.4 percent for Chinese Americans, 16.7 percent for Native Hawaiian and Pacific Islander Americans, 19.8 percent for Vietnamese Americans, and 25.5 percent for Korean Americans.8
The Affordable Care Act includes provisions that will greatly improve the health of Asian Americans and Pacific Islanders by increasing their access to affordable health insurance coverage and high-quality care.9 New estimates from RAND suggest that in 2016, 2.0 million Asian Americans who would otherwise be uninsured will gain or be eligible for coverage. Valuable benefits, including coverage for young adults and preventive services without cost-sharing, are already in effect and benefiting Asian Americans and Pacific Islanders across the country.
"
Expanded Insurance Coverage
Under the Affordable Care Act, young adults ages 19-25 can be covered under their parent’s employer-sponsored or individually purchased health insurance.10 In the first nine months after this provision took effect (October 2010 to June 2011), the number of young adults in this age group with health insurance increased by 8.3 percent.11 These estimates show that from September 2010 to June 2011, the share of adults 19 to 25 with insurance coverage increased from 64 percent to 73 percent, which translates into 2.5 million additional young adults with coverage. And of the 2.5 million young adults who have benefitted from this provision of the Affordable Care Act, an estimated 97,000 are Asian American and Pacific Islander (Table 1).12
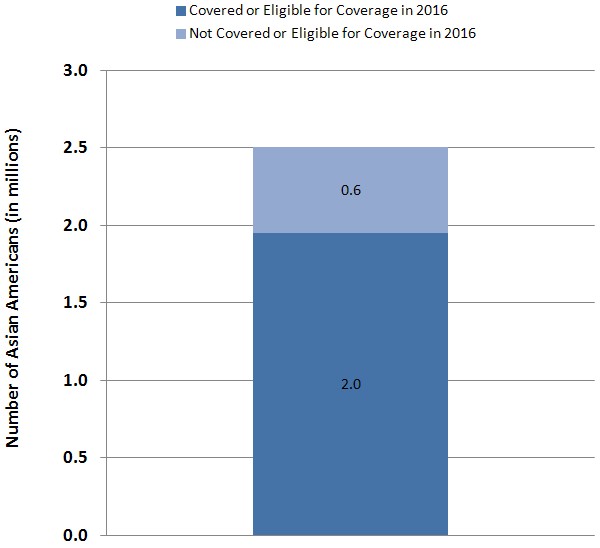
Estimates from the RAND COMPARE microsimulation model suggest that in 2016, 2.0 million Asian Americans who would otherwise be uninsured will be eligible for coverage through the expansion of Medicaid eligibility and the creation of Affordable Insurance Exchanges, or newly covered by their employers (Figure 1).13 The Affordable Care Act expands Medicaid coverage to include Americans with family incomes at or below 133 percent of federal poverty guidelines (currently $30,657 for a family of four); the expansion includes adults without dependent children living at home, who have not been eligible in most states.14 Individuals with incomes up to 400 percent of federal poverty guidelines (currently $92,200 for a family of four) will be eligible to purchase subsidized coverage from the new Affordable Insurance Exchanges.15
Preventive Health Services
The Affordable Care Act helps to address health disparities by making prevention more affordable and accessible, requiring many health insurance plans to cover recommended prevention and wellness benefits with no cost-sharing (such as a co-payment or deductible).16 The services that many insurers are now required to cover with no cost-sharing include well-child visits, blood pressure and cholesterol screenings, diabetes screening, Pap smears and mammograms for women, and flu shots for both children and adults. An estimated 2.7 million Asian Americans and Pacific Islanders with private insurance currently have access to expanded preventive services with no cost-sharing because of the Affordable Care Act.17
The 867,000 elderly and disabled Asian Americans and Pacific Islanders who receive health coverage from Medicare also have access to an expanded list of preventive services with no cost-sharing under the Affordable Care Act. These benefits include an annual wellness visit with a personalized prevention plan and access to such important screenings and services as diabetes and colorectal cancer screenings, bone mass measurement, mammograms, and hepatitis B and pneumococcal shots.18 Asian American adults are 29 percent less likely than Whites to receive the pneumococcal vaccination.19
Cancer screenings are particularly important for Asian Americans and Pacific Islanders who are less likely to undergo mammograms, Pap smears, and colorectal cancer screening than Whites.20 Cervical cancer incidence rates are particularly high for Laotian Americans, Samoan Americans, Vietnamese Americans, and Cambodian Americans.21 The law also requires insurers to cover HIV screening without cost-sharing for individuals at high risk of infection. This is important for Asian Americans who are less likely to be tested for HIV/AIDS.22 While the rates of adults and adolescents living with a diagnosis of HIV infection has generally declined over the past five years for Whites and Native Hawaiian and Other Pacific Islanders, it has continued to increase for Asian Americans.23
Asian American children are the most likely to have had no health care visits to an office or clinic in the past year.24 Asian American adults are also more likely than their White counterparts to have had no office visits in the past year (24.7 percent for Asian Americans, compared with 19.6 percent for Whites) and tend to report relatively high lengths of time since last contact with a doctor or other health care professional.25
The Affordable Care Act benefits Asian Americans and Pacific Islanders in many other ways, including:
- Improving Chronic Disease Management. Racial and ethnic minorities often receive poorer quality care and face more barriers in seeking care and chronic disease management than White patients. The Affordable Care Act’s Innovation Center explores opportunities to invest in care innovations such as community health teams to improve the management of chronic disease.26 Such investments seek to improve care for Americans suffering from chronic disease such as the estimated 891,000 Asian American adults with diabetes.27 In addition, an estimated 1.4 million people in the United States are living with chronic hepatitis B. More than half are Asian Americans and Pacific Islanders, who have a hepatitis B virus mortality rate seven times greater than Whites.28 Tuberculosis continues to disproportionally affect the Asian American and Pacific Islander population. In 2010, Asian Americans had a prevalence rate of tuberculosis 25 times higher than Whites (22.5 cases per 100,000 population for Asian Americans, compared to 0.9 cases per 100,000 population for Whites). Native Hawaiians and Other Pacific Islanders had a prevalence rate of tuberculosis 23 times higher (20.6 cases compared to 0.9 cases).29
- Increasing Access to Community Health Centers. The Affordable Care Act increases the funding available to the more than 1,100 community health centers in all fifty states, the District of Columbia, and Puerto Rico, and the additional funding will enable them to increase the number of patients they serve.30
- Strengthening Cultural Competency in Health Care. The Affordable Care Act includes initiatives to strengthen cultural competency training among health care providers.31 These initiatives will help providers better understand and respond to the particular experiences and needs of Asian Americans and Pacific Islanders. Improved doctor patient communication is especially important as many Asian Americans and Pacific Islanders believe their doctors do not understand their culture or their values.32 Asian Americans are the most likely to be born outside the United States (66.7 percent compared to 8.3 percent for Whites) and speak English less than “very well” (35.5 percent compared to 6.0 percent for Whites).33
- Addressing Health Disparities. The Affordable Care Act invests in data collection and research focused on disparities in health and health care to help us better understand the causes of disparities and effective programs to eliminate them.34 Leveraging the Affordable Care Act, the U.S. Department of Health and Human Services (HHS) has developed and is implementing the HHS Disparities Action Plan, the Department’s largest commitment to the elimination of health disparities.35 The Affordable Care Act promotes the National Center on Minority Health and Health Disparities at the National Institutes of Health (NIH) to Institute status, enabling it to access increased funding and to plan, coordinate, and evaluate disparity-related research within NIH.36 The law also invests in the Community Transformation Grant program to support States and communities by promoting healthy lifestyles (for example, tobacco-free living), especially among groups experiencing high rates of chronic disease such as Asian Americans and Pacific Islanders. The program aims to improve health, reduce health disparities, and lower health care costs.37 HHS is in the process of upgrading data collection standards to better understand the causes of health disparities and evaluate progress toward eliminating them.38 HHS has adopted new data collection standards for its major surveys that include additional granularity for Asian Americans and Pacific Islanders. These new standards, which add a combined nine additional data collection categories for these two groups, will enhance the ability of HHS to identity and address disparities among Asian American and Pacific Islander subgroups.
- Native Hawaiians and Other Pacific Islanders. Native Hawaiians and OtherPacific Islanders are a small group in absolute numbers and often are not sampled sufficiently in surveys to estimate reliable statistics. When Native Hawaiian and Other Pacific Islander numbers are reported separately, it becomes evident that these Americans suffer from many health disparities. For example, Native Hawaiian and Other Pacific Islanders have the highest rates of all types of circulatory diseases (20.2 percent of Native Hawaiian and Other Pacific Islander adults have a circulatory disease compared to 11.7 percent of White American adults).39 Circulatory diseases include coronary heart disease, hypertension, and stroke. Native Hawaiian and Other Pacific Islanders report the highest rates of difficulty in physical functioning (25.6 percent of Native Hawaiian and Other Pacific Islander adults have any physical difficulty compared to 14.8 percent of all White American adults).40 Native Hawaiian and Other Pacific Islanders also have the highest rates of obesity (43.5 percent of Native Hawaiian and Other Pacific Islander adults are obese compared to 26.8 percent of all White American adults).41 Moreover, Native Hawaiian and Other Pacific Islanders have the highest percentage of adults (37.4 percent) with no office visits in the past year.42 The Affordable Care Act’s provisions will be particularly important for this population.
Because of the Affordable Care Act, all Americans will have access to affordable health care coverage. For Asian Americans and Pacific Islanders, the benefits are especially important. The law’s benefits will help reduce disparities in both health care and health outcomes through expanded insurance coverage and better access to high-quality health care services.
Table 1.Key Benefits of the Affordable Care Act for Asian Americans and Pacific Islanders
Figure 1:
Two Million Asian Americans Who Would Otherwise Be Uninsured
Will Be Covered or Eligible for Coverage Under the Affordable Care Act
Source: RAND COMPARE microsimulation model.
Note: Estimates shown are for 2016 coverage of individuals ages 0-64 reporting themselves as Asian.
Estimates do not include individuals reporting themselves as Native Hawaiian or Other Pacific Islander;
individuals reporting themselves as Spanish, Hispanic, or Latino; or individuals reporting more than one race.
The 2.5 million included in this figure are Asian Americans who would be uninsured in the the absence of the Affordable Care Act
(the 0.6 million and 2.0 million shown in the figure do not add to 2.5 million because of rounding).
The 2.0 million Asian Americans who are covered or eligible for coverage in 2016 will be covered or eligible for coverage
through the expansion of Medicaid eligibility or subsidized coverage in the Affordable Insurance Exchanges, or will be newly covered by their employers.
Endnotes
1 “Health disparities: A case for closing the gap.” Office of Health Reform, Department of Health and Human Services, 2009. (Accessed at http://www.healthreform.gov/reports/healthdisparities/).
2 Lesley M. Russell, “Reducing disparities in life expectancy: What factors matter?” The Institute of Medicine, 2011. (Accessed at http://www.iom.edu/~/media/Files/Activity percent20Files/SelectPops/HealthDisparities/2011-FEB-24/Commissioned percent20Paper percent20by percent20Lesley percent20Russell.pdf).
3 “Overview of the Uninsured in the United States: A Summary of the 2011 Current Population Survey.” Office of the Assistant Secretary for Planning and Evaluation, U.S. Department of Health and Human Services, 2011, p. 1. (Accessed at http://aspe.hhs.gov/health/reports/2011/CPSHealthIns2011/ib.shtml).
4 Karen R. Humes, Nicholas A. Jones, and Roberto R. Ramirez, “Overview of Race and Hispanic Origin: 2010.” U.S. Census Bureau, Table 8 (p. 14) and Table 9 (p. 15). (Accessed at http://www.census.gov/prod/cen2010/briefs/c2010br-02.pdf). Population estimate combines the total number of Asians alone and the total number of Native Hawaiian and Other Pacific Islanders alone. Throughout the brief, we use the term “Asian Americans and Pacific Islanders” for estimates encompassing both groups, and “Asian Americans” and “Native Hawaiians and Other Pacific Islanders”, respectively, for estimates for each of those groups separately. Some data sources refer to Asian Americans as “Asians,” and some data sources refer to Native Hawaiians and Other Pacific Islanders as “Pacific Islanders.” Some data sources that report data for Asian Americans do not report data for Native Hawaiians and Other Pacific Islanders due to small sample sizes and/or high standard errors for the latter population.
5 Karen R. Humes, Nicholas A. Jones, and Roberto R. Ramirez, “Overview of Race and Hispanic Origin: 2010.” U.S. Census Bureau, Table 1 (p. 4). (Accessed at http://www.census.gov/prod/cen2010/briefs/c2010br-02.pdf). This growth rate estimate was taken by first combining the Asian alone and Native Hawaiian and Other Pacific Islanders alone categories for both 2000 and 2010, and then calculating the growth rate of these totals.
6 Population estimates for Native Hawaiians and Other Pacific Islanders are from Karen R. Humes, Nicholas A. Jones, and Roberto R. Ramirez, “Overview of Race and Hispanic Origin: 2010.” U.S. Census Bureau, Table 3 (p. 7). (Accessed at http://www.census.gov/prod/cen2010/briefs/c2010br-02.pdf). All other Asian American and Pacific Islander subgroup population estimates are from Elizabeth M. Hoeffel, Sonya Rastogi, Myoung Ouk Kim, and Hasan Shahid, “The Asian Population: 2010.” U.S Census Bureau, Table 6 (p. 15). (Accessed at http://www.census.gov/prod/cen2010/briefs/c2010br-11.pdf).
7 Carmen DeNavas-Walt, Bernadette D. Proctor, and Jessica C. Smith, “Income, Poverty, and Health Insurance Coverage in the United States: 2010.” U.S. Census Bureau Current Population Reports Table 8 (p. 26). (Accessed at http://www.census.gov/prod/2011pubs/p60-239.pdf).
8 Estimates are from the 2008-2010 American Community Survey (ACS) for subgroups of Asian alone using the U.S. Census Bureau’s American FactFinder tool. The American FactFinder tool can be accessed at http://factfinder2.census.gov/faces/nav/jsf/pages/index.xhtml.
9 Patient Protection and Affordable Care Act (Public Law 111-148) and Health Care and Education Reconciliation Act of 2010 (Public Law 111-152).
10 Section 1001.
11 Benjamin D. Sommers and Karyn Schwartz, “2.5 million young adults gain health insurance due to the Affordable Care Act.” Office of the Assistant Secretary for Planning and Evaluation, Department of Health and Human Services, 2011, p. 1. (Accessed at http://aspe.hhs.gov/health/reports/2011/YoungAdultsACA/ib.shtml). The estimate is based on data from the June 2011 National Health Interview Survey (NHIS).
12 “New Report Shows Affordable Care Act Has Expanded Insurance Coverage Among Young Adults of All Races and Ethnicities.” Office of the Assistant Secretary for Planning and Evaluation, Department of Health and Human Services, 2011, p. 2. (Accessed at http://aspe.hhs.gov/health/reports/2012/YoungAdultsbyGroup/ib.shtml).
13 Estimates provided to the Office of the Assistant Secretary for Planning and Evaluation under contract no. HHSP23320095649WC. Information on the RAND COMPARE model is available at http://www.rand.org/health/projects/compare.html.
14 Section 2001. Section 2002 provides for an income disregard of 5 percent of Federal Poverty Guidelines, raising the effective income limit to 138 percent ($31,809 for a family of four).
15 Section 1401.
17 Benjamin D. Sommers and Lee Wilson, “Fifty-four million additional Americans are receiving preventive services without cost-sharing.” Office of the Assistant Secretary for Planning and Evaluation, Department of Health and Human Services, 2011, p. 3. (Accessed at http://aspe.hhs.gov/health/reports/2012/PreventiveServices/ib.shtml).
18 The Medicare preventive services provisions are in Section 4104. Medicare enrollment data computed from 2009 Medicare Current Beneficiary Survey. The complete list of benefits covered with no cost-sharing is available in “The Affordable Care Act: Strengthening Medicare in 2011.” U.S. Department of Health and Human Services. (Accessed at http://www.cms.gov/apps/files/MedicareReport2011.pdf).
19 “Health, United States, 2010.” Centers for Disease Control and Prevention (CDC), Table 85 (p. 293). (Accessed at http://www.cdc.gov/nchs/data/hus/hus10.pdf#085). Native Hawaiians and Pacific Islanders are not included in this estimate and are not shown separately in the source due to high standard error.
20 “Cancer Screening – United States, 2010.” Morbidity and Mortality Weekly Report, 61(03), Centers for Disease Control and Prevention (CDC), 2012, pp. 41-45. (Accessed at http://www.cdc.gov/mmwr/pdf/wk/mm6103.pdf). Asian American and Pacific Islander screening rates are 8.7 percentage points below that for Whites for mammograms, 8.0 percentage points below that for Whites for Pap smears, and 12.9 percentage points below that for Whites for colorectal cancer screening. Estimated Asian American and Pacific Islander rates for mammograms and Pap smears are also below those for African Americans, American Indians and Alaska Natives, and Latinos. Estimated Asian American and Pacific Islander rates for colorectal cancer screening are below those for African Americans and for American Indians and Alaska Natives, but slightly above those for Latinos.
21 “The Affordable Care Act Helps Asian Americans and Pacific Islanders.” The White House, 2012, p. 1. (Accessed at http://www.whitehouse.gov/sites/default/files/private/docs/the_aca_helps_aapis_fact_sheet.pdf).
22 “Summary Health Statistics for U.S. Adults: National Health Interview Survey, 2010.” Centers for Disease Control and Prevention (CDC), Table 41 (p. 136). (Accessed at http://www.cdc.gov/nchs/data/series/sr_10/sr10_252.pdf ).
23 “HIV Surveillance Report.” Centers for Disease Control and Prevention (CDC) Vol. 21, 2009, p. 6. (Accessed at http://www.cdc.gov/hiv/surveillance/resources/reports/2009report/pdf/2009SurveillanceReport.pdf).
24 “Health, United States, 2010.” Centers for Disease Control and Prevention (CDC), Table 78 (p. 279). (Accessed at http://www.cdc.gov/nchs/data/hus/hus10.pdf#085). Native Hawaiian and Other Pacific Islanders are not included and not shown separately in the source because of high standard error.
25 “Summary Health Statistics for U.S. Adults: National Health Interview Survey, 2010.” Centers for Disease Control and Prevention (CDC) National Center for Health Statistics, Table 35 (p. 118). (Accessed at http://www.cdc.gov/nchs/data/series/sr_10/sr10_252.pdf).
26 Innovation Center, Health Care Innovation Challenge Funding Opportunity Number: CMS-1C1-12-001, CFDA: 93.610. (Accessed at http://www.innovations.cms.gov/Files/x/Health-Care-Innovation-Challenge-Funding-Opportunity-Announcement.pdf).
27 “Summary Health Statistics for U.S. Adults: National Health Interview Survey, 2010.” Centers for Disease Control and Prevention (CDC) National Center for Health Statistics, Table 7 (p. 34). (Accessed at http://www.cdc.gov/nchs/data/series/sr_10/sr10_252.pdf). Native Hawaiian and Other Pacific Islander adults are not included and are not shown separately in the source due to high standard error.
28 “Notice to Readers: National Hepatitis B Initiative for Asian Americans/Native Hawaiian and Other Pacific Islanders.” Centers for Disease Control and Prevention (CDC) Morbidity and Mortality Weekly Report 58(18), 2009, pp. 503-4. (Accessed at http://www.cdc.gov/mmwr/preview/mmwrhtml/mm5818a6.htm).
29 “Trends in Tuberculosis — United States 2010.” Centers for Disease Control and Prevention (CDC), p. 1. (Accessed at http://www.cdc.gov/mmwr/preview/mmwrhtml/mm6011a2.htm#fig1).
30 “The Affordable Care Act Helps Asian Americans and Pacific Islanders.” The White House, 2012, p. 3. (Accessed at http://www.whitehouse.gov/sites/default/files/private/docs/the_aca_helps_aapis_fact_sheet.pdf ).
31 For example, Section 5402 provides for loan repayments and educational assistance for health care professionals with disadvantaged backgrounds, and provision of training in cultural competency is a priority criterion for support and development of primary care training programs under Section 5301.
32 “Quality of Health Care for Asian Americans,” based on the 2001 Health Care Quality Survey. The Commonwealth Fund, March 2002, p. 2. (Accessed at http://www.commonwealthfund.org/~/media/Files/Publications/Other/2002/Mar/Quality%20of%20Health%20Care%20for%20Asian%20Americans%20%20A%20Fact%20Sheet/Hughes_factsheetasam%20pdf.pdf).
33 Estimates are from the 2008-2010 American Community Survey (ACS) for Asian alone and White alone using the US Census Bureau’s American FactFinder tool. The American FactFinder tool can be accessed at http://factfinder2.census.gov/faces/nav/jsf/pages/index.xhtml.
34 Sections 4302, 6301, 10334. Final Data Collection Standards for Race, Ethnicity, Primary Language, Sex, and Disability Status Required by Section 4302 of the Affordable Care Act available at http://minorityhealth.hhs.gov/templates/browse.aspx?lvl=2&lvlid=208.
35 More information on the HHS Disparities Action Plan can be accessed at http://minorityhealth.hhs.gov/npa/templates/content.aspx?lvl=1&lvlid=33&ID=285.
36 Section 10334.
37 More information on the Community Transformation Grant program can be accessed at http://www.cdc.gov/communitytransformation/.
38 More information on HHS ethnicity standards is available at: http://aspe.hhs.gov/datacncl/standards/ACA/4302/index.shtml. http://www.minorityhealth.hhs.gov/templates/browse.aspx?lvl=2&lvlid=208.
39 “Summary Health Statistics for U.S. Adults: National Health Interview Survey, 2010.” Centers for Disease Control and Prevention (CDC) National Center for Health Statistics, Table 2 (p. 19). (Accessed at http://www.cdc.gov/nchs/data/series/sr_10/sr10_252.pdf). The Native Hawaiian and Other Pacific Islander rate of all circulatory diseases is higher than the rates shown for Whites, Blacks or African Americans, American Indians or Alaska Natives, Asians, or Hispanics or Latinos.
40 “Summary Health Statistics for U.S. Adults: National Health Interview Survey, 2010.” Centers for Disease Control and Prevention (CDC) National Center for Health Statistics, Table 19 (p. 70). (Accessed at http://www.cdc.gov/nchs/data/series/sr_10/sr10_252.pdf). The Native Hawaiian and Other Pacific Islander rate of difficulty in physical functioning is higher than the rates shown for Whites, Blacks or African Americans, American Indians or Alaska Natives, Asians, or Hispanics or Latinos. Physical difficulties include inability to walk a quarter of a mile, climb up ten stairs without resting, or stand for two hours.
41 “Summary Health Statistics for U.S. Adults: National Health Interview Survey, 2010.” Centers for Disease Control and Prevention (CDC) - National Center for Health Statistics, Table 31 (p. 106). (Accessed at http://www.cdc.gov/nchs/data/series/sr_10/sr10_252.pdf). The Native Hawaiian and Other Pacific Islander obesity rate is higher than the rates shown for Whites, Blacks or African Americans, American Indians or Alaska Natives, Asians, or Hispanics or Latinos.
42 “Summary Health Statistics for U.S. Adults: National Health Interview Survey, 2010.” Centers for Disease Control and Prevention (CDC) National Center for Health Statistics, Table 35 (p. 118). (Accessed at http://www.cdc.gov/nchs/data/series/sr_10/sr10_252.pdf).