
Publication Date
ASPE ISSUE BRIEF
Overview of the Uninsured in the United States: A Summary of the 2011 Current Population Survey
September 2011
According to the Census Bureaus 2011 Current Population Survey (CPS), there were 49.9 million uninsured individuals in 2010, or 16.3% of the total population. Those that lack insurance are a diverse group. Understanding the uninsured population is important for policy makers looking to design solutions to the problem.
This Issue Brief is available on the Internet at:http://aspe.hhs.gov/health/reports/2011/CPSHealthIns2011/ib.shtml
Printer Friendly (PDF) Version, (5 pages) [Free PDF reader  ]
]
Contents
Overview of the Uninsured in the United States: A Summary of the 2011 Current Population Survey
- The Census Bureau released data on health insurance coverage and the uninsured for 2010 on September 13, 2011. Although there are four major government surveys that produce estimates of health insurance coverage, the Current Population Survey is the most widely cited and receives national media attention.
- The percentage of people without health insurance in 2010 was not statistically different from 2009. In 2010, the percentage was 16.3%, compared to 16.1% in 2009. Among the non-elderly, 18.4% of individuals were uninsured in 2010, which is not statistically different from the nonelderly uninsured rate of 18.2% in 2009. During 2010, 49.9 million people were without insurance.
- Young adults are the age group least likely to have health insurance. However, 18-24 year olds were the only age group to experience a significant increase in the percentage with health insurance over the past year, from 70.7% in 2009 to 72.8% in 2010. This is a two percentage point increase in the share of adults 18-24 with coverage and represents 500,000 more young adults with health insurance. The Affordable Care Act allows children to remain on their parents plans until age 26, and this policy took effect for insurance plan renewals beginning on September 23, 2010. Given that the fraction with health coverage was stable or decreasing in other groups, the two percentage point increase in share with health coverage among 18-24 year olds almost certainly reflects the effects of the extension of dependent coverage to age 26.
- The percentage of children under age 18 without health insurance in 2010 was 9.8%, stable from 2009. The uninsured rate for children has decreased significantly from 12.0% in 1999, due to the substantial expansion of coverage in response to the Childrens Health Insurance Program (CHIP).
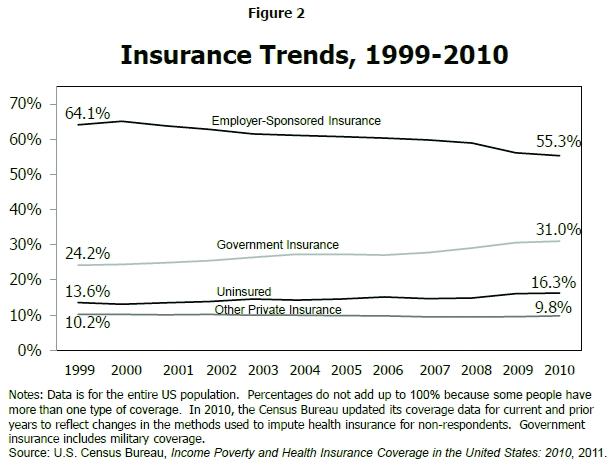
- Employer-sponsored insurance continues to be the largest source of health insurance coverage in 2010, covering 55.3% of the population, a decline from 56.1% in 2009 and 64.1% in 1999.
- Uninsured rates for Hispanics (30.7%) and blacks (20.8%) are higher than for non-Hispanic whites (11.7%).
The following figures summarize key points about the health insurance coverage data released today.
Overall Health Insurance Coverage
- For calendar year 2010:
- 55.3% of the population was covered by employer-sponsored insurance
- 14.5% of the population was covered by Medicare and 15.9% was covered by Medicaid with some individuals covered by both programs
- 16.3% of the population was uninsured for the entire year

- The percentage of people covered by employer-sponsored insurance declined from 56.1% in 2009 to 55.3% in 2010. This continues a steady decline over the past decade, from 64.1% in 1999.
[ Go to Contents ]
How Many Americans are Uninsured?
- The percentage of individuals without health insurance for all of 2010 was 16.3%, statistically unchanged from the 16.1% percent in 2009.
- The number of people without health insurance in 2010 was 49.9 million.
[ Go to Contents ]
Who are the Uninsured?
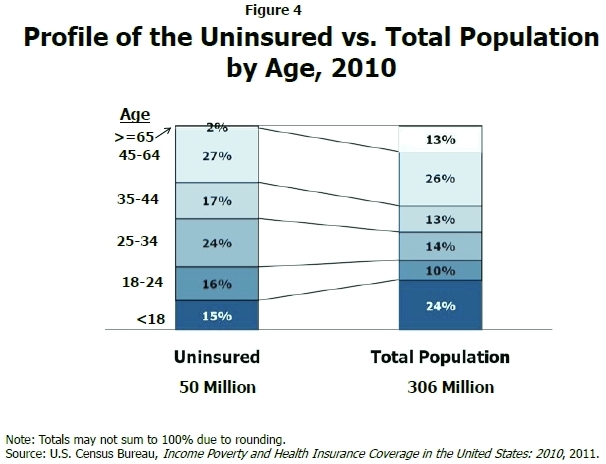
- Age: The uninsured are disproportionately between the ages of 18 and 34. However, 18-24 year-olds were the only age group to experience a significant decline in the percentage without insurance over the past year, from 29.3% in 2009 to 27.2% in 2010, which represents 500,000 fewer young adults without health insurance. The Affordable Care Act allows children to remain on their parents plans until age 26, and this policy took effect for insurance plan renewals beginning on September 23, 2010.
- Race/Ethnicity: In 2010, three in ten individuals of Hispanic origin (30.7%) were uninsured. Blacks were also more likely to be uninsured, with 20.8% lacking insurance, and 18.1% of Asians were uninsured, compared to 11.7% for non-Hispanic whites.
- Employment: Working full-time increases the likelihood of having insurance, though one in seven full-time workers (15.0%) was still uninsured. Uninsured rates were higher among those with a marginal attachment to the labor force. Over a quarter (28.5%) of part-time workers were uninsured, the same percentage as among those who were unemployed.
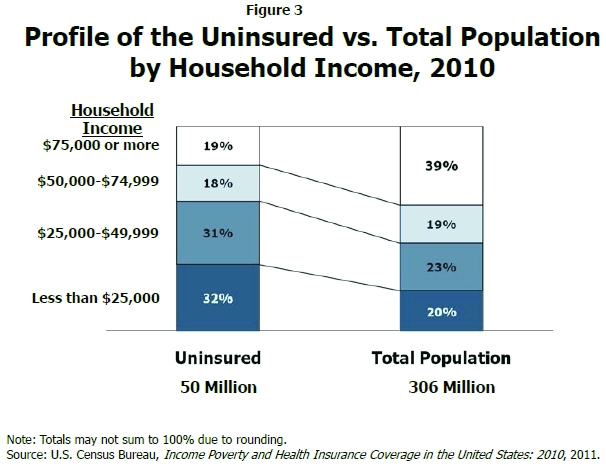
- Income: Individuals with lower incomes are more likely to be uninsured, although 37% of all uninsured Americans have household incomes above $50,000.
| Percent of the Total Population | Percent of the Uninsured | Uninsured Rate | ||
| Age | Under 18 | 24.5% | 14.6% | 9.8% |
| 18-24 | 9.7% | 16.2% | 27.2% | |
| 25-34 | 13.6% | 23.7% | 28.4% | |
| 35-44 | 13.0% | 17.4% | 21.8% | |
| 45-64 | 26.4% | 26.5% | 16.3% | |
| 65 and older | 12.8% | 1.6% | 2.0% | |
| Race/ Ethnicity | White | 79.5% | 74.9% | 15.4% |
| White, Non-Hispanic | 64.5% | 46.3% | 11.7% | |
| Black | 12.8% | 16.3% | 20.8% | |
| Asian | 4.7% | 5.2% | 18.1% | |
| Hispanic (any race) | 16.3% | 30.7% | 30.7% | |
| Household Income | Less than $25,000 | 19.6% | 32.4% | 26.9% |
| $25,000-49,999 | 23.1% | 30.9% | 21.8% | |
| $50,000-$74,999 | 18.7% | 17.7% | 15.4% | |
| $75,000 more | 38.5% | 19.0% | 8.0% |
Source: U.S. Census Bureau, Income Poverty and Health Insurance Coverage in the United States: 2010, 2011.
[ Go to Contents ]
Files
Document
ib.pdf (pdf, 113.27 KB)
Product Type
ASPE Issue Brief
Populations
Uninsured & Underinsured
Location- & Geography-Based Data
National Data