
Fifty-Four Million Additional Americans Are Receiving Preventive Services Coverage Without Cost-Sharing Under The Affordable Care Act
February 2012
By: Benjamin D. Sommers and Lee Wilson ASPE
This Issue Brief is available on the Internet at:http://aspe.hhs.gov/health/reports/2012/PreventiveServices/ib.shtml
Printer Friendly (PDF) Version (4 pages) [Free PDF reader  ]
]
The Affordable Care Act requires many insurance plans (so-called non-grandfathered plans) to provide coverage for and eliminate cost-sharing on certain recommended preventive health services, for policies renewing on or after September 23, 2010.[1] Based primarily on guidelines from the U.S. Preventive Services Task Force, this includes services such as colonoscopy screening for colon cancer, Pap smears and mammograms for women, well-child visits, flu shots for all children and adults, and many more.[2]
While some plans already covered these services, millions of Americans were previously in health plans that did not. According to the Kaiser Family Foundations Employer Health Benefits Survey in 2011, 31% of all workers were covered by plans that expanded their list of covered preventive services due to the Affordable Care Act.[3] The most recent data from the Census Bureau show that 173 million Americans ages 0 to 64 currently have private coverage.[4] Putting these facts together, we estimate that approximately 54 million Americans received expanded coverage of at least some preventive services due to the Affordable Care Act in 2011.[5]
Using national survey data on children and adults with private insurance, we next estimated how those 54 million people are distributed across states, and across age, race, and ethnic groups. We examined the following age/gender groups, and provide here a sample of the services they are now eligible for without any cost-sharing. Note that this is not an exhaustive list of covered services and is only meant to highlight several examples.
- Children (0-17): Coverage includes regular pediatrician visits, vision and hearing screening, developmental assessments, immunizations, and screening and counseling to address obesity and help children maintain a healthy weight.
- Women (18-64): Coverage includes cancer screening such as pap smears for those ages 21 to 64, mammograms for those ages 50 to 64, and colonoscopy for those 50 to 64; recommended immunizations such as HPV vaccination for women ages 19 to 26, flu shots for all adults, and meningococcal and pneumococcal vaccinations for high-risk adults; healthy diet counseling and obesity screening; cholesterol and blood pressure screening; screening for sexually-transmitted infections and HIV; depression screening; and tobacco-use counseling. Starting in August 2012, additional preventive services specific to women, such as screening for gestational diabetes and contraception, will be covered by new health plans with no cost sharing.
- Men (18-64): Coverage includes recommended immunizations such as flu shots for all adults and meningococcal and pneumococcal vaccinations for high-risk adults; cancer screening including colonoscopy for adults 50 to 64; healthy diet counseling and obesity screening; cholesterol and blood pressure screening; screening for HIV; depression screening; and tobacco-use counseling.
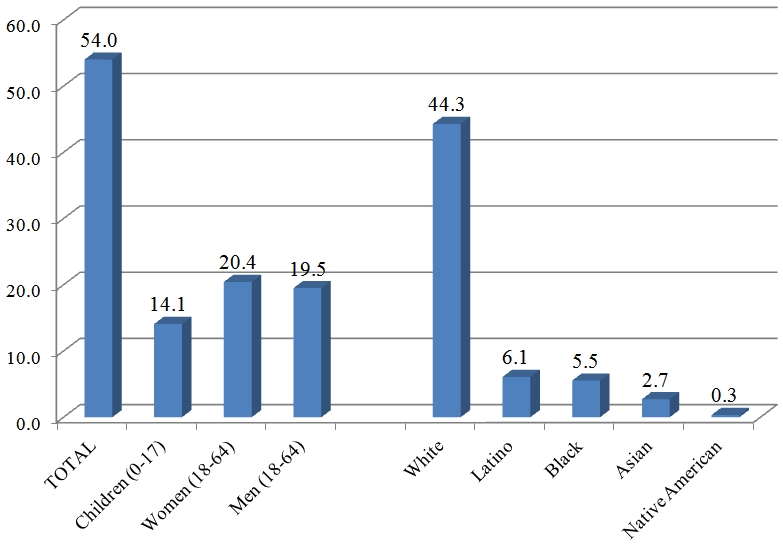
Figure 1 presents national totals, including breakdowns by age, gender, race, and ethnicity. Table 1 presents totals by state.[6]
FIGURE 1: Number of Americans Estimated to be Receiving Expanded Preventive Services Coverage Under the Affordable Care Act (in Millions)[7]
| State | Total | Children | Women | Men |
| Alabama | 819,000 | 205,000 | 319,000 | 294,000 |
| Alaska | 121,000 | 33,000 | 44,000 | 44,000 |
| Arizona | 1,056,000 | 282,000 | 389,000 | 385,000 |
| Arkansas | 439,000 | 110,000 | 170,000 | 159,000 |
| California | 6,181,000 | 1,638,000 | 2,286,000 | 2,257,000 |
| Colorado | 973,000 | 259,000 | 362,000 | 352,000 |
| Connecticut | 710,000 | 188,000 | 270,000 | 252,000 |
| Delaware | 163,000 | 43,000 | 61,000 | 58,000 |
| District of Columbia | 107,000 | 17,000 | 47,000 | 42,000 |
| Florida | 2,841,000 | 710,000 | 1,104,000 | 1,027,000 |
| Georgia | 1,713,000 | 465,000 | 654,000 | 593,000 |
| Hawaii | 240,000 | 59,000 | 90,000 | 91,000 |
| Idaho | 283,000 | 86,000 | 100,000 | 97,000 |
| Illinois | 2,390,000 | 605,000 | 898,000 | 887,000 |
| Indiana | 1,160,000 | 314,000 | 421,000 | 425,000 |
| Iowa | 611,000 | 158,000 | 225,000 | 228,000 |
| Kansas | 529,000 | 141,000 | 198,000 | 191,000 |
| Kentucky | 732,000 | 184,000 | 274,000 | 273,000 |
| Louisiana | 719,000 | 193,000 | 275,000 | 251,000 |
| Maine | 226,000 | 53,000 | 91,000 | 82,000 |
| Maryland | 1,153,000 | 297,000 | 448,000 | 408,000 |
| Massachusetts | 1,324,000 | 327,000 | 517,000 | 480,000 |
| Michigan | 1,849,000 | 498,000 | 692,000 | 658,000 |
| Minnesota | 1,056,000 | 281,000 | 392,000 | 383,000 |
| Mississippi | 430,000 | 111,000 | 167,000 | 152,000 |
| Missouri | 1,102,000 | 292,000 | 408,000 | 401,000 |
| Montana | 166,000 | 41,000 | 62,000 | 63,000 |
| Nebraska | 359,000 | 96,000 | 134,000 | 129,000 |
| Nevada | 477,000 | 133,000 | 171,000 | 173,000 |
| New Hampshire | 279,000 | 70,000 | 107,000 | 102,000 |
| New Jersey | 1,694,000 | 449,000 | 628,000 | 617,000 |
| New Mexico | 285,000 | 75,000 | 111,000 | 100,000 |
| New York | 3,342,000 | 824,000 | 1,322,000 | 1,196,000 |
| North Carolina | 1,564,000 | 403,000 | 600,000 | 561,000 |
| North Dakota | 130,000 | 33,000 | 49,000 | 48,000 |
| Ohio | 2,138,000 | 559,000 | 797,000 | 782,000 |
| Oklahoma | 616,000 | 160,000 | 236,000 | 220,000 |
| Oregon | 692,000 | 171,000 | 273,000 | 248,000 |
| Pennsylvania | 2,363,000 | 580,000 | 915,000 | 869,000 |
| Rhode Island | 195,000 | 46,000 | 76,000 | 72,000 |
| South Carolina | 755,000 | 201,000 | 296,000 | 258,000 |
| South Dakota | 151,000 | 41,000 | 56,000 | 54,000 |
| Tennessee | 1,044,000 | 263,000 | 401,000 | 380,000 |
| Texas | 3,836,000 | 1,049,000 | 1,421,000 | 1,366,000 |
| Utah | 605,000 | 207,000 | 199,000 | 198,000 |
| Vermont | 115,000 | 24,000 | 47,000 | 44,000 |
| Virginia | 1,519,000 | 410,000 | 576,000 | 533,000 |
| Washington | 1,239,000 | 293,000 | 483,000 | 463,000 |
| West Virginia | 300,000 | 75,000 | 113,000 | 112,000 |
| Wisconsin | 1,111,000 | 295,000 | 413,000 | 403,000 |
| Wyoming | 102,000 | 28,000 | 36,000 | 38,000 |
| TOTAL | 54,004,000 | 14,075,000 | 20,424,000 | 19,499,000 |
Endnotes
[1] Preventive Regulations. U.S. Departments of Treasury; Labor; and Health and Human Services.
[2] Recommended Preventive Services. U.S. Department of Health and Human Services, 2011. Accessed at: (http://www.healthcare.gov/law/resources/regulations/prevention/recommendations.html)
[3] Kaiser Family Foundation Health Research and Education Trust. Employer Health Benefits: 2011 Summary of Findings. Exhibit 13.6 shows that 31% of workers were in plans where the services considered preventive changed because of the ACA. The same analysis shows that 23% of works were in plans where cost sharing changed for preventive services because of the ACA. We made the conservative assumption that these two groups overlapped completely, meaning that 31% experienced expanded coverage and/or reduced cost-sharing, though in fact if some people in the second group were not in the first, the overall percentage affected could have been even higher than 31% and as high as 54% (31% + 23%).
[4] DeNavas-Walt C, Proctor BD, Smith JC. Census Bureau, Current Population Reports, P60-239, Income, Poverty, and Health Insurance Coverage in the United States: 2010, Government Printing Office, Washington, DC, 2011. [PDF format]
[5] We included people with non-group plans in this calculation, since non-group coverage tends to be less generous than employer-provided insurance, suggesting that at least 31% of people in the non-group market likely experienced expanded coverage for preventive services due to this provision.
[6] Data come from the Census Bureaus Current Population Survey, for the years 2009-2011. We use three pooled years to allow for state-level estimates. We analyzed the proportion of all non-elderly individuals (0-64 years old) with private insurance in each category and state listed in Figure 1 and Table 1, and scaled the survey-weighted percentages to total 54 million individuals in aggregate, to match the projected number of people affected by this policy. Note that this overall approach is only a rough approximation and does not reflect any potential uneven distribution of individuals by age, race/ethnicity, or state of residence in private plans affected by the preventive coverage provisions of the Affordable Care Act.
[7] The Census Bureau records race and ethnicity separately, which means that totals combining racial and ethnic groups sum to more than 100%.