
Comparing Insulin Prices in the U.S. to Other Countries
The Office of the Assistant Secretary for Planning and Evaluation (ASPE) requested that RAND Health Care compare U.S. insulin prices to those paid internationally by Organisation for Economic Co-operation and Development (OECD) countries for which we have prescription drug data.
RAND found that the average gross manufacturer price for a standard unit of insulin in 2018 was more than ten times the price in a sample of 32 foreign countries:
- $98.70 in the U.S.
- $8.81 in the 32 non-U.S. OECD countries for which we have prescription drug data
These estimates compare the U.S. insulin market basket with the insulin market basket used in other OECD countries, and thus include the effects of both U.S. use of more expensive kinds of insulin (for example, analog versus human) and higher U.S. prices for the same insulins.
When RAND adjusted the mix of insulin used in the 32 non-US OECD countries to that used in the U.S., a large price differential was still apparent. In this analysis, U.S. average gross manufacturer prices ranged from 3.8 times those in Chile to 27.7 times those in Turkey and were 8.1 times prices paid in all non-U.S. OECD countries combined.
While the ratio of U.S. to other-country prices varied depending on the country and the insulin category, U.S. prices were always higher and often between 5 and 10 times higher than those elsewhere. U.S. prices were relatively higher for analog versus human insulins in nearly all comparison countries. U.S. prices were even higher when the comparison used active ingredient rather than presentation-level data, suggesting that the United States both has higher prices at the presentation level and uses a more expensive mix of insulin presentations.
These differences might be lower if data on price concessions were available to enable comparisons of net prices. Estimates of price concessions suggest that if we adjust U.S. gross prices downward by 50 percent, to account for the estimated impact of insulin price concessions, and make no such adjustment for insulin price concessions in other OECD countries, U.S. net prices for the U.S. insulin market basket remain more than four times the prices for the same mix of drugs in other OECD countries.
The overlap between the presentations of insulin sold in the United States and comparison countries was generally high, although there were differences in market shares across categories of insulin. Given the presentation-level price index approach, the results likely highlight differences in prices rather than differences in the mix of insulins sold in the United States versus other countries.
Prescription Drug Spending Continues to Increase in the United States
The Office of the Actuary within the Centers for Medicare and Medicaid Services (CMS) estimates that in 2019, $360.3 billion will be spent on retail prescription drugs (net of rebates), rising from $265.2 billion in 2013. This increase has prompted many to discuss how to address this growing challenge. To inform this discussion, ASPE has conducted research into the magnitude of the recent rise in prescription drug spending, the relative importance of various factors that underlie it, and the contribution of drug spending to the overall rise in health care spending in recent years.
The drug market has many players that comprise the supply chain: manufacturers; pharmacies; physicians; private and public insurers; and ultimately patients (see Figure 1). Within federal programs, trends in prescription drug utilization and spending vary across the Medicare Part B, Medicare Part D, and Medicaid programs. Differences in utilization and spending reflect underlying variation in eligibility for each program, including age, disability, income, and medical need. The Medicare Program provides health insurance coverage for individuals aged 65 years and older as well as certain younger individuals with disabilities or with End-Stage Renal Disease. The Medicaid program is a joint Federal-State program that provides coverage for disabled individuals and individuals and families with low incomes; some individuals with incomes above these limits may also qualify due to high medical expenses.
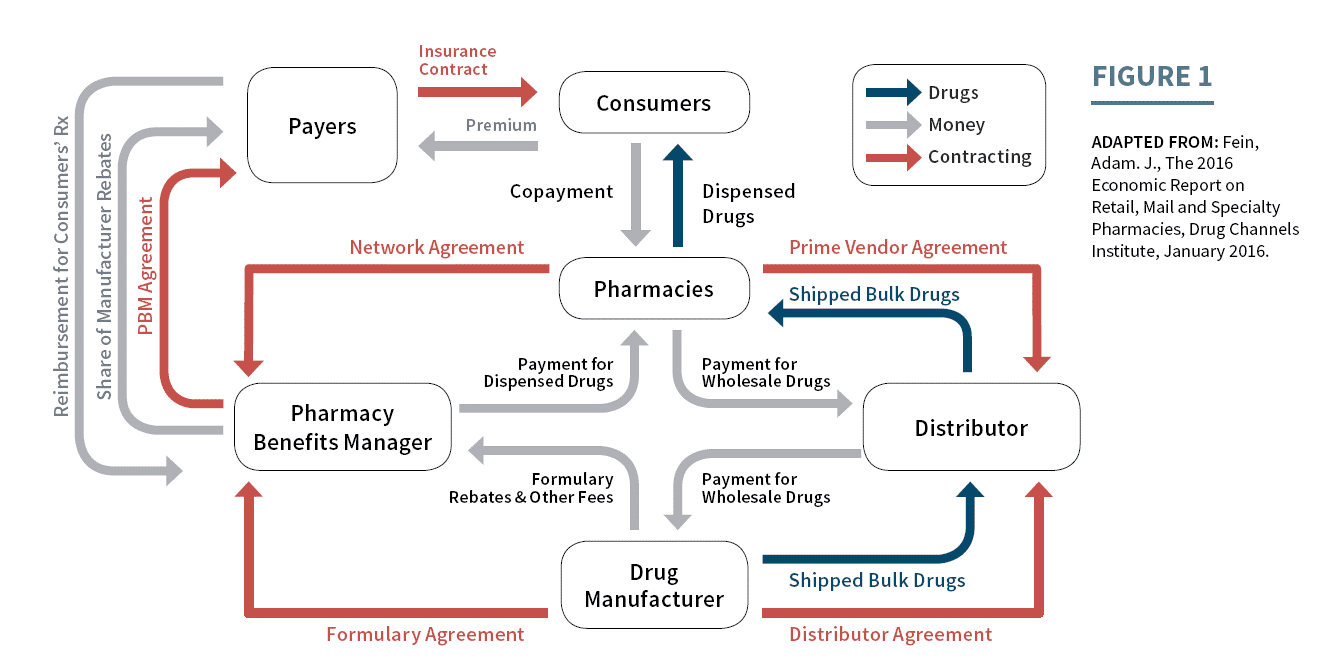
Figure 1 illustrates the flow of goods, services, and money between members of the pharmaceutical supply chain. View larger version of this flowchart.