
David Stevenson, Nicholas Sinclair, and Shiyuan Zhang
Vanderbilt School of Medicine
Laurie Meneades and Haiden Huskamp
Harvard Medical School
November 16, 2018
Printer Friendly Version in PDF Format (43 PDF pages)
ABSTRACT
Between 2005 and 2015, the number of hospice agencies with common ownership to nursing homes nearly quintupled in number and now represents almost 1-in-5 hospice agencies participating in the Medicare program. Using data from 2005-2015, the report describes: (1) trends in nursing home-hospice contracting relationships and in common ownership between hospice agencies and nursing homes; (2) geographic dimensions of nursing home-hospice contracting; and (3) hospice use trends in nursing homes with and without common ownership.
DISCLAIMER: The opinions and views expressed in this report are those of the authors. They do not necessarily reflect the views of the Department of Health and Human Services, the contractor or any other funding organization.
TABLE OF CONTENTS
- Data Sources
- Chain Coding
- Analyses
- Limitations
- Section I: Hospice Agencies
- Section II: Nursing Homes
- Section III: Service Use Characteristics
LIST OF EXHIBITS
- EXHIBIT 1.1: Percent of Hospice Agencies with Common Ownership to a Nursing Home by Hospice Profit and Chain Status, 2005-2015
- EXHIBIT 1.2: Percent of Medicare Hospice Enrollees Served by a Hospice with Common Ownership to a Nursing Home by Profit and Chain Status, 2005-2015
- EXHIBIT 1.3: Percent of Hospice Agencies with Common Ownership to a Nursing Home by State, 2015
- EXHIBIT 2.1: Percent of Nursing Homes with Common Ownership to a Hospice Agency by Nursing Home and Chain Status, 2005-2015
- EXHIBIT 2.2: Percent of Nursing Home Residents Living in a Nursing Home with Common Ownership to a Hospice Agency by Nursing Home Profit and Chain Status, 2005-2015
- EXHIBIT 2.3: Percent of Nursing Homes with Common Ownership to a Hospice Agency by State, 2015
- EXHIBIT 3.1: Number of Hospice Agencies with which Nursing Homes Contract
- EXHIBIT 3.2a: Percent of Hospice Patients Served by a Nursing Home's Primary Hospice
- EXHIBIT 3.2b: Percent of Nursing Homes with >75% of Hospice Patients Served by the Primary Hospice
- EXHIBIT 3.3: HHI for Hospice within the Nursing Home
- EXHIBIT 3.4: Percent of Hospice Users in Nursing Homes with Common Ownership Being Served by the Commonly-Owned Hospice Agency, 2005-2015
- EXHIBIT 3.5: Percent of Nursing Home Decedents Who Died in Hospice Care, by Profit and Common Ownership Status, 2005-2015
- EXHIBIT 3.6: Hospice Service Use Outcomes by Nursing Home Profit and Common Ownership Status, 2005-2015
- EXHIBIT 3.7: Hospice Visit Outcomes by Nursing Home Profit and Common Ownership Status, 2005-2015
- EXHIBIT 3.8: Logistic Regression Results for Hospice Service Use and Visit Outcomes by Nursing Home Profit and Common Ownership Status, 2005-2015
- EXHIBIT 3.9: Linear Regression Results for Hospice Service Use and Visit Outcomes by Nursing Home Profit and Common Ownership Status, 2005-2015
KEY FINDINGS
-
The proportion of hospice agencies and nursing homes with common ownership grew substantially over the study period, as did the proportion of hospice enrollees and nursing home residents receiving care from these providers.
-
Rates of common ownership were highest among chain nursing homes and hospice agencies.
-
As nursing home-hospice use expanded over the last decade, the number of hospice agencies from which residents in particular facilities receive hospice increased.
-
Although these trends imply greater freedom of choice for Medicare beneficiaries, it is still the case that a large proportion of hospice users within individual facilities enroll at the hospice agency with which the nursing home appears to have a primary referral relationship.
-
The proportion of hospice enrollees using the commonly-owned hospice was somewhat higher among not-for-profit relative to for-profit nursing homes, potentially suggesting greater coordination of services between not-for-profit nursing homes and hospice agencies.
-
In unadjusted analyses, hospice patients in nursing homes with common ownership had higher rates of live discharge, longer lengths of stay, a higher proportion of stays greater than 90 days, and a lower proportion of stays less than or equal to three days.
-
After adjusting for geographic, provider, and patient-level factors, hospice patients receiving hospice care from a commonly-owned agency were more likely to have long hospice stays and registered nurse/licensed practical nurse visits at the end of life. At the same time, these individuals had a slightly lower proportion of days with any kind of hospice visit and fewer visit hours per day.
ACRONYMS
The following acronyms are mentioned in this report.
| ASPE | HHS Office of the Assistant Secretary for Planning and Evaluation |
|---|---|
| CASPER | Certification and Survey Provider Enhanced Reporting |
| CI | Confidence Interval |
| CMS | HHS Centers for Medicare & Medicaid Services |
| HHI | Herfindahl Hirschman Index |
| HHS | U.S. Department of Health and Human Services |
| IQR | Interquartile Range |
| LPN | Licensed Practical Nurse |
| MDS | Minimum Data Set |
| OR | Odds Ratio |
| OSCAR | Online Survey, Certification, and Reporting |
| PECOS | Provider Enrollment Chain Ownership System |
| RN | Registered Nurse |
| SNF | Skilled Nursing Facility |
| SW | Social Worker |
EXECUTIVE SUMMARY
Working together on this project, Vanderbilt and Harvard built upon earlier research for the U.S. Department of Health and Human Services, Office of the Assistant Secretary for Planning and Evaluation (Tracking the Impact of Ownership Changes in Hospice Care Provided to Medicare Beneficiaries) and used several datasets to illuminate key issues of interest. In particular, using data from 2005-2015, the report describes: (1) trends in nursing home-hospice contracting relationships and in common ownership between hospice agencies and nursing homes; (2) geographic dimensions of nursing home-hospice contracting; and (3) hospice use trends in nursing homes with and without common ownership.
Guiding these analyses was the objective to characterize trends in nursing home-hospice contracting and common ownership and to identify potential tradeoffs in the care provided by nursing homes and hospice agencies that share common ownership.
Between 2005 and 2015, the number of hospice agencies with common ownership to nursing homes nearly quintupled in number and now represents almost one-in-five hospice agencies participating in the Medicare program. The proportion of nursing homes with common ownership to hospice agencies increased similarly over our study period, from 5% to 20% of all nursing homes (and nursing home residents) between 2005 and 2015. Not surprisingly, most nursing homes and hospice agencies that shared common ownership were part of larger chain organizations. Although select geographic areas had higher proportions of common ownership among hospice agencies and nursing homes, few clear geographic trends emerged.
As nursing home-hospice use expanded, the number of hospice agencies across which residents in particular facilities receive hospice increased. Nonetheless, a large proportion of hospice users within most individual facilities enroll at the hospice agency with which the nursing home appears to have a primary referral relationship (67% in 2015, on average). Among nursing homes with common ownership to a hospice agency, the proportion of hospice enrollees using the commonly-owned hospice was similar to this level, at 65% in 2015.
After adjusting for geographic, provider, and patient-level factors, we identified several differences in hospice service use between individuals using hospice in nursing homes without common ownership relative to nursing home-hospice users in facilities with common ownership. Residents of commonly-owned facilities who use the commonly-owned hospice are more likely to have long hospice stays (i.e., both stays of >90 days and very long stays of >180 days) than residents of facilities without common ownership. Perhaps more interesting is the fact that residents of commonly-owned facilities who use the commonly-owned hospice are more likely to have longer hospice stays than those in commonly-owned facilities who use an externally-owned hospice. We also find that residents who use commonly-owned hospices have a lower intensity of hospice visit use overall (i.e., the percentage of hospice days with any visits and the average visit hours per day are lower) relative both to residents of non-commonly-owned facilities and residents of commonly-owned facilities who use an externally-owned hospice. Residents of commonly-owned nursing homes (regardless of whether they use the commonly-owned hospice or not) are more likely to receive at least one registered nurse or licensed practical nurse hospice visit in the last three days of life relative to residents of non-commonly-owned facilities.
The differences we observe in hospice length of stay and services delivered among residents of commonly-owned facilities who use the commonly-owned hospice versus an externally-owned hospice might reflect distinct care patterns that are facilitated (and/or incented) by common ownership itself. It is possible that commonly-owned organizations have closer coordination between the nursing home and hospice, which could lead to earlier hospice enrollment (and thus longer stays). It is also possible that commonly-owned organizations deploy nursing facility resources differently for enrollees of their commonly-owned hospice versus enrollees of externally-owned hospices. For example, for a commonly-owned hospice enrollee, nursing home staff could provide more of the nursing or custodial care than for an externally-owned hospice, but we are unable to observe service provision by nursing home staff with our data. Importantly, claims data alone do not allow us to determine whether the different hospice utilization patterns we observe for residents who use commonly-owned hospices (particularly relative to residents of commonly-owned nursing homes who do not use the commonly-owned hospice) result in improvements or decrements in quality of care.
Common ownership between hospice agencies and nursing homes is an emerging trend that reflects a broader push toward consolidation in the health care sector. The analyses presented above are a first step toward improving our understanding of these trends and their implications. Going forward, policymakers and other stakeholders must continue studying these dimensions and the mechanisms that will shape them and the care that nursing home-hospice enrollees receive.
INTRODUCTION
The hospice provider market has changed markedly over the past 30 years, transitioning from a relatively small base of stand-alone, locally-run, not-for-profit agencies to a larger market where the majority of agencies, some with a national presence, are run on a for-profit basis. There has been limited research on trends in nursing home-hospice partnerships, and none on the extent of nursing home-hospice common ownership. Given the substantial growth in nursing home-hospice use, it is important that policymakers consider how the business decisions may be affecting patient care.1, 2
Working together, Vanderbilt and Harvard have previously examined ownership trends in the hospice and nursing home sectors, including their implications for beneficiaries' care. Our expertise in the complexities of each of these sectors helps us illuminate how nursing homes and hospice agencies work together and the potential tradeoffs related to their joint ownership. This project builds directly on the recent U.S. Department of Health and Human Services (HHS), Office of the Assistant Secretary for Planning and Evaluation (ASPE) project, Tracking the Impact of Ownership Changes in Hospice Care Provided to Medicare Beneficiaries.
In our prior ASPE project and related research,3, 4, 5, 6 we argued that the simple distinction of for-profit/not-for-profit is overly broad and that it is important to explore issues such as the extent to which regional or national chains have entered the hospice provider market and the manner in which for-profit hospice growth has occurred. In particular, we observed substantial heterogeneity within hospice profit status, highlighting the need to consider factors such as agency size and chain affiliation to understand factors that might shape Medicare beneficiaries' hospice care. Although not a primary focus of the previous study, our findings documented the rise in nursing home-hospice use and highlighted the importance of considering the role of nursing home-hospice contracting and of common ownership between hospices and nursing homes.
Since completion of the prior ASPE-funded project, the Vanderbilt and Harvard teams have continued their work to explore hospice ownership and common ownership across sectors. This research, using Medicare Cost Reports, Provider Enrollment Chain Ownership System (PECOS) data, and Provider of Service files, has been descriptive in nature (e.g., resulting in a paper describing common ownership across the inpatient, hospice, and post-acute care sectors).7 This project builds and expands upon our prior work. As detailed below, we used several datasets to illuminate key issues of interest. Using data from 2005-2015, we seek to describe: (1) trends in nursing home-hospice contracting relationships and in common ownership between hospice agencies and nursing homes; (2) geographic dimensions of nursing home-hospice contracting; and (3) hospice use trends in nursing homes with and without common ownership.
Below is a description of the available data sources, methods (including how we identify instances of common ownership and characterize nursing home-hospice contracting over time), selected outcome measures, and potential limitations of these data sources and the methodology used.
Data Sources
To describe trends in nursing home-hospice contracting and the effect of these changes on beneficiary outcomes, we used data from multiple sources over the 2005-2015 time period. These data included the PECOS data, Medicare Cost Reports, Medicare claims data and the Minimum Data Set (MDS), and Online Survey, Certification, and Reporting (OSCAR)/Certification and Survey Provider Enhanced Reporting (CASPER) data.
Provider Enrollment Chain Ownership System
PECOS data were essential for this project, allowing us to build on previous hospice ownership coding efforts to identify instances of common investment. PECOS, the HHS Centers for Medicare & Medicaid Services system used to enroll physicians and eligible provider entities into the Medicare program, collects information on all individual and institutional investors having a 5% or more ownership stake in each individual provider that serves Medicare beneficiaries. In particular, PECOS data can be used to identify instances of common ownership between hospice agencies and nursing homes, as individual and organizational owners with ownership stakes of 5% or higher are listed. In contrast to ownership data available from other sources, PECOS includes unique numeric identifiers for each investor, which allows investors to be tracked across sectors.
All Medicare providers must be registered with the PECOS online system and submit current enrollment information to participate in Medicare. Though PECOS was launched in 2003, the system did not initially capture the universe of Medicare-enrolled providers. Our proposed study period spans 11 years from 2005 to 2015, as we believe that by 2005 the majority of providers that were enrolled in Medicare prior to PECOS would have had to revalidate information and interact with PECOS. To validate this start date, we examined data from the CMS OSCAR system for skilled nursing facilities (SNFs), and from Medicare Cost Reports for hospice agencies. In our preliminary analyses, we found that 2005 was the earliest year in which over 90% of entities in each sector matched across PECOS and these sources. For the purpose of this project, we used PECOS data for hospice and SNF care from March 2016, which includes historical data to the extent it was completed.
Medicare Cost Reports
Medicare Cost Reports previously formed the basis for our coding of hospice ownership. For the purpose of these analyses, we extended this ownership coding up to 2015. All Medicare-certified hospice agencies must submit cost reports on a yearly basis to CMS, and these data are all publicly available. Medicare Cost Reports provide hospice agency name, parent organization, geographic location, and number of Medicare hospice enrollees, in addition to more detailed financial information. Although cost reports data include variables that specify the parent organization and whether an agency is a part of a chain, we have found them to be unreliable. For this reason, coding of hospice chains is an iterative process that includes linking organizations using parent organization/chain information from other cost report variables including the name and address of the hospice agency. In addition to freestanding agencies, we captured ownership information for hospice agencies listed as sub-providers in cost reports for hospitals, home health agencies, and SNFs. We coded each hospice agency as for-profit, not-for-profit, or government-owned and as non-chain or chain (i.e., part of a company owning more than one agency). For chain-owned agencies, we coded the individual chains to which they belong to track their role over time. We used Medicare Cost Reports for 2005-2015.
Medicare Claims
From the Medicare claims data, we utilized the Master Beneficiary Summary File, Medicare Hospice claims, and the MDS. The Master Beneficiary Summary file was used to obtain hospice enrollee characteristics, including age, sex, race, and date of death. Medicare Hospice claims were used to obtain dates of service use, geographic region, patient's terminal diagnosis, and payment category for each day in hospice. Medicare Hospice claims were also used to determine the hospice length of use, percent of very short stays (3 days), percent of very long stays (>180 days), and the percent of stays with live discharges. We also used hospice claims data to analyze several visit outcomes, including the percent of enrolled days with any visit and with any registered nurse or licensed practical nurse (RN/LPN) visit; the average visit hours per day and the average RN/LPN visit hours per day; and visits by staffing discipline at the very end of life for decedents. Visit analyses were based on routine home care days only. Finally, in combination with claims data, we used the MDS and the location code on the hospice claims to identify overlap between hospice use and nursing home residence. Medicare beneficiaries under 65 years of age were excluded from our analyses, regardless of hospice use.
Online Survey, Certification, and Reporting/Certification and Survey Provider Enhanced Reporting
OSCAR/CASPER contains survey and certification data for all Medicaid-certified and Medicare-certified facilities in the United States (96% of all facilities). For this project, we used these data primarily to characterize the nursing homes that do and do not have common ownership along selected variables of interest. Collected and maintained by the CMS, OSCAR/CASPER data include information about whether homes are in compliance with federal regulatory requirements. Following an initial survey, states are required to survey each facility no less often than every 15 months, and the average is about 12 months. Nursing homes submit facility, resident, and staffing information. Deficiencies are entered into OSCAR by survey agencies when facilities are found to be out of compliance with federal regulatory standards. OSCAR data have several important limitations that should be noted, including a lack of explicit auditing procedures of facility-reported information, potential variation across states and over time, and possible under-reporting of serious quality problems.
Chain Coding
For hospice agencies, the Medicare Cost Reports were used as the primary dataset for coding hospice ownership and chain affiliation; however, the PECOS file and other information (e.g., provider websites) were used to supplement and cross-reference data found in the cost reports. Our coding strategy was based on that used by Stevenson, et al in their 2015 Health Affairs analysis.8 For nursing homes, chain affiliation was based on information in the OSCAR/CASPER database that is pulled from CMS Form 671 in the text field "Name of Multi-Facility Organization" building on methods previously described.9, 10
Analyses
The bulk of our analyses focused on common investor linkages between hospice agencies and nursing homes from 2005 to 2015. To construct these linkages, we used PECOS information from April 2016 and created a database of nursing homes and hospice agencies that were in operation at any point during our study period. In coding common ownership, we followed the general approach outlined in a recent Health Affairs paper that examined common ownership between hospitals and post-acute and hospice settings.7
We obtained the location of each provider from PECOS and our other datasets (e.g., OSCAR/CASPER and Cost Reports). For most analyses, we focused on nursing homes and hospice agencies operating within the same state. Although nursing home markets are focused around specific locations, the state is a more appropriate parameter for hospice agencies, as they tend to have broad catchment areas and lack specific bricks-and-mortar locations. In addition, hospice companies appear to use different approaches to their location of agency administrative offices, with some of the largest companies having few agencies that serve entire states.
To construct common investor linkages between nursing homes and hospice agencies, we identified the largest health company investor associated with each provider in each year. Because we cannot obtain the actual ownership stake each investor held in each provider, we used the number of providers with which an investor was associated in each year as a proxy for investor size. We focused on health company investors, which included entities such as delivery systems, hospitals, and post-acute care and hospice companies, because we believe these types of investors would be most likely to exert managerial or operational control over the facilities and agencies in our study.
Using the strategy described above, we examined trends in the percentage of nursing homes and hospice agencies, respectively, with common ownership during the study period. We described how common ownership has evolved over the study period, including its prevalence among hospice agencies and nursing homes and whether it is concentrated in certain parts of the country. We will also describe the major companies that are strategically focusing across the hospice and nursing facility sectors.
To provide context for our analyses of common ownership, we also investigated nursing home-hospice contracting generally. In particular, we examined trends in the number of hospice agencies that nursing homes work with and the percent of hospice users being served by the primary hospice agency for each facility (i.e., the hospice agency at which the greatest percentage of residents is being served). Analyses also explored the concentration of nursing home-hospice patients using a Herfindahl Hirschman Index (HHI).
Finally, using claims data, our analyses also investigated the implications of common ownership for nursing home-hospice users, not only in terms of hospice enrollment but in terms of hospice service use patterns. Comparing hospice use among nursing homes with and without common ownership, we examined several measures of interest, including:
At the nursing home level:
-
The likelihood that the commonly-owned hospice is the dominant hospice agency used by a nursing home's enrollees.
-
Percent of hospice users at a nursing home enrolled in the dominant hospice.
-
Hospice enrollment among decedents.
Among hospice enrollees:
-
Hospice length of stay.
-
Percent of enrollees with very short stays (3 days).
-
Percent of enrollees with very long stays (>90 days and >180 days).
-
Percent of stays with live discharges.
-
Percent of days with any hospice visit and any RN/LPN hospice visit.
-
Percent of decedents with RN/LPN and other visits at the very end of life.
Many of these analyses were descriptive. We stratified our presentation of results by common ownership and profit status to explore potential differences in the implications of common ownership status by profit type. Still, we cannot assume that nursing homes with common ownership are similar to nursing homes without common ownership on dimensions that might impact our outcomes of interest. To address this consideration, we take advantage of the longitudinal nature of our data and the fact that many nursing homes will transition in their joint ownership status over the study period (most typically from not having a commonly-owned hospice to having one). In particular, we incorporated pre-transition and post-transition terms into regression models to estimate the impact of joint ownership on outcomes of interest.
We used logistic regression for dichotomous (yes/no) outcomes of interest, including having a hospice stay of 3 days, having a hospice stay resulting in live discharge, having a stay of >90 and >180 days, and having any hospice visit in the last two days of life. We use ordinary least squares regression models for continuous outcomes of interest, including mean length of use and the percent of days with any visit. The regression models included variables for age, sex, race, hospice diagnosis (cancer, dementia, debility, congestive heart failure, failure to thrive, chronic obstructive pulmonary disease, cerebrovascular disease, heart disease, renal failure, or other), rural location, health maintenance organization enrollee, hospice ownership, nursing home ownership, region, and year.
Guiding these analyses was the objective to identify potential tradeoffs in the care provided by nursing homes and hospice agencies having common ownership. In particular, common ownership and closer working relationships between hospice agencies and nursing homes could result in closer coordination of nursing home and hospice care, more aggressive referrals and use of hospice among potentially eligible enrollees, or both. By focusing on hospice outcomes with potential implications for quality, we sought to distinguish between these effects to the extent possible.
More specifically: Hospice length of stay and the percent of enrollees with very long stays were selected to offer a rough indication of agencies enrolling patients in hospice earlier in their advanced illness trajectories. In contrast, the percent of enrollees with very short hospice stays was selected to be indicative of very late hospice enrollment, potentially reflecting inadequate attention to the imminence of end-of-life needs. For these outcomes and others, it is important to note that we are unable to discern the appropriateness or quality of care practices underlying the differences. The rate of live discharge was selected to convey the extent to which individuals disenroll from hospice before death, high rates of which could indicate problems in assessing eligibility and delivering high-quality, coordinated care. The percent of days on which hospice patients receive any hospice visit and any RN/LPN hospice visit were selected to convey the extent to which patients were seen by hospice staff. If commonly-owned hospices and nursing homes share care delivery responsibilities to a greater extent than those without common ownership, one might expect fewer visits overall among patients served in facilities with common ownership. Finally, the percent of decedents with visits in the last days of life was selected to convey a level of communication between the nursing home and the hospice agencies, which one might expect or hope to be higher in instances of common ownership.
Limitations
There are several potential limitations with this research project. First, although almost all Medicare-eligible providers are listed in PECOS throughout our study period, the investor information likely became more complete and reliable in later years. Second, our common investor linkages are binary, with no measure of the strength or significance of a relationship beyond it being at least a 5% ownership. Third, corporate investors and their subsidiaries appear as separate entities in PECOS, and we excluded individual investors (that is, people as opposed to companies). As a result, our linkages likely represent a lower bound of common investor ownership across sectors. In terms of our hospice outcomes of interest, although we have chosen these service use variables with quality of care in mind, we are limited in our ability to draw conclusions about hospice quality using administrative data alone, especially as these outcomes might relate to potential tradeoffs of common ownership. Finally, although hospice claims data provide detailed information about services delivered by hospice agencies, we are unable to observe services delivered by nursing homes.
RESULTS
Section I: Hospice Agencies
Exhibit 1.1: Hospice Agencies with Common Ownership by Ownership Type
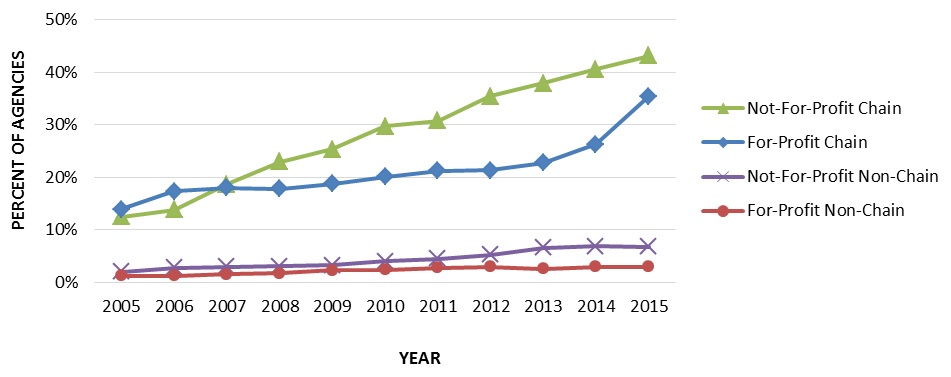
To convey how common ownership of hospice agencies and nursing homes has changed over time, Exhibit 1.1 displays the percentage of hospice agencies with common ownership to a nursing home by chain status and profit status.
Highlights:
-
The number of Medicare-certified hospice agencies commonly-owned with a nursing home grew substantially over the study period.
-
The number of hospice agencies with common ownership to a nursing home especially increased among for-profit and not-for-profit chain hospice agencies.
-
Rates of common ownership were similar among for-profit and not-for-profit non-chain hospice agencies.
| EXHIBIT 1.1. Percent of Hospice Agencies with Common Ownership to a Nursing Home by Hospice Profit and Chain Status, 2005-2015 |
|---|
 |
| SOURCE: Authors' coding and analyses of 2005-2015 Medicare Cost Reports, PECOS, and CASPER data. |
During the study period (2005-2015), the number of Medicare-certified hospice agencies commonly-owned with a nursing home grew substantially. In 2005, 160 of the 2,551 hospice agencies (13.6%) were commonly-owned. By 2015, the number of commonly-owned hospice agencies had increased to 716 of 3,771 (19.0%). This trend was driven mostly by common ownership among hospice chains. The number of commonly-owned chain hospice agencies increased from 132 agencies in 2005 (13.6% of chains) to 617 agencies in 2015 (37.4% of chains). Rates of nursing home common ownership among non-chain agencies were low, totaling 28 agencies in 2005 (1.8% of non-chains) and 99 agencies in 2015 (4.7% of non-chains).
Although small in number, not-for-profit hospice chain agencies had the highest rates of common ownership with a nursing home throughout most of the study period, followed by for-profit chain agencies. In 2005, 36 of the 288 not-for-profit chain agencies (12.5%) and 92 of the 663 for-profit chain agencies (13.9%) were commonly-owned. These rates increased through 2015, where 162 of the 375 not-for-profit chain agencies (43.2%) and 448 of the 1,265 for-profit chain agencies (35.4%) were commonly-owned. Rates among not-for-profit and for-profit non-chain agencies were significantly lower. In 2005, 17 of the 854 not-for-profit non-chains (2.0%) and 6 of the 513 for-profit non-chains (1.2%) were commonly-owned. These rates grew only slightly over the study period. In 2015, 53 of the 793 not-for-profit non-chain agencies (6.7%) and 34 of the 1,168 for-profit non-chain agencies (2.9%) were commonly-owned.
Exhibit 1.2: Hospice Enrollees Receiving Care from Hospice Agencies with Common Ownership by Ownership Type
To illustrate the growing role of hospice agencies with common ownership to nursing homes among Medicare hospice enrollees, Exhibit 1.2 displays the percentage of hospice enrollees receiving care from a hospice agency with common ownership to a nursing home by chain status and profit status.
Highlights:
-
The percent of hospice enrollees receiving care from an agency with common ownership to a nursing home increased over the study period.
-
Chain operated hospice agencies were the main source of growth among patients being served by commonly-owned hospice agencies.
-
The proportion of patients being served by an agency with common ownership were similar among for-profit and not-for-profit non-chains.
| EXHIBIT 1.2. Percent of Medicare Hospice Enrollees Served by a Hospice with Common Ownership to a Nursing Home by Profit and Chain Status, 2005-2015 |
|---|
 |
| SOURCE: Authors' coding and analyses of 2005-2015 Medicare Cost Reports, PECOS, and CASPER data. |
The percent of hospice enrollees receiving care from an agency with common ownership to a nursing home increased over the study period. In 2005, 39,715 of the 645,949 patients receiving hospice (6.1%) were served by an agency with common ownership. In 2015, 214,314 of the 1,066,914 patients receiving hospice care (20.1%) were served by a commonly-owned hospice agency, a more than three-fold increase. Chain operated hospice agencies were the main source of growth among patients being served by commonly-owned hospice agencies, increasing from 31,786 patients in common ownership in 2005 (11.4%) to 180,920 patients in 2015 (34.2%). In contrast, non-chains served a much lower number of patients in common ownership, ranging from 7,929 patients in 2005 (2.2%) to 33,394 patients in 2015 (6.2%).
The percent of hospice enrollees receiving care from an agency with common ownership to a nursing home was highest among patients receiving care in not-for-profit and for-profit chain agencies. In 2005, 7,455 of the 95,923 patients served by not-for-profit chains (7.8%) were served by commonly-owned agencies, with 22,411 of the 178,970 patients served by for-profit chain agencies (12.5%) with common ownership. By 2015, 64,176 of the 177,949 patients served by not-for-profit chains (36.1%) were served by commonly-owned agencies, and 115,652 of the 349,032 patients served by for-profit chains (33.1%) were served by commonly-owned agencies. Rates of common ownership among patients receiving care at non-chain agencies were much lower. In 2005, 6,863 of the 263,073 patients receiving care from not-for-profit non-chains (2.6%) were served by commonly-owned agencies, and 836 of the 84,557 patients served by for-profit non-chains (1.0%) were served by commonly-owned agencies. By 2015, these numbers increased only slightly -- to 21,508 of the 362,315 among patients in not-for-profit non-chains (5.9%) and 9,274 of the 156,787 among patients in for-profit non-chains (5.9%).
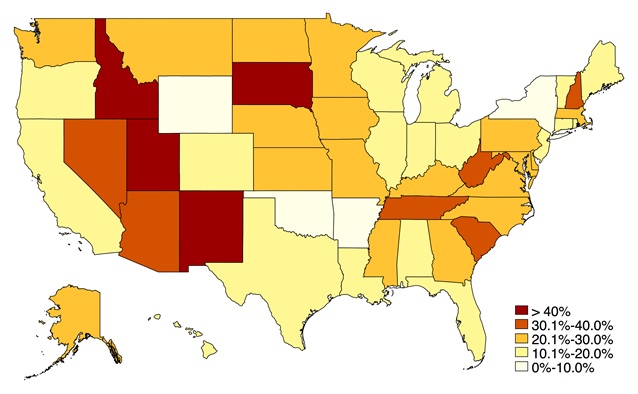
Exhibit 1.3: Geographic Dimensions of Common Ownership
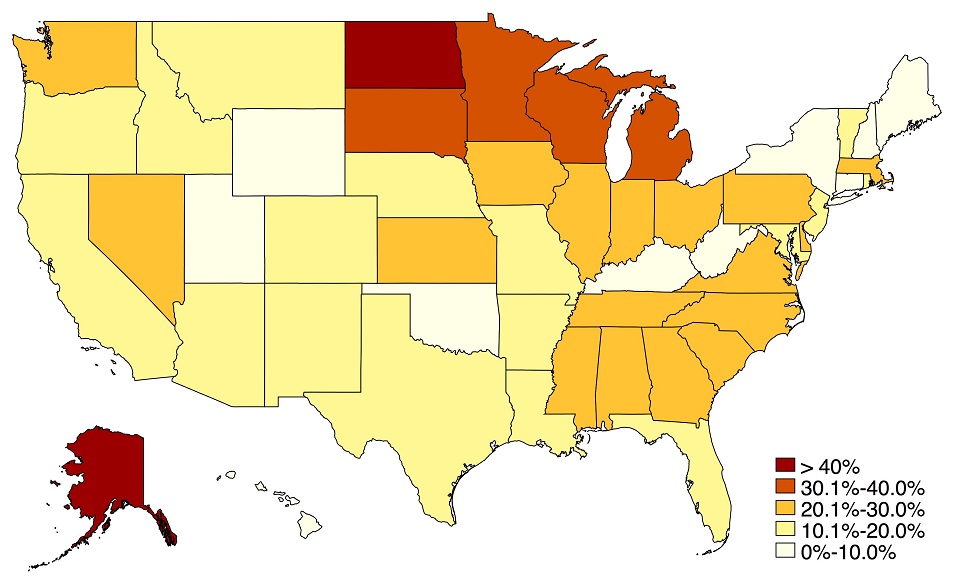
To examine geographic variation in common ownership, Exhibit 1.3 is a map that shows the state-level differences in the percent of hospice agencies with common ownership to a nursing home in 2015.
Highlights:
-
The greatest concentration of hospice agencies with common ownership to nursing homes was in the Northern Plains, Southeast, and Midwest.
-
Common ownership in the Western and Southwestern states was generally lower, as it was in many Northeastern states.
| EXHIBIT 1.3. Percent of Hospice Agencies with Common Ownership to a Nursing Home by State, 2015 |
|---|
 |
| SOURCE: Authors' coding and analyses of 2015 Medicare Cost Reports, PECOS, and CASPER data. |
At the state-level, the average rate of common ownership among hospice agencies in 2015 was 19.6%, ranging from a high of 75.0% in Alaska to a low of 0.0% in Washington, D.C., Hawaii, and Wyoming. Having common ownership with a nursing home was highest among hospice agencies in the Northern Plains states and also in the Southeast and Midwest. Common ownership in the Western and Southwestern states was generally lower, as it was in many Northeastern states.
Section II: Nursing Homes
Exhibit 2.1: Nursing Homes with Common Ownership by Ownership Type
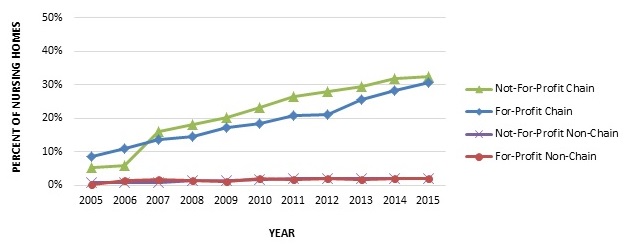
To convey how common ownership of hospice agencies and nursing homes has changed over time, Exhibit 2.1 displays the percentage of nursing homes with common ownership to a hospice agency by chain status and profit status.
Highlights:
-
The percentage of nursing homes commonly-owned with a hospice agency grew considerably over the study period.
-
Nursing home chains were the primary driver of the increased rates of common ownership.
-
The proportion of not-for-profit and for-profit nursing home chains with common ownership to a hospice agency increased steadily, and similarly throughout the study period.
| EXHIBIT 2.1. Percent of Nursing Homes with Common Ownership to a Hospice Agency by Nursing Home and Chain Status, 2005-2015 |
|---|
 |
| SOURCE: Authors' coding and analyses of 2015 Medicare Cost Reports, PECOS, and CASPER data. |
Trends of hospice common ownership among nursing homes mirrored the trends seen among hospice agencies. In 2005, 663 of the 14,047 nursing homes in operation (4.7%) had common ownership to a hospice agency. By 2015, the number of nursing homes with common ownership increased to 2,865 of 14,262 (20.1%), a 15.4 percentage point and more than four-fold increase. Nursing home chains were a large factor in the growth of common ownership. Of the 7,990 chain nursing homes operating in 2005, 634 (7.9%) had common ownership to a hospice agency. By 2015, 2,769 of the 9,122 (30.36%) chain operated nursing home facilities were commonly-owned, an increase of 22.5 percentage points. Relative to chain-owned facilities, rates of common ownership among non-chain nursing homes were quite low. In 2005, only 29 of the 6,057 non-chain nursing homes (0.5%) had common ownership to a hospice agency, increasing to 96 out of 5,140 nursing homes (1.9%) by 2015.
The proportion of not-for-profit and for-profit nursing home chains with common ownership to a hospice agency increased steadily, and similarly throughout the study period. In 2005, 85 of the 1,635 not-for-profit chain nursing homes (5.2%) and 548 of the 6,303 for-profit chain nursing homes (8.7%) had common ownership with a hospice agency. By 2015, these numbers were 543 of the 1,680 (32.3%) among not-for-profit chain facilities and 2,185 of 7,127 for-profit chain facilities (30.7%). Rates of common ownership among non-chain facilities were very low throughout the study period. In 2005, only 19 of 2,244 not-for-profit non-chains (0.8%) and 9 of the 3,196 for-profit non-chains (0.3%) were commonly-owned. In 2015, 35 of the 1,756 not-for-profit non-chain facilities (2.0%) and 56 of the 2,850 for-profit non-chain facilities (2.0%) were commonly-owned.
Exhibits 2.2: Nursing Home Residents Receiving Care from Nursing Homes with Common Ownership by Ownership Type
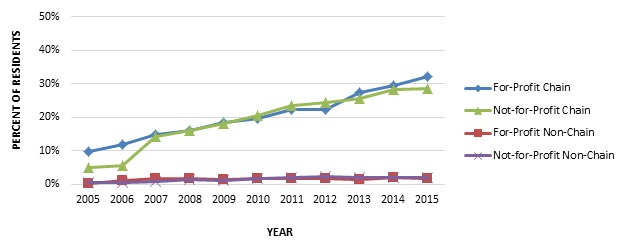
To illustrate the growing role of nursing homes with common ownership to hospice agencies among nursing home residents, Exhibit 2.2 displays the percentage of nursing home residents receiving care from a nursing home with common ownership to a hospice agency by chain and profit status.
Highlights:
-
The proportion of nursing home residents receiving care in a facility with common ownership to a hospice agency steadily increased over the study period.
-
Most of the change in residents living in facilities with common ownership can be attributed to nursing home chains, which experienced far higher rates of common ownership relative to non-chains.
-
The percent of nursing home residents living in a facility that has common ownership to a hospice agency was greatest among residents receiving care in for-profit and not-for-profit chain facilities.
| EXHIBIT 2.2. Percent of Nursing Home Residents Living in a Nursing Home with Common Ownership to a Hospice Agency by Nursing Home Profit and Chain Status, 2005-2015 |
|---|
 |
| SOURCE: Authors' coding and analyses of 2015 Medicare Cost Reports, PECOS, and CASPER data. |
The proportion of nursing home residents receiving care in a facility with common ownership to a hospice agency steadily increased over the study period. In 2005, 65,545 of the 1,130,150 total nursing home residents (5.0%) received care in a commonly-owned nursing facility. In 2015, 247,992 of the 1,253,898 total nursing home residents (19.8%) received care in a commonly-owned nursing facility, an increase of 14.8 percentage points. Most of the change in common ownership can be attributed to nursing home chains, which experienced far higher rates of common ownership relative to non-chains over the study period. In 2005, 63,082 of the 721,030 residents (8.7%) in chain operated nursing homes lived in a facility with common ownership to a hospice, increasing to be 239,527 of the 777,195 residents (30.8%) by 2015. Conversely, 2,463 residents out of 580,120 residents (0.4%) in non-chain nursing homes were served by a commonly-owned facility in 2005, increasing only slightly over the study period to be 8,465 of the 476,703 residents (1.8%).
The percent of nursing home residents living in a facility that has common ownership to a hospice agency was greatest among residents receiving care in for-profit and not-for-profit chain facilities. In 2005, 56,139 of the 577,890 residents served by for-profit chains (9.7%) were served by commonly-owned facilities, and 6,823 of the 136,758 residents served by not-for-profit chains (5.0%) were served by commonly-owned facilities. Common ownership subsequently grew at similar rates for each of these ownership types. By 2015, 199,524 of the 621,609 residents living in for-profit chain facilities (32.1%) were served by facilities with common ownership to a hospice, and 37,208 of the 129,965 residents served by not-for-profit chains (28.6%) were served by commonly-owned facilities. Rates of common ownership among nursing home residents receiving care in non-chain facilities were quite low across the study period. In 2005, 850 of the 306,713 residents living in for-profit non-chain facilities (0.3%) were served by commonly-owned facilities, and 1,358 of the 206,036 residents living in not-for-profit non-chains (0.7%) were served by commonly-owned facilities. These numbers increased only slightly by 2015 -- to 4,947 of the 271,660 in for-profit non-chain facilities (1.8%) and 3,009 of the 151,331 in not-for-profit non-chains (2.0%).
Exhibit 2.3: Geographic Dimensions of Common Ownership
To examine geographic variation in common ownership, Exhibit 2.3 shows the penetration of hospice common ownership among nursing homes at the state-level.
Highlights:
-
The Southwestern and Southeastern United States had generally higher rates of common ownership among nursing homes.
-
Common ownership in the Midwest and Northeast was relatively lower.
| EXHIBIT 2.3. Percent of Nursing Homes with Common Ownership to a Hospice Agency by State, 2015 |
|---|
 |
| SOURCE: Authors' coding and analyses of 2015 Medicare Cost Reports, PECOS, and CASPER data. |
At the state-level, the average rate of common ownership to a hospice agency among nursing homes was 22.6% in 2015, ranging from a high of 48.3% of nursing homes in Utah to a low of 1.6% nursing homes in Arkansas. Although there are few clear geographic patterns of common ownership, the Western and Southeastern United States had generally higher rates of common ownership among nursing homes, while the Midwest and Northeast had relatively lower rates.
Section III: Service Use Characteristics
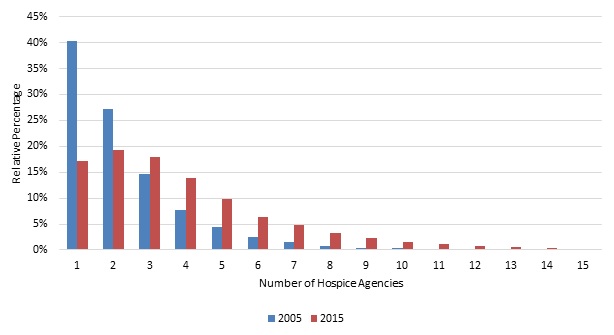
Exhibit 3.1: Number of Hospice Agencies per Nursing Home
To illustrate nursing home-hospice contracting patterns, Exhibit 3.1 displays the percent of nursing homes that had patients receive hospice care from a specified number of hospice providers (1 through 15) for the years 2005 and 2015.
Highlights:
-
As hospice use has expanded among nursing home residents, the number of hospice agencies from which residents at particular facilities receive hospice has increased.
-
In 2005, 67% of all nursing homes had residents receive hospice from 1-2 hospice agencies. By 2015, only 36% of nursing homes had residents receive hospice from 1-2 hospice agencies.
| EXHIBIT 3.1. Number of Hospice Agencies with which Nursing Homes Contract |
|---|
 |
| SOURCE: Authors' coding and analyses of 2015 Medicare Cost Reports, PECOS, and CASPER data. |
In 2005, two-thirds (67%) of all nursing homes had residents receive hospice from only one (40%) or two (27%) hospice agencies, and around 90% of nursing homes had residents receive hospice from four or fewer agencies (15% and 8% of nursing homes had residents receive hospice from three and four agencies, respectively). These numbers changed substantially over our study period. As hospice use has expanded among nursing home residents, the number of hospice agencies from which residents at particular facilities receive hospice has increased.
By 2015, only 36% of nursing homes had residents receive hospice from only one (17%) or two (19%) hospice agencies, and around 68% of all nursing homes had residents receive hospice from four or fewer hospice agencies (18% and 14% of nursing homes had residents receive hospice from three and four agencies, respectively). In other words, by 2015, almost one-third of nursing homes had residents enroll in hospice across five or more hospice agencies in a given year.
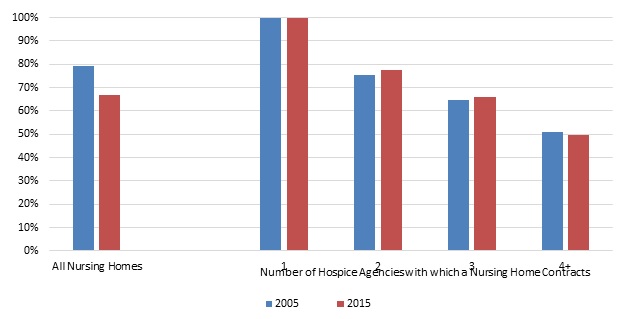
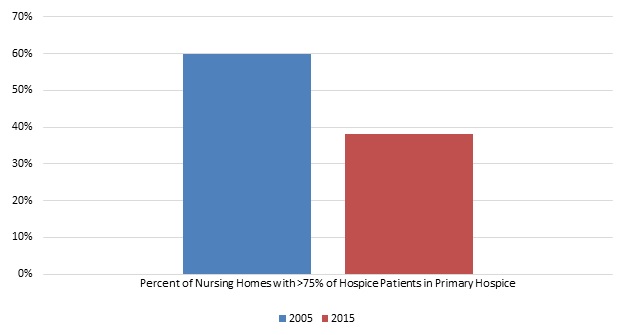
Exhibits 3.2a-3.2b: Hospice Patients Served by Nursing Home's Primary Hospice
To describe the concentration of nursing home-hospice enrollees within a single agency, Exhibit 3.2a displays the average percent of hospice patients served by a nursing home's primary hospice in 2005 and 2015. Exhibit 3.2b shows the percent of nursing homes with >75% of hospice patients served by a nursing home's primary hospice in 2005 and 2015.
Highlights:
-
A large proportion of nursing home-hospice users enroll at the hospice agency with which the nursing home appears to have a primary referral relationship.
-
The percent of hospice patients in a nursing home's primary hospice decreased somewhat over the study period, from 79% in 2005 to 67% in 2015.
-
The percent of nursing homes where 75% or more of the hospice patients in the facility were served by the primary hospice was relatively high; this proportion did, however, decrease over the study period, from 60% to 38%.
| EXHIBIT 3.2a. Percent of Hospice Patients Served by a Nursing Home's Primary Hospice |
|---|
 |
| SOURCE: Authors' coding and analyses of 2015 Medicare Cost Reports, PECOS, and CASPER data. |
| EXHIBIT 3.2b. Percent of Nursing Homes with >75% of Hospice Patients Served by the Primary Hospice |
|---|
 |
| SOURCE: Authors' coding and analyses of 2015 Medicare Cost Reports, PECOS, and CASPER data. |
A large proportion of nursing home-hospice users enroll at the hospice agency with which the nursing home appears to have a primary referral relationship. Reflecting the trend of nursing homes contracting with a greater number of hospice agencies over our study period, the percent of hospice patients in a nursing home's primary hospice decreased over time, from 79% in 2005 to 67% in 2015.
Almost by definition, the percent of a facility's hospice users served by the primary hospice declines as the number of agencies from which residents receive hospice in the nursing home increases. However, even among nursing homes that contracted with four or more hospice agencies, around 50% of all hospice enrollees were served by the same agency in 2005 and 2015.
Similar to the results above, the percent of nursing homes where 75% or more of the hospice patients in the facility were served by the primary hospice was relatively high. Also, as above, this share decreased over time as nursing homes have contracted with greater numbers of hospice agencies, from 60% in 2005 to 38.0% in 2015.
Exhibit 3.3: Market Concentration
To describe the concentration of nursing home-hospice enrollment within facilities, Exhibit 3.3 displays the HHI for hospice within the nursing home. In this context, the HHI measures the concentration of nursing home-hospice users at particular hospice agencies over time.
Highlights:
-
The nursing home-hospice market became less concentrated over the study period, reflecting the fact that nursing home residents have enrolled in more hospice agencies over time.
-
The HHI dropped from 0.73 in 2005 to 0.57 in 2015.
| EXHIBIT 3.3. HHI for Hospice within the Nursing Home |
|---|
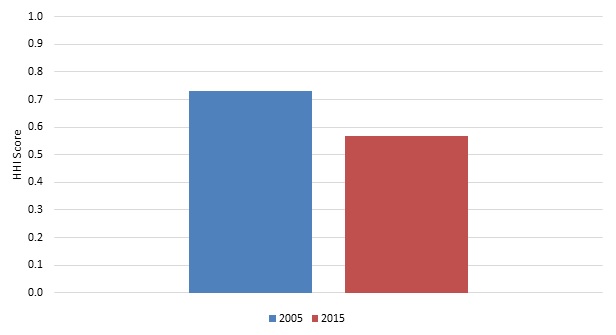 |
| SOURCE: Authors' coding and analyses of 2015 Medicare Cost Reports, PECOS, and CASPER data. NOTE: The HHI is a commonly used measure of market concentration. The HHI is calculated by squaring the market share of each hospice agency and then summing the resulting numbers. |
The HHI measures the concentration of a particular market. Although not a traditional market, we calculated the HHI within each nursing home to demonstrate the concentration of nursing home-hospice users at particular hospice agencies, over time. We did this by squaring the market share of each hospice agency among a facility's residents and summing these across the agencies serving residents in that facility. If only one agency serves all resident in a facility, the HHI would be (1)2 or 1; if two hospice agencies serve 60% and 40% of a facility's residents, the HHI would be (0.6)2 + (0.4)2 or 0.52.
By the HHI measure, the nursing home-hospice market became less concentrated over the study period, reflecting the fact that nursing home residents have enrolled in more hospice agencies over the study period. The HHI score dropped from 0.73 in 2005 to 0.57 in 2015.
Exhibit 3.4: Use of Commonly-Owned Hospice
Among nursing homes that have common ownership with a hospice agency, Exhibit 3.4 shows the mean percent of nursing home-hospice users being served by the commonly-owned hospice agency. To convey the extent to which nursing home-hospice enrollees are served by the commonly-owned hospice (i.e., as opposed to any other hospice agency in the market), we show this overall and by nursing home profit status.
Highlights:
-
Among all nursing homes with common ownership to a hospice, around two-thirds (65%) of nursing home-hospice user received hospice care from the commonly-owned hospice.
-
This proportion was higher among not-for-profit nursing homes relative to for-profit facilities.
| EXHIBIT 3.4. Percent of Hospice Users in Nursing Homes with Common Ownership Being Served by the Commonly-Owned Hospice Agency, 2005-2015 |
|---|
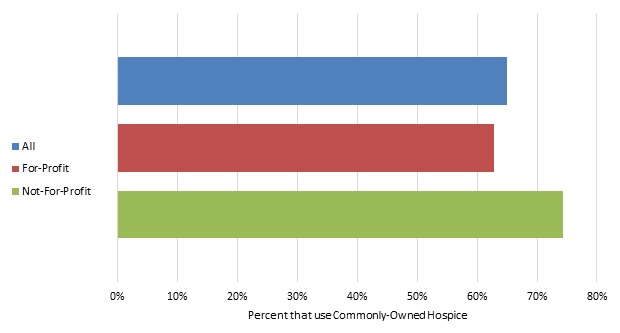 |
| SOURCE: Authors' coding and analyses of 2015 Medicare Cost Reports, PECOS, and CASPER data. NOTE: Only includes hospice stays that began in the nursing home. |
Among all nursing homes with common ownership to a hospice, an average of 65.0% (median 70.0%; IQR 44-90%) of nursing home-hospice users received hospice care from the commonly-owned hospice. This proportion was higher among not-for-profit nursing homes (mean 74%; median 83%; IQR 56-100%) relative to for-profit facilities (mean 63%; median 67%; IQR 41-88%).
Exhibit 3.5: Nursing Home Decedents
To examine whether nursing homes with common ownership to hospice agencies enroll residents in hospice at a higher rate, Exhibit 3.5 focuses on the percent of nursing home decedents who enroll in hospice before death, by nursing home profit and common ownership status. These results are meant to be descriptive only. Greater hospice enrollment might reflect better access to hospice care and its specialized end-of-life services, more aggressive hospice enrollment practices, or other differences about the clinical practices and resident populations within these facilities. Based only on our data, it is impossible to discern the impact of these differences on residents' end-of-life care.
Highlights:
-
A slightly higher percentage of residents in facilities with hospice common ownership died in hospice care relative to non-commonly-owned facilities.
-
For-profit and not-for-profit nursing homes had similar proportions of decedents die while receiving hospice care.
| EXHIBIT 3.5. Percent of Nursing Home Decedents Who Died in Hospice Care, by Profit and Common Ownership Status, 2005-2015 |
|---|
 |
| SOURCE: Authors' coding and analyses of 2015 Medicare Cost Reports, PECOS, and CASPER data. |
Over the study period, an average of 41% (median: 39%; IQR: 24-55%) of nursing home residents died in hospice care. A slightly higher percentage of residents in commonly-owned facilities (mean: 42%; median: 41%; IQR: 28-55%) died in hospice care relative to non-commonly-owned facilities (mean: 40%; median: 39%; IQR: 24-55%). For-profit and not-for-profit nursing homes had similar proportions of decedents die while receiving hospice care (40% and 42%, respectively). Among for-profit nursing homes, rates of residents dying in hospice were nearly identical in commonly-owned and non-commonly-owned facilities (41% and 40%, respectively). However, among not-for-profit nursing homes, there were relatively large differences -- 46% (median: 46%; IQR: 30-61%) of residents in not-for-profit, commonly-owned facilities died in hospice, while only 42% (median: 41%; IQR: 24-57%) of residents in not-for-profit, non-commonly-owned facilities died in hospice.
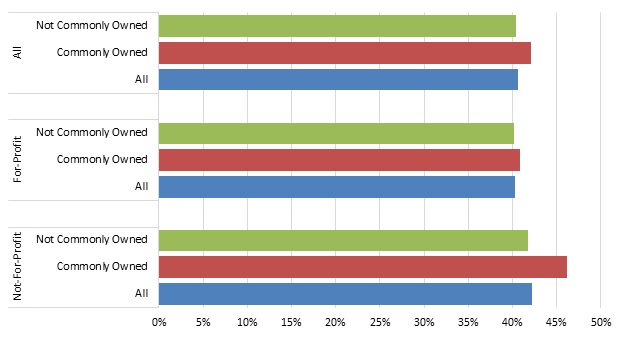
Exhibit 3.6: Service Use by Common Ownership Status
To characterize differences in hospice use outcomes across nursing home-hospice users living in facilities with and without common ownership, Exhibit 3.6 shows the unadjusted mean values for several patient-level hospice use outcomes of interest over the 2005-2015 study period, by nursing home profit and common ownership status. These analyses do not adjust for patient, geographic, nursing home, or hospice factors that might influence service use and are meant to be descriptive.
Highlights:
-
Hospice patients in a nursing home with common ownership had higher rates of live discharge, longer lengths of stay, a higher proportion of stay greater than 90 days, and a lower proportion of stays less than or equal to three days.
-
Most outcomes were similar regardless of whether enrollees used the commonly-owned hospice or another agency.
-
Within for-profit nursing homes, hospice enrollees receiving care at the commonly-owned hospice had longer lengths of stay and a higher proportion of stay over 90 days relative to enrollees receiving care from any hospice.
-
Results for 2015 were similar, except the difference in for-profit lengths of stay was even larger.
| EXHIBIT 3.6. Hospice Service Use Outcomes by Nursing Home Profit and Common Ownership Status, 2005-2015 | ||||
|---|---|---|---|---|
| Service Use Outcomes | ||||
| Live Discharges (%) | Hospice Stays >90 Days (%) | Hospice Stays 30 Days (%) | Mean Length Of Stay (Days) | |
| All Nursing Homes | 16.0% | 22.6% | 15.9% | 78.8 |
| No Common Ownership | 15.9% | 22.5% | 15.9% | 78.6 |
| Common Ownership (any hospice) | 17.2% | 24.4% | 15.0% | 82.7 |
| Common Ownership (commonly-owned hospice) | 17.2% | 26.2% | 14.4% | 88.5 |
| For-Profit Nursing Homes | 16.7% | 23.2% | 15.5% | 81.1 |
| No Common Ownership | 16.6% | 23.0% | 15.6% | 80.7 |
| Common Ownership (any hospice) | 18.0% | 25.5% | 14.5% | 86.9 |
| Common Ownership (commonly-owned hospice) | 18.4% | 28.1% | 13.4% | 95.9 |
| Not-For-Profit Nursing Homes | 14.2% | 20.9% | 16.8% | 71.5 |
| No Common Ownership | 14.2% | 20.9% | 16.7% | 71.8 |
| Common Ownership (any hospice) | 14.0% | 20.3% | 17.1% | 65.6 |
| Common Ownership (commonly-owned hospice) | 13.6% | 19.9% | 17.8% | 63.7 |
| SOURCE: Authors' coding and analyses of 2005-2015 Medicare claims data, Medicare Cost Reports, PECOS, and CASPER data. NOTE: Only includes hospice stays that began in the nursing home. No Common Ownership refers to hospice stays in a nursing home without common ownership. Common Ownership (any hospice) refers to hospice stays in a commonly-owned nursing home, regardless of whether the patient received care from the commonly-owned hospice. Common Ownership (commonly-owned hospice) refers to hospice stays in a commonly-owned nursing home with care delivered by the commonly-owned hospice. | ||||
Common ownership status is divided into two categories -- hospice use at a nursing home with common ownership from: (i) any hospice agency, and (ii) the agency that is commonly-owned. These include the proportion of stays that end in live discharge, mean length of hospice stay, and the proportion of hospice users with short and long hospice stays.
Relative to hospice users residing in nursing homes without common ownership, those who received hospice in a nursing home with common ownership to a hospice had higher unadjusted rates of live discharge, longer lengths of stay, a higher proportion of individuals with stays greater than 90 days, and a lower proportion of stays less than or equal to three days. These trends held whether the hospice users in nursing homes with common ownership used the commonly-owned hospice agency or not.
In nursing homes with common ownership to a hospice, most hospice use outcomes were similar regardless of whether enrollees used the commonly-owned hospice or another agency. The exception to these similarities was hospice length of stay, where hospice length of stay was longer (89 vs. 83 days) and the proportion of stays greater than 90 days higher (26.2% vs. 24.4%) at the commonly-owned hospice agency relative to other agencies. These differences were driven entirely by differences at for-profit nursing homes, where length of stay (96 days vs. 87 days) and the proportion of stays longer than 90 days (28.1% vs. 25.5%) were higher at the commonly-owned hospice agency.
Differences across categories are very similar in the 2015 results, although the for-profit length of stay differences were even larger. Among hospice users in for-profit nursing homes, unadjusted mean length of stay was 83 days where there was no common ownership, and 89 and 99 days at facilities with common ownership where any hospice and the commonly-owned hospice were used, respectively.
Exhibit 3.7: Hospice Visit Outcomes by Common Ownership Status
To characterize differences in hospice visit outcomes across nursing home-hospice users living in facilities with and without common ownership, Exhibit 3.7 shows the unadjusted mean values for several hospice visit outcomes of interest over the 2005-2015 study period, by nursing home profit and common ownership status. These analyses do not adjust for patient, geographic, nursing home, or hospice factors that might influence service use and are meant to be descriptive.
Highlights:
-
Individuals in not-for-profit nursing homes with common ownership received fewer visit hours and RN/LPN visit hours relative to other categories.
-
Individuals receiving hospice in commonly-owned nursing homes were more likely to have RN/LPN, social worker, and aide visits at the very end of life, a difference that was slightly larger when hospice was received from the agency that was commonly-owned.
| EXHIBIT 3.7. Hospice Visit Outcomes by Nursing Home Profit and Common Ownership Status, 2005-2015 | ||||||
|---|---|---|---|---|---|---|
| Day-Level Measures | Patient-Level Measures | |||||
| Percent of Days with Any Visits | Percent of Days with RN/LPN Visits | Average Visit Hours per Day | Average RN/LPN Visit Hours per Day | Percent of Patients with at Least 1 RN/LPN Visit in the Last 3 Days of Life | Percent of Patients with at Least 2 SW or Aide Visits in the Last 7 Days of Life | |
| All Nursing Homes | 58.9% | 41.4% | 1.06 | 0.62 | 84.2% | 65.0% |
| No Common Ownership | 58.9% | 41.5% | 1.06 | 0.62 | 84.1% | 64.7% |
| Common Ownership (any hospice) | 58.7% | 41.0% | 1.05 | 0.63 | 85.9% | 68.0% |
| Common Ownership (commonly-owned hospice) | 58.4% | 40.4% | 1.02 | 0.62 | 86.3% | 69.6% |
| For-Profit Nursing Homes | 58.8% | 40.8% | 1.05 | 0.62 | 83.8% | 66.3% |
| No Common Ownership | 58.7% | 40.8% | 1.05 | 0.62 | 83.6% | 65.9% |
| Common Ownership (any hospice) | 58.9% | 40.4% | 1.07 | 0.63 | 85.6% | 70.1% |
| Common Ownership (commonly-owned hospice) | 58.3% | 39.3% | 1.04 | 0.62 | 85.9% | 72.5% |
| Not-For-Profit Nursing Homes | 59.1% | 43.1% | 1.08 | 0.64 | 85.0% | 61.4% |
| No Common Ownership | 59.1% | 43.1% | 1.09 | 0.65 | 84.8% | 61.5% |
| Common Ownership (any hospice) | 58.1% | 43.3% | 0.98 | 0.61 | 87.2% | 60.6% |
| Common Ownership (commonly-owned hospice) | 58.5% | 43.4% | 0.97 | 0.61 | 87.4% | 60.9% |
| SOURCE: Authors' coding and analyses of 2005-2015 Medicare claims data, Medicare Cost Reports, PECOS, and CASPER data. NOTE: Only includes hospice stays that began in the nursing home. No Common Ownership refers to hospice stays in a nursing home without common ownership. Common Ownership (any hospice) refers to hospice stays in a commonly-owned nursing home, regardless of whether the patient received care from the commonly-owned hospice. Common Ownership (commonly-owned hospice) refers to hospice stays in a commonly-owned nursing home with care delivered by the commonly-owned hospice. | ||||||
Hospice visit outcomes include patient day-level measures (the percent of days with any visit and any RN/LPN visit and the average visit and RN/LPN visit hours per day) and patient-level measures for decedents (the percent of decedents with at least one RN/LPN visit in the last three days of life and the percent with at least two social worker or aide visits in the last seven days of life).
Over the study period, hospice patients received a visit on 58.9% of days during their stay, receiving an average of 1.06 hours (64 minutes) per day overall and an average of 0.62 hours per day (37 minutes) of RN/LPN care. There were no clear trends comparing visit frequency and duration for hospice patients in commonly-owned vs. non-commonly-owned nursing homes overall. However, individuals in not-for-profit nursing homes with common ownership received fewer visit hours and RN/LPN visit hours relative to other categories. Interestingly, individuals receiving hospice in commonly-owned nursing homes were more likely to have RN/LPN, social worker, and aide visits at the very end of life, a difference that was slightly larger when hospice was received from the agency that was commonly-owned. These differences were particularly large in for-profit nursing homes.
Similar trends emerged from 2015 -- little difference in visit frequency or duration across common ownership status, and a slightly greater likelihood of having a RN/LPN, social worker, and aide visits at the very end of life among commonly-owned hospice agencies, particularly when hospice is delivered by the commonly-owned hospice.
Exhibits 3.8-3.9: Regression Results for Hospice Service Use and Visit Outcomes by Common Ownership
To characterize differences in hospice service use and visit outcomes across nursing home-hospice users living in facilities with and without common ownership, Exhibit 3.8 displays logistic regression results for hospice service use and visit outcomes in 2015, by common ownership status. Exhibit 3.9 displays linear regression results for hospice service use and visit outcomes in 2015, by common ownership status. In an attempt to isolate the effects of common ownership from other, related factors, these analyses adjust for patient characteristics, geography, and nursing home and hospice ownership traits.
Highlights:
-
The regression models identified several differences in hospice service use patterns between individuals using hospice in nursing homes without common ownership relative to nursing home-hospice users in facilities with common ownership who used the commonly-owned hospice and who used an externally-owned agency. The differences we identified were primarily among those being served by the commonly-owned hospice agencies, suggesting that receiving services from the commonly-owned hospice agency mattered above and beyond simply residing in a nursing home with common ownership to a hospice.
-
Relative to individuals using hospice in nursing homes without common ownership, individuals receiving hospice from a commonly-owned agency were more likely to have long hospice stays, suggesting that nursing home-hospice common ownership might be conducive to hospice enrollment earlier in the advanced illness trajectory. Individuals being served by commonly-owned hospice agencies were more likely to have RN/LPN visits in the last days of life, a feature that could reflect better communication between nursing homes and their commonly-owned hospice agencies when residents are approaching the very end of their lives. At the same time, relative to individuals in facilities without common ownership, individuals being served by the commonly-owned hospice agency had a lower percent of days with any kind of visit and fewer visit hours per day, which could suggest a greater overlap in service provision between the commonly-owned hospice agency and nursing home.
-
Individuals living in nursing homes with common ownership but not using the commonly-owned hospice shared only one of the differences exhibited by those using the commonly-owned hospice, having a somewhat higher proportion of RN/LPN visits at the end of life. The former group also had a higher live discharge rate relative to those receiving hospice in nursing homes without common ownership. The general absence of differences among individuals living in nursing homes with common ownership and receiving hospice from non-commonly-owned agencies vs. residents of facilities without common ownership suggests that receiving hospice from the commonly-owned hospice matters above and beyond simply residing in a nursing home with common ownership to a hospice.
| EXHIBIT 3.8. Logistic Regression Results for Hospice Service Use and Visit Outcomes by Nursing Home Profit and Common Ownership Status, 2005-2015 | |||
|---|---|---|---|
| Service Use and Visit Outcomes | |||
| OR | 95% CI OR | P Value | |
| Live Discharges (%) | |||
| Common Ownership (other hospice) | 1.15 | [1.10, 1.20] | 0.001 |
| Common Ownership (commonly-owned hospice) | 1.02 | [0.96, 1.08] | 0.510 |
| Hospice Stays >90 Days (%) | |||
| Common Ownership (other hospice) | 1.00 | [0.96, 1.03] | 0.854 |
| Common Ownership (commonly-owned hospice) | 1.09 | [1.03, 1.15] | 0.003 |
| Hospice Stays >180 Days (%) | |||
| Common Ownership (other hospice) | 0.96 | [0.92, 1.00] | 0.056 |
| Common Ownership (commonly-owned hospice) | 1.06 | [1.00, 1.13] | 0.053 |
| Hospice Stays 3 Days (%) | |||
| Common Ownership (other hospice) | 0.99 | [0.95, 1.03] | 0.065 |
| Common Ownership (commonly-owned hospice) | 0.96 | [0.91, 1.01] | 0.086 |
| Percent of Patients with at Least 1 RN/LPN Visit in the Last 3 days of Life | |||
| Common Ownership (other hospice) | 1.08 | [1.00, 1.17] | 0.039 |
| Common Ownership (commonly-owned hospice) | 1.21 | [1.04, 1.41] | 0.012 |
| Percent of Patients with at Least 2 SW or Aide Visits in the Last 7 Days of Life | |||
| Common Ownership (other hospice) | 1.02 | [0.93, 1.11] | 0.740 |
| Common Ownership (commonly-owned hospice) | 1.10 | [0.99, 1.23] | 0.087 |
| SOURCE: Authors' coding and analyses of 2005-2015 Medicare claims data, Medicare Cost Reports, PECOS, and CASPER data. NOTE: Only includes hospice stays that began in the nursing home. No Common Ownership refers to hospice stays in a nursing home without common ownership. Common Ownership (any hospice) refers to hospice stays in a commonly-owned nursing home, regardless of whether the patient received care from the commonly-owned hospice. Common Ownership (commonly-owned hospice) refers to hospice stays in a commonly-owned nursing home with care delivered by the commonly-owned hospice. | |||
| EXHIBIT 3.9. Linear Regression Results for Hospice Service Use and Visit Outcomes by Nursing Home Profit and Common Ownership Status, 2005-2015 | |||
|---|---|---|---|
| Service Use and Visit Outcomes | |||
| Coefficient | Standard Error | P Value | |
| Length of Stay (Days) | |||
| Common Ownership (other hospice) | -1.93 | 1.12 | 0.086 |
| Common Ownership (commonly-owned hospice) | 1.49 | 1.95 | 0.444 |
| Percent of Days with Any Visits | |||
| Common Ownership (other hospice) | 0.09 | 0.41 | 0.822 |
| Common Ownership (commonly-owned hospice) | -1.40 | 0.66 | 0.033 |
| Percent of Days with RN/LPN Visits | |||
| Common Ownership (other hospice) | -0.23 | 0.40 | 0.562 |
| Common Ownership (commonly-owned hospice) | -0.72 | 0.63 | 0.250 |
| Average Visit Hours per Day | |||
| Common Ownership (other hospice) | -0.01 | 0.02 | 0.704 |
| Common Ownership (commonly-owned hospice) | -0.07 | 0.02 | 0.003 |
| Average RN/LPN Visit Hours per Day | |||
| Common Ownership (other hospice) | -0.01 | 0.01 | 0.424 |
| Common Ownership (commonly-owned hospice) | 0.00 | 0.02 | 0.807 |
| SOURCE: Authors' coding and analyses of 2005-2015 Medicare claims data, Medicare Cost Reports, PECOS, and CASPER data. NOTE: Only includes hospice stays that began in the nursing home. No Common Ownership refers to hospice stays in a nursing home without common ownership. Common Ownership (any hospice) refers to hospice stays in a commonly-owned nursing home, regardless of whether the patient received care from the commonly-owned hospice. Common Ownership (commonly-owned hospice) refers to hospice stays in a commonly-owned nursing home with care delivered by the commonly-owned hospice. | |||
After adjusting for geographic, provider, and patient-level factors, several differences in hospice service use patterns remained between individuals using hospice in nursing homes without common ownership relative to nursing home-hospice users in facilities with common ownership, primarily among those being served by the commonly-owned hospice agencies. Relative to individuals using hospice in nursing homes without common ownership, individuals receiving hospice from a commonly-owned agency had a greater likelihood of having stays of 90 days or more (OR=1.09; p=0.003), having stays of 180 days or more (OR=1.06; p=0.053 (borderline significance)), and having at least one RN/LPN visit during the last three days of life (OR=1.21; p=0.012); these individuals also had a somewhat lower percent of days with any kind of visit (-1.40; p=0.033)) and a lower mean visit hours per day (-0.07; p=0.003). At the p0.10 significance level, individuals receiving hospice from commonly-owned hospices also had slightly fewer very short hospice stays (OR=0.96; p=0.086) and a greater likelihood of at least two social worker or aide visits in the last seven days of life (OR=1.10; p=0.087).
Individuals living in nursing homes with common ownership but not using the commonly-owned hospice were more likely to have at least one RN/LPN visit in the final three days of life (OR=1.08; p=0.039) and marginally less likely to have stays of 180 days or more (OR=0.96; p=0.056) but did not share any of the other differences exhibited by those enrolled at the commonly-owned hospice agency. Unlike those receiving hospice from the commonly-owned hospice agency, however, this group had a significantly higher live discharge rate relative to those receiving hospice in nursing homes without common ownership (OR=1.15; p0.001).
CONCLUSION
Between 2005 and 2015, the number of hospice agencies with common ownership to nursing homes nearly quintupled in number and now represent almost one-in-five hospice agencies participating in the Medicare program. Not surprisingly, the growth in common ownership has been fueled by the increased role of hospice agencies with a chain affiliation, especially for-profit chain agencies. These same trends are evident when focused on the proportion of total Medicare hospice enrollees -- 20% of all hospice enrollees in 2015 received services from an agency with common ownership to a nursing home, up from only 6% of enrollees in 2005.
The proportion of nursing homes with common ownership to hospice agencies increased similarly over our study period, from 5% to 20% of all nursing homes (and nursing home residents) between 2005 and 2015. This proportion was highest among chain nursing homes (for-profit and not-for-profit), with almost one-third of all chain nursing homes with common ownership to a hospice agency.
Although select geographic areas had higher proportions of common ownership among hospice agencies and nursing homes, few clear geographic trends emerged.
In addition to chronicling common ownership trends, our analyses documented general trends in nursing home-hospice contracting. As nursing home-hospice use expanded over the last decade, the number of hospice agencies from which residents in particular facilities receive hospice increased. Although these trends imply greater freedom of choice for Medicare beneficiaries, it is still the case that a large proportion of hospice users within most individual facilities enroll at the hospice agency with which the nursing home appears to have a primary referral relationship (67% in 2015, on average). Among nursing homes with common ownership to a hospice agency, the proportion of hospice enrollees using the commonly-owned hospice was similar to this level, at 65% in 2015. Interestingly, this proportion was higher among not-for-profit relative to for-profit nursing homes (74% vs. 63%), potentially suggesting greater coordination of services between not-for-profit nursing homes and hospice agencies.
In addition to having slightly higher enrollment in hospice among decedents (42% vs. 40%), hospice patients in nursing homes with common ownership had, in unadjusted analyses, higher rates of live discharge, longer lengths of stay, a higher proportion of stays greater than 90 days, and a lower proportion of stays less than or equal to three days. Most of these unadjusted outcomes were similar regardless of whether enrollees used the commonly-owned hospice or another agency; however, hospice enrollees in for-profit nursing homes who were receiving care at the commonly-owned hospice had longer unadjusted lengths of stay relative to enrollees receiving care from other hospice agencies.
After adjusting for geographic, provider, and patient-level factors, we identified several differences in service use patterns between individuals using hospice in nursing homes without common ownership relative to nursing home-hospice users in facilities with common ownership. These differences were primarily found among those being served by the commonly-owned hospice agencies, as opposed to those using other hospice agencies. Relative to individuals using hospice in nursing homes without common ownership, individuals receiving hospice from a commonly-owned agency were more likely to have long hospice stays and RN/LPN visits at the end of life. At the same time, these individuals also had a lower percent of days with any kind of visit and fewer visit hours per day.
It is difficult to know using claims data alone what the implications of common ownership between nursing homes and hospice agencies are for the quality of end-of-life care for nursing home residents. In the adjusted analyses comparing patients receiving care from commonly-owned hospice agencies to hospice patients in nursing homes without common ownership, we see slightly higher hospice enrollment, marginally fewer very short hospice stays, and more RN/LPN visits at the very end of life, differences which could suggest greater care coordination between commonly-owned hospice agencies and nursing homes. We also see fewer hospice visits and fewer visit hours overall, which could reflect shared resources between nursing homes and their commonly-owned hospice agencies, and a greater proportion of very long stays, which could reflect care practices that are geared toward patient selection/profit maximization, or at least earlier enrollment in residents' advanced illness trajectories. Among nursing home-hospice enrollees at facilities with common ownership to a hospice, the concentration of some of these practices among individuals receiving hospice from the commonly-owned hospice, as opposed to other hospices that serve individuals in these facilities, suggests that these differences might reflect distinct care patterns that are facilitated through common ownership itself. For instance, there could be distinct communication, coordination, and influence between nursing homes and their commonly-owned hospice agencies, relative to these same nursing homes and other hospice agencies with which they work.
Common ownership between hospice agencies and nursing homes is an emerging trend that reflects a broader push toward consolidation in the health care sector. As described above, this trend could have positive effects for nursing home-hospice users if the shift results in greater access to specialized end-of-life care and better coordination between nursing homes and hospice agencies. At the same time, the consolidation could increase the overall cost of care if hospice lengths of stay are increased considerably in the context of per-diem reimbursements being made to both the nursing homes and the hospice agencies for care of the same residents. The analyses presented above are a first step toward improving our understanding of these trends and their implications. Going forward, policymakers and other stakeholders must continue studying these dimensions and the mechanisms that will shape them and the care that nursing home-hospice enrollees receive.
REFERENCES
-
Miller SC, Lima J, Gozalo PL, Mor V. The growth of hospice care in U.S. nursing homes. J Am Geriatr Soc. 2010; 58(8):1481-1488. doi:10.1111/j.1532-5415.2010.02968.x.
-
Hospice Services: Assessing Payment Adequacy and Updating Payments. Medicare Payment Advisory Commission; 2017:317-342.
-
Stevenson DG, Bramson JS, Grabowski DC. Nursing home ownership trends and their impacts on quality of care: A study using detailed ownership data from Texas. J Aging Soc Policy. 2012; forthcoming.
-
Grabowski DC, Stevenson DG. Ownership conversions and nursing home performance. Health Serv Res. 2008; 43(4):1184-1203. doi:10.1111/j.1475-6773.2008.00841.x.
-
Stevenson DG, Grabowski DC. Private equity investment and nursing home care: is it a big deal? Health Aff (Millwood). 2008; 27(5):1399-1408.
-
Stevenson D, Krone E, Gambrel R, Meneades L, Huskamp H. Tracking the Impact of Ownership Changes in Hospice Care Provided to Medicare Beneficiaries: Final Report; 2017.
-
Fowler AC, Grabowski DC, Gambrel RJ, Huskamp HA, Stevenson DG. Corporate investors increased common ownership in hospitals and the postacute care and hospice sectors. Health Aff (Millwood). 2017; 36(9):1547-1555. doi:10.1377/hlthaff.2017.0591.
-
Stevenson DG, Dalton JB, Grabowski DC, Huskamp HA. Nearly half of all Medicare hospice enrollees received care from agencies owned by regional or national chains. Health Aff Proj Hope. 2015; 34(1):30-38. doi:10.1377/hlthaff.2014.0599.
-
Stevenson DG, Grabowski DC, Coots LA. Nursing Home Divestiture and Corporate Restructuring: Final Report. Washington, DC: Office of the Assistant Secretary for Planning and Evaluation, U.S. Department of Health and Human Services; 2006.
-
Grabowski DC, Hirth RA, Intrator O, et al. Low-quality nursing homes were more likely than other nursing homes to be bought or sold by chains in 1993-2010. Health Aff (Millwood). 2016; 35(5):907-914. doi:10.1377/hlthaff.2015.1042.
This report was prepared under contract #HHSP233201700036C between the U.S. Department of Health and Human Services (HHS), Office of Disability, Aging and Long-Term Care Policy (DALTCP) and Vanderbilt University. For additional information about this subject, you can visit the DALTCP home page at http://aspe.hhs.gov/office-disability-aging-and-long-term-care-policy-daltcp or contact the ASPE Project Officer, Iara Oliveira, at HHS/ASPE/DALTCP, Room 424E, H.H. Humphrey Building, 200 Independence Avenue, S.W., Washington, D.C. 20201. Her e-mail addresses is: Iara.Oliveira@hhs.gov.
Reports Available
Tracking the Impact of Ownership Changes in Hospice Care Provided to Medicare Beneficiaries: Final Report
- HTML: https://aspe.hhs.gov/basic-report/tracking-impact-ownership-changes-hospice-care-provided-medicare-beneficiaries-final-report
- PDF: https://aspe.hhs.gov/pdf-report/tracking-impact-ownership-changes-hospice-care-provided-medicare-beneficiaries-final-report
Trends in Nursing Home-Hospice Contracting and Common Ownership between Hospice Agencies and Nursing Homes: Final Report
- HTML: https://aspe.hhs.gov/basic-report/trends-nursing-home-hospice-contracting-and-common-ownership-between-hospice-agencies-and-nursing-homes-final-report
- PDF: https://aspe.hhs.gov/pdf-report/trends-nursing-home-hospice-contracting-and-common-ownership-between-hospice-agencies-and-nursing-homes-final-report