
IMPACTS OF MINIMUM WAGE INCREASES ON NURSING HOMES: FINAL REPORT
Michael Lepore, PhD, Ian Livingstone, PhD, David Naden, MA, Mark Hatem, BA, and ZhanlianFeng, PhD
RTI International
June 2020
Printer Friendly Version in PDF Format ( PDF pages)
ABSTRACT
Nursing homes employ large proportions of their workforce at the minimum wage. This project sought to understand the potential impacts of federal minimum wage increases on nursing staffing and labor costs of nursing homes. We found that an increase of the federal minimum wage would result in large proportions of nursing assistants gaining a wage increase, thereby increasing direct labor costs to nursing homes. These results are based on national estimates.
This report was prepared under contract #HHSP233201600021I between HHS's ASPE/DALTCP and RTI International. For additional information about this subject, you can visit the DALTCP home page at https://aspe.hhs.gov/office-disability-aging-and-long-term-care-policy-… or contact the ASPE Project Officers at HHS/ASPE/DALTCP, Room 424E, H.H. Humphrey Building, 200 Independence Avenue, S.W., Washington, D.C. 20201; Iara.Oliveira@hhs.gov, Marie.Squillace@hhs.gov.
DISCLAIMER: The opinions and views expressed in this report are those of the authors. They do not reflect the views of the Department of Health and Human Services, the contractor or any other funding organization. This report was completed and submitted on September 19, 2019.
TABLE OF CONTENTS
1. BACKGROUND
2. METHODS
3. FINDINGS
3.1. What is the National Relationship between Average State Wage Levels for Nursing Occupations and Nursing Home Staff Patterns?
3.2. What is the National Relationship between State Minimum Wage Levels and Nursing Home Staff Patterns?
3.3. What Would Be the Impacts on Nursing Homes of Raising the Federal Minimum Wage to $10, $12, or $15 per Hour, Nationally and in Select States?
4. DISCUSSION
4.1. Synthesis of Findings
4.2. How Would a Federal Minimum Wage Increase Ultimately Affect Nursing Homes?
4.3. Possible Responses to a Federal Minimum Wage Increase by Key Stakeholders
4.4. Study Limitations
5. CONCLUSION
APPENDICES
LIST OF EXHIBITS
ACRONYMS
The following acronyms are mentioned in this report and/or appendices.
| ANOVA | Analysis of Variance |
|---|---|
| BLS | DOL Bureau of Labor Statistics |
| CMS | Centers for Medicare & Medicaid Services |
| CNA | Certified Nursing Assistant |
| DOL | U.S. Department of Labor |
| DON | Director of Nursing |
| FTE | Full-Time Equivalent |
| HPRD | Hours Per Resident Day |
| LPN | Licensed Practical Nurse |
| LTC | Long-Term Care |
| NA | Nursing Assistant |
| NAICS | North American Industry Classification System |
| PBJ | Payroll-Based Journal |
| RN | Registered Nurse |
| RSE | Relative Standard Error |
| SNF | Skilled Nursing Facility |
1. BACKGROUND
Historically high rates of population aging coupled with corresponding increases in the number of persons with disabilities will lead to a higher demand for long-term care (LTC) services (Favreault & Dey, 2015). A fundamental challenge to meeting the increasing need for LTC is maintaining a sufficient workforce (Kaye, 2014). LTC providers--including nursing homes--employ large numbers of nursing assistants (NAs) who are paid relatively low wages. In 2018, 581,000 NAs were employed in nursing homes and earned a median hourly wage of $13.38 (PHI, 2019), which means that half of that workforce makes less than that amount. Nursing homes pay large proportions of NAs at the minimum wage, resulting in challenges associated with recruiting and retaining employees, which may in turn decrease care quality and reduce access to LTC services (Stone & Wiener, 2001; Zuckerbraun et al., 2015).
As demand for LTC services increases, the urgency to tackle these LTC workforce challenges grows. In some LTC programs, wage increases have been shown to improve worker retention and increase the availability of workers (Fishman et al., 2004; Morgan, Dill, & Kalleberg, 2013; Raphael, 2008; Seavey & Marquand, 2011). In recent years, several proposals have been made to raise the federal minimum wage as a potential strategy for addressing workforce recruitment and retention issues, and on July 11, 2019, the United States Congress proposed H.R.582, the Raise the Wage Act, a bill to increase the federal minimum wage to $15 (Raise the Wage, 2019). However, the potential impacts of federal minimum wage increases on nursing home providers have not yet been examined.
This project had two objectives to help understand the potential impacts of minimum wage increases on nursing homes.[1] First, we sought to determine how current wage levels relate to nurse staffing patterns in nursing homes on a national level. Second, we sought to investigate the effects of potential minimum wage increases, particularly the financial impacts that different wage-level increases could have on nursing homes, nationally and in select states. To accomplish these objectives, we addressed the following three primary research questions:
The methods used to address these research questions are summarized in Section 2, and a full discussion is presented in Appendix B.
2. METHODS
This research used publicly available secondary data from three sources--U.S. Bureau of Labor Statistics (BLS), U.S. Department of Labor (DOL), and CMS. The BLS data include the wages of nursing occupations in nursing homes, the CMS data include the hours worked by nursing occupations in nursing homes, and the DOL data include state minimum wage levels. A single analytic file that includes all variables needed to conduct this research was created by merging BLS data about staff pay in nursing homes, DOL data on state minimum wage levels, and CMS Payroll-Based Journal (PBJ) data on hours worked by nursing home employees (Appendix A). Data from calendar year 2017 (January 1, 2017-December 31, 2017) were used from each data source.
Distinct analyses were conducted to address each research question. All analyses were cross-sectional. Each research question and its unit of analysis and analyses are listed below.
RQ1: What is the relationship between average state wage levels for nursing occupations and nursing home staffing patterns?
RQ2: What is the relationship between state minimum wage levels and nursing home staffing patterns?
RQ3: What would be the impacts on nursing homes of raising the federal minimum wage level to $10, $12, or $15 per hour, nationally and in select states?
Appendix B provides a more comprehensive review of the study methods.
3. FINDINGS
This study addressed the three primary research questions that were previously introduced. Study findings, organized by research question, are summarized in this section.
3.1. What is the Relationship between Average State Wage Levels for Nursing Occupations and Nursing Home Staffing Patterns?
Across states, the number of nursing homes varies widely. The number and national percentage of nursing homes by state are presented in Exhibit 1.
| EXHIBIT 1. Number and Percentage of Nursing Homes by State, 2017 | |||||
|---|---|---|---|---|---|
| State | Number | Percentage | State | Number | Percentage |
| AK | 14 | 0.09 | MT | 75 | 0.49 |
| AL | 226 | 1.47 | NC | 412 | 2.69 |
| AR | 227 | 1.48 | ND | 77 | 0.50 |
| AZ | 143 | 0.93 | NE | 212 | 1.38 |
| CA | 1,165 | 7.60 | NH | 75 | 0.49 |
| CO | 221 | 1.44 | NJ | 360 | 2.35 |
| CT | 214 | 1.40 | NM | 72 | 0.47 |
| DC | 18 | 0.12 | NV | 55 | 0.36 |
| DE | 44 | 0.29 | NY | 612 | 3.99 |
| FL | 685 | 4.47 | OH | 959 | 6.26 |
| GA | 353 | 2.30 | OK | 287 | 1.87 |
| HI | 43 | 0.28 | OR | 135 | 0.88 |
| IA | 433 | 2.82 | PA | 692 | 4.51 |
| ID | 75 | 0.49 | PR | 1 | 0.01 |
| IL | 721 | 4.70 | RI | 84 | 0.55 |
| IN | 545 | 3.56 | SC | 183 | 1.19 |
| KS | 322 | 2.10 | SD | 105 | 0.68 |
| KY | 277 | 1.81 | TN | 315 | 2.05 |
| LA | 272 | 1.77 | TX | 1,197 | 7.81 |
| MA | 402 | 2.62 | UT | 98 | 0.64 |
| MD | 225 | 1.47 | VA | 288 | 1.88 |
| ME | 101 | 0.66 | VT | 37 | 0.24 |
| MI | 444 | 2.90 | WA | 215 | 1.40 |
| MN | 375 | 2.45 | WI | 378 | 2.47 |
| MO | 498 | 3.25 | WV | 123 | 0.80 |
| MS | 202 | 1.32 | WY | 38 | 0.25 |
Nationally, across states (48 states and the District of Columbia), the average hourly wages in nursing homes was $33.52 for registered nurses (RNs), $22.07 for licensed practical nurses (LPNs), and $13.61 for NAs (Exhibit 2). The range of wages among RNs and LPNs was wide across states. For example, LPNs in one state (Rhode Island) had an average wage of $27.79, which was higher than the average wage of RNs in several other states (e.g., Alabama, Arkansas, Iowa, Mississippi, South Dakota). (State-level data details are not shown.)
| EXHIBIT 2. Average Wages among Nursing Occupations in Nursing Homes across States in 2017 (n = 49*) | |||
|---|---|---|---|
| Nursing Occupation | Average Hourly Wage across States ($) | Minimum State Average Hourly Wage ($) | Maximum State Average Hourly Wage ($) |
| RN | 33.52 | 27.41 | 49.37 |
| LPN | 22.07 | 17.40 | 27.79 |
| NA | 13.61 | 10.52 | 16.87 |
| * 48 states and the District of Columbia. | |||
Visual representation of the state-level data on nursing home staff wages and hours worked per average nursing facility suggests that, nationally, higher average wages among RNs and NAs correlate with higher average hours worked per nursing home among these nursing home staff types, but no such relationship is observable among LPNs (Exhibit 3). It is important to emphasize that this relationship may not be causal. Many factors other than wages (i.e., local laws and regulations, Medicaid rates, resident census, geography, and other factors that affect labor costs) may be contributing to the differences in worked nursing home hours observed in this analysis. While our methods control for unmeasured state factors affecting hours, there may be other shared characteristics of states with higher or lower wage categories (for example, states with higher wages may also share similar approaches to licensure or regulation) that account for the observed differences in staffing patterns associated with different wage levels. Further research would be needed to address causality effects to better understand what other factors and to what extent they are contributing to changes in hours worked.
| EXHIBIT 3. Scatterplot of Nursing Home Staff Wages by Average Hours Worked across States |
|---|
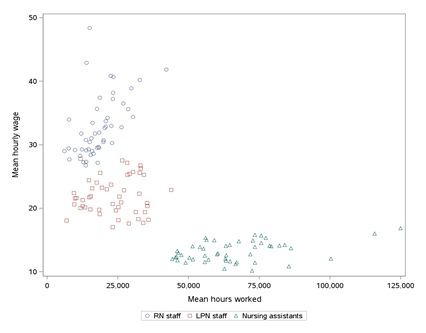 |
For RNs, a strong and significant correlation (p 0.0001) between state average RN wages and state average RN hours worked was observed (Exhibit 4). This finding suggests that RNs in states with higher RN wages tend to work more hours than RNs in states with lower RN wages. Similarly, for NAs, a significant correlation (p 0.0047) was observed between average wages and hours worked. Thus, NAs in states with higher wages tend to work more hours than NAs in states with lower wages. For LPNs, no significant correlation between average wages and hours worked was found.
In examining whether state-level staffing patterns in nursing homes vary across states with distinct average wage levels, we found significant differences in average occupational hours worked for RNs and NAs across states that differ in average occupational wages (i.e., RNs and NAs in states with higher average wages work, on average, more hours than RNs and NAs in states with lower wages), but no relationship for LPNs (Exhibit 4). The strength of the relationship between wages and numbers of hours worked was stronger for RNs than it was for NAs.
| EXHIBIT 4. Bivariate Correlations and ANOVAs of Average Wages with Average Hours Worked among Nursing Staff in Nursing Homes (n = 49*) | ||
|---|---|---|
| Nursing Occupation | Pearson Correlation Coefficient of Average Wage Levels with Average Hours Worked (p-value) | ANOVA of Average Wage Level Terciles with Average Hours Worked (F-score and p-value displayed) |
| RN | 0.55 (0.0001) | 17.92 (0.0001) |
| LPN | 0.09 (0.528) | 0.55 (0.5781) |
| NA | 0.40 (0.0047) | 5.53 (0.0071) |
| * 48 states and the District of Columbia. | ||
Further examining the relationship between average state wage levels and state-level staffing patterns in nursing homes, we found that RN hours worked were significantly higher in states in the medium average wage category (p = 0.0179) and the high-average wage category (p 0.0001) than in states in the low average wage category (Exhibit 5). On average, states in the low-wage category were associated with 13,243 RN hours worked per nursing home year, and states in the medium and high wage categories were associated with 4,574 and 11,106 more average hours worked per nursing home year, respectively, than states in the low-wage category. The findings for NAs also suggest that hours worked were significantly higher in states in the high-average wage category (p= 0.0144) than in states with low average wages; however, the effects of average wages on NA staffing hours worked were not significantly different in hours worked between NAs in states in the medium and low average wage categories. On average, states in the low-wage category were associated with 62,706 NA hours worked per nursing home year, and states in the high wage category were associated with 13,935 more average hours worked than states in the low-wage category. State average wage levels were not related to LPN hours worked (Exhibit 5).
| EXHIBIT 5. Simple Linear Regression of Average Wage-Level Terciles on Average Hours Worked (n = 49*) | ||||
|---|---|---|---|---|
| Nursing Occupation | Intercept | Wage Level (reference: low)† | Parameter Estimate | t value (Pr > [t]) |
| RN | 13,243 | Medium: $30.59 - $34.65 | 4,573.5 | 2.46 (0.0179) |
| High: $34.66 - $49.37 | 11,106.0 | 5.97 (0.0001) | ||
| LPN | 22,989 | Medium: $20.40 - $23.11 | -1,332.0 | -0.42 (0.6797) |
| High: $23.34 - $27.79 | 2,067.9 | 0.64 (0.5221) | ||
| NA | 62,706 | Medium: $12.69 - $14.41 | -3,507.4 | -0.64 (0.5254) |
| High: $14.43 - $16.87 | 13,935.0 | 2.54 (0.0144) | ||
| * 48 states and the District of Columbia. † Reference categories: RN ($27.41 - $30.56); LPN ($17.40 - $20.35); NA ($10.52 - $12.57). | ||||
3.2. What is the Relationship between State Minimum Wage Levels and Nursing Home Staffing Patterns?
In exploring the relationship between state minimum wage levels and nursing home staffing patterns, we found a considerable amount of variation in state minimum wage levels. Exhibit 6 presents a map of the United States, with states grouped by their minimum wage levels (i.e., $7.25, $7.50-$8.90, $9.00+).
| EXHIBIT 6. States by Minimum Wage Categories, 2017 |
|---|
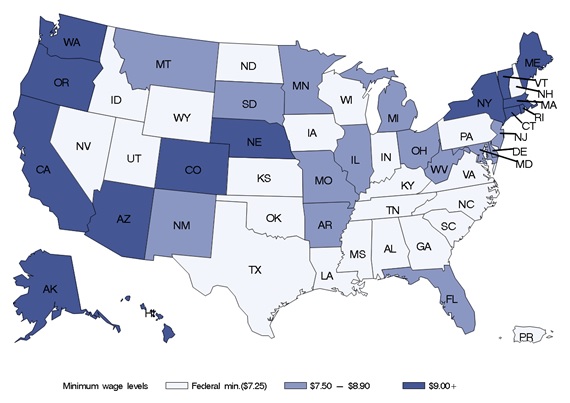 |
Approximately 44% of nursing homes are in states that use the federal minimum hourly wage level of $7.25, 28% are in states with a minimum hourly wage between $7.50 and $8.90, and 28% are in states with a minimum hourly wage of $9.00 or more (Exhibit 7).
| EXHIBIT 7. Nursing Homes by State Minimum Wage Levels | |||
|---|---|---|---|
| Minimum Wage ($) | Nursing Homes (N) | National Percentage | Cum. Percentage |
| 7.25 | 6,801 | 44.36 | 44.36 |
| 7.50 | 72 | 0.47 | 44.83 |
| 7.70 | 498 | 3.25 | 48.08 |
| 7.75 | 375 | 2.45 | 50.53 |
| 8.10 | 685 | 4.47 | 55.00 |
| 8.15 | 1,034 | 6.74 | 61.74 |
| 8.25 | 765 | 4.99 | 66.73 |
| 8.44 | 360 | 2.35 | 69.08 |
| 8.50 | 227 | 1.48 | 70.56 |
| 8.65 | 105 | 0.68 | 71.25 |
| 8.75 | 348 | 2.27 | 73.52 |
| 8.90 | 444 | 2.90 | 76.41 |
| 9.00 | 313 | 2.04 | 78.45 |
| 9.25 | 43 | 0.28 | 78.73 |
| 9.30 | 221 | 1.44 | 80.18 |
| 9.60 | 84 | 0.55 | 80.72 |
| 9.70 | 612 | 3.99 | 84.72 |
| 9.75 | 135 | 0.88 | 85.60 |
| 9.80 | 14 | 0.09 | 85.69 |
| 10.00 | 1,345 | 8.77 | 94.46 |
| 10.10 | 214 | 1.40 | 95.86 |
| 11.00 | 617 | 4.02 | 99.88 |
| 11.50 | 18 | 0.12 | 100.00 |
In examining facility-level HPRD for each nursing occupation, we found that average HPRD was lowest among RNs (0.61 HPRD, or 36 minutes per resident day), slightly higher among LPNs (0.85 HPRD, or 51 minutes per resident day), and highest among NAs (2.28 HPRD, or 137 minutes per resident day); some facilities reported no LPN HPRD (Exhibit 8).
After examining the relationship between state hourly minimum wage categories and nursing home nurse staffing patterns, specifically RN, LPN, and NA HPRD, we found that RN, LPN and NA HPRD differ across states with different minimum wage levels. Specifically, RN and NA HPRD appear higher in states with higher minimum wages levels versus the federal minimum wage level, whereas LPN HPRD appear lower in states with higher minimum wage levels (not shown). It is important to emphasize that these relationships may not be causal. Many factors other than wages (i.e., local laws and regulations, Medicaid rates, resident census, geography, and other factors that affect labor costs) may be contributing to the differences in worked hours observed in this analysis. While our methods control for unmeasured state factors affecting hours staffed, there may be other shared characteristics of states with higher or lower minimum wages (for example, states with higher minimum wages may also share similar approaches to licensure or regulation compared to states that rely on the federal minimum wage) that account for the observed differences in staffing patterns associated with different minimum wage levels. Further research would be needed to address causality effects to better understand what other factors and to what extent they are contributing to changes in hours worked.
| EXHIBIT 8. HPRD by Nursing Occupation | |||||
|---|---|---|---|---|---|
| Nursing Occupation | N | Average HPRD (minutes) | Std. Dev. of HPRD (minutes) | Minimum HPRD (minutes) | Maximum HPRD (minutes) |
| RN | 15,046 | 0.608 (36.48) | 0.339 (20.34) | 0.0003 (>0.02) | 2.289 (137.34) |
| LPN | 15,180 | 0.852 (51.12) | 0.315 (18.90) | 0.000* (0.00) | 1.983 (118.98) |
| NA | 15,073 | 2.282 (136.92) | 0.479 (28.74) | 0.682 (40.92) | 3.944 (236.64) |
| * Nursing homes that reported no LPN hours (n = 80) ranged in size (i.e., number of beds) and, on average, reported considerably more RN hours worked than all other nursing homes in the sample. | |||||
In examining the strength and directionality of the correlations between state minimum wages and HPRD for RN, LPN, and NA staff, findings reveal the coefficients of 0.16 (p 0.0001) and 0.10 (p 0.0001) for RNs and NAs, respectively. RNs and NAs in states with higher minimum wage levels (on average) work more HPRD than do RNs and NAs in states with lower minimum wage levels. However, for LPNs, the coefficient of -0.05 (p 0.0001) indicates a weak, negative association: LPNs in states with higher minimum wage levels work fewer HPRD than do LPNs in states with lower minimum wage levels, on average (Exhibit 9).
| EXHIBIT 9. Bivariate Correlations of State Minimum Wage and HPRD among Nursing Staff in Nursing Homes | |
|---|---|
| Nursing Occupation | Pearson Correlation Coefficient of Average Wages with HPRD (p-value) |
| RN | 0.16 (0.0001) |
| LPN | -0.05 (0.0001) |
| NA | 0.10 (0.0001) |
Overall, we observed positive relationships between state minimum wages and RN and NA HPRD. RNs and NAs in states with higher minimum wages average higher HPRD than those in states with lower minimum wages. In contrast, we found a negative relationship between state minimum wages and LPN HPRD. HPRD among LPNs were lower in states with higher minimum wages.
In examining the relationships between state minimum wages and nursing staff HPRD, we found that RN (p 0.001), LPN (p 0.001), and NA (p = 0.001) HPRD differ across states with different minimum wage levels. Specifically, RN and NA HPRD are significantly higher in states with higher minimum wages than in states that use the federal minimum wage (Exhibit 10 and Exhibit 12), whereas LPN HPRD are significantly lower in states with higher minimum wages than in states that use the federal minimum wage (Exhibit 11). Specifically, compared with RNs in states with the federal minimum wage of $7.25, RNs in states with a $7.50-$8.90 minimum wage average 5 minutes or 0.085 HPRD more, and RNs in states with a $9.00+ minimum wage average approximately 8 minutes or 0.127 HPRD more (Exhibit 10).
| EXHIBIT 10. Relationship between State Minimum Wage and RN HPRD | ||||
|---|---|---|---|---|
| Minimum Wage Parameter* | HPRD Estimate (minutes) | PR > [t] | HPRD 95% Confidence Limits (minutes) | |
| $7.50 - $8.90 | 0.085 (5.10) | 0.0001 | 0.072 (4.32) | 0.097 (5.82) |
| $9.00+ | 0.127 (7.62) | 0.0001 | 0.113 (6.78) | 0.140 (8.40) |
| Intercept | 0.551 (33.06) | 0.0001 | 0.543 (32.58) | 0.559 (33.54) |
| * Reference group = minimum wage of $7.25. | ||||
Compared with LPNs in states with the federal minimum wage of $7.25, LPNs in states with a $7.50-$8.90 minimum wage average nearly 5 minutes or 0.076 fewer HPRD, and LPNs in states with a $9.00+ minimum wage average approximately 4 minutes or 0.066 HPRD fewer (Exhibit 11).
| EXHIBIT 11. Relationship between State Minimum Wage and LPN HPRD | ||||
|---|---|---|---|---|
| Minimum Wage Parameter* | HPRD Estimate (minutes) | PR > [t] | HPRD 95% Confidence Limits (minutes) | |
| $7.50 - $8.90 | -0.076 (-4.56) | 0.0001 | -0.087 (-5.22) | -0.064 (-3.84) |
| $9.00+ | -0.066 (-3.96) | 0.0001 | -0.078 (-4.68) | -0.053 (-3.18) |
| Intercept | 0.891 (53.46) | 0.0001 | 0.884 (53.04) | 0.899 (53.94) |
| * Reference group = minimum wage of $7.25. | ||||
Compared with NAs in states with the federal minimum wage of $7.25, NAs in states with a $7.50-$8.90 minimum wage average nearly 5 minutes or 0.077 HPRD more, and NAs in states with a $9.00+ minimum wage average approximately 9 minutes or 0.149 HPRD more (Exhibit 12).
| EXHIBIT 12. Relationship between State Minimum Wage and NA HPRD | ||||
|---|---|---|---|---|
| Minimum Wage Parameter* | HPRD Estimate (minutes) | PR > [t] | HPRD 95% Confidence Limits (minutes) | |
| $7.50 - $8.90 | 0.077 (4.62) | 0.0001 | 0.059 (3.54) | 0.095 (5.70) |
| $9.00+ | 0.149 (8.94) | 0.0001 | 0.130 (7.80) | 0.169 (10.14) |
| Intercept | 2.223 (133.38) | 0.0001 | 2.211 (132.66) | 2.234 (134.04) |
| * Reference group = minimum wage of $7.25. | ||||
3.3. What Would Be the Impacts on Nursing Homes of Raising the Federal Minimum Wage to $10, $12, or $15 per Hour, Nationally and in Select States?
Overall, the impacts on nursing homes of raising the federal minimum wage would be almost completely restricted to increasing wages among NAs, but a very small percentage of LPNs also would gain a small wage increase with a federal minimum wage increase to $15 per hour. To determine the impacts on nursing homes of raising the federal minimum wage to $10, $12, or $15 per hour, we first determined the proportion of nursing occupation workers who would be affected (i.e., the proportion with a wage increase at each minimum wage level). Based on 2017 BLS data, increasing the minimum wage to $10 would require wage increases for 12% of NAs, increasing it to $12 would require wage increases for 38% of NAs, and increasing it to $15 would impact 76% of NAs and 1% of LPNs (Exhibit 13). The RN staffing group is not shown in the tables below because RN wages average higher than any of the minimum wages we analyzed in this section.
| EXHIBIT 13. Percentage of Nursing Home Nursing Employees Affected by Minimum Wage Increases | |||
|---|---|---|---|
| Nursing Occupation | $10 | $12 | $15 |
| LPN (n = 214,801) | n/a | n/a | 1% |
| NA (n = 560,562) | 12% | 38% | 76% |
Exhibit 14 shows the estimated wage increases required per employee if the minimum hourly wage were $10, $12, or $15. Increasing the federal minimum wage would require hourly wage increases for NAs of approximately $0.55 if set to $10 per hour, approximately $1.44 if set to $12, and approximately $3.03 if set to $15. Additionally, setting the minimum wage at $15 would require a slight increase in average LPN wages.
| EXHIBIT 14. Average Increase in Hourly Wages of Nursing Employees Affected by Minimum Wage Increases | |||
|---|---|---|---|
| Nursing Occupation | $10 | $12 | $15 |
| LPN | n/a | n/a | $0.04 |
| NA | $0.55 | $1.44 | $3.03 |
In addition to increasing wages for workers, raising the minimum wage would also increase payroll taxes for employers and employees. Including Social Security (6.2% of wages) and Medicare taxes (1.45% of wages) adds to employer costs. Nationally, increasing the hourly minimum wage would require annual wage and payroll tax increases of roughly $1,100 if set to $10, $2,600 if set to $12, and $5,900 if set to $15 per employee in the NA staffing group (Exhibit 15). Additionally, increasing the hourly minimum wage to $15 would require slight annual wage and payroll tax increases per employee in the LPN staffing group.
| EXHIBIT 15. Average Increase in Annual Direct Labor Costs of Nursing Employees Affected by Minimum Wage Increases* | |||
|---|---|---|---|
| Nursing Occupation | $10 | $12 | $15 |
| LPN | n/a | n/a | $73 |
| NA | $1,079 | $2,621 | $5,941 |
| * Based on 35 hours/week as full-time, 52 weeks/year, 6.2% Social Security tax, and 1.45% Medicare tax. | |||
Exhibit 16 shows the total annual wage and payroll tax increases required for all nursing home nursing employees if hourly minimum wage were increased to $10, $12, and $15. Nationally, increasing the federal minimum wage would increase total direct labor costs (wages and payroll taxes) by approximately $72.6 million if set to $10, approximately $600 million if set to $12, and more than $2.5 billion if set to $15. Almost all increases in direct labor costs would be for NAs, with a small proportion for LPNs if the hourly minimum wage were set to $15.
| EXHIBIT 16. Total Annual Increase in Direct Labor Costs of Nursing Employees Affected by Minimum Wage Increases* | |||
|---|---|---|---|
| Nursing Occupation | $10 | $12 | $15 |
| LPN | n/a | n/a | $167,544 |
| NA | $72,581,093 | $601,551,536 | $2,531,026,407 |
| * n = 214,801 (LPN staffing group); n = 560,562 (NA staffing group); based on 35 hours/week as full-time, 52 weeks/year, 6.2% Social Security tax, and 1.45% Medicare tax. | |||
Exhibit 17 shows the cost of the increase in direct labor costs as a proportion of total direct labor costs across all nursing home occupations, if hourly minimum wage levels were increased to $10, $12, and $15. Nationally, the cost of the increase in direct labor costs for employees in the NA staffing group would be approximately 0.22% of total direct labor costs across all occupations if the hourly minimum wage were increased to $10, 1.82% if increased to $12, and 7.66% if increased to $15. Additionally, if set to $15, the cost of the increase in direct labor costs for the LPN staffing group would be a very small proportion of total direct labor costs across all occupations.
| EXHIBIT 17. Total Direct Labor Cost of Minimum Wage Increase as a Proportion of Total Direct Labor Cost across All Occupations | |||
|---|---|---|---|
| Nursing Occupation | $10 | $12 | $15 |
| LPN | n/a | n/a | 0.001% |
| NA | 0.22% | 1.82% | 7.66% |
Exhibit 18 shows the cost of the increase in direct labor costs as a proportion of total direct labor costs within each occupation, if hourly minimum wage levels were increased to $10, $12, and $15. Nationally, the cost of the increase in direct labor costs for employees in the NA staffing group would be approximately 0.50% of NA total direct labor costs if the hourly minimum wage were increased to $10, 4.14% if increased to $12, and 17.41% if increased to $15. Additionally, if set to $15, the cost of the increase in direct labor costs would be a very small proportion of LPN staffing total direct labor costs for the LPN staffing group.
| EXHIBIT 18. Total Direct Labor Cost of Minimum Wage Increase as a Proportion of Total Direct Labor Cost within Each Occupation | |||
|---|---|---|---|
| Nursing Occupation | $10 | $12 | $15 |
| LPN | n/a | n/a | 0.002% |
| NA | 0.50% | 4.14% | 17.41% |
To determine the differential state impacts of increasing the federal minimum wage, we explored the impacts of potential minimum wage increases ($10, $12, $15) in six states whose current minimum wage levels differ. The states examined (and their minimum wages) are California ($10.00), New York ($9.70), Florida ($8.10), Texas ($7.25), Arizona ($10.00), and Arkansas ($8.50). We determined the proportion of nursing occupation workers who would require a wage increase at each minimum wage level in each of the six states. Increasing the minimum wage to $10 would require wage increases for NAs in three of the six states, including 12% of NAs in Florida, 18% in Texas, and 24% in Arkansas. Increasing the minimum wage to $12 or $15 would require wage increases for NAs in all six states, ranging from lows of 12% and 34% in New York to highs of 64% and 97% in Arkansas, respectively. Additionally, increasing the minimum wage to $15 would require wage increases for LPNs in four of the six states, including 1% in New York, 2% in Texas, 3% in Florida, and 18% in Arkansas (Exhibit 19).
| EXHIBIT 19. Percentage of Nursing Home Employees Affected by Minimum Wage Increases in 6 States | |||
|---|---|---|---|
| State and Nursing Occupation | $10 | $12 | $15 |
| California | |||
| LPN (n = 19,394) | n/a | n/a | n/a |
| NA (n = 43,346) | n/a | 17% | 52% |
| New York | |||
| LPN (n = 14,716) | n/a | n/a | 1% |
| NA (n = 42,001) | n/a | 12% | 34% |
| Florida | |||
| LPN (n = 13,268) | n/a | n/a | 3% |
| NA (n = 37,721) | 12% | 48% | 83% |
| Texas | |||
| LPN (n = 16,796) | n/a | n/a | 2% |
| NA (n = 33,892) | 18% | 50% | 78% |
| Arizona | |||
| LPN (n = 2,229) | n/a | n/a | n/a |
| NA (n = 5,069) | n/a | 15% | 59% |
| Arkansas | |||
| LPN (n = 3,129) | n/a | n/a | 18% |
| NA (n = 8,306) | 24% | 64% | 97% |
| EXHIBIT 20. Average Increase in Hourly Wages of Employees Affected by Minimum Wage Increases in 6 States | |||
|---|---|---|---|
| State and Nursing Occupation | $10 | $12 | $15 |
| California | |||
| LPN (n = 19,394) | n/a | n/a | n/a |
| NA (n = 43,346) | n/a | $0.91 | $2.23 |
| New York | |||
| LPN (n = 14,716) | n/a | n/a | $0.14 |
| NA (n = 42,001) | n/a | $0.94 | $2.32 |
| Florida | |||
| LPN (n = 13,268) | n/a | n/a | $0.18 |
| NA (n = 37,721) | $0.42 | $1.36 | $3.20 |
| Texas | |||
| LPN (n = 16,796) | n/a | n/a | $0.15 |
| NA (n = 33,892) | $0.81 | $1.64 | $3.56 |
| Arizona | |||
| LPN (n = 2,229) | n/a | n/a | n/a |
| NA (n = 5,069) | n/a | $0.89 | $2.10 |
| Arkansas | |||
| LPN (n = 3,129) | n/a | n/a | $1.31 |
| NA (n = 8,306) | $0.71 | $1.67 | $3.62 |
Exhibit 20 shows the estimated wage increases required per employee in the six states, if the minimum hourly wage level were $10, $12, or $15. Based on 2017 BLS data, increasing the minimum wage to $10 would require wage increases for NAs of less than one dollar per hour in Florida, Texas, and Arkansas, but no increases in California, New York, or Arizona. In contrast, increasing the hourly minimum wage to $12 would require wage increases for NAs in all six states, ranging from lows of less than one dollar per hour in California, New York, and Arizona, to highs of $1.64 in Texas and $1.67 in Arkansas. Increasing the hourly minimum wage to $15 would require wage increases for NAs in all six states and for LPNs in three of the six states. For NAs, increasing the hourly minimum wage to $15 would require hourly wage increases ranging from a low of $2.10 in Arizona to a high of $3.62 in Arkansas. For LPNs, increasing the hourly minimum wage to $15 would require hourly wage increases of less than $0.20 in New York, Texas, and Florida, and $1.31 in Arkansas.
In addition to increasing wages for workers, raising the minimum wage would also increase payroll taxes for employers and employees, including Social Security (6.2% of wages) and Medicare taxes (1.45% of wages). Exhibit 21 shows the average increase in direct labor costs per employee by state. Increasing the hourly minimum wage to $10 would require annual wage and payroll tax increases per NA of roughly $824 in Florida, $1,588 in Texas, and $1,392 in Arkansas, with no increases in California, New York, or Arizona. Increasing the hourly minimum wage to $12 or $15 would require annual wage and payroll tax increases per NA in all six states, ranging from lows of $1,745 and $4,118 in Arizona to highs of $3,275 and $7,098 in Arkansas, respectively. For LPNs, increasing the hourly minimum wage to $15 would result in average increases in annual direct labor costs of less than $400 in New York, Texas, and Florida and $2,569 in Arkansas.
| EXHIBIT 21. Average Increase in Annual Direct Labor Costs per Employee Affected by Minimum Wage Increases in 6 States | |||
|---|---|---|---|
| State and Nursing Occupation | $10 | $12 | $15 |
| California | |||
| LPN (n = 19,394) | n/a | n/a | n/a |
| NA (n = 43,346) | n/a | $1,784 | $4,373 |
| New York | |||
| LPN (n = 14,716) | n/a | n/a | $275 |
| NA (n = 42,001) | n/a | $1,843 | $4,549 |
| Florida | |||
| LPN (n = 13,268) | n/a | n/a | $353 |
| NA (n = 37,721) | $824 | $2,667 | $6,275 |
| Texas | |||
| LPN (n = 16,796) | n/a | n/a | $294 |
| NA (n = 33,892) | $1,588 | $3,216 | $6,981 |
| Arizona | |||
| LPN (n = 2,229) | n/a | n/a | n/a |
| NA (n = 5,069) | n/a | $1,745 | $4,118 |
| Arkansas | |||
| LPN (n = 3,129) | n/a | n/a | $2,569 |
| NA (n = 8,306) | $1,392 | $3,275 | $7,098 |
| * Based on 35 hours/week as full-time, 52 weeks/year, 6.2% Social Security tax, and 1.45% Medicare tax. | |||
Exhibit 22 shows the total annual wage and payroll tax increases required for all nursing home nursing employees in the six states if hourly minimum wages were increased to $10, $12, and $15. The total annual wage and payroll tax increase required for workers differs by both state and occupation. For example, in New York, increasing the federal minimum wage to $12 would require an annual wage and payroll tax increase of approximately $9.3 million for NAs, whereas in Texas, increasing the federal minimum wage to $12 would require an annual wage and payroll tax increase of roughly $54.5 million for NAs. Likewise, increasing the minimum wage to $15 would require an annual wage and payroll tax increase for LPNs in Arkansas of nearly $1.5 million, whereas direct labor costs for LPNs in California and Arizona would not increase.
| EXHIBIT 22. Total Annual Increase in Direct Labor Costs of Employees Affected by Minimum Wage Increases in 6 States | |||
|---|---|---|---|
| State and Nursing Occupation | $10 | $12 | $15 |
| California | |||
| LPN (n = 19,394) | n/a | n/a | n/a |
| NA (n = 43,346) | n/a | $13,145,975 | $98,567,070 |
| New York | |||
| LPN (n = 14,716) | n/a | n/a | $40,469 |
| NA (n = 42,001) | n/a | $9,288,941 | $64,961,267 |
| Florida | |||
| LPN (n = 13,268) | n/a | n/a | $140,508 |
| NA (n = 37,721) | $3,729,852 | $48,288,915 | $196,460,398 |
| Texas | |||
| LPN (n = 16,796) | n/a | n/a | $98,760 |
| NA (n = 33,892) | $9,687,689 | $54,498,336 | $184,548,041 |
| Arizona | |||
| LPN (n = 2,229) | n/a | n/a | n/a |
| NA (n = 5,069) | n/a | $1,326,811 | $12,315,744 |
| Arkansas | |||
| LPN (n = 3,129) | n/a | n/a | $1,446,912 |
| NA (n = 8,306) | $2,774,868 | $17,409,376 | $57,187,308 |
Exhibit 23 shows the cost of the increase in direct labor costs as a proportion of total direct labor costs across these nursing home nursing occupations, if hourly minimum wage levels for the six states were increased to $10, $12, and $15. The cost of the increase as a proportion of total direct labor costs for all nursing home nursing occupations differs by both state and occupation. For example, in California, New York, and Arizona, increasing the federal minimum wage to $12 would increase the direct labor costs of NAs by less than 1% of total direct labor costs across all nursing home nursing occupations, whereas this proportion of total direct labor costs would be substantially higher in Florida (2.4%), Texas (2.9%), and Arkansas (4.9%).
| EXHIBIT 23. Total Direct Labor Cost of Minimum Wage Increases as a Proportion of Total Direct Labor Cost across All Occupations in 6 States | |||
|---|---|---|---|
| State and Nursing Occupation | $10 | $12 | $15 |
| California | |||
| LPN (n = 19,394) | n/a | n/a | n/a |
| NA (n = 43,346) | n/a | 0.40% | 3.03% |
| New York | |||
| LPN (n = 14,716) | n/a | n/a | 0.001% |
| NA (n = 42,001) | n/a | 0.31% | 2.16% |
| Florida | |||
| LPN (n = 13,268) | n/a | n/a | 0.01% |
| NA (n = 37,721) | 0.19% | 2.41% | 9.80% |
| Texas | |||
| LPN (n = 16,796) | n/a | n/a | 0.01% |
| NA (n = 33,892) | 0.51% | 2.86% | 9.67% |
| Arizona | |||
| LPN (n = 2,229) | n/a | n/a | n/a |
| NA (n = 5,069) | n/a | 0.37% | 3.43% |
| Arkansas | |||
| LPN (n = 3,129) | n/a | n/a | 0.41% |
| NA (n = 8,306) | 0.78% | 4.88% | 16.02% |
| EXHIBIT 24. Total Direct Labor Cost of Minimum Wage Increase as a Proportion of Total Direct Labor Cost within Each Occupation in 6 States | |||
|---|---|---|---|
| State and Nursing Occupation | $10 | $12 | $15 |
| California | |||
| LPN (n = 19,394) | n/a | n/a | n/a |
| NA (n = 43,346) | n/a | 1.01% | 7.59% |
| New York | |||
| LPN (n = 14,716) | n/a | n/a | 0.006% |
| NA (n = 42,001) | n/a | 0.65% | 4.54% |
| Florida | |||
| LPN (n = 13,268) | n/a | n/a | 0.03% |
| NA (n = 37,721) | 0.41% | 5.25% | 21.36% |
| Texas | |||
| LPN (n = 16,796) | n/a | n/a | 0.013% |
| NA (n = 33,892) | 1.18% | 6.66% | 22.54% |
| Arizona | |||
| LPN (n = 2,229) | n/a | n/a | n/a |
| NA (n = 5,069) | n/a | 0.91% | 8.45% |
| Arkansas | |||
| LPN (n = 3,129) | n/a | n/a | 1.26% |
| NA (n = 8,306) | 1.48% | 9.26% | 30.41% |
Finally, Exhibit 24 shows the cost of the increase in direct labor costs as a proportion of total direct labor costs within each nursing occupation, if hourly minimum wages were increased to $10, $12, and $15. The cost of the increase as a proportion of total direct labor costs within nursing occupations differs by both state and occupation. For example, in California, New York, and Arizona, increasing the federal minimum wage to $12 would increase the direct labor costs of NAs by about 1% or less of total direct labor costs for NAs, whereas this proportion of labor costs for NAs would be substantially higher in Florida (5.3%), Texas (6.7%), and Arkansas (9.3%).
4. DISCUSSION
4.1. Synthesis of Findings
Low-wage workers who earn the federal minimum hourly wage or a few dollars more constitute a substantial proportion of all nursing home employees, but both shortages and turnover of low-wage nursing home workers are long-standing challenges to the delivery of safe, high-quality nursing home care. Increasing the federal minimum wage could impact wages for many nursing home employees, and many proposals have been made to increase the federal minimum wage in recent years. For example, on July 11, 2019, the United States Congress proposed H.R.582, the Raise the Wage Act, a bill to increase the federal minimum wage to $15 (Raise the Wage, 2019).
This study sought to improve understanding of the relationships between nursing occupation wages and hours worked in nursing homes and the impacts that a federal minimum wage increase to $10, $12, or $15 an hour would have on nursing homes and their employees. We examined the relationships between average state wage levels for each nursing occupation and nursing occupation staffing patterns in nursing homes, the relationships between state minimum wages and nursing occupation staffing patterns in nursing homes, and the impacts on nursing homes of raising the federal minimum wage, focusing on the number and proportion of employees in nursing occupations (RNs, LPNs, NAs) who would be affected and the financial impacts on nursing homes. Overall, findings showed positive relationships between state wages and worked hours among RNs and NAs but either no relationship or a negative association between wages and worked hours among LPNs. We note again that these relationships may not be causal and many factors other than wages may be contributing to the differences in worked hours observed in this analysis.
Because nursing homes depend heavily on NAs who earn the minimum wage or a few dollars more, raising the minimum wage from $7.25 to $10, $12, or $15 an hour would have the largest impact on these employees. Our analyses show that wages for most NAs (76%) would be increased by a $15 federal minimum wage, and wages for fewer NAs would be increased by a $12 minimum wage (38%) or a $10 minimum wage (12%). Wages for a small proportion of LPNs (1%) also would be increased by a $15 federal minimum wage. RN wages, which are already more than $15 per hour, would not be directly impacted by a minimum wage increase. Increasing the federal minimum wage would increase total direct labor costs (wages and payroll taxes) in nursing homes by approximately $72.6 million if set to $10, approximately $600 million if set to $12, and more than $2.5 billion if set to $15. Almost all increases in direct labor costs would be for NAs, with a small proportion for LPNs if the hourly minimum wage is set to $15.
We also found that increasing the federal minimum wage would have different impacts on nursing homes across states and occupations. For example, if the federal minimum wage were to be increased to $12, the total annual wage and payroll tax increase required for NAs in New York would be approximately $9.3 million, whereas in Texas, it would be roughly $54.5 million. Likewise, increasing the minimum wage to $15 would require an annual wage and payroll tax increase of nearly $1.5 million for LPNs in Arkansas, but direct labor costs for LPNs in California and Arizona would not increase.
4.2. How Would a Federal Minimum Wage Increase Ultimately Affect Nursing Homes?
The effect of a minimum wage increase on employment and unemployment rates is one long-examined outcome (Mincer, 1976), particularly among food service workers (Addison et al., 2012, 2013; Card & Krueger, 1993; Dube et al., 2010), that also deserves examination among nursing home employees. Although we estimated the direct financial impacts that a federal minimum wage increase would have on nursing occupation wages and employer labor costs in nursing homes, the ultimate impact of a minimum wage increase would vary depending on several factors. For example, the impact on nursing homes of a federal minimum wage increase would be shaped by the level of wages prior to the increase and by how several stakeholder groups respond to the increase, including payers for LTC (e.g., state Medicaid programs) and nursing home employers/providers. Some possible responses to a federal minimum wage increase, and the influences of those responses on the ultimate impacts of a minimum wage increase, are discussed in Section 4.3.
4.3. Possible Responses to a Federal Minimum Wage Increase by Key Stakeholders
Payers. Overall, Medicaid is the predominant payer for LTC, and almost all nursing homes (approximately 95%) participate in Medicaid (Harris-Kojetin et al., 2016). In response to a minimum wage increase, state Medicaid programs tend not to increase their LTC payment rates (Bowers, 2016; Stone, 2017). Because some LTC providers already find Medicaid reimbursement rates so low as to be a deterrent to serving Medicaid beneficiaries (Lepore et al., 2017), increasing the minimum wage without making a corresponding increase to Medicaid payment rates could risk draining the pool of LTC providers who serve Medicaid beneficiaries. Given the role that state Medicaid rates can play in shaping the impact of a federal minimum wage increase on nursing homes, additional research is needed to determine how nursing home wages and hours correlate in states with higher and lower Medicaid rates for nursing home services.
Nursing Homes Employers/Providers. As a result of a federal minimum wage increase raising labor costs, nursing home profits could be reduced. To counteract lost profits, owners and administrators of nursing homes might respond to a federal minimum wage increase in several ways. For example, they could pass on the increased labor costs to consumers through higher prices (Liepelt, 2016); however, higher prices could reduce consumer demand and result in lower occupancy rates, thus potentially costing nursing homes financial resources. Nursing homes could implement a variety of initiatives to reduce nonlabor costs, such as providing lower-cost food and spending less on environmental amenities; however, reducing costs on food or amenities might detract from current consumer satisfaction, putting the facility's reputation and finances at risk. Alternatively, in response to a federal minimum wage increase, which would strictly increase wages for low-wage workers, nursing homes could attempt to reduce other drivers of their labor costs, such as by reducing employee hours, reducing spending on employee benefits, or reducing other employee salaries. However, the essential responsibilities of low-wage workers in these settings and state-mandated minimum staffing levels for some of these low-wage occupations (Zhang et al., 2006) mean relatively few reductions to hours worked are feasible.
Turnover rates among NAs in nursing homes have been high for decades, ranging upwards of 100% (Mukamel et al., 2009). Between 2016 and 2026, it is projected that nursing homes will have to fill nearly 680,000 NA job openings, primarily as workers leave the field (PHI, 2019). The direct cost of turnover per NA has been estimated to be at least $2,500 and the total price paid by government payers for turnover in LTC has been estimated as $2.5 billion annually (Seavey, 2004). The costs of turnover would be even greater if accounting for the increased costs of health care, due to lower care quality for consumers, or higher injury-related medical costs for workers, both of which are associated with turnover (Seavey, 2004). Reducing turnover could generate substantial savings: the marginal cost associated with a 10 percentage point increase in turnover for an average nursing home in 2005 was estimated to be about 3% of annual total costs (Mukamel et al., 2009). Furthermore, spending on fringe benefits for low-wage workers in nursing homes is already limited or nonexistent, so the opportunity to reduce these costs is negligible. The uninsured rate among NAs is 11%, 60% of NAs are provided employer-sponsored insurance, and 25% rely on public coverage, particularly Medicaid (PHI, 2019). Additionally, the challenges of NA recruitment and retention are not strictly financial, but also due to the dangerous nature of the work, as NAs are more than three times more likely to experience workplace injuries than the typical United States worker (PHI, 2019). Overall, low wages, limited benefits, and dangerous work conditions make it difficult to retain and recruit NAs, and turnover remains high.
Rather than reducing costs of low-wage labor, decreasing labor costs might require reducing higher-income employees' hours, salaries, and benefits. Because of the diverse responses that nursing homes can have in response to a federal minimum wage increase, research is needed to determine how nursing homes have previously responded to minimum wage increases, such as in various states that have increased their minimum wages in recent years.
4.4. Study Limitations
This cross-sectional study was limited to state-level minimum and average wage data. The study did not account for any state-level factors, such as state policies or regulations or market dynamics (e.g., competition or availability of workers), that might also impact nursing home wages or hours. Further research would be needed to address causality effects to better understand what other factors and to what extent they are contributing to changes in hours worked. The study also did not account for a myriad of other potential impacts of minimum wage increases on nursing homes--such as the potential for increasing turnover among higher-wage workers and the potential for nursing homes to reduce labor costs through other means, such as reducing or eliminating health benefits or employing fewer staff.
For purposes of linking datasets, the study also combined different categories of nursing home labor into single categories (e.g., RNs, RN directors of nursing, and RN administrators were all examined in a single RN occupational category; certified nursing assistants (CNAs), nurse aides in training, and medication aide/technicians were all examined in a single NA occupation category), which obscures any differences that may exist between the occupational sub-groups. Future research examining the relationships between wages and staffing patterns in states that vary by key factors other than minimum wage--such as state-mandated minimum staffing levels and unemployment rates--would help address the limitations of this national study.
To our knowledge, this study is the first to estimate the direct financial impact on nursing homes of raising the federal minimum wage. However, our calculations of the total wage and payroll tax increases per worker depend on our estimates of wage distributions. We believe that our linear estimates are reasonable; however, employee wages are not, in fact, believed to be linearly distributed. Indeed, they may be clustered around specific wages (e.g., $8.00; $8.50) rather than spread evenly among BLS-reported wage levels. Additionally, over half of nursing home assistants work part-time or for part of the year (PHI, 2015) and our analyses assume full-time employment and, thus, may overestimate the financial impact of minimum wage increases. Finally, as our above review of some possible responses to a minimum wage increase indicates, the ultimate impacts of a minimum wage increase depend on a wide range of real-life factors that are unaccounted for in our aggregate estimates, including factors from outside the nursing home industry that are beyond the scope of our discussion, such as growth in unemployment among traditional nursing home workers (i.e., women with limited education) driven by layoffs and terminations in other industries, such as reductions in retail work as the dominance of online shopping grows.
5. CONCLUSION
This study provides valuable preliminary insights into the relationships between wages and hours worked in nursing homes, and potential impacts of federal minimum wage increases on nursing homes across states and by nursing occupation. Select state findings are also reported, highlighting substantial cross-state differences. To better understand the relationships between wages and hours in nursing homes, and potential impacts of federal minimum wage increases, additional research that takes into account key state-level policy and market factors is needed.
REFERENCES
Addison, J.T., Blackburn, M.L., & Cotti, C.D. (2012). The effect of minimum wages on labour market outcomes: Countylevel estimates from the restaurantandbar sector. British Journal of Industrial Relations, 50(3), 412-435.
Addison, J.T., Blackburn, M.L., & Cotti, C.D. (2013). Minimum wage increases in a recessionary environment. Labour Economics, 23, 30-39.
Bowers, L.A. (2016). California operator braces for planned $15 minimum wage. McKnight's Senior Living. Retrieved from http://www.mcknightsseniorliving.com/news/california-operator-braces-for-planned-15-minimum-wage/article/485966/.
Card, D., & Krueger, A.B. (2015). Myth and Measurement: The New Economics of the Minimum Wage (20th anniversary ed.). Princeton, NJ: Princeton University Press.
Dube, A., Lester, T.W., & Reich, M. (2016). Minimum wage shocks, employment flows, and labor market frictions. Journal of Labor Economics, 34(3), 663-704.
Certification & Survey Provider Enhanced Reporting (CASPER). (2018). SNF CASPER/QIES File Layout. Cowles Research Group: Long Term Care Information. Retrieved from https://www.longtermcareinfo.com/data/casper-and-oscar.php.
Clark, T.S., & Linzer, D.A. (2015). Should I use fixed or random effects? Political Science Research and Methods, 3(2), 399-408.
Centers for Medicare & Medicaid Services (CMS). (2018a). Transition to Payroll-Based Journal (PBJ) Staffing Measures on the Nursing Home Compare Tool on Medicare.gov and the Five Star Quality Rating System. Retrieved from https://www.cms.gov/Medicare/Provider-Enrollment-and-Certification/SurveyCertificationGenInfo/Downloads/QSO18-17-NH.pdf.
Centers for Medicare & Medicaid Services (CMS). (2018c). Payroll-Based Journal Public Use Files: Technical Specifications, October 2018. Retrieved from https://docs.google.com/viewerng/viewer?url=https://data.cms.gov/api/views/ygny-gzks/files/d39a580c-6eff-4771-9590-afe28b431fdd.
Centers for Medicare & Medicaid Services (CMS). (2018b). Design for Nursing Home Compare Five-Star Quality Rating System: Technical User's Guide. Retrieved from https://www.cms.gov/Medicare/Provider-Enrollment-and-Certification/CertificationandComplianc/downloads/usersguide.pdf.
Crespo, M., Bernaldo de Quirós, M., Gómez, M.M., & Hornillos, C. (2011). Quality of life of nursing home residents with dementia: A comparison of perspectives of residents, family, and staff. Gerontologist, 52(1), 56-65.
Favreault, M., & Dey, J. (2015). Long-Term Services and Supports for Older Americans: Risks and Financing. Retrieved from https://aspe.hhs.gov/basic-report/long-term-services-and-supports-older-americans-risks-and-financing-research-brief.
Fishman, M.F., Barnow, B., Glosser, A., & Gardiner, K. (2004). Recruiting and Retaining a Quality Paraprofessional Long-Term Care Workforce: Building Collaboratives with the Nation's Workforce Investment System. Retrieved from https://aspe.hhs.gov/basic-report/recruiting-and-retaining-quality-paraprofessional-long-term-care-workforce-building-collaboratives-nations-workforce-investment-system.
Flynn, L., Liang, Y., Dickson, G.L., & Aiken, L.H. (2010). Effects of nursing practice environments on quality outcomes in nursing homes. Journal of the American Geriatrics Society, 58(12), 2401-2406.
Harris-Kojetin, L., Sengupta, M., Park-Lee, E., Valverde, R., Caffrey, C., Rome, V., & Lendon, J. (2016). Long-term care providers and services users in the United States: data from the National Study of Long-Term Care Providers, 2013-2014. Vital & Health Statistics. Series 3, Analytical and Epidemiological Studies, (38), x-xii.
Hauke, J., & Kossowski, T. (2011). Comparison of values of Pearson's and Spearman's correlation coefficients on the same sets of data. Quaestiones Geographicae, 30(2), 87-93.
Kaye, H.S. (2014). Toward a model long-term services and supports system: State policy elements. Gerontologist, 54(5), 754-761. doi:10.1093/geront/gnu013.
Konetzka, R.T., Stearns, S.C., & Park, J. (2008). The staffing-outcomes relationship in nursing homes. Health Services Research, 43(3), 1025-1042.
Lepore, M., Knowles, M., Porter, K.A., O'Keeffe, J., & Wiener, J. (2017). Medicaid beneficiaries' access to residential care settings. Journal of Housing for the Elderly, 31(4), 351-366.
Liepelt, K. (2016). Minimum wage hikes to have ripple effect in senior living. Mcknight's Senior Living. Retrieved from http://seniorhousingnews.com/2016/04/18/minimum-wage-hikes-ripple-effec….
Mincer, J. (1976). Unemployment effects of minimum wages. Journal of Political Economy, 84(4, Part 2), S87-S104.
Morgan, J.C., Dill, J., & Kalleberg, A.L. (2013). The quality of healthcare jobs: Can intrinsic rewards compensate for low extrinsic rewards? Work, Employment and Society, 27(5), 802-822.
Mukamel, D.B., Spector, W.D., Limcangco, R., Wang, Y., Feng, Z., & Mor, V. (2009). The costs of turnover in nursing homes. Medical Care, 47(10), 1039.
PHI. (2015). U.S. Nursing Assistants Employed in Nursing Homes: Key Facts. Retrieved from http://phinational.org/wp-content/uploads/legacy/phi-nursing-assistants-key-facts.pdf.
PHI. (2019). U.S. Nursing Assistants Employed in Nursing Homes: Key Facts. Retrieved from https://phinational.org/wp-content/uploads/2019/08/US-Nursing-Assistants-2019-PHI.pdf.
Raise the Wage Act, H.R. 582, 116th Cong. (2019).
Raphael, C. (2008). Long-Term Care: Preparing for the Next Generation. Retrieved from http://www.commonwealthfund.org/Publications/Commentaries/2008/Jul/Long….
Seavey, D. The Cost of Frontline Turnover in Long-Term Care. Retrieved from https://www.leadingage.org/sites/default/files/Cost_Frontline_Turnover.pdf.
Seavey, D., & Marquand, A. (2011). Caring in America: A Comprehensive Analysis of the Nation's FastestGrowing Jobs: Home Health and Personal Care Aides. Retrieved from https://phinational.org/wp-content/uploads/legacy/clearinghouse/caringinamerica-20111212.pdf.
Stone, W. (2017). New Arizona Minimum Wage Hits Developmental-Disability Providers. KJZZ. Retrieved from http://kjzz.org/content/434148/new-arizonaminimum-wage-hits-development….
Stone, R.I. & Wiener, J.M. (2001). Who Will Care for Us? Addressing the Long-Term Care Workforce Crisis. Retrieved from http://www.urban.org/sites/default/files/publication/42696/310304-Who-Will-Care-For-Us-Addressing-the-Long-Term-Care-Workforce-Crisis.PDF.
Wiener, J.M., Lepore, M., & Elkins, W. (2017). Impacts of Potential Minimum Wage Increases on Assisted Living and Continuing Care Retirement Communities. Prepared for the Center for Excellence in Assisted Living. Retrieved from https://www.theceal.org/images/reports/RTI-CEAL-Minimum-Wage-Report-2017-FINAL.pdf.
Williams, S.C., Morton, D.J., Braun, B.I., Longo, B.A., & Baker, D.W. (2017). Comparing public quality ratings for accredited and nonaccredited nursing homes. Journal of the American Medical Directors Association, 18(1), 24-29.
Zhang, N.J., Unruh, L., Liu, R., & Wan, T.T. (2006). Minimum nurse staffing ratios for nursing homes. Nursing Economics, 24(2), 78.
Zhang, X., & Grabowski, D.C. (2004). Nursing home staffing and quality under the nursing home reform act. Gerontologist, 44(1), 13-23.
Zuckerbraun, S., Wiener, J.M., McGinn-Shapiro, M., Porter, K., Eicheldinger, C., Dai, L, & Kruger, H. (2015).Wages, Fringe Benefits, and Turnover for Direct Care Workers Working for Long-Term Care Providers in Oregon. Retrieved from https://www.oregon.gov/dhs/aboutdhs/dhsbudget/20152017%20Budget/Oregon%20Final%20Direct%20Care%20Wage%20Report%20to%20DHS.pdf.
APPENDIX A. DATA IN ANALYTIC FILES
| EXHIBIT A-1. BLS Data in Analytic Files | |
|---|---|
| State | State Name (only on the state file) |
| NAics | North American Industry Classification System (NAICS) code for the given industry (only on the national industry files) |
| occ_title | Standard Occupational Classification title or OES-specific title for the occupation |
| occ_group | Shows the SOC occupation level: "total"=total of all occupations; "major"=SOC major group; "minor"=SOC minor group; "broad"=SOC broad occupation; "detailed"=SOC detailed occupation |
| tot_emp | Estimated total employment rounded to the nearest 10 (excludes self-employed) |
| emp_prse | Percentage relative standard error (RSE) for the employment. RSE is a measure of the reliability of a statistic; the smaller the RSE, the more precise the estimate. |
| pct_total | Percentage of industry employment in the given occupation (only on the national industry files). Percentages may not total to 100 due to occupational data not published separately. |
| pct_rpt | Percentage of establishments reporting the given occupation in the given industry (only on the national industry files) |
| jobs_1000 | The number of jobs (employment) in the given occupation per 1,000 jobs in the given area (only on the statewide, metropolitan, and nonmetropolitan area files) |
| h_mean | Mean hourly wage |
| a_mean | Mean annual wage |
| mean_prse | Percentage RSE for the mean wage. RSE is a measure of the reliability of a statistic; the smaller the RSE, the more precise the estimate. |
| h_pct10 | Hourly 10th percentile wage |
| h_pct25 | Hourly 25th percentile wage |
| h_median | Hourly median wage (or the 50th percentile) |
| h_pct75 | Hourly 75th percentile wage |
| h_pct90 | Hourly 90th percentile wage |
| a_pct10 | Annual 10th percentile wage |
| a_pct25 | Annual 25th percentile wage |
| a_median | Annual median wage (or the 50th percentile) |
| a_pct75 | Annual 75th percentile wage |
| a_pct90 | Annual 90th percentile wage |
| EXHIBIT A-2. PBJ Data in Analytic Files | |
|---|---|
| PROVNUM | Medicare provider number |
| STATE | Postal abbreviation for State |
| CY_Qtr | Calendar Quarter (yyyyQq, e.g., 2017Q1) |
| Hrs_RN | Total hours for RN |
| Hrs_LPN | Total hours for LPN |
| Hrs_CNA | Total hours for CNA |
| Hrs_NAtrn | Total hours for nurse aide in training |
| Hrs_MedAide | Total hours for med aide/technician |
| EXHIBIT A-3. DOL Data in Analytic Files | |||||
|---|---|---|---|---|---|
| State or Jurisdiction | Minimum Wage ($) | State or Jurisdiction | Minimum Wage ($) | State or Jurisdiction | Minimum Wage ($) |
| Alabama | N/A | Maine | 9.00 | Oregon | 9.75 |
| Alaska | 9.80 | Maryland | 8.75 | Pennsylvania | 7.25 |
| Arizona | 10.00 | Massachusetts | 11.00 | Rhode Island | 9.60 |
| Arkansas | 8.50 | Michigan | 8.90 | South Carolina | N/A |
| California | 10.00 | Minnesota | 7.75* | South Dakota | 8.65 |
| Colorado | 9.30 | Mississippi | N/A | Tennessee | N/A |
| Connecticut | 10.10 | Missouri | 7.70 | Texas | 7.25 |
| Delaware | 8.25 | Montana | 8.15 | Utah | 7.25 |
| Florida | 8.10 | Nebraska | 9.00 | Vermont | 10.00 |
| Georgia | 7.25 | Nevada | 7.25* | Virginia | 7.25 |
| Hawaii | 9.25 | New Hampshire | 7.25 | Washington | 11.00 |
| Idaho | 7.25 | New Jersey | 8.44 | West Virginia | 8.75 |
| Illinois | 8.25 | New Mexico | 7.50 | Wisconsin | 7.25 |
| Indiana | 7.25 | New York | 9.70 | Wyoming | 7.25 |
| Iowa | 7.25 | North Carolina | 7.25 | District of Columbia | 11.50 |
| Kansas | 7.25 | North Dakota | 7.25 | Guam | 8.25 |
| Kentucky | 7.25 | Ohio | 8.15 | Puerto Rico | 7.25 |
| Louisiana | N/A | Oklahoma | 7.25 | Virgin Islands | 7.25 |
| N/A -- not applicable; no minimum wage law; must comply with federal minimum wage; Federal Fair Labor Standards Act = $7.25. * Lower limit of range in minimum wage levels; established based on gross income. | |||||
APPENDIX B. METHODS
This research used publicly available secondary data from three sources--BLS, DOL, and CMS.
Data Sources and Analytic File Construction
A single analytic file that includes all variables needed to conduct this research was created by merging BLS data about staff pay in nursing homes, DOL data on state minimum wage levels, and CMS PBJ data on hours worked by nursing home employees. Data from calendar year 2017 (January 1, 2017-December 31, 2017) were used from each data source.
BLS data were used to identify nursing staff pay (i.e., wage data) in nursing homes. Wage data were drawn from BLS May 2017 National Industry-Specific Occupational Employment and Wage Estimates for Nursing Care Facilities (e.g., SNFs), which includes combined data on wages in both nursing facilities and SNFs. These estimates were calculated with data collected from employers of all sizes, in metropolitan and nonmetropolitan areas in every state and the District of Columbia. State minimum wages in 2017 were obtained from the DOL data.
Data on nursing staff hours worked came from the CMS PBJ Public Use Files. The PBJ data include substantial staffing information based on payroll and other verifiable and auditable data, including the total number of hours that members from each staffing occupation were paid to deliver services for each day worked (CMS, 2018a). This direct care staffing information includes data on staff directly employed by each nursing home provider and agency and contract staff. Resident census data from the Minimum Data Set are included in the PBJ files. The PBJ staffing data consist of calendar year quarterly files and are aggregated to the facility-day for each nursing home in the data set. Thus, each facility included has one record for each day in the quarter, ranging between 90-92 daily observations, contingent on the number of days in each quarter.
Nursing homes are excluded from the final PBJ data set if they were not active at the time of the quarterly submission period or the facility had nonzero resident census values for 5 or more days without reporting nursing staff hours worked for the director of nursing (DON), RNs, RNs with administrative duties, LPNs, LPNs with administrative duties, CNAs, and medication aides/technicians. Nursing homes are also excluded if their total quarterly nursing staff hours are less than 1.5 or greater than 12 HPRD or if their total quarterly nurse aide staffing hours are greater than 5.25 HPRD. Nursing staff level values that meet these criteria are deemed erroneous. Last, the PBJ files do not contain missing data; values of zero are used to identify when no hours are reported for any worker occupational category.
Each of the four quarterly files from the 2017 PBJ data were linked at the facility level using the Medicare provider number to create a calendar year 2017 file. The calendar year 2017 PBJ data file served as the master file for analyses. The BLS and the DOL data were linked to the PBJ master file by state using unique state identifiers.
The PBJ data include the hours worked by nursing occupations in nursing homes, and the BLS data include the wages of nursing occupations in nursing homes. The datasets are strongly aligned, but the nursing occupation categories are not an exact match across datasets. We merged sub-occupations to facilitate analysis, as summarized below:
The final data set included state-level minimum wage data, state-level nursing staff pay data, and nursing home employee hours worked at the facility level. The sample of nursing homes consists of facilities participating in the Medicare and/or Medicaid programs. Hours worked within each nursing home for each nursing occupation--RN, LPN, NA--were summed across each facility-day within the final calendar year 2017 analytic file to yield the total hours worked for each nursing staffing category in 2017.
Key Variable Construction
The PBJ data include total hours worked per day for each staffing category (CMS, 2018c). The PBJ variables were used to identify total hours worked for each nursing staff category (RN, LPN, NA) within the final calendar year 2017 analytic file to create continuous measures of HPRD by amending the approach CMS uses for the Five-Star Quality Rating System (CMS, 2018b).
The conversion from total hours to HPRD began by summing the resident census variables across each facility-day for each nursing home in the analytic file to determine the total resident census count from each day in 2017. The total hours worked for each nursing staff category in 2017 was then divided by the total resident census from each facility-day in 2017 to yield total facility-level staffing HPRD for each nursing occupation category.
To obtain average staffing patterns at the state level (i.e., average number of facility hours), the total hours worked variable for each occupational category and each facility within each state was summed and divided by the total number of facilities within each state. This approach ensured comparability across states so that staffing levels were not a function of state size or the number of nursing homes within each state.
Data Analysis by Research Question
Distinct analyses were conducted to address each research question. Analyses for each research question are summarized below.
RQ1: What is the national relationship between average state wages for nursing occupations and nursing home staffing patterns?
The first objective for this work was to identify the association between average state wage levels (i.e., the average wages for each nursing occupation) and state average nursing home staffing patterns (i.e., the hours worked by each nursing occupation). To address this objective, analyses were conducted using the state as the unit of analysis, and state average nursing home staffing patterns were conceptualized as the average number of hours worked for each occupational category in a typical facility, utilizing available data from all facilities within each state.
To address research question 1, we first inspected the average wage-level data against staffing levels using scatterplots to depict the visual relationship between the two state-level characteristics and the extent to which the two variables are correlated. We then calculated correlation coefficients to quantify the strength of the association by identifying how well and in which direction the two variables co-vary. Pearson (r) correlations were calculated to measure the linear association. The Pearson approach uses the observed data (i.e., raw values) to calculate correlation coefficients (Hauke & Kossowski, 2011).
We then examined whether state-level staffing patterns in nursing homes vary across states with distinct average wage levels. One-way ANOVAs were calculated to determine the statistical significance of the relationship between state-level average wages and average staffing hours, separately for each occupational category. The ANOVA uses the variation in staffing levels between and within each state to compare average state-level staffing hours for each occupational category and has been a widely used approach in nursing home-related studies to test for significant differences between groups or populations (Crespo et al., 2011; Flynn et al., 2010; Williams et al., 2017). This approach was used to determine whether differences in staffing levels are due to random variation in the data or whether the differences arise from the individual state-level effects of average wage levels.
In addition, we ran a simple linear regression for each staffing occupational category to further examine the association between average state wage levels and state-level staffing patterns in nursing homes. Linear regressions use the observed data to estimate the effects of different average wage levels on average number of hours worked. Average state wage levels were specified as the independent variable and average number of facility hours at the state level, separately for each category of nursing staff, served as the dependent variable in each of the analyses.
RQ2: What is the national relationship between state minimum wage levels and nursing home staffing patterns?
The second objective of this study was to understand the relationship between state minimum wage levels and nurse staffing patterns in nursing homes. To address research question 2, we used data from the PBJ and DOL to conduct facility-level analyses, where nursing home staffing levels were specified as HPRD for each occupational category and merged with state-level DOL data on minimum wage levels. Thus, the analytic file included facility-level observations (unit of analysis), which were grouped within states. The analytic approach accounted for the hierarchical structure of the data, where nursing homes are clustered or grouped within states, to obtain robust estimates of the relationship between state minimum wage levels and nursing home staffing levels (using HPRD).
We then ran linear regressions with fixed effects with state minimum wage levels (i.e., $7.25, $7.50-$8.90, $9.00+) specified as the independent variable and facility-level staffing HPRD, separately for each nursing occupational category, as the dependent variable. The fixed-effects regressions examined the association between state minimum wage levels and nursing home staffing HPRD at the facility level. The fixed-effects model has advantages over other approaches because it focuses on within-group variation (i.e., intra-group variation) in staffing HPRD among the nursing homes included in each state grouping. This approach allows for a more accurate representation of the relationship between state minimum wage levels and nursing home staffing HPRD because the methods isolate the effects of within-group differences in the data and in doing so controls for between state differences, irrespective of unmeasured characteristics that are not controlled for (Clark & Linzer, 2015; Konetzka, Stearns, & Park, 2008; Zhang & Grabowski, 2004).
To isolate the within-group effects of minimum wage levels, we included dummy variables for each minimum wage level in each regression model. Controlling for these fixed differences yielded less-biased estimates by adjusting for the pre-defined clustering of facility observations within states grouped by a similar minimum wage level. Rather than assuming all facility observations are independent, the model treats only facility observations across groups of states as independent, allowing for within-group correlations to exist (McCullagh & Nelder, 1989).
RQ3: What would be the impacts on nursing homes of raising the federal minimum wage to $10, $12, or $15 per hour, nationally and in select states?
The third objective of this study was to investigate how raising the federal hourly minimum wage would impact the nursing home industry. We explored potential minimum wage increases to $10, $12, and $15/hour to demonstrate the range of impact estimates based on differences in wage increases. To depict various impact characteristics, we investigated the effects of federal minimum wage increases at different levels of analysis. First, we conducted national-level analyses to examine the impact of federal minimum wage increases at the nursing home industry level on the following:
Second, we conducted state-level analyses to discern the following:
To address the proportion of nursing occupation workers affected by a minimum wage increase, we examined the BLS-reported Healthcare Support Occupations where the wage distributions identified occupations under $15 per hour, which includes: (1) NAs, who constitute the largest share of nursing home employees with over 36% of the total nursing home workers; (2) personal care aides, who constitute a smaller occupational group with less than 2% of the total nursing home workers; and (3) LPNs. Both NAs and personal care aides tend to have average hourly wages under $13 per hour, whereas LPNs commonly have wages above $15 per hour. We included LPNs in the analyses, despite their higher wages, because, using the national-level distribution of wages, we estimated that LPNs in a small number of nursing homes have wages under $15.
RTI used the PBJ and BLS data to examine the impact of minimum wage increases at the industry level (i.e., nationally). First, we identified the overall total number of hours worked from the selected BLS-reported Healthcare Support Occupations using matched data from the PBJ. We also identified the total number of hours worked from the selected BLS-reported Healthcare Support Occupations that would be affected by the minimum wage increase, across all facilities using data from both the BLS and PBJ, using interpolation and extrapolation methods. We converted the overall total and affected-worker total, in hours, to full-time equivalents (FTEs) using the CMS approach to yield the total number of employees from the BLS-reported Healthcare Support Occupations and the total number of employees who would be affected (CMS, 2018b). We then divided the overall total FTEs by the total FTEs affected by wage increases to identify the proportion of nursing staff affected by minimum wage increases at the industry level. This was repeated for each potential minimum wage increase examined (i.e., $10, $12, and $15/hour).
To address the impacts of federal minimum wage increases on the average increase in wage costs per nursing occupation category and the cost of the increase as a proportion of total direct labor costs, we used the PBJ and BLS data to analyze wages for each occupational staffing category and provide national-level estimates. We started by subtracting each occupational category's wage level that would be affected by a minimum wage increase from each potential minimum wage increase value to yield the individual effects on each nursing occupation included in the analyses. We then summed the differences across each occupational category and divided this value by the number of occupational categories that would be affected by each minimum wage increase to provide the average increase in wage costs per occupational category. We then divided the total cost of the increase by total direct labor costs of nursing occupations, using all facilities included in the sample, to identify the cost of the increase from total direct labor costs at the national level.
To obtain the total cost of the increase, we multiplied the difference between each minimum wage increase and each occupational staffing category wage by total hours worked for each staffing category to yield the cost of the increase for each occupation included. We then summed the total from each occupational staffing category to obtain the total cost of the increase. We multiplied each occupational category wage level by total number of hours worked, for each occupation included, and summed the totals across all occupations to produce total direct labor costs.
Last, to address differential impacts across states (part d), we used states that include a large proportion of all nursing home employees nationally (e.g., California, New York, Florida, Texas) and that differ in their current minimum wage levels (e.g., Arizona, Arkansas) to demonstrate the differential impacts of these potential minimum wage increases across select states based on different state wage characteristics. The national BLS data were used to capture the number of health care support occupations, and the number of occupations in nursing homes that would be affected by each minimum wage increase within each state. The PBJ data were used to identify total hours worked from each occupational category. The approach to examine the national-level impact of minimum wage increases was used to address part d, but the analyses were conducted with states as the unit of analysis, and the data were limited to the states previously identified. Each state was examined separately to demonstrate the state-level impact by providing the number of nursing staff that would be affected by each wage increase within the nursing home setting, for each state. Individual state wage characteristics were used to estimate the financial impact across states.
Consistent with prior work, total direct labor costs were estimated using the BLS-reported wage data added to payroll tax amounts that were estimated using the tax rate for Social Security and Medicare as a multiplier (Wiener et al., 2017).
NOTES
ANALYSES OF DISABILITY, AGING AND LONG-TERM CARE POLICY AND DATA: MINIMUM WAGE
This brief was prepared under contract #HHSP233201600021I between HHS's ASPE/DALTCP and RTI International. For additional information about this subject, you can visit the DALTCP home page at https://aspe.hhs.gov/office-disability-aging-and-long-term-care-policy-daltcp or contact the ASPE Project Officers at HHS/ASPE/DALTCP, Room 424E, H.H. Humphrey Building, 200 Independence Avenue, S.W., Washington, D.C. 20201; Iara.Oliveira@hhs.gov, Marie.Squillace@hhs.gov.
Reports Available
Impacts of Minimum Wage Increases on Nursing Homes: Final Report
- HTML version: https://aspe.hhs.gov/basic-report/impacts-minimum-wage-increases-nursing-homes-final-report
- PDF version: https://aspe.hhs.gov/pdf-report/impacts-minimum-wage-increases-nursing-homes-final-report
Potential Impacts of Minimum Wage Increases on Nursing Homes: Issue Brief
- HTML version: https://aspe.hhs.gov/basic-report/potential-impacts-minimum-wage-increases-nursing-homes-issue-brief
- PDF version: https://aspe.hhs.gov/pdf-report/potential-impacts-minimum-wage-increases-nursing-homes-issue-brief