
About this research Brief
This ASPE Research Brief presents analyses of the 2011-2012 National Survey of Children’s Health focused on the characteristics, health and well-being of children who live with neither of their parents. The brief was prepared by ASPE’s Laura F. Radel and Matthew D. Bramlett of the Centers for Disease Control and Prevention’s National Center for Health Statistics. The analysis is a prelude to the National Survey of Children in Nonparental Care (NSCNC) which will include more detailed information on this population. Data from that survey will be available in 2014. The NSCNC is sponsored by ASPE and conducted by NCHS, with supplemental funding from the Annie E. Casey Foundation.
Introduction
Researchers examining child and family issues have long differentiated between children who live with two parents and children who live with a single parent, recognizing that children in single-parent families show lower levels of well-being across a variety of domains (Dunifon, 2009). However, programs serving children and youth frequently also interact with young people who live with neither of their parents, a population that has received significantly less attention. Noninstitutionalized children living apart from either parent most frequently are cared for by grandparents, either alone or in combination with other adults in a multigenerational household (U.S. Census Bureau, 2011). Others are living with relatives other than grandparents, with foster parents, or with other nonrelatives. This issue brief analyzes data from the 2011-2012 National Survey of Children’s Health to describe children living in nonparental care. Within the population of children living with neither parent, subgroups are defined based on the caregiver(s) with whom the child resides. These include children living with grandparents only, children living with grandparents and other people, children living with foster parents, and children living with adults who are neither grandparents nor foster parents (these might include other adult relatives like aunts, uncles or siblings, or nonrelatives such as godparents or friends).
There are several reasons to be particularly concerned about the well-being of children who live with neither parent. The extensive literature documenting that children of single parents have worse outcomes than children living with both their parents raises concerns that children living without either parent may be further disadvantaged. In addition, transitions in caregiving are problematic for children’s well-being (Fomby and Cherlin, 2007) and most children living apart from their parents have already experienced at least one change in caregiver. Finally, the causes of parents’ absence from the household, which primarily though not exclusively relate to parenting capacity (Gleeson and Seryak, 2010), may also place children at risk independent of the caregiving arrangement.
Existing research has shown that children living apart from their parents are more likely to be suspended from school or repeat a grade in school and have lower levels of school engagement than children living with one or two parents (Conway and Li, 2011; Bavier, 2011). However, few national surveys have sufficient sample sizes and also identify household members in sufficient detail to examine the subgroup of children who live with neither parent. Those that do, including the American Community Survey (Kreider and Ellis, 2011) and the Survey of Income and Program Participation (Swingle, 1999; Hynes and Dunifon, 2007; Bavier, 2011), typically include limited information on the well-being of children. For this reason, most studies of children in nonparental care rely on local data, primarily convenience samples identified in clinical settings (Vandivere et. al., 2012). Nationally representative information on these children is scarce.
Methods
Data
The data used in this report are drawn from the 2011-2012 National Survey of Children’s Health (NSCH), a random-digit-dial landline and cell telephone survey sponsored by the Health Resources and Services Administration’s Maternal and Child Health Bureau (MCHB) and conducted by the Centers for Disease Control and Prevention’s National Center for Health Statistics (NCHS) as a module of the State and Local Area Integrated Telephone Survey. The NSCH sample represents all children aged 0 to 17 years in households in the United States in 2011-2012 (CDC, 2013). One child in each household with children was randomly selected to be the subject of the NSCH interview. Respondents were adults in the household who were knowledgeable about the child’s health, most often the child’s mother. Further detailed information about the design and administration of the NSCH and the derivation of the sample weights can be found in the online documentation (CDC, 2013) and methodology report (O’Connor, et al., forthcoming). The NSCH overall response rate was 23.0%. The low response rate was partly due to the inclusion of cell phone interviews in 2011–2012 and the resulting higher proportion of numbers that were not answered and for which eligibility for the survey could not be determined. When only noncooperation among eligible households was examined, more than half of eligible parents and guardians who were contacted to participate in the 2011-2012 survey did so. The NSCH sampling weights were adjusted for nonresponse and further adjusted to population control totals to minimize nonresponse bias, but the potential for bias cannot be eliminated with certainty. The NSCH response rate and the potential for nonresponse bias are discussed further in the Limitations section below.
The NSCH sample is large, including 95,677 children aged 0-17 years in 2011-2012. The relationships of all adults in the household to the sample child were captured. If there were no parents identified in the household, an additional question was asked to determine if the child was currently in foster care, in order to identify those children in relative foster care whose foster parents were identified as “grandmother” or other relative. The survey collected data on the health and health care of children, family functioning, parental health, and neighborhood characteristics, as well as age-specific academic and well-being information pertaining to early childhood (ages 0-5) or middle childhood and adolescence (6-17). Thus, the NSCH is not limited by the problems described above in terms of national surveys either not having enough sample size, not identifying household relationships sufficiently, or not including much content on child well-being.
Comparison Groups
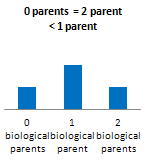
Comparisons are made by the number of biological parents living in the child’s household: two, one or zero. Adopted children have been shown to have poorer health outcomes but better health care access than biological children (Bramlett, Radel & Blumberg 2007) and stepchildren have been shown to have poorer well-being than biological children, although this relationship can differ by whether the stepparent has adopted the child or not (Bramlett 2010). Thus, children living with adoptive or step parents have been excluded from the comparative analysis to avoid confounding a clean comparison by number of parents. The comparison groups are therefore: children living with two biological parents and no other parents in the household (referred to in the text for brevity’s sake as children living with two parents); children living with one biological parent and no other parents in the household (referred to in the text for brevity as children living with one parent); and children living with no biological, adoptive or step parents in the household (referred to as children living with no parents or as children in nonparental care). This final group includes children living in foster care, children living with grandparents, and children living in in nonparental care with neither foster parents nor grandparents in the household.
Analysis Variables
Analysis variables include demographic and socioeconomic characteristics, health and health care indicators, academic performance measures, family environment variables, and indicators of program participation. Most are self-explanatory or are based on single variables from the NSCH interview (the questionnaire is available online at http://www.cdc.gov/nchs/data/slaits/2011NSCHQuestionnaire.pdf). The remaining analysis variables are described below.
MCHB, with assistance from NCHS and the Child and Adolescent Health Measurement Initiative (CAHMI), has developed a set of indicators from the NSCH that measure the key concepts in the survey. National and State-level estimates of these indicators for 2007 were released in The Health and Well-Being of Children: A Portrait of States and the Nation 2007 (US DHHS, 2009). Measures of parental stress and school engagement examined in this brief are based on the key indicators and are coded in the same manner as in that chartbook. Our measure of safe and supportive neighborhoods combines two separate indicators from that chartbook (a safe and supportive neighborhood is one which satisfies both indicators; if either indicator’s criteria is not met, then the combined indicator is not met). Children with special health care needs are those who experience any of the following health care consequences due to a chronic health condition lasting at least a year: need for or use of prescription medications, need for or use of more health services than is normal for children the same age, activity limitation, need for or use of specialized therapies, or need for or use of treatment for an emotional, developmental, or behavioral problem (Bethell et al. 2002). More information about these indicators, including programming code to derive them, is available at the CAHMI Data Resource Center website at http://www.childhealthdata.org/content/Default.aspx.
Statistical Technique
Weighted estimates of demographic, socioeconomic, health, health care, and other well-being characteristics were calculated using SUDAAN to account for the complex sample design of the NSCH(RTI, 2008). The significance of differences was evaluated with t-tests at the 0.05 level. No adjustments were made to account for multiple comparisons. Household income relative to the Federal Poverty Level is missing for 9.3% of data records in the 2011-2012 NSCH. NCHS has made publicly available a data file containing multiply-imputed income data for the 2011-2012 NSCH, and the present analysis of income has used the imputed data.
Findings
Demographics and Household Characteristics
As shown in table 1 and figure 1, an estimated 2.3 million children in the U.S. (3.1 percent of all children in households) live in nonparental care. Figure 1 describes U.S. children according to the number of biological parents the children live with and, for those living with no parents, the relationship of adults in the household to the child. Most children who do not live with parents live with grandparents, either alone (0.8 percent of all children and 25 percent of those living apart from both parents) or in combination with others (1.2 percent of all children and 38 percent of those living with neither parent). Nearly a quarter of children who do not live with parents (22 percent) live with persons who are neither grandparents nor foster parents. This may include relatives other than grandparents (aunts, uncles, siblings, as well as godparents or neighbors, etc.) About 1 in 7 children in nonparental care live in household foster care[1].
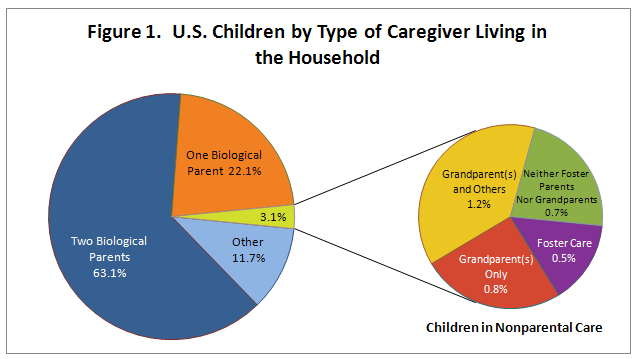
Note: “Other” includes children in 2-parent or 1-parent families that include non-biological parents such as step-parents and adoptive parents (this group is excluded from Table 1 and subsequent figures). Data source: NSCH 2011-2012
Figure 1. U.S. Children by Type of Caregiver Living in the Household
Over one-third of children (35 percent) in nonparental care are non-Hispanic black, compared with 27 percent of children living with one parent and 8 percent of those living with two parents (Table 1). Hispanic children make up 18 percent of those children living apart from both parents compared with 26 percent of those living with one parent and 24 percent of children living with two parents. Non-Hispanic white children, in turn, make up 58 percent of those living with both parents, 38 percent of those living with one parent, and 36 percent of those living in nonparental care.
Children in nonparental care are on average older than children living with one biological parent who, in turn, are older than children living with both biological parents (mean ages 10, 9 and 8 years, respectively). Children in nonparental care are more likely than children living with either one or both parents to live in the South and less likely to live in the Northeast or West. Indeed, over half of children in nonparental care live in the South (51 percent). Children living in nonparental care are more likely to be living in a primarily-English-speaking household (94 percent) than are children living with one biological parent (86 percent), who in turn are more likely than children living with both parents to live in a household in which English is the primary language spoken (82 percent). Similarly, children living in nonparental care are more likely to be living with a native-born caregiver (91 percent) than are children living with one biological parent (83 percent), who in turn are more likely than children living with both parents to live with a U.S.-born caregiver (75 percent) (Table 5).
Income and Program Participation
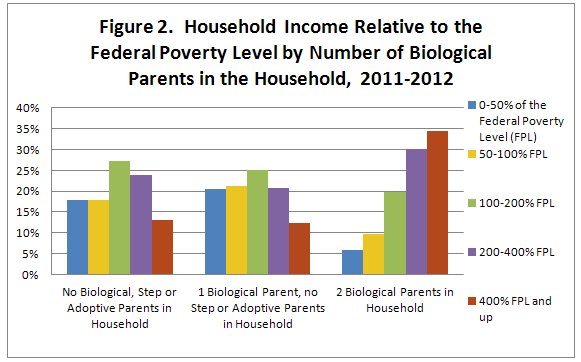
Table 2 shows household income and program participation rates for children by number of biological parents in the household. As shown in Figure 2, the distribution of children by income level is similar for those in nonparental care as for those living with one biological parent, with roughly 4 in 10 children of each group living in households with below-poverty level incomes as compared with 16 percent of children living with two parents. Despite similar household income distributions, children in nonparental care are more likely to live in households that receive welfare benefits through the Temporary Assistance for Needy Families (TANF) program. Nearly one-quarter of children in nonparental care lived in households that included someone receiving TANF benefits (23 percent) as compared with 15 percent of children living with one parent and 4 percent of children living with two parents. In contrast, children living with one parent were more likely than those in nonparental care to receive Supplemental Nutrition Assistance Program (SNAP) or Women, Infants and Children (WIC) benefits (50 percent versus 38 percent for SNAP and 20 percent versus 12 percent for WIC).
Data source: NSCH 2011-2012
| No Biological, Step or Adoptive Parents in Household | 1 Biological Parent, no Step or Adoptive Parents in Household | 2 Biological Parents in Household | |
|---|---|---|---|
| 0-50% of the Federal Poverty Level (FPL) | 18% | 20% | 6% |
| 50-100% FPL | 18% | 21% | 10% |
| 100-200% FPL | 27% | 25% | 20% |
| 200-400% FPL | 24% | 21% | 30% |
| 400% FPL and up | 13% | 12% | 35% |
Health and Health Care
Table 3 presents data on the child’s health and health care by number of biological parents living in the household. Most children in all household configurations are reported by their caregivers to be in excellent or very good overall health and overall dental health. However, children in nonparental care are less likely than those living with both biological parents to have excellent or very good overall health (77 percent compared with 86 percent) and are similar to children living with one biological parent. In addition, children in nonparental care are less likely than both children living with two biological parents and children living with one biological parent to have excellent or very good dental health (60 percent compared with 75 percent and 65 percent, respectively). Nearly one third of children in nonparental care have special health care needs (32 percent) compared with 25 percent of children living with one biological parent and 16 percent of children living with both parents. Mental health diagnoses and receipt of mental health care are higher among children in nonparental care than among children living with parents. This is particularly true among children in foster care (analysis not shown[2]), but also very high in other nonparental care subgroups. For example, 10 percent of children in nonparental care have depression or anxiety disorders, compared with 6 percent of children living with one biological parent and 3 percent of children living with both biological parents. Similarly, 15 percent of children in nonparental care have Attention Deficit Disorder or Attention-Deficit/Hyperactivity Disorder (ADD/ADHD) compared with 10 percent of children living with one biological parent and 5 percent of children living with both biological parents. Behavior/conduct problems follow this same pattern.
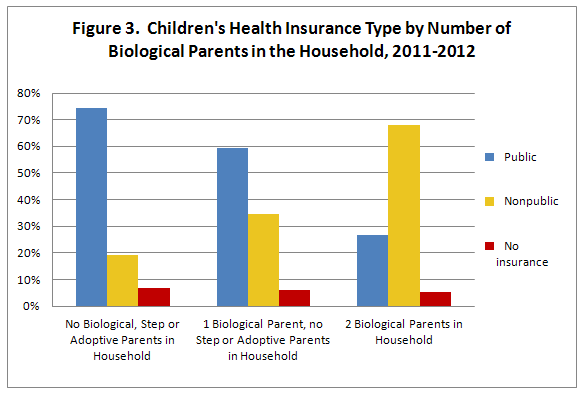
With respect to health insurance, the vast majority of children in all household configurations were insured; there were no significant differences among groups in whether there was coverage. However, as shown in Figure 3, there were stark differences in the source of health insurance coverage by household configuration, with children in nonparental care much more likely than children living with either one or two parents to be covered by Medicaid or the Children’s Health Insurance Program (that is, having publicly provided health insurance). Nearly three quarters of children in nonparental care (74 percent) had public insurance coverage, compared with 59 percent of children living with one biological parent and 27 percent of those living with two biological parents.
Data source: NSCH 2011-2012
gure 3. Children's Health Insurance Type by Number of Biological Parents in the Household, 2011-2012
|
| No Biological, Step or Adoptive Parents in Household | 1 Biological Parent, no Step or Adoptive Parents in Household | 2 Biological Parents in Household |
|---|---|---|---|
| Public | 74% | 59% | 27% |
| Nonpublic | 19% | 35% | 68% |
| No insurance | 7% | 6% | 5% |
School Engagement and Academic Performance
Table 4 shows variables related to school engagement and academic performance. Children living with both biological parents are less likely to attend public school and more likely to attend private school or be home schooled than either children living with one or no parents. For measures of school success or problems, a stepwise pattern is revealed, with children living with both parents doing better than children living with one parent who in turn do better than children living apart from their parents. As shown in Figure 4, of children in nonparental care, 18 percent had repeated at least one grade in school, compared with 14 percent of children living with one parent and 6 percent of children living with both parents. Children in nonparental care were also more likely to have special education plans known as Individual Education Plans or Individual Family Service Plans (15 percent), compared with children living with one parent (12 percent) or both parents (7 percent). Among children in nonparental care, children in foster care were especially likely to have a special education plan (25 percent, analysis not shown).
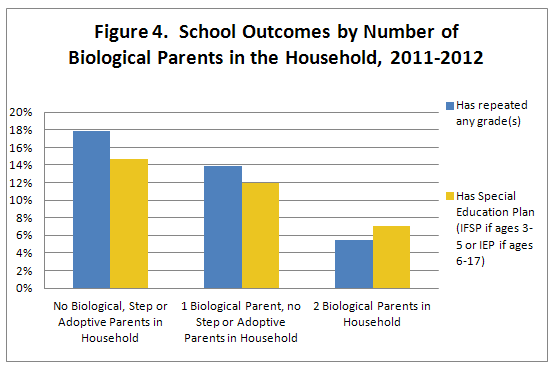
Note: IFSP is Individualized Family Service Plan; IEP is Individualized Education Plan;
Data source: NSCH 2011-2012
Figure 4. School Outcomes by Number of Biological Parents in the Household, 2011-2012
| No Biological, Step or Adoptive Parents in Household | 1 Biological Parent, no Step or Adoptive Parents in Household | 2 Biological Parents in Household | |
|---|---|---|---|
| Has repeated any grade(s) | 18% | 14% | 6% |
| Has Special Education Plan (IFSP if ages 3-5 or IEP if ages 6-17) | 15% | 12% | 7% |
Caregiver Well-Being and Neighborhood Characteristics
Characteristics and well-being of children’s caregivers are shown in table 5 along with a measure of neighborhood quality. Fewer than half of children living apart from both biological parents have a caregiver reported to be in excellent or very good health overall (46 percent), while somewhat more (61 percent) have a caregiver who reports excellent or very good mental health. These children’s caregivers’ health and mental health statuses are worse than those of children living with both parents, but were not significantly different from those of children living with one parent. Children with nonparental caregivers also resembled those living with one parent and were disadvantaged compared with those living with two parents on the survey’s measure of caregiver stress. On both social support (whether the caregiver has someone to turn to for help) and neighborhood quality (whether the neighborhood is safe and supportive), estimates for children in nonparental care were in-between those of children living with two parent and one parent. That is, they fared better than those living with one parent but not as well as those living with two parents on these issues. On social support, 84 percent of children in nonparental care had caregivers who had someone to turn to for help, compared with 91 percent for children living with two parents and 79 percent of those living with one parent.
Adverse Family Experiences (AFEs)
Table 6 describes adverse family experiences that children may have had at any time in their lives by the number of biological parents living in the household. Adverse family experiences (AFEs) are potentially traumatic events or circumstances that children may have experienced. AFEs have been linked to poor adult health outcomes (Felitti et al, 1998), risk of illicit drug abuse (Dube, et al 2003), and risk of suicide (Dube, et al 2001). The 2011-2012 NSCH provides parent or caregiver reported data on nine AFEs children may have experienced. These AFEs could have occurred at any time in the past and could have contributed to the child’s status of living apart from the parents.
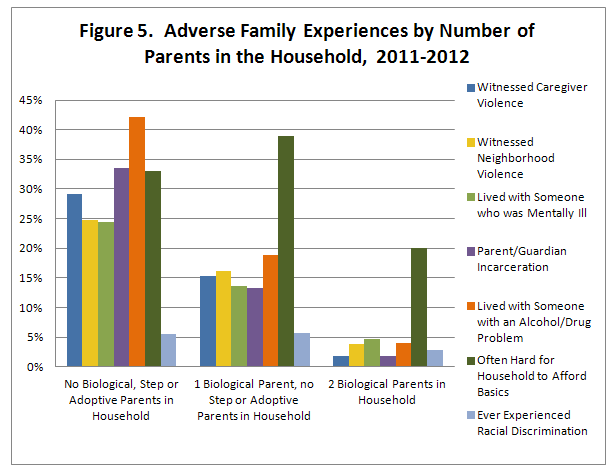
Children in nonparental care as well as children living with one parent were more likely than children living with two biological parents to experience each of the adverse family experiences measured in the NSCH (see Figure 5). Compared with children living with two biological parents, children in nonparental care were about 1.5 times as likely to be living in a household in which it was often difficult to afford basics, five times as likely to have ever lived with a mentally ill caregiver or parent, six times as likely to have witnessed neighborhood violence, fifteen times as likely to have witnessed caregiver or parent violence, eleven times as likely to have lived with a caregiver or parent with an alcohol or drug problem, and seventeen times as likely to have experienced caregiver or parent incarceration. Compared with children living with one biological parent, children in nonparental care were also more likely to experience many of the adverse family experiences measured. They were between 1.5 and 2.5 times as likely to have experienced caregiver or parent violence, experienced neighborhood violence, lived with someone with a mental illness, lived with someone with an alcohol or drug problem, or lived with a parent or guardian who had been incarcerated. However, children in nonparental care were less likely than children living with one biological parent to have experienced financial deprivation (i.e., to be living in a household in which it was often hard to afford basics) and were equally likely to have experienced the separation/divorce of a caregiver or parents or racial discrimination.
Data source: NSCH 2011-2012
Figure 5. Adverse Family Experiences by Number of Parents in the Household, 2011-2012
| No Biological, Step or Adoptive Parents in Household | 1 Biological Parent, no Step or Adoptive Parents in Household | 2 Biological Parents in Household | |
|---|---|---|---|
| Witnessed Caregiver Violence | 29% | 15% | 2% |
| Witnessed Neighborhood Violence | 25% | 16% | 4% |
| Lived with Someone who was Mentally Ill | 24% | 14% | 5% |
| Parent/Guardian Incarceration | 34% | 13% | 2% |
| Lived with Someone with an Alcohol/Drug Problem | 42% | 19% | 4% |
| Often Hard for Household to Afford Basics | 33% | 39% | 20% |
| Ever Experienced Racial Discrimination | 6% | 6% | 3% |
Caregiver incarceration and living with someone with an alcohol or drug problem were especially elevated across the range of nonparental care subgroups shown in Figure 1 (that is, children living with grandparents only, children in foster care, etc.; analysis not shown).[3] Caregiver incarceration ranged from 28 to 51 percent across the subgroups of children in nonparental care, compared with 13 percent among children living with one parent and 2 percent among children living with both parents. Having lived with someone who had alcohol/drug problems ranged from 35 to 65 percent across the nonparental care subgroups as compared with 19 percent among children living with one parent and 4 percent among children living with both parents. Several AFEs were extraordinarily high among children in foster care. This included witnessing caregiver violence (53 percent), witnessing neighborhood violence (43 percent), experiencing separation/divorce (54 percent) having lived with someone who was mentally ill (43 percent), caregiver incarceration (51 percent) and having lived with someone who had an alcohol or drug problem (65 percent).
Discussion
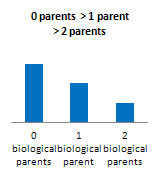
The data revealed three basic patterns of differences among children living with two biological parents, one biological parent, and no parents. In each of the three primary patterns, children living with two parents significantly differed from those living either with one parent or no parents. The patterns are differentiated by how children in one parent households differed from children living in nonparental care.
In the first pattern, children living with two parents fared better than those living with one parent who in turn fared better than children living with no parents. Most child well-being measures fell into this category, including health status items, measures of school engagement and performance, and most of the adverse family experiences items. Receipt of benefits from the Temporary Assistance for Needy Families program (TANF) also fit this pattern, with children in nonparental care most likely to live in a household receiving welfare benefits.
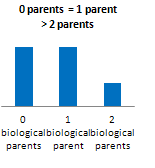
In the second pattern, children living with two parents fared best, with children living with either one or no parents equally worse off. For variables following this pattern, it may be that what matters is whether the child lives with both parents or not, and the absence of both parents does not additionally disadvantage children relative to those who live with only one of their biological parents. Variables showing this pattern included household income and receipt of reduced-price lunch, overall health measures for both the child and the caregiver, and the measure of caregiver stress.
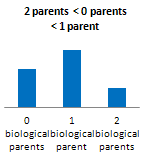
The third pattern includes variables on which children living with one parent are significantly worse off than those in two parent households, with children in nonparental care somewhere in between. This pattern was evident in participation in the SNAP program, measures of neighborhood and social support, and the AFE on whether the child lived in a household in which it was often hard to afford basics.
A fourth and less-frequently-seen pattern was a variant of the third in which the children in one-parent households fared significantly worse than those in two-parent households but children in nonparental care did not differ from those living with two parents. Participation in WIC and how well the caregivers cope with parenting were the only two indicators to follow this pattern.
Figure 6 describes these patterns and lists the variables that follow each pattern.
Figure 6. Patterns in Measures among Households with No, One or Two Biological Parents
| Pattern 1 | Pattern 2 | Pattern 3 | Pattern 4 |
|
|
|
|
|
| · TANF receipt · Child does not have excellent or very good dental health · Child has Special Health Care Needs · All child mental health conditions · Child’s receipt of mental health care · Reliance on public health insurance · Repeated grades · Poor School Engagement · Child has an IFSP/IEP (special education plan) · Poor Caregiver/child communication · AFE: Caregiver Death · AFE: Witnessed Caregiver Violence · AFE: Witnessed Neighborhood Violence · AFE: Lived with Someone with a Mental Illness · AFE: Parent/Guardian Incarceration · AFE: Lived with Someone with an Alcohol/Drug Problem | · Low Household income · Free/Reduced Price Lunch receipt · Child overall health is not excellent or very good · Missed school due to illness · Reliance on public schools · School problems · Caregiver overall health is not excellent or very good · Caregiver mental health is not excellent or very good · Caregiver stress · AFE: Experienced Racism · AFE: Experienced Separation/Divorce | · SNAP receipt · Caregiver does not have someone to turn to for help · Neighborhood is not safe and supportive · AFE: Often Hard for Household to Afford Basics
| · WIC receipt · Poor coping with parenting
|
Among the nonparental care subgroups, children in foster care stood out as faring worse on virtually every measure (subgroup analysis not shown). While either the child welfare system or a grandparent may step in to provide care for the child under similar circumstances, those in foster care are consistently reported to have experienced more adverse circumstances, suffered more mental health problems, and were less engaged in school than children in any of the other groups examined. This may indicate that the child welfare system has stepped in to care for children in the worst circumstances. Alternatively, or perhaps additionally, it is possible that foster care has additionally traumatized children so that they present as worse off than those in the care of relatives.
Findings regarding families’ income and program participation are particularly complex, with certain measures following each of the four patterns. Household income followed the second pattern, with households of children in nonparental care looking similar to those living with one parent and worse off than those living with two parents. Receipt of free or reduced price lunches also followed this pattern. However, though incomes were similar, children living with one biological parent more frequently participated in the WIC and SNAP programs than did those living with neither parent, which may reflect eligibility or other access problems for nonparental caregivers. Conversely, those living with neither parent were more likely than those living with one parent to participate in the TANF program (i.e. welfare cash assistance). And while TANF participation may seem relatively high for those living with neither parent – 23 percent of children in these households receive that benefit – considering that nearly all children living apart from their parents are eligible for TANF “child only” payments (Ehrle and Geen, 2002), the proportion receiving benefits is actually quite low.
The very high rates of adverse family experiences among children in nonparental care suggest that parental substance abuse, mental health problems, domestic violence and incarceration form a cluster of factors that pervade the lives of children who have been separated from their parents. The cumulative trauma that these circumstances represent could have long term implications for the health and well-being of these children over the life course.
The information presented here is descriptive and based on cross sectional data. While more detailed than typically available for a nationally representative sample including children living apart from their parents, these data do not provide information on a number of critical issues specific to these children. These include, among others, the reasons children are in nonparental care, roles parents may continue to play in the lives of their children even when they do not live with them, transitions involved in children living with nonparental caregivers such as changing school enrollment and insurance eligibility, barriers that may arise in obtaining services for children, and families’ expectations for children’s custodial care in the future. The lack of data on these critical issues led the Office of the Assistant Secretary for Planning and Evaluation to team with the National Center for Health Statistics to develop and field the 2013 National Survey of Children in Nonparental Care (NSCNC). The Annie E. Casey Foundation provided supplemental funding for fielding the survey. This survey effort re-interviewed families in the sample described here (that is, those who responded to the 2011-2012 National Survey of Children’s Health and who had reported that the sample child’s parents were not living in the household), and administered a supplemental survey about their particular experiences. Data from the NSCNC will become available in the spring of 2014 and will allow more detailed analysis of critical issues regarding these vulnerable children and their caregivers.
Limitations
The 2011-2012 NSCH overall response rate was 23.0%. A low response rate does not in and of itself indicate nonresponse bias; nonresponse will only result in biased estimates when response propensity is related to the survey variables of interest. The low response rate was largely due to the inclusion of cell-phone interviews in 2011–2012, which actually provided better coverage of the population of children than if cell-phone households had been excluded, but at the expense of lower response rates. The low response rates for cell-phone interviews largely resulted from the higher proportion of telephone numbers that were not answered and therefore provided no indication of whether the number belonged to an eligible household. When only noncooperation among eligible households was examined, more than half of eligible parents and guardians who were contacted to participate in the 2011-2012 survey did so.
To reduce the potential for bias, the sampling weights were adjusted for nonresponse and further adjusted to match external demographic control totals. As summarized in the online documentation (CDC, 2013) and detailed in the methodology report (O’Connor, et al. forthcoming), nonresponse bias analyses were conducted with the 2011–2012 NSCH data using several recommended approaches to examine estimates before and after the nonresponse weighting adjustment. Bias was found to greatly decrease after the weighting adjustment, and estimated biases using the final weights were small – in each case, the maximum estimated bias was within the 95% confidence interval for the survey estimate, indicating that nonresponse bias was consistently smaller than potential sampling error. Bias estimates were so small that, for most of the key survey variables examined, changing the method used to estimate bias changed the estimated direction of the bias (CDC, 2013).
Finally, the present analysis has focused on differences among subgroups. Even if nonresponse resulted in biased estimates, comparisons of subgroups would be less sensitive to this bias unless the relationship between response propensity and the comparison variables differed by subgroup. Thus, nonresponse is less likely to impact the conclusion that children in nonparental care are much more likely than children living with two biological parents to live in a household where anyone receives TANF than it is to impact the specific finding of 23.1% for children in nonparental care and 4.0% for children living with two biological parents (table 2).
Another limitation in the NSCH data is that the findings are based on parents’ experiences and perceptions. Information provided about health status was not verified with health care professionals.
References
Bavier, R. (2011). Children residing with no parent present. Children and Youth Services Review, 33(10), 1891-1901.
Bethell, C. D., Read, D., Stein, R. E., et al. (2002). Identifying children with special health care needs: development and evaluation of a short screening instrument. Ambulatory Pediatrics, 2: 38–47.
Bramlett, M.D., Radel, L.F. (forthcoming). Adverse Family Experiences among Children in Nonparental Care, 2011-2012. National Center for Health Statistics. Data Brief.
Bramlett, M.D. (2010). When stepparents adopt: Demographic, health and health care characteristics of adopted children, stepchildren, and adopted stepchildren. Adoption Quarterly 13(3/4): 248-267.
Bramlett, M.D., Radel, L.F. & Blumberg, S.J. (2007). The health and well-being of adopted children.Pediatrics, 119(S1): S54-S60.
Centers for Disease Control and Prevention, National Center for Health Statistics, State and Local Area Integrated Telephone Survey (2013). 2011-2012 National Survey of Children’s Health Frequently Asked Questions. April 2013. Available from URL: http://www.cdc.gov/nchs/slaits/nsch.htm
Dube, S.R., Anda, R.F., Felitti, V.J., Chapman, D.P., Williamson, D.F., and Giles, W.H. (2001). Childhood abuse, household dysfunction, and the risk of attempted suicide throughout the lifespan: findings from the adverse childhood experiences study. Journal of the American Medical Association, 286(24):3089-3096.
Dube, S.R., Felitti, V.J., Dong, M., Chapman, D.P., Giles, W.H., & Anda, R.F. (2003). Childhood abuse, neglect, and household dysfunction and the risk of illicit drug abuse: the adverse childhood experiences study. Pediatrics, 111(3): 564-572.
Dunifon, R. (2009). Single parenthood and child well-being: Trends, theories, and evidence. Pp. 93-113 in Marriage and Family: Perspectives and Complexities. (Peters, H.E. & Dush, C.M.K., Eds.) New York, NY: Columbia University Press.
Ehrle, J., & Geen, R. (2002). Children cared for by relatives: What services do they need? New Federalism: National Survey of America’s Families, No. B-47. Washington, D.C.: The Urban Institute. Retrieved from http://www.urban.org/uploadedPDF/310511_B47.pdf.
Felitti, V.J., Anda, R.F., Nordenberg, D., Williamson, D.F., Spitz, A.M., Edwards, V., Koss, M.P., & Marks, J.S. (1998). Relationship of childhood abuse and household dysfunction to many of the leading causes of death in adults. The Adverse Childhood Experiences Study. American Journal of Preventive Medicine, 14(4):245-258.
Fomby, P., & Cherlin, A. J. (2007). Family instability and child well-being. American Sociological Review, 72(2): 181-204.
Gleeson, J.P., & Seryak, C.M. (2010). ‘I made some mistakes . . . but I love them dearly:’ The views of parents of children in informal kinship care. Child and Family Social Work, 15(1), 87-96.
Hynes, K. & Dunifon, R. (2007). Children in no-parent households: The continuity of arrangements and the composition of households. Children and Youth Services Review, 29(7), 912-932.
Kreider, R.M., & Ellis, R. (2011). Living arrangements of children: 2009. Household Economic Studies, No. P70-126. Washington, DC: U.S. Census Bureau. Retrieved from http://www.census.gov/prod/2011pubs/p70-126.pdf.
Minkler, M., & Fuller-Thomson, E. (1999). The health of grandparents raising grandchildren: Results of a national study. American Journal of Public Health, 89(9), 1384-1389.
O’Connor, K.S., Bramlett M.D., George, J.M., Ormson, A.E. et al. (forthcoming). Design and Operation
of the National Survey of Children’s Health, 2011-2012. National Center for Health Statistics.
Vital Health Stat 1.
Research Triangle Institute (2008). SUDAAN Language Manual, Release 10.0. Research
Triangle Park, NC: Research Triangle Institute.
Swingle, J. (1999). The Characteristics of Mothers Separated from a Young Child. Joint Center for Policy Research Working Paper. Retrieved from http://www.ipr.northwestern.edu/jcpr/workingpapers/wpfiles/swingle.PDF.
U.S. Census Bureau. (2011). Table C9. Children/1 by Presence and Type of Parent(s), Race, and Hispanic Origin/2: 2011. Retrieved from http://www.census.gov/population/socdemo/hh-fam/cps2011/tabC9-all.xls.
U.S. Department of Health and Human Services (DHHS), Health Services and Resources
Administration, Maternal and Child Health Bureau (2009). The Health and Well-Being of
Children: A Portrait of States and the Nation 2007. Rockville, MD: US DHHS, 2009.
Available online at: http://mchb.hrsa.gov/nsch/07main/
Vandivere, S., Yrausquin, A., Allen, T., Malm, K., and McKlindon, A. (2012). Children in Nonparental Care: A Review of the Literature and Analysis of Data Gaps. Washington, DC: U.S. Department of Health and Human Services, Office of the Assistant Secretary for Planning and Evaluation.
Table 1: Child Demographic Characteristics and Sample Size by Caregiver Type
|
Characteristic | Caregiver Type in the Household | ||
|
Two Biological Parents | One Biological Parent, no step or adoptive parents | No biological, step or adoptive parents | |
|
| Mean (Standard error) | ||
| Mean Age (years) | 8.0 (0.05) | 9.0 (0.08)* | 10.1 (0.21)*± |
|
| Percent (standard error) | ||
| Gender: Male | 51.1 (0.45) | 51.5 (0.82) | 48.7 (1.93) |
| Female | 48.9 (0.45) | 48.5 (0.82) | 51.3 (1.93) |
|
|
|
|
|
| Race/ethnicity: Hispanic, any race | 23.8 (0.47) | 25.7 (0.84)* | 18.3 (1.84)*± |
| Non-Hispanic White, single race | 58.3 (0.47) | 38.1 (0.75)* | 36.2 (1.77)* |
| Non-Hispanic Black, single race | 7.5 (0.24) | 27.2 (0.71)* | 35.3 (1.92)*± |
| Non-Hispanic Other, single or multiple race | 10.4 (0.29) | 9.0 (0.44)* | 10.2 (1.02) |
|
|
|
|
|
| Census Region: Northeast | 17.5 (0.24) | 15.6 (0.50)* | 11.5 (1.14)*± |
| Midwest | 21.3 (0.24) | 21.5 (0.53) | 20.9 (1.38) |
| South | 35.3 (0.36) | 41.7 (0.76)* | 51.1 (1.92)*± |
| West | 26.0 (0.39) | 21.3 (0.78)* | 16.4 (1.66)*± |
|
|
|
|
|
| Child Born in the United States | 95.8 (0.22) | 97.2 (0.29)* | 96.9 (0.92) |
| Household Primary Language is English | 82.1 (0.43) | 86.2 (0.68)* | 94.3 (1.05)*± |
|
| Count | ||
| Unweighted Sample Size | 63,776 | 17,752 | 3,617 |
| Weighted Population Size1 | 46,502,000 | 16,311,000 | 2,290,000 |
|
|
|
|
|
Data source: National Survey of Children’s Health 2011-2012; 1Rounded to thousands; *Estimate differs at 0.05 level from that of Two Biological Parents; ±Estimate differs at 0.05 level from that of One Biological Parent.
Table 2: Household Income and Program Participation by Caregiver Type
|
Characteristic | Caregiver Type in the Household | ||
|
Two Biological Parents | One Biological Parent, no step or adoptive parents | No biological, step or adoptive parents | |
|
| Percent (standard error) | ||
| Household (HH) income relative to Federal Poverty Level (FPL): 0-50% FPL |
5.8 (0.25) |
20.4 (0.71)* |
17.8 (1.76)* |
| 50-100% FPL | 9.7 (0.32) | 21.2 (0.71)* | 17.9 (1.45)* |
| 100-200% FPL | 19.8 (0.41) | 25.2 (0.70)* | 27.3 (1.70)* |
| 200-400% FPL | 30.2 (0.41) | 20.8 (0.71)* | 23.9 (1.64)* |
| 400% FPL and up | 34.5 (0.41) | 12.4 (0.57)* | 13.0 (1.53)* |
|
|
|
|
|
| Anyone in HH Receives TANF1 benefits | 4.0 (0.23) | 15.1 (0.61)* | 23.1 (1.73)*± |
|
|
|
|
|
| Anyone in HH Receives SNAP2 benefits | 16.4 (0.38) | 50.0 (0.83)* | 37.8 (1.93)*± |
|
|
|
|
|
| Anyone in HH Receives WIC3 benefits | 12.5 (0.36) | 20.0 (0.70)* | 12.4 (1.41)± |
|
|
|
|
|
| Any Child in HH Receives Free or Reduced-Price Lunch | 24.4 (0.45) | 54.8 (0.82)* | 57.8 (1.98)* |
|
|
|
|
|
Data source: National Survey of Children’s Health 2011-2012; *Estimate differs at 0.05 level from that of Two Biological Parents; ±Estimate differs at 0.05 level from that of One Biological Parent. 1TANF is Temporary Assistance for Needy Families; 2SNAP is Supplemental Nutrition Assistance Program; 3WIC is Women, Infants and Children.
Table 3: Child’s Physical and Mental Health Characteristics and Health Insurance Coverage by Caregiver Type
|
Characteristic (age is 0-17 unless otherwise noted) | Caregiver Type in the Household | ||
|
Two Biological Parents | One Biological Parent, no step or adoptive parents | No biological, step or adoptive parents | |
|
| Percent (standard error) | ||
| Overall Health is excellent/very good | 86.3 (0.36) | 79.5 (0.70)* | 76.9 (1.48)* |
| Overall Dental Health is excellent/very good | 75.0 (0.45) | 64.5 (0.82)* | 60.1 (1.88)*± |
|
|
|
|
|
| Missed >10 school days for illness or injury in previous year (6-17) | 5.0 (0.27) | 8.6 (0.56)* | 7.6 (1.18)* |
|
|
|
|
|
| Has special health care needs | 15.8 (0.31) | 24.5 (0.69)* | 32.3 (1.82)*± |
|
|
|
|
|
| Has depression/anxiety (2-17) | 2.7 (0.15) | 6.0 (0.39)* | 9.5 (1.08)*± |
|
|
|
|
|
| Has ADHD (2-17) 1 | 5.3 (0.22) | 9.7 (0.47)* | 15.0 (1.18)*± |
|
|
|
|
|
| Has behavior/conduct problems (2-17) | 1.4 (0.13) | 5.1 (0.37)* | 9.8 (1.03)*± |
|
|
|
|
|
| Received mental health care in previous year (2-17) | 5.8 (0.24) | 13.5 (0.56)* | 19.5 (1.46)*± |
|
|
|
|
|
| Child is currently insured | 94.8 (0.24) | 94.0 (0.43) | 93.6 (1.08) |
|
|
|
|
|
| Child’s Insurance Type: Public | 26.7 (0.44) | 59.4 (0.81)* | 74.2 (1.74)*± |
| Nonpublic | 68.1 (0.46) | 34.5 (0.78)* | 19.1 (1.51)*± |
| No insurance | 5.3 (0.24) | 6.1 (0.44) | 6.7 (1.11) |
|
|
|
|
|
Data source: National Survey of Children’s Health 2011-2012; *Estimate differs at 0.05 level from that of Two Biological Parents; ± Estimate differs at 0.05 level from that of One Biological Parent. 1ADHD is Attention-Deficit/Hyperactivity Disorder.
Table 4: Child Academic Characteristics by Caregiver Type
|
Characteristic (age is 6-17 unless otherwise noted) | Caregiver Type in the Household | ||
|
Two Biological Parents | One Biological Parent, no step or adoptive parents | No biological, step or adoptive parents | |
|
| Percent (standard error) | ||
| Type of School: Public | 85.4 (0.36) | 91.5 (0.55)* | 92.6 (1.35)* |
| Private | 11.8 (0.32) | 6.7 (0.49)* | 4.9 (0.84)* |
| Home-schooled/not enrolled | 2.9 (0.16) | 1.8 (0.27)* | 2.6 (1.11)§ |
|
|
|
|
|
| Has repeated any grade(s) | 5.5 (0.29) | 13.9 (0.68)* | 17.9 (1.73)*± |
|
|
|
|
|
| Is engaged in school | 86.1 (0.38) | 73.7 (0.86)* | 69.1 (1.95)*± |
| Does all homework | 91.5 (0.31) | 81.8 (0.73)* | 76.7 (1.73)*± |
| Cares about school | 90.3 (0.31) | 81.5 (0.77)* | 77.5 (1.81)*± |
|
|
|
|
|
| Has IFSP(3-5) or IEP( 6-17) 1 | 7.1 (0.22) | 12.0 (0.51)* | 14.7 (1.18)*± |
|
|
|
|
|
| Parents/guardians ever contacted about school problems |
25.4 (0.52) |
40.5 (0.98)* |
43.9 (2.09)* |
|
| Mean (standard error) | ||
| Mean number of times contacted | 0.9 (0.04) | 2.3 (0.13)* | 2.2 (0.18)* |
|
|
|
|
|
Data source: National Survey of Children’s Health 2011-2012; *Estimate differs at 0.05 level from that of Two Biological Parents; ± Estimate differs at 0.05 level from that of One Biological Parent. 1IFSP/IEP is Individualized Family Service Plan/Individualized Education Plan. § indicates unreliable estimate (relative standard error >0.3).
Table 5: Caregiver and Neighborhood Characteristics by Caregiver Type
|
Characteristic (age is 0-17 unless otherwise noted) | Caregiver Type in the Household | ||
|
Two Biological Parents | One Biological Parent, no step or adoptive parents | No biological, step or adoptive parents | |
|
| Percent (standard error) | ||
| Caregiver Born in the United States | 74.8 (0.45) | 82.6 (0.70)* | 90.9 (1.26)*± |
|
|
|
|
|
| Excellent/very good Overall Health1 | 68.1 (0.44) | 49.1 (0.82)* | 45.7 (1.95)* |
| Excellent/very good Mental Health1 | 76.6 (0.41) | 58.4 (0.82)* | 60.9 (1.91)* |
|
|
|
|
|
| Child & caregiver can talk, share ideas very well (6-17) |
72.4 (0.51) |
70.3 (0.91)* |
65.7 (1.98)*± |
|
|
|
|
|
| Caregiver usually feels stress | 8.8 (0.29) | 15.8 (0.61)* | 15.5 (1.21)* |
| Caregiver copes very well with parenting | 62.0 (0.44) | 58.2 (0.81)* | 61.6 (1.87) |
| Caregiver has someone to turn to for help | 90.8 (0.30) | 79.1 (0.72)* | 83.6 (1.43)*± |
|
|
|
|
|
| Neighborhood is safe & supportive | 78.7 (0.41) | 64.6 (0.81)* | 74.4 (1.64)*± |
|
|
|
|
|
Data source: National Survey of Children’s Health 2011-2012; *Estimate differs at 0.05 level from that of Two Biological Parents; ± Estimate differs at 0.05 level from that of One Biological Parent; 1assessed for the NSCH respondent.
Table 6: Child’s History of Adverse Family Experiences by Caregiver Type
|
Characteristic | Caregiver Type in the Household | ||
|
Two Biological Parents | One Biological Parent, no step or adoptive parents | No biological, step or adoptive parents | |
|
| Percent (standard error) | ||
| Often hard for household to afford basics | 20.0 (0.39) | 38.9 (0.80)* | 33.0 (1.87)*± |
|
|
|
|
|
| Child ever experienced racial discrimination | 2.8 (0.16) | 5.7 (0.37)* | 5.5 (0.83)* |
|
|
|
|
|
| Ever experienced death of caregiver | 0.4 (0.05) | 6.6 (0.36)* | 18.1 (1.63)*± |
|
|
|
|
|
| Ever experienced separation/divorce | 2.2 (0.15) | 47.9 (0.82)* | 47.7 (1.97)* |
|
|
|
|
|
| Ever witnessed caregiver violence | 1.9 (0.14) | 15.3 (0.63)* | 29.2 (1.83)*± |
|
|
|
|
|
| Ever witnessed neighborhood violence | 3.9 (0.17) | 16.2 (0.64)* | 24.8 (1.61)*± |
|
|
|
|
|
| Ever lived with mentally ill caregiver | 4.7 (0.19) | 13.6 (0.51)* | 24.4 (1.71)*± |
|
|
|
|
|
| Ever experienced caregiver incarceration | 1.9 (0.14) | 13.3 (0.56)* | 33.5 (1.88)*± |
|
|
|
|
|
| Ever lived with anyone with alcohol/drug problem | 4.0 (0.19) | 18.9 (0.65)* | 42.2 (1.92)*± |
|
|
|
|
|
Data source: National Survey of Children’s Health 2011-2012; *Estimate differs at 0.05 level from that of Two Biological Parents; ± Estimate differs at 0.05 level from that of One Biological Parent.
[1] The NSCH sample includes children living in households only. Foster children who lived in group homes or institutions were outside of the NSCH sampling frame, and thus are not represented in the study.
[2] In order to simplify the tables that appear at the end of this document, subgroup analyses have not been included. In most cases subgroups did not differ substantially from one another, but some notable exceptions are described in the text. Detailed tables with subgroups are available upon request from the authors (laura.radel@hhs.gov).
[3] A more detailed analysis of the adverse family experiences by caregiver subgroups is included in a forthcoming report from NCHS (Bramlett and Radel, forthcoming).