
Kristen M. Kiefer, MPP
Lauren Harris-Kojetin, PhD
Diane Brannon, PhD
Teta Barry, PhD
Joseph Vasey, PhD
Michael Lepore, PhD Candidate
Institute for the Future of Aging Services
This report was prepared under contract #HHS-100-01-0025 between the U.S. Department of Health and Human Services, Office of the Assistant Secretary for Planning and Evaluation, Office of Disability, Aging and Long-Term Care Policy and the Institute for the Future of Aging Services. Additional funding was provided by the Office of the Assistant Secretary for Policy, U.S. Department of Labor. For additional information about this subject, you can visit the DALTCP home page at http://aspe.hhs.gov/daltcp/home.shtml or contact the ASPE Project Officer, Emily Rosenoff, at HHS/ASPE/DALTCP, Room 424E, H.H. Humphrey Building, 200 Independence Avenue, S.W., Washington, D.C. 20201. Her e-mail address is: Emily.Rosenoff@hhs.gov.
Additional information can also be found at the OASP home page at http://www.dol.gov/asp/welcome.html or contact the OASP Project Officer, Stephanie Swirsky, at DOL/OASP, Suite S-2312, 200 Constitution Avenue, N.W. Washington, D.C. 20210. Her e-mail address is: Swirsky.Stephanie@DOL.GOV.
This report was prepared under contract #HHS-100-01-0025 between the U.S. Department of Health and Human Services, the U.S. Department of Labor, and the Institute for the Future of Aging Services (IFAS). The views expressed are those of the authors and should not be attributed to the Federal Government, to IFAS or its funders.
TABLE OF CONTENTS
- CHAPTER 1. INTRODUCTION AND PURPOSE OF GOAL
- Background
- Key Terminology
- Scope and Purpose of the Guide
- Overview of Guide
- CHAPTER 2. HOW THIS GUIDE CAN HELP ORGANIZATIONS USE INFORMATION TO ADDRESS THE CHALLENGES OF JOB RETENTION AND PERFORMANCE AMONG DCWS
- Why Organizations Might Use this Guide
- Potential Uses for Data Obtained through Instrument Use
- Examples of Measurement Use in LTC
- CHAPTER 3. READY TO USE INSTRUMENTS
- Criteria for Inclusion of Instruments
- Types of Instruments Included in this Guide
- Caveats about the Instruments in this Chapter
- Differences Between Chapter 3 and Appendix F
- How the Instruments in this Chapter are Organized
- Summary Chart for Instruments
- Instruments Which Use Data Organizations May Already Collect
- Instruments Which Require New Data Collection -- Measures of DCW Job Characteristics
- Instruments Which Require New Data Collection -- Measures of the Organization
- APPENDICES (also available as separate PDF files)
- APPENDIX A: From Start to Finish -- Sample Scenarios of Using and/or Constructing Survey Instruments (PDF File)
- APPENDIX B: Overview Charts of Chapter 3 Measures, By Topic (PDF File)
- APPENDIX C: Data Collection Planning and Implementation Issues (PDF File)
- APPENDIX D: Resources for Providers Considering Use of Employee Surveys (PDF File)
- APPENDIX E: Individual Measures from Chapter 3 that Use Survey Instruments to Collect Data, By Topic (PDF File)
- APPENDIX F: Ready Made Multi-Topic Survey Instruments (PDF File)
- APPENDIX G: Instruments Needing Work (PDF File)
- APPENDIX H: Guide Reviewers (PDF File)
- LIST OF INSTRUMENTS
- READY TO USE INSTRUMENTS (Chapter 3)
- Instruments Which Use Data Organizations May Already Collect
- Injuries and Illnesses
- Bureau of Labor Statistics (BLS) Instrument for Illnesses and Injuries
- Retention
- Leon, et al. Retention Instrument
- Remsburg, Armacost, and Bennett Retention Instrument
- Turnover
- Annual Short Turnover Survey of North Carolina Department of Health and Human Services’ Office of Long Term Care
- Eaton Instrument for Measuring Turnover
- Price and Mueller Instrument for Measuring Turnover
- Vacancies
- Job Openings and Labor Turnover Survey (JOLT)
- Job Vacancy Survey (JVS)
- Leon, et al. Job Vacancies Instrument
- Injuries and Illnesses
- Instruments Which Require New Data Collection -- Measures of DCW Job Characteristics
- Empowerment
- Conditions for Work Effectiveness Questionnaire (CWEQ I) and (CWEQ II Short Form) (3 of 6 subscales)
- Perception of Empowerment Instrument (PEI)
- Psychological Empowerment Instrument
- Yeatts and Cready Dimensions of Empowerment Measure
- Job Design
- Job Characteristics Scales (JCS) of the Job Diagnostic Survey (JDS) Revised (4 of 5 subscales)
- Job Role Quality Questionnaire (JRQ)
- Job Satisfaction
- Benjamin Rose Nurse Assistant Job Satisfaction Scale
- General Job Satisfaction Scale (GJS, from the Job Diagnostic Survey or JDS)
- Grau Job Satisfaction Scale
- Job Satisfaction Survey©
- Single Item Measures of Job Satisfaction
- Visual Analog Satisfaction Scale (VAS)
- Organizational Commitment
- Intent to Turnover Measure (from the Michigan Organizational Assessment Questionnaire or MOAQ)
- Organizational Commitment Questionnaire (OCQ)
- Worker-Client/Resident Relationships
- Stress/Burden Scale from the California Homecare Workers Outcomes Survey (2 of 6 subscales)
- Worker-Supervisor Relationships
- Benjamin Rose Relationship with Supervisor Scale
- Charge Nurse Support Scale
- LEAP Leadership Behaviors and Organizational Climate Survey (1 of 2 subscales, Leadership)
- Supervision Subscales of the Job Role Quality Questionnaire (JRQ) (2 of 11 subscales)
- Workload
- Quantitative Workload Scale from the Quality of Employment Survey
- Role Overload Scale (from the Michigan Organizational Assessment Questionnaire or MOAQ)
- Stress/Burden Scale from the Califronai Homecare Workers Outcomes Survey (4 of 6 subscales)
- Empowerment
- Instruments Which Require New Data Collection -- Measures of the Organization
- Organizational Culture
- LEAP Leadership Behaviors and Organizational Climate Survey (1 of 2 subscales, Organizational Climate)
- LEAP Organizational Learning Readiness Survey
- Nursing Home Adaptation of the Competing Values Framework (CVF) Organizational Culture Assessment
- Organizational Culture
- READY MADE MULTI-TOPIC SURVEY INSTRUMENTS (Appendix F)
- Better Jobs Better Care Survey of Direct Care Workers
- National Nursing Assistant Survey (NNAS) Nursing Assistant Questionnaire
- INSTRUMENTS NEEDING WORK (Appendix G)
- Instruments Which Require New Data Collection -- Measures of DCW Job Characteristics
- Empowerment
- Conditions for Work Effectiveness Questionnaire (CWEQ I) and (CWEQ II Short Form) (3 of 6 subscales)
- Reciprocal Empowerment Scale (RES)
- Job Design
- Job Characteristics Scales (JCS) of the Job Diagnostic Survey (JDS) Revised (1 of 5 subscales)
- Job Satisfaction
- Abridged Job Descriptive Index (aJDI) Facet Scales
- Minnesota Satisfaction Questionnaire (MSQ) (Short Form)
- Misener Nurse Practitioner Satisfaction Scale
- Peer-to-Peer Work Relationships
- Satisfaction with Co-Workers Subscale of the abridged Job Descriptive Index (aJDI) (1 of 5 subscales)
- Worker-Supervisor Relationships
- External Satisfaction (ES) Subscale from the Minnesota Satisfaction Questionnaire
- Satisfaction with Co-Workers Subscale of the abridged Job Descriptive Index (aJDI) (1 of 5 subscales)
- Empowerment
- Instruments Which Require New Data Collection -- Measures of the Organization
- Organizational Culture
- Nursing Home Adaptation of the Organizational Culture Profile (OCP)
- Organizational Structure
- Communication and Leadership Subscales of the Nursing Home Adaptation of the Shortell Organization and Management Survey
- Organizational Culture
ACKNOWLEDGMENTS
Several IFAS staff contributed significantly to the content, format, and production of this Guide: Trish Hampton, Executive Assistant; Debra Lipson, MHSA, Deputy Director, Better Jobs Better Care; Nancy Mosely, Administrative Assistant, Better Jobs Better Care; Kristen Santaromita, MHA, Research Assistant; and Robyn I. Stone, DrPH, Executive Director.
IFAS project staff would like to thank our project officers, Andreas Frank (Office of the Assistant Secretary for Planning and Evaluation, U.S. Department of Health and Human Services) and Stephanie Swirsky (Office of Policy, U.S. Department of Labor) for their careful, thoughtful, and valuable review and comments on this Guide.
IFAS staff would also like to thank the Key Informants and Technical Expert Panel (TEP) members for their insightful comments and suggestions throughout this process. Appendix H contains a list of Key Informants and TEP members.
Special thanks to Judith Braun, RN, PhD, Director of Affiliate Services, Kendal Corporation; Farida Ejaz, PhD, LISW, Senior Research Associate, Margaret Blenkner Research Institute; Elsie Norton, MBA, Vice President, Health Services Administration, ACTS Retirement-Life Communities; and Linda Noelker, PhD, Senior Vice President, Planning and Organizational Resources, Benjamin Rose and Editor-in-Chief, The Gerontologist, for the feedback they provided throughout the Guide’s development.
IFAS staff would like to recognize representatives from provider organizations who shared their work with measuring employee experiences and outcomes in this Guide: Judith Passerini, CNHA, CAS, Deputy Secretary and Chief Operating Officer, Catholic Health Care Services; Jan Roth, SPHR, Director of Human Resources, Christian Living Campus; Julie Secviar, Senior Vice President of Strategic Resources, Franciscan Sisters of Chicago Service Corporation; and Renae Spohn, RHIA, CPHQ, Quality Improvement Department Director, Good Samaritan Society.
EXECUTIVE SUMMARY
Long-term care (LTC) providers face enormous challenges each day trying to provide high quality care to clients. One of the biggest challenges is staff retention among direct care workers (DCWs) -- the nursing assistants, personal care attendants and home health aides who provide hands-on care to clients.
High turnover rates among DCWs are costly. Both the direct costs (recruiting, training new employees, hiring temporary staff) and indirect costs (reduced productivity, deterioration in organizational culture and morale) associated with turnover can compromise the quality and continuity of residents’ care.1
While doing nothing about turnover can be costly, doing something that does not address the real causes of turnover in an organization can also be expensive and frustrating. Surveys and research show that employees’ feelings about various aspects of their jobs affect their commitment, overall job satisfaction, and the likelihood that they will remain with their employer (Kuokkanen & Katajisto; 2003; Laschinger, Finegan, & Shamian, 2001; Burke, 2003).
Employee surveys can help pinpoint what may improve staff satisfaction. They can help identify the key drivers of staff satisfaction, which can differ in each organization. They can quickly tell managers whether it is best to focus on supervision, skill development, or advancement opportunities. Quantitative findings from surveys or records-based data are a nice complement to qualitative data organizations often collect through focus groups or in-depth interviews with employees.
While there are some standard questions that organizations may regularly ask employees, most organizations have unique cultures or goals that influence the types of questions that should be asked of employees. Each organization’s workforce goals, such as improved retention or enhanced skills in providing care, may determine which survey instruments are best.
This Guide was developed to help providers devise appropriate surveys for measuring DCWs’ opinions about their jobs. This Guide can help organizations:
- Understand the importance of accurate measurement to guiding effective DCW retention efforts
- Develop a measurement plan to target DCW retention strategies
- Become a more informed user of survey-based and records-based data for monitoring and improving the work environment.
Benefits of the Guide
While this Guide may be helpful to many audiences -- providers, state agencies, workforce development groups, worker groups and researchers -- it is intended for providers in institutional, home care and other residential settings. Many different types of providers may find this Guide useful. Some may already be surveying employees using an in-house research center or an outside data collection vendor, but wish to enhance or supplement them in a number of areas. Others may not be conducting employee opinion surveys yet and want to know more before jumping in.
For providers already using measurement
If organizations are already conducting surveys or measuring turnover or retention rates in a systematic way, this Guide can provide additional ways to supplement workforce measurement efforts. This Guide provides a wealth of measures in 12 topic areas that have proven reliability and validity and are free of charge. Reliability is the degree to which an instrument can produce consistent results on different occasions. Validity is the degree to which an instrument measures what it is supposed to measure (CDC, 2002).
Chapter 3 provides definitions of the topic areas included in this Guide. It includes measures for each topic area that organizations may use to enhance the effort and resources already dedicated to using worker outcomes and experiences to inform organizational decisions.
For providers interested in measurement who would like more information
If organizations are not yet conducting surveys but are interested in learning more about how to do it, this Guide can help them understand the many ways that investing in measurement of outcomes could be beneficial. Chapter 2 provides examples of how other LTC providers use information collected from measurement instruments in a meaningful way. Measurement can help organizations make informed decisions about things that may specifically help given particular circumstances. For example, if an organization has noticed a lag in the energy levels of direct care staff, management may want to understand the cause. Do they feel monotony in their daily tasks? Do they feel their workload is too heavy?
For those concerned that they don’t have the knowledge or skills to measure staff outcomes or survey employees, this Guide might make it easier to specify needs and concerns if an organization decides to engage local researchers or become a consumer of vendor services. It will also give basic tools to help administer surveys and/or participate in the data collection process with their guidance. Appendix C provides detailed information on issues to think about and discuss with researchers or consultants when planning and implementing a data collection and analysis process. Chapter 3 provides descriptions of the topic areas, measures and subscales organizations may consider using to address the issues most relevant to them.
Uses of the Guide
Employee opinion and outcome measurement can be done in different ways, depending on the purpose of the survey. Organizations might choose to use this Guide for certain purposes:
- Measure a single topic of interest using one of the instruments in Chapter 3
- Construct a multi-topic survey instrument, either with or without assistance of researchers/consultants, using several of the instruments in Chapter 3
- Gain access to existing survey instruments that encompass many topics in Appendix F
Measure a single topic of interest
For organizations that would like to understand how employees feel about a specific part of their job (e.g., the organizational culture, or perceptions of their job design, or their relationship with clients/residents), the use of a single measure might best meet this need. For example, if an organization recently implemented a participatory team approach where CNAs have input into a resident’s care plan, it can measure CNAs’ perceptions of the way their jobs are designed and find out if they have improved. Before implementation, a survey can establish a “baseline” of CNAs’ feelings and subsequent surveys can be conducted after implementation at a specific time (e.g., 6 months or 12 months after implementation). In this case, the topic area titled “Job Design” in this Guide may help the organization identify measures that could capture CNAs’ feelings. In Appendix A, a scenario is provided of how a nursing home may use this Guide to measure a single topic of interest (based on its organizational needs).
Construct a multi-topic survey instrument
Many organizations would find it more efficient to survey employees about numerous topics all at one time. In this case, the development of a survey instrument relevant to the organizational goals is more involved than simply using a one-dimensional measure or its subscales. A first key step is to select the topics and related measures or subscales from Chapter 3 that are most consistent with organizational goals. Next, the organization would likely opt to construct and pretest the questionnaire, develop strategies for administering it and discuss how the results will be analyzed, communicated back to staff and addressed. Many organizations have found it helpful to work with a consultant or researcher during this process. In Appendix A, a scenario of a continuing care retirement community (CCRC) that constructed its own multi-topic survey instrument is provided as an example.
Gain access to existing multi-topic survey instruments
Some organizations might prefer access to existing survey instruments that measure multiple topics. Appendix F includes two instruments that have already been developed for specific purposes and have not been tested for reliability and validity themselves, however.
Other Tools Available in the Guide
- sample scenarios for selecting and developing survey instruments
- overview charts of all measures and their properties
- discussion around data collection and analysis issues
- templates of letters to use when surveying employees
- copies of survey instruments ready for use
- additional workforce instruments that are not the focus of this Guide but may be useful
- names and affiliations of Key Informants and Technical Expert Panel members who helped develop the Guide
CHAPTER 1: INTRODUCTION AND PURPOSE OF GUIDE
Background
Measurement of long-term care direct care worker (DCW) perceptions and outcomes is a field that is in its early stages of development. The Institute for the Future of Aging Services (IFAS) has developed this Guide to help long-term care (LTC) organizations improve their use of measurement tools to understand direct care workforce problems and to inform their solutions. This Guide has been funded by the Office of the Assistant Secretary for Planning and Evaluation (ASPE) of the U.S. Department of Health and Human Services and the Office of Policy of the U.S. Department of Labor.
This Guide relies heavily on a review of existing workforce measures by researchers at The Pennsylvania State University (PSU), who assessed the utility of instruments for measuring the direct care workforce. The choice of topics and instruments included in this Guide was made jointly by PSU and IFAS teams and will be discussed in further detail in Chapter 3. The choice of instruments was also based on review and input from 24 Key Informants with expertise in analyzing and/or evaluating workforce recruitment and retention practices and who represent potential users of the Guide -- providers, worker groups, researchers, workforce development representatives, and state agencies. A Technical Expert Panel (TEP) shared ideas for further development of the Guide at a meeting in September 2003. Appendix H lists the reviewers and TEP members and their affiliations.
A draft version of the Guide was completed in November 2003. IFAS staff held a pre-conference session to introduce the Guide and its uses at the annual meeting of the American Association of Homes and Services for the Aging (AAHSA), a membership association of not-for-profit LTC providers of residential housing and services, and made a presentation to AAHSA members at their Future of Aging Services spring conference. IFAS staff also presented information on the Guide at the annual meetings of the American Society on Aging (ASA)-National Council on Aging (NCOA) and the Gerontological Society of America (GSA). Extensive feedback on content and format obtained from attendees of these meetings as well as other recipients of the draft version of the Guide informed this final version.
Key Terminology
Certain terms that are used frequently in this Guide have particular meanings. For the purpose of this Guide, direct care workers (DCWs) refer to nursing assistants (NAs), home health and home care aides, personal care workers and personal care attendants who provide hands-on care, supervision and emotional support to people with chronic illnesses and disabilities. DCWs work in a variety of settings, including nursing homes, assisted living and other residential care settings, adult day care and private homes.
Formulas refer to how information collected from administrative records will be used to create variables. Surveys and questionnaires are used interchangeably throughout the Guide when discussing worker surveys. Scales are survey components that examines specific issues related to the topic being examined. Subscales are sections of a scale that measure the concept being studied in a subscale in greater detail. Instruments or measures are general terms used to refer to both formulas and surveys.
Scope and Purpose of the Guide
The Guide is meant to serve as a starting point for measurement of LTC workforce problems and possible solutions. Providers that already survey workers or collect information on retention and turnover may find the instruments reviewed here useful for enhancing their efforts. Providers that do not yet collect information on their DCWs will learn some of the benefits and become more informed of possible ways to measure direct care workers’ experiences and behaviors. Providers can benefit by using appropriate instruments as tools to understand what their workers want and how providers are doing in keeping DCWs.
The Guide presents a collection of instruments that quantify different ways to look at worker outcomes and worker experiences through employee surveys. These instruments have been used in the real world to assess how employees feel and think about their jobs and their employer and whether they stay or leave their jobs. Instruments to measure 12 topics of greatest relevance to DCWs have been included in the Guide, many of which have been applied in acute care or LTC settings.2 Some topics that are relevant to the LTC workforce, such as absenteeism and use of temporary workers, were excluded when valid instruments for measuring them were unavailable.
While all of the instruments in the Guide have been used in work settings, in Chapter 3 we highlight ones that have been used in health care settings and with DCWs and that meet specific criteria detailed in that Chapter.3 The instruments in the Guide are generally more applicable to nursing homes than other provider settings, because few instruments to date have been developed for home and community-based care settings.
Two major types of instruments are in this Guide. One type uses formulas to calculate rates based on data that may already be collected through employment records. A second type requires the collection of new data in order to understand DCWs’ perceptions and attitudes about their jobs or the organization. This type of information is collected through survey questionnaires administered to DCWs.
This Guide is not a “how-to” manual. It will not identify the “best” instrument for every possible circumstance, nor will it tell providers how to select instruments for an organization’s specific purposes, administer surveys to DCWs, or undertake other data collection efforts. Organizations lacking staff with research experience may find it helpful to work with a local researcher, university (e.g., survey research center, nursing department, organizational studies or labor department) or data collection vendor. The Guide will not provide tips on how to build capacity in an organization to gather, analyze and use information or how to conduct evaluations of programs and practices already in place. This Guide is not a retention program in itself.
Overview of Guide
This Chapter has provided a background and outlined the purpose and scope of this Guide.
Chapter 2 discusses how organizations can benefit from using these instruments and provides examples of how others use information collected from measurement instruments in a meaningful way.
Chapter 3 reviews the workforce topics, instruments and subscales included in the Guide, how they were selected, and identifies those currently ready for use.
Appendices A through H include valuable information:
- Appendix A includes sample scenarios of how organizations might use the Guide to select and/or develop survey instruments to meet their organizational goals.
- Appendix B provides overview charts of all measures in a given topic, which compare properties (e.g., readability, reliability, validity, administration and scoring, etc.) and their relative advantages.
- Appendix C discusses issues to think about when planning and implementing a data collection and analysis process.
- Appendix D presents templates for types of letters to accompany surveys, encourage employees to partake in the survey process or thank responding employees, as well as other resources for providers considering surveying employees.
- Appendix E contains measures that use survey instruments to collect data included in Chapter 3 as separate files for use, by topic.
- Appendix F provides two multi-topic survey instruments developed for use with DCWs, but have not yet been tested for reliability and validity.
- Appendix G includes instruments that have not been used with DCWs and instruments meant to measure manager needs or experiences (which are not the focus of this Guide) that may prove useful.
- Appendix H provides the names and affiliations of Key Informants and Technical Expert Panel members who contributed significantly to the Guide’s development.
CHAPTER 2: HOW THIS GUIDE CAN HELP ORGANIZATIONS USE INFORMATION TO ADDRESS THE CHALLENGES OF JOB RETENTION AND PERFORMANCE AMONG DCWS
Why Organizations Might Use this Guide
The information organizations can gain through measurement is a tool they can use to pursue the goal of improving quality in LTC. Research has shown that administrators, supervisors and DCWs feel a large obstacle to achieving desired quality of care is the need to constantly address vacancies from staff turnover and a revolving door of new staff (Harahan et al., 2003). An Institute of Medicine report on LTC quality acknowledges that “quality of (long-term) care depends largely on the performance of the caregiving workforce” (Wunderlich, 2000). High turnover among DCWs impacts the quality of care that residents or clients receive. Continuity of care may be interrupted. Quality of care may also be affected if DCWs feel unappreciated or burned out because of having to frequently “work short.”
High turnover among DCWs also impacts employers financially. Constant turnover often requires employers to hire temporary staff which is costly (and, may affect the quality of care provided). Training new hires to replace positions that turn over is expensive, especially when employees leave within months of receiving training.
These quality and financial incentives make it is essential for LTC organizations to determine why employees are leaving and which organizational actions are necessary to create an environment where DCWs are less likely to leave. Using measurement instruments, such as those provided in this Guide, is a good way to understand an organization’s workforce and work towards establishing ways to maintain a stable and qualified workforce that provides optimal care to residents and clients.
Potential Uses for Data Obtained through Instrument Use
Measurement itself will not solve direct care workforce issues. It will, however, serve as a tool to help identify workforce problems and provide data for making informed decisions about their resolution.
There are many ways to use the data collected through measurement instruments. This Guide is not a “how to” manual for doing these things. Many providers have found it useful to work with a research organization, research consultant, local university faculty or an outside vendor to collaborate on data collection, analysis, and use of the data to inform workforce improvements. Potential uses of measurement include:
- Benchmarking
- Learning more about employees
- Determining how to make the best use of resources
- Evaluating the effect of programs and practices
- Achieving quality
- Increasing marketability
The remainder of this chapter gives examples of how measurement has been used by organizations for different purposes.
Benchmarking
Information collected can be utilized to benchmark against other providers in the area, for example. Organizations may want to see how staff turns over in relation to other providers, so they might compare turnover rates. Organizations could also use instruments to monitor their own progress over time. For example, they may measure turnover rates from year to year to determine whether they are increasing or decreasing. In order to benchmark effectively, the same instruments must be used across providers and across the same periods in time.
Learning more about employees
Measurement in LTC can also be used to learn more about DCWs. Organizations can see what makes employees happy or not. For instance, they may be able to answer the questions “are my employees happy with their jobs?” or “are my employees happy with their supervisors?” by administering a survey to DCWs. If organizations find the answer is “no,” they can find ways to make DCWs more satisfied. If an employee survey reveals that DCWs feel their job offers no opportunities for advancement, organizations may opt to implement a career ladder. They can then test (measure) whether what was developed and implemented (in this example, a career ladder) actually increased DCWs’ satisfaction.
Determining the best use of resources/Evaluating the effect of programs and practices
Data collected from worker questionnaires or administrative records can be used to evaluate workforce improvement initiatives. For example, let’s say an organization administers a survey to its DCWs and find that they feel unempowered in their jobs. In response, the organization develops and implements interdisciplinary teams where DCWs participate in care planning. If retention rates are consistently measured in the same way before and after implementation of these teams, organizations can determine whether these teams have impacted whether DCWs remain in their jobs.
Achieving quality
Measurement may allow organizations to identify areas that need improvement so they can make the appropriate organizational changes. Addressing needs and continuously making changes for improvement might help achieve continuous quality improvement (CQI).
Increasing marketability
An organization able to show that employees have remained for many years is likely to be attractive to families trying to find the best home for their loved ones. High retention among staff may also be an effective recruiting tool since it might suggest that employees are treated well and are happy with their jobs.
Examples of Measurement Use in LTC
Catholic Health Care Services (CHCS)
Since 2001, Catholic Health Care Services (CHCS) has collected, collated, studied and employed a significant amount of data and information to create a transformational model of service delivery which would "enable CHCS to recruit and retain staff who flourish while meeting the needs of those being served." As part of this larger organizational endeavor, CHCS developed a four-page, 76-question Employee Opinion Survey. Questions incorporated in the survey were either created by staff or adapted from a variety of sources. An outside data collection vendor was contracted by CHCS to provide input on how to administer the tool, disseminate the results, compile scanned surveys into practical and functional formats and to ensure to all participants the confidentiality of the entire process. In 2003, the opinion survey was provided to 1,242 staff with 994 (73 percent) responding to it.
After the process was concluded, the vendor scanned all completed surveys, returning to CHCS books of data detailing the outcomes in a variety of ways. Every facility received a book of their own data while CHCS additionally received books of data which combined the results of all completed surveys (e.g., all facilities, by departments, by functional titles and shifts). CHCS is presently sharing the outcomes with all staff in each facility while obtaining feedback, ideas and suggestions for continuing the follow-up.
Christian Living Campus (CLC)
Christian Living Campus formally surveys all employees at least every two years on issues such as leadership, working conditions and culture, compensation and benefits, supervision, training and development, work/life balance, communication and job satisfaction. CLC hires an outside data collection vendor to devise the survey instrument, process and analyze survey results and assist CLC in developing a communication plan for management to report survey results back to employees.
CLC management looks at survey results over time to compare how employees feel about working conditions from survey to survey. These data are also used to benchmark against employee opinion data of other employers in the area that are included in a database kept by the vendor. Based on these survey results, CLC management holds focus groups and develops strategic action plans.
CNA Recruitment and Retention Project -- Iowa Caregivers Association (ICA)
The Iowa Caregivers Association (ICA) managed the two-year CNA Recruitment and Retention Project, whose goal was to reduce CNA turnover by assessing the needs of DCWs in nursing facilities, and providing programs and services responsive to their needs. Interventions implemented in facilities included: (1) training in work skills (e.g., conflict resolution, team/building/communication, and clinical skills such as communicating with dying residents, caring for Alzheimer’s patients; (2) a CNA mentoring program; and, (3) support group activities. Community-based interventions included a public awareness campaign, CNA recognition programs, and CNA support groups facilitated by local community colleges.
One evaluation of the overall program compared the retention rates of nursing facilities that implemented interventions with the retention rates of facilities that did not. Those which implemented the program experienced retention rates nearly double those of facilities which did not receive the interventions.
A second evaluation of the peer mentoring program involved satisfaction surveys of participating nursing home administrators, mentors, and “mentees.” Mentors, mentees, and administrators generally felt positively about the peer mentoring program. Surveys also revealed that nursing homes did not have a plan for making use of the skills of their returning, newly trained mentors (Richardson & Graf, 2002). As a result, project staff developed a training program for administrative staff on CNA mentor program implementation.
Evangelical Lutheran Good Samaritan Society
The Evangelical Lutheran Good Samaritan Society has a Director for Quality Improvement whose department schedules and coordinates approximately 3,500 employee satisfaction surveys between an outside research firm and the Society campuses on an annual basis. Each campus administrator appoints a facilitator and schedules an all-staff meeting. The research firm mails the surveys and instructions to facilitators who administer the surveys at the all-staff meetings. After employee surveys are completed, facilitators mail them to the research firm to tabulate results.
After the most recent employee survey process, the Good Samaritan Society diagnosed three areas for improvement: communications, teamwork and supervision. The Society’s response to these issues was to enhance the supervisory curriculum. An educational series of workbooks were developed called “Leading with Spirit” to improve employee satisfaction in these areas. The Leading Spirit series is currently being completed by all management staff within the Good Samaritan Society. Results of this program’s implementation will be evaluated through future employee surveys.
Franciscan Sisters of Chicago Service Corporation’s Use of Life Services Network Employee Satisfaction Survey
The Life Services Network (LSN) -- the Illinois state affiliate of the American Association of Homes and Services for the Aging (a membership association of not-for-profit LTC providers of residential housing and services) -- developed an employee satisfaction survey for its members. The survey instrument questions employees about their satisfaction with the job and their perceptions of quality assurance in services provided, co-worker and supervisory relationships, working conditions, orientation and education, administration and pay and benefits. The survey has been used by over 75 organizations for a nominal fee and taken by more than 5,800 employees.
Franciscan Sisters of Chicago Corporation, through its senior healthcare and housing division -- Franciscan Communities -- is one LSN member that administers this survey to its workers for organizational quality improvement efforts on an annual basis. Franciscan Communities worked with LSN to customize the survey instrument to create questions unique to their circumstances and organizational goals.
Franciscan Communities developed a Task Force from among its staff which implemented structured administrative and communications strategies for the data collection and analyses processes. A strategic reporting and action planning process was also developed to insure a targeted effort is undertaken on both a system-wide and local community level to improve employee satisfaction levels. Initiatives focus on areas that employees express dissatisfaction most through these surveys, focus groups and exit interviews. Action plans are constructed and progress reports submitted on a quarterly basis to the Vice President of Operations for Franciscan Communities to monitor how initiatives are working to increase satisfaction of employees. This continuous quality improvement initiative is intended ultimately to lead to better quality of care and more satisfied consumers of LTC services.
Retention, Earnings, and Career Advancement in the Home Health Care Sector strategy -- Boston Private Industry Council (PIC), conducted as part of a U.S. Department of Labor demonstration project
The Boston PIC’s Retention, Earnings and Career Advancement in the Home Health Care Sector training strategy was designed to improve retention of newly hired home health care workers by providing a more effective orientation to the work they were expected to perform. Retention rates of trained home health care workers were calculated after the first year of this new training. An evaluation of the training program was completed by comparing the retention rates of those trained under the new program with the retention rates of hires from previous years who were not. Results showed that retention rates of trainees under the new program were 15 percent higher than those from previous measurement periods (before the training was implemented).
Data retained by the organization on client feedback found that there were fewer complaints about home health care workers that participated in the new training which suggests that the new training program had an impact on the quality of service provided to patients as well.
State Nurse Aide Registries -- How Data Are Used by States to Understand the Direct Care Workforce
Federal law requires every state to maintain a nurse aide registry that contains a list of individuals with the minimum training needed to work in skilled nursing facilities. However, only about 10 states include other types of LTC paraprofessionals in their registries, and many do not regularly update the information. States with comprehensive, up-to-date lists of all certified, licensed or registered direct care paraprofessionals can produce more accurate pictures of total supply, the extent or severity of shortages, and the adequacy of training programs’ capacity to meet demand. Such registries can also be helpful in evaluating the effectiveness of state or regional efforts to increase recruitment and retention, and allowing LTC organizations to compare their efforts to recruit, retain and train workers with averages at the state, regional or facility-type level.
North Carolina’s nurse aide registry identifies those who completed training at any time since 1990 and is updated to show active (those currently working as nursing aides) and inactive registrants. The data show, for example, that an estimated 38 percent of active registrants were not working as CNAs in 2001. Between July 2000 and June 2002, the number of newly certified nursing assistants outpaced the number of assistants becoming inactive. However, it is not clear whether this is due to an increase of CNAs committed to the occupation or to less availability of other employment in the currently depressed job market. State analysts are able to link individuals in the nurse aide registry with their earnings record, maintained on a state employment database that tracks wages paid to employees. The linked data set shows that inactive registrants earned higher wages and were more stably employed than active registrants. It also showed that the wages of CNAs working in nursing homes were relatively flat over the 10-year period, in contrast to CNAs working in hospitals who tended to have more consistent upward wage trajectories.
Kansas’ nurse aide registry includes information on all direct care professionals in all health care facilities and requires all health care employers to register their workers by a specific date each year. The state has also invested in new technology that permits an efficient interface for data sharing between state agencies. The Kansas system produces a more accurate picture of the types of workers in each health care setting and makes it easy to disseminate information to many types of users. Other states can build on existing nurse aide registries to obtain more useful information for policy and planning purposes, and for benchmarking by providers in the state.
CHAPTER 3: READY TO USE INSTRUMENTS
Criteria for Inclusion of Instruments
Specific criteria were applied to each instrument under consideration for inclusion in this Guide.
The instruments included in the Guide (in Chapter 3 and Appendix G)….
- are quantitative in nature.
- have some evidence of reliability and/or validity, when possible. At a minimum, they have solid face validity (e.g., appear on the surface to be a reasonable measure of the concept of interest).
- have already been used in (or are able to be applied to) health care or LTC settings.
The instruments in Chapter 3 also….
- are practical and applicable to DCWs in LTC.
- are free to use or available for free when used for research purposes.4
Types of Instruments Included in this Guide
Chapter 3 contains two main categories of workforce topics:
- Topics whose instruments use data organizations may already collect (i.e., use administrative records)
- Topics whose instruments require new data collection (i.e., use worker questionnaires)
There are 4 topics that use data organizations may already collect and 8 topics that require new data collection.
The following 4 topics require the use of data organizations may already collect: injuries and illnesses, retention, turnover, and vacancies.5 Instruments that use data that already may be collected are generally formulas in which calculations are made using factual information available from administrative records. Records used to calculate measures might include employee payroll records, cost reports, human resource records, employment records, or nurse aide registries. The data for some measures in this section come from surveys (also called questionnaires) completed by employer representatives (e.g., Human Resources staff, administrator). In these cases, the respondents are asked to complete the survey by using information from their employer records.
Employers can assess organizational factors that may be contributing to recruitment and retention problems by examining the feelings and perceptions of their employees. The following 8 topics require the use of newly collected information: empowerment, job design, job satisfaction, organizational commitment, organizational culture, worker-client relationships, worker-supervisor relationships, and workload.6 Instruments that require new data collection are questionnaires (also called surveys) that collect information on respondents’ attitudes and perceptions of their experiences.
Instruments for which new data are required have been divided into two groups in this Guide: (1) instruments that measure DCW job characteristics; and, (2) instruments that measure the organization. The instruments that measure DCW job characteristics are focused on DCWs specifically and assess their feelings and perceptions of various aspects of their jobs. The instruments that measure the organization are focused on employees at all levels in the organization (not just DCWs) and assess employees’ feelings and perceptions about the organization by which they are employed.
Caveats about the Instruments in this Chapter
Chapter 3 presents a collection of instruments to consider in addressing workforce issues. Here are some caveats about these instruments.
- Not all instruments are applicable for use in all LTC settings.
- Many were not developed to be used with LTC DCWs specifically and have not been tested with DCWs. Rather, many have been used with employees (e.g., usually nurses) in hospital settings.
- There is a range of reliability and validity across instruments.
- Some instruments are simply a list of questions that need to be formatted into a survey questionnaire.
- Certain instruments in this chapter are ready for immediate use, while others need minor alteration. For example, minor wording changes may be needed to make them more applicable to a certain LTC setting, such as changing the word “hospital” to “nursing home.” Or simplification of words used in questions asked of DCWs in surveys may be necessary. For these reasons, it is important to pre-test survey questionnaires with a small number of DCWs. This will provide a sense of whether the content and wording of questions in a survey are appropriate for DCWs or whether readability levels of the questions need to be adapted to be used with them.
Differences Between Chapter 3 and Appendix G
Certain subscales in some instruments are not applicable to the nature of DCWs’ jobs so they have been included in Appendix G. It is important that, when using a subscale, all subscale questions are asked of DCWs because scoring, reliability and validity have been done on a subscale level. An example of a two-item subscale is the Recognition subscale from the Job Role Quality Questionnaire, where respondents are asked to rate the extent these two items are rewarding parts of their jobs (on a scale of 1 (not at all) to 4 (extremely)):
- The recognition you get
- The appreciation you get
The remainder of Chapter 3 introduces instruments and subscales of instruments that are currently ready (or nearly ready) for use. Appendix G includes instruments and subscales that require adaptation before they are ready for use and/or charge a fee for use. As mentioned, these instruments include the subscales considered irrelevant to DCWs, but that may be fruitful for future development and adaptation for use with DCWs. For two topics in this Guide -- organizational structure and peer-to-peer work relationships -- none of the instruments are considered ready for use because they are not geared towards DCWs and/or because they have associated costs. Therefore, the extant instruments and subscales we identified for these topics have been included only in Appendix G.
How the Instruments in this Chapter are Organized
The instruments and subscales in this Chapter were chosen because they are ready (or nearly ready) for providers to “take off the shelf” and apply in their settings, as appropriate. These instruments require no sophisticated software for scoring. Surveys (questionnaires) for which slight modification in wording (either through changing words to reflect the appropriate setting type or wording simplification for DCWs) were selected based on the fact that these alterations would enhance, not compromise (or change the meaning of) the instrument being used. Readability levels for surveys included in this Chapter appeared to be reasonable for DCWs, based on face validity and feedback from contributors to this Guide. Subscales of instruments that are relevant to DCWs are also included in this Chapter.
Each of the topics in Chapter 3 includes two main sections:
- An introduction describing the topic and its relation to the DCW workforce; and,
- A summary chart of the alternative instruments or subscales, where appropriate. These charts include a detailed description of the instrument or subscale. Survey item/instrument wording (for instruments that use surveys to gather information) follow these charts.
Overview charts for the instruments that use data already collected using information contained in records may differ from those based on administering surveys to collect information. These instruments are usually formulas calculated using information from employment records and do not contain subscales. When this is the case, a description and survey questionnaire are not included because they are not applicable. In a few cases where these instruments are based on a survey, descriptions of instruments are included.
Summary Chart for Instruments
As mentioned, a summary chart is included for each instrument or subscale. These charts contain information on the following features: description, measure, administration, scoring, availability, reliability and validity, and relevant contact information. An overview chart describing these features for instruments that use data already collected and for instruments that require new data collection is included on the two next pages.
Appendix B provides overview charts for all measures in a given topic if organizations are interested in making cross-comparisons as they decide which measure may be best to use for their purposes.
| Overview of Features in Summary Chart for Each Instrument | ||
|---|---|---|
| Topics whose instruments use data organizations may already collect (Based on administrative records or surveys completed by employer representatives) | Topics whose instruments require new data collection (Based on surveys, questionnaires of workers) | |
| Description | Provides a brief description of the formula or survey instrument being discussed. | |
| Measure | Proposed formula or way to calculate a measure | Name of questionnaire and its subscale labels Subscale: A subscale usually contains multiple survey items intended to measure the same aspect or dimension of a topic (e.g., autonomy is a subscale of 5 items measuring one aspect of empowerment). |
| Administration | Specifies data source to be used. Data to make calculations for measures may come from sources such as: Employee payroll records Cost reports Human resource records Employment records Nurse aide registries Surveys of administrators or nurse aides | Survey administration (1) Whether survey is meant to be conducted using paper and pencil or in-person interviews and/or whether the survey can be adapted for administration in either way (2) Length of time required to complete the survey (3) Number of questions in the survey (4) The types of response scales given to people taking the survey, such as: 1=strongly disagree, 2=disagree, 3=not sure, 4=agree, and 5=strongly agree Readability = the reading level of the survey instrument |
| Scoring | Scoring = the method used to tally survey results or to make calculations (1) Whether scoring can be computed by hand, by using software, or either way (2) Method used for scoring of measure; range of possible scores (low – high) (3) Meaning of scores (what a low score indicates, what a high score indicates) | |
| Availability | Which category the instrument falls into for use: (1) Free (2) Free with permission from author -- email author to request permission to use (3) Fee or costs associated with use | |
| Reliability | To date, there is little evidence available on the reliability of the records-based measures. Reliability for these measures is designated as N/A. | Reliability Internal consistency (Cronbach's Alpha) = a measure of how well a set of items measures a single one dimensional construct consistently on different occasions For example, internal consistency might measure how well a set of questions measures job satisfaction. Internal consistency scores range from 0-1. A score of internal consistency that is .7 or higher shows that a measure is reliable. |
| Validity | To date, there is little evidence available on validity other than face validity for records-based measures. Validity for these measures is designated as N/A. | Validity = how close what is being measured is to what was intended to be measured. Answers the question "did you measure what you were supposed to measure?" Validity measure scores range from 0-1. The closer that the validity measure is to 1, the more valid the measure. There are multiple types of validity. The charts in this topic show the types of validity available for the selected measures. Face validity = when the quality of a measure appears on the surface to be a reasonable measure of the concept of interest. For example, a group of experts may not agree on what should be included in a retention measure, but they likely would agree that retention rates in a nursing facility have implications for workforce stability. Criterion-related validity (predictive validity) = the degree to which a measure relates to or predicts something. For example, the validity of a job satisfaction measure may be determined by the quality of a worker's relationship with his or her supervisor or fellow workers. Construct validity = the degree to which logical relationships exist between items (includes convergent and discriminate validity). For example, one might assert that retention relates to empowerment and job design. If an analysis shows that this relationship exists, then the measure has construct validity. Content validity = the degree to which a measure covers the range of meanings included in the concept. For example, a test of employee empowerment would not be limited to access to opportunity alone, but would also need to include support, information and resources (and so forth) in an individual's work setting. |
| Contact Information | Provides relevant contact information for more information on the formula or instrument being discussed. | |
Instruments Which Use Data Organizations May Already Collect
Injuries and Illnesses
Introduction
Definition of Injuries and Illnesses
Occupational injuries and illnesses are those which occur as a result of an individual completing the tasks required of them in their job. Nursing aides, orderlies, and attendants rate second highest among occupations experiencing the most injuries and illnesses. They have some of the highest lost-worktime injuries and illnesses days away from work. In 2002, 79,000 injuries and illnesses requiring days away from work were reported among this occupational category (BLS, 2004). For example, DCWs in LTC often suffer from the strain and repetitive stress injuries that result from lifting or repositioning residents or clients.
Overview of Selected Instruments for Injuries and Illnesses
One instrument included in this Guide calculates injuries and illnesses:
- Bureau of Labor Statistics (BLS) Instrument for Injuries and Illnesses
Issues to Consider When Selecting Instruments of Injuries and Illnesses
- Incidence rates cannot be calculated if worker’s compensation data (as opposed to the number of reportable injuries) are being used because it is not possible to obtain data on the denominator (hours worked) from worker’s compensation databases.
Alternatives for Measuring Injuries and Illnesses
Bureau of Labor Statistics (BLS) Instrument for Injuries and Illnesses
| Bureau of Labor Statistics (BLS) Instrument for Injuries and Illnesses | ||
|---|---|---|
| Description | This instrument calculates injuries and illnesses as “incidence rates” as used by the Bureau of Labor Statistics. The incidence rate is the number of nonfatal injuries and illnesses for the year divided by the number of all employee hours worked for the year. The numerator can be calculated by counting the number of recordable cases of occupational injuries and illnesses for the year, as reported from the Occupational Safety and Health’s (OSHA) Log and Summary of Occupational Illnesses and Injuries. This form is required of employers covered by the Occupational Safety and Health (OSH) Act, except for those with ten or fewer employees. The 200,000 hours in the formula represents the equivalent of 100 employees working 40 hours per week, 50 weeks per year, and provides the standard base for incidence rates. The denominator can be determined through payroll or other time records. | |
| Measure | Number of nonfatal injuries and illnesses X 200,000 Number of all employee hours worked (not including non-work time, such as vacation, sick leave, holidays, etc.) | |
| Administration | Data collected from employers via survey and payroll records. | |
| Scoring | Can be scored by hand. | |
| Availability | Free. | |
| Reliability | N/A | |
| Validity | N/A | |
| Contact Information | Not needed for use of this instrument. | |
Survey Items
The instrument for injuries presented here uses a formula calculated using data from various sources; therefore, no survey instrument is included here.
Retention
Introduction
Definition of Retention
Retention generally refers to the number of employees who remain at their job within an organization over time. Worker retention rates measure the proportion of staff that has been employed in an organization over a specified period of time. Other measures of retention include tenure or length of stay.
Overview of Selected Instruments for Retention
Two instruments for staff retention rates have been included here. These instruments were taken from published literature on retention among nurse aides (sources to be discussed under “alternatives for measuring retention” section) and identify two main concepts in the measurement of retention. Both examine the number of staff employed for a specified period of time relative to the total number of employees in an organization. One measure also looks at retention as length of service or tenure of both terminated employees and employees that remain.7
- Leon, et al. Retention Instrument
- Remsburg, Armacost, and Bennett Retention Instrument
Issues to Consider When Selecting Instruments for Retention
- While retention rates are often thought of as the reciprocal of turnover, having high turnover does not necessarily mean low retention. For example, an organization with a high annual turnover rate may also maintain a large proportion of their staff for the year, suggesting that terminations are concentrated within a few positions. Therefore, when assessing the stability of an organization, it is important to look at both turnover and retention rates. This is especially true for LTC organizations, where discontinuity of paraprofessional nursing staff may adversely affect the quality of care (Wunderlich et al., 1996).
- Time periods used in measuring retention rates differ so comparisons of retention rates across organizations must be made with caution. For example, some have assessed retention rates for one year, while others have measured two, three, or even ten-year retention rates.
- Retention rates may include the entire workforce or specific subgroups. Subgroups for measuring retention might include employees who remain with the organization, yet have been promoted to another position (career ladders), or newly hired employees who have remained at the organization for a specified period of time. Consideration of subgroups might be of interest in LTC where new hires often leave their positions after only a few short months of employment or during the initial orientation period (Bowers & Becker, 1992; Pillemer, 1997).
- In measuring both turnover and retention of DCWs, it is often more difficult to assess rates of home care workers due to the nature of employment. According to Feldman et al., distinctions between stayers and leavers in the home care industry are not always clear (1990). Home aides can refuse work for several weeks or even for several pay periods without actually resigning. Furthermore, aides may declare a leave of absence from which they do not return.
Alternatives for Measuring Retention
Leon, et al. Retention Instrument
| Leon, et al. Retention Instrument | ||
|---|---|---|
| Description | Retention data were collected in a statewide study of LTC organizations in Pennsylvania (Leon et al., 2001). As part of a telephone interview, LTC administrators were asked to report the number of DCWs that have been with them for specific periods of time (less than one year, 3 or more years, 10 or more years) and the total number of DCWs. The retention rate for the organization was calculated as the percentage of DCWs who worked for a certain time period (less than one year, 3 or more years, 10 or more years) divided by the total number of DCWs at the time of the telephone interview. | |
| Measure | # of nurse aides employed for less than one year total # employees at time of survey # of nurse aides employed for 3 years or more # of nurse aides employed for ten years or more | |
| Administration | Data collected from nursing home administrator via survey. | |
| Scoring | Can be scored by hand. | |
| Availability | Free. | |
| Reliability | N/A | |
| Validity | N/A | |
| Contact Information | Not needed for use of this instrument. | |
Survey Items
The instrument for retention presented here uses a formula calculated using data from various sources; therefore, no survey instrument is included here.
Remsburg, Armacost, and Bennett Retention Instrument
| Remsburg, Armacost, and Bennett Retention Instrument | ||
|---|---|---|
| Description | In their research, Remsburg and colleagues refer to retention rates as “stability rates” and measure them in two ways. Annual retention rates were calculated for a study of a 255-bed LTC facility as the number of nurse aides (NAs) employed for more than one year divided by the number of employees on the payroll on the last day of the fiscal year. In addition, Remsburg, et al, looked at retention by calculating the length of service for terminated employees and employees who remained. | |
| Measure | # of nurse aides employed for more than one year # of nurse aides on payroll on the last day of the fiscal year length of service for terminated employees and staff who remained | |
| Administration | Data collected from human resource records. | |
| Scoring | Can be scored by hand. | |
| Availability | Free. | |
| Reliability | N/A | |
| Validity | N/A | |
| Contact Information | Not needed for use of this instrument. | |
Survey Items
The instrument for retention presented here uses a formula calculated using data from various sources; therefore, no survey instrument is included here.
Turnover
Introduction
Definition of Turnover
Many references to employee turnover refer to the termination of employment, which can be voluntary or involuntary. The turnover of positions within an organization might also occur through promotions or transfers.
Overview of Selected Measures of Turnover
Three main ways to measure turnover have been included here. These measures were taken from published and unpublished literature on employee turnover (sources to be discussed under “alternatives for measuring turnover” section). These instruments include valuable information that is important when measuring turnover among LTC organizations. One instrument provides a way to consistently collect turnover information for employees across the long-term care continuum (e.g., nurse aides, personal care aides, and/or home management aides, etc.). The others provide more precise ways of measuring turnover among LTC organizations than are used by most. These three measures are described in more detail in the remainder of this section.8
- Annual Short Turnover Survey of North Carolina Department of Health and Human Services’ Office of Long Term Care
- Eaton Instrument for Measuring Turnover
- Price and Mueller Instrument for Measuring Turnover
Issues to Consider When Selecting Measures of Turnover
- There is debate about the usefulness of distinguishing between voluntary and involuntary turnover. Some argue that, no matter the reason for people leaving positions (e.g., moving to a different state or being fired), there is still turnover within an organization. Others find this distinction is important because it might be useful for suggesting different management responses. For instance, if employees are being terminated due to a lack of proficiency in the job (e.g., involuntary turnover), there may be a training issue that needs to be addressed.
- Variation among reference periods may test the accuracy of some instruments. Instruments for turnover over a 12-month period, for example, may be preferable to a 6-month period in that they may capture more movement of employees in and out of the organization over time.
- The rate has no precise meaning. For example, one cannot tell from a high separation rate whether it is due to the same position turning over many times or many positions each turning over one time. These two different ways of producing a high quit rate can have different implications for the work environment and workload of employees who stay.
- Use of cost reports prohibits the distinction between voluntary and involuntary turnover which may provide useful information.
- While not reflected in the turnover rate, it may be beneficial to also count the number of times the same position turns over.
- The rate does not account for the stability of the employees. High turnover rates among a few positions may be appropriate if the organization maintains a stable core of employees despite the rate.
- Payroll records must be used with caution. Issues that need to be addressed when using payroll records to compute a quit rate include (Price & Mueller, 1986;1991):
- Members of governing boards may appear on payroll records and should be deleted.
- Women who marry may change their names -- these changes should be documented.
- Some employees quit and are rehired between the two periods of measurement -- these employees should be located and considered “stayers.”
- Individuals who go on “leaves of absence” should be labeled as such and remain in the employee pool, even if they are not on the payroll for the specified time period.
- “Temporary” workers should be identified and not be included in the turnover rate.
Alternatives for Measuring Turnover
Annual Short Turnover Survey of North Carolina Department of Health and Human Services’ Office of Long Term Care
| Annual Short Turnover Survey of North Carolina Department of Health and Human Services’ Office of Long Term Care | ||
|---|---|---|
| Description | In North Carolina, the Annual Short Turnover Survey is included by the North Carolina Department of Health and Human Services as an insert with the licensure renewal application for the state’s licensed LTC facilities. The Annual Short Survey measures turnover as a “separation rate.” The separation rate is calculated as the total number of full-time and part-time staff who leave an organization either voluntarily (“quits”) or involuntarily (“fires”) divided by the total number of employees (both part-time and full-time) needed for the organization to be considered fully staffed. | |
| Measure | Total Separation = FT voluntary terminations + PT voluntary terminations + FT involuntary terminations + PT involuntary termination # needed to be completely staffed by FT and PT staff Voluntary separation = Involuntary separation rate = | |
| Administration | Data collected from employee payroll records. | |
| Scoring | Can be scored by hand. | |
| Availability | Free. | |
| Reliability | N/A | |
| Validity | N/A | |
| Contact Information | Not needed for use of this instrument. | |
Survey Items
The instrument for turnover presented here uses a formula calculated using data from various sources; therefore, no survey instrument is included here.
Eaton Instrument for Measuring Turnover (1997)
| Eaton Instrument for Measuring Turnover (1997) | ||
|---|---|---|
| Description | Eaton measured turnover of LTC employees as the number of newly hired employees in a certain category (e.g., registered nurses, licensed practical nurses, nurse aides) divided by the number of employees in that category over a 12-month period. For example, if an organization had employed 50 nurse aides during the year and had hired 20 over the course of the year, the turnover rate would be 40 percent (e.g., 20/50). Use of a rate is readily understandable when expressed in percentages. Use of the same reference period enhances accuracy of the measure. | |
| Measure | # full-time new hires over 12 months average # staff employed in that category over 12 months # part-time new hires over 12 months | |
| Administration | Data collected from Medicaid cost reports. | |
| Scoring | Can be scored by hand. | |
| Availability | Free. | |
| Reliability | N/A | |
| Validity | N/A | |
| Contact Information | Not needed for use of this instrument. | |
Survey Items
The instrument for turnover presented here uses a formula calculated using data from various sources; therefore, no survey instrument is included here.
Price and Mueller Instrument for Measuring Turnover (1986; 1981)
| Price and Mueller Instrument for Measuring Turnover (1986; 1981) | ||
|---|---|---|
| Description | Price and Mueller measure turnover as a “quit rate.” The quit rate is computed as the number of employees who leave voluntarily during a period divided by the number employed at the beginning of that period. The quit rate is relatively easy to compute. While it may take some attention to obtain the list of voluntary terminations, it is generally not a problem to obtain the average number of employees during the time period. The quit rate is readily understandable when expressed in percentages; (e.g. a 50-percent rate is higher than a 25-percent rate). The quit rate is widely, but not exclusively, used in LTC organizations. | |
| Measure | Total # employed at Time 1 - # still employed at 12-month follow-up + involuntary terminations (“voluntary terminations”) Total # employed at Time 1 | |
| Administration | Data collected from employee payroll records. | |
| Scoring | Can be scored by hand. | |
| Availability | Free. | |
| Reliability | N/A | |
| Validity | N/A | |
| Contact Information | Not needed for use of this instrument. | |
Survey Items
The instrument for turnover presented here uses a formula calculated using data from various sources; therefore, no survey instrument is included here.
Vacancies
Introduction
Definition of Vacancies
Vacancies refer to job openings for which employers are seeking employees. Vacancies are the most commonly cited indicator of labor shortages when measuring the demand for labor. A large number of vacant positions, relative to some expected level of vacancies, is often considered as evidence of a labor shortage (Institute of Medicine, 1989).
Overview of Selected Instruments for Vacancies
Three instruments for vacancies have been included here.
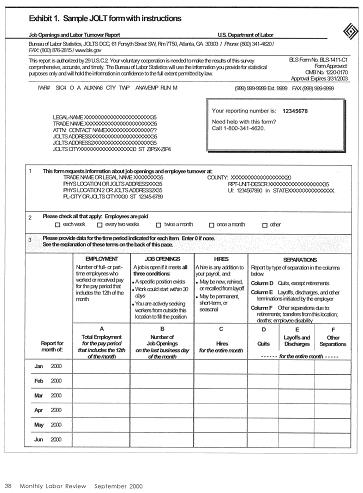
- Job Openings and Labor Turnover Survey (JOLTS)
- Job Vacancy Survey (JVS)
- Leon, et al. Vacancies Instrument
The JOLTS is a federal-level instrument which measures job openings, hires and separations in business and government. The JVS is a state-level instrument which has been used by several states (CO, LA, MN, OK, TX, and WI) to assess state labor market conditions. The Leon, et al Vacancies Instrument has measured vacancies to understand the extent of recruitment and retention problems from a provider’s perspective.
All three measures calculate vacancies as rates. While they share the same numerators, the denominators used to calculate these rates differ. The JOLTS and JVS calculate vacancy rates in a similar manner, but the JVS provides vacancy data by certain occupations and industry and supplies additional details about the specific positions that are available. The vacancy rate instrument used by Leon, et al uses a different denominator (full-time equivalents) than the JOLTS or JVS and has been used specifically in LTC settings.9
Issues to Consider When Selecting Instruments for Vacancies
- Vacancy rates should be interpreted with caution because high vacancy rates may not necessarily represent a labor shortage, but rather a labor “imbalance.” For example, if wages are kept below the level that would balance supply and demand of workers, then employer demand will surpass the number of individuals who are willing to work at that wage. Thus, the reported vacancy rates may not reflect a worker shortage per se, but may be the result of organizational or industry characteristics that contribute to the difficulty in recruiting for vacant positions. In contrast, low vacancy rates may simply be the result of a high availability of workers due to factors such as a recession.
- The use of vacancies with other indicators of labor demand, such as turnover, would provide a more accurate picture of the need for employees within the industry. There are always some vacancies in a particular job due to employee turnover and higher vacancy rates occur in occupations that experience the highest turnover (Institute of Medicine, 1989).
- Calculating rates for both full-time and part-time positions may provide a more accurate picture of employer demand by more specifically defining the types of vacancies that are present. Although the total number of positions within the organization may not collected as part of the original survey, a question asking the respondent to report a total number of full and part-time positions, respectively, can be added. This could be used to determine the vacancy rates for full and part-time positions rather than an overall vacancy rate using the number of employees as the denominator.
Alternatives for Measuring Vacancies
Job Openings and Labor Turnover Survey (JOLTS)
| Job Openings and Labor Turnover Survey (JOLTS) | ||
|---|---|---|
| Description | Introduced in 2001, the JOLTS collects counts of job openings on a monthly basis using the last business day of the month as the reference point. While using the middle of the month was considered in order to remain consistent with other JOLTS data, the pilot study revealed that job vacancies were not always available at that time (Levin et al., 2000). The goal of JOLTS is to produce monthly measures of unmet labor demand in the form of rates and numbers of job openings. For a job to be considered “open,” three conditions must apply:
| |
| Measure | # job openings on last day of month total # employed for pay period that includes the 12th of the month (for full-time or part-time) | |
| Administration | Data collected from human resources records via survey. | |
| Scoring | Can be scored by hand. | |
| Availability | Free. | |
| Reliability | N/A | |
| Validity | N/A | |
| Contact Information | Not needed for use of this instrument. | |
Survey Items
Job Vacancy Survey (JVS)
| Job Vacancy Survey (JVS) | ||
|---|---|---|
| Description | The Job Vacancy Survey (JVS) produces vacancy statistics as a measure of employer demand for workers within states and local communities. The Bureau of Labor Statistics (BLS), the Employment and Training Administration, and State Labor Market Information Offices collaborated to produce the JVS. The JVS was created in order to obtain reliable information on job vacancies that can be used in concert with other labor statistics to assess the health of state and local labor markets. From the survey, job vacancy rates are calculated as the total number of vacancies reported divided by the total number of employees in the organization at a single point in time. In addition to determining job vacancy rates in certain occupations and industries, the survey provides an analysis of the characteristics of these vacancies, including wages and benefits, educational requirements, full versus part-time positions and length of time a position has been vacant (see “survey items” below). The additional information included in the questionnaire regarding characteristics of vacant jobs provides important supplemental information on reported vacancies. | |
| Measure | # job openings total # employed OR total # positions | |
| Administration | Data collected from human resources records via survey. No time frame specified for when to make calculation. | |
| Scoring | Can be scored by hand or by using purchased software. | |
| Availability | Free. | |
| Reliability | N/A | |
| Validity | N/A | |
| Contact Information | Not needed for use of this instrument. | |
Survey Items
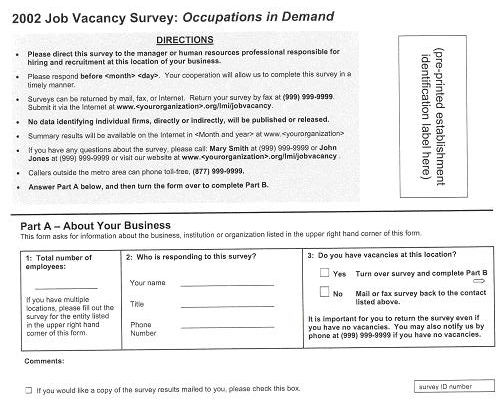
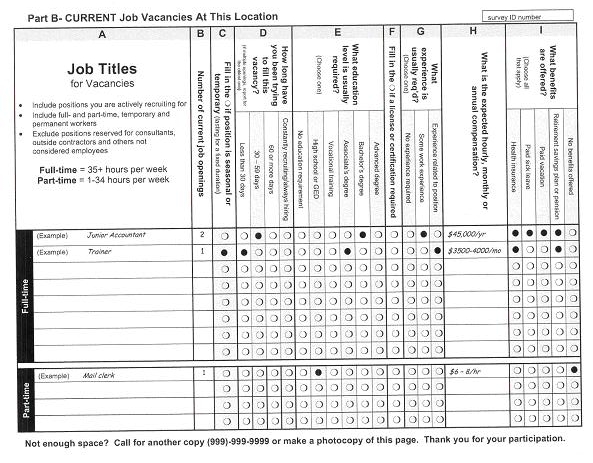
Survey Items
Leon, et al. Job Vacancies Instrument
| Leon, et al. Job Vacancies Instrument | ||
|---|---|---|
| Description | Job vacancy data were collected in a statewide study of LTC organizations in Pennsylvania (Leon et al., 2001). As part of a telephone interview, LTC administrators were asked to report the number of full time equivalents (FTEs) and the number of vacant positions on the day of the interview. The job vacancy rate for the organization was calculated as the percentage of vacant jobs over all jobs. Further, vacancy rates were categorized as low (rates greater than 0 but less than 10%), moderate (rates between 10 and 20%) and high (rates greater than 20%). | |
| Measure | # job openings total number of FTE positions on the day of the interview | |
| Administration | Data collected from human resources records via survey. | |
| Scoring | Can be scored by hand. | |
| Availability | Free. | |
| Reliability | N/A | |
| Validity | N/A | |
| Contact Information | Not needed for use of this instrument. | |
Survey Items
2. How many full-time equivalent [WORKER] positions do you currently have at your [PROVIDER]? Please count a full-time [WORKER] as one person and a 20-hour per week [WORKER] as half a person. For example, if you had two people working 20 hours each, that would be one full time equivalent.
________ # OF POSITIONS
6. How many job openings for [WORKERS] do you currently have?
_______ # OF OPENINGS
Instruments Which Require New Data Collection -- Measures of DCW Job Characteristics
Empowerment
Introduction
Definition of Empowerment
Much has been written about empowerment at three different levels: individual/ psychological, sociological, and management/organizational. The focus here is on the management/organizational perspective.
Empowerment is often explained as the delegation of authority and decentralization of decision-making. However, when empowerment is more broadly defined, it speaks to the ability of management to create a working environment that shapes an individual’s perceptions of his or her work role in a way that motivates positive work behavior (Conger & Kanungo, 1988). This broader definition of empowerment includes workers’ perceptions of the meaning of their job to them, their sense of competence in the job, how much self-determination they believe they have in the job, and how much impact they believe they have in their job (Thomas & Velthouse, 1990).
Studies have found that nurses in hospitals who feel more empowered have higher job satisfaction, more commitment to their employer, and are less likely to voluntarily quit (Kuokkanen & Katajisto, 2003; Larrabee et al., 2003; Radice, 1994; Laschinger, Finegan, & Shamian, 2001).
Measuring worker empowerment in the workplace can help managers to identify and remove conditions in the organization that foster powerlessness and provide structural processes that foster empowerment.
Overview of Selected Measures of Empowerment
The five instruments reviewed here measure multiple dimensions of empowerment.
- Conditions for Work Effectiveness Questionnaire (CWEQ I) and (CWEQ II Short Form) (3 of 6 subscales)
- Perception of Empowerment Instrument (PEI)
- Psychological Empowerment Instrument
- Yeatts and Cready Dimensions of Empowerment Measure
Issues to Consider When Selecting Measures of Empowerment
- Some survey items in the reviewed instruments may need to be simplified for DCWs or modified to be more applicable to DCWs than to nurses or other professionals (for which the instruments were initially developed).
Alternatives for Measuring Empowerment
Conditions for Work Effectiveness Questionnaire (CWEQ I) and (CWEQ II Short Form) (3 of 6 subscales)10
| Conditions for Work Effectiveness Questionnaire (CWEQ I) and (CWEQ II Short Form) (3 of 6 subscales)10 | ||
|---|---|---|
| Description | The Conditions for Work Effectiveness Questionnaire (CWEQ- I) is a 31-item questionnaire designed to measure the four empowerment dimensions -- perceived access to opportunity, support, information and resources in an individual’s work setting -- based on Kanter’s ethnographic study of work empowerment (Kanter, 1977; Laschinger, 1996). Opportunity refers to opportunities for growth and movement within the organization as well as opportunity to increase knowledge and skills. Support relates to the allowance of risk taking and autonomy in making decisions. Information refers to having information regarding organizational goals and policy changes. Resources involve having the ability to mobilize resources needed to get the job done. Access to these empowerment structures is facilitated by: (1) formal power characteristics such as flexibility, adaptability, creativity associated with discretionary decision-making, visibility, and centrality to organizational purpose and goals; and (2) informal power characteristics derived from social connections, and the development of communication and information channels with sponsors, peers, subordinates, and cross-functional groups. Chandler adapted the CWEQ from Kanter’s earlier work to be used in a nursing population (1986). The CWEQ-II a modification of the original CWEQ, consists of 19 items across 6 subscales (three for each of Kanter’s empowerment structures, 3 for the Formal Power (JAS) measure and 4 for the Informal Power (ORS) measure) (Laschinger, Finegan, Shamian, & Wilk, 2001). Because the CWEQ II is shorter to administer while still having comparable readability and measurement properties, only the CWEQ II survey items are provided. The CWEQ II has been studied and used frequently in nursing research since 2000 and has shown consistent reliability and validity. The University of Western Ontario Workplace Empowerment Research Program has been working with and revising the original CWEQ and CWEQ-II in nursing populations for over 10 years. | |
| Measure | Subscales (3 of 6 subscales) (1) Opportunity (2) Support (3) Formal Power | |
| Administration | Survey Administration (1) Paper and pencil (2) 10 to 15 minutes for entire scale (3) 19 questions for entire scale (4) 5-point Likert scale (none to a lot; no knowledge to know a lot; strongly disagree to strongly agree) Readability | |
| Scoring | (1) Simple calculations. (2) Total empowerment score = Sum of 6 subscales (Range 6 – 30). Subscale mean scores are obtained by summing and averaging items (range 1-5). (3) Higher scores indicate higher perceptions of empowerment. | |
| Availability | Free with permission from the author. | |
| Reliability | Cronbach alpha reliabilities for the CWEQ-II ranges from 0.79 to 0.82, and 0.71 to 0.90 for the subscales. | |
| Validity |
| |
| Contact Information | Permission to use this instrument can be obtained on-line at http://publish.uwo.ca/~hkl/ or by contacting: Heather Spence Laschinger, PhD University of Western Ontario School of Nursing London, Ontario, Canada N6A 5C1 (519) 661-4065 hkl@uwo.ca | |
Survey Items
Key to Which Questions Fall into Which Subscales
O = Opportunity subscale (3 items)
S = Support subscale (3 items)
FP = Formal Power subscale (4 items)
| None | Some | A Lot | |||||
|---|---|---|---|---|---|---|---|
| O | 1. | Challenging work. | 1 | 2 | 3 | 4 | 5 |
| O | 2. | The chance to gain new skills and knowledge on the job. | 1 | 2 | 3 | 4 | 5 |
| O | 3. | Tasks that use all of your own skills and knowledge. | 1 | 2 | 3 | 4 | 5 |
| None | Some | A Lot | |||||
|---|---|---|---|---|---|---|---|
| S | 1. | Specific information about things you do well. | 1 | 2 | 3 | 4 | 5 |
| S | 2. | Specific comments about things you could improve. | 1 | 2 | 3 | 4 | 5 |
| S | 3. | Helpful hints or problem solving advice. | 1 | 2 | 3 | 4 | 5 |
| None | Some | A Lot | |||||
|---|---|---|---|---|---|---|---|
| FP | 1. | the rewards for innovation on the job are | 1 | 2 | 3 | 4 | 5 |
| FP | 2. | the amount of flexibility in my job is | 1 | 2 | 3 | 4 | 5 |
| FP | 3. | the amount of visibility of my work-related activities within the institution is | 1 | 2 | 3 | 4 | 5 |
Perception of Empowerment Instrument (PEI)
| Perception of Empowerment Instrument (PEI) | ||
|---|---|---|
| Description | The Perception of Empowerment Instrument measures three dimensions of empowerment -- autonomy, participation, and responsibility. Autonomy refers to an individual’s perception of the level of freedom and personal control that he or she possesses and is able to exercise in performing job tasks. Participation measures perceptions of influence in producing job outcomes and the degree to which employees feel they have input into organizational goals and processes. Responsibility measures the psychological investment an individual feels toward his/her job and the commitment he/she brings to the job. | |
| Measure | Subscales (1) Autonomy (2) Responsibility (3) Participation | |
| Administration | Survey Administration (1) Paper and pencil (2) 5-10 minutes (3) 15 questions (4) 5-point Likert scale (strongly agree to strongly disagree) Readability | |
| Scoring | (1) Simple calculations. (2) Subscale score = Sum of items on the subscale (Range 4 – 30, depending on subscale) (3) Higher scores indicate higher perceptions of empowerment. | |
| Availability | Free with permission from the author. | |
| Reliability | Internal consistency ranges from .80 to .87 for the subscales. | |
| Validity | Criterion-related validity reported as .82; however, specific criterion used is unclear. | |
| Contact Information | This instrument can be obtained on-line. Permission to use it can be obtained by contacting: W. Kirk Roller, Ph.D. 1515 Jefferson Davis Highway #1405 Arlington, VA 22202 (703) 416-6618 kroller225@aol.com | |
Survey Items
Key to Which Questions Fall into Which Subscales
A = Autonomy subscale (5 items)
R = Responsibility subscale (4 items)
P = Participation subscale (6 items)
Provide your reaction to each of the following by putting a number from the scale below in the column to the right of the statement.
5 = Strongly Agree
4 = Agree
3 = Neutral
2 = Disagree
1 = Strongly Disagree
| ITEM # | ITEM | RESPONSE | |
|---|---|---|---|
| A | 1 | I have the freedom to decide how to do my job. | |
| P | 2 | I am often involved when changes are planned. | |
| A | 3 | I can be creative in finding solutions to problems on the job. | |
| P | 4 | I am involved in determining organizational goals. | |
| R | 5 | I am responsible for the results of my decisions. | |
| P | 6 | My input is solicited in planning changes. | |
| R | 7 | I take responsibility for what I do. | |
| R | 8 | I am responsible for the outcomes of my actions. | |
| A | 9 | I have a lot of autonomy in my job. | |
| R | 10 | I am personally responsible for the work I do. | |
| P | 11 | I am involved in decisions that affect me on the job. | |
| A | 12 | I make my own decisions about how to do my work. | |
| A | 13 | I am my own boss most of the time. | |
| P | 14 | I am involved in creating our vision of the future. | |
| P | 15 | My ideas and inputs are valued at work. |
Psychological Empowerment Instrument
| Psychological Empowerment Instrument | ||
|---|---|---|
| Description | The Psychological Empowerment Instrument was designed to measure the four dimensions of empowerment based on Thomas and Velthouse’s definition -- meaning, competence, self-determination, and impact (1990). Meaning refers to the value of the work goals or purposes; it involves a fit between values, beliefs and behaviors and the work role. Competence is a reflection of an individual’s self-efficacy or one’s belief in his/her capability of performing work tasks. Self-determination involves believing that one has a choice in initiating actions in the workplace. Impact is the degree to which an employee can influence the outcomes of the organization. | |
| Measure | Subscales (1) Meaning (2) Competence (3) Self-Determination (4) Impact | |
| Administration | Survey Administration (1) Paper and pencil (2) 5-10 minutes (3) 12 questions (4) 7-point Likert scale (very strongly agree to very strongly disagree) Readability | |
| Scoring | (1) Simple calculations. (2) Subscale score = Sum of items on the subscale (Range 3 – 21) Total scale score = Average of subscale scores (Range 3 – 21) (3) Higher scores indicate higher perceptions of empowerment. | |
| Availability | Free if used for research or non-commercial use with permission from the author. | |
| Reliability | Internal consistency ranges from .62 to .74 for the total scale and from .79 to .85 for the subscales. | |
| Validity | Criterion-related validity:
| |
| Contact Information | Permission to use it can be obtained by contacting: Gretchen Spreitzer Department of Organizational Behavior and HRM University of Michigan 701 Tappan Street Room A2144 Ann Arbor, MI 48109 (734) 936-2835 spreitze@bus.umich.edu | |
Survey Items
Key to Which Questions Fall into Which Subscales
M = Meaning subscale (3 items)
C = Competence subscale (3 items)
S = Self-determination subscale (3 items)
I = Impact (3 items)
7-point response scale, ranging from very strongly agree to very strongly disagree
M 1. The work I do is meaningful.
M 2. The work I do is very important to me.
M 3. My job activities are personally meaningful to me.
C 1. I am confident about my ability to do my job.
C 2. I am self-assured about my capability to perform my work.
C 3. I have mastered the skills necessary for my job.
S 1. I have significant autonomy in determining how I do my job.
S 2. I can decide on my own how to go about doing my work.
S 3. I have considerable opportunity for independence and freedom in how I do my job.
I 1. My impact on what happens in my department is large.
I 2. I have a great deal of control over what happens in my department.
I 3. I have significant influence over what happens in my department.
Yeatts and Cready Dimensions of Empowerment Measure
| Yeatts and Cready Dimensions of Empowerment Measure | ||
|---|---|---|
| Description | Yeatts and colleagues at the University of North Texas are currently conducting an evaluation of 10 nursing homes in the Dallas-Fort Worth metropolitan area to assess whether self-managed work teams (SMWTs) result in reduced turnover and absenteeism and improved performance among CNAs. SMWTs were designed to empower CNAs, improve their job satisfaction, and improve resident care. The teams consist of CNAs who work together daily with the same residents, identify clinical or work areas needing improvement and share decision-making about how to accomplish their tasks (Yeatts et al., 2004). As part of this research, Yeatts and Cready developed a 26-item questionnaire designed to measure five empowerment dimensions -- ability to make workplace decisions, ability to modify the work, perception that management listens to CNAs, perception that management consults CNAs, and global empowerment (Yeatts et al., 2004). Global empowerment encompasses employees’ perceptions of competence, the meaningfulness of their work, the impact of their work and autonomy. This measure has been pretested in seven nursing homes with 207 CNAs. | |
| Measure | Subscale (1) Ability to make workplace decisions (2) Ability to modify the work (3) Management listens seriously to CNAs (4) Management consults CNAs (5) Global empowerment | |
| Administration | Survey Administration (1) Paper and pencil (2) 20 to 30 minutes (3) 26 questions (4) 5-point Likert scale (disagree strongly to agree strongly) Readability | |
| Scoring | (1) Simple calculations. (2) Total scale score = Sum of subscale scores, after reverse coding the one negatively worded item (Range 26 – 130) (3) Higher scores indicate higher perceptions of empowerment. | |
| Availability | Free with permission from the author. | |
| Reliability | Internal consistency ranges from .63 to .80 for the subscales. (It should be noted that the survey data are still in the process of being collected from 3 nursing homes, and additional reliability testing will be conducted in future phases of the research project.) | |
| Validity | No published information is available. | |
| Contact Information | Permission to use this instrument is available by contacting: Dale Yeatts, PhD Professor Department of Sociology University of North Texas (940) 565-2000 Yeatts@unt.edu | |
Survey Items
Key to Which Questions Fall into Which Subscales*
WD = Ability to Make Workplace Decisions subscale (7 items)
WP = Ability to Modify the Work subscale (3 items)
ML = Management Listens Seriously to CNAs subscale (6 items)
MC = Management Consults CNAs subscale (3 items)
GE = Global Empowerment subscale (8 items)
* The total number of items adds up to 27 because one item is asked in two subscales.
Please use the following scale to answer the questions below:
1 = Disagree strongly
2 = Disagree
3 = Neutral
4 = Agree
5 = Agree strongly
| Disagree Strongly | Neutral | Agree Strongly | |||||
|---|---|---|---|---|---|---|---|
| WD | 1. | The nurse aides decide who will do what each day. | 1 | 2 | 3 | 4 | 5 |
| WD | 2. | The nurse aides provide information that is used in a resident’s care plan. | 1 | 2 | 3 | 4 | 5 |
| WD | 3. | The nurse aides decide the procedures for getting residents to the dining room. | 1 | 2 | 3 | 4 | 5 |
| WD | 4. | I am allowed to make my own decisions. | 1 | 2 | 3 | 4 | 5 |
| WD | 5. | I make many decisions on my own. | 1 | 2 | 3 | 4 | 5 |
| WD | 6. | I work with the management staff in making decisions about my work. | 1 | 2 | 3 | 4 | 5 |
| WD | 7. | CNAs work with the management staff in making decisions about CNA work. | 1 | 2 | 3 | 4 | 5 |
| Disagree Strongly | Neutral | Agree Strongly | |||||
|---|---|---|---|---|---|---|---|
| WP | 1. | I sometimes provide new ideas at work that are used. | 1 | 2 | 3 | 4 | 5 |
| WP | 2. | I sometimes provide solutions to problems at work that are used. | 1 | 2 | 3 | 4 | 5 |
| WP | 3. | I sometimes suggest new ways for doing the work that are used. | 1 | 2 | 3 | 4 | 5 |
| Disagree Strongly | Neutral | Agree Strongly | |||||
|---|---|---|---|---|---|---|---|
| ML | 1. | The management staff (such as the DON and administrator) listen to the suggestions of CNAs. | 1 | 2 | 3 | 4 | 5 |
| ML | 2. | When CNAs make suggestions on how to do the work, charge nurses seriously consider them. | 1 | 2 | 3 | 4 | 5 |
| ML | 3. | When CNAs make suggestions, someone listens to them and gives them feedback. | 1 | 2 | 3 | 4 | 5 |
| ML | 4. | When CNAs make suggestions on how to do their work, the management staff (such as the administrator and DON) considers their suggestions seriously. | 1 | 2 | 3 | 4 | 5 |
| ML | 5. | When CNAs make suggestions, someone listens to them and gives them feedback. | 1 | 2 | 3 | 4 | 5 |
| ML | 6. | CNAs are provided reasons, when their suggestions are not used. | 1 | 2 | 3 | 4 | 5 |
| Disagree Strongly | Neutral | Agree Strongly | |||||
|---|---|---|---|---|---|---|---|
| MC | 1. | Whenever CNA work must be changed, the CNAs are usually asked how they think the work should be changed. | 1 | 2 | 3 | 4 | 5 |
| MC | 2. | The management staff asks the CNAs for their opinion, before making work related decisions. | 1 | 2 | 3 | 4 | 5 |
| MC | 3. | CNAs are asked to help make decisions about their work. | 1 | 2 | 3 | 4 | 5 |
| Disagree Strongly | Neutral | Agree Strongly | |||||
|---|---|---|---|---|---|---|---|
| GE | 1. | I do NOT have all the skills and knowledge I need to do a good job. | 1 | 2 | 3 | 4 | 5 |
| GE | 2. | I have all the skills and knowledge I need to do a good job, and I use them. | 1 | 2 | 3 | 4 | 5 |
| GE | 3. | I feel I am positively influencing other people’s lives through my work. | 1 | 2 | 3 | 4 | 5 |
| GE | 4. | I have accomplished many worthwhile (good) things in this job. | 1 | 2 | 3 | 4 | 5 |
| GE | 5. | I deal very effectively with the problems of my residents. | 1 | 2 | 3 | 4 | 5 |
| GE | 6. | I can easily create a relaxed atmosphere with my residents. | 1 | 2 | 3 | 4 | 5 |
| GE | 7. | I am allowed to make my own decisions about how I do my work. | 1 | 2 | 3 | 4 | 5 |
| GE | 8. | While at work, I make many decisions on my own or with other nurse aides. | 1 | 2 | 3 | 4 | 5 |
Job Design
Introduction
Definition of Job Design
Job design includes the characteristics of the tasks that make up a given job that influence its potential for producing motivated work behavior. Job design comes from a line of research started more than 50 years ago looking at the impact on workers of assembly-lines with highly specialized and repetitive jobs and external control over the pace of production. Job design describes perceptions of jobs by job incumbents themselves, and is distinguished from more objective job or task analysis techniques used to classify jobs for compensation systems or other human resource management functions. Job design is associated with job satisfaction, job stress, and job performance among nursing staff (Bailey, 1995; Banaszak-Holl & Hines, 1996; Streit & Brannon, 1994; Peterson & Dunnagan, 1998; Tonges, 1998; Tonges, Rothstein, & Carter, 1998).
Overview of Selected Measures of Job Design
The two major approaches to measuring job incumbents’ perceptions of job design both focus on the description of several job characteristics. They differ in terms of which characteristics are measured. Both are described in the remainder of this section.
- Job Characteristics Scales (JCS) of the Job Diagnostic Survey (JDS) Revised (4 of 5 subscales)
- Job Role Quality Questionnaire (JRQ)
Issues to Consider When Selecting Measures of Job Design
Major issues related to the use of perceptional measures of job design are:
- Since job perceptions are subjective responses to presumed objective features of work, they are likely to be moderated by individual personality differences such as the need for growth and locus of control as well as job knowledge and skill and demographic characteristics. There is strong evidence, however, that perceived job characteristics are reasonably accurate reflections of objective job design features (Fried & Ferris, 1987).
- Perceptional measures are valid for measuring variability in perceptions within similar job categories including change over time. However, they are less informative when comparing distinctly different jobs given that job incumbents have only their own experience by which to frame assessments of their job. For example, stock brokers and home health aides may both rate their work as very significant, but the comparison is not very useful.
Alternatives for Measuring Job Design
Job Characteristics Scales (JCS) of the Job Diagnostic Survey (JDS) Revised (4 of 5 subscales)11
| Job Characteristics Scales (JCS) of the Job Diagnostic Survey (JDS) Revised (4 of 5 subscales)11 | ||
|---|---|---|
| Description | The Hackman and Oldham Job Characteristics Model is the dominant model for studying the impact of job characteristics on affective work outcomes (e.g., job satisfaction, empowerment, and motivation) and to a more limited extent behavioral outcomes (e.g., performance, absenteeism, and turnover intentions) (1975, 1980). The Job Characteristics Scales (JCS) are a component of the Job Diagnostic Survey (JDS), the most widely used instrument across many types of jobs to measure perceived job characteristics. The JDS was revised in 1987 to eliminate a measurement artifact resulting from reverse-worded questionnaire items. Only the revised version should be used (Idaszak & Drasgow, 1987). The JCS contain five subscales -- skill variety, task significance, autonomy, task identity and feedback. The JCS is often combined in surveys with other measures of workers’ feelings about and satisfaction with their jobs. Hackman and Oldham recommend that it be administered during regular work hours in groups of no more than 15 respondents at a time (1980). Hackman and Oldham provide substantive guidelines for administration (1980). | |
| Measure | Subscales (4 of 5) (1) Skill variety (2) Task significance (3) Autonomy (4) Job feedback | |
| Administration | Survey Administration (1) Paper and pencil (2) 5-8 minutes (3) 12 questions (4) 7-item Likert scale (very little to very much) Readability | |
| Scoring | (1) Simple calculations. (2) Subscale score = Average of items on the subscale (Range 1 7) (3) Higher scores indicate better job design features. | |
| Availability | Free. | |
| Reliability | Internal consistency ranges from .75 to .79 for the subscales. | |
| Validity | Criterion-related validity: Job design correlates with intent to leave and is predictive of absenteeism and job satisfaction | |
| Contact Information | Not needed for use of this instrument. | |
Survey Items
Key to Which Questions Fall into Which Subscales
SV = Skill Variety subscale (3 items)
TS = Task Significance subscale (3 items)
A = Autonomy subscale (3 items)
F = Feedback from the Job Itself subscale (3 items)
On the following pages, you will find several different kinds of questions about your job. Specific instructions are given at the start of each section. Please read them carefully. It should take no more than 10 minutes to complete the entire questionnaire. Please move through it quickly.
The questions are designed to obtain your perceptions of your job. There are no trick questions. Your individual answers will be kept completely confidential. Please answer each item as honestly and frankly as possible. Thank you for your cooperation.
Section One
This part of the questionnaire asks you to describe your job listed above as objectively as you can. Try to make your description as accurate and as objective as you possibly can. Please do not use this part of the questionnaire to show us how much you like or dislike your job.
A sample question is given below.
A. To what extent does your job require you to work overtime?
| 1--- | ---2--- | ---3--- | ---4--- | ---5--- | ---6--- | ---7 |
|---|---|---|---|---|---|---|
| Very little; the job requires almost no overtime hours. | Moderately; the job requires overtime at least a week. | Very much; the job requires overtime more than once a week. | ||||
You are to circle the number which is the most accurate description of your job.
If, for example, your job requires you to work overtime two times a month -- you might circle the number six, as was done in the example above.
Survey Items
(A) 1. How much autonomy is there in the job? That is, to what extent does the job permit a person to decide on his or her own how to go about doing the work?
| 1--- | ---2--- | ---3--- | ---4--- | ---5--- | ---6--- | ---7 |
|---|---|---|---|---|---|---|
| Very little; the job gives me almost no personal “say” about deciding how and when the work is done. | Moderate autonomy; many things are standardized and not under my control but I can make some decisions about the work. | Very much; the job gives a person almost complete responsibility for deciding how and when the work is done. | ||||
(SV) 2. How much variety is there in your job? That is, to what extent does the job require you to do many different things at work, using a variety of his or her skills and talents?
| 1--- | ---2--- | ---3--- | ---4--- | ---5--- | ---6--- | ---7 |
|---|---|---|---|---|---|---|
| Very little; the job requires the person to do the same routine things over and over again. | Moderate variety | Very much; the job requires the person to do many different things, using a number of different skills and talents. | ||||
(TS) 3. In general, how significant or important is your job? That is, are the results of your work likely to significantly affect the lives or well-being of other people?
| 1--- | ---2--- | ---3--- | ---4--- | ---5--- | ---6--- | ---7 |
|---|---|---|---|---|---|---|
| Not at all significant: the outcomes of the work are not likely to affect anyone in any important way. | Moderately significant | Highly significant; the outcomes of the work can affect other people in very important ways. | ||||
(F) 4. To what extent does doing the job itself provide you with information about your work performance? That is, does the actual work itself provide clues about how well you are doing -- aside from any “feedback” co-workers or supervisors may provide?
| 1--- | ---2--- | ---3--- | ---4--- | ---5--- | ---6--- | ---7 |
|---|---|---|---|---|---|---|
| Very little; the job itself is set up so a person could work forever without finding out how well he or she is doing. | Moderately; sometimes doing the job provides “feedback” to the person; sometimes it does not. | Very much; the job is set up so that a person gets almost constant “feedback” as he or she works about how well he or she is doing. | ||||
Section Two
Listed below are a number of statements which could be used to describe a job.
You are to indicate whether each statement is an accurate or an inaccurate description of your job.
Once again, please try to be as objective as you can in deciding how accurately each statement describes your job -- regardless of you like or dislike your job.
Write a number in the blank beside each statement, based on the following scale:
How accurate is the statement in describing your job?
| 1 Very Inaccurate | 2 Mostly Inaccurate | 3 Slightly Inacurate | 4 Uncertain | 5 Slightly Accurate | 6 Mostly Accurate | 7 Very Accurate |
|---|---|---|---|---|---|---|
| (SV) | _____ 1. | The job requires me to use a number of complex or sophisticated skills. | ||||
| (F) | _____ 2. | Just doing the work required by the job provides many chances for me to figure out how well I am doing. | ||||
| (SV) | _____ 3. | The job requires me to use a number of complex or high-level skills. | ||||
| (TS) | _____ 4. | This job is one where a lot of other people can be affected by how well the work gets done. | ||||
| (A) | _____ 5. | The job gives me a chance to use my personal initiative and judgment in carrying out the work. | ||||
| (F) | _____ 6. | After I finish a job, I know whether I performed well. | ||||
| (A) | _____ 7. | The job gives me considerable opportunity for independence and freedom in how I do the work. | ||||
| (TS) | _____ 8. | The job itself is very significant and important in the broader scheme of things. | ||||
Job Role Quality Questionnaire (JRQ)
| Job Role Quality Questionnaire (JRQ) | ||
|---|---|---|
| Description | The Job Role Quality questionnaire was developed through a National Institute of Occupational Safety and Health (NIOSH)-funded project (Marshall et al., 1991). The Job Role Quality questionnaire was developed as a response to research findings from the widely used Job Content Questionnaire (JCQ).12 This research has shown that satisfaction and health outcomes are impacted by the strain that results when jobs combine heavy demands and low decision latitude with little social support. This model has been applied in some health care settings and the occupation “nurse aide” is categorized as a high strain one, combining relatively high demands and low decision latitude. A major problem with the model underlying this approach, however, has been that it is based predominantly on data from male workers. The Job Role Quality Questionnaire was designed to adapt the JCQ to more accurately reflect women’s psychosocial responses to service work. While it is derived from the Job Content Questionnaire and includes the same concepts, the Job Role Quality scales are not identical. Further, the Job Role Quality items of “helping others” and “discrimination” were added to assess their moderating role on job strain. These modifications suggest a good fit for studies of DCWs. The Job Role Quality questionnaire is intended to measure job strain that leads to negative psychological and physical health outcomes. It contains 5 Job Concern subscales -- overload, dead-end job, hazard exposure, poor supervision, and discrimination. It also contains 6 Job Reward subscales -- helping others, decision authority, challenge, supervisor support, recognition, and satisfaction with salary. Overall, decision authority, challenge and the opportunity to help others are each important buffers of heavy work demands. Supervisor support and helping others most consistently buffer the negative health effects of overload (Marshall & Barnett, 1993; Marshall et al., 1991). | |
| Measure | Subscales Concern Factors: (1) Overload (2) Dead-end job (3) Hazard exposure (4) Supervision (5) Discrimination Reward factors: | |
| Administration | Survey Administration (1) Designed for face-to-face interview, but may be possible to adapt to paper and pencil, self-administered (2) Data on time not available (3) 36 questions (4) 4-item Likert scale (not at all (concerned/rewarding) to extremely (concerned/rewarding)) Readability | |
| Scoring | (1) Simple calculations. (2) Subscale score = Average of items on the subscale (Range 1 - 4) (3) Lower scores on Job Concern subscales indicate better job design features; Higher scores on Job Reward subscales indicate better job design features. | |
| Availability | Free. | |
| Reliability | Internal consistency ranges from .48 to .87 for the subscales. | |
| Validity | Construct validity:
Criterion-related validity:
| |
| Contact Information | Not needed for use of the instrument. | |
Survey Items
Key to Which Questions Fall into Which Subscales
The 36 items are organized below into their respective 11 subscales (5 job concern subscales and 6 job reward subscales).
Job Concern Factors
Instructions. Think about your job right now and indicate on a scale of 1 (not at all) to 4 (extremely), to what extent, if at all, each of the following is of concern.
Overload
- Having too much to do
- The jobs taking too much out of you
- Having to deal with emotionally difficult situations
Dead-End Job
- Having little chance for the advancement you want or deserve
- The jobs not using your skills
- The jobs dullness, monotony, lack of variety
- Limited opportunity for professional or career development
Hazard Exposure
- Being exposed to illness or injury
- The physical conditions on your job (noise, crowding, temperature, etc.)
- The jobs being physically strenuous
Poor Supervision
- Lack of support from your supervisor for what you need to do your job
- Your supervisors lack of competence
- Your supervisors lack of appreciation for your work
- Your supervisors having unrealistic expectations for your work
Discrimination
- Facing discrimination or harassment because of your race/ethnic background
- Facing discrimination or harassment because youre a woman
Job Reward Factors
Instructions: Think about your job right now and indicate on a scale of 1 (not at all) to 4 (extremely) to what extent, if at all, each of the following is a rewarding part of your job.
Helping Others
- Helping others
- Being needed by others
- Having an impact on other peoples lives
Decision Authority
- Being able to make decisions on your own
- Being able to work on your own
- Having the authority you need to get your job done without having to go to someone else for permission
- The freedom to decide how you do your work
Challenge
- Challenging or stimulating work
- Having a variety of tasks
- The sense of accomplishment and competence you get from doing your job
- The jobs fitting your interests and skills
- The opportunity for learning new things
Supervisor Support
- Your immediate supervisors respect for your abilities
- Your supervisors concern about the welfare of those under him/her
- Your supervisors encouragement of your professional development
- Liking your immediate supervisor
Recognition
- The recognition you get
- The appreciation you get
Satisfaction with Salary
- The income
- Making good money compared to other people in your field
Job Satisfaction
Introduction
Definition of Job Satisfaction
Job satisfaction is generally defined as the degree to which individuals have a positive emotional response towards employment in an organization. It is not the same as morale, which includes other concepts such as commitment, discouragement, and loyalty.
Organizations care about job satisfaction because it is thought to be related to employees’ emotional and behavioral responses to work. However, the evidence on these relationships is mixed. Extensive literature reviews, meta-analyses, and organizational studies conducted in the 1970s found that the relationship between job satisfaction and productivity, absence, and turnover is negligible (Landy, 1989; Steers & Rhoades, 1978; Mobley, Horner, & Hollingsworth, 1978; Locke, 1976). In contrast, more recent studies have found that job dissatisfaction is strongly associated with job stress and organizational commitment among nurses (Blegen, 1993; Cohen-Mansfield, 1997; Lundstrom et al., 2002; Upenieks, 2000).
Overview of Selected Measures of Job Satisfaction
Job satisfaction can be measured globally as a single measure of whether one is generally satisfied (or dissatisfied) with his or her job (Porter & Lawler, 1968). With this global approach, job satisfaction is measured as a general, overall emotional response to a persons current work situation. Three measures identified for this topic address overall job satisfaction:
- General Job Satisfaction Scale (GJS, from the Job Diagnostic Survey or JDS)
- Various single-item measures including the Visual Analog Satisfaction Scale
- Visual Analog Satisfaction Scale (VAS)
In contrast to a global approach, some argue that job satisfaction should be assessed in terms of multiple dimensions such as in response to tasks, supervisor, coworkers, or pay (e.g., Smith, Kendall, & Hulin, 1969). This multi-dimensional or facet approach assumes that people have reactions to specific aspects of their work that a general measure fails to recognize. Satisfaction on different dimensions does not simply combine to produce a general or overall measure of satisfaction. Three measures identified for this topic use this multi-dimensional approach.
- Benjamin Rose Nurse Assistant Job Satisfaction Scale
- Grau Job Satisfaction Scale
- Job Satisfaction Survey (JSS©)
Issues to Consider When Selecting Measures of Job Satisfaction
- For many years it has been assumed that multi-item measures of satisfaction were psychometrically superior to single items. Recent evidence (summarized in “Single Item Measures of Job Satisfaction” later in this topic) suggests that it is possible to construct one-item measures that have good measurement properties. This possibility may be significant to users with limited time and budget resources. Single item measures have proven popular in many studies of health care workers where job satisfaction is not the focus of the research, but one among many data points collected in a study.
Alternatives for Measuring Job Satisfaction
Benjamin Rose Nurse Assistant Job Satisfaction Scale
| Benjamin Rose Nurse Assistant Job Satisfaction Scale | ||
|---|---|---|
| Description | The Benjamin Rose Nurse Assistant Job Satisfaction Scale is an 18-item scale that measures job satisfaction which was developed for use in surveys of state-tested nursing assistants working in nursing homes. It was developed by researchers at the Margaret Blenkner Research Institute. The Benjamin Rose Nurse Assistant Job Satisfaction Scale has been used with 338 nurse assistants for more than ten years and its psychometric properties established. | |
| Measure | Subscales (1) Communication and recognition (2) Amount of time to do work (3) Available resources (4) Teamwork (5) Management practices | |
| Administration | Survey Administration (1) Interview (2) 5 minutes or less (3) 18 questions (4) 4-point Likert scale (0=very dissatisfied to 3=very satisfied) Readability | |
| Scoring | (1) Simple calculations. (2) Total scale score = Sum of 18 items (Range 0-54) (3) Higher scores indicate higher job satisfaction. | |
| Availability | This scale is copyrighted. Parties interested in using the measure must obtain written permission from Benjamin Roses Margaret Blenkner Research Institute and acknowledge the source in all publications and other documents. | |
| Reliability | Internal consistency of scale is .92 | |
| Validity | Construct validity:
| |
| Contact Information | Permission to use this instrument can be obtained by contacting: Administrative Assistant Margaret Blenkner Research Institute Phone: 216-373-1604 Email: klutian@benrose.org | |
Survey Items
Key to Which Questions Fall into Which Subscales
CR = Communication and recognition subscale (5 items)
TO = Amount of time/organization subscale (2 items)
R = Resources subscale (2 items)
T = Teamwork subscale (2 items)
MP = Management practice and policy subscale (7 items)
| Very Satisfied | Satisfied | Dissatisfied | Very Dissatisfied | |||
|---|---|---|---|---|---|---|
| MP | 1. | the working conditions here? | 3 | 2 | 1 | 0 |
| T | 2. | the way nurse assistants here pitch in and help one another? | 3 | 2 | 1 | 0 |
| CR | 3. | the recognition you get for your work? | 3 | 2 | 1 | 0 |
| MP | 4. | the amount of responsibility you have? | 3 | 2 | 1 | 0 |
| MP | 5. | your rate of pay? | 3 | 2 | 1 | 0 |
| MP | 6. | the way this nursing home is managed? | 3 | 2 | 1 | 0 |
| CR | 7. | the attention paid to suggestions you make? | 3 | 2 | 1 | 0 |
| MP | 8. | the amount of variety in your job? | 3 | 2 | 1 | 0 |
| MP | 9. | your job security? | 3 | 2 | 1 | 0 |
| MP | 10. | your fringe benefits? | 3 | 2 | 1 | 0 |
| TO | 11. | the amount of time you have to get your job done? | 3 | 2 | 1 | 0 |
| T | 12. | the teamwork between nurse assistants and other staff? | 3 | 2 | 1 | 0 |
| CR | 13. | the attention paid to your observations or opinions? | 3 | 2 | 1 | 0 |
| R | 14. | the information you get to do your job? | 3 | 2 | 1 | 0 |
| R | 15. | the supplies you use on the job? | 3 | 2 | 1 | 0 |
| TO | 16. | the pace or speed at which you have to work? | 3 | 2 | 1 | 0 |
| CR | 17. | the way employee complaints are handled? | 3 | 2 | 1 | 0 |
| CR | 18. | the feedback you get about how well you do your job? | 3 | 2 | 1 | 0 |
General Job Satisfaction Scale (GJS, from Job Diagnostic Survey or JDS)
| General Job Satisfaction Scale (GJS, from Job Diagnostic Survey or JDS) | ||
|---|---|---|
| Description | The General Job Satisfaction Scale is a short 5-item measure of overall job satisfaction that is derived from the theoretical and conceptual work that resulted in the Job Diagnostic Survey (Hackman & Oldham, 1975, 1980). Job satisfaction is defined as an overall measure of the degree to which the employee is satisfied and happy with the job. As a component of the JDS, the scale has been used in a wide variety of jobs, including telephone companies, factory workers, clerical workers, supervisors, and nursing and technical staff. An example of the use of the JDS in a long-term care setting is Schaefers work on the effect of stressors and work climate on staff morale and functioning (1996). | |
| Measure | (1) Overall (global) satisfaction. | |
| Administration | Survey Administration (1) Paper and pencil or interview (2) 5 minutes (3) 5 questions (4) 7-point Likert scaling (strongly disagree to strongly agree) Readability | |
| Scoring | (1) Simple calculations. (2) Overall score = Average of the 5 items after reverse coding the two negatively worded items (Range 1 - 7). (3) Higher scores indicate higher job satisfaction. | |
| Availability | Free. | |
| Reliability | Internal consistency of scale ranges from .74 - .80. | |
| Validity | Construct validity:
| |
| Contact Information | Not needed for use of this instrument. | |
Survey Items
Key to Which Questions Fall into Which Subscales
All 5 items go into the General Job Satisfaction scale.
Note that two items, marked ®, are reverse worded. Their responses must be recoded prior to scoring.
- Generally speaking, I am very satisfied with this job.
- I frequently think of quitting this job. ®
- I am generally satisfied with the kind of work I do in this job.
- Most people on this job are very satisfied with the job.
- People on this job often think of quitting. ®
Each item is to be answered using the following 7-point response scale:
- Disagree strongly
- Disagree
- Disagree slightly
- Neutral
- Agree slightly
- Agree
- Agree strongly
Grau Job Satisfaction Scale
| Grau Job Satisfaction Scale | ||
|---|---|---|
| Description | A two-dimension measure of job satisfaction was developed by Grau et al. for a study of nurse aides in nursing homes (1991). The instrument was based on earlier work by Cantor and Chichin for a study of homecare workers (1989). Although the instrument included items related to multiple job satisfaction dimensions (economic characteristics, sense of accomplishment, personal satisfaction, job responsibilities, supervision, and job convenience), factor analysis of the instrument provided evidence of only two dimensions (Grau et al., 1991). These two dimensions are general job satisfaction and job benefits. The instrument has been used in a study of home health aides who cared for AIDS patients (Grau, Colombotos, & Gorman, 1992) and nurse aides in a long term care facility (Grau, Chandler, Burton, & Kilditz, 1991). | |
| Measure | Subscales (1) Intrinsic job satisfaction (2) Satisfaction with benefits | |
| Administration | Survey Administration (1) Paper and pencil or interview (2) 5 minutes (3) 14 questions (4) 4-point Likert scaling (very true to not true at all) Readability | |
| Scoring | (1) Simple calculations. (2) Subscale score = Sum of items on the subscale (Range 4 52, depending on subscale). (3) Lower scores indicate higher job satisfaction. | |
| Availability | Free. | |
| Reliability | Internal consistency is .84 for intrinsic satisfaction scale and .72 for job benefits scale. | |
| Validity | No published information is available. | |
| Contact Information | Not needed for use of this instrument. | |
Survey Items (Exact wording below)
Key to Which Questions Fall into Which Subscales
The survey items are grouped as shown below into the two respective subscales (13 items in Intrinsic Job Satisfaction subscale and 4 items in Job Benefits subscale).
The 4-point response scale is: 1. very true; 2. somewhat true; 3. not too true; 4. not true at all
Intrinsic Job Satisfaction
- See the result of my work.
- Chances to make friends.
- Sense of accomplishment.
- My job prepares me for better jobs in health care.
- Get to do a variety of things on the job.
- Responsibilities are clearly defined.
- Have enough authority to do my job.
- I am given a chance to do the things I do best.
- I get a chance to be helpful to others.
- I am given a chance to be helpful to others.
- I am given freedom to decide how I do my work.
- The work is interesting.
- The people I work with are friendly.
Job Benefits
- The fringe benefits are good.
- The security is good.
- The pay is good.
- The chances for promotion are good.
Job Satisfaction Survey (JSS)©
| Job Satisfaction Survey (JSS)© | ||
|---|---|---|
| Description | The Job Satisfaction Survey (JSS)© -- a 36 item, nine subscale measure -- was developed by Spector to assess employee attitudes about certain aspects of their job (1985). The nine subscales include pay, promotion, supervision, fringe benefits, contingent rewards (performance-based rewards), operating procedures (required rules and procedures), coworkers, nature of work, and communication. Each subscale includes four items, and a total score is computed from all items. While the JSS© was originally developed for use in human service organizations, it is applicable to all organizations, both in the public and private sectors. | |
| Measure | Subscales (1) Pay (2) Promotion (3) Supervision (4) Fringe benefits (5) Contingent rewards (6) Operating conditions (7) Coworkers (8) Nature of work (9) Communication | |
| Administration | Survey Administration (1) Paper and pencil or interview (2) 10 minutes (3) 36 questions (4) 6-point Likert scaling (strongly agree to strongly disagree) Readability: | |
| Scoring | (1) Simple calculations. (2) Subscale score = Sum of items on the subscale (Range 4 - 24, depending on subscale) Overall score = Sum of all 36 items (Range 36 - 216) (3) Higher scores indicate higher job satisfaction. | |
| Availability | Free for research or non-commercial use with permission from the author. | |
| Reliability | Internal consistency ranges from .60 .91 for subscales. | |
| Validity | Validity correlations between equivalent scales from another tested instrument (JDI) and the JSS© were significantly larger than zero and of reasonable magnitude. | |
| Contact Information | This instrument is available on-line at http://chuma.cas.usf.edu/~spector. Permission to use it can be obtained by contacting: Paul Spector, PhD Department of Psychology PCD4118G University of South Florida Tampa, FL 33620 (813) 974-0357 spector@chuma.cas.usf.edu | |
Survey Items (Exact wording below)
Key to Which Questions Fall into Which Subscales
P = Pay subscale (4 items)
PR = Promotion subscale (4 items)
S = Supervision subscale (4 items)
F = Fringe benefits subscale (4 items)
C = Contingent rewards subscale (4 items)
O = Operating procedures subscale (4 items)
CO = Coworkers subscale (4 items)
N = Nature of work subscale (4 items)
CM = Communication subscale (4 items)
Note that 19 items, marked ®, are reverse worded. Their responses must be recoded prior to scoring.
7-point response scale, ranging from very strongly agree to very strongly disagree
| PLEASE CIRCLE THE ONE NUMBER FOR EACH QUESTION THAT COMES CLOSEST TO REFLECTING YOUR OPINION. | ||
|---|---|---|
| P | 1. | I feel I am being paid a fair amount for the work I do. |
| PR | 2. | There is really too little chance for promotion on my job. ® |
| S | 3. | My supervisor is quite competent in doing his/her job. |
| F | 4. | I am not satisfied with the benefits I receive. ® |
| C | 5. | When I do a good job, I receive the recognition for it that I should receive. |
| O | 6. | Many of our rules and procedures make doing a good job difficult. ® |
| CO | 7. | I like the people I work with. |
| N | 8. | I sometimes feel my job is meaningless. ® |
| CM | 9. | Communications seem good within this organization. |
| P | 10. | Raises are too few and far between. ® |
| PR | 11. | Those who do well on the job stand a fair chance of being promoted. |
| S | 12. | My supervisor is unfair to me. ® |
| F | 13. | The benefits we receive are as good as most other organizations offer. |
| C | 14. | I do not feel that the work I do is appreciated. ® |
| O | 15. | My efforts to do a good job are seldom blocked by red tape. |
| CO | 16. | I find I have to work harder at my job because of the incompetence of people I work with. ® |
| N | 17. | I like doing the things I do at work. |
| CM | 18. | The goals of this organization are not clear to me. ® |
| P | 19. | I feel unappreciated by the organization when I think about what they pay me. ® |
| PR | 20. | People get ahead as fast here as they do in other places. |
| S | 21. | My supervisor shows too little interest in the feelings of subordinates. ® |
| F | 22. | The benefit package we have is equitable. |
| C | 23. | There are few rewards for those who work here. ® |
| O | 24. | I have too much to do at work. ® |
| CO | 25. | I enjoy my coworkers. |
| CM | 26. | I often feel that I do not know what is going on with the organization. ® |
| N | 27. | I feel a sense of pride in doing my job. |
| P | 28. | I feel satisfied with my chances for salary increases. |
| F | 29. | There are benefits we do not have which we should have. ® |
| S | 30. | I like my supervisor. |
| O | 31. | I have too much paperwork. ® |
| C | 32. | I don't feel my efforts are rewarded the way they should be. ® |
| PR | 33. | I am satisfied with my chances for promotion. |
| CO | 34. | There is too much bickering and fighting at work. ® |
| N | 35. | My job is enjoyable. |
| CM | 36. | Work assignments are not fully explained. ® |
Single Item Measures of Job Satisfaction
| Single Item Measures of Job Satisfaction | ||
|---|---|---|
| Description | Over time, the trend in measuring job satisfaction has been towards multi-item, multi-scale instruments. Many currently available instruments have grown out of theories of satisfaction that emphasize employees’ emotional reactions to multiple aspects of their job. For example, one of the most heavily researched and widely used instruments, the JDI, is based on a model that identifies five important aspects of work: the task, pay, coworkers, supervision, and promotion. However, the long form of this instrument consists of 72 items, and even a shorter, more streamlined version still contains 25 statements. Yet simpler and more adaptable measures may be available to the researcher. For example, Aiken et al. used a single job satisfaction question rather than a lengthy multi-item instrument in her study of nursing burnout and found satisfaction significantly related to nurse-patient ratio (2002). | |
| Measure | (1) Single item measures have generally been used to assess overall job satisfaction, but may be adapted to address specific dimensions or facets. | |
| Administration | Survey Administration (1) Paper and pencil or interview (2) 1 minute (3) 1 question (4) Typically a 5-point Likert scale anchored by levels of satisfaction. Readability | |
| Scoring | (1) Simple calculations. (2) Subject’s response is used as his/her “score” on the measure. (3) Depends on direction of scores. | |
| Availability | Free. | |
| Reliability | Internal consistency measures are not applicable to single item measures. | |
| Validity | Recent research indicates that single- item measures of overall or global job satisfaction correlate well (r > .60) with multi-item measures, and may be superior to summing up multi-item facet scores into an overall score. | |
| Contact Information | Not needed for use of this instrument. | |
Examples of Survey Items
- Scarpello and Campbell, in a review of job satisfaction measures, concluded that the best global rating of satisfaction is a single item, 5-point scale asking “Overall, how satisfied are you with your job?” (1983)
- Nagy suggests that single item measures are most likely to have acceptable measurement properties if they use a discrepancy format (2002). That is, their wording should follow a form such as “How does the amount of satisfaction [or some other area of interest] compare to what it should be?” The measure should use a multi-level response, such as a five-point scale ranging from “not at all satisfying” to “very satisfying.”
Visual Analog Satisfaction Scale (VAS)
| Visual Analog Satisfaction Scale (VAS) | ||
|---|---|---|
| Description | The Visual Analog Satisfaction Scale (VAS) is a one-item graphical rating scale. Unlike the other instruments described here, the VAS is not an instrument, per se, but an approach to measurement that can be implemented easily. McGilton and Pringle describe the VAS and the significant relationship they found among nurses in LTC between job satisfaction (using the VAS) and perceived organizational control and clinical control (1999). | |
| Measure | Overall job satisfaction. While examples of dimensions that might affect overall satisfaction are given, subjects are encouraged to make their rating in terms of their overall emotional reaction to whatever aspects of their job are important to them. | |
| Administration | Survey Administration (1) Paper and pencil (2) 1 minute (3) 1 question (4) Graphical rating scale: The subject’s evaluation of his/her job satisfaction is indicated by placing a marker on an anchored analog scale that ranges from no satisfaction to greatest possible satisfaction. Readability | |
| Scoring | (1) Simple calculations. (2) The VAS score is the distance (using a ruler) from the lowest end of a 100ml analog scale on which the respondent records their response. (3) Depends on which end of scale is reference point for measuring. | |
| Availability | Free. | |
| Reliability | Internal consistency measures are not applicable to single-item measures. | |
| Validity | VAS and similar graphical rating scales are believed to be a valid measure of job satisfaction. It is argued that they capture respondents global affective reactions to their work situation. The global nature of the question allows respondents to identify and respond to aspects of work that are most personally relevant or important. | |
| Contact Information | Not needed for use of this instrument. | |
Survey Item
I would like you to think about how satisfied you are with your job. Think about all the different parts of your work life. This could include things like hospital management, unit organization, and relationships with co-workers and supervisors. How satisfied are you?
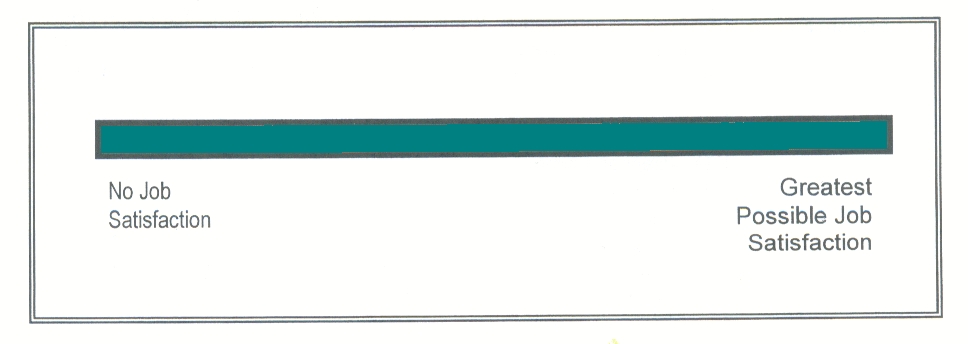
Organizational Commitment
Introduction
Definition of Organizational Commitment
Organizational commitment is the strength (or lack thereof) of an individual’s expressed attachment to a particular organization. This attachment has been measured in two ways: affective (or emotional) and behavioral (intent to leave). In some studies, most notably with direct care staff in psychiatric hospitals, organizational commitment has been more effective than job satisfaction at discriminating stayers from leavers (Porter et al., 1974).
Overview of Selected Measures of Organizational Commitment
One measure of organizational commitment focuses on behavioral intent whereas the other addresses both affective attachment and behavioral intent.
- The Intent to Turnover Measure (from the Michigan Organizational Assessment Questionnaire or MOAQ)
- Organizational Commitment Questionnaire (OCQ)
Issues to Consider When Selecting Measures of Organizational Commitment
- To date, no issues have been identified.
Alternatives for Measuring Organizational Commitment
Intent to Turnover Measure (from the Michigan Organizational Assessment Questionnaire or MOAQ)
| Intent to Turnover Measure (from the Michigan Organizational Assessment Questionnaire or MOAQ) | ||
|---|---|---|
| Description | Developed initially in 1975 as part of a larger survey instrument measuring employee perceptions, the three-item instrument has been used with many different occupational samples (Cammann et al., 1983). This set of items focuses on behavioral intent rather than affective attachment as indicating degree of commitment to the organization. | |
| Measure | Behavioral intent to leave job | |
| Administration | Survey Administration (1) Paper and pencil (2) 5 minutes (3) 3 questions (4) 7-point or 5-point Likert scaling (strongly disagree to strongly agree; not at all likely to extremely likely) Readability | |
| Scoring | (1) Simple calculations. (2) Score = Sum of the 3 items (Range 3 21). (3) Lower scores indicate greater organizational commitment. | |
| Availability | Free. | |
| Reliability | Internal consistency of scale is .83 from diverse occupational sample at 11 sites. | |
| Validity | Logical relationships found between look for new job item and age, loneliness, and satisfaction with pay and benefits in study of home health aides. | |
| Contact Information | Not needed for use of this instrument. | |
Survey Items
Here are some statements about you and your job. How much do you agree or disagree with each?
1. I will probably look for a new job in the next year.
1-strongly disagree
2-disagree
3-slightly disagree
4-neither agree nor disagree
5-slightly agree
6-agree
7-strongly agree
2. I often think about quitting.
1-strongly disagree
2-disagree
3-slightly disagree
4-neither agree nor disagree
5-slightly agree
6-agree
7-strongly agree
Please answer the following question.
3. How likely is it that you could find a job with another employer with about the same pay and benefits you now have?
1-not at all likely
2-
3-somewhat likely
4-
5-quite likely
6-
7-extremely likely
Organizational Commitment Questionnaire (OCQ) -- Mowday and Steers (1979)
| Organizational Commitment Questionnaire (OCQ) -- Mowday and Steers (1979) | ||
|---|---|---|
| Description | The Organizational Commitment Questionnaire (OCQ) is the most thoroughly studied instrument in the literature that measures affective attachment to the organization. The OCQ was developed over a 9-year period on research from diverse samples (n=2563) including hospital employees and psychiatric technicians (DCWs). It includes the extent to which the individual: (1) accepts and believes in the organizations goals; (2) is willing to exert effort on behalf of the organization; and (3) wants to continue involvement in the organization. These first two components represent attitudinal commitment, whereas the third one is behavioral (Price & Mueller, 1986). | |
| Measure | Affective attachment to organization | |
| Administration | Survey Administration (1) Paper and pencil (2) 5 minutes (short form), 10 minutes (long form) (3) 9 (positively worded) questions in short form and 15 questions (both positively and negatively worded) in long form (4) 7-point or 5-point Likert scaling (strongly agree to strongly disagree) Readability | |
| Scoring | (1) Simple calculations. (2) Score = Average of the items, after reversing negatively worded items if long form is used (Range 1 7). (3) Higher scores indicate greater organizational commitment. | |
| Availability | Free. | |
| Reliability | Internal consistency of scale ranges from .8 - .9 for the long version (not known for short version). | |
| Validity | Construct validity:
| |
| Contact Information | Not needed for use of this instrument. | |
Survey Items
Listed below are a series of statements that represent possible feelings that individuals might have about the company or organization for which they work. With respect to your own feelings about the particular organization for which you are now working (company/agency name) please indicate the degree of your agreement or disagreement with each statement by checking one of the seven alternatives for each statement.
1-strongly disagree
2-moderately disagree
3-slightly disagree
4-neither disagree nor agree
5-slightly agree
6-moderately agree
7-strongly agree
- I am willing to put in a great deal of effort beyond that normally expected in order to help this organization be successful.
- I talk up this organization to my friends as a great organization to work for.
- I feel very little loyalty to this organization. (reverse scored)
- I would accept almost any type of job assignment in order to keep working for this organization.
- I find that my values and the organizations values are very similar.
- I am proud to tell others that I am part of this organization.
- I could just as well be working for a different organization as long as the type of work was similar. (reverse scored)
- This organization really inspires the very best in me in the way of job performance.
- It would take very little change in my present circumstances to cause me to leave this organization. (reverse scored)
- I am extremely glad that I chose this organization to work for over others I was considering at the time I joined.
- Theres not too much to be gained by sticking with this organization indefinitely. (reverse scored)
- Often, I find it difficult to agree with this organizations policies on important matters relating to its employees. (reverse scored)
- I really care about the fate of this organization.
- For me this is the best of all possible organizations for which to work.
- Deciding to work for this organization was a definite mistake on my part. (reverse scored)
Worker-Client/Resident Relationships
Introduction
Definition of Worker-Client/Resident Relationships
The worker-client/resident relationships topic addresses workers’ perceptions of their relationships with care recipients. It is concerned with both workers’ feelings for the care recipients, and with workers’ perceptions of how their feelings have been affected by relationships with care recipients.
Worker-client/resident relationships are important for organizations to consider, as turnover has been found to decelerate as a result of workers sharing kin-like relationships with clients (Karner, 1998). In a study of nursing home nursing assistants, worker-resident relationships were identified as the most important work issue, and the major reason for worker retention (Parsons, 2003). Conversely, the involvedness of relationships that develop between residential care workers and residents has also been found to be especially stressful for workers (Maslach, 1981). Further, low levels of empathy and negative attitudes towards older people are associated with nursing staff burnout (Astrom, 1991).
Pringle details the dearth of studies on what constitutes an appropriate worker-client/resident relationship (2000). Current literature does not provide guidance for the type of relationships health-care aides or nurses should develop with residents (Pringle, 2000). At this time, very few measures exist that focus on the positive aspects or feelings of worker-client/resident relationships. Rather, measures usually emphasize the negative and difficult features these relationships entail.
Overview of Selected Measures of Worker-Client/Resident Relationships
This scale focuses on home care workers’ feelings about their relationship with their client and the client’s involvement in their work.
- Stress/Burden Scale from the California Homecare Workers Outcomes Survey (2 of 6 subscales)
Issues to Consider When Selecting Measures of Worker-Client/Resident Relationships
- No measures designed to exclusively assess the quality of worker-client/resident relationships have yet been developed.
Alternatives for Measuring Worker-Client/Resident Relationships
Stress/Burden Scale from the California Homecare Workers Outcomes Survey (2 of 6 subscales)13
| Stress/Burden Scale from the California Homecare Workers Outcomes Survey (2 of 6 subscales)13 | ||
|---|---|---|
| Description | Researchers at the University of California, Los Angeles developed the California Homecare Workers Outcomes Survey to compare outcomes (stress and satisfaction) between agency and client-directed workers and between family and non-family workers (Doty et al., 1998). In 1997, the survey was administered by telephone to 618 home care providers working in Californias In-Home Supportive Services (IHSS) program, a well-established program in California that provides both agency and client-directed services to residents living in their own homes that are aged, blind or disabled and reimburses any provider selected by eligible clients, including family members. Ten subscales were developed to measure these outcomes (6 scales for stress/burden and 4 for satisfaction). Stress refers to how stressed home care workers feel when it comes to client safety, family issues, client behavioral problems, their relationship with the client, the client role in their work and their own emotional state. Satisfaction relates to how satisfied home care workers are with their job role, their self-assessment of performance, career benefits and independence and flexibility in their work schedule. | |
| Measure | Stress/Burden Scale (2 of 6 subscales) (1) Relationship with client (2) Client role in provider’s work | |
| Administration | Survey Administration (1) Telephone interview (2) 1–2 minutes (3) 6 questions (4) 5-point Likert scales (very close to hostile; strongly agree to strongly disagree; or extremely well to not well at all) Readability: Published data not available at this time. | |
| Scoring | (1) Simple calculations. (2) Score = Average of the 6 items (Range 1-5) (3) Higher scores indicate the most stress. | |
| Availability | Free. If using this measure, please cite the following: Benjamin, A.E., and Matthias, R.E. (2004). Work Life Differences and Outcomes for Agency and Consumer-Directed Home Care Workers. The Gerontologist, 44(4): 479-488. | |
| Reliability | Internal consistency ranges from .63 - .75 for subscales. | |
| Validity |
| |
| Contact Information | Ruth Matthias, Ph.D UCLA School of Public Policy and Social Research 3250 Public Policy Building Los Angeles, CA 90095-1656 (310) 825-1951 matthias@ucla.edu | |
Survey Items (exact wording below)
Key to Which Questions Fall into Which Subscales
R = Relationship with Client subscale (3 items)
CR = Client Role in Provider’s Work subscale (3 items)
| THESE NEXT FEW QUESTIONS DEAL WITH THE RELATIONSHIP YOU HAVE WITH YOUR CLIENT(S). | |||||||
|---|---|---|---|---|---|---|---|
| Very Close | Not Very Close | Hostile | |||||
| R | 1. | How would you describe your relationship to your client? | 1 | 2 | 3 | 4 | 5 |
| Strongly Agree | Uncertain | Strongly Disagree | |||||
| R | 2. | My client is someone I can tell my troubles to and share my feelings with. | 1 | 2 | 3 | 4 | 5 |
| Extremely Well | Somewhat Well | Not At All Well | |||||
| R | 3. | My client is someone I can tell my troubles to and share my feelings with. | 1 | 2 | 3 | 4 | 5 |
| Strongly Agree | Uncertain | Strongly Disagree | |||||
|---|---|---|---|---|---|---|---|
| CR | 1. | My client is comfortable telling me what he/she wants done. | 1 | 2 | 3 | 4 | 5 |
| CR | 2. | I appreciate my client telling me how he/she wants things done. | 1 | 2 | 3 | 4 | 5 |
| CR | 3. | My client wants to have a say in what I do for him/her. | 1 | 2 | 3 | 4 | 5 |
Worker-Supervisor Relationships
Introduction
Definition of Worker-Supervisor Relationships
Lack of knowledge about effective management strategies for improving quality of care of nursing homes has been identified as a priority concern in long-term care (Binstock & Spector, 1997). The quality of worker-supervisor work relationships topic addresses workers perceptions of their relationships with their supervisors, as well as their perceptions of their peers relationships with their supervisors. It is concerned with both workers feelings for their supervisors, and for workers attitudes toward their peer groups relationship to their supervisors.
The importance of considering worker-supervisor relationships when attempting to maximize retention and limit turnover cannot be overstated. In residential care research, supervision has been cited as a primary reason for leaving an organization (Howe, 2003). Conversely, perceived supervisor support has been found to be associated with high job satisfaction (Moniz, 1997; Gleason, 1999; Poulin, 1992).
Overview of Selected Measures of Worker-Supervisor Relationships
Four instruments/subscales that measure worker-supervisor relationships differently are presented here. One job satisfaction instrument looks at workers’ feelings on their relationship with their supervisor, while another measures their feelings about the empathy and reliability of their charge nurse. Another instrument measures nursing staff’s perceptions about leadership effectiveness of their supervisors. Other subscales assess the respondent’s satisfaction with the worker-supervisor relationship or examine how concerned or rewarded workers feel by supervision given to them.
- Benjamin Rose Relationship with Supervisor Scale
- Charge Nurse Support Scale
- LEAP Leadership Behaviors and Organizational Climate Survey (1 of 2 subscales, Leadership)
- Supervision Subscales of the Job Role Quality Questionnaire (JRQ) (2 of 11 subscales)
Issues to Consider When Selecting Measures of Worker-Supervisor Relationships
- To date, no issues have been identified.
Alternatives for Measuring Worker-Supervisor Relationships
Benjamin Rose Relationship with Supervisor Scale
| Benjamin Rose Relationship with Supervisor Scale | ||
|---|---|---|
| Description | The Benjamin Rose Relationship with Supervisor Scale is an 11-item measure of nursing assistants’ perceptions of relationships with their supervisors developed and refined by researchers at the Margaret Blenkner Research Institute (Noelker & Ejaz, 2001). This measure taps nursing assistant perceptions about the frequency with which supervisors demonstrate good communication, recognition and team building abilities. The Benjamin Rose Relationship with Supervisor Scale has been used with 338 nurse assistants in long-term care settings for more than ten years and its psychometric properties established. | |
| Measure | Relationship with supervisor. | |
| Administration | Survey Administration (1) Interview (2) Less than 5 minutes (3) 11 questions (4) 3-point Likert scale (2=most of the time to 0=hardly ever/never) Readability | |
| Scoring | (1) Simple calculations. (2) Total scale score = Sum of 11 items (Range 0 - 22) (3) Higher scores indicate more positive perceptions of supervisors. | |
| Availability | This scale is copyrighted. Parties interested in using the measure must obtain written permission from Benjamin Roses Margaret Blenkner Research Institute and acknowledge the source in all publications and other documents. | |
| Reliability | Internal consistency of scale is .90 | |
| Validity | Construct validity:
| |
| Contact Information | Permission to use this information can be obtained by contacting: Administrative Assistant Margaret Blenkner Research Institute Phone: (216) 373-1604 Email: klutian@benrose.org | |
Survey Items
THE FOLLOWING STATEMENTS ARE ABOUT YOU RELATIONSHIP WITH YOUR SUPERVISOR. IF YOU HAVE MORE THAN ONE, THINK ABOUT THE ONE WITH WHOM YOU HAVE THE MOST CONTACT. AFTER I READ EACH STATEMENT, PLEASE TELL ME WHETHER YOU FEEL THIS WAY MOST OF THE TIME, SOME OF THE TIME, HARDLY EVER OR NEVER.
| Most of the Time | Some of the Time | Hardly Ever/Never | |
|---|---|---|---|
| listens carefully to my observations and opinions. | 2 | 1 | 0 |
| gives me credit for my contributions to resident care. | 2 | 1 | 0 |
| respects my ability to observe and report clinical symptoms. | 2 | 1 | 0 |
| lets me know how helpful my observations are for resident care. | 2 | 1 | 0 |
| talks down to me. | 0 | 1 | 2 |
| shows me recognition when I do good work. | 2 | 1 | 0 |
| encourages me to use my nursing skills to the fullest. | 2 | 1 | 0 |
| treats me as an equal member of the health care team. | 2 | 1 | 0 |
| ignores my input when developing care plans. | 0 | 1 | 2 |
| acts like they are better than I am. | 0 | 1 | 2 |
| understands my loss when a resident dies. | 2 | 1 | 0 |
Charge Nurse Support Scale
| Charge Nurse Support Scale | ||
|---|---|---|
| Description | The Charge Nurse Support Scale was developed to evaluate the supportive leadership behaviors of charge nurses in long-term care settings. Supportive leadership is defined as behaviors in which the supervisor exhibits empathy and reliability towards staff (McGilton et al., 2003). The first outcome measured by the Charge Nurse Support Scale -- empathy -- is the ability to recognize standards of care among the nursing staff, to recognize and accommodate nursing staffs expressed needs, and to understand nursing staffs point of view when they come forward with concerns. The second outcome -- reliability -- is the ability to be available to nursing staff if things were not going well with residents and families, to keep nursing staff informed of changes in the work environment and to tolerate feelings of frustration from staff. | |
| Measure | Charge nurse support. | |
| Administration | Survey Administration (1) Paper and pencil (2) 10 minutes (3) 15 questions (4) 5-point Likert scale (never to always) Readability | |
| Scoring | (1) Simple calculations. (2) Scale score = Sum of items in the scale (Range 15-75) (3) Higher scores indicate higher levels of supportive charge nurses/supervisors. | |
| Availability | Free with permission from author. | |
| Reliability | Internal consistency for scale is .92 | |
| Validity | Construct validity.
| |
| Contact Information | Kathy McGilton, RN, PhD. Toronto Rehabilitation Institute. McGilton.Kathy@torontorehab.on.ca | |
Survey Items
Below are 15 statements that relate to how you feel about your charge nurse. Please circle the number that reflects your relationship with your charge nurse. Please be as honest as your can. Your answers are confidential and will not be shared with others you work with. If you work with more than one charge nurse, please answer these questions in relation to the charge nurse that you work with most often.
| Never | Seldom | Occasionally | Often | Always | ||
|---|---|---|---|---|---|---|
| 1. | My charge nurse recognizes my ability to deliver quality care. | 1 | 2 | 3 | 4 | 5 |
| 2. | My charge nurse tries to meet my needs. | 1 | 2 | 3 | 4 | 5 |
| 3. | My charge nurse knows me well enough to know when I have concerns about resident care. | 1 | 2 | 3 | 4 | 5 |
| 4. | My charge nurse tries to understand my point of view when I speak to them. | 1 | 2 | 3 | 4 | 5 |
| 5. | My charge nurse tries to meet my needs in such ways as informing me of what is expected of me when working with my residents. | 1 | 2 | 3 | 4 | 5 |
| 6. | I can rely on my charge nurse when I ask for help, for example, if things are not going well between myself and my co-workers or between myself and residents and/or their families. | 1 | 2 | 3 | 4 | 5 |
| 7. | My charge nurse keeps me informed of any major changes in the work environment or organization. | 1 | 2 | 3 | 4 | 5 |
| 8. | I can rely on my charge nurse to be open to any remarks I may make to him/her. | 1 | 2 | 3 | 4 | 5 |
| 9. | My charge nurse keeps me informed of any decisions that were made in regards to my residents. | 1 | 2 | 3 | 4 | 5 |
| 10. | My charge nurse strikes a balance between clients/families’ concerns and mine. | 1 | 2 | 3 | 4 | 5 |
| 11. | My charge nurse encourages me even in difficult situations. | 1 | 2 | 3 | 4 | 5 |
| 12. | My charge nurse makes a point of expressing appreciation when I do a good job. | 1 | 2 | 3 | 4 | 5 |
| 13. | My charge nurse respects me as a person. | 1 | 2 | 3 | 4 | 5 |
| 14. | My charge nurse makes time to listen to me. | 1 | 2 | 3 | 4 | 5 |
| 15. | My charge nurse recognizes my strengths and areas for development. | 1 | 2 | 3 | 4 | 5 |
LEAP Leadership Behaviors and Organizational Climate Survey (1 of 2 subscales, Leadership)14
| LEAP Leadership Behaviors and Organizational Climate Survey (1 of 2 subscales, Leadership)14 | ||
|---|---|---|
| Description | The LEAP Leadership Behaviors and Organizational Climate Survey is a 14-item questionnaire designed to measure nursing staffs perceptions about two specific areas: leadership effectiveness and the organizational climate. One subscale, the Leadership subscale, contains 10 items examining leadership behavior such as: informing, consulting/delegating, planning/organizing, problem solving, role clarifying, monitoring operations, motivating, rewarding, mentoring, and managing conflict. The second subscale, the Organizational Climate subscale, includes four items measuring the organizational climate including communication flow, human resources, motivational conditions, and decision-making practices. Questions were derived from the extensive work at The University of Michigan in the development of the Survey of Organizations questionnaire, an extensive survey of organizational conditions and practices utilized across many diverse industries (1970). The original tool was derived from a theoretical integrative model of leadership tested as a predictor of an organizations effectiveness (Bowers & Seashore, 1966). Organizational climate is conceptualized as a quality of the internal environment of an organization that is experienced by its members, influences their behavior, and reflect the values of the characteristics or attributes of the organization (Tagiuri & Litwin, 1968). | |
| Measure | Subscales (1 of 2) (1) Leadership | |
| Administration | Survey Administration (1) Paper and pencil (2) 5-6 minutes (3) 10 questions (4) 5-point Likert scale (very little to always) Readability | |
| Scoring | (1) Simple calculations. (2) Subscale score = Sum of 10 items (Range of 10 - 50) (3) Higher scores indicate better perceptions of leadership behaviors. | |
| Availability | Free with permission from author. | |
| Reliability | Internal consistency ranges from .75 to .82 for leadership items; .94 for the leadership subscale. | |
| Validity | Discriminant validity showed high intercorrelations among leadership items. | |
| Contact Information | Permission to use this instrument can be obtained by contacting: Linda Hollinger-Smith, RN, PhD Director of Research Mather LifeWays Institute on Aging 1603 Orrington Avenue Suite 1800 Evanston, IL 60201 (847) 492-6810 Lhollingersmith@matherlifeways.com | |
Survey Items
| Very Little | Some | Always | ||||
|---|---|---|---|---|---|---|
| 1. | How often does your supervisor keep the people who work for him/her informed of changes or activities in the organization? | 1 | 2 | 3 | 4 | 5 |
| 2. | How often does your supervisor encourage people who work for him/her to exchange opinions and ideas? | 1 | 2 | 3 | 4 | 5 |
| 3. | How often is your supervisor receptive to the ideas and suggestions of others? | 1 | 2 | 3 | 4 | 5 |
| 4. | How often does your supervisor offer new ideas for solving job-related problems? | 1 | 2 | 3 | 4 | 5 |
| 5. | How often does your supervisor show people who work for him/her how to improve their performance? | 1 | 2 | 3 | 4 | 5 |
| 6. | How much does your supervisor pay attention to what people who work for him/her say? | 1 | 2 | 3 | 4 | 5 |
| 7. | How much does your supervisor encourage people who work for him/her to give their best effort? | 1 | 2 | 3 | 4 | 5 |
| 8. | How much does your supervisor praise the job performed by the people who work for him/her? | 1 | 2 | 3 | 4 | 5 |
| 9. | How much is your supervisor willing to listen to your problems? | 1 | 2 | 3 | 4 | 5 |
| 10. | How often does your supervisor encourage persons who work for him/her to work as a team? | 1 | 2 | 3 | 4 | 5 |
Supervision Subscales of the Job Role Quality Questionnaire(JRQ) (2 of 11 subscales)15
| Supervision Subscales of the Job Role Quality Questionnaire(JRQ) (2 of 11 subscales)15 | ||
|---|---|---|
| Description | The Job Role Quality questionnaire was developed through a National Institute of Occupational Safety and Health (NIOSH)-funded project (Marshall et al., 1991). The Job Role Quality questionnaire was developed as a response to research findings from the widely used Job Content Questionnaire (JCQ).16 This research has shown that satisfaction and health outcomes are impacted by the strain that results when jobs combine heavy demands and low decision latitude with little social support. This model has been applied in some health care settings and the occupation “nurse aide” is categorized as a high strain one, combining relatively high demands and low decision latitude. A major problem with the model underlying this approach, however, has been that it is based predominantly on data from male workers. The Job Role Quality Questionnaire was designed to adapt the JCQ to more accurately reflect women’s psychosocial responses to service work. While it is derived from the Job Content Questionnaire and includes the same concepts, the Job Role Quality scales are not identical. Further, the Job Role Quality items of “helping others” and “discrimination” were added to assess their moderating role on job strain. These modifications suggest a good fit for studies of DCWs. The Job Role Quality questionnaire is intended to measure job strain that leads to negative psychological and physical health outcomes. It contains 5 Job Concern subscales -- overload, dead-end job, hazard exposure, poor supervision, and discrimination. It also contains 6 Job Reward subscales -- helping others, decision authority, challenge, supervisor support, recognition, and satisfaction with salary. Overall, decision authority, challenge and the opportunity to help others are each important buffers of heavy work demands. Supervisor support and helping others most consistently buffer the negative health effects of overload (Marshall & Barnett, 1993; Marshall et al., 1991). | |
| Measure | Subscales (2 of 11) Concern Factors: (1) Supervision Reward factors: | |
| Administration | Survey Administration (1) Designed for face-to-face interview, but may be possible to adapt to paper and pencil, self-administered (2) Data on time not available (3) 8 questions (4 for poor supervision subscale and 4 for supervisor support subscale) (4) 4-item Likert scale (not at all (concerned/rewarding) to extremely (concerned/rewarding)) Readability | |
| Scoring | (1) Simple calculations. (2) Subscale score = Average of items on the subscale (Range 1 - 4) (3) Lower scores on Job Concern subscales indicate better job design features; Higher scores on Job Reward subscales indicate better job design features. | |
| Availability | Free. | |
| Reliability | Internal consistency ranges from .48 to .87 for the subscales. | |
| Validity | Construct validity:
Criterion-related validity:
| |
| Contact Information | Not needed for use of the instrument. | |
Survey Items
Key to Which Questions Fall into Which Subscales
The 8 items are organized below into their respective 2 subscales (job concern and job reward).
Job Concern Factors
Instructions. Think about your job right now and indicate on a scale of 1 (not at all) to 4 (extremely), to what extent, if at all, each of the following is of concern.
Poor Supervision
- Lack of support from your supervisor for what you need to do your job
- Your supervisors lack of competence
- Your supervisors lack of appreciation for your work
- Your supervisors having unrealistic expectations for your work
Job Reward Factors
Instructions: Think about your job right now and indicate on a scale of 1 (not at all) to 4 (extremely) to what extent, if at all, each of the following is a rewarding part of your job.
Supervisor Support
- Your immediate supervisors respect for your abilities
- Your supervisors concern about the welfare of those under him/her
- Your supervisors encouragement of your professional development
- Liking your immediate supervisor
Workload
Introduction
Definition of Workload
Subjective workload is a measure of a worker’s perception of the amount of work assigned to him/her, the lead time available to perform it, the extent to which the worker can control the pace of his/her work and the stress or burden felt by the worker. High amounts of work load pressure and stress lead to situations in which the worker can exercise little job discretion because the pace, scheduling and standards for work tasks are externally controlled. Studies among nurses have found that as perceived workload increases, job satisfaction decreases (e.g., Burke, 2003; Lyons et al., 2003).
Overview of Selected Measures of Workload
Three measures of worker-perceived workload are reviewed here:
- Quantitative Workload Scale from the Quality of Employment Survey
- Role Overload Scale (from the Michigan Organizational Assessment Questionnaire or MOAQ)
- Stress/Burden Scale from the California Homecare Workers Outcomes Survey (4 of 6 subscales)
Issues to Consider When Selecting Measures of Workload
- None of the measures included were developed for nursing homes or assisted living environments. Although two were developed for home care, the issue of workload is quite different in nursing home versus home care settings.
Alternatives for Measuring Workload
Quantitative Workload Scale from the Quality of Employment Survey
| Quantitative Workload Scale from the Quality of Employment Survey | ||
|---|---|---|
| Description | The Quantitative Workload Scale was developed for the Department of Labor as one component of the Quality of Employment Survey (Quinn & Shepard, 1974). Variations have been observed in many kinds of jobs. | |
| Measure | Workload | |
| Administration | Survey Administration (1) Paper and pencil (2) 2 minutes (3) 4 questions (4) 5-point Likert scale (very often to rarely) Readability | |
| Scoring | (1) Simple calculations. (2) Score = Average of the 4 items (Range 1 5). (3) Higher scores indicate higher workload. | |
| Availability | Free. | |
| Reliability | Internal consistency of scale is not reported. However, since items are highly correlated (.5 - .6), it may be suitable to use only one item. | |
| Validity | Criterion validity:
| |
| Contact Information | Not needed for use of this instrument. | |
Survey Items
These questions deal with different aspects of work. Please indicate how often these aspects appear in your job. The following response scale is used:
5-very often
4-fairly often
3-sometimes
2-occasionally
1-rarely
- How often does your job require you to work very fast?
- How often does your job require you to work very hard?
- How often does your job leave you with little time to get things done?
- How often is there a great deal to be done?
Role Overload Scale (from the Michigan Organizational Assessment Questionnaire or MOAQ)
| Role Overload Scale (from the Michigan Organizational Assessment Questionnaire or MOAQ) | ||
|---|---|---|
| Description | This scale is part of a widely used battery of assessment scales with reliabilities and validity well-established with industrial workers (Cammann et al., 1983). Feldman reports using the MOAQ with some adaptations with home care workers but does not report on this scale (1990). | |
| Measure | Role Overload | |
| Administration | Survey Administration (1) Paper and pencil (2) 2 minutes (3) 3 questions (4) 7-point Likert scale (strongly disagree to strongly agree) Readability | |
| Scoring | (1) Simple calculations. (2) Score = Average of the 3 items after reverse scoring item #2 (Range 17). (3) Higher scores indicate higher workload. | |
| Availability | Free. | |
| Reliability | Internal consistency of scale is .65 in original sample of 400 respondents with varied jobs. | |
| Validity | Criterion validity: The scale is negatively related to overall job satisfaction (higher workload, lower satisfaction). | |
| Contact Information | Not needed for use of this instrument. | |
Survey Items
A seven-point Likert scale is used as follows:
1--strongly disagree
2--disagree
3--slightly disagree
4--neither agree nor disagree
5--slightly agree
6--agree
7--strongly agree
- I have too much work to do to do everything well.
- The amount of work I am asked to do is fair. (reverse-scored)
- I never seem to have enough time to get everything done.
Stress/Burden Scale from the California Homecare Workers Outcomes Survey (4 of 6 subscales)17
| Stress/Burden Scale from the California Homecare Workers Outcomes Survey (4 of 6 subscales)17 | ||
|---|---|---|
| Description | Researchers at the University of California, Los Angeles developed the California Homecare Workers Outcomes Survey to compare outcomes (stress and satisfaction) between agency and client-directed workers and between family and non-family workers (Doty et al, 1998). In 1997, the survey was administered by telephone to 618 home care providers working in Californias In-Home Supportive Services (IHSS) program, a well-established program in California that provides both agency and client-directed services to residents living in their own homes that are aged, blind or disabled and reimburses any provider selected by eligible clients, including family members. Ten subscales were developed to measure these outcomes (6 subscales for stress/burden and 4 for satisfaction). Stress refers to how stressed home care workers feel when it comes to client safety, family issues, client behavioral problems, their relationship with the client, the client role in their work and their own emotional state. Satisfaction relates to how satisfied home care workers are with their job role, their self-assessment of performance, career benefits and independence and flexibility in their work schedule. | |
| Measure | Stress/Burden Scale (4 of 6 subscales) (1) Client safety concerns for provider (2) Family issues (3) Client behavioral problems (4) Emotional state of provider | |
| Administration | (1) Telephone interview (2) 4-5 minutes (3) 15 questions (4) 5-point Likert scale (very often to never or strongly agree to strongly disagree, or all to most of the time) Readability: Published data not available at this time. | |
| Scoring | (1) Simple calculations. (2) Score = Average of the 15 items (Range 1-5). (3) Higher scores indicate the most stress. | |
| Availability | Free. If using this measure, please cite the following: Benjamin, A.E., and Matthias, R.E. (2004). Work Life Differences and Outcomes for Agency and Consumer-Directed Home Care Workers. The Gerontologist, 44(4): 479-488. | |
| Reliability | Internal consistency ranges from .63 - .75 for subscales. | |
| Validity | Published data on validity not available at this time. | |
| Contact Information | Ruth Matthias, Ph.D UCLA School of Public Policy and Social Research 3250 Public Policy Building Los Angeles, CA 90095-1656 (310) 825-1951 matthias@ucla.edu | |
Survey Items (exact wording below)
Key to Which Questions Fall into Which Subscales
CS = Client Safety Concerns for the Provider subscale (4 items)
FI = Family Issues subscale (4 items)
CB = Client Behavioral Problems subscale (4 items)
E = Emotional State of Provider subscale (3 items)
| Never | Sometimes | Very Often | |||||
|---|---|---|---|---|---|---|---|
| CS | 1. | I worry that my client might do something dangerous when I am not there, like not turning off the stove. | 1 | 2 | 3 | 4 | 5 |
| CS | 2. | I worry about my client’s safety when I am not there. | 1 | 2 | 3 | 4 | 5 |
| CS | 3. | I worry that someone could easily take money or other things from my client when I am not there to protect him/her. | 1 | 2 | 3 | 4 | 5 |
| CS | 4. | I worry about how family members or others treat my client when I am not there. | 1 | 2 | 3 | 4 | 5 |
| Strongly Agree | Uncertain | Strongly Disagree | |||||
|---|---|---|---|---|---|---|---|
| FI | 1. | Some family members do not trust me. | 1 | 2 | 3 | 4 | 5 |
| FI | 2. | Some family members of the client criticize the work that I do. | 1 | 2 | 3 | 4 | 5 |
| FI | 3. | The family expects me to do things that are not part of my job. | 1 | 2 | 3 | 4 | 5 |
| FI | 4. | The family appreciates what I do for the client. | 1 | 2 | 3 | 4 | 5 |
| Never | Sometimes | Very Often | |||||
|---|---|---|---|---|---|---|---|
| CB | 1. | How often has a client yelled at you in the past 6 months? | 1 | 2 | 3 | 4 | 5 |
| CB | 2. | How often has a client threatened you in the past 6 months? | 1 | 2 | 3 | 4 | 5 |
| CB | 3. | How often do you experience conflict between what client wants you to do and what you want to do? | 1 | 2 | 3 | 4 | 5 |
| CB | 4. | (Sum of “yes” responses for the following 5 items:
| 1 | 2 | 3 | 4 | 5 |
| All | Some | None of the Time | |||||
|---|---|---|---|---|---|---|---|
| E | 1. | How much of the time during the past month did you have a lot of energy? | 1 | 2 | 3 | 4 | 5 |
| E | 2. | How much of the time during the past month have you felt calm and peaceful? | 1 | 2 | 3 | 4 | 5 |
| E | 3. | How much of the time during the past month have you felt downhearted and blue? | 1 | 2 | 3 | 4 | 5 |
Instruments Which Require New Data Collection -- Measures of the Organization
Organizational Culture
Introduction
Definition of Organizational Culture
Culture is defined as the values, beliefs, and norms of an organization that shape its behavior. Data on culture should be collected from workers at all levels of the organization. Significant organizational change, such as the transition to a continuous quality improvement mode of operating, requires a culture that supports both the process of change and the substance of the intended change. Type of organizational culture has been found to be related to continuous quality improvement (CQI) implementation (Wakefield et al., 2001). There is increasing acknowledgement among providers and researchers alike about the importance of assessing capacity for change by tapping into organizational culture (Scott et al., 2003).
Overview of Selected Measures of Organizational Culture
There are several approaches to measuring organizational culture. The measures included here were selected because they have been used in LTC organizations and are free to use:
- LEAP Leadership Behaviors and Organizational Climate Survey (1 of 2 subscales, Organizational Climate)
- LEAP Organizational Learning Readiness Survey
- Nursing Home Adaptation of the Competing Values Framework (CVF) Organizational Culture Assessment
Issues to Consider When Selecting Measures of Organizational Culture
- Some have argued that organizational culture (as distinct from but related to organizational climate) may not be adequately measured through attitudinal close-ended surveys (Bowers, 2001).
- If surveys are to be used to examine culture, instruments that tap multiple dimensions and ways of thinking about culture should be considered (to aim toward tapping some of the complexity of organizational culture).
Alternatives for Measuring Organizational Culture
LEAP Leadership Behaviors and Organizational Climate Survey (1 of 2 subscales, Organizational Climate)18
| LEAP Leadership Behaviors and Organizational Climate Survey (1 of 2 subscales, Organizational Climate)18 | ||
|---|---|---|
| Description | The LEAP Leadership Behaviors and Organizational Climate Survey is a 14-item questionnaire designed to measure nursing staffs perceptions about two specific areas: leadership effectiveness and the organizational climate. One subscale, the Leadership subscale, contains 10 items examining leadership behavior such as: informing, consulting/delegating, planning/organizing, problem solving, role clarifying, monitoring operations, motivating, rewarding, mentoring, and managing conflict. The second subscale, the Organizational Climate subscale, includes four items measuring the organizational climate including communication flow, human resources, motivational conditions, and decision-making practices. Questions were derived from the extensive work at The University of Michigan in the development of the Survey of Organizations questionnaire, an extensive survey of organizational conditions and practices utilized across many diverse industries (1970). The original tool was derived from a theoretical integrative model of leadership tested as a predictor of an organizations effectiveness (Bowers & Seashore, 1966). Organizational climate is conceptualized as a quality of the internal environment of an organization that is experienced by its members, influences their behavior, and reflects the values of the characteristics or attributes of the organization (Tagiuri & Litwin, 1968). | |
| Measure | Subscales (1 of 2) (1) Organizational climate | |
| Administration | Survey Administration (1) Paper and pencil (2) 2-3 minutes (3) 4 questions (4) 5-point Likert scale (very little to always) Readability | |
| Scoring | (1) Simple calculations. (2) Subscale score = Sum of 4 items (Range of 4 - 20) (3) Higher scores indicate better perceptions of organizational climate. | |
| Availability | Free with permission from author. | |
| Reliability | Internal consistency ranges from .54 to .62 for organizational climate items; .65 for the total organizational climate score. | |
| Validity | Construct validity and discriminant validity of organizational climate items reported four distinct clusters that relate to four concepts identified in the theoretical model of organizational climate. | |
| Contact Information | Permission to use this instrument can be obtained by contacting: Linda Hollinger-Smith, RN, PhD Director of Research Mather LifeWays Institute on Aging 1603 Orrington Avenue Suite 1800 Evanston, IL 60201 (847) 492-6810 Lhollingersmith@matherlifeways.com | |
Survey Items
| Very Little | Some | Always | ||||
|---|---|---|---|---|---|---|
| 1. | How often do you get information about what is going on in other parts of your facility? | 1 | 2 | 3 | 4 | 5 |
| 2. | How much do you enjoy doing your daily work activities? | 1 | 2 | 3 | 4 | 5 |
| 3. | How much does other staff you work with give their best effort? | 1 | 2 | 3 | 4 | 5 |
| 4. | How much does administration ask for your ideas when decisions are being made? | 1 | 2 | 3 | 4 | 5 |
LEAP Organizational Learning Readiness Survey
| LEAP Organizational Learning Readiness Survey | ||
|---|---|---|
| Description | The LEAP Organizational Learning Readiness Survey is a 20-item questionnaire designed to measure the management style and learning readiness of an organization. The premise of a learning organization is one in which all employees and managers build their capacity to produce results as learning opportunities become personally rewarding and satisfying ongoing processes. In this environment, staff from all levels strives to achieve at the highest levels. This tool was built on the learning organization model proposed by Peter Senge who stated in his book, The Fifth Discipline: The Art and Practice of the Learning Organization that a learning organization is "...where people continually expand their capacity to create the results they truly desire, where new and expansive patterns of thinking are nurtured, where collective aspiration is set free, and where people are continually learning to see the whole picture (1990). The tool may be useful for organizations that wish to assess their current capacity and support for a culture of learning, targeting key areas to consider including management style and environmental factors that may impact the organizations capacity to develop as a learning organization. Four styles of management (autocratic, custodial, supportive, and collegial) are assessed (three subscales per management style for a total of 12 subscales). Four dimensions of learning readiness (mobility, visioning, empowering, and evaluating) are assessed (two subscales per dimension for a total of 8 subscales). | |
| Measure | Management Style subscales (1) Autocratic (2) Custodial (3) Supportive (4) Collegial subscale Organization Readiness for Learning subscales | |
| Administration | Survey Administration (1) Paper and pencil (2) Data on time unavailable (3) 20 questions (4) 5-point Likert scale (almost never almost always (except for two reversed scales) Readability | |
| Scoring | (1) Simple calculations. (2) Subscale scores = Sum of items on the subscale (Range 20100). (3) Highest scored subscales determine the management style. Higher scores on Organization Readiness for Learning scale indicate greater readiness for learning in each dimension. | |
| Availability | Free with permission from author. | |
| Reliability | Internal consistency for management styles: autocratic subscales - .798; custodial subscales - .623; supportive subscales - .709; collegial subscales - .820. Internal consistency for learning readiness dimensions: mobility subscales - .642; visioning subscales- .841; empowering subscales - .644; evaluating subscales - .726. | |
| Validity | Construct validity of the management scale and learning readiness scale supported. For the management scale, three components were identified: autocratic style, custodial style, and supportive/collegial style. The supportive/collegial styles of management best support organizational learning cultures. For learning readiness, all factors loaded on a single dimension which was to be expected given all four dimensions are key to establish an organizations readiness to learn. | |
| Contact Information | This instrument can be used with the authors permission and is available online at http://www.l-e-a-p.com. The author can be reached at: Linda Hollinger-Smith, RN, PhD Director of Research Mather LifeWays Institute on Aging 1603 Orrington Avenue, Suite 1800 Evanston, IL 60201 (847) 492-6810 lhollingersmith@matherlifeways.com | |
Survey Items
Evaluation of the long-term care facility's learning readiness focuses on assessment of three key areas. These are: management style, readiness for learning, and capacity to implement and sustain LEAP.
We ask that the facility's administrator and director of nursing each complete a survey. Additionally, you may want others in the organization to complete a survey. We can supply you with additional surveys. Please respond to each item in the survey. We will compile the results and provide your facility with a summary of our assessment.
| Almost never | Seldom | Occasionally | Frequently | Almost always | ||
|---|---|---|---|---|---|---|
| 1. | Some employees fear for their jobs. | |||||
| 2. | Management includes employees in organizational decisions. | |||||
| 3. | Management encourages employees to give their best effort. | |||||
| 4. | Most employees feel secure working here and therefore do not leave | |||||
| 5. | Even though employees have good benefits, they tend to give minimal job performance. | |||||
| 6. | Most employees seem content in their positions and are not interested in job promotion. | |||||
| 7. | Management is respected by employees. | |||||
| 8. | Employees feel a part of the organization. | |||||
| 9. | Managers regularly recognize employees for their job performance. | |||||
| 10. | There is a feeling of teamwork in this organization among managers and employees. | |||||
| 11. | Employees are enthusiastic about improving job performance. | |||||
| 12. | Employees are valued by this organization. | |||||
| 13. | This organization encourages employees to learn and develop new skills. | |||||
| 14. | Employees and managers in this organization have the capacity to apply new knowledge to future clinical situations. | |||||
| 15. | The climate of our organization recognizes the importance of learning. | |||||
| 16. | Upper management supports the vision of a learning environment that supports learning and development across all levels of staff and managers. | |||||
| 17. | Our managers have the capacity to be mentors and coaches to facilitate learning among staff. | |||||
| 18. | Our organization believes staff should feel empowered and participate in learning and development experiences. | |||||
| 19. | Following trends in our organizations practice, management, and staff through benchmarking would be valuable and utilized for evaluation purposes. | |||||
| 20. | Our organization supports creativity to improve care practices for our residents. |
Nursing Home Adaptation of the Competing Values Framework (CVF) Organizational Culture Assessment
| Nursing Home Adaptation of the Competing Values Framework (CVF) Organizational Culture Assessment | ||
|---|---|---|
| Description | The Competing Values Framework (CVF) Organizational Assessment is a model of organizational culture as the expression of competing values (Quinn & Kimberly, 1984). The model has two axes reflecting different values: (1) flexibility and change versus stability and control; and, (2) internal emphasis on well-being and development of people in an organization versus external focus on well-being and development of the organization. Together, these two dimensions form four quadrants, each representing a set of organizational effectiveness indicators (human relations, growth, resource acquisition, stability/control, and productivity/efficiency). Jill Scott-Cawiezell and colleagues from the Colorado Foundation for Medical Care (the QIO of Colorado) and MetaStar (the QIO of Wisconsin) have developed an adaptation of the CVF for use with nursing home staff at all levels (Scott-Cawiezell et al., in press). The four value quadrants within the context of the nursing home include:
It is not expected that any organization will be totally characterized as only one of the culture types mentioned above (e.g., group, market) when perceptions of multiple respondents are combined. However, some studies have found that the group or developmental culture type is more associated with likelihood to succeed in implementing CQI (Cameron & Quinn, 1999). | |
| Measure | Subscales (e.g., Culture Types) (1) Group (2) Developmental (3) Hierarchy (4) Market | |
| Administration | Survey Administration (1) Paper and pencil (2) 10 minutes (3) 24 questions (4 in each of 6 sets) (4) Distribution of 100 points for each of 6 sets of 4 categories. Respondents must know basic math. Readability | |
| Scoring | (1) Multi-step calculations. (2) Subscale (culture type) score = Validate that each section adds up to 10 and then multiply each section total by 10 to maintain relative value on a 100 point scale.
(3) For each type, higher scores indicate the organization is perceived to reflect more characteristics of this type (than other types). | |
| Availability | Free with permission from the author. | |
| Reliability | Measures of internal consistency can not be computed because the CVF is a scale with relative rather than absolute values (Scott-Cawiezell et al., in press). | |
| Validity | Construct validity:
| |
| Contact Information | For information on the instrument and its availability, contact: Jill Scott-Cawiezell, PhD, RN University of Missouri-Columbia S235 Sinclair School of Nursing Building (573) 882-024 scottji@missouri.edu | |
Survey Items
Key to Which Questions Fall into Which Subscales
All “A” statements fall into the “Group” subscale (6 items)
All “B” statements fall into the “Developmental” subscale (6 items)
All “C” statements fall into the “Hierarchy” subscale (6 items)
All “D” statements fall into the “Market” subscale (6 items)
Six sets of statements about your nursing home are listed below. Each set has 4 statements that may describe where you work. Rate each set of statements separately. For each set, first read all 4 statements. Then decide how to split up 10 points across the 4 to show how much each of these, compared with the other 3 statements, describes your nursing home.
The following examples show how you might do this:
| Example #1 | Example #2 | Example #3 |
|---|---|---|
| A. 10 | A. 2 | A. 4 |
| B. 0 | B. 3 | B. 2 |
| C. 0 | C. 2 | C. 4 |
| D. 0 | D. 3 | D. 0 |
| Total = 10 | Total = 10 | Total = 10 |
| Set 1: My nursing home is: | ||
|---|---|---|
| A. | A very personal place like belonging to a family. | _____ |
| B. | A very business-like place with lots of risk-taking. | _____ |
| C. | A very formal and structured place with lots of rules and policies. | _____ |
| D. | A very competitive place with high productivity. | _____ |
| Add together A+B+C+D to make sure they equal 10: ___+___+___+___= 10 | ||
| Set 2: The nursing home administrator is: | ||
|---|---|---|
| A. | Like a coach, a mentor, or a parent figure. | _____ |
| B. | A risk-taker, always trying new ways of doing things. | _____ |
| C. | A good organizer; an efficiency expert. | _____ |
| D. | A hard-driver; very competitive and productive. | _____ |
| Add together A+B+C+D to make sure they equal 10: ___+___+___+___= 10 | ||
| Set 3: The management style at my nursing home is: | ||
|---|---|---|
| A. | Team work and group decision making. | _____ |
| B. | Individual freedom to do work in new ways. | _____ |
| C. | Job security, seniority system, predictability. | _____ |
| D. | Intense competition and getting the job done. | _____ |
| Add together A+B+C+D to make sure they equal 10: ___+___+___+___= 10 | ||
| Set 4: My nursing home is held together by: | ||
|---|---|---|
| A. | Loyalty, trust and commitment | _____ |
| B. | A focus on customer service | _____ |
| C. | Formal procedures, rules and policies | _____ |
| D. | Emphasizing productivity, achieving goals, getting the job done | _____ |
| Add together A+B+C+D to make sure they equal 10: ___+___+___+___= 10 | ||
| Set 5: The work climate in my nursing home: | ||
|---|---|---|
| A. | Promotes trust, openness, and people development | _____ |
| B. | Emphasizes trying new things and meeting new challenges | _____ |
| C. | Emphasizes tradition, stability, and efficiency | _____ |
| D. | Promotes competition, achievement of targets and objectives | _____ |
| Add together A+B+C+D to make sure they equal 10: ___+___+___+___= 10 | ||
| Set 6: My nursing home defines success as: | ||
|---|---|---|
| A. | Team work and concern for people | _____ |
| B. | Being a leader in providing the best care | _____ |
| C. | Being efficient and dependable in providing services | _____ |
| D. | Being number one when compared to other nursing homes | _____ |
| Add together A+B+C+D to make sure they equal 10: ___+___+___+___= 10 | ||
REFERENCES
AHCA (2003). Results of the 2002 AHCA Nursing Position Vacancy and Turnover Survey.
Aiken, L., Clarke, S., Sloane, D., Sochalski, J., & Silber, J. (2002). Hospital nurse staffing and patient mortality, nurse burnout, and job dissatisfaction. Journal of the American Medical Association, 288(16), 1987-1993.
Anderson, R.A., Issel, L.M. & Mc Daniel, R.R. (2002). Relationship between management practice, staff turnover and resident outcomes in nursing homes. Paper presented at the annual meeting of the Academy of Management, August, 2002.
Astrom, S., Nilsson, M., Norberg, A., Sandman, P. O., & Winbald, B. (1991). Staff burnout in dementia care: relations to empathy and attitudes. International Journal of Nursing Studies, 28: 65-75.
Bailey, B.I. (1995). Faculty practice in an academic nursing care center model: autonomy, job satisfaction, and productivity. Journal of Nursing Education, 34(2): 84-86.
Balazek, M., personal interview. Standard errors for JOLTS measures across industries. Balazek_M@bls.gov. 2003
Balzer, W.K., Khim, J.A., Smith, P.C., Irwin, J.L., Bachiochi, P.D., Robie, C., et al. (1997). Users manual for the job descriptive index and job in general scales. Bowling Green, OH: Bowling Green State University.
Banaszak-Holl, J., & Hines, M.A. (1996). Factors associated with nursing home staff turnover. The Gerontologist, 36(4): 512-517.
Benjamin, A.E., & Matthias, R.E. Work life differences and outcomes for agency and consumer-directed home care workers. The Gerontologist, 44(4): 479-488.
Binstock, R.H. & Spector, W.D. (1997). Five priority areas for research on long-term care. Health Services Research, 32: 715-730.
Blegen, M.A. (1993). Nurses’ job satisfaction: a meta-analysis of related variables. Nursing Research, 42(1): 36-41.
Bouchard, T.J. (1997). Genetic influence on mental abilities, personality, vocational interests, and work attitudes. International Review of Industrial and Organizational Psychology, 12: 373-395.
Bowers, B. & Becker, M. (1992) Nurse’s aides in nursing homes: The relationship between organization and quality. The Gerontologist, 32(2): 360-366.
Bowers, B. (2001). Organizational change and workforce development in long term care. Paper prepared for Technical Expert Meeting, Washington DC.
Brannon, D. & Streit, A. (1991). The predictive validity of the job characteristics model for nursing home work performance. Academy of Management Best Papers Proceedings, (ed.) J. Wall and L. Jauch.
Brannon, D., Zinn, J., Mor, V.M. & Davis, J. (2002). An exploration of job, organizational and environmental factors associated with high and low nursing assistant turnover. The Gerontologist, 42(2): 159-168.
Brief, A.P. & Roberson, L. (1989). Job attitude organization: An exploratory study. Journal of Applied Social Psychology, 19: 717-727.
Brown, S.P. (1996). A meta analysis and review of organizational research on job involvement. Psychological Bulletin, 120: 235-255.
Bureau of Labor Statistics. Job Vacancy Survey. http://www.jvsinfo.org/
Bureau of Labor Statistics (2003). People are asking. Retrieved from http://www.bls.gov/iif/peoplebox.htm#faqc on March 5, 2003.
Bureau of Labor Statistics (2003). How to compute a firm's incidence rate for safety management. Retrieved from http://www.bls.gov/iif/osheval.htm on Marcy 5, 2003.
Bureau of Labor Statistics (2004). Lost worktime injuries and illnesses: characteristics and resulting days away from work, 2002. See: News from the United States Department of Labor at: http://www.bls.gov/news.release/pdf/osh2.pdf.
Burke R.J. (2003). Hospital restructuring, workload, and nursing staff satisfaction and work experiences. Health Care Management, 22(2): 99-107
Cameron, K. & Quinn, R. (1999). Diagnosing and changing organizational culture based on the Competing Values Framework. Addison Wesley: Reading, MA.
Cammann, C., Fichman, M., Jenkins, D., & Klesh, J. R. (1983). Assessing the attitudes and perceptions of organization members. In S. E. Seashore, E. Lawler, P. Mirvis, & C. Cammann (Eds.), Assessing organizational change: A guide to field practice (71-138). New York: John Wiley.
Cantor, M. & Chichin, E. (1989). Stress and strain among the homecare workers of the frail elderly. New York: The Brookdale Institute on Aging, Third Age Center, Fordham University.
Centers for Disease Control and Prevention. Measurement Properties: validity, reliability, and responsiveness. http://www.cdc.gov/hrqol/measurement_properties/ This web page was last reviewed and updated September 24, 2002.
Chandler, G.E. (1986). The relationship of nursing work environment to empowerment and powerlessness. Unpublished doctoral dissertation. University of Utah.
CMS/Abt Associates (2001). Appropriateness of minimum nurse staffing ratios in nursing Homes Phase II Final Report. [http://www.cms.gov].
Cocco, E., Gatti, M., Augusto de Mendonca Lima, C., & Camus, V. (2003). A comparative study of stress and burnout among staff caregivers in nursing homes and acute geriatric wards. International Journal of Geriatric Psychiatry, 18: 78-85.
Cohen-Mansfield, J. (1997). Turnover among nursing home staff. A review. Nursing Management, 28(5): 59-62, 64.
Conger, J.A. & Kanungo, R.N. (1988). The empowerment process: Integrating theory and practice. Academy of Management Review, 13(3): 471-482.
Cook, J.D., Hepworth, S.J., Wall, T.D., & Warr, P.B. (1981). The experience of work. London: Academic Press.
Cordes, C.L., & Dougherty, T.W. (1993). A review and an integration of research on job burnout. Academy of Management Review. 18(4): 621-656.
Doty, P., A.E. Benjamin, R.E. Matthias, & T.M. Franke. In-Home Supportive Services for the Elderly and Disabled: A Comparison of Client-Directed and Professional Management Models of Service Delivery. Non-Technical Summary Report. Washington, D.C.: U.S. Department of Health and Human Services, Assistant Secretary for Planning and Evaluation, April 1999. [http://aspe.hhs.gov/daltcp/reports/ihss.htm]
Eaton, S.C. (1997). PA nursing homes: promoting quality care and quality jobs. Keystone Research Center High Road Industry Series #1.
Feldman, P., Sapienza, A. & Kane, N. (1990). Who cares for them? Workers in the home care industry. New York: Greenwood Press.
Feldman, P.H. personal communication. 2003.
Feuerberg, M. & White, A. (2001). Nursing staff turnover and retention in nursing homes. In CMS/Abt Associates, Appropriateness of minimum nurse staffing ratios in Nursing Homes Phase II Final Report (Chapter 4, pp. 4-1 to 4-77). www.cms.gov.
Florida Dept of Elder Affairs (2000). Recruitment, training, employment and retention report on CNAs in Florida’s nursing homes.
Fried, Y. & Ferris, G. (1987). The validity of the job characteristics model: a review and meta-analysis. Personnel Psychology, 40: 287-322.
Friedman, S., Daub, C., Cresci, K., & Keyser, R. (1999). A comparison of job satisfaction among nursing assistants in nursing homes and the Program of All-Inclusive Care for the Elderly (PACE). The Gerontologist, 39: 434-439.
Garland, T., Oyabu, N. & Gipson, G. (1988). Stayers and leavers: a comparison of nurse assistants employed in nursing homes. Journal of Long-Term Care Administration, 16: 23-29.
Gleason-Wynn, P., & Mindel, C.H. (1999). Proposed model for predicting job satisfaction among nursing home social workers. Journal of Gerontological Social Work, 32(3): 65-79.
Gordon, G.K. & Stryker, R. (1994). Creative Long-Term Care Administration. Charles C. Thomas, publisher.
Grau, L., Chandler, B., Burton, B., & Kilditz, D. (1991). Institutional loyalty and job satisfaction among nurse aides in nursing homes. Journal of Ageing and Health, 3(1): 47-65.
Grau, L., Colombotos, J., & Gorman, S. (1992). Psychological morale and job satisfaction among homecare workers who care for persons with AIDS. Women and Health, 18(1): 1-21.
Grieshaber, L. Parker, P. & Deering, J (1995). Job satisfaction of nursing assistants in long-term care. Health Care Supervisor, 13: 18-28.
Hackman, J.R. & Oldham, G.R. (1975). Development of the Job Diagnostic Survey. Journal of Applied Psychology, 60: 159-170.
Hackman, J.R. & Oldham, G.R. (1980). Work Redesign. Reading, MA: Addison-Wesley.
Halbur, B. (1982). Turnover among Nursing Personnel in Nursing Homes. Ann Arbor: UMI Research Press.
Halbur, B.T. & Fears, N. (1986). Nursing personnel turnover rates turned over: potential positive effects on resident outcomes in nursing homes. The Gerontologist, 26(1): 70-76.
Harahan, M.F., Kiefer, K., Burns Johnson, A., Guiliano, J., Bowers, B., & Stone, R.I. (2003). Addressing shortages in the direct care workforce: the recruitment and retention practices of California’s not-for-profit nursing homes, continuing care retirement communities and assisted living facilities. California Association of Homes and Services for the Aging and the Institute for the Future of Aging Services.
Harris-Kojetin, L., Lipson, D., Fielding, J., Kiefer, K., & Stone, R.I. (2004). Recent findings on front-line long-term care workers: a research synthesis 1999-2003. A report for the Office of Disability Aging, and Long-Term Care Policy, Office of the Assistant Secretary for Planning and Evaluation, Department of Health and Human Services, Contract #HHS-100-01-0025. [http://aspe.hhs.gov/daltcp/reports/insight.htm]
Herschfeld, R. (2000). Does revising the intrinsic and extrinsic subscales of the Minnesota Satisfaction Questionnaire short form make a difference? Educational and Psychological Measurement. 60(2): 255-270.
Hollinger-Smith, L. personal communication. L.E.A.P. State of Illinois LTC Initiative. 2002.
Hollinger-Smith, L., Lindeman, D, Leary, M. & Ortigara, A. (2002). Building the foundation for quality improvement: LEAP for a quality long term care workforce. Seniors Housing and Care Journal, 10(1), pp. 31-43.
Howe, S.R. (2003). Evaluation of the Talbert House Training Initiative. KnowledgeWorks Foundation.
Idaszak, J.R. & Drasgow, F. (1987). A revision of the Job Diagnostic Survey: elimination of a measurement artifact. Journal of Applied Psychology, 72(1): 69-74.
Institute of Medicine (1989). Allied health services: avoiding the crisis. Washington, DC: National Academies Press.
Iowa Caregivers Association (2000). Certified nursing assistant recruitment and retention project final report. Iowa Department of Human Services.
Ironson, G.H., Brannick, M.T., Smith, P.C., Gibson, W.M., & Paul, K.B. (1989). Construction of a job in general scale: a comparison of global, composite, and specific measures. Journal of Applied Psychology, 74: 193-200.
Irvine, D., Leatt, P., Evans, M.G. & Baker, R.G. (1999). Measurement of staff empowerment within health services organizations. Journal of Nursing Management, 7(1), 79-96.
Jenkins, H., & Allen, C. (1998). The relationship between staff burnout/distress and interactions with residents in two residential homes for older people. International Journal of Geriatric Psychiatry, 13: 466-472.
Kanter, R. (1977). Men and Women of the Corporation. New York: Basic Books.
Karasek, R., Brisson, K., Kawakami, N., Houtman, I., Bongers, P. & Amick, B. (1998). The job content questionnaire (JCQ): an instrument for internationally comparative assessments of psychosocial job characteristics. Journal of Occupational Health Psychology, 3(4): 322-355.
Karner, T. (1998). Professional caring: homecare workers as fictive kin. Journal of Aging Studies, 12(1): 69-82.
Kettitz, G., Zbib, I. & Motwani, J. (1998). Validity of background data as a predictor of employee tenure among nursing aides in long-term care facilities. Health Care Supervisor, 16(3): 26-31.
Kinicki, A.J., McKee-Ryan, F.M., Schriesheim, C.A., & Carson, K.P. (2002). Assessing the construct validity of the Job Descriptive Index: A review and meta-analysis. Journal of Applied Psychology. 87(1): 14-32.
Klakovich, M. (1995). Development and psychometric evaluation of the Reciprocal Empowerment Scale. Journal of Nursing Measurement, 3(2): 127-143.
Konrad, T. & Morgan, J. (2002). Where have all the nurse aides gone? Part II. North Carolina Institute on Aging.
Konrad, T. 2003. Where have all the nurse aides gone? Part III. Report prepared for the North Carolina Division of Facility Services and the Kate B. Reynolds Charitable Trust. North Carolina Institute on Aging. http://www.aging.unc.edu/research/winastepup/reports/aidespart3.pdf
Konrad, T. & Morgan, J. 2003. Workforce Improvement for Nursing Assistants: Supporting Training, Education, and Payment for Upgrading Performance: Executive Summary. http://www.aging.unc.edu/research/winastepup/reports/execsummary.pdf
Konrad, T.R. (2002). Descriptive results from the short turnover survey conducted for the Office of LTC of the NC Department of Health and Human Services.
Kraimer, M.L., Seibert, S.E. & Liden, R.C. (1999). Psychological empowerment as a multidimensional construct: A teat of construct validity. Educational and Psychological Measurement, 59(1): 127-142.
Kuokkanen, L. & Katajisto, J. (2003). Promoting or impeding empowerment? Nurses' assessments of their work environment. The Journal of Nursing Administration, 33(4): 209-215.
Landy, F.J. (1989). Psychology of work behavior. Homewood, IL: The Dorsey Press.
Larrabee, J.H., Janney, M.A., Ostrow, C.L., Withrow, M.L., Hobbs, G.R. Jr., & Burant, C. (2003). Predicting registered nurse job satisfaction and intent to leave. The Journal of Nursing Administration, 33(5):271-283.
Laschinger, H. (1996). Measuring empowerment from Kanter’s 1977 theoretical perspective. Journal of Shared Governance. 2(4): 23-26.
Laschinger, H., Finegan, J., Shamian, J., & Wilk, P. (2001). Impact of structural and psychological empowerment on job strain in nursing work settings. Journal of Nursing Administration, 31 (5): 260-272.
Leon, J., Marainen, J., & Marcotte, J. (2001). Pennsylvania’s frontline workers in long-term care: The provider organization perspective. Jenkintown, PA: Polisher Research Institute.
Levin, K., Hagerty, T., Heltemes, S., Becher, A. & Cantor, D. (2000). Job Openings and Labor Turnover Study (JOLTS) Pilot Study: Final Report. Westat, Rockville, MD.
Locke, E.A. (1976). The nature and causes of job satisfaction. In M.D. Dunnette (Ed.), The Handbook of Industrial and Organizational Psychology. Chicago: Rand McNally.
Lundstrom, T., Pugliese, G., Bartley, J., Cox, J., & Guither, C. (2002). Organizational and environmental factors that affect worker health and safety and patient outcomes. American Journal of Infection Control, 30(2): 93-106.
Lyonsm K.J., Lapin J, & Young, B. (2003). A study of job satisfaction of nursing and allied health graduates from a Mid-Atlantic university. Journal of Allied Health, 32(1): 10-7.
Marshall, N. & Barnett, R. (1993). Variations in job strain across nursing and social work specialties. Journal Community and Applied Social Psychology, 3: 261-271.
Marshall, N., Barnett, R. Baruch, G., & Pleck, J. (1991). More than a job: women and stress in caregiving occupations. Current Research on Occupations and Professions, 6: 61-81.
Maru, M. Job burnout: A review of recent literature. http://www.geocities.com/rpipsych/jobburnout.html.
Maslach, C., & Jackson, S.E. (1981). The measurement of experienced burnout. Journal of Occupational Behavior, 2: 99-113.
Maslach, C., & Jackson, S.E. Burnout Inventory Manual (1986). Palo Alto, California: Consulting Psychologists Press, Inc.
McGilton, K.S. & Pringle, D.M. (1999). The effects of perceived and preferred control on nurses’ job satisfaction in long term care environments. Research in Nursing and Health, 22: 251-261.
McGilton, K.S., O’Brien-Pallas, L.L., Darlington, G., Evans, M., Wynn, F. & Pringle, D. (2003). Effects of a relationship enhancing program of care on residents and nursing staff. Image: Journal of Nursing Scholarship, 35(20): 151-156.
Misener, TR & Cox, DL. (2001). Development of the Misener Nurse Practitioner Job Satisfaction Scale: Journal of Nursing Measurement, 9(1): 91-108.
Mobley, W.H., Horner, S.O., & Hollingsworth, A.T. (1978). An evaluation of precursors of hospital employee turnover. Journal of Applied Psychology, 63: 408-414.
Moniz, C.E., Millington, D., & Silver, M. (1997). Residential care for older people: job satisfaction and psychological health in care staff. Health and Social Care in the Community, 5(2): 124-133.
Mowday, R. & Steers, R. (1979). The measurement of organizational commitment. Journal of Vocational Behavior, 14: 224-247.
Mueller, C. & Wohlford, J. (2000). Developing a new business survey: Job openings and labor turnover survey at the Bureau of Labor Statistics. Paper presented at the Annual Meeting of the American Statistical Association, Indianapolis, IN.
Nagy, M.S. (2002). Using a single item approach to measure facet job satisfaction. Journal of Occupational and Organizational Psychology, 75: 77-86.
Noelker, L. & Ejaz, F. (2001). Final report; improving work settings and job outcomes for nursing assistants in skilled care facilities. Margaret Blenkner Research Institute. Report prepared for The Cleveland Foundation (grant #980508) and The Retirement Research Foundation (grant #99-39).
O’Reilly, C.A., J. A. Chatman, & D.F. Caldwell. (1991). People and organizational culture: A profile comparison approach to assessing person-organization fit. Academy of Management Journal, 34(3): 487-516.
Paraprofessional Healthcare Institute and the North Carolina Department of Health and Human Services’ Office of Long Term Care. (2004). Results of the 2003 national survey of state initiatives on the long-term care direct care workforce.
Parsons, S., Parker, K.P. & Ghose, R.P. (1998). A blueprint for reducing turnover among NAs: A Louisiana study. Journal of the Louisiana State Medical Society, 150: 545-553.
Peterson, M. & Dunnagan, T. (1998). Analysis of a worksite health promotion program's impact on job satisfaction. Journal of Occupational and Environmental Medicine, 40(11): 973-979.
Pillemer, K. (1997). Higher calling. Contemporary Long Term Care, 20: 50-52.
Pillemer, Karl (1997). Three "best practices" to retain nursing assistants. Nursing-Homes-Long-Term-Care-Management, 46 (3): 13-14.
Porter, L., Steers, R. & Mowday, R. (1974). Organizational commitment, job satisfaction, and turnover among psychiatric technicians. Journal of Applied Psychology, 59(5): 603-609.
Porter, L.W. & Lawler, E.E. (1968). Managerial Attitudes and Performance. Homewood, IL: Dorsey.
Poulin, J.E., & Walter, C.A. (1992). Retention plans and job satisfaction of gerontological social workers. Journal of Gerontological Social Work, 19(1): 99-114.
Price, J.L. & Bluedorn, A.C. (1979). Test of a causal model of turnover from organizations. In D. Dunkerley and G. Salaman (Eds.) The International Yearbook of Organizational Studies. London: Routledge and Kegan Paul.
Price, J.L. & Mueller, C.W. (1981). Professional Turnover: The Case of Nurses. New York: SP Medical and Scientific Books.
Price, J.L. & Mueller, C.W. (1986). Handbook of organizational measurement. Massachusetts: Pitman Publishing, Inc.
Pringle, D. (2000). Thoughts on working with cognitively impaired older people. http://www2.arts.ubc.ca/anso/graham/pringle2.htm.
Quinn, R.E., & J.R. Kimberly. (1984). Paradox, Planning, and Perseverance: Guidelines for Managerial Practice. Managing Organization Transitions, edited by J.R. Kimberly and R.E. Quinn. 295-313. Homewood, IL: Dow Jones-Irwin.
Quinn, R.P., & Shepard, L.J. (1974). The 1972-1973 quality of employment survey: Descriptive statistics, with comparison data from the 1969-1970 survey of working conditions. Ann Arbor: Institute for Social Research.
Quinn, R. Beyond Rational Management. (1988). Jossey-Bass San Francisco, CA.
Radice, B. (1994). The relationship between nurse empowerment in the hospital work environment and job satisfaction: a pilot study. Journal of the New York State Nurses Association, 25(2): 14-17.
Remsberg, R., Armacost, K. & Bennett, R. (1999). Improving nursing assistant turnover and stability rates in a long-term care facility. Geriatric Nursing, 20(4): 203-208.
Remsberg, R.E., Armcost, K.A. & Bennett, R.G. (1999). Improving NA turnover and stability rates in a LTC facility. Geriatric Nursing, 20(4): 203-208.
Renn, R. & Vandenberg. (1995). The critical psychological states: an underrepresented component in job characteristics model research. Journal of Management, 21(2): 279-303.
Rentsch, J. & Steel, R. (1998). Testing the durability of job characteristics as predictors of absenteeism over a six-year period. Personnel Psychology, 51: 165-190.
Richardson, B. & Graf, N. (2002). Evaluation of the Certified Nurse Assistant (CNA) MentorProgram: Surveys of Long Term Care Facility Administrators, CNA Mentors and Mentees. National Resource Center for Family Centered Practice, University of Iowa School of Social Work.
Robertson, D., Tjosvold, D., & Tjosvold, M. (1989). Staff relations and acceptance of the elderly in long-term care facilities. Journal of Long Term Care Administration, 17(3): 2-7.
Roller, W.K. (1999). Measuring Empowerment: The Perception of Empowerment Instrument (PEI). The Pfeiffer Annual.
Scarpello, V. & Campbell, J.P. (1983). Job satisfaction: Are the parts all there? Personnel Psychology, 36: 577-600.
Schaefer, J., & Moos, R. (1996). Effects of work stressors and work climate on long-term care staff’s job morale and functioning. Research in Nursing and Health, 19: 63-73.
Schriesheim, C.A., Powers, K.J., Scandura, T.A., Gardiner, C.C., & Lankau, M.J. (1993). Improving construct measurement in management research: Comments and a quantitative approach for assessing the theoretical content adequacy of paper and pencil survey type instruments. Journal of Management, 19: 385-417.
Scott, T., Mannion, R., Davies, H., & Marshall, M. (2003). The Quantitative measurement of organizational culture in health care: A review of the available instruments. Health Services Research, 38(3): 923-945
Scott-Cawiezell, J., Jones, K., Schenkman, M., Moore L, Vojir, C.(2004) Exploring nursing home staff’s perceptions of communication and leadership to facilitate quality improvement. Journal of Nursing Care Quality, 19:242-52.
Seavie, D. (2004) The Cost of Frontline Turnover in Long-Term Care. Better Jobs Better Care, Issue Brief 5. In press.
Senge, P. (1990). The fifth discipline: The art and practice of the learning organization. London: Random House.
Shortell, S.M., Jones, R.H., Rademaker, A.W., Gillies, R.R., Dranove, D.S., Hughes, E.F. et al. (1995). Assessing the impact of continuous quality improvement/total quality management: Concept versus implementation. Health Services Research, 30(2): 377-401.
Shortell, S.M., Gillies, R.R., Anderson, D.A. (2000). Remaking healthcare in America: Building organized delivery systems (2nd Edition). San Francisco: Jossey-Bass Publishers.
Shortell, S., Jones, R., Rademaker, A. (2000). Assessing the impact of total quality management and organization culture of multiple outcomes of care for coronary artery bypass graft surgery patients. Medical Care, 38(2): 207-217.
Smith, P.C., Kendall, L.M., & Hulin, C.L. (1969). The Measurement of Satisfaction in Work and Retirement. Chicago: Rand McNally.
Spector, P.E. (1985). Measurement of human service staff satisfaction: Development of the Job Satisfaction Survey. American Journal of Community Psychology, 13(6): 693-713.
Spector, P.E. (1997). Job Satisfaction: Application, Assessment, Causes, and Consequences. Thousand Oaks, CA: Sage.
Spreitzer, G.M. (1995). Psychological empowerment in the workplace: Dimensions, measurement and validation. Academy of Management Journal. 38(5): 1442-1456.
Spreitzer, G.M. (1995). An empirical test of a comprehensive model of intrapersonal empowerment in the workplace. American Journal of Community Psychology, 23(5): 601-629.
Stamps, P. (1997). Nurses and Work Satisfaction: An Index for Measurement. Chicago: Health Administration Press.
Steers, R.M. & Rhoades S.R. (1978). Major influences on employee attendance: A process model. Journal of Applied Psychology, 63: 391-407.
Stone, R.I., & Reinhard S. (2001). Promoting quality in nursing homes: Evaluating the Wellspring Model. Final Report.
Straker, J.K. & Atchley, R.C. (1999). Recruiting and retaining frontline workers in LTC: Usual organizational practices in Ohio. Scripps Gerontology Center, Miami University: Oxford, OH.
Streit A, & Brannon D. (1994). The effect of primary nursing job design dimensions on caregiving technology and job performance in nursing homes. Health Services Management Research, 7(4): 271-281.
Stryker, R. (1982). The effect of managerial interventions on high personnel turnover in nursing homes. Journal of Long-Term Care Administration, 10(2): 21-33.
Taber, T. & Taylor, E. (1990). A review and evaluation of the psychometric properties of the job diagnostic survey. Personnel Psychology, 43: 467-500.
Tagiuri, R., & Litwin, G. (Eds.). 1968. Organizational climate: Explorations of a concept. Boston: Harvard Business School.
Taylor, J. C., & Bowers, D. G. (1972). Survey of organizations: a machine-scored standardized questionnaire instrument. Ann Arbor: Center for Research on Utilization of Scientific Knowledge, University of Michigan.
Thomas, K. W., & Velthouse, B. A. (1990). Cognitive elements of empowerment. Academy of Management Journal, 15, 666-681.
Tonges, M.C., Rothstein H, & Carter HK. (1998). Sources of satisfaction in hospital nursing practice. A guide to effective job design. Journal of Nursing Administration, 28(5):47-61.
Tonges, M.C., (1998). Job design for nurse case managers. Intended and unintended effects on satisfaction and well-being. Nursing Case Management, 3(1):11-23.
University of Western Ontario Workplace Empowerment Program. http://publish.uwo.ca/~hkl/program.html.
Upenieks V. (2000). The relationship of nursing practice models and job satisfaction outcomes. Journal of Nursing Administration, 30(6): 330-5.
Wagnild, G. (1988). A descriptive study of nurse’s aide turnover in long-term care facilities. Journal of Long-Term Care Administration, 16(1): 19-23.
Wakefield, B.J., Blegen, M.A., Uden-Holman, T., Vaughn, T., Chrischilles, E., & Wakefield, D. (2001). Organizational culture, continuous quality improvement, and medication administration error reporting. American Journal of Medical Quality, 16(4): 128-34.
Wanous, J.P., Reichers, A.E., & Hudy, M.J. (1997). Overall job satisfaction: How good are single item measures? Journal of Applied Psychology, 82: 247-252.
Waxman, H., Carner, E., & Berkenstock, G. (1984). Job turnover and job satisfaction among nursing home aides. The Gerontologist, 24: 503-509.
Wunderlich, G., Sloan, F. & Davis, C. (Eds.). (1996) Nursing staff in hospitals and nursing homes: Is it adequate? Institute of Medicine. Washington, DC: National Academy Press.
Wunderlich, G. (2000). Improving the Quality of Long-Term Care. The Institute of Medicine.
Yeatts, D., Cready, C., Ray, B., DeWitt, A., & Queen, C. (2004). Self-managed work teams in nursing homes: implementing and empowering nurse aide teams. The Gerontologist, 44: 256-261.
Zammuto, R.F., & J.Y. Krakower. (1991). Quantitative and qualitative studies of organizational culture. Organizational Change and Development, 5: 83-114.
NOTES
-
Some estimates have shown that it costs nursing homes $3,000 to $4,000 to replace a nursing assistant who resigns or is fired (Noelker and Ejaz, 2001). These costs are likely underestiamted because they are generally based on direct care costs and do not account for indirect costs, which are more difficult to quantify (Seavie, 2004).
-
To date, more research has been conducted on measuring employee outcomes and experiences in acute care settings, so many instruments in the Guide are those used in these settings. These instruments have been included because they can be applied to LTC settings.
-
However, we strongly encourage organizations to "pre-test" any instrument with a small number of DCWs in their setting before using it with the entire community, facility, agency or unit. Testing can help uncover questions that do not make sense to DCWs, are hard to understand, or are not appropriate.
-
Under the scope of this Guide, "research purposes" means that instruments are used solely by providers and their staff (or in collaboration with researchers or data collection vendors) to obtain information about their organization and, ultimately, use it for internal quality improvement at their organizations.
-
Absenteeism and use of temporary workers were excluded because valid instruments for measuring them were unavailable.
-
Some surveys in this Guide address wages and benefits by asking employees how they feel about their wage and benefit offerings.
-
Numerous instruments have been developed which measure retention similarly to those selected: CMS/Abt Associates (2001); Garland, Oyabu and Gipson (1988); Iowa Caregivers Association (2000); Kettlitz, Zbib and Motwani (1998); Konrad and Morgan (2002); and Stone, et al., (2001). For more information on these instruments, consult the References section of this Guide.
-
Numerous instruments have been developed which measure turnover similarly to those selected (though they may not capture as much detail): AHCA (2003); Anderson et al. (2002); Banaszak-Hall and Hine (1996); Brannon et al. (2002); CMS/Abt Associates (2001); Florida Department of Elder Affairs (2000); Halbur and Fears (1986); Hollinger-Smith (2002); Remsburg, Armcost and Bennett (1999); Straker and Atchley (1999); Stryker (1982); Gordon and Stryker (1994); U.S. Department of Labor (JOLTS); U.S. Department of Personnel; Wagnild (1988); Parsons et al. (1998); and Waxman et al. (1984). For more information on these instruments, consult the References section of this Guide.
-
A 2003 American Health Care Association (AHCA) study used a vacancy rate calculation similar to the one used by Leon et al. For more information on this instrument, consult the References section of this Guide.
-
The other three subscales of the Conditions for Work Effectiveness Questionnaire II (CWEQ II) can be found in Appendix G.
-
The other subscale of the Job Characteristics Scales (JCS) of the Job Diagnostic Survey (JDS) Revised can be found in Appendix G.
-
The Job Content Questionnaire is managed by Dr. Karasek at the JCQ Center. The instrument is copyrighted and not in the public domain. Use of the instrument for research purposes is free for studies involving fewer than 750 subjects. The use fee for studies involving 750-2000 subjects is $.50 per subject and for studies with sample sizes 20,000-40,000, it is $.10. You can contact Dr. Robert Karasek to obtain use contract at Professor of Work Environment, University of MA Lowell, One University Ave., Kitson 200, Lowell, MA 01854-2867.
-
The other four subscales of the Stress/Burden Scale from the California Homecare Workers Outcomes Survey can be found in the Workload topic section of this Chapter.
-
The other subscale (Organizational Climate) of the LEAP Leadership Behaviors and Organizational Climate Survey can be found in the Organizational Culture topic section of this Chapter.
-
All subscales of the Job Role Quality Questionnaire can be found in the Job Design topic section of this Chapter.
-
The Job Content Questionnaire is managed by Dr. Karasek at the JCQ Center. The instrument is copyrighted and not in the public domain. Use of the instrument for research purposes is free for studies involving fewer than 750 subjects. The use fee for studies involving 750-2000 subjects is $.50 per subject and for studies with sample sizes 20,000-40,000, it is $.10. You can contact Dr. Robert Karasek to obtain use contract at Professor of Work Environment, University of MA Lowell, One University Ave., Kitson 200, Lowell, MA 01854-2867.
-
The other two subscales of the Stress/Burden Scale from the California Homecare Workers Outcomes Survey can be found in the Worker-Client/Resident Relationships topic section of this Chapter.
-
The other subscale (Leadership) of the LEAP Leadership Behaviors and Organizational Climate Survey can be found in the Worker-Supervisor Relationships topic section of this Chapter.
APPENDIX A: FROM START TO FINISH -- SAMPLE SCENARIOS OF USING AND/OR CONSTRUCTING SURVEY INSTRUMENTS
This appendix is also available as a separate PDF File.
Appendix A includes two examples of how providers may use the survey instruments and/or their subscales included in this Guide. One example shows how a nursing home decided to measure one topic of interest (Job Design) among CNAs. The other illustrates how a continuing care retirement community (CCRC) constructed a multi-topic survey instrument from among the scales/subscales in the Guide. Both scenarios follow the steps laid out in Appendix C on data collection planning and implementation issues.
Measuring a Single Topic of Interest
Step #1: Purpose of data collection effort
A nursing home is experiencing high turnover among its CNAs. The Administrator wants to identify the parts of their jobs that CNAs are most concerned about and those that are least rewarding. Using this information, she would like to decide what actions management can take to try to address some of these problems.
Step #2: Specify the target population for data collection
CNAs in nursing home
Step #3: Determine project team, budget and schedule
The Administrator has started to call the nursing departments at local universities in an attempt to identify potential researchers with whom she can collaborate. She has also asked her Director of Human Resources to obtain price quotes from data collection vendors for conducting an employee survey of all 40 CNAs. Lastly, she has asked her Director of Finance to assess what kind of budget the organization has for staff development as she realizes she will have to act on the survey findings in order to maintain credibility among her CNAs. The survey fielding/data collection period will last for three weeks.
Step #4: Decide whether to include all members of the population or a sample
All 40 CNAs will be surveyed (a census).
Step #5: Decide the topics, subscales, and/or formulas on which to collect data
The nursing home Administrator has heard rumors about tension between CNAs and certain charge nurses. While she knows for certain that this topic area is one that her CNAs will be asked about, she really wants to keep the employee survey broad so she can really get at what may be causing the high CNA turnover she is experiencing.
Step #6: Decide how the questionnaire will be administered and set the response rate goal
The Administrator was able to form a relationship with a local researcher who will oversee the data collection process. Each CNA will receive an advance letter informing them of the survey and its goals. After the letters are distributed, a CNA staff meeting will be held to allow a question-and-answer period focused on the survey. The project team has determined that the survey will be administered by the researcher at pre-appointed times for each employee on each shift in a common area. Free food will be available in this common area during these times. A lock box will be placed in this room so that employees will feel comfortable responding. The goal is to have a 100 percent response rate among CNAs.
Step #7: Design and pretest the questionnaire
Together, the Administrator and researcher examined the instruments in the Guide around the topic areas of job satisfaction, job design and worker-supervisor relationships. Using the advice of her research collaborator, the Administrator has decided to keep the survey broad and use subscales of the Job Role Quality Questionnaire. She is particularly interested in assessing the degree to which her CNAs are concerned about the workplace environment and the degree to which they find certain aspects of their jobs rewarding in order to inform an appropriate organizational response. The JRQ includes five items to measure “job concern factors” and six items to measure “job reward factors.”
The Director of Nursing has recruited CNAs on each shift with whom the research collaborator, an objective outside source, will hold focus groups to get feedback on the length and content of the questionnaire.
Step #8: Monitor data collection
The researcher has agreed to provide frequent reports on response rates among the CNAs via email and phone calls with the Administrator, Director of Nursing, and Director of Human Resources. The survey will be conducted over a three-week period.
Step #9: Analyze data and present findings
Scores for each item in the eleven subscales were added across the 40 CNAs and then averaged. The results for each item are as follows:
Subscale averages for job concern factors (N = 40 CNAs)
| Subscale averages for job concern factors (N = 40 CNAs) | ||
|---|---|---|
| -- | Overload | 2.8 |
| -- | Dead-end job | 2.5 |
| -- | Hazard exposure | 1.1 |
| -- | Poor supervision | 3.4 |
| -- | Discrimination | 1.4 |
*For job concern factors, a lower score reflects better job design.
Subscale averages for job reward factors (N = 40 CNAs)
| Subscale averages for job reward factors (N = 40 CNAs) | ||
|---|---|---|
| -- | Helping others | 3.8 |
| -- | Decision authority | 3.0 |
| -- | Challenge | 2.9 |
| -- | Supervisor support | 1.8 |
| -- | Recognition | 1.9 |
| -- | Satisfaction with salary | 2.2 |
* For job reward factors, a lower score represents poorer job design.
The results of the survey show that the Administrator’s suspicion that the employee-supervisor relationships may need to be strengthened has been reinforced. Based on survey results, it appears that CNAs seem most concerned about the poor supervision they receive. They report the least rewarding parts of their jobs to be supervisor support and recognition they receive.
The Administrator and Director of Nursing are putting together a presentation for the next CNA staff meeting to report the survey results. At that time, they will solicit CNAs who would like to work on a team to develop a strategic plan for improving employee supervisor relationships and the overall work environment of the nursing home.
Constructing a Multi-Topic Survey Instrument
Step #1: Purpose of data collection effort
A CCRC wants to see how committed its employees are, how empowered they feel, and whether those who feel more empowered are more likely to be committed to their employer. The Administrator would like to see how employees’ perceptions in these areas differ across department so that an informed organizational response can be developed.
Step #2: Specify the target population for data collection
A random sample of employees in all departments of a CCRC.
Step #3: Determine project team, budget and schedule
This CCRC has a research unit on campus, so the Administrator will work with the Director of Research on campus to develop a reasonable schedule. The Administrator will also coordinate with the Director of Finance so the appropriate distribution of resources across the CCRC and its research unit is clearly spelled out among all parties.
The team determined ahead of time that the survey will be administered in-person, since many of the employees are Spanish-speaking. Added expenses the team has already considered include the hiring of outside interpreters, time staff spends on completing surveys (and the overhead costs associated with a lengthy survey process as a result), and efforts to increase response rate. The survey fielding/data collection period will last six weeks, including survey administration and follow-up to improve response rate.
Step #4: Decide whether to include all members of the population or a sample
Given the cost of doing in-person interviews and the number of staff members at the CCRC, the Administrator and Director of Research decided to draw a random sample of the 1,100 employees at the CCRC. Employees from all departments, on all shifts will be included in the random sample. The research unit will ensure that enough employees are drawn from each department to make appropriate comparisons and to ensure confidentiality.
Step #5: Decide the topics, subscales, and/or formulas on which to collect data
The Administrator and department heads determined that organizational commitment and empowerment among employees were the topic areas most appropriate to focus on for this first employee survey. After looking at these topic areas in the Guide, the team narrowed their choices to the following scales and subscales: Intent to Turnover measure (behavioral intent to leave job) from the Michigan Organizational Assessment Questionnaire and three items from the opportunity subscale of the Conditions for Work Effectiveness Questionnaire (CWEQ I) and (CWEQ II Short Form). A total of 6 items were chosen to keep the in-person survey short.
The specific items selected, which include entire subscales,1 are:
Items from the Michigan Organizational Assessment Questionnaire -- Intent to Turnover measure (3 items):
Here are some statements about you and your job. How much do you agree or disagree with each? (Likert Scale ranging from 1-7, where 1 = strongly disagree and 7 = strongly agree.)
Item #1. I will probably look for a new job in the next year.
Item #2. I often think about quitting.
Please answer the following question.
Item #3. How likely is it that you could find a job with another employer with about the same pay and benefits you now have? (Likert Scale ranging from 1-7, where 1 = not likely at all and 7 = extremely likely)
Items from the Conditions for Work Effectiveness Questionnaire (CWEQ I) and (CWEQ II Short Form) -- Opportunity subscale (3 items):
Items #1-#3. How much of each kind of opportunity do you have in your present job? (Likert Scale ranging from 1-5, where 1 = None and 5 = A Lot)
- Challenging work.
- The chance to gain new skills and knowledge on the job.
- Tasks that use all of your own skills and knowledge.
Step #6: Decide how the questionnaire will be administered and set the response rate goal
The team determined that it would like a 70-percent response rate across the CCRC. The questionnaire will be administered in-person. The Director of Human Resources will work with each department head to schedule times for employee surveys. At least 2 interviewers will be available per shift. Survey interviews will be conducted on campus, in areas away from the departments in which interviewed employees work. Advance letters and reminder postcards will be mailed to selected staff at their residence, flyers will be posted throughout the campus and a “Share your Voice!” kick-off meeting will be held the week survey administration begins where refreshments will be served and door prizes given out.
Step #7: Design and pretest the questionnaire
Because this CCRC has many Spanish-speaking employees, cognitive testing will be done on the survey item translation. Pretesting will also be conducted with 10 English-speaking employees.
Step #8: Monitor data collection
Survey fielding will be conducted over a six-week period. The research unit on the CCRC campus and the department heads will meet weekly to discuss the progress of data collection. That way, the team is updated on the survey response rate and can, subsequently, strategize on what types of efforts are needed to increase the response rate (if any).
Step #9: Analyze data and present findings
Below is an illustrative example of the scores that correspond to answers three workers gave to the six questionnaire items. The CCRC will tabulate the results of all responding employees (of the random sample) using this same scoring process.
| Worker ID | Intent to Turnover Items (response scale ranges from 1 to 7) | Conditions for Work Effectiveness Questionnaire II Items (response scale ranges from 1 to 5) | ||||
|---|---|---|---|---|---|---|
| Item #1 | Item #2 | Item #3 | Item #1 | Item #2 | Item #3 | |
| Worker #1 | 2 | 3 | 3 | 4 | 3 | 3 |
| Worker #2 | 6 | 4 | 2 | 4 | 2 | 2 |
| Worker #3 | 3 | 3 | 4 | 5 | 4 | 3 |
To calculate the score for each employee for the behavioral intent to leave job subscale, sum the scores given for all three items. In this example, below are the scores for each worker on this organizational commitment measure.
Worker #1: 8 = (2 + 3 + 3)
Worker #2: 12 = (6 + 4 + 2)
Worker #3: 10 = (3 + 3 + 4)
Lower scores on this measure indicate greater organizational commitment, with possible scores on this 3-item measure ranging from 3 to 21. At the individual worker level, worker #1 shows the highest commitment (score of 8) followed by worker #3 (score of 10), with worker #2 (score of 12) showing the least commitment.
To calculate the score for each employee for the opportunity subscale of the “Conditions for Work Effectiveness Questionnaire II,” average the scores given for all three items. In this example, below are the scores for each worker on this empowerment measure.
Worker #1: 3.3 = [(4 + 3 + 3)/3] = 10/3 items
Worker #2: 2.7 = [(4 + 2 + 2)/3] = 8/3 items
Worker #3: 4.0 = [(5 + 4 + 3)/3] = 12/3 items
Higher scores on this measure indicate greater empowerment in the form of more perceived opportunity, with possible scores on this 3-item measure ranging from 1 to 5. At the individual worker level, worker #3 shows the greatest level of empowerment (score of 4.0) followed by worker #1 (score of 3.3), with worker #2 (score of 2.7) showing the least empowerment.
The average is usually the statistic used to indicate the summary score on a measure across all respondents when using Likert-type response scales. Using the empowerment measure above as an example, here is how to calculate the average empowerment score for all respondents.
Worker #1 total score + Worker #2 total score + Worker #3 total score
3 (number of respondents)
Working through this formula we get these figures below, for an average of 3.3 among all three workers:
3.3 + 2.7 + 4.0 = 10/3 = 3.3
So, on average, this sample of workers at this CCRC tend to feel that they have “some” opportunities at work. However, based on the score of 3.3, there is room for improvement toward a score of 4 or 5.
Management believes the needs of each department may differ and has decided to put together employee focus groups for each department. The goal of these focus groups is to get a sense of the types of things needed to make employees feel more empowered in their jobs. All employees will be given the opportunity to be part of the focus groups. After examining each department’s focus group findings and comparing across departments, management will work with teams of staff members (across all departments and titles) to determine how to allocate resources across all staff in the best manner. The ultimate goal is to increase satisfaction with the working environment and to improve retention of staff. Results of each stage in the process will be shared at all-staff meetings.
Notes
-
It is important to include all items in a subscale because our review and the findings on the properties of the instruments reported in this Guide are based on the entire subscales (not individual items within each subscale). If you choose to take only some items from a subscale, the properties we reported (e.g., reading level, reliability, validity) do not apply to the individual items.
APPENDIX B: OVERVIEW CHARTS OF CHAPTER 3 MEASURES, BY TOPIC
This appendix is also available as a separate PDF File.
Instruments Which Use Data Organizations May Already Collect
Injuries and Illnesses Instrument
| Bureau of Labor Statistics (BLS) Instrument for Injuries and Illnesses | ||
|---|---|---|
| Measure | Number of nonfatal injuries and illnesses X 200,000 Number of all employee hours worked (not including non-work time, such as vacation, sick leave, holidays, etc.) | |
| Administration | Data collected from employers via survey and payroll records. | |
| Scoring | Can be scored by hand. | |
| Availability | Free. | |
| Reliability | N/A | |
| Validity | N/A | |
Retention Instruments
| Leon, et al. Retention Instrument | Remsburg, Armacost, and Bennett Retention Instrument | ||
|---|---|---|---|
| Measure | # of nurse aides employed for less than one year total # employees at time of survey # of nurse aides employed for 3 years or more # of nurse aides employed for ten years or more | # of nurse aides employed for more than one year # of nurse aides on payroll on the last day of the fiscal year length of service for terminated employees and staff who remained | |
| Administration | Data collected from nursing home administrator via survey. | Data collected from human resource records. | |
| Scoring | Can be scored by hand. | Can be scored by hand. | |
| Availability | Free. | Free. | |
| Reliability | N/A | N/A | |
| Validity | N/A | N/A | |
Turnover Instruments
| Annual Short Turnover Survey of North Carolina Department of Health and Human Services’ Office of Long Term Care | Eaton Instrument for Measuring Turnover | Price and Mueller Instrument for Measuring Turnover | ||
|---|---|---|---|---|
| Measure | Total Separation = FT voluntary terminations + PT voluntary terminations + FT involuntary terminations + PT involuntary terminations --------------- # needed to be completely staffed by FT and PT staff Voluntary separation = Involuntary separation rate = | # full-time new hires over 12 months average # staff employed in that category over 12 months # part-time new hires over 12 months | Total # employed at Time 1 - # still employed at 12-month follow-up + involuntary terminations (“voluntary terminations”) --------------- Total # employed at Time 1 | |
| Administration | Data collected from employee payroll records. | Data collected from Medicaid cost reports. | Data collected from employee payroll records. | |
| Scoring | Can be scored by hand. | Can be scored by hand. | Can be scored by hand. | |
| Availability | Free. | Free. | Free. | |
| Reliability | N/A | N/A | N/A | |
| Validity | N/A | N/A | N/A | |
Vacancies Instruments
| Job Openings and Labor Turnover Survey (JOLTS) | Job Vacancy Survey (JVS) | Leon, et al. Job Vacancies Instrument | ||
|---|---|---|---|---|
| Measure | # job openings on last day of month total # employed for pay period that includes the 12th of the month (for full-time or part-time) | # job openings total # employed OR total # positions | # job openings total number of FTE positions on the day of the interview | |
| Administration | Data collected from human resources records via survey. | Data collected from human resources records via survey. No time frame specified for when to make calculation. | Data collected from human resources records via survey. | |
| Scoring | Can be scored by hand. | Can be scored by hand or by using purchased software. | Can be scored by hand. | |
| Availability | Free. | Free. | Free. | |
| Reliability | N/A | N/A | N/A | |
| Validity | N/A | N/A | N/A | |
Instruments Which Require New Data Collection -- Measures of DCW Job Characteristics
Empowerment Instruments
| Conditions for Work Effectiveness Questionnaire (CWEQ I) and (CWEQ II Short Form) (3 of 6 subscales) 1 | Perception of Empowerment Instrument (PEI) | ||
|---|---|---|---|
| Measure | Subscales (3 of 6 subscales) 1) Opportunity 2) Support 3) Formal Power | Subscales 1) Autonomy 2) Responsibility 3) Participation | |
| Administration | Survey Administration 1) Paper and pencil 2) 10 to 15 minutes for entire scale 3) 19 questions for entire scale 4) 5-point Likert scale (none to a lot; no knowledge to know a lot; strongly disagree to strongly agree) Readability | Survey Administration 1) Paper and pencil 2) 5-10 minutes 3) 15 questions 4) 5-point Likert scale (strongly agree to strongly disagree) Readability | |
| Scoring | 1) Simple calculations. 2) Total empowerment score = Sum of 6 subscales (Range 6 – 30). Subscale mean scores are obtained by summing and averaging items (range 1-5). 3) Higher scores indicate higher perceptions of empowerment. | 1) Simple calculations. 2) Subscale score = Sum of items on the subscale (Range 4 – 30, depending on subscale) 3) Higher scores indicate higher perceptions of empowerment. | |
| Availability | Free with permission from the author. | Free with permission from the author. | |
| Reliability | Cronbach alpha reliabilities for the CWEQ-II ranges from 0.79 to 0.82, and 0.71 to 0.90 for the subscales. | Internal consistency ranges from .80 to .87 for the subscales. | |
| Validity |
| Criterion-related validity reported as .82; however, specific criterion used is unclear. | |
| Psychological Empowerment Instrument | Yeatts and Cready Dimensions of Empowerment Measure | ||
|---|---|---|---|
| Measure | Subscales 1) Meaning 2) Competence 3) Self-Determination 4) Impact | Subscale 1) Ability to make workplace decisions 2) Ability to modify the work 3) Management listens seriously to CNAs 4) Management consults CNAs 5) Global empowerment | |
| Administration | Survey Administration 1) Paper and pencil 2) 5-10 minutes 3) 12 questions 4) 7-point Likert scale (very strongly agree to very strongly disagree) Readability | Survey Administration 1) Paper and pencil 2) 20 to 30 minutes 3) 26 questions 4) 5-point Likert scale (disagree strongly to agree strongly) Readability | |
| Scoring | 1) Simple calculations. 2) Subscale score = Sum of items on the subscale (Range 3 - 21) Total scale score = Average of subscale scores (Range 3 - 21). 3) Higher scores indicate higher perceptions of empowerment. | 1) Simple calculations. 2) Total scale score = Sum of subscale scores, after reverse coding the one negatively worded item (Range 26 – 130) 3) Higher scores indicate higher perceptions of empowerment. | |
| Availability | Free if used for research or non-commercial use with permission from the author. | Free with permission from the author. | |
| Reliability | Internal consistency ranges from .62 to .74 for the total scale and from .79 to .85 for the subscales. | Internal consistency ranges from .63 to .80 for the subscales. (It should be noted that the survey data are still in the process of being collected from 3 nursing homes, and additional reliability testing will be conducted in future phases of the research project.) | |
| Validity | Criterion-related validity:
| No published information is available. | |
Job Design Instruments
| Job Characteristics Scales (JCS) of the Job Diagnostic Survey (JDS) Revised (4 of 5 subscales)2 | Job Role Quality Questionnaire (JRQ) | ||
|---|---|---|---|
| Measure | Subscales (4 of 5) 1) Skill variety 2 ) Task significance 3) Autonomy 4) Job feedback | Subscales Concern Factors: 1) Overload 2) Dead-end job 3) Hazard exposure 4) Supervision 5) Discrimination Reward factors: | |
| Administration | Survey Administration 1) Paper and pencil 2) 5-8 minutes 3) 12 questions 4) 7-item Likert scale (very little to very much) Readability | Survey Administration 1) Designed for face-to-face interview, but may be possible to adapt to paper and pencil, self-administered 2) Data on time not available 3) 36 questions 4) 4-item Likert scale (not at all (concerned/rewarding) to extremely (concerned/rewarding)) Readability | |
| Scoring | 1) Simple calculations. 2) Subscale score = Average of items on the subscale (Range 1 - 7) 3) Higher scores indicate better job design features. | 1) Simple calculations. 2) Subscale score = Average of items on the subscale (Range 1 - 4) 3) Lower scores on Job Concern subscales indicate better job design features; Higher scores on Job Reward subscales indicate better job design features. | |
| Availability | Free. | Free. | |
| Reliability | Internal consistency ranges from .75 to .79 for the subscales. | Internal consistency ranges from .48 to .87 for the subscales. | |
| Validity | Criterion-related validity:
| Construct validity:
Criterion-related validity:
| |
Job Satisfaction Instruments
| Benjamin Rose Nurse Assistant Job Satisfaction Scale | General Job Satisfaction Scale (GJS, from Job Diagnostic Survey or JDS) | Grau Job Satisfaction Scale | ||
|---|---|---|---|---|
| Measure | Subscales 1) Communication and recognition 2) Amount of time to do work 3) Available resources 4) Teamwork 5) Management practices | 1) Overall (global) satisfaction. | Subscales 1) Intrinsic job satisfaction 2) Satisfaction with benefits | |
| Administration | Survey Administration 1) Interview 2) 5 minutes or less 3) 18 questions 4) 4-point Likert scale (0=very dissatisfied to 3=very satisfied) Readability | Survey Administration 1) Paper and pencil or interview 2) 5 minutes 3) 5 questions 4) 7-point Likert scaling (strongly disagree to strongly agree) Readability | Survey Administration 1) Paper and pencil or interview 2) 5 minutes 3) 14 questions 4) 4-point Likert scaling (very true to not true at all) Readability | |
| Scoring | 1) Simple calculations. 2) Total scale score = Sum of 18 items (Range 0-54) 3) Higher scores indicate higher job satisfaction. | 1) Simple calculations. 2) Overall score = Average of the 5 items after reverse coding the two negatively worded items (Range 1 - 7). 3) Higher scores indicate higher job satisfaction. | 1) Simple calculations. 2) Subscale score = Sum of items on the subscale (Range 4 - 52, depending on subscale). 3) Lower scores indicate higher job satisfaction. | |
| Availability | This scale is copyrighted. Parties interested in using the measure must obtain written permission from Benjamin Rose’s Margaret Blenkner Research Institute and acknowledge the source in all publications and other documents. | Free. | Free. | |
| Reliability | Internal consistency of scale is .92 | Internal consistency of scale ranges from .74 - .80. | Internal consistency is .84 for intrinsic satisfaction scale and .72 for job benefits scale. | |
| Validity | Construct validity:
| Construct validity:
| No published information is available. | |
| Job Satisfaction Survey (JSS)© | Single Item Measures of Job Satisfaction | Visual Analog Satisfaction Scale (VAS) | ||
|---|---|---|---|---|
| Measure | Subscales 1) Pay 2) Promotion 3) Supervision 4) Fringe benefits 5) Contingent rewards 6) Operating conditions 7) Coworkers 8) Nature of work 9) Communication | 1) Single item measures have generally been used to assess overall job satisfaction, but may be adapted to address specific dimensions or facets. | Overall job satisfaction. While examples of dimensions that might affect overall satisfaction are given, subjects are encouraged to make their rating in terms of their overall emotional reaction to whatever aspects of their job are important to them. | |
| Administration | Survey Administration 1) Paper and pencil or interview 2) 10 minutes 3) 36 questions 4) 6-point Likert scaling (strongly agree to strongly disagree) Readability: | Survey Administration 1) Paper and pencil or interview 2) 1 minute 3) 1 question 4) Typically a 5-point Likert scale anchored by levels of satisfaction. Readability | Survey Administration 1) Paper and pencil 2) 1 minute 3) 1 question 4) Graphical rating scale: The subject’s evaluation of his/her job satisfaction is indicated by placing a marker on an anchored analog scale that ranges from no satisfaction to greatest possible satisfaction. Readability | |
| Scoring | 1) Simple calculations. 2) Subscale score = Sum of items on the subscale (Range 4 - 24, depending on subscale) Overall score = Sum of all 36 items (range 36 - 216) 3) Higher scores indicate higher job satisfaction. | 1) Simple calculations. 2) Subject’s response is used as his/her “score” on the measure. 3) Depends on direction of scores. | 1) Simple calculations. 2) The VAS score is the distance (using a ruler) from the lowest end of a 100ml analog scale on which the respondent records their response. 3) Depends on which end of scale is reference point for measuring. | |
| Availability | Free for research or non-commercial use with permission from the author. | Free. | Free. | |
| Reliability | Internal consistency ranges from .60-.91 for subscales. | Internal consistency measures are not applicable to single item measures. | Internal consistency measures are not applicable to single-item measures. | |
| Validity | Validity correlations between equivalent scales from another tested instrument (JDI) and the JSS© were significantly large than zero and of reasonable magnitude. | Recent research indicates that single- item measures of overall or global job satisfaction correlate well (r .60) with multi-item measures, and may be superior to summing up multi-item facet scores into an overall score. | VAS and similar graphical rating scales are believed to be a valid measure of job satisfaction. It is argued that they capture respondents’ global affective reactions to their work situation. The global nature of the question allows respondents to identify and respond to aspects of work that are most personally relevant or important. | |
Organizational Commitment Instruments
| Intent to Turnover Measure (from the Michigan Organizational Assessment Questionnaire or MOAQ) | Organizational Commitment Questionnaire (OCQ) | ||
|---|---|---|---|
| Measure | Behavioral intent to leave job | Affective attachment to organization | |
| Administration | Survey Administration 1) Paper and pencil 2) 5 minutes 3) 3 questions 4) 7-point or 5-point Likert scaling (strongly disagree to strongly agree; not at all likely to extremely likely) Readability | Survey Administration 1) Paper and pencil 2) 5 minutes (short form), 10 minutes (long form) 3) 9 (positively worded) questions in short form and 15 questions (both positively and negatively worded) in long form 4) 7-point or 5-point Likert scaling (strongly agree to strongly disagree) Readability | |
| Scoring | 1) Simple calculations. 2) Score = Sum of the 3 items (Range 3 – 21). 3) Lower scores indicate greater organizational commitment. | 1) Simple calculations. 2) Score = Average of the items, after reversing negatively worded items if long form is used (Range 1 – 7). 3) Higher scores indicate greater organizational commitment. | |
| Availability | Free. | Free. | |
| Reliability | Internal consistency of scale is .83 from diverse occupational sample at 11 sites. | Internal consistency of scale ranges from .8 - .9 for the long version (not known for short version). | |
| Validity | Logical relationships found between “look for new job” item and age, loneliness, and satisfaction with pay and benefits in study of home health aides. | Construct validity:
| |
Worker-Client/Resident Relationships Instrument
| Stress/Burden Scale from the California Homecare Workers Outcomes Survey (2 of 6 subscales)3 | ||
|---|---|---|
| Measure | Stress/Burden (2 of 6 subscales) 1) Relationship with client 2) Client role in provider’s work | |
| Administration | Survey Administration 1) Telephone interview 2) 1-2 minutes 3) 6 questions 4) 5-point Likert scales (very close to hostile; strongly agree to strongly disagree, or extremely well to not well at all) Readability: Published data not available at this time. | |
| Scoring | 1) Simple calculations. 2) Score = Average of the 6 items (Range 1-5). 3) Higher scores indicate the most stress. | |
| Availability | Free. If using this measure, please cite the following: Benjamin, A.E., and Matthias, R.E. (2004). Work Life Differences and Outcomes for Agency and Consumer-Directed Home Care Workers. The Gerontologist, 44(4): 479-488. | |
| Reliability | Internal consistency ranges from .63 - .75 for subscales. | |
| Validity | Published data on validity not available at this time. | |
Worker-Supervisor Relationships Instruments
| Benjamin Rose Relationship with Supervisor Scale | Charge Nurse Support Scale | LEAP Leadership Behaviors and Organizational Climate Survey (1 of 2 subscales, Leadership) 4 | ||
|---|---|---|---|---|
| Measure | Relationship with supervisor | Charge nurse support | Subscales 1) Leadership | |
| Administration | Survey Administration 1) Interview 2) Less than 5 minutes 3) 11 questions 4) 3-point Likert scale (2=most of the time to 0=hardly ever/never) Readability | Survey Administration 1) Paper and pencil 2) 10 minutes 3) 15 questions 4) 5-point Likert scale (never to always) Readability | Survey Administration 1) Paper and pencil 2) 5-6 minutes 3) 10 questions 4) 5-point Likert scale (very little to always) Readability | |
| Scoring | 1) Simple calculations. 2) Total scale score = Sum of items in the scale (Range 0 - 22) 3) Higher scores indicate more positive perceptions of supervisors. | 1) Simple calculations. 2) Scale score = Sum of items in the scale (Range 15 - 75) 3) Higher scores indicate higher levels of supportive charge nurses/supervisors. | 1) Simple calculations 2) Sum of items 1-10 (Range of 10 - 50) 3) Higher scores indicate better perceptions of leadership behaviors. | |
| Availability | This scale is copyrighted. Parties interested in using the measure must obtain written permission from Benjamin Rose’s Margaret Blenkner Research Institute and acknowledge the source in all publications and other documents. | Free with permission from author. | Free with permission from author. | |
| Reliability | Internal consistency of scale is .90 | Internal consistency for scale is .92 | Internal consistency ranges from .75 to .82 for leadership items; .94 for the leadership subscale. | |
| Validity | Construct validity:
| Construct validity.
| Discriminant validity showed high intercorrelations among leadership items. | |
| Supervision Subscales of the Job Role Quality Questionnaire (JRQ) (2 of 11 subscales)5 | ||
|---|---|---|
| Measure | Subscales (2 of 11) Concern Factors: 1) Supervision Reward factors: | |
| Administration | Survey Administration 1) Designed for face-to-face interview, but may be possible to adapt to paper and pencil, self-administered 2) Data on time not available 3) 8 questions (4 for poor supervision subscale and 4 for supervisor support subscale) 4) 4-item Likert scale (not at all (concerned/rewarding) to extremely (concerned/rewarding)) Readability | |
| Scoring | 1) Simple calculations. 2) Subscale score = Average of items on the subscale (Range 1 – 4) 3) Lower scores on Job Concern subscales indicate better job design features; Higher scores on Job Reward subscales indicate better job design features. | |
| Availability | Free. | |
| Reliability | Internal consistency ranges from .48 to .87 for the subscales. | |
| Validity | Construct validity:
Criterion-related validity:
| |
Workload Instruments
| Quantitative Workload Scale from the Quality of Employment Survey | Role Overload Scale (from the Michigan Organizational Assessment Questionnaire or MOAQ) | Stress/Burden Scale from the California Homecare Workers Outcomes Survey (4 of 6 subscales)6 | ||
|---|---|---|---|---|
| Measure | Workload | Role Overload | Stress/Burden (4 of 6 subscales) 1) Client safety concerns for provider 2) Family issues 3) Client behavioral problems 4) Emotional state of provider | |
| Administration | Survey Administration 1) Paper and pencil 2) 2 minutes 3) 4 questions 4) 5-point Likert scale (very often to rarely) Readability | Survey Administration 1) Paper and pencil 2) 2 minutes 3) 3 questions 4) 7-point Likert scale (strongly disagree to strongly agree) Readability | Survey Administration 1) Telephone interview 2) 4–5 minutes 3) 15 questions 4) 5-point Likert scale (very often to never or strongly agree to strongly disagree, or all to most of the time) Readability: Published data not available at this time. | |
| Scoring | 1) Simple calculations. 2) Score = Average of the 4 items (Range 1 – 5). 3) Higher scores indicate higher workload. | 1) Simple calculations. 2) Score = Average of the 3 items after reverse scoring item #2 (Range 1–7). 3) Higher scores indicate higher workload. | 1) Simple calculations. 2) Score = Average of the 15 items (Range 1 - 5). 3) Higher scores indicate the most stress. | |
| Availability | Free. | Free. | Free. If using this measure, please cite the following: Benjamin, A.E., and Matthias, R.E. (2004). Work Life Differences and Outcomes for Agency and Consumer-Directed Home Care Workers. The Gerontologist, 44(4): 479-488. | |
| Reliability | Internal consistency of scale is not reported. However, since items are highly correlated (.5 - .6), it may be suitable to use only one item. | Internal consistency of scale is .65 in original sample of 400 respondents with varied jobs. | Internal consistency ranges from .63 - .75 for subscales. | |
| Validity | Criterion validity:
| Criterion validity: The scale is negatively related to overall job satisfaction (higher workload, lower satisfaction). | Published data on validity not available at this time. | |
Instruments Which Require New Data Collection -- Measures of the Organization
Organizational Culture Instruments
| LEAP Leadership Behaviors and Organizational Climate Survey (1 of 2 subscales, Organizational Climate)7 | LEAP Organizational Learning Readiness Survey | ||
|---|---|---|---|
| Measure | Subscales (1 of 2) 1) Organizational climate | Management Style subscales 1) Autocratic 2) Custodial 3) Supportive 4) Collegial subscale Organization Readiness for Learning Subscales | |
| Administration | Survey Administration 1) Paper and pencil 2) 2-3 minutes 3) 4 questions 4) 5-point Likert scale (very little to always) Readability | Survey Administration 1) Paper and pencil 2) Data on time unavailable 3) 20 questions 4) 5-point Likert scale (almost never almost always (except for two reversed scales) Readability | |
| Scoring | 1) Simple calculations 2) Subscale score = Sum of items 1-4 (Range of 4-20) 3) Higher scores indicate better perceptions of organizational climate. | 1) Simple calculations. 2) Subscale scores = Sum of items on the subscale (Range 20–100). 3) Highest scored subscales determine the management style. Higher scores on Organization Readiness for Learning scale indicate greater readiness for learning in each dimension. | |
| Availability | Free with permission from author. | Free with permission from author. | |
| Reliability | Internal consistency ranges from .54 to .62 for organizational climate items; .65 for the total organizational climate score. | Internal consistency for management styles: autocratic subscales - .798; custodial subscales - .623; supportive subscales - .709; collegial subscales - .820. Internal consistency for learning readiness dimensions: mobility subscales - .642; visioning subscales- .841; empowering subscales - .644; evaluating subscales - .726. | |
| Validity | Construct validity and discriminant validity of organizational climate items reported – four distinct “clusters” that relate to four concepts identified in the theoretical model of organizational climate. | Construct validity of the management scale and learning readiness scale supported. For the management scale, three components were identified: autocratic style, custodial style, and supportive/collegial style. The supportive/collegial styles of management best support organizational learning cultures. For learning readiness, all factors loaded on a single dimension which was to be expected given all four dmensions are key to establish an organization’s readiness to learn. | |
| Nursing Home Adaptation of the Competing Values Framework (CVF) Organizational Culture Assessment | ||
|---|---|---|
| Measure | Subscales (e.g., Culture Types) 1) Group 2) Developmental 3) Hierarchy 4) Market | |
| Administration | Survey Administration 1) Paper and pencil 2) 10 minutes 3) 24 questions (4 in each of 6 sets) 4) Distribution of 100 points for each of 6 sets of 4 categories. Respondents must know basic math. Readability | |
| Scoring | 1) Subscale (culture type) score = Validate that each section adds up to 10 and then multiply each section total by 10 to maintain relative value on a 100 point scale.
2) For each type, higher scores indicate the organization is perceived to reflect more characteristics of this type (than other types). | |
| Availability | Free with permission from the author. | |
| Reliability | Measures of internal consistency can not be computed because the CVF is a scale with relative rather than absolute values (Scott-Cawiezell, et al, in press). | |
| Validity | Construct validity:
| |
Notes
-
The other three subscales of the Conditions for Work Effectiveness Questionnaire (CWEQ I) and (CWEQ II Short Form) can be found in Appendix G.
-
The other subscale of the Job Characteristics Scales (JCS) of the Job Diagnostic Survey (JDS) Revised can be found in Appendix G.
-
The other four subscales of the Stress/Burden Scale from the California Homecare Workers Outcomes Survey can be found in the Workload topic section of Chapter 3.
-
The other subscale (Organizational Climate) of the LEAP Leadership Behaviors and Organizational Climate Surveycan be found in the Organizational Culture topic section of Chapter 3.
-
All subscales of the Job Role Quality Questionnaire can be found in the Job Design topic section of Chapter 3.
-
The other two subscales of the Stress/Burden Scale from the California Homecare Workers Outcomes Survey can be located in the Worker-Client/Resident Relationships topic section of Chapter 3.
-
The other subscale (Leadership) of the LEAP Leadership Behaviors and Organizational Climate Survey can be found in the Worker-Supervisor Relationships topic section in Chapter 3.
APPENDIX C: DATA COLLECTION PLANNING AND IMPLEMENTATION ISSUES
This appendix is also available as a separate PDF File.
Introduction
Appendix C is intended to help organizations become more informed consumers of survey- and records-based data collection. It is meant mainly for providers who have not yet collected information on their DCWs using a questionnaire or records-based data. However, it may also be valuable for providers who have been collecting data (either themselves or working with researchers) to enhance their data collection efforts or understanding of these activities.
As noted previously, this Guide is not a “how to” manual that will enable organizations to conduct a data collection effort from start to finish. Organizations may opt to partner with a reputable researcher (consultant, in-house if organizations have such services, or university-based) and/or data collection vendor to collaborate in data collection, analysis, and use of the data to inform workforce improvement efforts. Working with a third party viewed as independent and impartial can also help convey to employees that it is safe to provide honest answers to survey questions.
Having a better understanding of standardized measurement approaches can help organizations collaborate more productively with researchers1 they work with in data collection efforts. Appendix C provides an introduction to a variety of issues that organizations and the researcher(s) will need to decide as they plan their work. A number of issues in this chapter are relevant to both questionnaires and records-based data collection. Where there are differences (e.g., particularly in how data are collected), some differences are highlighted.
Issues to Consider in Planning the Data Collection Effort
Specify the purpose for the data collection effort
As noted in Chapter 2, data collection can be a useful tool to help organizations address a variety of workforce-related purposes and problems. Focusing on the key purpose for doing data collection and a short list of the problems or questions organizations want to address with the data will become invaluable to the team as it moves forward in its efforts. Since everyone works in an environment of limited resources, organizations will likely find that they need to make numerous trade-offs as they plan for and collect data. Having developed a clear sense of the key problem/purpose and short set of questions to answer will enable organizations to make these trade-offs more easily because they will have set the boundaries for what they will (and will not) do. At a minimum, the key purpose and questions will drive what topics organizations measure and what measures they include.
Answering these questions will help organizations to specify their main purpose for the data collection effort:
- Why are you collecting the information?
- What do you want to learn from the information collected?
- How do you intend to use the information you gain?
- Who are the intended audiences for the results?
- What changes, if any, do you hope to bring about as a result of what you learn?
Answering these questions should help organizations be able to focus on key goals for the effort. Examples of possible goals include:
- To help the organization’s management team understand how employees feel about their jobs and about the organization.
- To help the organization’s management team see areas where employees may not be satisfied or areas where employees are having problems with the work environment.
- To help the organization’s management team see how well a new workplace initiative is doing in improving employees’ work experiences and retention.
- To enable HR staff to share information with the employees on a regular basis about employee satisfaction and work experiences.
- To help potential residents/clients and their families see how well the organization does at keeping employees, as a measure of the positive environment it supports.
- To help potential workers see how well the organization does at keeping employees, as a measure of the positive work environment it supports.
Specify the target population for data collection
As noted in Chapter 1, this Guide focuses on DCWs in a variety of settings, including nursing assistants (NAs, CNAs), home health and home care aides, personal care workers and personal care attendants. In many cases, the target population for questionnaires or records-based data collection is an entire group of CNAs, for example.
However, there may be times, depending on an organization’s purpose, when it may want to focus on a subset of DCWs. For instance, if an organization wants to see how well a new peer mentoring program is doing in helping keep new CNAs longer, the target population would be new CNAs, rather than all CNAs employed. Organizations may want to track retention rates among the new CNAs. Another target population of interest may be the experienced CNAs who were mentors, and organizations may want to track their retention before and after the program started as well.
Within an organization’s target population, it may want to be able to compare between subgroups of workers. For example, it may want to understand whether younger workers differ from older workers in their satisfaction and commitment, or whether workers on different units or at different locations differ in their responses. Organizations will need to see whether they have enough workers in each subgroup to make meaningful comparisons between them. Determining the minimum number of people needed to make appropriate comparisons (while ensuring confidentiality) depends on a number of factors, including the measures used, how big a difference an organization expects there to be between groups, how confident organizations want to be that they will see a subgroup difference in the results if it really exists and having a large enough number of workers to ensure confidentiality. A researcher well-trained in statistics and survey design may help organizations make these decisions.
Once organizations define a target population for data collection, it is important to try to ensure that results that are representative of the larger target population. For example, if the population for a worker questionnaire is all CNAs, then when it is administered in an organization, CNAs on all shifts should know about the questionnaire and the importance of completing it.
Determine project team, budget, and schedule
A data collection effort usually requires a team effort, at a minimum including representatives from the provider organization and persons with research skills to design, implement, and analyze the results. As an organization plans for the data collection effort, it should determine what is available, including staff resources with relevant expertise, financial resources to conduct the data collection, and time to complete the work. All three types of resources may determine what can realistically be done in the data collection effort.
Designing and managing a data collection effort is not simple. To ensure that data collection efforts run smoothly and that organizations are able to handle unexpected problems, it is important to establish a project management strategy early in the effort. This strategy might include specifying what needs to be done, who needs to do it (assignments), and the timing of each task/step. It is also important to address how team members will communicate, clarify expectations for costs and timing, and, perhaps, opt to develop a good working relationship with a researcher and/or data collection vendor.
Two key parts of an effective data collection effort are a clear budget and a realistic schedule. Both will evolve as organizations go beyond the planning phase into the implementation phase. However, keeping the budget and schedule in mind as organizations develop their data collection design may help ensure that plans are feasible within the time and resources organizations have. One way to begin may be to list out the key set of activities involved; each set of activities has budget and schedule implications. Organizations might start with a budget and schedule that they would ideally like to carry out and then adjust as needed. They may also include a cushion for unanticipated costs and build in some time for activities that might take longer than expected.
For budgeting and scheduling purposes, organizations may consider grouping activities into these categories:2
- Project planning and coordination
- Consulting with researcher(s)/data collection and analysis vendors
- Instrument design and pretesting
- Developing list of workers on whom to collect information
- Determining strategies to increase awareness about upcoming survey
- Data collection (typically conducted through researcher/vendor)
- Data preparation and analysis (typically conducted through researcher/vendor)
- Dissemination of results to key audiences, including employees
- Developing and implementing ways to use the results to inform workforce improvements (this step contains multiple activities whose cost and budget will depend on what is done)
Examples of the variety of design decisions that will affect schedule and budget include: how many workers organizations will collect information for; how large the audience is for receiving the results; and, whether there is in-house expertise (in-kind contribution) that may be able to conduct some activities versus having to hire a researcher/vendor. If organizations will conduct a survey, additional considerations might include: whether questionnaires will be collected by mail, telephone, or in-person; how long the questionnaire will be; and, how much follow-up effort will be done to increase the number of responses to the questionnaire.
If organizations are collecting records-based information, an additional consideration may be how many measures are to be collected from records (which will affect how much time it will take to collect the information and how much staffing effort is needed to collect the information). Another issue that will affect budget and schedule for records-based data collection is whether records are computerized or paper only. If records are in a computer-readable form, there may be ways to create an electronic data set from the relevant information in records that can be analyzed using either a basic spreadsheet software package (e.g., Excel) or statistical package (e.g., SAS, SPSS). Organizations may choose to talk with their research partner about these issues, preferably someone who has some experience working with records-based information.
Decide whether to include all members of the population or a sample
When collecting data through a survey or records collection, organizations may either collect it from all members of the target population (a census) or from a systematically chosen sample drawn from the full population. Either way, organizations will work with a list of eligible target population members, often called a “frame.” When generating a frame, it is important to review it carefully to ensure that the frame is inclusive of all employees who meet an organization’s definition of eligible members of the target population while excluding those (e.g., agency staff) who may not meet the definition. It is also important to avoid duplication of the same employee (which can happen if an employee leaves and returns and employment records system counts these changes as two separate records).
Many data collection efforts used today employ a sample because the full population is too large to pursue given the resources available. However, with an employee survey, there may be a real benefit in giving every employee a chance to be heard. Conducting a census conveys an important message to staff -- no one should feel like their employer does not care what they think because they were not surveyed. This is especially true if organizations conduct a periodic staff survey (e.g., yearly), report the results back to staff, and use the results to inform management and work environment changes.
Another benefit of using a census rather than a sample is that organizations do not need to be concerned about “sampling error,” a type of error that occurs because the sample drawn does not accurately reflect the target population. There are various types of error that can occur in the process of going from framing the purpose and questions to developing the instrument to developing the frame to drawing the sample to collecting the data to analyzing the data. An “error” in data collection is anything that lessens the ability of a data collection effort to provide an accurate reflection of the population on the measures of interest.
If organizations use a sample, it is important not to use a “convenience” sample, for example giving an employee questionnaire only to those workers on a certain shift or those who happen to be around on a certain day. Organizations can never know whether the findings from a convenience sample represent the larger employee population or not. In contrast, a systematic random sample that gives each member of the population an equal chance of being included in the sample enables organizations to draw a sample that is representative of the target population.3
Not having to be concerned with sampling error as one form of error is helpful. However, organizations still need to be concerned about error introduced because the workers who complete the questionnaire are somehow different from the workers who do not. That is why, regardless of whether a sample or census is used, it is critical that management emphasizes the importance of completing the questionnaire and that every effort is made to facilitate workers completing the questionnaire. This will be addressed further in the section below on “For a questionnaire, decide how it will be administered and set the response rate goal.”
If organizations have records-based data collection using paper rather than computer records, error can be introduced if the staff collecting relevant information from the records (called “records abstraction”) do not do so consistently. Training is an important step for this process.
If organizations have 300 or fewer DCWs in their target population, they might consider using a census. However, if there are more than 300 employees in the frame, organizations may consider using a sample. Organizations may choose to talk with a research partner about the comparative benefits of a sample versus a census and which better fits their situation.
Issues to Consider in Designing the Data Collection Instrument
Decide the topics, subscales, and/or formulas on which to collect information
There are 34 instruments covering 12 topics in this Guide. Nine of these instruments measure four worker outcomes topics based on records-based data collection (i.e., using data organizations may already collect). Twenty-five of these instruments measure eight job characteristics or organizational characteristics topics based on worker questionnaire-based data collection (i.e., requiring new data collection). Given constraints on budget, staffing, and time, and the need to minimize burden on employee respondents to a questionnaire, organizations are unlikely to measure all of these topics.
Using an organization’s purpose and key questions or problems to steer them, they may review the topics in Chapter 3 of this Guide with an eye toward which are most relevant to addressing the organization’s specific needs for this data collection effort. Once organizations have narrowed down the topics to a subset, they might look at the instruments and measures (subscales or formulas) in selected topics to see which are most relevant to address information needs. Using a team approach can be very valuable in this narrowing down process, since the different perspectives can help clarify core needs and which topics and measures are most appropriate. Especially when creating a questionnaire, it is not uncommon for a team to develop an initial list of measures then realize it needs to be shortened because the questionnaire is too long (burdensome) to ensure that workers will complete it.
For a questionnaire, decide how it will be administered and set the response rate goal
A questionnaire of workers can be administered in a variety of ways (or “modes of data collection”), including self-administered (by mail or in a small group setting), by telephone, in-person, or on-line via the Internet. Organizations may use one mode or multiple modes. For example, it is a common approach when using a mail questionnaire to follow-up with telephone interviews with non-responders, to increase the percentage of people completing the questionnaire (the “response rate”). The choice of mode to use depends on a number of factors including schedule, budget, the reading level and complexity of the questionnaire, and employees’ reading and writing skills. There are numerous differences among the modes, but these are some key ones organizations might consider:4
Mail mode tends to take longer to complete than telephone, on-line, or group administration modes. In-person (one-on-one) interviews can tend to take longer than telephone, on-line, or group administration, depending on staffing available to conduct the interviews.
- In-person interviewing tends to cost more than the other modes, followed by telephone, mail, and on-line approaches.
- If organizations have workers for whom English is a second language or have concerns about their ability to understand and complete a questionnaire, in-person interviewing or telephone interviewing enables the interviewer to help clarify questions (placing less burden on the worker’s reading and writing skills). However, it is important that interviewers convey the questions as intended, so as to minimize error introduced because of interviewer behavior.
- In-person and group administration modes tend to get higher response rates, followed by telephone, mail, and on-line approaches.
- Workers may feel more obliged to give more positive responses (called “socially desirable” responses) when they are talking with someone, as occurs in interviewer-administered modes of telephone and in-person data collection.
The questionnaire items in Chapter 3 can be used in a self-administered format, where a worker completes the questionnaire on her own. These questionnaire items generally tend to be simple and straightforward with a readability level that is generally within range for someone who has completed high school. Organizations may find different results with their employees. That is one of the reasons why it is important to pretest a questionnaire before administering it to employees larger scale. Workers are the best experts to let organizations know if the questionnaire is understandable or not, as well as in what mode(s) they would prefer to complete the questionnaire.
Another administration issue to consider is whether the survey will be anonymous. That is, workers will not put their names on the questionnaire and there will be no way to link a person’s answers with her/him. Some employers do this with their periodic surveys, so that instead of tracking change over time in individual workers, they track change among their workers in general.
One administration approach to consider, especially if the questionnaire will be administered anonymously at a facility, is to administer the questionnaire in a common area over a day or a couple of days. Each worker gets a questionnaire when they get in (across all shifts), they complete the questionnaire at a pre-appointed time in a common area, and then place the questionnaire in a locked box or mail bag (so it does not go to another employee). Providing light refreshments might make the experience more inviting. Employers using this approach tend to have high response rates (nearly 100%), with non-response usually due to absenteeism or scheduling (out sick, days off). One issue to consider in using this approach is whether, even if done anonymously, employees will feel comfortable being completely honest in their responses if required to complete the questionnaire at work in a group setting. Having the locked box or other neutral repository for returning the completed questionnaire might help address this concern.
Response rate is a concern for a well-designed survey because it can affect how representative findings are of a target population. The response rate for a survey is the total number of completed questionnaires (or interviews) divided by the total number of respondents who were selected to be surveyed. The more people who respond from among those whom are surveyed, the more representative findings will be. The more representative the findings, the more confidence organizations may have in using them to inform workforce initiatives.
There are steps organizations can take to help improve response rate. For example, if organizations use mail to administer a questionnaire, here are some steps they may opt to take that have been found to help increase response rates:
- sending an advance letter (this can also work well with a telephone survey)
- following up with a postcard reminder about a week after sending the questionnaire
- sending a second questionnaire packet to non-responders sometime after the initial questionnaire package
- having telephone follow-up to non-responders.
These additional actions obviously have associated costs, so it is important to be clear about the trade-offs being made between cost and response rate. For an employer survey, announcing that the survey is being conducting and having the management team convey the importance of completing the survey can help increase response rate.
Organizations may decide to talk with a research partner about the trade-offs of different modes, realistic and acceptable response rates for their purposes, how they calculate response rate, and what data collection and response rate enhancement approach(es) make most sense for their needs.
Design and pretest the questionnaire
Chapter 3 includes 25 instruments across 8 topics that look at DCW job and organizational characteristics. These instruments contain question wording for many separate subscales among which organizations can choose to include in their own worker questionnaire. While they may choose to use an entire instrument that measures one main topic, organizations need not do so. Organizations might want to review the instruments within the topics they chose earlier (see “Decide the topics, subscales, and/or formulas on which to collect information”) and carefully select those subscales that they believe best meet their needs.
Organizations may need to balance their desire to measure a variety of topics with the need to create a questionnaire short enough to be completed by respondents. It is important to include all items in a subscale because the findings on the properties of the instruments reported in this Guide are based on the entire subscales (not individual items within each subscale). If organizations choose to take only some items from a subscale, the properties reported in this Guide (e.g., reading level, reliability, validity) do not apply to the individual items.
Once organizations have chosen subscales, they will need to decide in what order to include them in the questionnaire. Because many of the instruments included in Chapter 3 were simply item wording and response scale wording (rather than a complete ready-to-administer questionnaire), organizations may wish to work with a research partner to ensure that the questionnaire has the following elements:
- an appropriate, brief introduction that is meaningful and understandable to workers and explains how to complete the questionnaire (if self-administered)
- transitional text, as needed, to lead from one section of the questionnaire to others
- correct and understandable skip instructions,5 if not all respondents are intended to answer all questions
- appropriate formatting of question wording and response scale wording
- correct sequential numbering of questions
- a brief yet compelling cover letter (if self-administered) or interviewer script (if in-person or telephone) conveying the importance of completing the survey and how its results will benefit workers (having the letter come from the CEO/Director or person who is most influential to workers can be beneficial). (Examples of cover letters used by others and other resources for employees considering using survey questionnaires can be found in Appendix D.)
All of the questionnaire items in the Guide are in English only. If organizations will need to translate their questionnaire into another language, they might consider using professional translators who are native speakers of that language. Organizations should make sure that the translation is both culturally and linguistically relevant as well as a true and accurate translation of the English questionnaire. Organizations may ask translators to produce colloquial translations that will be understood by the general public. At the same time, the meaning of the translated questions should be the same as that of the English questions. After the questionnaire has been translated, it is recommended that organizations back-translate it into English. The back-translation is a control mechanism that allows organizations to judge if the translated version is true to the original English questionnaire. One source for professional translation is the American Translation Association directory, which can help organizations identify a translator in their city or county.
Producing culturally and linguistically appropriate research instruments should be viewed as a process. Ensuring an adequate translation is only the first step. Ideally, the translated instrument should be subject to testing to analyze the reliability, validity, and equivalence of the instrument in measuring workers’ perceptions.6 However, such extensive testing is not always possible. Even if organizations cannot conduct testing to examine the reliability and validity of their translated instrument, pretesting the instrument with some workers who speak the language will provide helpful information on how they interpret the questions and whether the translated version of questions has the same meaning as the original English version. Organizations may choose to talk with a research partner about translation issues and how they recommend to proceed, if a questionnaire needs to be translated for workers.
While pretesting requires additional time and resources to conduct, it need not be cumbersome and can provide tremendous benefits in creating a questionnaire that is understandable and likely to be completed by workers. Pretesting is one of the least expensive ways to reduce error in measurement and results.7 If time is short, organizations can conduct 1 or 2 small focus groups (ideally 6 - 8 workers, but less is okay if that is what is available) with workers. It is better to conduct a couple of small rounds with questionnaire improvements between rounds than one larger round without being able to test changes. Organizations may have workers complete the questionnaire first and then discuss their experiences. They might focus on finding out what workers thought about the questionnaire, what they thought of specific questions, any comments they had about particular questions or words used, the appropriateness of the response scales used for questions, and any thoughts they have on how best to administer the questionnaire.
If organizations have more time, they might consider conducting some one-on-one pretest interviews (sometimes called “cognitive testing”). A one-on-one interview allows organizations to probe on each question and get some more in-depth information on how well individual items are interpreted by workers. When possible, organizations might try to pretest using the mode in which they plan to administer the questionnaire during the full-scale data collection.
For records-based data collection, determine what information organizations need to include in their data set and how it will be obtained
The benefit of using records organizations already maintain (or have another entity maintain, for example as some providers do with payroll records) is that organizations will not have to spend resources on new data collection. However, organizations need to keep in mind that the records are kept to meet a purpose other than their own. Therefore, the information organizations need from the records may not appear in exactly the form needed. In addition, records can contain a good deal of missing information. It is important to understand how good the data in records are for the information organizations need and to think through (perhaps with a research partner, records vendor, and/or data collection vendor) how to get the information needed from the records.
Obtaining the appropriate information from records will be easier if the records are computerized. If they are only available in print form, then staff will need to review the print records and transfer the needed information from the records into a form (often called an “abstraction form”) that can then be used to enter the information into a computerized data set. For both print and computerized records, an important step is to learn which type of information that is needed for the employees is available in the records. For example, for measures of retention and turnover, organizations will want to know the start date for every employee, the type of position they hold (e.g., CNA, LPN, RN), and their status (part-time, full-time).
Teams from the organization will also need to decide what reference period will be used for measuring work outcomes topics. Measures of turnover, retention, vacancies, and illnesses/injuries are all defined in terms of a specific time frame. Such measures often use the calendar as a starting point, but that not need be the case, as long as a consistent reference period is used. For example, if comparing turnover from 2001 to turnover in 2002, organizations will want to use the same 12 month period for each year.
Other issues for organizations to talk about when using records-based data that have been collected for another purpose (e.g., payroll, human resources) include:
- how to handle DCWs who quit and are rehired during your reference period
- how to handle temporary staff
- how to handle staff on a leave of absence
- ensuring that staff who get married and change names are still considered the same person in the records
- deciding how to handle cases (which can often occur in home care) where aides may declare a leave of absence but then never return to work
- deciding to handle situations where home care aides can refuse work for several weeks or pay periods without actually resigning.
Issues to Consider in Collecting Data
Monitor data collection
For the purposes of this Guide, it is assumed that someone other than organizational teams will be collecting the questionnaires and/or the data from records (i.e., the researcher or data collection vendor). In this case, organizations will want to monitor the progress of the vendor. The following tools are especially helpful if the data collection will take place over an extended period (such as with a mail, in-person interview, or telephone survey). This approach is generally used for questionnaire data collection but may also be applied to records-based data collection. These tools can help organizations oversee the monitoring process:
- a project timeline from the vendor that organizations can monitor for adherence to ensure the data collection is proceeding on time
- weekly data collection reports from the vendor (number of completions, including by key subgroups of workers if any, e.g., mentors versus mentees)
- if the data collection runs for over a month, monthly progress reports, which include status of data collection, a cost report to date, and a report of any deviation from the project’s response rate goals
- weekly conference calls with the team and the vendor/researcher to discuss the project’s status, next steps, problems, and plans to resolve them. This will help keep organizations updated and bring early attention to any potential problems.
Maintaining confidentiality
Just as it is important to protect the private information of residents/clients, it is vital to ensure that individual employees’ survey answers do not get linked to their names or work records. Organizations should let employees know that they will protect their confidentiality and that what they say in the survey will never be used against them at work. Clearly explaining how organizations will keep their answers confidential may help increase their likelihood of giving honest responses. Organizations may opt to talk with a research partner/vender to determine how this will be accomplished for the data collection effort.
Issues to Consider in Data Preparation, Analysis, and Use
Identify ineligible questionnaires, code, clean, and enter collected data
If using a data collection vendor or research partner, they will need to conduct several steps to prepare the data received from completed questionnaires from worker surveys or abstraction forms from records-based data collection. These steps include identifying and excluding ineligible cases, coding, data entry, data cleaning (e.g., check for out-of-range values, check for skip pattern problems), and handling missing data. Organizations may talk with a vendor/research partner about all of these steps, how they will handle them given the choice of data collection mode or source of records-based data (i.e., computerized versus print records), and what questions organizations may have about them.
Analyze data and present findings
Questionnaires
All questionnaire items in Chapter 3 that measure DCW job characteristics use a type of response scale called a “Likert scale.”8 The Likert scale is the most common form of an intensity question, where a respondent is asked to rate a concept, event, experience, or situation on a single dimension of quantity or intensity ranging from less to more. Here are examples of the Likert response scales used among the questionnaire items in Chapter 3:
- strongly disagree to strongly agree
- extremely concerned to not at all concerned
- no knowledge to know a lot
- none to a lot
- no confidence to complete confidence
- rarely to very often
- not at all true to extremely true
- very little to very much.
The Likert scales used in these instruments have either five, seven, or 11 points in their response scale. For example, the Role Overload Scale from the Michigan Organizational Assessment Questionnaire (MOAQ) (to measure workload) uses a 7-point Likert response scale, where strongly disagree is assigned a “1” and strongly agree is assigned a “7.” Each of the five points in between has its own label.
All subscales in Chapter 3 that measure DCW job characteristics are created in one of two ways -- taking either an average or a sum of the scores of everyone on the items in the subscale. Appendix A provides simple scenarios that provide examples of how to score results from employee surveys. One example includes a single topic questionnaire and the other shows how to score across different subscales.
When using different subscales, it may be sufficient to only look at how workers score on each of the subscales of interest. However, organizations may also want to look at whether there is a relationship between measures. For example, do empowered workers show greater commitment? There are a number of ways that this can be examined, depending on the skills and resources of the team member(s) doing the analysis. For example, with Likert response scales organizations can look at a measure of association statistic such as a correlation.
The “Pearson product-moment correlation” (or “Pearson’s R”) is the most commonly used measure of correlation. It ranges from -1.0 (strong negative relationship where the value of one measure goes up as the other goes down) to + 1.0 (strong positive relationship where the value of one measure goes up as the other goes up). A correlation of .55 indicates a stronger relationship than a correlation of .25. A value of 0 means that there is no relationship between the two measures. In the example given, this would mean that an employee’s sense of empowerment has no relationship to their sense of commitment to their employer. Organizations may choose to talk with a research partner about which statistics would be appropriate to analyze results.
If organizations have subgroups of interest (e.g., new workers and experienced workers, different units of a facility, different facilities within a multi-facility provider), it may be valuable to compare their scores on selected measures to see the extent to which there are differences.
Records
Just as worker questionnaires are used to collect information at the worker level, so records-based information can be collected at the worker level. In both cases, information at the worker level can be examined at the organizational level (i.e., “aggregated”). For example, organizations can find out from employee records when each DCW started with the organization. This can be used to develop a measure that shows how long each employee has been with the organization as of a certain date. Organizations can then average (summarize across) DCWs to find out what percentage of workers in the organization have been with them less than three months as of a certain date. Alternatively, organizations can see what the average length of time is for DCWs in them. This can be helpful if organizations decide that one of their goals is to increase the average length of employment among DCWs (as a measure of retention).
An advantage of obtaining both survey results and records-based information at the individual worker level is that both types of data can be included in the same data set. That way, organizations can look at the relationship between records-based and survey-based measures (e.g., empowerment and turnover).
The analysis discussion above for questionnaires applies also for analyzing records-based data. Organizations may decide to talk with a research partner about which statistics would be appropriate to analyze results.
Most of the results organizations report to their team (both survey- and records-based) will likely be in the form of frequencies and percentages, arranged by measure or subscale. If organizations are using data collection as a tool to benchmark performance or to evaluate a particular initiative, it can be helpful to display this information over time in the form of bar or line graphs. Organizations may opt to consult with their team on the best way to present the findings in a way that is easy for the audience(s) to understand and use for decision making. Organizations may also include a brief methods section describing any issues the team should be aware of on how the date were collected, prepared, or analyzed.
Decide how to use the data to answer questions and next steps
Return to the organization’s key purpose, goals, and problem/questions. As a team, organizations may think about how the results can help answer questions or begin to develop an action plan to address the problem. If organizations are benchmarking, they may look at the direction of the measures -- are they improving, maintaining the course, or is it time to take some action (and what will that be)? If they are trying to understand what DCWs think about their jobs, their supervisors, and/or their employer, what have organizations found? Is there room for improvement? Do the findings suggest that there are particular aspects of the workplace or jobs that could be targeted for change? What type of change might be needed?
If organizations are evaluating the effect of a new way of doing things to improve the workplace, how well did it do? Did it result in improvements in the outcomes they selected to measure (e.g., reduced turnover, increased retention) or workers’ perceptions of their jobs that they surveyed (e.g., empowerment, satisfaction, commitment)? If so, organizations should gain greater confidence that the initiative they are pursuing is worthwhile and worth investing in (or worth repeating in other locations). If not or, if often occurs, the results are mixed, organizations might see if can figure out what happened.9 Are there aspects that should be tweaked or is this initiative just not worth pursuing further?
While the data cannot tell organizations what steps to take in response to the findings, data collection is a valuable tool in helping them see where they are and how they are doing along their path toward workforce improvement in the organization.
Notes
-
The terms “researchers” and “data collection vendors” are used throughout this chapter because it is assumed that most providers will work with such partners in their data collection and use efforts.
-
This section on budgeting and scheduling is excerpted from “Chapter 2: Preparing for a CAHPS® Health Plan Survey,” from the CAHPS Survey and Reporting Kit 2.0, developed by Westat, Rockville, MD.
-
For more information on sampling, Chapter 2 of Survey Research Methods, 2nd edition, by Floyd J. Fowler, Jr. (Sage Publications, Newbury Park, CA; 1993), provides a good overview of a variety of sampling issues and the relationship between sample size and the precision of results.
-
Chapter 4 (pages 64 – 67) of Survey Research Methods, 2nd edition, by Floyd J. Fowler, Jr. (Sage Publications, Newbury Park, CA; 1993), provides a nice summary comparison of the potential advantages and disadvantages of in-person interviewing, telephone interviewing, mail questionnaires, and group administration.
-
Skip instructions are directions used in self-administered questionnaires to direct respondents where to go next in the questionnaire. Skip instructions are used when, based on a particular response, not all respondents should go to a subsequent set of questions. For example, say one has a questionnaire for DCWs and they want to ask workers who have been with them for at least three months the main reason why they have stayed while they do not ask that of workers who have been with them less than three months. Those DCWs who answer question #1 about how long they have been with them by choosing “less than 3 months” should follow the direction (usually written to the right of the response category) to “GO TO QUESTION 3” because they should not answer question 2 asking why they have stayed this long. Part of data cleaning is to determine whether a respondent should have skipped but did not or should not have skipped but did, and correct for this in the data where possible.
-
This section on questionnaire translation into other languages is excerpted from “Article 6: Guidelines for Translating CAHPS® into Other Languages,” from the CAHPS Survey and Reporting Kit 2.0, developed by Westat, Rockville, MD. If you have any questions about this section, please contact their SUN Help Line at 800-492-9261 or via e-mail at cahps1@westat.com.
-
Survey Research Methods, 2nd edition, by Floyd J. Fowler, Jr. (Sage Publications, Newbury Park, CA; 1993).
-
The Nursing Home Adaptation of the Competing Values Framework (CVF) Organizational Culture Assessment, an instrument in Chapter 3 that measures organizational culture, does not use a Likert scale and is not analyzed in the same way as the other instruments. Respondents assign a total of 100 points among four types of nursing homes in each of six sets of questions. The summary chart for this instrument in Chapter 3 describes how the results are to be analyzed.
-
Using focus groups or in-depth interviews with staff may help shed light on how an initiative was implemented. This qualitative information can be a good complement to the quantitative findings from surveys or records-based data.
APPENDIX D: RESOURCES FOR PROVIDERS CONSIDERING USE OF EMPLOYEE SURVEYS
This appendix is also available as a separate PDF File.
Appendix D provides examples of letters that may go out in advance or along with employee surveys and thank you letters for responding employees. These examples are meant to provide guidance for the language and content that might be included in such letters. Organizations may want to adapt the examples for their specific purposes. Additional resources for providers wishing to survey employees can be obtained, free of charge, from the National Center for Health Statistics by contacting Dr. Robin Remsburg at (301) 458-4416.
Sample Advance Letter to Alert Employees of Upcoming Survey
Dear ____________:
During the week of (date), you will be asked to fill out a questionnaire that asks about your views on working at (name of organization).
We need your help. Your responses to this survey will help management make (name of organization) an even better place for you to work! Your response to this survey counts! The results of the survey will be shared with you.
Thank you in advance for your time and consideration in completing this questionnaire. If you have any questions, please don’t hesitate to contact myself or (name of organization’s main contact for survey process).
Sincerely,
(name of Chief Executive Officer)
Sample Letter to Accompany Self-Administered Survey
(Name of Organization) has asked (name of research center or data collection vendor) to conduct an opinion survey to gather information from you in order to continue to identify organizational strengths and areas for improvement. This is an opportunity to communicate with top management. Please familiarize yourself with all instructions before completing the questionnaire.
- Please do not sign your name. Your answers are strictly confidential. (Name of organization) will never see your completed questionnaire.
- Please answer the questions honestly and completely so that the results will be a constructive management tool for the organization.
- After data is processed by (name of research center or data collection vendor), the questionnaires will be destroyed.
- The questionnaire is printed on front and back.
- At the end of the survey, please be sure to complete the general demographic section of the questionnaire (for example, Department). This will allow (name of research center or data collection vendor) to sort data into specific groups in order to provide management detailed information for decision making. Any groups with fewer than five (5) employees will be combined with a larger group to keep your opinions confidential.
- Please give only one answer for each question. Check or circle the response that is closest to your opinion.
- Your supervisor is the person who assigns work, directly supervises your work on a daily basis (for example, charge nurse, head cook) and reviews your performance. Your department head is the person who manages the entire department (for example, Director of Nursing or Environmental Services Director). The term management refers to the organization’s policies and the people who make those policies, especially the “upper management.”
Sample Letter to Thank Employees who Responded to the Survey
To All (name of organization) Employees:
I would like to take the time to personally thank you for your recent participation in the (name of survey). We have received the results from (name of research center or data collection vendor) and it appears that, in general, employees have a very positive view of our organization. I recognize, however, that we also have areas that require our attention. Your responses and comments are providing us with the opportunity to take a close look at all aspects of your employment at (name of organization).
I appreciate your frank and honest answers and ask that you work with me to create positive change and build upon our reputation as a leader in the senior housing industry.
Participation in the survey was outstanding -- number of responding employees) of (total number of employees) (or ___%) completed the survey. Overall, the summary score for (name of organization) was in the very positive range. The subject categories that scored highest were _______________ (e.g., customer service, supervision and working conditions). The categories that scored lowest were questions about _________________ (e.g., attendance, tardiness, compensation and job satisfaction).
In the next several weeks, your Executive Director will be sharing the survey results with you and you will be invited to participate in focus group discussions about those results and suggesting ways to initiate improvement.
After the focus group discussions, we will be working to establish action plans and priorities. I urge you to take a leadership role in helping us understand your responses and develop strategies to address areas targeted for improvement.
Sincerely,
(name of Chief Executive Officer)
APPENDIX E: INDIVIDUAL MEASURES FROM CHAPTER 3 THAT USE SURVEY INSTRUMENTS TO COLLECT DATA, BY TOPIC
This appendix is also available as a separate PDF File.
Instruments Which Use Data Organizations May Already Collect
Vacancies
Alternatives for Measuring Vacancies
Job Openings and Labor Turnover Survey (JOLTS)
Job Vacancy Survey (JVS)
Leon, et al. Job Vacancies Instrument
2. How many full-time equivalent [WORKER] positions do you currently have at your [PROVIDER]? Please count a full-time [WORKER] as one person and a 20-hour per week [WORKER] as half a person. For example, if you had two people working 20 hours each, that would be one full time equivalent.
________ # OF POSITIONS
6. How many job openings for [WORKERS] do you currently have?
_______ # OF OPENINGS
Instruments Which Require New Data Collection -- Measures of DCW Job Characteristics
Empowerment
Alternatives for Measuring Empowerment
Conditions for Work Effectiveness Questionnaire II (CWEQ II) (3 of 6 subscales)
Survey Items
Key to Which Questions Fall into Which Subscales
O = Opportunity subscale (3 items)
S = Support subscale (3 items)
FP = Formal Power subscale (4 items)
| None | Some | A Lot | |||||
|---|---|---|---|---|---|---|---|
| O | 1. | Challenging work. | 1 | 2 | 3 | 4 | 5 |
| O | 2. | The chance to gain new skills and knowledge on the job. | 1 | 2 | 3 | 4 | 5 |
| O | 3. | Tasks that use all of your own skills and knowledge. | 1 | 2 | 3 | 4 | 5 |
| None | Some | A Lot | |||||
|---|---|---|---|---|---|---|---|
| S | 1. | Specific information about things you do well. | 1 | 2 | 3 | 4 | 5 |
| S | 2. | Specific comments about things you could improve. | 1 | 2 | 3 | 4 | 5 |
| S | 3. | Helpful hints or problem solving advice. | 1 | 2 | 3 | 4 | 5 |
| None | Some | A Lot | |||||
|---|---|---|---|---|---|---|---|
| FP | 1. | the rewards for innovation on the job are | 1 | 2 | 3 | 4 | 5 |
| FP | 2. | the amount of flexibility in my job is | 1 | 2 | 3 | 4 | 5 |
| FP | 3. | the amount of visibility of my work-related activities within the institution is | 1 | 2 | 3 | 4 | 5 |
Perception of Empowerment Instrument (PEI)
Survey Items
Key to Which Questions Fall into Which Subscales
A = Autonomy subscale (5 items)
R = Responsibility subscale (4 items)
P = Participation subscale (6 items)
Provide your reaction to each of the following by putting a number from the scale below in the column to the right of the statement.
5 = Strongly Agree
4 = Agree
3 = Neutral
2 = Disagree
1 = Strongly Disagree
| ITEM # | ITEM | RESPONSE | |
|---|---|---|---|
| A | 1 | I have the freedom to decide how to do my job. | |
| P | 2 | I am often involved when changes are planned. | |
| A | 3 | I can be creative in finding solutions to problems on the job. | |
| P | 4 | I am involved in determining organizational goals. | |
| R | 5 | I am responsible for the results of my decisions. | |
| P | 6 | My input is solicited in planning changes. | |
| R | 7 | I take responsibility for what I do. | |
| R | 8 | I am responsible for the outcomes of my actions. | |
| A | 9 | I have a lot of autonomy in my job. | |
| R | 10 | I am personally responsible for the work I do. | |
| P | 11 | I am involved in decisions that affect me on the job. | |
| A | 12 | I make my own decisions about how to do my work. | |
| A | 13 | I am my own boss most of the time. | |
| P | 14 | I am involved in creating our vision of the future. | |
| P | 15 | My ideas and inputs are valued at work. |
Psychological Empowerment Instrument
Survey Items
Key to Which Questions Fall into Which Subscales
M = Meaning subscale (3 items)
C = Competence subscale (3 items)
S = Self-determination subscale (3 items)
I = Impact (3 items)
7-point response scale, ranging from very strongly agree to very strongly disagree
M 1. The work I do is meaningful.
M 2. The work I do is very important to me.
M 3. My job activities are personally meaningful to me.
C 1. I am confident about my ability to do my job.
C 2. I am self-assured about my capability to perform my work.
C 3. I have mastered the skills necessary for my job.
S 1. I have significant autonomy in determining how I do my job.
S 2. I can decide on my own how to go about doing my work.
S 3. I have considerable opportunity for independence and freedom in how I do my job.
I 1. My impact on what happens in my department is large.
I 2. I have a great deal of control over what happens in my department.
I 3. I have significant influence over what happens in my department.
Yeatts and Cready Dimensions of Empowerment Measure
Survey Items
Key to Which Questions Fall into Which Subscales*
WD = Ability to Make Workplace Decisions subscale (7 items)
WP = Ability to Modify the Work subscale (3 items)
ML = Management Listens Seriously to CNAs subscale (6 items)
MC = Management Consults CNAs subscale (3 items)
GE = Global Empowerment subscale (8 items)
* The total number of items adds up to 27 because one item is asked in two subscales.
Please use the following scale to answer the questions below:
1 = Disagree strongly
2 = Disagree
3 = Neutral
4 = Agree
5 = Agree strongly
| Disagree Strongly | Neutral | Agree Strongly | |||||
|---|---|---|---|---|---|---|---|
| WD | 1. | The nurse aides decide who will do what each day. | 1 | 2 | 3 | 4 | 5 |
| WD | 2. | The nurse aides provide information that is used in a resident’s care plan. | 1 | 2 | 3 | 4 | 5 |
| WD | 3. | The nurse aides decide the procedures for getting residents to the dining room. | 1 | 2 | 3 | 4 | 5 |
| WD | 4. | I am allowed to make my own decisions. | 1 | 2 | 3 | 4 | 5 |
| WD | 5. | I make many decisions on my own. | 1 | 2 | 3 | 4 | 5 |
| WD | 6. | I work with the management staff in making decisions about my work. | 1 | 2 | 3 | 4 | 5 |
| WD | 7. | CNAs work with the management staff in making decisions about CNA work. | 1 | 2 | 3 | 4 | 5 |
| Disagree Strongly | Neutral | Agree Strongly | |||||
|---|---|---|---|---|---|---|---|
| WP | 1. | I sometimes provide new ideas at work that are used. | 1 | 2 | 3 | 4 | 5 |
| WP | 2. | I sometimes provide solutions to problems at work that are used. | 1 | 2 | 3 | 4 | 5 |
| WP | 3. | I sometimes suggest new ways for doing the work that are used. | 1 | 2 | 3 | 4 | 5 |
| Disagree Strongly | Neutral | Agree Strongly | |||||
|---|---|---|---|---|---|---|---|
| ML | 1. | The management staff (such as the DON and administrator) listen to the suggestions of CNAs. | 1 | 2 | 3 | 4 | 5 |
| ML | 2. | When CNAs make suggestions on how to do the work, charge nurses seriously consider them. | 1 | 2 | 3 | 4 | 5 |
| ML | 3. | When CNAs make suggestions, someone listens to them and gives them feedback. | 1 | 2 | 3 | 4 | 5 |
| ML | 4. | When CNAs make suggestions on how to do their work, the management staff (such as the administrator and DON) considers their suggestions seriously. | 1 | 2 | 3 | 4 | 5 |
| ML | 5. | When CNAs make suggestions, someone listens to them and gives them feedback. | 1 | 2 | 3 | 4 | 5 |
| ML | 6. | CNAs are provided reasons, when their suggestions are not used. | 1 | 2 | 3 | 4 | 5 |
| Disagree Strongly | Neutral | Agree Strongly | |||||
|---|---|---|---|---|---|---|---|
| MC | 1. | Whenever CNA work must be changed, the CNAs are usually asked how they think the work should be changed. | 1 | 2 | 3 | 4 | 5 |
| MC | 2. | The management staff asks the CNAs for their opinion, before making work related decisions. | 1 | 2 | 3 | 4 | 5 |
| MC | 3. | CNAs are asked to help make decisions about their work. | 1 | 2 | 3 | 4 | 5 |
| Disagree Strongly | Neutral | Agree Strongly | |||||
|---|---|---|---|---|---|---|---|
| GE | 1. | I do NOT have all the skills and knowledge I need to do a good job. | 1 | 2 | 3 | 4 | 5 |
| GE | 2. | I have all the skills and knowledge I need to do a good job, and I use them. | 1 | 2 | 3 | 4 | 5 |
| GE | 3. | I feel I am positively influencing other people’s lives through my work. | 1 | 2 | 3 | 4 | 5 |
| GE | 4. | I have accomplished many worthwhile (good) things in this job. | 1 | 2 | 3 | 4 | 5 |
| GE | 5. | I deal very effectively with the problems of my residents. | 1 | 2 | 3 | 4 | 5 |
| GE | 6. | I can easily create a relaxed atmosphere with my residents. | 1 | 2 | 3 | 4 | 5 |
| GE | 7. | I am allowed to make my own decisions about how I do my work. | 1 | 2 | 3 | 4 | 5 |
| GE | 8. | While at work, I make many decisions on my own or with other nurse aides. | 1 | 2 | 3 | 4 | 5 |
Job Design
Alternatives for Measuring Job Design
Job Characteristics Scales (JCS) of the Job Diagnostic Survey (JDS) Revised (4 of 5 subscales)
Survey Items
Key to Which Questions Fall into Which Subscales
SV = Skill Variety subscale (3 items)
TS = Task Significance subscale (3 items)
A = Autonomy subscale (3 items)
F = Feedback from the Job Itself subscale (3 items)
On the following pages, you will find several different kinds of questions about your job. Specific instructions are given at the start of each section. Please read them carefully. It should take no more than 10 minutes to complete the entire questionnaire. Please move through it quickly.
The questions are designed to obtain your perceptions of your job. There are no trick questions. Your individual answers will be kept completely confidential. Please answer each item as honestly and frankly as possible. Thank you for your cooperation.
Section One
This part of the questionnaire asks you to describe your job listed above as objectively as you can. Try to make your description as accurate and as objective as you possibly can. Please do not use this part of the questionnaire to show us how much you like or dislike your job.
A sample question is given below.
A. To what extent does your job require you to work overtime?
| 1--- | ---2--- | ---3--- | ---4--- | ---5--- | ---6--- | ---7 |
|---|---|---|---|---|---|---|
| Very little; the job requires almost no overtime hours. | Moderately; the job requires overtime at least a week. | Very much; the job requires overtime more than once a week. | ||||
You are to circle the number which is the most accurate description of your job.
If, for example, your job requires you to work overtime two times a month -- you might circle the number six, as was done in the example above.
Survey Items
(A) 1. How much autonomy is there in the job? That is, to what extent does the job permit a person to decide on his or her own how to go about doing the work?
| 1--- | ---2--- | ---3--- | ---4--- | ---5--- | ---6--- | ---7 |
|---|---|---|---|---|---|---|
| Very little; the job gives me almost no personal “say” about deciding how and when the work is done. | Moderate autonomy; many things are standardized and not under my control but I can make some decisions about the work. | Very much; the job gives a person almost complete responsibility for deciding how and when the work is done. | ||||
(SV) 2. How much variety is there in your job? That is, to what extent does the job require you to do many different things at work, using a variety of his or her skills and talents?
| 1--- | ---2--- | ---3--- | ---4--- | ---5--- | ---6--- | ---7 |
|---|---|---|---|---|---|---|
| Very little; the job requires the person to do the same routine things over and over again. | Moderate variety | Very much; the job requires the person to do many different things, using a number of different skills and talents. | ||||
(TS) 3. In general, how significant or important is your job? That is, are the results of your work likely to significantly affect the lives or well-being of other people?
| 1--- | ---2--- | ---3--- | ---4--- | ---5--- | ---6--- | ---7 |
|---|---|---|---|---|---|---|
| Not at all significant: the outcomes of the work are not likely to affect anyone in any important way. | Moderately significant | Highly significant; the outcomes of the work can affect other people in very important ways. | ||||
(F) 4. To what extent does doing the job itself provide you with information about your work performance? That is, does the actual work itself provide clues about how well you are doing -- aside from any “feedback” co-workers or supervisors may provide?
| 1--- | ---2--- | ---3--- | ---4--- | ---5--- | ---6--- | ---7 |
|---|---|---|---|---|---|---|
| Very little; the job itself is set up so a person could work forever without finding out how well he or she is doing. | Moderately; sometimes doing the job provides “feedback” to the person; sometimes it does not. | Very much; the job is set up so that a person gets almost constant “feedback” as he or she works about how well he or she is doing. | ||||
Section Two
Listed below are a number of statements which could be used to describe a job.
You are to indicate whether each statement is an accurate or an inaccurate description of your job.
Once again, please try to be as objective as you can in deciding how accurately each statement describes your job -- regardless of you like or dislike your job.
Write a number in the blank beside each statement, based on the following scale:
How accurate is the statement in describing your job?
| 1 Very Inaccurate | 2 Mostly Inaccurate | 3 Slightly Inacurate | 4 Uncertain | 5 Slightly Accurate | 6 Mostly Accurate | 7 Very Accurate |
|---|---|---|---|---|---|---|
| (SV) | _____ 1. | The job requires me to use a number of complex or sophisticated skills. | ||||
| (F) | _____ 2. | Just doing the work required by the job provides many chances for me to figure out how well I am doing. | ||||
| (SV) | _____ 3. | The job requires me to use a number of complex or high-level skills. | ||||
| (TS) | _____ 4. | This job is one where a lot of other people can be affected by how well the work gets done. | ||||
| (A) | _____ 5. | The job gives me a chance to use my personal initiative and judgment in carrying out the work. | ||||
| (F) | _____ 6. | After I finish a job, I know whether I performed well. | ||||
| (A) | _____ 7. | The job gives me considerable opportunity for independence and freedom in how I do the work. | ||||
| (TS) | _____ 8. | The job itself is very significant and important in the broader scheme of things. | ||||
Job Role Quality Questionnaire (JRQ)
Survey Items
Key to Which Questions Fall into Which Subscales
The 36 items are organized below into their respective 11 subscales (5 job concern subscales and 6 job reward subscales).
Job Concern Factors
Instructions. Think about your job right now and indicate on a scale of 1 (not at all) to 4 (extremely), to what extent, if at all, each of the following is of concern.
Overload
- Having too much to do
- The job's taking too much out of you
- Having to deal with emotionally difficult situations
Dead-End Job
- Having little chance for the advancement you want or deserve
- The job's not using your skills
- The job's dullness, monotony, lack of variety
- Limited opportunity for professional or career development
Hazard Exposure
- Being exposed to illness or injury
- The physical conditions on your job (noise, crowding, temperature, etc.)
- The job's being physically strenuous
Poor Supervision
- Lack of support from your supervisor for what you need to do your job
- Your supervisor's lack of competence
- Your supervisor's lack of appreciation for your work
- Your supervisor's having unrealistic expectations for your work
Discrimination
- Facing discrimination or harassment because of your race/ethnic background
- Facing discrimination or harassment because youre a woman
Job Satisfaction
Alternatives for Measuring Job Satisfaction
Benjamin Rose Nurse Assistant Job Satisfaction Scale
Survey Items
Key to Which Questions Fall into Which Subscales
CR = Communication and recognition subscale (5 items)
TO = Amount of time/organization subscale (2 items)
R = Resources subscale (2 items)
T = Teamwork subscale (2 items)
MP = Management practice and policy subscale (7 items)
| Very Satisfied | Satisfied | Dissatisfied | Very Dissatisfied | |||
|---|---|---|---|---|---|---|
| MP | 1. | the working conditions here? | 3 | 2 | 1 | 0 |
| T | 2. | the way nurse assistants here pitch in and help one another? | 3 | 2 | 1 | 0 |
| CR | 3. | the recognition you get for your work? | 3 | 2 | 1 | 0 |
| MP | 4. | the amount of responsibility you have? | 3 | 2 | 1 | 0 |
| MP | 5. | your rate of pay? | 3 | 2 | 1 | 0 |
| MP | 6. | the way this nursing home is managed? | 3 | 2 | 1 | 0 |
| CR | 7. | the attention paid to suggestions you make? | 3 | 2 | 1 | 0 |
| MP | 8. | the amount of variety in your job? | 3 | 2 | 1 | 0 |
| MP | 9. | your job security? | 3 | 2 | 1 | 0 |
| MP | 10. | your fringe benefits? | 3 | 2 | 1 | 0 |
| TO | 11. | the amount of time you have to get your job done? | 3 | 2 | 1 | 0 |
| T | 12. | the teamwork between nurse assistants and other staff? | 3 | 2 | 1 | 0 |
| CR | 13. | the attention paid to your observations or opinions? | 3 | 2 | 1 | 0 |
| R | 14. | the information you get to do your job? | 3 | 2 | 1 | 0 |
| R | 15. | the supplies you use on the job? | 3 | 2 | 1 | 0 |
| TO | 16. | the pace or speed at which you have to work? | 3 | 2 | 1 | 0 |
| CR | 17. | the way employee complaints are handled? | 3 | 2 | 1 | 0 |
| CR | 18. | the feedback you get about how well you do your job? | 3 | 2 | 1 | 0 |
General Job Satisfaction Scale (GJS, from Job Diagnostic Survey or JDS)
Survey Items
Key to Which Questions Fall into Which Subscales
All 5 items go into the General Job Satisfaction scale.
Note that two items, marked ®, are reverse worded. Their responses must be recoded prior to scoring.
- Generally speaking, I am very satisfied with this job.
- I frequently think of quitting this job. ®
- I am generally satisfied with the kind of work I do in this job.
- Most people on this job are very satisfied with the job.
- People on this job often think of quitting. ®
Each item is to be answered using the following 7-point response scale:
- Disagree strongly
- Disagree
- Disagree slightly
- Neutral
- Agree slightly
- Agree
- Agree strongly
Grau Job Satisfaction Scale
Survey Items (Exact wording below)
Key to Which Questions Fall into Which Subscales
The survey items are grouped as shown below into the two respective subscales (13 items in Intrinsic Job Satisfaction subscale and 4 items in Job Benefits subscale).
The 4-point response scale is: 1. very true; 2. somewhat true; 3. not too true; 4. not true at all
Intrinsic Job Satisfaction
- See the result of my work.
- Chances to make friends.
- Sense of accomplishment.
- My job prepares me for better jobs in health care.
- Get to do a variety of things on the job.
- Responsibilities are clearly defined.
- Have enough authority to do my job.
- I am given a chance to do the things I do best.
- I get a chance to be helpful to others.
- I am given a chance to be helpful to others.
- I am given freedom to decide how I do my work.
- The work is interesting.
- The people I work with are friendly.
Job Benefits
- The fringe benefits are good.
- The security is good.
- The pay is good.
- The chances for promotion are good.
Job Satisfaction Survey (JSS)©
Survey Items (Exact wording below)
Key to Which Questions Fall into Which Subscales
P = Pay subscale (4 items)
PR = Promotion subscale (4 items)
S = Supervision subscale (4 items)
F = Fringe benefits subscale (4 items)
C = Contingent rewards subscale (4 items)
O = Operating procedures subscale (4 items)
CO = Coworkers subscale (4 items)
N = Nature of work subscale (4 items)
CM = Communication subscale (4 items)
Note that 19 items, marked ®, are reverse worded. Their responses must be recoded prior to scoring.
7-point response scale, ranging from very strongly agree to very strongly disagree
| PLEASE CIRCLE THE ONE NUMBER FOR EACH QUESTION THAT COMES CLOSEST TO REFLECTING YOUR OPINION. | ||
|---|---|---|
| P | 1. | I feel I am being paid a fair amount for the work I do. |
| PR | 2. | There is really too little chance for promotion on my job. ® |
| S | 3. | My supervisor is quite competent in doing his/her job. |
| F | 4. | I am not satisfied with the benefits I receive. ® |
| C | 5. | When I do a good job, I receive the recognition for it that I should receive. |
| O | 6. | Many of our rules and procedures make doing a good job difficult. ® |
| CO | 7. | I like the people I work with. |
| N | 8. | I sometimes feel my job is meaningless. ® |
| CM | 9. | Communications seem good within this organization. |
| P | 10. | Raises are too few and far between. ® |
| PR | 11. | Those who do well on the job stand a fair chance of being promoted. |
| S | 12. | My supervisor is unfair to me. ® |
| F | 13. | The benefits we receive are as good as most other organizations offer. |
| C | 14. | I do not feel that the work I do is appreciated. ® |
| O | 15. | My efforts to do a good job are seldom blocked by red tape. |
| CO | 16. | I find I have to work harder at my job because of the incompetence of people I work with. ® |
| N | 17. | I like doing the things I do at work. |
| CM | 18. | The goals of this organization are not clear to me. ® |
| P | 19. | I feel unappreciated by the organization when I think about what they pay me. ® |
| PR | 20. | People get ahead as fast here as they do in other places. |
| S | 21. | My supervisor shows too little interest in the feelings of subordinates. ® |
| F | 22. | The benefit package we have is equitable. |
| C | 23. | There are few rewards for those who work here. ® |
| O | 24. | I have too much to do at work. ® |
| CO | 25. | I enjoy my coworkers. |
| CM | 26. | I often feel that I do not know what is going on with the organization. ® |
| N | 27. | I feel a sense of pride in doing my job. |
| P | 28. | I feel satisfied with my chances for salary increases. |
| F | 29. | There are benefits we do not have which we should have. ® |
| S | 30. | I like my supervisor. |
| O | 31. | I have too much paperwork. ® |
| C | 32. | I don't feel my efforts are rewarded the way they should be. ® |
| PR | 33. | I am satisfied with my chances for promotion. |
| CO | 34. | There is too much bickering and fighting at work. ® |
| N | 35. | My job is enjoyable. |
| CM | 36. | Work assignments are not fully explained. ® |
Visual Analog Satisfaction Scale (VAS)
Survey Item
I would like you to think about how satisfied you are with your job. Think about all the different parts of your work life. This could include things like hospital management, unit organization, and relationships with co-workers and supervisors. How satisfied are you?
Organizational Commitment
Alternatives for Measuring Organizational Commitment
Intent to Turnover Measure (from the Michigan Organizational Assessment Questionnaire or MOAQ)
Survey Items
Here are some statements about you and your job. How much do you agree or disagree with each?
1. I will probably look for a new job in the next year.
1-strongly disagree
2-disagree
3-slightly disagree
4-neither agree nor disagree
5-slightly agree
6-agree
7-strongly agree
2. I often think about quitting.
1-strongly disagree
2-disagree
3-slightly disagree
4-neither agree nor disagree
5-slightly agree
6-agree
7-strongly agree
Please answer the following question.
3. How likely is it that you could find a job with another employer with about the same pay and benefits you now have?
1-not at all likely
2-
3-somewhat likely
4-
5-quite likely
6-
7-extremely likely
Organizational Commitment Questionnaire (OCQ) -- Mowday and Steers (1979)
Survey Items
Listed below are a series of statements that represent possible feelings that individuals might have about the company or organization for which they work. With respect to your own feelings about the particular organization for which you are now working (company/agency name) please indicate the degree of your agreement or disagreement with each statement by checking one of the seven alternatives for each statement.
1-strongly disagree
2-moderately disagree
3-slightly disagree
4-neither disagree nor agree
5-slightly agree
6-moderately agree
7-strongly agree
- I am willing to put in a great deal of effort beyond that normally expected in order to help this organization be successful.
- I talk up this organization to my friends as a great organization to work for.
- I feel very little loyalty to this organization. (reverse scored)
- I would accept almost any type of job assignment in order to keep working for this organization.
- I find that my values and the organizations values are very similar.
- I am proud to tell others that I am part of this organization.
- I could just as well be working for a different organization as long as the type of work was similar. (reverse scored)
- This organization really inspires the very best in me in the way of job performance.
- It would take very little change in my present circumstances to cause me to leave this organization. (reverse scored)
- I am extremely glad that I chose this organization to work for over others I was considering at the time I joined.
- Theres not too much to be gained by sticking with this organization indefinitely. (reverse scored)
- Often, I find it difficult to agree with this organizations policies on important matters relating to its employees. (reverse scored)
- I really care about the fate of this organization.
- For me this is the best of all possible organizations for which to work.
- Deciding to work for this organization was a definite mistake on my part. (reverse scored)
Worker-Client/Resident Relationships
Alternatives for Measuring Worker-Client/Resident Relationships
Stress/Burden Scale from the California Homecare Workers Outcomes Survey (2 of 6 subscales)
Survey Items (exact wording below)
Key to Which Questions Fall into Which Subscales
R = Relationship with Client subscale (3 items)
CR = Client Role in Provider’s Work subscale (3 items)
| THESE NEXT FEW QUESTIONS DEAL WITH THE RELATIONSHIP YOU HAVE WITH YOUR CLIENT(S). | |||||||
|---|---|---|---|---|---|---|---|
| Very Close | Not Very Close | Hostile | |||||
| R | 1. | How would you describe your relationship to your client? | 1 | 2 | 3 | 4 | 5 |
| Strongly Agree | Uncertain | Strongly Disagree | |||||
| R | 2. | My client is someone I can tell my troubles to and share my feelings with. | 1 | 2 | 3 | 4 | 5 |
| Extremely Well | Somewhat Well | Not At All Well | |||||
| R | 3. | My client is someone I can tell my troubles to and share my feelings with. | 1 | 2 | 3 | 4 | 5 |
| HOW MUCH DO YOU AGREE WITH THE FOLLOWING STATEMENTS? | |||||||
|---|---|---|---|---|---|---|---|
| Strongly Agree | Uncertain | Strongly Disagree | |||||
| CR | 1. | My client is comfortable telling me what he/she wants done. | 1 | 2 | 3 | 4 | 5 |
| CR | 2. | I appreciate my client telling me how he/she wants things done. | 1 | 2 | 3 | 4 | 5 |
| CR | 3. | My client wants to have a say in what I do for him/her. | 1 | 2 | 3 | 4 | 5 |
Worker-Supervisor Relationships
Alternatives for Measuring Worker-Supervisor Relationships
Benjamin Rose Relationship with Supervisor Scale
Survey Items
THE FOLLOWING STATEMENTS ARE ABOUT YOU RELATIONSHIP WITH YOUR SUPERVISOR. IF YOU HAVE MORE THAN ONE, THINK ABOUT THE ONE WITH WHOM YOU HAVE THE MOST CONTACT. AFTER I READ EACH STATEMENT, PLEASE TELL ME WHETHER YOU FEEL THIS WAY MOST OF THE TIME, SOME OF THE TIME, HARDLY EVER OR NEVER.
| Most of the Time | Some of the Time | Hardly Ever/Never | |
|---|---|---|---|
| listens carefully to my observations and opinions. | 2 | 1 | 0 |
| gives me credit for my contributions to resident care. | 2 | 1 | 0 |
| respects my ability to observe and report clinical symptoms. | 2 | 1 | 0 |
| lets me know how helpful my observations are for resident care. | 2 | 1 | 0 |
| talks down to me. | 0 | 1 | 2 |
| shows me recognition when I do good work. | 2 | 1 | 0 |
| encourages me to use my nursing skills to the fullest. | 2 | 1 | 0 |
| treats me as an equal member of the health care team. | 2 | 1 | 0 |
| ignores my input when developing care plans. | 0 | 1 | 2 |
| acts like they are better than I am. | 0 | 1 | 2 |
| understands my loss when a resident dies. | 2 | 1 | 0 |
Charge Nurse Support Scale
Survey Items
Below are 15 statements that relate to how you feel about your charge nurse. Please circle the number that reflects your relationship with your charge nurse. Please be as honest as your can. Your answers are confidential and will not be shared with others you work with. If you work with more than one charge nurse, please answer these questions in relation to the charge nurse that you work with most often.
| Never | Seldom | Occasionally | Often | Always | ||
|---|---|---|---|---|---|---|
| 1. | My charge nurse recognizes my ability to deliver quality care. | 1 | 2 | 3 | 4 | 5 |
| 2. | My charge nurse tries to meet my needs. | 1 | 2 | 3 | 4 | 5 |
| 3. | My charge nurse knows me well enough to know when I have concerns about resident care. | 1 | 2 | 3 | 4 | 5 |
| 4. | My charge nurse tries to understand my point of view when I speak to them. | 1 | 2 | 3 | 4 | 5 |
| 5. | My charge nurse tries to meet my needs in such ways as informing me of what is expected of me when working with my residents. | 1 | 2 | 3 | 4 | 5 |
| 6. | I can rely on my charge nurse when I ask for help, for example, if things are not going well between myself and my co-workers or between myself and residents and/or their families. | 1 | 2 | 3 | 4 | 5 |
| 7. | My charge nurse keeps me informed of any major changes in the work environment or organization. | 1 | 2 | 3 | 4 | 5 |
| 8. | I can rely on my charge nurse to be open to any remarks I may make to him/her. | 1 | 2 | 3 | 4 | 5 |
| 9. | My charge nurse keeps me informed of any decisions that were made in regards to my residents. | 1 | 2 | 3 | 4 | 5 |
| 10. | My charge nurse strikes a balance between clients/families’ concerns and mine. | 1 | 2 | 3 | 4 | 5 |
| 11. | My charge nurse encourages me even in difficult situations. | 1 | 2 | 3 | 4 | 5 |
| 12. | My charge nurse makes a point of expressing appreciation when I do a good job. | 1 | 2 | 3 | 4 | 5 |
| 13. | My charge nurse respects me as a person. | 1 | 2 | 3 | 4 | 5 |
| 14. | My charge nurse makes time to listen to me. | 1 | 2 | 3 | 4 | 5 |
| 15. | My charge nurse recognizes my strengths and areas for development. | 1 | 2 | 3 | 4 | 5 |
LEAP Leadership Behaviors and Organizational Climate Survey (1 of 2 subscales)
Survey Items
| Very Little | Some | Always | ||||
|---|---|---|---|---|---|---|
| 1. | How often does your supervisor keep the people who work for him/her informed of changes or activities in the organization? | 1 | 2 | 3 | 4 | 5 |
| 2. | How often does your supervisor encourage people who work for him/her to exchange opinions and ideas? | 1 | 2 | 3 | 4 | 5 |
| 3. | How often is your supervisor receptive to the ideas and suggestions of others? | 1 | 2 | 3 | 4 | 5 |
| 4. | How often does your supervisor offer new ideas for solving job-related problems? | 1 | 2 | 3 | 4 | 5 |
| 5. | How often does your supervisor show people who work for him/her how to improve their performance? | 1 | 2 | 3 | 4 | 5 |
| 6. | How much does your supervisor pay attention to what people who work for him/her say? | 1 | 2 | 3 | 4 | 5 |
| 7. | How much does your supervisor encourage people who work for him/her to give their best effort? | 1 | 2 | 3 | 4 | 5 |
| 8. | How much does your supervisor praise the job performed by the people who work for him/her? | 1 | 2 | 3 | 4 | 5 |
| 9. | How much is your supervisor willing to listen to your problems? | 1 | 2 | 3 | 4 | 5 |
| 10. | How often does your supervisor encourage persons who work for him/her to work as a team? | 1 | 2 | 3 | 4 | 5 |
Supervision Subscales of the Job Role Quality Questionnaire(JRQ)
Survey Items
Key to Which Questions Fall into Which Subscales
The 8 items are organized below into their respective 2 subscales (job concern and job reward).
Job Concern Factors
Instructions. Think about your job right now and indicate on a scale of 1 (not at all) to 4 (extremely), to what extent, if at all, each of the following is of concern.
Poor Supervision
- Lack of support from your supervisor for what you need to do your job
- Your supervisor's lack of competence
- Your supervisor's lack of appreciation for your work
- Your supervisor's having unrealistic expectations for your work
Job Reward Factors
Instructions: Think about your job right now and indicate on a scale of 1 (not at all) to 4 (extremely) to what extent, if at all, each of the following is a rewarding part of your job.
Supervisor Support
- Your immediate supervisor's respect for your abilities
- Your supervisors concern about the welfare of those under him/her
- Your supervisor's encouragement of your professional development
- Liking your immediate supervisor
Workload
Alternatives for Measuring Workload
Quantitative Workload Scale from the Quality of Employment Survey
Survey Items
These questions deal with different aspects of work. Please indicate how often these aspects appear in your job. The following response scale is used:
5-very often
4-fairly often
3-sometimes
2-occasionally
1-rarely
- How often does your job require you to work very fast?
- How often does your job require you to work very hard?
- How often does your job leave you with little time to get things done?
- How often is there a great deal to be done?
Role Overload Scale (from the Michigan Organizational Assessment Questionnaire or MOAQ)
Survey Items
A seven-point Likert scale is used as follows:
1--strongly disagree
2--disagree
3--slightly disagree
4--neither agree nor disagree
5--slightly agree
6--agree
7--strongly agree
- I have too much work to do to do everything well.
- The amount of work I am asked to do is fair. (reverse-scored)
- I never seem to have enough time to get everything done.
Stress/Burden Scale from the California Homecare Workers Outcomes Survey (4 of 6 subscales)
Survey Items (exact wording below)
Key to Which Questions Fall into Which Subscales
CS = Client Safety Concerns for the Provider subscale (4 items)
FI = Family Issues subscale (4 items)
CB = Client Behavioral Problems subscale (4 items)
E = Emotional State of Provider subscale (3 items)
| Never | Sometimes | Very Often | |||||
|---|---|---|---|---|---|---|---|
| CS | 1. | I worry that my client might do something dangerous when I am not there, like not turning off the stove. | 1 | 2 | 3 | 4 | 5 |
| CS | 2. | I worry about my client’s safety when I am not there. | 1 | 2 | 3 | 4 | 5 |
| CS | 3. | I worry that someone could easily take money or other things from my client when I am not there to protect him/her. | 1 | 2 | 3 | 4 | 5 |
| CS | 4. | I worry about how family members or others treat my client when I am not there. | 1 | 2 | 3 | 4 | 5 |
| Strongly Agree | Uncertain | Strongly Disagree | |||||
|---|---|---|---|---|---|---|---|
| FI | 1. | Some family members do not trust me. | 1 | 2 | 3 | 4 | 5 |
| FI | 2. | Some family members of the client criticize the work that I do. | 1 | 2 | 3 | 4 | 5 |
| FI | 3. | The family expects me to do things that are not part of my job. | 1 | 2 | 3 | 4 | 5 |
| FI | 4. | The family appreciates what I do for the client. | 1 | 2 | 3 | 4 | 5 |
| Never | Sometimes | Very Often | |||||
|---|---|---|---|---|---|---|---|
| CB | 1. | How often has a client yelled at you in the past 6 months? | 1 | 2 | 3 | 4 | 5 |
| CB | 2. | How often has a client threatened you in the past 6 months? | 1 | 2 | 3 | 4 | 5 |
| CB | 3. | How often do you experience conflict between what client wants you to do and what you want to do? | 1 | 2 | 3 | 4 | 5 |
| CB | 4. | (Sum of “yes” responses for the following 5 items:
| 1 | 2 | 3 | 4 | 5 |
| All | Some | None of the Time | |||||
|---|---|---|---|---|---|---|---|
| E | 1. | How much of the time during the past month did you have a lot of energy? | 1 | 2 | 3 | 4 | 5 |
| E | 2. | How much of the time during the past month have you felt calm and peaceful? | 1 | 2 | 3 | 4 | 5 |
| E | 3. | How much of the time during the past month have you felt downhearted and blue? | 1 | 2 | 3 | 4 | 5 |
Instruments Which Require New Data Collection -- Measures of the Organization
Organizational Culture
Alternatives for Measuring Organizational Culture
LEAP Leadership Behaviors and Organizational Climate Survey (Organizational Climate subscale)
Survey Items
| Very Little | Some | Always | ||||
|---|---|---|---|---|---|---|
| 1. | How often do you get information about what is going on in other parts of your facility? | 1 | 2 | 3 | 4 | 5 |
| 2. | How much do you enjoy doing your daily work activities? | 1 | 2 | 3 | 4 | 5 |
| 3. | How much does other staff you work with give their best effort? | 1 | 2 | 3 | 4 | 5 |
| 4. | How much does administration ask for your ideas when decisions are being made? | 1 | 2 | 3 | 4 | 5 |
LEAP Organizational Learning Readiness Survey
Survey Items
Evaluation of the long-term care facility's learning readiness focuses on assessment of three key areas. These are: management style, readiness for learning, and capacity to implement and sustain LEAP.
We ask that the facility's administrator and director of nursing each complete a survey. Additionally, you may want others in the organization to complete a survey. We can supply you with additional surveys. Please respond to each item in the survey. We will compile the results and provide your facility with a summary of our assessment.
| Very Little | Some | Always | ||||
|---|---|---|---|---|---|---|
| Almost never | Seldom | Occasionally | Frequently | Almost always | ||
| 1. | Some employees fear for their jobs. | |||||
| 2. | Management includes employees in organizational decisions. | |||||
| 3. | Management encourages employees to give their best effort. | |||||
| 4. | Most employees feel secure working here and therefore do not leave | |||||
| 5. | Even though employees have good benefits, they tend to give minimal job performance. | |||||
| 6. | Most employees seem content in their positions and are not interested in job promotion. | |||||
| 7. | Management is respected by employees. | |||||
| 8. | Employees feel a part of the organization. | |||||
| 9. | Managers regularly recognize employees for their job performance. | |||||
| 10. | There is a feeling of teamwork in this organization among managers and employees. | |||||
| 11. | Employees are enthusiastic about improving job performance. | |||||
| 12. | Employees are valued by this organization. | |||||
| 13. | This organization encourages employees to learn and develop new skills. | |||||
| 14. | Employees and managers in this organization have the capacity to apply new knowledge to future clinical situations. | |||||
| 15. | The climate of our organization recognizes the importance of learning. | |||||
| 16. | Upper management supports the vision of a learning environment that supports learning and development across all levels of staff and managers. | |||||
| 17. | Our managers have the capacity to be mentors and coaches to facilitate learning among staff. | |||||
| 18. | Our organization believes staff should feel empowered and participate in learning and development experiences. | |||||
| 19. | Following trends in our organizations practice, management, and staff through benchmarking would be valuable and utilized for evaluation purposes. | |||||
| 20. | Our organization supports creativity to improve care practices for our residents. |
Nursing Home Adaptation of the Competing Values Framework (CVF) Organizational Culture Assessment
Survey Items
Key to Which Questions Fall into Which Subscales
All “A” statements fall into the “Group” subscale (6 items)
All “B” statements fall into the “Developmental” subscale (6 items)
All “C” statements fall into the “Hierarchy” subscale (6 items)
All “D” statements fall into the “Market” subscale (6 items)
Six sets of statements about your nursing home are listed below. Each set has 4 statements that may describe where you work. Rate each set of statements separately. For each set, first read all 4 statements. Then decide how to split up 10 points across the 4 to show how much each of these, compared with the other 3 statements, describes your nursing home.
The following examples show how you might do this:
| Example #1 | Example #2 | Example #3 |
|---|---|---|
| A. 10 | A. 2 | A. 4 |
| B. 0 | B. 3 | B. 2 |
| C. 0 | C. 2 | C. 4 |
| D. 0 | D. 3 | D. 0 |
| Total = 10 | Total = 10 | Total = 10 |
| Set 1: My nursing home is: | ||
|---|---|---|
| A. | A very personal place like belonging to a family. | _____ |
| B. | A very business-like place with lots of risk-taking. | _____ |
| C. | A very formal and structured place with lots of rules and policies. | _____ |
| D. | A very competitive place with high productivity. | _____ |
| Add together A+B+C+D to make sure they equal 10: ___+___+___+___= 10 | ||
| Set 2: The nursing home administrator is: | ||
|---|---|---|
| A. | Like a coach, a mentor, or a parent figure. | _____ |
| B. | A risk-taker, always trying new ways of doing things. | _____ |
| C. | A good organizer; an efficiency expert. | _____ |
| D. | A hard-driver; very competitive and productive. | _____ |
| Add together A+B+C+D to make sure they equal 10: ___+___+___+___= 10 | ||
| Set 3: The management style at my nursing home is: | ||
|---|---|---|
| A. | Team work and group decision making. | _____ |
| B. | Individual freedom to do work in new ways. | _____ |
| C. | Job security, seniority system, predictability. | _____ |
| D. | Intense competition and getting the job done. | _____ |
| Add together A+B+C+D to make sure they equal 10: ___+___+___+___= 10 | ||
| Set 4: My nursing home is held together by: | ||
|---|---|---|
| A. | Loyalty, trust and commitment | _____ |
| B. | A focus on customer service | _____ |
| C. | Formal procedures, rules and policies | _____ |
| D. | Emphasizing productivity, achieving goals, getting the job done | _____ |
| Add together A+B+C+D to make sure they equal 10: ___+___+___+___= 10 | ||
| Set 5: The work climate in my nursing home: | ||
|---|---|---|
| A. | Promotes trust, openness, and people development | _____ |
| B. | Emphasizes trying new things and meeting new challenges | _____ |
| C. | Emphasizes tradition, stability, and efficiency | _____ |
| D. | Promotes competition, achievement of targets and objectives | _____ |
| Add together A+B+C+D to make sure they equal 10: ___+___+___+___= 10 | ||
| Set 6: My nursing home defines success as: | ||
|---|---|---|
| A. | Team work and concern for people | _____ |
| B. | Being a leader in providing the best care | _____ |
| C. | Being efficient and dependable in providing services | _____ |
| D. | Being number one when compared to other nursing homes | _____ |
| Add together A+B+C+D to make sure they equal 10: ___+___+___+___= 10 | ||
APPENDIX F: READY MADE MULTI-TOPIC SURVEY INSTRUMENTS
This appendix is also available as a separate PDF File.
Appendix F contains multi-topic survey instruments developed expressly for LTC DCWs from many tested survey instruments (such as those included in Chapter 3). These instruments do not meet criteria for inclusion in Chapter 3, however, because they have not yet been tested for reliability and validity. The multi-topic survey instruments included in this Appendix are:
- Better Jobs Better Care Survey of Direct Care Workers
- National Nursing Assistant Survey (NNAS) Nursing Assistant Questionnaire
Better Jobs Better Care Survey of Direct Care Workers
Better Jobs, Better Care (BJBC) is a 4-year, $15.5 million program funded by The Robert Wood Johnson Foundation and The Atlantic Philanthropies, and is managed by a national program office at the Institute for the Future of Aging Services/AAHSA. The goal of the program is to promote changes in policy and workplace practices that will improve recruitment and retention of direct care workers -- nursing assistants, home health aides and personal care attendants -- in the long-term care field.
Five demonstration grants were awarded under the program to lead agencies in five states, on behalf of coalitions of long term care providers, consumers and workers. Each grantee is undertaking a variety of policy and workplace change initiatives designed to improve the recruitment and retention of direct care workers in their state. To maximize what can be learned from these demonstration programs, the Foundations have committed funds for a three-and-a-half year evaluation by researchers at Penn State University. The evaluation is designed to:
- document and analyze the implementation of Demonstration activities across the five states, articulate the successes and challenges encountered, and provide formative feedback to the lead agencies; and,
- assess the impacts of policy and practice changes on job turnover and retention, quality of DCWs’ jobs, and workers’ perceptions of quality of care.
The evaluation is intended to draw lessons on successful implementation for the benefit of states and provider organizations that want to improve DCW’s jobs through policy and practice changes. In addition, it will provide evidence on the effectiveness of the provider practice changes that will be tested by the demonstration. The evaluation will rely on information from a variety of sources, including: site visit and telephone interviews with coalition members and provider organizations; employee hiring and termination MIS data; and surveys of DCWs and managers of clinical services (e.g., the Director of Nursing in a nursing facility) of provider organizations.
The self-administered survey included in this Appendix is the instrument to be given to DCWs through BJBC program evaluations to get their perceptions of their jobs and work environment. Please note that this instrument is a Microsoft Word version of the scannable instrument being used for the BJBC evaluation; thus, instructions within the survey instrument are relevant to a scannable form (e.g., “fill in the appropriate circle, etc.). If organizations use subscales from this instrument, they will need to reformat the items for their purposes. For example, organizations can change instructions currently relevant for the scannable instrument to meet their needs (e.g., “circle the appropriate response”).
For more information on the Better Jobs Better Care program, visit www.bjbc.org.
Survey Items
1a. How long have you worked as a direct care worker?
_________ years ____________months
1b. How long have you worked as a direct care worker for this employer?
_________ years ____________months
2. Overall, how satisfied are you with your job?
1-Extremely satisfied
2-Somewhat satisfied
3-Somewhat dissatisfied
4-Extremely dissatisfied
5-Don’t know
3. Think about your job right now. Fill in the circle that best indicates how much, if at all, each of the following is a rewarding part of your job. Is it not at all rewarding, somewhat rewarding, very rewarding, or extremely rewarding?
| Does not apply to my job | Not at all rewarding | Somewhat rewarding | Very rewarding | Extremely rewarding | |
|---|---|---|---|---|---|
| a. Helping others is... | 1 | 2 | 3 | 4 | |
| b. Being able to work on your own is .. | 1 | 2 | 3 | 4 | |
| c. Getting credit for your work is... | 1 | 2 | 3 | 4 | |
| d. Finding your work interesting is... | 1 | 2 | 3 | 4 | |
| e. Liking your coworkers is... | 1 | 2 | 3 | 4 | |
| f. Making a difference in other people’s lives is... | 1 | 2 | 3 | 4 | |
| g. Feeling a sense of accomplishment and competence from doing your job is... | 1 | 2 | 3 | 4 | |
| h. Having your job fit your skills is... | 1 | 2 | 3 | 4 | |
| i. Having the chance to learn new things is... | 1 | 2 | 3 | 4 | |
| j. Being valued by supervisors and management is... | 1 | 2 | 3 | 4 | |
| k. Being needed by others is... | 1 | 2 | 3 | 4 | |
| l. Having the power you need to get your job done without getting permission from someone else is... | 1 | 2 | 3 | 4 | |
| m. Having a lot of different things to do is... | 1 | 2 | 3 | 4 | |
| n. Getting support from coworkers is... | 1 | 2 | 3 | 4 | |
| o. Having your job fit your interests is... | 1 | 2 | 3 | 4 | |
| p. The income you earn is... | 1 | 2 | 3 | 4 | |
| q. Being valued by residents or clients and their families is... | 1 | 2 | 3 | 4 | |
| r. Having the freedom to decide how to do your work is... | 1 | 2 | 3 | 4 | |
| s. The team spirit in your work group is... | 1 | 2 | 3 | 4 |
4. Continue thinking about your job right now. Indicate how much, if at all, each of the following is a problem or concern in your job. Is it not at all a problem, somewhat a problem, a big problem, or an extremely big problem?
| Not at all a problem | Somewhat a problem | A big problem | An extremely big problem | |
|---|---|---|---|---|
| a. Having too much work to do is… | 1 | 2 | 3 | 4 |
| b. Having to deal with emotionally hard situations is… | 1 | 2 | 3 | 4 |
| c. Not having support from your supervisor in your job is… | 1 | 2 | 3 | 4 |
| d. Finding your job boring or doing too much of the same thing is… | 1 | 2 | 3 | 4 |
| e. Having your job take too much out of you is… | 1 | 2 | 3 | 4 |
| f. Having little chance to get promoted is… | 1 | 2 | 3 | 4 |
| g. Dealing with unrealistic expectations from your supervisor for your work is… | 1 | 2 | 3 | 4 |
| h. Not having the job use your skills is… | 1 | 2 | 3 | 4 |
| i. Catching an illness is… | 1 | 2 | 3 | 4 |
| j. Not having the chance to develop job skills is… | 1 | 2 | 3 | 4 |
| k. Not being valued by your supervisor for your work is… | 1 | 2 | 3 | 4 |
| l. Being on your own too much is… | 1 | 2 | 3 | 4 |
| m. Getting hurt is… | 1 | 2 | 3 | 4 |
| o. The physical conditions (equipment, temperature, smell, etc.) at your job is… | 1 | 2 | 3 | 4 |
| p. Not having enough help when you need it is… | 1 | 2 | 3 | 4 |
| q. Facing difficulties because of your race or ethnic background is… | 1 | 2 | 3 | 4 |
| r. Facing difficulties because of your sex is… | 1 | 2 | 3 | 4 |
| s. That your supervisor is not good at her job is… | 1 | 2 | 3 | 4 |
| t. That the job is physically hard is… | 1 | 2 | 3 | 4 |
| u. The time it takes to get work is… | 1 | 2 | 3 | 4 |
5. Please think about your direct supervisor. Indicate if you strongly disagree, somewhat disagree, somewhat agree, or strongly agree with each statement.
| My supervisor... | Strongly disagree | Somewhat disagree | Somewhat agree | Strongly agree | |
|---|---|---|---|---|---|
| a. | provides clear instructions when assigning work. | 01 | 02 | 03 | 04 |
| c. | listens to me when I am worried about a resident’s or client’s care. | 01 | 02 | 03 | 04 |
| d. | supports direct care workers working in groups or teams with other health care workers such as physical therapists, dieticians, RNs, LPNs or other nurses | 01 | 02 | 03 | 04 |
| e. | disciplines or removes other direct care workers who do not do their jobs well or their share of the work. | 01 | 02 | 03 | 04 |
| f. | tells me when I am doing a good job. | 01 | 02 | 03 | 04 |
| g. | gives me useful criticism to help me improve my work | 01 | 02 | 03 | 04 |
| h. | is interested in my development in my job. | 01 | 02 | 03 | 04 |
6. In general, are you encouraged by supervisors to discuss the care and well-being of residents and/or clients with their families?
Yes
No
7. Please indicate the degree to which you agree with the following statements by filling in the appropriate circle.
| Not at all agree | Agree Somewhat | Agree a great deal | ||
|---|---|---|---|---|
| a. | My supervisor respects me as part of the health care team? | 01 | 02 | 03 |
| b. | Residents or clients respects you as part of the health care team? | 01 | 02 | 03 |
| c. | Residents’ or clients’ families respects you as part of the health care team? | 01 | 02 | 03 |
8. For each statement, please indicate if you strongly disagree, somewhat disagree, somewhat agree, or strongly agree.
| Strongly disagree | Somewhat disagree | Somewhat agree | Strongly agree | ||
|---|---|---|---|---|---|
| a. | I have learned the skills necessary to do my job well. | 01 | 02 | 03 | 04 |
| b. | I have the opportunity to work in teams | 01 | 02 | 03 | 04 |
| c. | I am confident in my ability to do my job | 01 | 02 | 03 | 04 |
| d. | I could get a job that paid more than this job. | 01 | 02 | 03 | 04 |
9. The following is a list of training program topics that are sometimes offered by employers. Please indicate whether or not you have attended each of the following program topics in the past 2 years as part of an inservice or formal training program offered by your employer. If you attended the program, please indicate how useful the program was to you by filling in the appropriate circle.
| Offered at your workplace? | If yes, how useful was it?? | |||||
|---|---|---|---|---|---|---|
| Yes | No | Not at all useful | Somewhat useful | Very useful | Extremely useful | |
| a. resident or client care skills such as helping with bathing, eating, dressing. | ||||||
| b. specialized clinical training such as caring for bed sores, pain management, incontinence. | ||||||
| c. communicating with residents or clients | ||||||
| d. communicating with coworkers | ||||||
| e. working with residents’ or clients’ family members | ||||||
| f. working with supervisors | ||||||
| g. recording residents’ or clients’ information | ||||||
| h. organizing your work tasks. | ||||||
| i. how to mentor other direct care workers? | ||||||
| j. how to work in teams. | ||||||
| k. Dealing with problems at work. | ||||||
| l. Dealing with personal problems outside of work such as money management, parenting skills, etc. | ||||||
| l. other (Please specify in the box below) _________________ | ||||||
10. How likely is it that you will leave this job in the next year?
- Very likely
- Somewhat likely
- Not at all likely
11. How often do you think about quitting?
- All of the time
- Some of the time
- Rarely
- Never
12. When you think about your job as a direct care worker, do you view it as:
A short-term job
A long-term career
13. Is your employer currently doing anything out of the ordinary to improve your job or to encourage direct care workers to keep working there?
Yes
No
Don't know
14. What is the single most important thing your employer could do to improve your job as a direct care worker?
_______________________________________________________________
15. If a friend or family member needed care and asked your advice about getting care from the place where you work, would you…
Definitely recommend it
Probably recommend it
Probably not recommend it
Definitely not recommend it
16. If a friend or family member asked your advice about taking a direct care worker job at the place where you work, would you…
Definitely recommend it
Probably recommend it
Probably not recommend it
Definitely not recommend it
17. In your current job with this employer, what is your hourly wage?
$________ per hour
18. Do you receive health insurance through this employer?
Yes, I receive health insurance through my employer
My employer offers health insurance to me, but I am not enrolled.
My employer does not offer health insurance to me
19. Do you currently work for pay at another job as a direct care worker?
Yes
No
20. What is your age?
Less than 25 years old
25-34
35-44
45-54
55-64
65 and older
21. What is your sex?
Female
Male
22. Did you earn a high school diploma or GED?
Yes
No
If yes, what is your highest level of education?
High School or GED
Some college/trade school
College graduate or post-college
23. Please indicate your race/ethnicity (choose all that apply)
White
Hispanic or Latina/Latino
African American or Black
American Indian or Alaska Native
Asian
Native Hawaiian or Pacific Islander
Other _________________________
24. On your current job, have you ever been discriminated against because of your race or ethnic origin?
Yes
No
National Nursing Assistant Survey (NNAS) Nursing Assistant Questionnaire
The National Nursing Assistant Survey (NNAS) represents the first time the government -- through the Department of Health and Human Services, Office of the Assistant Secretary for Planning and Evaluation (ASPE) -- will collect data on a nationally representative sample of CNAs. The goal of the survey is to provide a “landscape” of CNAs and their perceptions on benefits, the impact of training and supervision, nature of their work, the work environment and employment history.
The NNAS was first fielded in June 2004 in conjunction with the National Center for Health Statistics (NCHS) National Nursing Home Survey. The goal is to survey a sample of 3,000 nursing assistants from approximately 700 participating nursing facilities. From this survey, ASPE hopes to get valuable information to improve the recruitment and retention of nursing assistants across the country.
Through pretesting, it was found that the survey instrument included here is difficult to self-administer. It was determined that the instrument be administered best via computer-assisted telephone interviewing (CATI); therefore, it is presented in the CATI format. Survey Items
Survey Items
The actual NNAS Nursing Assistant Questionnaire is available on the PDF version of this appendix.
APPENDIX G: INSTRUMENTS NEEDING WORK
This appendix is also available as a separate PDF File.
Instruments Included in this Appendix
This Appendix provides instruments that require some adaptation before they can be used (e.g., making questions more applicable to DCWs beyond wording simplification, lowering readability levels, or changing the language of a survey) or are not easily available to the public.
While this Guide is not a “how-to” manual, here are a few things for organizations to consider when reviewing instruments that require adaptation:
- If possible, organizations may consider working with researchers within their own organization or may make contact with a local researcher, university (e.g., survey research center, nursing department, organizational studies or labor department) or survey organization as they adapt these instruments. This will ensure that these adaptations are done correctly and do not change the overall meaning and intent of these instruments.
- Some subscales are not relevant to DCWs. Other subscales have a few questions that may need alteration in order to make them applicable to DCWs, however. It is important to ask all of the questions in a subscale so that the information is meaningful.
- Pre-testing is important as organizations adapt instruments. For instruments to be used effectively, organizations must ensure that their DCWs find the content, language, wording and readability to be understandable.
How the Instruments in this Appendix are Organized
A summary chart (as in Chapter 3) with the following features is included for each instrument: description, measure, administration, scoring, availability, reliability and validity of each instrument or set of subscales, and relevant contact information. Only descriptions of the “peer-to-peer work relationships” and “organizational structure” topic areas are included in Appendix G since they are the only topics not described in Chapter 3 (because no “ready” or “near ready” measures meeting the criteria were available). Organizations can consult Chapter 3 if they are interested in reviewing descriptions of the other topic areas.
Instruments which require new data collection -- measures of DCW job characteristics
Empowerment
- Conditions for Work Effectiveness Questionnaire (CWEQ I) and (CWEQ II Short Form) (3 of 6 subscales)
- Reciprocal Empowerment Scale (RES)
Job Design
- Job Characteristics Scales (JCS) of the Job Diagnostic Survey (JDS) Revised (1 of 5 subscales)
Job Satisfaction
- Abridged Job Descriptive Index (aJDI) (Short Form) Facet Scales
- Minnesota Satisfaction Questionnaire (MSQ) (Short Form)
- Misener Nurse Practitioner Satisfaction Scale
Peer-to-Peer Work Relationships
- Satisfaction with Co-Workers Subscale of the abridged Job Descriptive Index (aJDI) (1 of 5 subscales)
Worker-Supervisor Relationships
- External Satisfaction (ES) Subscale from the Minnesota Satisfaction Questionnaire (MSQ)
- Satisfaction with Co-Workers Subscale of the abridged Job Descriptive Index (aJDI) (1 of 5 subscales)
Instruments which require new data collection -- measures of the organization
Organizational Culture
- Nursing Home Adaptation of the Organizational Culture Profile (OCP)
Organizational Structure
- Communication and Leadership Subscales of the Nursing Home Adaptation of the Shortell Organization and Management Survey
Instruments Which Require New Data Collection -- Measures of DCW Job Characteristics
Empowerment
Alternatives for Measuring Empowerment
Conditions for Work Effectiveness Questionnaire (CWEQ I) and (CWEQ II Short Form) (3 of 6 subscales)1
| Conditions for Work Effectiveness Questionnaire (CWEQ I) and (CWEQ II Short Form) (3 of 6 subscales)1 | ||
|---|---|---|
| Description | The Conditions for Work Effectiveness Questionnaire (CWEQ- I) is a 31-item questionnaire designed to measure the four empowerment dimensions -- perceived access to opportunity, support, information and resources in an individual’s work setting -- based on Kanter’s ethnographic study of work empowerment (Kanter, 1977; Laschinger, 1996). Opportunity refers to opportunities for growth and movement within the organization as well as opportunity to increase knowledge and skills. Support relates to the allowance of risk taking and autonomy in making decisions. Information refers to having information regarding organizational goals and policy changes. Resources involve having the ability to mobilize resources needed to get the job done. Access to these empowerment structures is facilitated by (1) formal power characteristics such as flexibility, adaptability, creativity associated with discretionary decision-making, visibility, and centrality to organizational purpose and goals; and (2) informal power characteristics derived from social connections, and the development of communication and information channels with sponsors, peers, subordinates, and cross-functional groups. Chandler adapted the CWEQ from Kanter’s earlier work to be used in a nursing population (1986). The CWEQ-II, a modification of the original CWEQ, consists of 19 items (three for each of Kanter’s empowerment structures, 3 for the Formal Power (JAS) measure and 4 for the Informal Power (ORS) measure) (Laschinger et al., 2001). Because the CWEQ II is shorter to administer while still having comparable readability and measurement properties, only the CWEQ II survey items are provided. The CWEQ II has been studied and used frequently in nursing research since 2000 and has shown consistent reliability and validity. The University of Western Ontario Workplace Empowerment Research Program has been working with and revising the original CWEQ and CWEQ-II in nursing populations for over 10 years. | |
| Measure | Subscales (3 of 6) (1) Information (2) Resources (3) Informal Power | |
| Administration | Survey Administration (1) Paper and pencil (2) 10 to 15 minutes for entire scale (3) 19 questions for entire scale (4) 5-point Likert scale (none to a lot; no knowledge to know a lot) Readability | |
| Scoring | (1) Simple calculations. (2) Total empowerment score = Sum of 6 subscales (Range 6 - 30). Subscale mean scores are obtained by summing and averaging items (range 1 - 5). (3) Higher scores indicate higher perceptions of empowerment. | |
| Availability | Free with permission from the author. | |
| Reliability | Cronbach alpha reliabilities for the CWEQ-II ranges from 0.79 to 0.82, and 0.71 to 0.90 for the subscales. | |
| Validity |
| |
| Contact Information | Permission to use the CWEQ II can be obtained on-line at http://publish.uwo.ca/~hkl/ or by contacting the author: Heather Spence Laschinger, PhD University of Western Ontario School of Nursing London, Ontario, Canada N6A 5C1 (519) 661-4065 hkl@uwo.ca | |
Survey Items
Key to Which Questions Fall into Which Subscales
I = Information subscale (3 items)
R = Resources subscale (3 items)
IP = Informal Power (4 items)
| No Knowledge | Some Knowledge | Know A Lot | |||||
|---|---|---|---|---|---|---|---|
| I | 1. | The current state of the hospital. | 1 | 2 | 3 | 4 | 5 |
| I | 2. | The values of top management. | 1 | 2 | 3 | 4 | 5 |
| I | 3. | The goals of top management. | 1 | 2 | 3 | 4 | 5 |
| None | Some | A Lot | |||||
|---|---|---|---|---|---|---|---|
| R | 1. | Time available to do necessary paperwork. | 1 | 2 | 3 | 4 | 5 |
| R | 2. | Time available to accomplish job requirements. | 1 | 2 | 3 | 4 | 5 |
| R | 3. | Acquiring temporary help when needed. | 1 | 2 | 3 | 4 | 5 |
| None | Some | A Lot | |||||
|---|---|---|---|---|---|---|---|
| IP | 1. | Collaborating on patient care with physicians. | 1 | 2 | 3 | 4 | 5 |
| IP | 2. | Being sought out by peers for help with problems. | 1 | 2 | 3 | 4 | 5 |
| IP | 3. | Being sought out by managers for help with problems. | 1 | 2 | 3 | 4 | 5 |
| IP | 4. | Seeking out ideas from professionals other than physicians, e.g., Physiotherapists, Occupational Therapists, Dieticians. | 1 | 2 | 3 | 4 | 5 |
Reciprocal Empowerment Scale (RES)
| Reciprocal Empowerment Scale (RES) | ||
|---|---|---|
| Description | The Reciprocal Empowerment Scale (RES) was developed to measure empowerment of staff nurses with the underlying assumption that empowerment is a reciprocal process involving both leaders and followers. The instrument measures three dimensions of empowerment -- reciprocity, synergy and ownership. Reciprocity focuses on the leadership role and emphasizes leader behaviors such as sharing power, support, and information. Synergy involves the formation and communication of a vision, including contributions toward the development of the vision and the long-term direction of the organization. Ownership reflects the follower’s internalization of the vision and organizational commitment. | |
| Measure | Subscales (1) Reciprocity (2) Ownership (3) Synergy | |
| Administration | Survey Administration (1) Paper and pencil (2) 15 minutes (3) 36 questions (4) 5-point Likert scale (not at all true to extremely true) Readability | |
| Scoring | (1) Simple calculations. (2) Subscale score = Sum of items on the subscale (Range 6 - 95, depending on subscale) Total scale score = Sum of subscale scores (Range 36 - 180) 3) (3) Higher scores indicate higher perceptions of empowerment. | |
| Availability | Free if used for research or non-commercial use. | |
| Reliability | Internal consistency of total scale is .95; and ranges from .82 to .95 for subscales. | |
| Validity | Construct validity
| |
| Contact Information | The entire instrument and permission to use the survey can be obtained by contacting: Marilyn Klakovich 1753 Brentwood Avenue Upland, CA 91784 (626) 815-5406 mklakovich@apu.edu | |
Sample Survey Items (6 of 36 items)
(Contact the author for the entire instrument)
Key to Which Questions Fall into Which Subscales for Entire Instrument
R = Reciprocity subscale (19 items)
S = Synergy subscale (11 items)
O = Ownership subscale (6 items)
Please circle the response that best indicates TO WHAT EXTENT, that is, how much each of the following statements is TRUE for you in YOUR PRACTICE or POSITION. There are no right answers.
When an item, refers to your leader, please consider this to be the individual to whom you most directly report (e.g. Director of Nursing). For the purpose of this survey, vision is defined as a statement which clarifies the current situation and induces commitment to the future.
| 1 = NOT AT ALL TRUE (NT) 2 = SLIGHTLY TRUE (ST) 3 = MODERATELY TRUE (MT) 4= VERY TRUE (VT) 5 = EXTREMELY TRUE (ET) | NT | ST | MT | VT | ET | ||
|---|---|---|---|---|---|---|---|
| R | 1. | My leader communicates clear, consistent expectations. | 1 | 2 | 3 | 4 | 5 |
| S | 2. | The vision gives me a sense of purpose. | 1 | 2 | 3 | 4 | 5 |
| O | 3. | I feel that I make a unique contribution to the organization. | 1 | 2 | 3 | 4 | 5 |
| R | 4. | My leader uses my recommendations. | 1 | 2 | 3 | 4 | 5 |
| S | 5. | What I do in my job really impacts the direction of the organization as a whole. | 1 | 2 | 3 | 4 | 5 |
| O | 6. | I get the feeling of pride from the work I do. | 1 | 2 | 3 | 4 | 5 |
Job Design
Alternatives for Measuring Job Design
Job Characteristics Scales (JCS) of the Job Diagnostic Survey (JDS) Revised (1 of 5 subscales)2
| Job Characteristics Scales (JCS) of the Job Diagnostic Survey (JDS) Revised (1 of 5 subscales)2 | ||
|---|---|---|
| Description | The Hackman and Oldham Job Characteristics Model is the dominant model for studying the impact of job characteristics on affective work outcomes (e.g., job satisfaction, empowerment, and motivation) and to a more limited extent behavioral outcomes (e.g., performance, absenteeism, and turnover intentions) (1975; 1980). The Job Characteristics Scales (JCS) are a component of the Job Diagnostic Survey (JDS), the most widely used instrument across many types of jobs to measure perceived job characteristics. The JDS was revised in 1987 to eliminate a measurement artifact resulting from reverse-worded questionnaire items. Only the revised version should be used (Idaszak & Drasgow, 1987). The JCS contain five subscales -- skill variety, task significance, autonomy, task identity and feedback. The JCS is often combined in surveys with other measures of workers’ feelings about and satisfaction with their jobs. Hackman and Oldham recommend that it be administered during regular work hours in groups of no more than 15 respondents at a time (1980). Hackman and Oldham provide substantive guidelines for administration (1980). | |
| Measure | Task identity | |
| Administration | Survey Administration (1) Paper and pencil (2) 3-5 minutes (3) 3 questions (4) 7-item Likert scale (very little to very much) Readability | |
| Scoring | (1) Simple calculations. (2) Subscale score = Average of items on the subscale (Range 1 - 7) (3) Higher scores indicate better job design features. | |
| Availability/ price | Free. | |
| Reliability | Internal consistency ranges from .75 to .79 for the subscales. | |
| Validity | Criterion-related validity:
| |
| Contact Information | Not needed for use of the instrument. | |
Survey Items
Key to Which Questions Fall into Which Subscales
TI = Task Identity subscale (3 items)
On the following pages, you will find several different kinds of questions about your job. Specific instructions are given at the start of each section. Please read them carefully. It should take no more than 10 minutes to complete the entire questionnaire. Please move through it quickly.
The questions are designed to obtain your perceptions of your job. There are no trick questions. Your individual answers will be kept completely confidential. Please answer each item as honestly and frankly as possible. Thank you for your cooperation.
Section One
This part of the questionnaire asks you to describe your job listed above as objectively as you can. Try to make your description as accurate and as objective as you possibly can. Please do not use this part of the questionnaire to show us how much you like or dislike your job.
A sample question is given below.
A. To what extent does your job require you to work overtime?
| 1--- | ---2--- | ---3--- | ---4--- | ---5--- | ---6--- | ---7 |
|---|---|---|---|---|---|---|
| Very little; the job requires almost no overtime hours. | Moderately; the job requires overtime at least a week. | Very much; the job requires overtime more than once a week. | ||||
You are to circle the number which is the most accurate description of your job.
If, for example, your job requires you to work overtime two times a month -- you might circle the number six, as was done in the example above.
Survey Items
(TI) 1. To what extent does your job involve doing a whole and identifiable piece of work? That is, is the job a complete piece of work that has an obvious beginning and end? Or is it only a small part of the overall piece of work, which is finished by other people or by automatic machines?
| 1--- | ---2--- | ---3--- | ---4--- | ---5--- | ---6--- | ---7 |
|---|---|---|---|---|---|---|
| The job is only a tiny part of the overall piece of work; the results of the person’s activities cannot be seen in the final product or service. | The job is a moderate-sized “chunk” of the overall piece of work; the person’s own contribution can be seen in the final outcome. | The job involves doing the whole piece of work, from start to finish; the results of the person’s activities are easily seen in the final product or service. | ||||
Section Two
Listed below are a number of statements which could be used to describe a job.
You are to indicate whether each statement is an accurate or an inaccurate description of your job.
Once again, please try to be as objective as you can in deciding how accurately each statement describes your job -- regardless of you like or dislike your job.
Write a number in the blank beside each statement, based on the following scale:
How accurate is the statement in describing your job?
| 1 Very Inaccurate | 2 Mostly Inaccurate | 3 Slightly Inacurate | 4 Uncertain | 5 Slightly Accurate | 6 Mostly Accurate | 7 Very Accurate |
|---|---|---|---|---|---|---|
| (TI) | _____ 1. | The job is arranged so that I can do an entire piece of work from beginning to end. | ||||
| (TI) | _____ 2. | The job provides me with the chance to finish completely any work I start. | ||||
Job Satisfaction
Alternatives for Measuring Job Satisfaction
Abridged Job Descriptive Index (aJDI) (Short Form) Facet Scales
© Bowling Green University
| Abridged Job Descriptive Index (aJDI) (Short Form) Facet Scales © Bowling Green University | ||
|---|---|---|
| Description | The Job Descriptive Index is perhaps the premier instrument for assessing job satisfaction. It is a multi-faceted assessment of job satisfaction that has been extensively used in research and applied settings for over 40 years. The JDI comes in both long (90 item) and short (“abridged - 25 item) versions. The short form or abridged JDI (aJDI), described here, poses less of an administrative and scoring burden and is, therefore, the version included here. Five facets of job satisfaction are assessed by the JDI. In the aJDI, each facet (or subscale) is composed of 5 items (25 items total). The facets are: work on present job; present pay; opportunities for promotion; supervision; and, coworkers. The JDI adheres to the idea that overall job satisfaction is not simply the sum of satisfaction with different aspects of work. Therefore, an additional scale, Job in General (JIG), evaluates overall job satisfaction. The short form of the JIG scale consists of 8 items. | |
| Measure | Subscales (1) Work on present job (2) Present pay (3) Opportunities for promotion (4) Supervision (5) Coworkers A separate overall satisfaction scale (Job in General, or JIG) is also available. | |
| Administration | Survey Administration (1) Paper and pencil (2) 5-10 minutes (3) 25 questions (plus 8 items for Job in General) (4) Respondent indicates if each item does or does not describe their work situation Readability | |
| Scoring | (1) Scoring algorithms are described in the Users Manual. SAS and SPSS scoring code is available. (2) Not known. (3) Not known. | |
| Availability | Bowling Green State University owns a copyright of the JDI and JIG. Cost depends on user status (academic or commercial) and whether the user is willing to share collected data with the JDI research group. User manuals and software are extra cost options. Non-academic users must pay a fee for the test booklets and scoring code. The base price for non-academic users for data collection instruments is $100 per test booklet (100 forms). Additional cost items include SAS/SPSS scoring code ($10.00) and the Users Manual: ($50.00). Complete pricing information is available at: http://www.bgsu.edu/departments/psych/JDI/price.html. For academic research, fees for the data collection instruments may be waived in return for the user sharing item level data collected with the instrument with the JDI Research Group. | |
| Reliability | Internal consistency has been consistently shown to be > .70 for all subscales. | |
| Validity | An extensive meta-analysis of the measurement properties of the JDI found that content, criterion-related, and convergent validity are well established (e.g., correlates as expected with turnover, and other job satisfaction measures). | |
| Contact Information | The JDI is available from: JDI Research Group, Bowling Green State University Department of Psychology Bowling Green, OH 43403 Phone: (419) 372-8247 jdi_ra@bgnet.bgsu.edu | |
Sample Survey Items
NOTE: Below is only a sample of the items in the abridged Job Descriptive Index (aJDI). The complete aJDI is not available without charge; therefore, we cannot include here.
Key to Which Questions Fall into Which Subscales
Only a subset of items in each of the 6 subscales is provided below.
Think of the work you do at present. How well does each of the following words or phrases describe your job? In the blank beside each word or phrase: below, write:
__Y__ for "Yes" if it describes your work
__N__ for "No" if it does NOT describe it
__?__ for "?" if you can not decide
Work on Present Job
_____ Fascinating
_____ Pleasant
_____ Can see results
Present Pay
_____ Barely live on income
_____ Well-paid
_____ Bad
Opportunities for Promotion
_____ Regular promotions
_____ Promotion on ability
_____ Opportunities somewhat limited
Supervision
_____ Knows job well
_____ Doesn’t supervise enough
_____ Around when needed
Co-Workers
_____ Stimulating
_____ Unpleasant
_____ Smart
Job in General
_____ Pleasant
_____ Worse than most
_____ Worthwhile
Minnesota Satisfaction Questionnaire (MSQ) (Short Form)
© Vocational Psychology Research, University of Minnesota. Reproduced by permission.
| Minnesota Satisfaction Questionnaire (MSQ) (Short Form) © Vocational Psychology Research, University of Minnesota. Reproduced by permission. | ||
|---|---|---|
| Description | The Minnesota Satisfaction Questionnaire (MSQ) is a popular measure of job satisfaction that conceptualizes satisfaction as being related to either intrinsic or extrinsic aspects of the job. Intrinsic satisfaction is related to how people feel about the nature of their job tasks, while extrinsic satisfaction is concerned with aspects of the job that are external or separate from job tasks or the work itself. The MSQ has been in use for over 30 years in a wide range of jobs, including factory and production work, management, education (primary, secondary, college), health care (including nurses, physicians, and mental health workers), and sales. Several studies of nursing assistants in long term care facilities have used the MSQ (Friedman et al., 1999; Grieshaber et al., 1995; Waxman et al., 1984). | |
| Measure | Subscales (1) Intrinsic job factors (2) Extrinsic job factors | |
| Administration | Survey Administration (1) Paper and pencil (2) 5 minutes (3) 20 questions (4) 5-point Likert scaling (extremely satisfied to not satisfied) Readability | |
| Scoring | (1) Simple calculations. (2) Subscale scores = Sum of items on the subscale. (3) Higher scores indicate higher job satisfaction. | |
| Availability | Fee charged. The short form is available in quantities of 50 or more for $0.39 per copy. A users manual is also available, for $4.95. An order form for the MSQ can be found at: http://www.psych.umn.edu/psylabs/vpr/orderform.html. Scoring can be done by the user following the simple rules described in the users’ manual. Alternatively, surveys may be machine scored by the vocational Psychology Institute at a cost of $1.10 per form. | |
| Reliability | Internal consistency ranges from .84 - .91 for the Intrinsic subscale, from .77 - .82 for the Extrinsic subscale, and from .87 - .92 for the General Satisfaction scale. | |
| Validity | Construct validity:
| |
| Contact Information | The instrument is available from: Vocational Psychology Research N657 Elliott Hall University of Minnesota Minneapolis MN 55455-0344 Phone: (612) 625-1367 vpr@tc.umn.edu. | |
Survey Items
Key to Which Questions Fall into Which Subscales
IS = Intrinsic Satisfaction subscale (12 items)
ES = Extrinsic Satisfaction subscale (6 items)
GI = General items (2 items, plus all other items)
Ask yourself: How satisfied am I with this aspect of my job?
5=extremely satisfied
4=very satisfied
3=satisfied
2=somewhat satisfied
1=not satisfied
| Ask yourself: How satisfied am I with this aspect of my job? | ||
|---|---|---|
| IS | 1. | Being able to keep busy all the time. |
| IS | 2. | The chance to work alone on the job. |
| IS | 3. | The chance to do different things from time to time. |
| IS | 4. | The chance to be somebody in the community. |
| ES | 5. | The way my boss handles his/her workers. |
| ES | 6. | The competence of my supervisor in making decisions. |
| IS | 7. | Being able to do things that don’t go against my conscience. |
| IS | 8. | The way my job provides for steady employment. |
| IS | 9. | The chance to do things for other people. |
| IS | 10. | The chance to tell people what to do. |
| IS | 11. | The chance to do something that makes use of my abilities. |
| ES | 12. | The way company policies are put into practice. |
| ES | 13. | My pay and the amount of work I do. |
| ES | 14. | The chances for advancement on this job. |
| IS | 15. | The freedom to use my own judgment. |
| IS | 16. | The chance to try my own methods of doing the job. |
| GI | 17. | The working conditions. |
| GI | 18. | The way my coworkers get along with each other. |
| ES | 19. | The praise I get for doing a good job. |
| IS | 20. | The feeling of accomplishment I get from the job. |
Misener Nurse Practitioner Satisfaction Scale
| Misener Nurse Practitioner Satisfaction Scale | ||
|---|---|---|
| Description | The Misener Nurse Practitioner Satisfaction Scale is designed to assess six dimensions of job satisfaction: (1) Intrapractice partnership/collegiality; (2) Challenge/autonomy; (3) Professional, social, and community interaction; (4) Professional growth; (5) Time; and (6) Benefits. | |
| Measure | Subscales (1) Collegiality (2) Challenge/autonomy (3) Professional, social, and community interaction (4) Professional growth (5) Time (6) Benefits | |
| Administration | Survey Administration (1) Paper and pencil (2) 5-10 minutes (3) 44 questions (4) 6-point Likert scaling (very dissatisfied to very satisfied) Readability | |
| Scoring | (1) Simple calculations. (2) Subscale scores = Sum of items on the subscale. (3) Higher scores indicate higher job satisfaction. | |
| Availability | Free. | |
| Reliability | Internal consistency ranges from .79 - .94 for the subscales. | |
| Validity | Construct validity:
| |
| Contact Information | Not needed for use of the instrument. | |
Survey Items
Key to Which Questions Fall into Which Subscales
IP/C = Intrapractice partnership/collegiality subscale (14 items)
C/A = Challenge/autonomy subscale (10 items)
PSCI = Professional, social, and community interaction subscale (8 items)
PG = Professional growth subscale (6 items)
T = Time subscale (3 items)
B = Benefits subscale (3 items)
The following is a list of items known to have varying levels of satisfaction among nurse practitioners. There may be items that to not pertain to you, however, please answer them if you are able to assess your satisfaction with the item based on the employer’s policy.
How satisfied are you in your current job as a nurse practitioner with respect to the following factors?
6=Very Satisfied
5=Satisfied
4=Minimally satisfied
3=Minimally dissatisfied
2=Dissatisfied
1=Very dissatisfied
| How satisfied are you in your current job as a nurse practitioner with respect to the following factors? | ||
|---|---|---|
| B | 1. | Vacation/leave policy |
| B | 2. | Benefit package |
| B | 3. | Retirement plan |
| T | 4. | Time allotted for answering messages |
| PG | 5. | Time allotted for review of lab and other test results |
| IP/C | 6. | Your immediate supervisor |
| C/A | 7. | Percentage of time spent in direct patient care |
| T | 8. | Time allocation for seeing patients |
| IP/C | 9. | Amount of administrative support |
| PSCI | 10. | Quality of assistive personnel |
| T | 11. | Patient scheduling policies and practices |
| C/A | 12. | Patient mix |
| C/A | 13. | Sense of accomplishment |
| PSCI | 14. | Social contact at work |
| PSCI | 15. | Status in the community |
| PSCI | 16. | Social contact with your colleagues after work |
| PSCI | 17. | Professional interaction with other disciplines |
| PG | 18. | Support for continuing education |
| PG | 19. | Opportunity for professional growth |
| PG | 20. | Time off to serve on professional committees |
| PG | 21. | Amount of involvement in research |
| C/A | 22. | Opportunity to expand your scope of practice |
| PSCI | 23. | Interaction with other NPs including faculty |
| IP/C | 24. | Consideration given to your opinion and suggestions for change in the work setting or office practice |
| IP/C | 25. | Input into organizational policy |
| IP/C | 26. | Freedom to question decisions and practices |
| C/A | 27. | Expanding skill level/procedures within your scope of practice |
| C/A | 28. | Ability to deliver quality care |
| PG | 29. | Opportunities to expand your scope of practice and time to seek advanced education |
| IP/C | 30. | Recognition for your work from supervisors |
| PSCI | 31. | Recognition of your work from peers |
| C/A | 32. | Level of autonomy |
| IP/C | 33. | Evaluation process and policy |
| IP/C | 34. | Reward distribution |
| C/A | 35. | Sense of value for what you do |
| C/A | 36. | Challenge in work |
| IP/C | 37. | Opportunity to develop and implement ideas |
| IP/C | 38. | Process used in conflict resolution |
| IP/C | 39. | Amount of consideration given to your personal needs |
| C/A | 40. | Flexibility in practice protocols |
| IP/C | 41. | Monetary bonuses that are available in addition to your salary |
| IP/C | 42. | Opportunities to receive compensation for services performed outside your normal duties |
| IP/C | 43. | Respect for your opinion |
| PSCI | 44. | Acceptance and attitudes of physicians outside of your practice |
Peer-to-Peer Work Relationships
Introduction
Definition of Peer-To-Peer Work Relationships
The peer-to-peer work relationships topic addresses workers’ perceptions of their relationships with peer co-workers. It is concerned with both workers’ feelings for their peer co-workers, and for workers’ attitudes toward their peer group at large (e.g., DCWs’ attitudes toward all DCWs, not just those in their organization).
Peer-to-peer work relationships are important for organizations to consider, as coworker relationships have been found to strongly predict turnover (Pillemer, 1997). Further, the nature of coworker relationships has been shown to contribute to job commitment and accepting attitudes toward the elderly in long-term care facilities (Robertson, 1989).
Overview of Selected Measures of Peer-To-Peer Work Relationships
The instrument reviewed under the Job Satisfaction section of this Measurement Guide provides subscales assessing the respondent’s satisfaction with his/her relationships with peer co-workers:
- Satisfaction with Co-Workers Subscale of abridged Job Descriptive Index (aJDI) (1 of 5 subscales)
Issues to Consider When Selecting Measures of Peer-To-Peer Work Relationships
- Although the Misener Nurse Practitioner Satisfaction Scale provides an assessment of collegiality, the scale is not targeted at particular relationships and includes questions regarding the respondents relationship with both peers and supervisors. Given this, the Misener scale is not included here.
Alternatives for Measuring Peer-To-Peer Work Relationships
Satisfaction with Co-Workers Subscale of the abridged Job Descriptive Index (aJDI) (1 of 5 subscales)3
| Satisfaction with Co-Workers Subscale of the abridged Job Descriptive Index (aJDI) (1 of 5 subscales)3 | ||
|---|---|---|
| Description | The Job Descriptive Index is perhaps the premier instrument for assessing job satisfaction. It is a multi-faceted assessment of job satisfaction that has been extensively used in research and applied settings for over 40 years. The JDI comes in both long (90 item) and short (abridged - 25 item) versions. The short form or abridged JDI (aJDI), described here, poses less of an administrative and scoring burden and is, therefore, the version included here. Five facets of job satisfaction are assessed by the JDI. In the aJDI, each facet (or subscale) is composed of 5 items (25 items total). The facets are: work on present job; present pay; opportunities for promotion; supervision; and, coworkers. The JDI adheres to the idea that overall job satisfaction is not simply the sum of satisfaction with different aspects of work. Therefore, an additional scale, Job in General (JIG), evaluates overall job satisfaction. The short form of the JIG scale consists of 8 items. | |
| Measure | Satisfaction with Co-Workers | |
| Administration | Survey Administration (1) Paper and pencil. (2) Approximately 2 minutes or less (3) 5 questions (4) Respondent indicates if each question does or does not describe their work situation Readability | |
| Scoring | (1) Scoring algorithms are described in the Users Manual. SAS and SPSS scoring code is available. (2) Not known. (3) Not known. | |
| Availability | Bowling Green State University owns a copyright of the JDI and JIG. The subscale is not available separately from the JDI. Cost depends on user status (academic or commercial) and whether the user is willing to share collected data with the JDI research group. | |
| Reliability | Internal consistency of the scale has been consistently shown to be >.70. | |
| Validity | An extensive meta-analysis of the measurement properties of the JDI found that content, criterion-related, and convergent validity are well established (e.g., correlates as expected with turnover and other job satisfaction measures). | |
| Contact Information | The JDI is available from: JDI Research Group Bowling Green State University Department of Psychology Bowling Green, OH 43403 Phone: (419) 372-8247 jdi_ra@bgnet.bgsu.edu | |
Survey Items
The Job Satisfaction section in this Appendix contains sample items for this subscale of the JDI.
Worker-Supervisor Relationships
Alternatives for Measuring Worker-Supervisor Relationships
External Satisfaction (ES) Subscale from the Minnesota Satisfaction Questionnaire (MSQ)
© Vocational Psychology Research, University of Minnesota. Reproduced by permission.
| External Satisfaction (ES) Subscale from the Minnesota Satisfaction Questionnaire (MSQ) © Vocational Psychology Research, University of Minnesota. Reproduced by permission. | ||
|---|---|---|
| Description | The Minnesota Satisfaction Questionnaire (MSQ) is a popular measure of job satisfaction that conceptualizes satisfaction as being related to either intrinsic or extrinsic aspects of the job. Intrinsic satisfaction is related to how people feel about the nature of their job tasks, while extrinsic satisfaction is concerned with aspects of the job that are external or separate from job tasks or the work itself. The MSQ has been in use for over 30 years in a wide range of jobs, including factory and production work, management, education (primary, secondary, college), health care (including nurses, physicians, and mental health workers), and sales. Several studies of nursing assistants in long term care facilities have used the MSQ (Friedman et al., 1999; Grieshaber et al., 1995; Waxman et al., 1984). | |
| Measure | External Satisfaction (ES) | |
| Administration | Survey Administration (1) Paper and pencil (2) Approximately 2 minutes or less (3) 6 questions (4) 5-point Likert scale (not satisfied to extremely satisfied) Readability | |
| Scoring | (1) Simple calculations. (2) Subscale scores = Sum of items on the subscale (Range 0 - 30). (3) Higher scores indicate higher job satisfaction. | |
| Availability | Fee. | |
| Reliability | Internal consistency of the External Satisfaction (ES) subscale ranges from .77 - .82. | |
| Validity | As with MSQ generally, psychometric investigations have rated the construct validity of the scale as adequate. | |
| Contact Information | The instrument is available from: Vocational Psychology Research N657 Elliott Hall University of Minnesota Minneapolis MN 55455-0344 Phone (612) 625-1367 vpr@tc.umn.edu | |
Survey Items
The Job Satisfaction section in this Appendix contains the items for this subscale of the MSQ.
Satisfaction with Co-Workers Subscale of the abridged Job Descriptive Index (aJDI) (1 of 5 subscales)4
| Satisfaction with Co-Workers Subscale of the abridged Job Descriptive Index (aJDI) (1 of 5 subscales)4 | ||
|---|---|---|
| Description | The Job Descriptive Index is perhaps the premier instrument for assessing job satisfaction. It is a multi-faceted assessment of job satisfaction that has been extensively used in research and applied settings for over 40 years. The JDI comes in both long (90 item) and short (abridged - 25 item) versions. The short form or abridged JDI (aJDI), described here, poses less of an administrative and scoring burden and is, therefore, the version included here. Five facets of job satisfaction are assessed by the JDI. In the aJDI, each facet (or subscale) is composed of 5 items (25 items total). The facets are: work on present job; present pay; opportunities for promotion; supervision; and, coworkers. The JDI adheres to the idea that overall job satisfaction is not simply the sum of satisfaction with different aspects of work. Therefore, an additional scale, Job in General (JIG), evaluates overall job satisfaction. The short form of the JIG scale consists of 8 items. | |
| Measure | Satisfaction with Co-Workers | |
| Administration | Survey Administration (1) Paper and pencil. (2) Approximately 2 minutes or less (3) 5 questions (4) Respondent indicates if each question does or does not describe their work situation Readability | |
| Scoring | (1) Scoring algorithms are described in the Users Manual. SAS and SPSS scoring code is available. (2) Not known. (3) Not known. | |
| Availability | Bowling Green State University owns a copyright of the JDI and JIG. The subscale is not available separately from the JDI. Cost depends on user status (academic or commercial) and whether the user is willing to share collected data with the JDI research group. | |
| Reliability | Internal consistency of the scale has been consistently shown to be >.70. | |
| Validity | An extensive meta-analysis of the measurement properties of the JDI found that content, criterion-related, and convergent validity are well established (e.g., correlates as expected with turnover and other job satisfaction measures). | |
| Contact Information | The JDI is available from JDI Research Group Bowling Green State University Department of Psychology Bowling Green, OH 43403 Phone: (419) 372-8247 jdi_ra@bgnet.bgsu.edu | |
Survey Items
The Job Satisfaction section in this Appendix contains sample items for this subscale of the JDI.
Instruments Which Require New Data Collection -- Measures of the Organization
Organizational Culture
Alternatives for Measuring Organizational Culture Nursing Home Adaptation of the Organizational Culture Profile (OCP)
| Alternatives for Measuring Organizational Culture Nursing Home Adaptation of the Organizational Culture Profile (OCP) | ||
|---|---|---|
| Description | Sheridan et al. developed the Nursing Home Culture Profile in a study of continuous quality improvement initiatives in 30 nursing homes in Texas (1995). The instrument is an adaptation of the more general Organizational Culture Profile (OCP) that involved having employees identify the culture values shared by organization members rather than relying on researchers’ expectations (O’Reilly et al., 1991). Accordingly, 6 staff focus groups were used to generate a list of statements that represent values that may be shared by nursing home staff. This represents a more grounded approach to culture, not based on previously established measures of what constitutes important dimensions of culture. Respondents from all levels and departments are included and the exercise can be administered on site. The format used by Sheridan et al. was a Q-sort procedure in which each respondent was given a stack of 18 cards each containing one of the value statements. They were instructed to sort the cards into categories that created a forced (2,4,6,4,2) bell-shaped distribution where the two most important were labeled 5, the two least important labeled 1, etc. The logic of forcing the distribution is that a variety of natural rating biases will result in little variation if staff is asked to simply rate (on a Likert type scale) these values. Personal communication with the lead researcher indicated that this process was cumbersome and challenging for some respondents, however. In the Texas study, the responses from the 747 raters in the 30 facilities were factor analyzed and three dimensions were identified (4 items did not appear to load on any factor): Concern -- the importance of mutual trust and concern between administration and employees as well as caring attitudes of staff toward residents (5 items) Teamwork -- the importance of cooperation and balanced priorities among staff, administration and resident families in providing care (5 items) Being Best -- the importance of problem-solving and improvement initiatives by employees and administrative support to provide the best care possible (4 items) | |
| Measure | Subscales (1) Concern (2) Teamwork (3) Being the best | |
| Administration | Survey Administration (1) Q Card sort (not a survey) (2) Time not reported (3) 18 values statements, each on a separate card (4) Raters group cards into a forced bell-shaped distribution, to produce more variation than may occur with a Likert scale Readability | |
| Scoring | (1) Q-sort requires multivariate statistics and is not recommended. Adapting the value statements on the cards into survey questions would be preferable. (2) Scoring currently requires factor analysis and is not recommended. (3) Scoring of subscales is not applicable here. | |
| Availability | Free. | |
| Reliability | Not reported and not applicable, since the items are value statements without response options. | |
| Validity | Construct validity:
| |
| Contact Information | Not needed for use of this instrument. | |
Survey Items (Q Sort Card Items)
| Value statement in NHCP instrument | Factor 1 Concern | Factor 2 Teamwork | Factor 3 Being Best |
|---|---|---|---|
| Trust -- Employees feel free to state their problems and ideas with other staff and administration. | .40 | .03 | .02 |
| Well Being --Our pay, benefits, and training show that this home is concerned about us. | .50 | .12 | .28 |
| Listening -- Supervisors and Administrators listen to the ideas of employees. They do something about these ideas. | .63 | .12 | .04 |
| Caring Attitude -- We all enjoy helping residents and take time to do the little things that make them feel at home. | .56 | .02 | .06 |
| Resident Rights -- We respect all residents -- even those who may be difficult. | .49 | .28 | .30 |
| Responsibility -- Employees come to work and do their fair share of the work. | .09 | .56 | .17 |
| Balanced Priorities -- The needs of the residents are as important as budget worries. | .13 | .49 | .07 |
| Self-Initiative When things need to be done, employees do it even though it may not be their job. | .19 | .45 | .27 |
| Teamwork -- Employees respect each other and work together as a team. | .12 | .61 | .14 |
| Family Involvement -- Families know what is going on with their loved ones and are encouraged to stay involved in the home. | .26 | .53 | .00 |
| Support for Employees -- We have enough staff and supplies so that we can give the best care to all residents. | .29 | .18 | .50 |
| Reputation -- We are proud to work here because it has a good reputation in the community. | .04 | .27 | .57 |
| Problem Solving -- We like to solve problems on our own and look for better ways to do our jobs. | .03 | .13 | .51 |
| Be the Best -- Employees work very hard to be the best nursing home in the area. | .28 | .04 | .57 |
| Resident Focus -- We try to guess what residents need and look for ways to please residents and their families. | .31 | .28 | .03 |
| Cooperation -- Dietary, housekeeping, and nursing work well together to meet al the residents needs. | .06 | .02 | .25 |
| Good Communication -- We are kept totally informed about any changes that will affect us. | .30 | .18 | .15 |
| Changes -- We are encouraged to find new ways to improve the quality of services. Our ideas are supported and welcomed. | .36 | .23 | .23 |
| Eigenvalue | 2.32 | 1.74 | 1.45 |
Organizational Structure
Introduction
Definition of Organizational Structure
There are numerous different definitions of organizational structure. In one sense, organizational structure is the way duties are arranged to get work done. While there are many features of organizational structure, we focus on those that have been shown to affect the work life of DCWs. Some aspects of organizational structure are appropriate to be measured mainly from the perspective of management (e.g., are formal procedures used to manage the work of home health aides). However, other aspects of organizational structure (e.g., decision making structure, communication, leadership) are best addressed by measuring perceptions at multiple levels within the organization (e.g., nurse aide, charge nurse, DON, administrator).
Overview of Selected Measures of Organizational Structure
Research on organizational structure in long term care settings is scarce and this topic needs further development. We include one measure that addressees the leadership and communication dimension of organizational structure:
- Communication and Leadership Subscales of the Nursing Home Adaptation of the Shortell Organization and Management Survey
Issues to Consider When Selecting Measures of Organizational Structure
- To date, no issues have been identified for use of this instrument.
Alternatives for Measuring Organizational Structure
Communication and Leadership Subscales of the Nursing Home Adaptation of the Shortell Organization and Management Survey
| Communication and Leadership Subscales of the Nursing Home Adaptation of the Shortell Organization and Management Survey | ||
|---|---|---|
| Description | Communication among those involved in providing care has been shown to be a critical factor in quality of care and in turnover in hospital intensive care units (Shortell et al., 1991). A number of reports about the working conditions of DCWs in long term care have indicated that communication is a highly meaningful aspect of DCWs’ being recognized as part of a care team. However, direct measurement of communication quality in LTC settings has been lacking. Shortell and colleagues developed and tested a measure of communication among professional staff in Intensive Care Units (ICUs) as part of their larger Organization and Management Survey (1991). The multi-item communication subscales included openness, accuracy, timeliness, understanding and satisfaction with communication. The subscales were highly correlated in the ICU study. Scott-Cawiezell and her colleagues have adapted and tested the Shortell Organization and Management Survey for use in nursing homes (1991). Scott et al. surveyed RNs, LPNs, and CNAs in a sample of 32 Colorado nursing homes (additional samples of 42, and 60 have produced comparable results). Factor analysis (a statistical technique used to explore what items go together to measure an underlying concept) of 69 items collected from this sample resulted in five factors (or groupings among the items) (Scott et al., 2003). These factors (shown as subscales below) include two about leadership, two about communication, and one that is a mix of items on leadership and communication. Further analyses have evolved the subscales to Organizational Harmony, Connectedness, and Clinical Leadership (Scott-Cawiezell et al., in press). | |
| Measure | Initial Subscales (1) Connectedness (2) Timeliness & Understanding (3) Organizational Harmony (4) Clinical Leadership (5) Perceived Effectiveness Later Subscales that were Nursing Home specific | |
| Administration | Survey Administration (1) Paper and pencil (2) 15-20 minutes (3) 69 questions (4) 5-point Likert scale (strongly agree to strongly disagree) Readability | |
| Scoring | (1) Simple calculations. (2) Score = Average of the items in a subscale, after reversing negatively worded items (Range 1 - 5). (3) Higher scores indicate better perceived communication (or leadership). | |
| Availability | Contact Jill Scott-Cawiezell for availability information (information below). | |
| Reliability | Internal consistency of subscales ranges from .83 to .94, in a sample of CNAs, LPNs, and RNs. | |
| Validity | Construct validity:
| |
| Contact Information | For information on the instrument and its availability, contact: Jill Scott-Cawiezell, PhD, RN University of Missouri-Columbia S235 Sinclair School of Nursing Building (573) 882-0264 scottji@missouri.edu | |
Survey Items
NOTE: Below is only a sample of the items in the survey.
Key to Which Questions Fall into Which Subscales
Only a subset of items in each of the 5 subscales is provided below.
Response options use a 5-point Likert scale (1=strongly disagree to 5=strongly agree).
Connectedness (total number of items not yet known)
- I take pride in this facility
- I identify with the facility goals
- I am part of the team
Timeliness and Understanding (total number of items not yet known)
- We get information when we need it
- Physicians are available when they are needed
- We get information about changes in resident status
Organizational Harmony (total number of items not yet known)
- Nurses are uncertain where they stand (reversed)
- Nursing leadership is out of touch with staff concerns (reversed)
- Decisions are made without staff input
Clinical Leadership (total number of items not yet known)
- Staff meetings are used to resolve issues
- Staff interests are represented at higher levels of the facility
- Standards of excellence are emphasized
Perceived Effectiveness
- Our facility meets patient care goals
- Our residents experience very good outcomes
- Our facility does a good job of meeting family needs
Notes
-
The other three subscales of the Conditions for Work Effectiveness Questionnaire (CWEQ I) and (CWEQ II Short Form) can be found in the Empowerment topic section in Chapter 3.
-
The other four subscales of the Job Characteristics Scales (JCS) of the Job Diagnostic Survey (JDS) Revised can be found in the Job Design topic section in Chapter 3.
-
The other four subscales for the Job Descriptive Index (JDI) can be found in the Job Satisfaction topic section of this Appendix.
-
The other four subscales for the Job Descriptive Index (JDI) can be found in the Job Satisfaction topic section of this Appendix.
APPENDIX H: GUIDE REVIEWERS
This appendix is also available as a separate PDF File.
| Key Informants | |
|---|---|
| Marcie Barnette National Association for Home Care (NAHC) | Ted Benjamin, PhD University of California, Los Angeles |
| Chris Condeelis American Health Care Association (AHCA) | Howard Croft SEIU |
| Farida Ejaz, PhD Benjamin Rose Margaret Blenkner Research Institute | Cheryl Feldman District 1199C Training & Upgrading Fund |
| Di Findlay Iowa Caregivers Association (ICA) | Sandra Fitzler American Health Care Association (AHCA) |
| Penny Hollander Feldman, PhD Visiting Nurse Service (VNS) or New York | Linda Hollinger-Smith, PhD Mather Institute on Aging |
| Ruta Kadanoff American Association of Homes and Services for the Aging (AAHSA) | Rosalie Kane, PhD University of Minnesota |
| Dean Mertz The Evangelical Lutheran Good Samaritan Society | Douglas Pace American Association of Homes and Services for the Aging (AAHSA) |
| Pat Parmelee, PhD Emory University Department of Medicine | Karl Pillemer, PhD Cornell University |
| Shelley Sabo National Center for Assisted Living (NCAL) | Vera Salter, PhD Paraprofessional Healthcare Institute |
| Mary Tellis-Nayak American College of Health Care Administrators (ACHCA) | Linda Velgouse American Association of Homes and Services for the Aging (AAHSA) |
| Mary Ann Wilner, PhD Direct Care Alliance | Barbara Wisnefski Kenosha County Job Center |
| Dale Yeatts, PhD University of North Texas | Sheryl Zimmerman, PhD Cecil G. Sheps Center for Health Services Research The University of North Carolina at Chapel Hill |
| Technical Expert Panel | |
|---|---|
| Barbara Bowers, PhD University of Wisconsin, Madison | Diane Brannon, PhD The Pennsylvania State University |
| Suzanne Broderick, PhD New York State Department of Health | Steven Dawson Paraprofessional Healthcare Institute |
| Susan Harmuth North Carolina Department of Health and Human Services | Dale Laninga Pennsylvania Intro-Governmental Council on Long Term Care Pennsylvania Department of Aging |
| Robert Logan, PhD Council on Aging, Southwestern Ohio | Connie Marsh Provena Senior Health Services |
| Carol Raphael Visiting Nurse Service (VNS) or New York | William Spector, PhD Agency for Healthcare Research and Quality (AHRQ) |
| Suzanne Teegarden Workforce Learning Strategies | Mary Vencill Berkeley Policy Associate |