
Angela M. Greene, Nga Thach, Joshua M. Wiener and Galina Khatutsky
RTI International
Printer Friendly Version in PDF Format (17 PDF pages)
ABSTRACT
This issue brief examines concerns individuals have about becoming disabled and needing long-term services and supports (LTSS), how these concerns vary by household income and assets, what actions people are willing to take to address their LTSS needs, and how homeowners who are willing to use home equity to finance LTSS differ from those who are not willing.
This issue brief examines concerns individuals have about becoming disabled and needing LTSS, how these concerns vary by household income and assets, what actions people are willing to take to address their LTSS needs, and how homeowners who are willing to use home equity to finance LTSS differ from those who are not willing. It was authored by Angela M. Greene, Nga Thach, Joshua M. Wiener and Galina Khatutsky from RTI International. The authors gratefully acknowledge contributions of Judy Dey and Pam Dotty of ASPE/HHS. The views expressed in this brief are those of the authors and do not express the views of HHS or RTI International.
EXECUTIVE SUMMARY
With the aging of the United States population and the higher prevalence of chronic illness and disability, understanding what concerns Americans have about becoming disabled and using long-term services and supports (LTSS) and what actions they are willing to take should they need LTSS is increasingly important. This issue brief examines concerns individuals have about becoming disabled and needing LTSS, how these concerns vary by household income and assets, what actions people are willing to take to address their LTSS needs, and how homeowners who are willing to use home equity to finance LTSS differ from those who are not willing.
To explore these issues, this issue brief uses data from the 2014 Survey of Long-Term Care Awareness and Planning sponsored by the Office of the Assistant Secretary for Planning and Evaluation (ASPE)/U.S. Department of Health and Human Services (HHS). The survey was conducted in the summer of 2014 with a nationally representative sample of 15,298 non-institutionalized persons aged 40-70 from the web-based KnowledgePanel® (KP). Survey respondents were asked questions about seven concerns and ten actions related to LTSS.
Key Findings:
-
The majority of respondents expressed multiple concerns about LTSS. More than three-quarters expressed at least five of the seven concerns. Only a small minority expressed no concerns at all. Losing independence was a concern shared by almost all respondents; fewer, almost two-thirds, were concerned about being unable to depend on family or friends for care.
-
There was little variation in concerns by income and savings, though respondents falling into the extreme categories (i.e., lowest income/savings or highest income/savings) were slightly less worried about LTSS needs than those with moderate incomes or savings.
-
Most respondents expressed willingness to make modifications to homes; rely on spouse, family, or friend; or have family or friend move in. Fewer than half were willing to move in with family/friends or use the value in their home to pay for LTSS. Only slightly more than a quarter were likely to be willing to move into a nursing home.
-
Those with the highest incomes were more willing to take actions that require financial resources, while those with the lowest incomes were generally less willing to take actions to address a disability.
-
Slightly fewer than half of homeowners expressed willingness to use the value in their homes to pay for LTSS.
-
Although data showed little overall variation for age and income in willingness to use home equity, males, people who are unmarried, those with more savings and assets, and non-Whites were more willing to use home equity to pay for LTSS.
Although almost all respondents reported multiple concerns about their future LTSS needs and many were willing to take actions related to LTSS, many were not willing to use paid services or receive the informal care needed to address their LTSS needs. These findings highlight the long-term care (LTC) concerns of Americans aged 40-70 and support the need for increased education of the American public on their LTSS choices and financing options.
Introduction
People with disabilities who need LTSS confront a fragmented and uncoordinated system that has many problems. LTSS is expensive, with the median private pay cost of a private room in a nursing home of $88,000 per year in 2014 (Genworth Financial, 2014). Although Medicare and private insurance cover short-term, post-acute services in nursing homes and home health agencies, they provide little coverage for LTSS. As a result, individuals must pay out-of-pocket for LTSS and may face high costs after using services. Many LTSS users impoverish themselves and some spend down to qualify for Medicaid (Wiener, Anderson, Khatutsky, Kaganova, & O'Keeffe, 2013). Although people with disabilities strongly prefer home and community-based services, the financing system remains oriented toward institutional services (Eiken et al., 2014). Despite the growth in home and community-based services, families and friends remain the main source of care for people with disabilities, who often help at great personal and financial cost (Feinberg, Reinhard, Houser, & Choula, 2011). Finally, concerns about quality of care in LTSS are widespread, especially in nursing homes (Levinson, 2014).
This issue brief uses data from the 2014 Survey of Long-Term Care Awareness and Planning to examine the most common LTSS-related concerns (e.g., affording LTSS, choice of the type of LTSS, losing independence, being a burden to family) among a representative sample of adults aged 40-70. The brief also assesses respondents' willingness to take various actions related to use of LTSS.
Research Questions
This brief addresses the following research questions:
-
What are people's main concerns about becoming disabled? How are income and assets associated with concerns and actions regarding LTSS?
-
What actions are people willing to take to help address their LTSS needs?
-
How do homeowners who are willing to use home equity to finance LTC differ from those who are not willing?
Background
With the rapid aging of the United States population and the growing demands on the LTSS system, it is becoming increasingly important to understand what concerns Americans have about becoming disabled and using LTSS. Several studies highlight the ability to pay for LTSS as a concern many people have. In a Kaiser Family Foundation survey (2007), 28 percent of respondents reported being very worried and 25 percent somewhat worried that they will not be able to pay for nursing home and home care services. Similarly, 58 percent of California respondents felt "not very prepared" or "not at all prepared" financially if they needed LTSS "right now" and 68 percent reported that they would not be able to pay for more than 3 months of nursing home care. In addition, 57 percent of respondents reported not being able to afford more than 3 months of part-time personal care at home. In the America's Health Insurance Plans' buyer/non-buyer LTC insurance study, 68 percent of LTC insurance purchasers in 2005 cited being able to afford needed services as being a very important reason for purchasing LTC insurance (LifePlans, 2007). Concerns about financial dependence, having to depend on others for care, and avoiding Medicaid were also cited by LTC purchasers as important motivators for them to purchase a policy (LifePlans, 2007).
People were also concerned about where they would receive LTSS, and most individuals have clear preferences to be cared for in their own homes. In RTI's survey of people living in Hawaii, 41 percent preferred to receive LTSS from family and friends, and about 29 percent preferred to pay a nurse or a personal care assistant to provide LTSS at home (Khatutsky, Wiener, Best, & McMichael, 2010). Research on LTSS indicates that people generally prefer home and community-based settings over moving into nursing homes (Guo, Konetzka, Magett, & Dale, 2015).
An Associated Press-NORC study identified several concerns people have about LTC, including fear of losing independence and fear of losing cognitive function (Tompson et al., 2013). Fifty-two percent of respondents in that study were concerned about losing independence; 51 percent were concerned about losing memory and other mental capabilities. When including those with at least a "moderate amount" of concern, the total proportion of respondents with these concerns was more than 70 percent. Less than half of respondents reported "quite a bit" or a "great deal" of concern for other issues, including being able to afford LTSS, having to transition into a nursing home, being a burden to family, being alone without family or friends, or leaving debts to family.
Although some studies have been done to understand concerns people have about needing LTSS, little research exists on people's willingness to take actions related to LTSS. Data from the 2012 National Health Interview Survey indicate that 73 percent of respondents expected to receive LTSS from their family. Less than 20 percent indicated that they would rely on a hired aide or a home health agency for LTSS, or that they would move into a nursing home or assisted living facility should they need LTSS (Henning-Smith & Shippee, 2015). In a study of Baby Boomers in Connecticut, respondents showed strong preference for LTSS actions that allowed them to remain in the home. Making home modifications and using home health care or homemaker services were the two most popular choices for what respondents were willing to do if they needed LTSS in older age. The majority (60-70 percent) of the sample was also willing to downsize and move into an apartment or condo, live in a retirement community, live in an assisted living facility, or live in a continuing care retirement community. Only 44 percent of respondents would live in senior housing and only 37 percent would move in with their adult child. Moving into a nursing home was the least popular of the living arrangements, with only 29 percent agreeing to this option (Finkelstein, Reid, Kleppinger, Pillemer, & Robison, 2012).
Home equity, defined as the difference between an individual's home value and what he or she owes on any mortgages, is a potential source of funding LTSS for some older adults (National Council on Aging, 2013). Although home equity is the major asset for most of the older population (Wiener, 2006), it is not commonly used as an LTSS financing option. Eighty percent of older people are homeowners (Stucki, 2014), and most older homeowners do not deplete their housing wealth before death (Davidoff, 2010). While more people are taking out reverse mortgage loans, most are not using this resource to finance health or disability services (Stucki, 2012). A 2006 AARP survey indicated that only 28 percent of people who sought counseling on reverse mortgages were doing so to cover health and disability expenses (Redfood, Scholen, & Brown, 2007). Further, because of certain risks and restrictions (lower equity among people with disabilities, caps on the amount of home equity that can be accessed, interest costs, etc.), homeowners and lenders alike are still hesitant to use home equity for financing LTSS (Wiener, 2006; Wiener, 2009).
Data and Methods
Data from this issue brief are from the 2014 Survey of Long-Term Care Awareness and Planning, which was sponsored by ASPE/HHS. The survey instrument was developed by RTI International in close cooperation with ASPE and with guidance from a Technical Expert Panel of experts on survey methodology, LTC, and LTC insurance.
The survey has two components. The first component asks questions on: (1) self-perceived longevity and the risk of needing LTC; (2) basic financial literacy and psychological characteristics such as risk tolerance; (3) LTC knowledge and LTC experience; (4) beliefs and concerns about LTC; (5) retirement and LTC planning; (6) LTC information gathering and decision making; (7) attitudes toward LTC financing options; and (8) core demographic and socioeconomic information. The second component of the survey is a discrete choice experiment, where respondents are asked to choose among LTC insurance products with different features. The survey underwent two rounds of cognitive testing and was revised based on results of the testing.
The survey was fielded by using KP, GfK's standing Internet panel.1 The survey sample consisted of non-institutionalized adults ages 40-70 residing in the United States. The survey was administered from August 8, 2014, to September 21, 2014. Survey respondents received e-mail notifications and reminders to fill out the survey, and were rewarded for their participation with 10,000 KP "points" (equivalent to about $10) that can be exchanged for merchandise and other prizes. Of the 24,878 people sampled, 15,298 consented and completed the main survey, yielding a response rate of 61.5 percent. Thirty cases were excluded because of respondent omission of more than one-third of the substantive survey questions. GfK used data from the 2013 March supplement of the Current Population Survey for weighting. Respondents were weighted to match the 40-70 year old United States population on the dimensions of gender, age, race/ethnicity, census region by metropolitan status, education, and household income.
Findings
Concerns About Becoming Disabled
As part of an effort to understand what motivates people aged 40-70 to think about what they would do should they develop functional or cognitive disabilities, the survey asked respondents what they worry about when they think of the possibility of needing LTSS. In particular, the survey asked respondents "If you become disabled and need LTC, how concerned are you about" each of seven concerns (losing independence, being a burden on family, losing control and choice over the type of LTC you might need, being unable to afford high-quality care, using up savings or income to pay for nursing home care or LTC services, becoming poor and having to rely on Medicaid, and being unable to depend on family or friends for care).
Such concerns were very common among respondents. At least 65 percent of respondents expressed feeling "very"/"somewhat" concerned about each individual issue (Figure 1). The top concern, "losing independence," was shared by almost all respondents (90.6 percent), followed by "being a burden to your family" (83.5 percent), and "losing control and choice over LTC you might need" (83.3 percent). Being unable to depend on family or friends for care was the least of the seven concerns, although almost two-thirds of respondents (65.3 percent) still reported worrying about this possibility.
Almost all survey respondents (95 percent) had at least one of the seven concerns and most people reported multiple concerns about needing LTC. A large majority of respondents (79.4 percent) had between five and seven concerns, with only 15.9 percent reporting between one and four concerns and only 4.7 percent reporting that they did not worry about needing LTSS (Figure 2). There was little difference across the number of concerns people had by age group, although a somewhat higher proportion of those who reported not worrying about LTSS needs were under 65 years compared to those with one or more concerns (descriptive data not shown). There was also little difference across number of concerns by gender, although females worried slightly more than males. Not surprisingly, a higher proportion of those who reported no concerns also had no chronic conditions. Three-quarters of those without chronic conditions (77.0 percent) who indicated that they do not worry about LTSS needs have no chronic conditions, compared to 68.4 percent with one to four concerns and 69.3 percent with five to seven concerns.
Patterns of concerns varied only slightly across household income (Table 1a) and savings and asset categories (Table 1b). Not surprisingly, respondents in the lowest income group demonstrated the least concern for the following: using up savings and income to pay nursing home care/service (69.3 percent) and becoming poor and having to rely on Medicaid (73.8 percent). The high-income group demonstrated the least concern about being unable to depend on family and friends for care (59.4 percent).
Also not surprisingly, people with no savings or assets were somewhat less concerned than those with assets over $100,000 about all of the concerns except two: being unable to afford high-quality care (80.4 percent vs. 78.7 percent) and being unable to rely on family/friends for care (69.4 percent vs. 60.0 percent). These results also suggest that respondents falling into the extreme categories (lowest income/savings or highest income/savings) were generally slightly less worried than those with moderate incomes or savings, perhaps because of the availability of Medicaid for people with lower incomes and assets and the ability to purchase services for people with higher income and assets.
Willingness to Take Long-Term Care Actions
Respondents were asked questions about how willing--"very," "somewhat," "not too," or "not at all"--they would be to take several actions should they become disabled and need LTSS. For all analyses of these responses, we report the proportion of respondents who indicated feeling "very"/"somewhat" willing to do each of the things asked.
Some actions required paying for services or having a third party pay for services (i.e., making modifications to their home, attending adult day care, hiring an aide or agency for home care, moving into an assisted living facility, hiring a live-in caregiver, using the value of the home to pay for home modifications or LTSS, and moving into a nursing home). Other actions involved informal caregiving (i.e., relying on a family member or friend for care, having family or friend move in, and moving in with children, family member, or friend). The highest proportions of respondents were "very"/"somewhat" willing to make modifications to their homes (82.3 percent), rely on a spouse, family member, or friend for care (75.0 percent), and have a family member or friend move in (69.7 percent) (Figure 3). Fewer than half of respondents were willing to move in with children, family members, or a friend (48.5 percent), or (for homeowners) use the value of their home to pay for LTSS (43.6 percent). Not surprisingly, moving into a nursing home was the least favored choice. Just over a quarter of respondents (28.6 percent) indicated that they would be willing to move into a nursing home if they became disabled.
We also examined actions people were willing to take by income and assets. There was little overall variation by income, with a few notable differences (Table 2a). Across income categories, those with the highest incomes (more than $100,000) tended to be most willing to do things that require financial resources. A higher proportion of respondents in this income group were willing to attend adult day care, hire an aide or a person from an agency to help with personal care, and hire a live-in caregiver than those with lower incomes. They were also more willing to move into an assisted living facility or nursing home, and make modifications to their home if they need LTSS. Those with higher incomes were also more willing to rely on family members and friends. Those with the lowest incomes (i.e., less than $15,000) were, in most cases, least willing to take most of the actions the survey asked about, including impose on family by having them move in or by relying on them for care. Fewer than half of respondents in all income categories were willing to use home equity to finance LTC, and those in the $15,000–$40,000 income category were less inclined than the other income groups to finance LTSS using this method (39.5 percent).
Willingness to take LTSS-related actions was similar across categories of household savings and assets2 and similar to those described above, again with a few differences (Table 2b). Those with moderate savings and assets (i.e., less than $100,000) were most likely to be willing to have family or friends move in. Interestingly, those with no assets were least willing to burden their families or friends by relying on them to provide LTSS. Homeowners with no assets other than their home were less likely to be willing to use home equity to finance LTSS than those with assets. About a third of respondents (32.7 percent) with no assets were willing to use home equity compared to 46.9 percent of those with $100,000 or more in assets.
Home Equity as a Long-Term Care Financing Resource
For most people, home equity is their primary asset and might be a source of funding for LTSS. Overall, fewer than half of homeowners (43.6 percent) reported that they were willing--"very"/"somewhat"--to use the value in their homes to finance LTSS, with little difference by age group (Table 3). About two-fifths of homeowners under 65 and 65 or older (44.2 percent and 40.7 percent, respectively) were willing to use the value in their home to pay for LTSS. Half of homeowners without children (50.3 percent), about one in five of those with no children living within a 10-mile radius or children living within a 10-mile radius (41.3 percent and 41.9 percent, respectively), were willing to use home equity to finance LTSS. Males (44.8 percent), those who were unmarried (47.7 percent), and non-Whites (46.1 percent) were more likely than females (42.5 percent), those who were married (42.1 percent), and those who were White (42.8 percent) to be willing to access the value in their homes to pay for LTSS. Willingness to use home equity for LTSS did not vary much by income, but did vary by assets. People with fewer assets were less willing to use home equity to pay for LTSS. Only 32.7 percent of people with no assets were willing to use their home equity for LTSS compared to 46.9 percent of people with more than $100,000 in assets. This likely reflects the fact that the no-asset group had fewer alternative sources of funds should they need them.
The average home value, amount owed, and amount of home equity did not vary greatly between homeowners who were willing to use their home equity to pay for LTSS and those who were not. The average primary home value of individuals aged 40-70 years who said they were very or somewhat willing to use home equity to pay for LTSS was $266,889, compared to a home value of $237,517 for those unwilling to use the equity in their home to finance LTSS. The average amount the willing group owed on their primary home was $134,540, slightly higher than the $119,821 owed by those not too willing or not at all willing to use home equity in this way. Thus, homeowners in this study who said they were willing to use the value in their homes for LTSS had, on average, approximately $132,349 worth of home equity, somewhat more than the 56.4 percent of respondents unwilling to finance LTSS using the equity in their homes (averaging $117,696).
Conclusion
Understanding the concerns people have about LTSS and the things they are willing to do to address their LTSS needs if it becomes necessary is important in finding ways to encourage the public to think about their future LTSS needs. Similar to findings in other studies, these survey respondents' top concerns centered on losing independence. Almost all respondents (90.6 percent) had this fear; in addition, the vast majority (83.5 percent) were concerned about being a burden to family, and not having a choice about LTSS (83.3 percent). Moreover, almost all respondents (95.3 percent) had multiple concerns about what would happen to them if they develop functional or cognitive disabilities and need LTSS. Although there were differences by sociodemographic characteristics, these differences were small. Females worried slightly more than males and those who indicated they did not worry were in good health.
Results also suggest that respondents whose income, savings, and assets were on either the low end or the high end of the spectrum were generally less worried. Those with low income and no assets may be less concerned about becoming poor as a result of needing LTSS because they are already poor. Those with higher income and assets may feel they have the ability to pay or may not fully understand the cost of LTSS. Respondents with higher income and assets indicated that they were more willing to use LTSS (i.e., attend adult day care, hire an aide to help with personal care, and hire a live-in caregiver than those with lower incomes). They were also more willing to move into an assisted living facility or nursing home, and to make modifications to their home if they need LTSS. Interestingly, they were also more willing to impose on family and friends than those with lower incomes, although the difference was not as great.
Findings show that a majority of respondents were willing to make modifications to their homes but had a limited willingness to use home equity to finance their LTSS needs. Fewer than half of homeowners in this study, across all income categories, expressed willingness to use home equity to pay for their LTSS and those in the middle income groups were somewhat less willing than the other income groups to finance LTSS using this method (39.5 percent and 32.7 percent, respectively). These views may reflect the important role that homes have in American culture, as well as a desire to leave an inheritance for their families or to preserve their major asset for some other adverse event.
The data presented in this issue brief point to the need for individuals to think seriously about and plan for their future LTSS needs. Moreover, the data offer some insights to the willingness and resistance of homeowners to use home equity as a means to pay for LTSS.
References
Davidoff, T. (2010). Home equity commitment and long-term care insurance demand. Journal of Public Economics, 94(1-2), 44-49.
Eiken, S., Sredl, K., Gold, L., Kasten, J., Burwell, B., & Saucier, P. (2014). Medicaid Expenditures for Long-Term Services and Supports in FFY 2012. Report prepared for Truven Health Analytics, Centers for Medicare and Medicaid Services. Washington, DC.
Feinberg, L., Reinhard, S.C., Houser, A., & Choula, R. (2011).Valuing the Invaluable: 2011 Update: The Growing Contributions and Costs of Family Caregiving. Report prepared for AARP Public Policy Institute. Washington, DC.
Finkelstein, E.S., Reid, M.C., Kleppinger, A., Pillemer, K., & Robison, J. (2012). Are baby boomers who care for their older parents planning for their own future long-term care needs? Journal of Aging & Social Policy, 24(1), 29-45.
Genworth Financial. (2014). Genworth 2014 Cost of Care Survey Home Care Providers, Adult Day Health Care Facilities, Assisted Living Facilities and Nursing Homes. Report prepared for Genworth Financial. Richmond, VA.
Guo, J., Konetzka, R.T., Magett, E., & Dale, W. (2015). Quantifying long-term care preferences. Medical Decision Making, 35(1), 106-113.
Henning-Smith, C.E., & Shippee, T.P. (2015). Expectations about future use of long-term services and supports vary by current living arrangement. Health Affairs, 34(1), 39-47.
Kaiser Family Foundation. (2007). Thepublic's views on long-term care. Kaiser Public Opinion Spotlight. Washington, DC: The Kaiser Family Foundation.
Khatutsky, G., Wiener, J., Best, H., & McMichael, J. (2010). Assessing Long-Term Care Policy Options in Hawaii: Results from the Hawaii Long-Term Care Survey. Washington, DC: RTI International.
Levinson, D.R. (2014). Adverse Events in Skilled Nursing Facilities: National Incidence Among Medicare Beneficiaries. Report prepared for U.S. Department of Health and Human Services, Office of Inspector General. Washington, DC.
LifePlans, Inc. (2007). Who Buys Long-Term Care Insurance? A 15-year Study of Buyers and Non-buyers, 1990-2005. Washington, DC: America's Health Insurance Plans. Retrieved from http://www.ahip.org/content/default.aspx?bc=39|341|328|21022.
National Council on Aging. (2013). Use Your Home to Stay at Home. Retrieved from http://www.ncoa.org/news-ncoa-publications/publications/ncoa_reverse_mo….
Redfood, D., Scholen, K., & Brown, S.K. (2007). Reverse Mortgages: Niche Product or Mainstream Solution? Report prepared for AARP Public Policy Institute. Washington, DC.
Stucki, B.R. (2012). Changing Attitudes, Changing Motives: The MetLife Study of How Aging Homeowners Use Reverse Mortgages. Report prepared for MetLife Mature Market Institute, National Council on Aging. New York, NY.
Stucki, B.R. (2014). Home Equity: A Strategic Resource for Long-Term Services and Supports. Paper presented at the Society of Actuaries 2014 Annual Meeting.
Tompson, T., Benz, J., Agiesta, J., Junius, D., Nguyen, K., & Lowell, K. (2013). Long-Term Care: Perceptions, Experiences, and Attitudes among Americans 40 or Older. Report prepared for Associated Press-NORC Center for Public Affairs Research. Chicago, IL.
Wiener, J.M. (2006). You Can Run, but You Can't Hide: Long-Term Care for Older People and Younger Persons with Disabilities. Paper presented at the House Committee on Energy and Commerce Hearing on "Planning for Long-Term Care." Washington, DC.
Wiener, J.M. (2009). Long-Term Care: Options in an Era of Health Reform. Report prepared for the SCAN Foundation. Washington, DC.
Wiener, J.M., Anderson, W.L., Khatutsky, G., Kaganova, Y.M., & O'Keeffe, J. (2013). Medicaid Spend Down: New Estimates and Implications for Long-term Services and Supports Financing Reform. Long Beach, CA: SCAN Foundation. Retrieved February 25, 2015, from http://www.thescanfoundation.org/sites/thescanfoundation.org/files/rti_medicaid-spend-down_3-20-13_1.pdf.
| FIGURE 1. Concerns About LTSS |
|---|
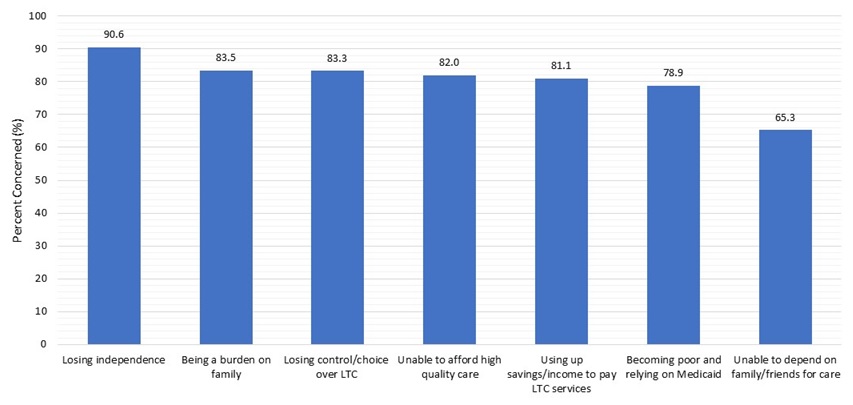 |
| SOURCE: RTI analysis of the 2014 ASPE Survey of Long-Term Care Awareness and Planning. NOTE: The percentages shown are the shares of respondents who felt "very"/"somewhat" concerned about the particular issue. |
| FIGURE 2. Number of LTC Concern |
|---|
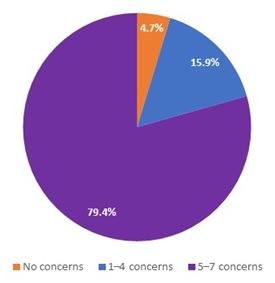 |
| SOURCE: RTI analysis of the 2014 ASPE Survey of Long-Term Care Awareness and Planning. |
| FIGURE 3. Willingness to Take Specific Actions in the Event of a Disability |
|---|
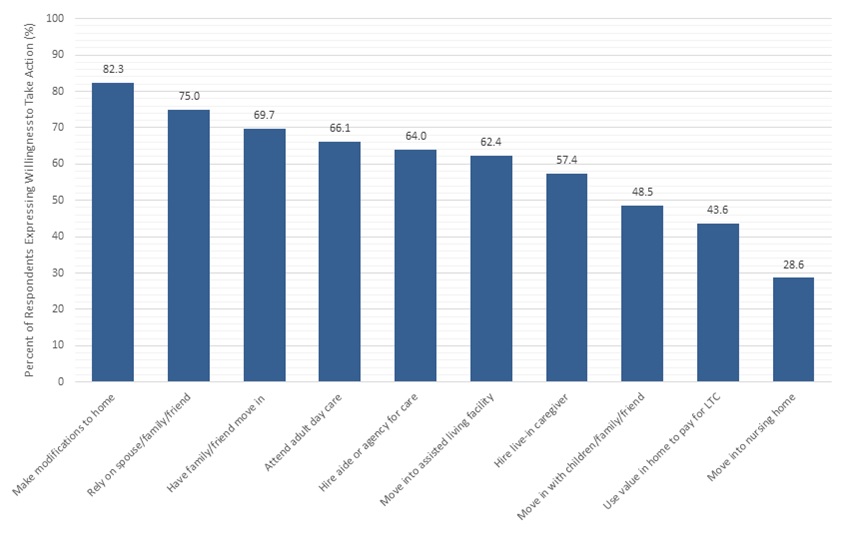 |
| SOURCE: RTI analysis of the 2014 ASPE Survey of Long-Term Care Awareness and Planning. |
| TABLE 1a. Concerns About LTC, by Household Income | |||||
|---|---|---|---|---|---|
| Respondents Who are Very Concerned/ Somewhat Concerned About: | Less Than $15,000 N=1,336 % | $15,000-$40,000 N=3,275 % | $40,000-$100,000 N=7,174 % | More Than $100,000 N=3,513 % | Sign. |
| Losing independence | 85.6 | 89.5 | 91.8 | 90.9 | *** |
| Being a burden on your family | 79.5 | 82.7 | 84.6 | 83.7 | *** |
| Losing control and choice over LTC you might need | 82.3 | 83.6 | 84.4 | 81.4 | *** |
| Being unable to afford high-quality care | 81.0 | 84.8 | 83.7 | 76.8 | *** |
| Using up savings/income to pay nursing home care/services | 69.3 | 80.6 | 83.4 | 81.6 | *** |
| Becoming poor and having to rely on Medicaid | 73.8 | 80.9 | 81.0 | 75.3 | *** |
| Being unable to depend on family/friends for care | 69.3 | 70.8 | 65.2 | 59.4 | *** |
| SOURCE: RTI analysis of the 2014 Survey of Long-Term Care Awareness and Planning. NOTES: Statistical significance: *** = p 0.001. Percentages are shares of respondents who felt "very"/"somewhat" concerned about the particular issue. | |||||
| TABLE 1b. Concerns About LTC, by Household Savings and Assets | ||||
|---|---|---|---|---|
| Respondents Who are Very Concerned/Somewhat Concerned About: | No Assets N=2,188 % | Less Than $100,000 N=5,425 % | Greater Than or Equal to $100,000 N=7,325 % | Sign. |
| Losing independence | 85.1 | 91.9 | 91.7 | *** |
| Being a burden on your family | 79.0 | 85.9 | 83.4 | *** |
| Losing control and choice over LTC you might need | 81.2 | 86.3 | 81.7 | *** |
| Being unable to afford high-quality care | 80.4 | 86.5 | 78.7 | *** |
| Using up savings/income to pay nursing home care/services | 69.5 | 84.9 | 82.6 | *** |
| Becoming poor and having to rely on Medicaid | 72.9 | 84.4 | 76.6 | *** |
| Being unable to depend on family/friends for care | 69.4 | 69.4 | 60.0 | *** |
| SOURCE: RTI analysis of the 2014 Survey of Long-Term Care Awareness and Planning. NOTES: Statistical significance: *** = p 0.001. Percentages are shares of respondents who felt "very"/"somewhat" concerned about the particular issue. | ||||
| TABLE 2a. Willingness to Take Specific Actions in the Event of a Disability, by Household Income | |||||
|---|---|---|---|---|---|
| Respondents Very Willing/Somewhat Willing To: | Less Than $15,000 N=1,336 % | $15,000-$40,000 N=3,275 % | $40,000-$100,000 N=7,174 % | More Than $100,000 N=3,513 % | Sign. |
| Have family/friend move in | 66.4 | 70.1 | 70.9 | 68.5 | ** |
| Move in with children/family/friend | 51.1 | 49.2 | 48.5 | 47.1 | ns |
| Rely on spouse/family/friend | 63.2 | 70.7 | 77.5 | 78.5 | *** |
| Attend adult day care | 59.3 | 63.3 | 66.2 | 70.7 | *** |
| Hire aide or agency for care | 54.2 | 55.4 | 64.6 | 73.6 | *** |
| Hire live-in caregiver | 47.1 | 47.0 | 58.1 | 68.4 | *** |
| Move into assisted living facility | 50.7 | 56.9 | 63.4 | 69.2 | *** |
| Move into nursing home | 26.1 | 24.5 | 28.6 | 32.9 | *** |
| Make modifications to home | 72.0 | 77.7 | 84.7 | 85.6 | *** |
| Use value in home to pay for LTC1 | 42.1 | 39.5 | 42.8 | 47.2 | *** |
| SOURCE: RTI analysis of the 2014 Survey of Long-Term Care Awareness and Planning. NOTES: Statistical significance: ns = p > 0.05; ** = p 0.01; *** = p 0.001.
| |||||
| TABLE 2b. Willingness to Take Specific Actions in the Event of a Disability, by Household Savings and Assets | ||||
|---|---|---|---|---|
| Respondents Very Willing/Somewhat Willing To: | No Assets N=2,188 % | Less Than $100,000 N=5,425 % | Greater Than or Equal to $100,000 N=7,325 % | Sign. |
| Have family/friend move in | 68.0 | 72.8 | 68.0 | *** |
| Move in with children/family/friend | 52.0 | 52.1 | 44.2 | *** |
| Rely on spouse/family/friend | 67.5 | 76.7 | 76.7 | *** |
| Attend adult day care | 56.6 | 65.1 | 71.1 | *** |
| Hire aide or agency for care | 50.4 | 60.4 | 73.4 | *** |
| Hire live-in caregiver | 44.3 | 54.4 | 65.9 | *** |
| Move into assisted living facility | 49.6 | 59.8 | 70.6 | *** |
| Move into nursing home | 24.2 | 27.4 | 31.8 | *** |
| Make modifications to home | 72.4 | 81.7 | 87.0 | *** |
| Use value in home to pay for LTC1 | 32.7 | 42.1 | 46.9 | *** |
| SOURCE: RTI analysis of the 2014 Survey of Long-Term Care Awareness and Planning. NOTES: Statistical significance: *** = p 0.001.
| ||||
| TABLE 3. Homeowner's Willingness to Use Home Equity for LTC Financing | ||
|---|---|---|
| Respondent Characteristics | Willingness to Use Home Equity for LTC Financing Very Willing/Somewhat Willing N=5,391 % | Willingness in Use Home Equity for LTC Financing Not Too Willing/Not At All Willing N=6,719 % |
| Age | ||
| Under 65 | 44.2** | 55.8 |
| Over 65 | 40.7 | 59.3 |
| Children | ||
| No children | 50.3*** | 49.7 |
| No children living within 10 miles | 41.3 | 58.7 |
| Children living within 10 miles | 41.9 | 58.1 |
| Gender | ||
| Male | 44.8* | 55.2 |
| Female | 42.5 | 57.5 |
| Marital Status | ||
| Married | 42.1*** | 57.9 |
| Unmarried | 47.7 | 52.3 |
| Race | ||
| White | 42.8** | 57.2 |
| Non-White | 46.1 | 53.9 |
| Household Income | ||
| Less than $15,000 | 42.1*** | 57.9 |
| $15,000-$40,000 | 39.5 | 60.5 |
| $40,000-$100,000 | 42.8 | 57.2 |
| More than $100,000 | 47.2 | 52.8 |
| Household Savings and Assets | ||
| No assets | 32.7*** | 67.3 |
| Less than $100,000 | 42.1 | 57.9 |
| Greater than or equal to $100,000 | 46.9 | 53.1 |
| Home Value | ||
| Average value of primary residence | $266,889*** | $237,517 |
| Average amount owed on home mortgage | $134,540*** | $119,821 |
| Total | 43.6 | 56.4 |
| SOURCE: RTI analysis of the 2014 Survey of Long-Term Care Awareness and Planning. NOTES: Statistical significance: * = p 0.05; ** = p 0.01; *** = p 0.001. | ||
NOTES
-
Documentation regarding KP sampling, data collection procedures, weighting, and Institutional Review Board-bearing issues are available at the following online resources: http://www.knowledgenetworks.com/ganp/reviewer-info.html; http://www.knowledgenetworks.com/knpanel/index.html; and http://www.knowledgenetworks.com/ganp/irbsupport/.
-
Savings and assets include certificate of deposits, stocks, bonds, mutual funds, cash, savings, Individual Retirement Accounts, employer-sponsored retirement plans, and all other liquid assets.
Survey on Long-Term Care Awareness and Planning
This report was prepared for U.S. Department of Health and Human Services (HHS), Office of Disability, Aging and Long-Term Care Policy (DALTCP) under contract #HHSP233201000693G with Knowledge Networks and contract #HHSP23320100021WI with the Research Triangle Institute. For additional information about this subject, you can visit the DALTCP home page at http://aspe.hhs.gov/office-disability-aging-and-long-term-care-policy-daltcp or contact the ASPE Project Officers, Samuel Shipley and William Marton, at HHS/ASPE/DALTCP, Room 424E, H.H. Humphrey Building, 200 Independence Avenue, S.W., Washington, D.C. 20201; William.Marton@hhs.gov.
Reports Available
Choosing Long-Term Care Insurance Policies: What Do People Want? Issue Brief
- HTML: https://aspe.hhs.gov/basic-report/choosing-long-term-care-insurance-policies-what-do-people-want
- PDF: https://aspe.hhs.gov/pdf-report/choosing-long-term-care-insurance-policies-what-do-people-want
Long-Term Services and Supports: What are the Concerns and What are People Willing to Do? Issue Brief
- HTML: https://aspe.hhs.gov/basic-report/long-term-services-and-supports-what-are-concerns-and-what-are-people-willing-do
- PDF: https://aspe.hhs.gov/pdf-report/long-term-services-and-supports-what-are-concerns-and-what-are-people-willing-do
What Do People Know About Long-Term Services and Supports? Issue Brief
- HTML: https://aspe.hhs.gov/basic-report/what-do-people-know-about-long-term-services-and-supports
- PDF: https://aspe.hhs.gov/pdf-report/what-do-people-know-about-long-term-services-and-supports
Which Way for Long-Term Services and Supports Financing Reform? Issue Brief