
This ASPE Research Brief examines the private and public health insurance coverage of children eligible for child support services. The generally low-incomes and unique family structures of children in the child support system may create numerous challenges in obtaining private health insurance coverage. This brief provides estimates of the extent to which uninsured children in the child support system may be eligible for Medicaid and CHIP coverage.
This brief was written by Stacey McMorrow, Genevieve Kenney, Allison Cook, and Christine Coyer of the Urban Institute under contract to ASPE.
"Introduction
In 2008, an estimated 26 million American children 18 and under had at least one parent living outside the household.[1] Children in such situations are potentially eligible to receive child support from the parent living elsewhere.[2] Almost 70 percent of these child support (CS) eligible children live in low-income families with incomes less than 200 percent of the federal poverty level (FPL) and an additional 21 percent have incomes between 200 and 399 percent of the FPL.[3] As a result of their generally low incomes and unique family structures, these children represent a particularly vulnerable population that may face numerous challenges in obtaining private health insurance coverage. Many of these children are likely to be eligible for Medicaid or the Children’s Health Insurance Program (CHIP), however.
The most recent estimates of health insurance coverage and Medicaid/CHIP eligibility for the child support eligible population come from the Urban Institute’s 1999 National Survey of America’s Families (NSAF). In 1999, 14.5 percent of CS eligible children living with their mothers were found to be uninsured. The uninsurance rate was 18 percent for those with incomes under 200 percent of the FPL. The same data indicate that 72.9 percent of all CS eligible children were eligible for Medicaid or CHIP and, of those that were uninsured, 81.3 percent were Medicaid or CHIP eligible.[4],[5] While these statistics are now outdated, they do suggest that Medicaid and CHIP could play an important role in extending coverage to uninsured CS eligible children.
Over the past decade, state child support enforcement (CSE) agencies have been increasingly focused on improving the functioning of medical support and encouraging better collaboration with Medicaid. The passage of CHIPRA in February 2009 also placed a strong emphasis on enrolling and retaining all uninsured children who are eligible for Medicaid or CHIP.[6] Along with the impending implementation of national health reforms, these developments have sparked a renewed interest in the current health insurance landscape for child support eligible children and the need for updated estimates of public program eligibility and health insurance coverage for this population. This brief focuses on identifying the coverage patterns of CS eligible children, with a special emphasis on the uninsured, and their eligibility for Medicaid/CHIP.
Data and Methods
The main source of data for the analysis is the 2009 Annual Social and Economic Supplement (ASEC) to the Current Population Survey (CPS), representing income and health insurance coverage for 2008. Because individuals may report multiple types of health insurance coverage on the CPS, we assign one type of coverage to each child based on the following hierarchy: Medicaid/CHIP, employer sponsored insurance coverage (ESI) from inside the household, any coverage from outside the household, other federal coverage (including Tricare, VA and Medicare) and directly purchased coverage from inside the household.[7],[8] The remaining individuals are categorized as uninsured. While the CPS includes questions on both Medicaid and CHIP coverage, it is not possible to reliably distinguish between these types of coverage and thus we only present aggregate estimates that combine Medicaid and CHIP.[9] As indicated above, we provide additional detail on those who report receiving coverage from outside the household.[10] Estimates of insurance coverage reflect adjustments to account for the underreporting of Medicaid and CHIP on the CPS using a methodology developed for previous analyses.[11] The adjustments have the effect of reducing the number of uninsured child support eligible children by 0.4 million and the number with private or other public coverage by 0.8 million, while increasing the number with Medicaid/CHIP coverage by 1.2 million.
In this analysis, we interpret the CPS uninsurance estimates as point-in-time, (i.e. average monthly) estimates. A point-in-time estimate of uninsurance, for instance, will be greater than an estimate of full year uninsurance, but less than an estimate of any uninsurance over the course of a year. While the CPS is worded with the intention of capturing full year uninsurance estimates, the results have generally been considered to be more closely in line with point-in-time estimates.[12] However, CPS estimates of individuals who report multiple types of coverage are much higher than point-in-time estimates and likely reflect coverage held at different points during the year for some respondents.[13] We therefore do not present estimates of dual coverage in our main estimates, but include such estimates in Appendix Table 2.
For this analysis, the child support eligible universe is defined as children 0-18 residing with one biological parent and one step parent or one biological parent only.[14] In addition, children under 15 living with no biological or adoptive parents are included in the eligible population.[15] Estimates of income as a percent of poverty reflect the income of the health insurance unit (HIU) and reflect U.S. Census Bureau poverty thresholds.[16] HIUs are derived from information available on household structure from the CPS, and are used as the family unit of analysis because they more closely align with the family groupings used by states when determining Medicaid/CHIP eligibility than Census households or families.[17] Estimates of family composition reflect Census family groupings and identify families with one parent, two parents, or multiple generations (e.g. grandparents, parents, children) residing together.[18] Other living arrangements that do not conform to these categories are also identified. These may include children living with other relatives or foster children. Because the CPS is a household survey, CS eligible children cannot be linked to the noncustodial parent (NCP) who does not live in the household. Therefore, no information on income or insurance coverage for the NCP is available. However, child support payments made by the NCP are on the custodial parent's CPS record and any insurance coverage from outside the household is noted for each individual on the CPS. For CS eligible children, this is very likely to be coverage provided by the NCP.
Estimates of Medicaid/CHIP eligibility are based on the Urban Institute’s Health Policy eligibility simulation model.[19] The model simulates eligibility for Medicaid and CHIP using information on 2008 eligibility guidelines for each program and state, including the amount and extent of disregards.[20] These guidelines are applied to person and family level data from the CPS to simulate the eligibility determination process.[21] Because the CPS does not collect information on monthly income, it is not possible to determine how eligibility status changes as a result of income fluctuations throughout the year. Family-level characteristics used in determining eligibility, such as income, are based on the HIU. A discussion of the use of the ASEC rather than the CPS Child Support Supplement (CSS) is provided in the appendix.
Results
Health insurance coverage of child support eligible children
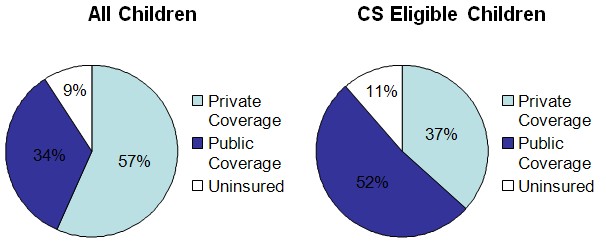
Exhibit 1 shows the health insurance distribution for all children and for CS eligible children in 2008. Nearly 60 percent of all children have private coverage compared to 37 percent of CS eligible children. Just over half of CS eligible children have public coverage however, resulting in an uninsurance rate of 11 percent for CS eligible children compared to 9 percent for all children.
Exhibit 1:
Health Insurance Coverage of Children (0 - 18)
Source: Urban Institute analysis of the 2009 Annual Social and Economic (ASEC) Supplement to the Current Population Survey (CPS).
Note: CS eligible children are children 18 and under living with only one biological parent and children 14 and under living with no parents.
Additional details provided in text. Estimates of uninsured children have been adjusted by the
Urban Institute's Health Policy Center for the underreporting of public coverage on the CPS.
This adjustment has the impact of reducing the number of uninsured by approximately 1 million.
Children who report multiple types of coverage are assigned one type according to the following hierarchy:
Medicaid/CHIP, ESI within household, coverage from outside the household, other public and direct purchase within household.
Private coverage includes ESI, coverage outside the household, and direct purchase.
Public coverage includes Medicaid/CHIP and other public.
Exhibit 2 displays the health insurance coverage distribution of CS eligible children in more detail. Based on this analysis, approximately 51 percent of CS eligible children have Medicaid/CHIP coverage. An additional 31 percent of the CS eligible population has private coverage from someone in their household and 6 percent obtain insurance coverage from someone outside the household. A small proportion of children (1 percent) obtain coverage from other federal sources. The remaining 11 percent of CS eligible children are estimated to be uninsured. Supplementary estimates that reflect children reporting both Medicaid/CHIP and private coverage are found in Appendix Table 2.
| All Children | CS Eligibile Children | |
|---|---|---|
| Private coverage | 56% | 37% |
| Within household | 54% | 31% |
| Outside household | 2% | 6% |
| Medicaid/CHIP | 33% | 51% |
| Other federal | 1% | 1% |
| Uninsured | 9% | 11% |
| Source: Urban Institute analysis of the 2009 Annual Social and Economic (ASEC) Supplement to the Current Population Survey (CPS). Note: CS eligible children are children 18 and under living with only one biological parent and children 14 and under living with no parents. Additional details provided in text. Estimates of uninsured children have been adjusted by the Urban Institute's Health Policy Center for the underreporting of public coverage on the CPS. This adjustment has the impact of reducing the number of uninsured by approximately 1 million. Children who report multiple types of coverage are assigned one type according to the following hierarchy: Medicaid/CHIP, ESI within household, coverage from outside the household, other federal and direct purchase within household. Private coverage includes ESI, coverage from outside the household and direct purchase. |
||
Distribution of CS eligible children by income and family type
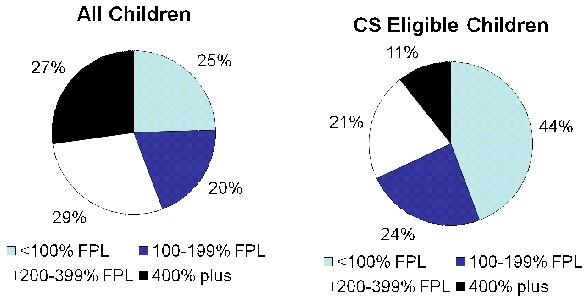
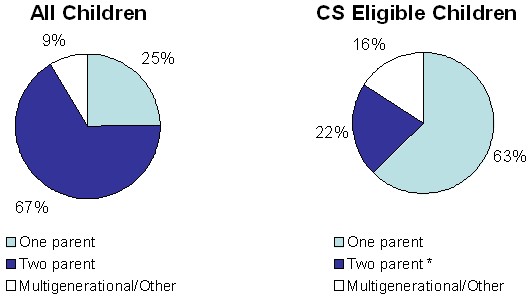
As the high rates of Medicaid/CHIP coverage suggest, the CS eligible population is also a low-income population. As shown in Exhibit 3, nearly 70 percent of all CS eligible children live in families with incomes below 200 percent of the FPL. This compares to 45 percent of all children. Exhibit 4 shows the living arrangements of CS eligible children compared to all children. Predictably, most CS eligible children (63 percent) live in one-parent families, but 22 percent live in two-parent families and 16 percent live in multi-generational or other family arrangements.[22]
Exhibit 3
Income Distribution of Children (0 - 18)
Source: Urban Institute analysis of the 2009 Annual Social and Economic (ASEC) Supplement to the Current Population Survey (CPS).
Note: CS eligible children are children 18 and under living with only one biological parent and children 14 and under with no parents.
Additional details in text. Income relative to the federal poverty level (FPL) reflects the income of the health insurance unit (HIU)
and 2008 U.S. Census Bureau poverty thresholds.
Exhibit 4
Family Type Distribution of Children (0-18)
Source: Urban Institute analysis of the 2009 Annual Social and Economic (ASEC) Supplement to the Current Population Survey (CPS).
Note: CS eligible children 18 and under living with only one biological parent and children 14 and under living with no parents. Additional details in text.
Family type reflects the Census definition of family. Census family groupings differ from HIUs because they can include family members
who are not part of the nuclear family unit (e.g. grandparents).
* CS eligible children in two-parent families are those living with one biological parent and one step-parent.
Uninsurance rate of CS eligible children
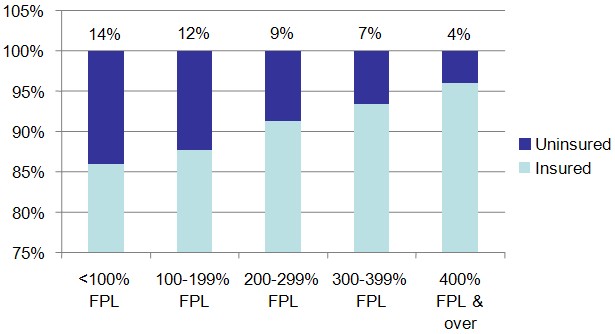
As shown in Exhibit 1, 11 percent of CS eligible children are uninsured. The uninsurance rate varies by income, however, as shown in Exhibit 5. Those with incomes below 100 percent of the FPL have the highest uninsurance rate (14 percent) while those with the highest incomes have a much lower rate of uninsurance (4 percent). Exhibit 6 shows the uninsurance rate by family composition. Children from one-parent and two-parent families have similar uninsurance rates of approximately 10 percent each, but those living in multigenerational or other family arrangements have uninsurance rates of 20 percent. Other family arrangements include children living with other relatives and foster children.
Exhibit 5
Uninsurance Rate of CS Eligible Children (0-18) by Income
Source: Urban Institute analysis of the 2009 Annual Social and Economic (ASEC) Supplement to the Current Population Survey (CPS).
Note: CS eligible children are children 18 and under living with only one biological parent and children 14 and under living with no parents. Additional details provided in text. Estimates of uninsured children have been adjusted by the Urban Institute's Health Policy Center for the underreporting of public coverage on the CPS. This adjustment has the impact of reducing the number of uninsured by approximately 1 million. Children who report multiple types of coverage are assigned one type according to the following hierarchy: Medicaid/CHIP, ESI within household, coverage from outside the household, other public and direct purchase within household. Private coverage includes ESI, coverage outside the household, and direct purchase. Public coverage includes Medicaid/CHIP and other public.
Exhibit 6
Uninsurance Rate of CS Eligible Children (0-18) by Family Type
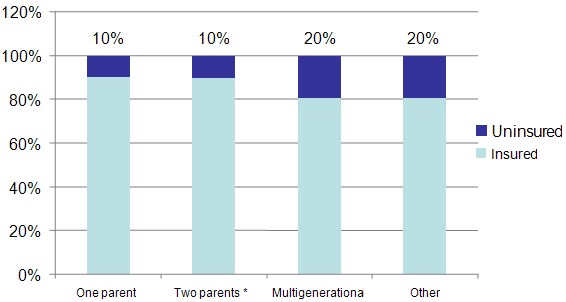
Source: Urban Institute analysis of the 2009 Annual Social and Economic (ASEC) Supplement to the Current Population Survey (CPS).
Note: CS eligible children are children 18 and under living with only one biological parent and children 14 and under living with no parents. Additional details in text.
Estimates of uninsured children have been adjusted by the Urban Institute's Health Policy Center for the underreporting of public coverage on the CPS. This adjustment has the impact of reducing the number of uninsured by approximately 1 million. Family type reflects the Census definition of family. Census family groupings differ from HIUs because they can include family members who are not part of the nuclear family unit (e.g. grandparents).
* CS eligible children in two parent families are those living with one biological parent and one step-parent.
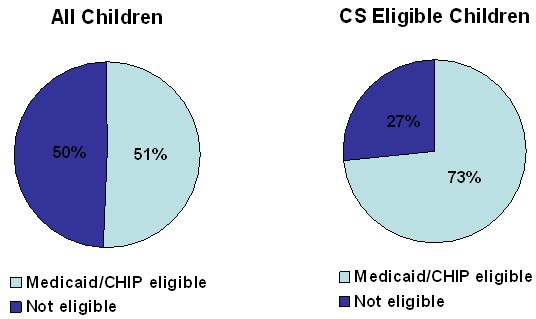
Medicaid/CHIP eligibility of CS eligible children
Exhibit 7 indicates that Medicaid/CHIP eligibility is quite high among CS eligible children, with over 70 percent eligible. This compares to 51 percent of all children. Eligibility is almost universal for those under 200 percent of the FPL, as shown in Exhibit 8.[23] Just over 40 percent of those with more moderate incomes (200-299 percent of the FPL) are also eligible and eligibility declines as expected with higher incomes.[24] With uninsurance rates hovering around 13 percent for those under 200 percent of the FPL (see Exhibit 5), these estimates suggest that Medicaid and CHIP could play significant roles in covering uninsured CS eligible children.
Exhibit 7
Medicaid/CHIP Eligibility of Children (0-18)
Source: Urban Institute Health Policy Center Eligibility Simulation Model, based on data from the
2009 Annual Social and Economic (ASEC) Supplement to the Current Population Survey (CPS).
Note: CS eligible children are children 18 and under living with only one biological parent and
children 14 and under living with no parents. Additional details in text.
Exhibit 8
Medicaid/CHIP Eligibility of Child Support Eligible Children (0-18), by Income
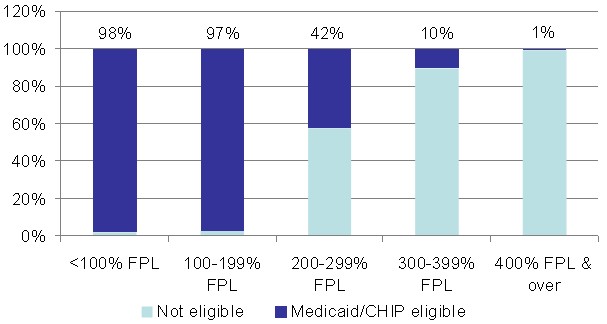
Source: Urban Institute Health Policy Center Eligibility Simulation Model, based on data from the
2009 Annual Social and Economic (ASEC) Supplement to the Current Population Survey (CPS).
Note: CS eligible children are children 18 and under living with only one biological parent and children 14 and under living with no parents.
Additional details in text. Income relative to the federal poverty level (FPL) reflects the income of the health insurance unit (HIU)
and 2008 U.S. Census Bureau poverty thresholds.
Uninsured child support eligible children and their Medicaid/CHIP eligibility
As shown in Exhibit 1, our estimates find that 11 percent of CS eligible children (a total of 2.9 million) were uninsured in 2008.[25],[26] Exhibit 9 displays our estimates of Medicaid/CHIP eligibility for uninsured children. Over two-thirds of all uninsured children are eligible for Medicaid/CHIP and our primary finding reveals that 79 percent of uninsured CS eligible children were eligible for Medicaid/CHIP under 2008 rules. Fully 2.3 million CS eligible children are uninsured despite being eligible for Medicaid/CHIP.[27] As was the case in the population as a whole, the lowest income uninsured children and those from multi-generational families are the most likely to be eligible for Medicaid/CHIP (see Appendix Table 6). These results strongly suggest that enrolling all currently Medicaid/CHIP eligible children in these programs would dramatically decrease the uninsurance rate among CS eligible children. In addition, enrolling this population would make substantial progress towards reducing the uninsurance rate for children more generally.
Exhibit 9
Medicaid/CHIP Eligibility of Uninsured Children (0-18)
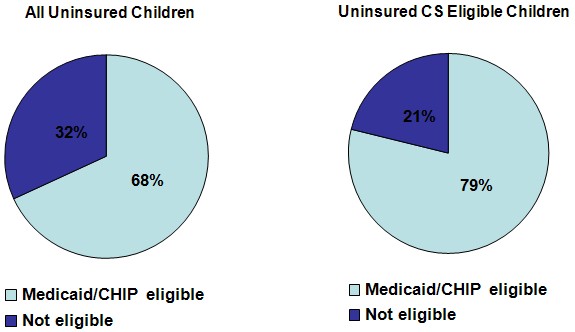
Source: Urban Institute Health Policy Center Eligibility Simulation Model, based on data from the
2009 Annual Social and Economic (ASEC) Supplement to the Current Population Survey (CPS).
Note: CS eligible children are children 18 and under living with only one biological parent and children 14 and under living with no parents.
Additional details provided in text. Estimates of uninsured children have been adjusted by the Urban Institute's Health Policy Center
for the underreporting of public coverage on the CPS. This adjustment has the impact of reducing the number of uninsured by approximately 1 million.
Child support eligible children among all uninsured children
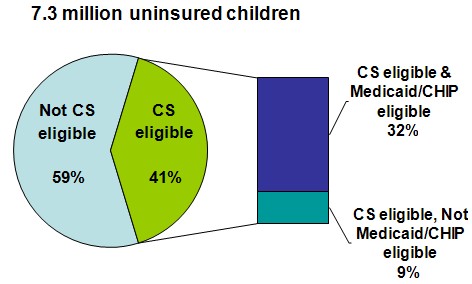
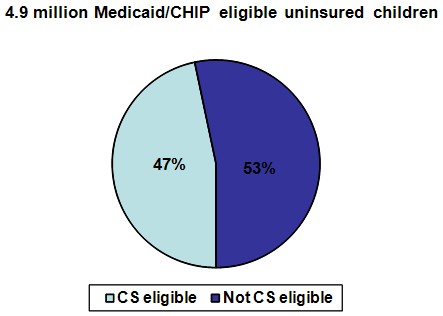
Exhibits 10 and 11 show the distribution of uninsured children by child support and Medicaid/CHIP eligibility. The CS eligible population represents approximately 40 percent of all uninsured children. Furthermore, almost one-third of all uninsured children are eligible for both child support and Medicaid/CHIP.[28] Exhibit 12 focuses on the population of Medicaid/CHIP eligible uninsured children. These children are the focus of the Secretary’s Challenge: Connecting Kids to Coverage that aims to enroll all uninsured children in the programs for which they are eligible.[29] Exhibit 12 shows that 47 percent of this population is CS eligible.[30]
| Child Support and Medicaid/CHIP Eligible | Percent |
|---|---|
| Child Support Eligible | 41% |
| Medicaid/CHIP eligible | 32% |
| Not Medicaid/CHIP eligible | 9% |
| Not Child Support Eligible | 59% |
| Medicaid/CHIP eligible | 36% |
| Not Medicaid/CHIP eligible | 23% |
| Source: Urban Institute Health Policy Center Eligibility Simulation Model, based on data from the 2009 Annual Social and Economic (ASEC) Supplement to the Current Population Survey (CPS). Note: CS eligible children are children 18 and under living with only one biological parent and children 14 and under living with no parents. Additional details in text. Estimates of uninsured children have been adjusted by the Urban Institute's Health Policy Center for the underreporting of public coverage on the CPS. This adjustment has the impact of reducing the number of uninsured by approximately 1 million. Estimates of the proportion of children that are CS eligible reflect an overreporting of CS eligible children on the ASEC of up to 14 percent. |
|
Exhibit 11
Medicaid/CHIP and Child Support Eligibility of Uninsured Children (0-18)
Source: Urban Institute Health Policy Center Eligibility Simulation Model, based on data from the
2009 Annual Social and Economic (ASEC) Supplement to the Current Population Survey (CPS).
Note: CS eligible children are children 18 and under living with only one biological parent and children 14 and under living with no parents.
Additional details provided in text. Estimates of uninsured children have been adjusted by the Urban Institute's Health Policy Center
for the underreporting of public coverage on the CPS. This adjustment has the impact of reducing the number of uninsured by approximately 1 million.
Estimates of the proportion of children that are CS eligible reflect an overreporting of CS eligible children on the ASEC of up to 14 percent.
Exhibit 12
Child Support Eligible Children among Medicaid/CHIP Eligible Uninsured Children
Source: Urban Institute Health Policy Center Eligibility Simulation Model, based on data from the
2009 Annual Social and Economic (ASEC) Supplement to the Current Population Survey (CPS).
Note: CS eligible children are children 18 and under living with only one biological parent and children 14 and under living with no parents.
Additional details provided in text. Estimates of uninsured children have been adjusted by the Urban Institute's Health Policy Center
for the underreporting of public coverage on the CPS. This adjustment has the impact of reducing the number of uninsured by approximately 1 million.
Estimates of the proportion of children that are CS eligible reflect an overreporting of CS eligible children on the ASEC of up to 14 percent.
Conclusions
The CS eligible population has characteristics, including low incomes and non-traditional family structures, which make them particularly vulnerable to going without insurance coverage. This analysis finds that the majority of CS eligible children are eligible for public coverage through their state Medicaid or CHIP program, but that many of them are not enrolled. Furthermore, the economic downturn and eligibility expansions since 2008 have likely increased the share of children eligible for Medicaid and CHIP. Thus, for most uninsured child support eligible children, the pieces are already in place to provide them with comprehensive coverage through Medicaid or CHIP. Expanded efforts in enrolling eligible children could therefore have a major impact on reducing uninsurance for the child support population and in reducing the rate of uninsurance for all children.
Appendix
Child Support Eligible Children on the CPS Annual Social and Economic (ASEC) and Child Support (CSS) Supplements
The analysis described above uses the 2009 ASEC to provide estimates of health insurance coverage and Medicaid/CHIP eligibility for the CS eligible population in 2008. Every other year in April, the Census Bureau fields an additional supplement to the CPS in order to obtain information on custodial parents and their child support. The Census Bureau creates a data file covering households that are in sample for both the March and April supplements. Income, health insurance, and other data from the March ASEC are combined with the child support supplement data from the April supplement, producing the CPS Child Support Supplement (CPS-CSS) data file. While the CPS-CSS can be used to produce estimates of the uninsurance rate for CS eligible children, there are several elements that make the March ASEC supplement preferable for our purposes. Due to the CPS sample design, the CPS-CSS has less than half the sample size of the ASEC and the matched sample must be re-weighted to meet US population totals.[31] Using the ASEC alone avoids this loss of sample as well as any additional measurement error brought in by the re-weighting process. Furthermore, the Urban Institute’s Medicaid/CHIP eligibility simulation model has been designed for and tested on the ASEC. Adapting it to the CPS-CSS would require additional modifications and robustness checks. Finally, in the interest of producing more regular estimates for this population, the ASEC is fielded each year and the results are available each fall. The April supplement however is fielded every other year and the necessary merging and re-weighting further delays file availability.[32]
The main drawback to using the ASEC alone is a lack of detail necessary to precisely identify the child support eligible population. The estimates from the 2008 CPS-CSS, which includes a series of questions designed to more accurately define this population, find a total of 20.6 million CS eligible children. Using the 2008 ASEC alone, we estimate a total of 23.7 million CS eligible children. The discrepancy in the count of CS eligible children is likely due to our inability, using the ASEC, to exclude from the eligible population those children who live with only one of their parents, but who, for a variety of reasons, do not have another parent living outside the household. For example, approximately 2.5 million children have been excluded from the eligible population on the CPS-CSS because their non-custodial parent has died, terminated their parental rights, or is no longer considered a parent by the custodial parent. Such children cannot be identified and excluded on the ASEC. These children account for the bulk of the excess eligible population identified on the ASEC.[33]
In order to explore the possible bias resulting from our eligibility definition, we examined the income and coverage distribution on the ASEC versus that on the CPS-CSS. On the ASEC, 65 percent of CS eligible children are found to have incomes below 200 percent of the FPL and 11.9 percent are uninsured while on the CPS-CSS, 59 percent fall below the same income threshold and 12.3 percent are uninsured using a comparable coverage definition.[34] On the basis of these similar income and coverage estimates, we conclude that our estimates of the proportion of CS eligible that are uninsured or Medicaid/CHIP eligible are not severely biased due to our sample of CS eligible children.
Due to the extra CS eligible children identified on the ASEC, estimates that report the number of CS eligible children in a given population, as well as those that estimate the CS eligible population as a proportion of all uninsured children, will likely be inflated however. The CPS-CSS estimates 20.6 million CS eligible children, but excludes children living with neither of their biological parents from the CS eligible population. Such children are generally eligible for child support however and these children are included in the estimates from the ASEC. We include children under 15 who live without either of their parents and they account for 2.2 million CS eligible children. Adding these children to the 23.7 million children living with at least one biological parent, results in a grand total of 25.9 million CS eligible children on the ASEC.
If we add the 2.2 million children living without any parents to the CPS-CSS estimate of 20.6 million CS eligible children, this results in an estimate of 22.8 million CS eligible children on the CPS-CSS compared to 25.9 million on the ASEC. The ASEC estimates of the number of CS eligible children are therefore inflated by approximately 14 percent. For example, we estimate 2.9 million uninsured child support eligible children. The details above suggest that this number should probably be closer to 2.6 million. In the analysis above, we report the estimates from the ASEC, but include alternative estimates that reflect an adjustment for the overreporting of CS eligible children in the footnotes.
Appendix Tables
| All Children | CS Eligible Children | |||
|---|---|---|---|---|
| Frequency | Percent | Frequency | Percent | |
| Medicaid/CHIP | 25,927,612 | 33.0% | 13,231,024 | 50.9% |
| ESI within HH | 39,932,092 | 50.8% | 7,431,025 | 28.6% |
| Coverage outside HH | 1,882,507 | 2.4% | 1,518,440 | 5.8% |
| Other federal | 1,039,919 | 1.3% | 296,259 | 1.1% |
| Direct purchase within HH | 2,631,991 | 3.4% | 577,615 | 2.2% |
| Uninsured | 7,263,082 | 9.2% | 2,927,557 | 11.3% |
| Source: Urban Institute analysis of the 2009 Annual Social and Economic (ASEC) Supplement to the Current Population Survey (CPS). Note: CS eligible children are children 18 and under living with only one biological parent and children 14 and under living with no parents. Additional details provided in text. Estimates of uninsured children have been adjusted by the Urban Institute's Health Policy Center for the underreporting of public coverage on the CPS. This adjustment has the impact of reducing the number of uninsured by approximately 1 million. Children who report multiple types of coverage are assigned one type according to the following hierarchy: Medicaid/CHIP, ESI within household, coverage from outside the household, other federal and direct purchase within household. Private coverage includes ESI, coverage outside the household and direct purchase. Estimates of the proportion of children that are CS eligible reflect an overreporting of CS eligible children on the ASEC of up to 14 percent. |
||||
| All Children | CS Eligible Children | |||
|---|---|---|---|---|
| Frequency | Percent | Frequency | Percent | |
| Without dual coverage estimate | ||||
| Medicaid/CHIP | 23,397,762 | 29.7% | 12,031,766 | 46.3% |
| ESI within HH | 40,833,927 | 51.9% | 7,732,196 | 29.8% |
| Coverage outside HH | 1,951,329 | 2.5% | 1,532,196 | 6.1% |
| Other federal | 1,202,251 | 1.5% | 375,320 | 1.4% |
| Direct purchase within HH | 3,215,552 | 4.1% | 941,523 | 3.6% |
| Uninsured | 8,076,381 | 10.3% | 3,321,840 | 12.8% |
| With dual coverage estimate | ||||
| Medicaid/CHIP and private | 3,954,117 | 5.0% | 1,592,348 | 6.1% |
| Medicaid/CHIP, no private | 19,443,646 | 24.7% | 10,439,418 | 40.2% |
| ESI within HH | 40,833,927 | 51.9% | 7,739,196 | 29.8% |
| Coverage outside HH | 1,951,329 | 2.5% | 1,579,275 | 6.1% |
| Other federal | 1,202,251 | 1.5% | 375,320 | 1.4% |
| Direct purchase within HH | 3,215,552 | 4.1% | 941,523 | 3.6% |
| Uninsured | 8,076,381 | 10.3% | 3,321,840 | 12.8% |
| Source: Urban Institue analysis of the 2009 Annual Social and Economic (ASEC) Supplement to the Current Population Survey (CPS). Note: CS eligible children are children 18 and under living with only one biological parent and children 14 and under living with no parents. Additional details provided in text. Estimates of uninsured children have NOT been adjusted for the underreporting of public coverage on the CPS. Children who report multiple types of coverage are assigned one type according to the following hierarchy: Medicaid/CHIP, ESI within household, coverage from outside the household, other federal and direct purchase within household. Private coverage includes ESI, coverage from outside the household and direct purchase. Dual coverage estimates should be interpreted with caution as they likely overestimate the propotion of children with Medicaid/CHIP and private coverage at a point-in-time. Estimates of the number of CS eligible children reflect an overreporting of CS eligible children on the ASEC of up to 14 percent. |
||||
| All Children | CS Eligible Children | |||
|---|---|---|---|---|
| Frequency | Percent | Frequency | Percent | |
| HIU Income | ||||
| <100% FPL | 19,306,620 | 24.5% | 11,510,767 | 44.3% |
| 100-199% FPL | 15,600,890 | 19.8% | 6,168,639 | 23.7% |
| 200-299% FPL | 12,784,332 | 16.3% | 3,598,080 | 13.9% |
| 300-399% FPL | 9,622,493 | 12.2% | 1,925,844 | 7.4% |
| >400% FPL | 21,362,867 | 27.2% | 2,778,590 | 10.7% |
| Familiy Type | ||||
| One parent | 19,427,920 | 24.7% | 16,275,359 | 62.6% |
| Two parent | 52,428,511 | 66.6% | 5,576,976 | 21.5% |
| Multigenerational | 3,814,101 | 4.9% | 2,595,053 | 10.0% |
| Other | 3,006,671 | 3.8% | 1,534,532 | 5.9% |
| Source: Urban Institute analysis of the 2009 Annual Social and Economic (ASEC) Supplement to the Current Population Survey (CPS). Note: CS eligible children are children 18 and under living with only one biological parent and children 14 and under living with no parents. Additional details in text. Estimates of uninsured children have been adjusted by the Urban Institute's Health Policy Center for the underreporting of public coverage on the CPS. This adjustment has the impact of reducing the number of uninsured by approximately 1 million. Income relative to the federal poverty level (FPL) reflects the income of the health insurance unit (HIU) and 2008 U.S. Census Bureau poverty thresholds. Family type reflects the Census definition of family. Census family groupings differ from HIUs because they can include family members who are not part of the nuclear family unit (e.g. grandparents). CS eligible children in two parent families are those living with one biological parent and one step-parent. Estimates of the number of CS eligible children reflect an overreporting of CS eligible children on the ASEC of up to 14 percent. |
||||
| All Children | CS Eligible Children | |||
|---|---|---|---|---|
| Frequency | Percent | Frequency | Percent | |
| Total | 7,263,082 | 9.2% | 2,927,557 | 11.3% |
| HIU Income | ||||
| <100% FPL | 3,088,187 | 16.0% | 1,614,977 | 14.0% |
| 100-199% FPL | 2,068,365 | 13.3% | 758,936 | 12.3% |
| 200-299% FPL | 1,056,477 | 8.3% | 316,488 | 8.8% |
| 300-399% FPL | 437,811 | 4.6% | 127,195 | 6.6% |
| >400% FPL | 612,241 | 2.9% | 109,961 | 4.0% |
| Family Type | ||||
| One parent | 1,937,045 | 10.0% | 1,553,553 | 9.6% |
| Two parent | 3,843,373 | 7.3% | 572,194 | 10.3% |
| Multigenerational | 727,486 | 19.1% | 505,167 | 19.5% |
| Other | 755,177 | 25.1% | 296,644 | 19.3% |
| Source: Urban Institute analysis of the 2009 Annual Social and Economic (ASEC) Supplement to the Current Population Survey (CPS). Note: CS eligible children are children 18 and under living with only one biological parent and children 14 and under living with no parents. Additional details in text. Estimates of uninsured children have been adjusted by the Urban Institute's Health Policy Center for the underreporting of public coverage on the CPS. This adjustment has the impact of reducing the number of uninsured by approximately 1 million. Income relative to the federal poverty level (FPL) reflects the income of the health insurance unit (HIU) and 2008 U.S. Census Bureau poverty thresholds. Family type reflects the Census definition of family. Census family groupings differ from HIUs because they can include family members who are not part of the nuclear family unit (e.g. grandparents). CS eligible children in two parent families are those living with one biological parent and one step-parent. Estimates of the number of CS eligible children reflect an overreporting of CS eligible children on the ASEC of up to 14 percent. |
||||
| All Children | CS Eligible Children | |||
|---|---|---|---|---|
| Frequency | Percent | Frequency | Percent | |
| Total | 39,758,691 | 50.5% | 19,052,840 | 73.3% |
| HIU Income | ||||
| <100% FPL | 18,674,208 | 96.7% | 11,305,447 | 98.2% |
| 100-199% FPL | 14,864,145 | 95.3% | 6,009,307 | 97.4% |
| 100-199% FPL | 14,864,145 | 95.3% | 6,009,307 | 97.4% |
| 200-299% FPL | 5,233,135 | 40.9% | 1,517,766 | 42.2% |
| 300-399% FPL | 882,604 | 9.2% | 200,463 | 10.4% |
| >400% FPL | 104,599 | 0.5% | 19,857 | 0.7% |
| Family Type | ||||
| One parent | 14,935,596 | 76.9% | 12,475,359 | 76.7% |
| Two parent | 18,739,705 | 35.7% | 2,715,172 | 48.7% |
| Multigenerational | 3,196,240 | 83.8% | 2,347,988 | 90.5% |
| Other | 2,887,150 | 96.0% | 1,514,320 | 98.7% |
| Source: Urban Institute analysis of the 2009 Annual Social and Economic (ASEC) Supplement to the Current Population Survey (CPS). Note: CS eligible children are children 18 and under living with only one biological parent and children 14 and under living with no parents. Additional details in text. Estimates of uninsured children have been adjusted by the Urban Institute's Health Policy Center for the underreporting of public coverage on the CPS. This adjustment has the impact of reducing the number of uninsured by approximately 1 million. Income relative to the federal poverty level (FPL) reflects the income of the health insurance unit (HIU) and 2008 U.S. Census Bureau poverty thresholds. Family type reflects the Census definition of family. Census family groupings differ from HIUs because they can include family members who are not part of the nuclear family unit (e.g. grandparents). CS eligible children in two parent families are those living with one biological parent and one step-parent. Estimates of the number of CS eligible children reflect an overreporting of CS eligible children on the ASEC of up to 14 percent. |
||||
| All Children | CS Eligible Children | |||
|---|---|---|---|---|
| Frequency | Percent | Frequency | Percent | |
| Total | 4,941,398 | 68.0% | 2,307,070 | 78.8% |
| HIU Income | ||||
| <100% FPL | 2,726,367 | 88.3% | 1,486,811 | 92.1% |
| 100-199% FPL | 1,808,775 | 87.5% | 692,394 | 91.2% |
| 200-299% FPL | 363,691 | 34.4% | 119,306 | 37.7% |
| 300-399% FPL | 34,318 | 7.8% | 8,560 | 6.7% |
| >400% FPL | 8,247 | 1.4% | -- | 0.0% |
| Family Type | ||||
| One parent | 1,538,595 | 79.4% | 1,209,271 | 77.8% |
| Two parent | 2,067,990 | 53.8% | 343,423 | 60.0% |
| Multigenerational | 644,451 | 88.6% | 472,953 | 93.6% |
| Other | 690,362 | 91.4% | 281,424 | 94.9% |
| Source: Urban Institute analysis of the 2009 Annual Social and Economic (ASEC) Supplement to the Current Population Survey (CPS). Note: CS eligible children are children 18 and under living with only one biological parent and children 14 and under living with no parents. Additional details in text. Estimates of uninsured children have been adjusted by the Urban Institute's Health Policy Center for the underreporting of public coverage on the CPS. This adjustment has the impact of reducing the number of uninsured by approximately 1 million. Income relative to the federal poverty level (FPL) reflects the income of the health insurance unit (HIU) and 2008 U.S. Census Bureau poverty thresholds. Family type reflects the Census definition of family. Census family groupings differ from HIUs because they can include family members who are not part of the nuclear family unit (e.g. grandparents). CS eligible children in two parent families are those living with one biological parent and one step-parent. Estimates of the number of CS eligible children reflect an overreporting of CS eligible children on the ASEC of up to 14 percent. |
||||
| Frequency | Percent | |
|---|---|---|
| CS and Medicaid eligible | 2,307,070 | 31.8% |
| CS eligible, NOT Medicaid eligible | 620,487 | 8.5% |
| NOT CS eligible, Medicaid eligible | 2,634,327 | 36.3% |
| NOT CS or Medicaid eligible | 1,701,197 | 23.4% |
| Source: Urban Institute Health Policy Center Eligibility Simulation Model, based on data from the 2009 Annual Social and Economic (ASEC) Supplement to the Current Population Survey (CPS). Note: CS eligible children are children 18 and under living with only one biological parent and children 14 and under living with no parents. Additional details in text. Estimates of uninsured children have been adjusted by the Urban Institute's Health Policy Center for the underreporting of public coverage on the CPS. This adjustment has the impact of reducing the number of uninsured by approximately 1 million. Estimates of the number of CS eligible children reflect an overreporting of CS eligible children on the ASEC of up to 14 percent. |
||
Endnotes
[1] Urban Institute estimates based on the 2009 Current Population Survey. This includes children living with only one biological parent as well as children 14 and under living with no parents.
[2] Children up to age 21 may also be eligible for child support but are excluded here because we will use a Medicaid eligibility simulation designed for those18 and under.
[3] Urban Institute estimates based on the 2009 Current Population Survey
[4] Aron, Laudon. 2002. “Health Care Coverage Among Child-Support Eligible Children.” http://aspe.hhs.gov/HSP/CSE-health-ben02/index.htm
[5] CHIP coverage has been expanded in many states since 1999 (G. Kenney and J. Yee. 2007. “SCHIP At a Crossroads: Experiences To Date and Challenges Ahead.” Health Affairs 26(2): 356-369.
[6] G. Kenney, A. Cook and L.Dubay “Progress Enrolling Children in Medicaid/CHIP: Who is Left and What are the Prospects for Covering More Children?” The Urban Institute, December 2009.
[7] We assign Medicaid/CHIP to the top of the hierarchy to estimate of the total number of children with Medicaid/CHIP coverage, regardless of whether they were also reported to have another type of coverage. This likely allows for more precise adjustments to coverage estimates since the exclusion of children reported to have both Medicaid/CHIP and other coverage from Medicaid/CHIP estimates could potentially overstate the extent of public coverage underreporting on the CPS. In addition, by assigning Medicaid/CHIP to the top of the hierarchy, we are able to assess the full extent to which children are reported to be enrolled in these programs, regardless of their other coverage experiences.
[8] There are fewer than 500,000 children 15 and over who are classified as having other federal coverage or direct purchase coverage who also reported coverage from outside the household. This represents approximately 1.8 percent of CS eligible children.
[9] Because many states use the same names for their Medicaid and CHIP programs and because many families are confused about the specific type of public coverage their child has, it is not possible to reliably distinguish between Medicaid and CHIP coverage on the CPS.(C.T. Nelson, and R.J. Mills. “The Characteristics of Persons Reporting State Children’s Health Insurance Program Coverage in the March 2001 Current Population Survey.” U.S. Bureau of the Census, August 2002.)
[10] The CPS health insurance questions do not specifically identify the type of coverage that is available from outside of the household.
[11] The undercount adjustment partially adjusts the CPS to administrative estimates of Medicaid and CHIP enrollment. For more information, see Dubay, L., J. Holahan, and A. Cook. “The Uninsured and the Affordability of Health Insurance Coverage.” Health Affairs 26(1): w22-w30. 2007. This adjustment has the effect of reducing the number of uninsured children by 0.8 million (from 8.1 million to 7.3 million) and increasing the number of children with Medicaid/CHIP coverage by 2.5 million (from 23.4 million to 25.9 million.).
[12] A long standing debate exists regarding whether insurance estimates from the CPS represent people who responded by providing their coverage at the time of the survey or responded about their health insurance coverage over the course of the year (as intended) but with recall error because of the long reference period. The Census Bureau has commented on this issue and stated that CPS estimates are more closely in line with point in time estimates of the uninsured. (DeNavas-Walt, C, BD Proctor, and JC Smith, U.S. Census Bureau, Current Population Reports, P60-236. “Income, Poverty, and Health Insurance Coverage in the United States: 2008.” Washington, DC: Government Printing Office, 2009.)
[13] CPS estimates of children with both Medicaid/CHIP and private coverage far exceed estimates from the National Health Interview Survey, a point-in-time survey. In 2008, only 1 percent of children report both Medicaid/CHIP and private coverage on the NHIS, while 5 percent do so on the CPS.
[14] The definition of child support eligibility excludes children who reside with a single parent who has been widowed and children residing with adoptive parent(s). Because children may be adopted by a single parent, we cannot identify which children living with one adoptive parent are child-support eligible.
[15] For those children living with no parents, we are unable to exclude cases where both parents are deceased.
[16] U.S. Census Bureau. “Poverty Thresholds for 2008 by Size of Family and Number of Related Children Under 18 years.” http://www.census.gov/hhes/www/poverty/threshld/thresh08.html
[17] Health insurance units include the member of a nuclear family, including the family head, spouse, and own children under 19 years of age, or own full-time student children 19-22 years of age.
[18] Census family groupings differ from HIUs because they can include family members who are not part of the nuclear family unit (e.g. grandparents).
[19] L. Dubay, and A. Cook. “How Will the Uninsured Be Affected by Health Reform?” Kaiser Commission on Medicaid and the Uninsured, August 2009, http://www.kff.org/healthreform/upload/7971.pdf.
[20] The model takes into account childcare expense, work expense and earnings disregards in determining eligibility, but does not take into account child support disregards.
[21] To account for the possibility that some foreign born individuals are unauthorized immigrants and therefore not eligible for public health insurance coverage, the model takes into account immigrant status. Immigrant status is predicted based on a simulation model of immigrant status derived from the March 2004 CPS. March 2004 CPS estimates of immigrant status were developed by Passell, and estimates derived from the two sample estimation technique are consistent with those produced using the March 2008 CPS (J. Passel, and D. Cohen. “A Portrait of Unauthorized Immigrants in the United States.” Washington, DC: Pew Hispanic Center, April 2009).
[22] Child support eligible children in two-parent families live with one biological parent and one step-parent.
[23] Child support eligible children with family income less than 200 percent of the FPL who are ineligible for Medicaid/CHIP do not qualify for these programs either because they are legal non-citizens who do not meet their state’s citizenship status requirements for eligibility or because they do not meet immigration status requirements. In contrast, the majority of ineligible children with income over 200 percent of the FPL appear to be ineligible on the basis of income.
[24] Medicaid/CHIP eligible children above 300 percent of the FPL are in states with high CHIP eligibility thresholds or other special programs for children.
[25] Adjusting for the March CPS overestimate of CS eligible children results in 2.6 million uninsured children
[26] An estimated 13 percent of child support eligible children appear to be uninsured based on coverage estimates that have not been adjusted for the underreporting of public coverage (See Appendix Table 2).
[27] Adjusting for the March CPS overestimate of CS eligible children results in an estimate of 2.0 million
[28] Adjusting for the March CPS overestimate of CS eligible children results in estimates of 36 percent for the proportion of uninsured children that are CS eligible and 28 percent of uninsured children that are both Medicaid/CHIP and CS eligible children
[29] See http://www.insurekidsnow.gov/chip/report.html for more details.
[30] Adjusting for the March CPS overestimate of CS eligible children results in an estimate 41 percent of Medicaid/CHIP eligible uninsured children that are CS eligible
[31] According to Urban Institute tabulations, there are 40,123 unweighted households on the 2008 CPS-CSS and 97,502 unweighted households in the 2008 ASEC. Approximately one-quarter of households interviewed in March are in the outgoing rotation group, and so are not in sample for the April CPS and are not included in the CPS-CSS. By restricting the universe to those households in sample for both the March and April interviews, the CPS-CSS appears to also exclude the additional "CHIP" and "Hispanic" samples that substantially increase the ASEC sample size (http://www.census.gov/apsd/techdoc/cps/cpsmar09.pdf).
[32] The March 2009 file was available in September 2009, while the March/April 2008 file was not available until April 2010.
[33] Some of 2.5 million excluded children are excluded because the custodial parent indicates that there is a parent living elsewhere, but they have never received or attempted to receive child support. Such children may still be eligible however and our eligibility definition would include these children.
[34] These coverage estimates do not include the adjustment to reflect the underreporting of public coverage and exclude children living with neither of their parents to be more consistent with the CPS-CSS.