
Frequently Asked Questions About Child-Only Cases
Sept. 1999
- What is a child-only case?
- Why might a parent be in the household, but not in the assistance unit?
- Has the child-only caseload grown in recent years?
- Why did the number of child-only cases increase during the early 1990s?
- Why are child only cases declining less quickly than other cases?
- Why are child-only cases treated differently than other TANF cases?
- How is kinship care different from foster care?
- What does the TANF Final Rule say about child-only cases?
- What is HHS doing to understand child-only cases?
What is a child-only case?
Child-only cases are those cases in which there is no adult in the assistance unit. In some of these cases, there is no parent living with the child, and the caregiver is not legally responsible for his or her care (i.e. kinship care cases). In other cases, a parent is living with the child, but is ineligible for benefits for some reason. In the period September 1996 to June 1997, the last period for which we have national data, 39 percent of child-only cases did not have a parent in the household, and 61 percent did. There is significant variation in this figure from state to state, however, as shown in Table A.
| States | Total AFDC Families | Total Child-Only Families | Percent Child-Only | Of Child-Only Families, Percent With: | |
|---|---|---|---|---|---|
| Parents Not in the Household | Parents in the Household | ||||
| US Total | 4,058,131 | 918,233 | 23% | 39% | 61% |
| Alabama | 36,728 | 16,268 | 44% | 37% | 63% |
| Alaska | 12,312 | ||||
| Arizona | 56,020 | 18,369 | 33% | 34% | 66% |
| Arkansas | 21,405 | 6,017 | 28% | 38% | 62% |
| California | 832,009 | 190,989 | 23% | 20% | 80% |
| Colorado | 31,182 | 6,273 | 20% | 36% | 64% |
| Connecticut | 56,051 | 6,625 | 12% | 64% | 36% |
| Delaware | 9,900 | 2,585 | 26% | 57% | 43% |
| District of Columbia | 24,508 | 4,780 | 20% | 55% | 45% |
| Florida | 179,170 | 50,556 | 28% | 57% | 43% |
| Georgia | 111,924 | 33,699 | 30% | 48% | 52% |
| Guam | 2,279 | 270 | 12% | 24% | 76% |
| Hawaii | 22,487 | 2,970 | 13% | 61% | 39% |
| Idaho | 7,710 | 1,217 | 16% | 0% | 100% |
| Illinois | 202,290 | 37,371 | 18% | 43% | 57% |
| Indiana | 45,813 | 13,193 | 29% | 34% | 66% |
| Iowa | 29,365 | 5,811 | 20% | 50% | 50% |
| Kansas | 21,066 | 5,557 | 26% | 41% | 59% |
| Kentucky | 66,623 | 20,145 | 30% | 36% | 64% |
| Louisiana | 58,665 | 21,111 | 36% | 26% | 74% |
| Maine | 18,961 | 1,534 | 8% | 24% | 76% |
| Maryland | 60,950 | 12,910 | 21% | 59% | 41% |
| Mass | 79,686 | 16,425 | 21% | 33% | 67% |
| Michigan | 154,816 | 23,073 | 15% | 30% | 70% |
| Minnesota | 54,276 | 6,147 | 11% | 29% | 71% |
| Mississippi | 40,646 | 14,064 | 35% | 31% | 69% |
| Missouri | 73,635 | 17,678 | 24% | 45% | 55% |
| Montana | 9,442 | 1,167 | 12% | 44% | 56% |
| Nebraska | 13,481 | 2,233 | 17% | 18% | 82% |
| Nevada | 12,120 | 5,467 | 45% | 40% | 60% |
| New Hampshire | 8,280 | 1,337 | 16% | 64% | 36% |
| New Jersey | 102,034 | 21,194 | 21% | 50% | 50% |
| New Mexico | 29,256 | 6,143 | 21% | 27% | 73% |
| New York | 391,000 | 72,077 | 18% | 20% | 80% |
| North Carolina | 101,783 | 27,066 | 27% | 82% | 18% |
| North Dakota | 4,331 | 568 | 13% | 37% | 63% |
| Ohio | 191,437 | 43,212 | 23% | 47% | 53% |
| Oklahoma | 31,750 | 9,309 | 29% | 51% | 49% |
| Oregon | 25,310 | 7,259 | 29% | 43% | 57% |
| Pennsylvania | 167,933 | 26,456 | 16% | 51% | 49% |
| Puerto Rico | 48,143 | 6,294 | 13% | 60% | 40% |
| Rhode Island | 19,903 | 3,125 | 16% | 30% | 70% |
| South Carolina | 35,895 | 11,605 | 32% | 52% | 48% |
| South Dakota | 5,264 | 1,921 | 36% | 47% | 53% |
| Tennessee | 73,763 | 19,763 | 27% | 55% | 45% |
| Texas | 222,162 | 56,169 | 25% | 45% | 55% |
| Utah | 12,613 | 2,176 | 17% | 56% | 44% |
| Vermont | 8,401 | 812 | 10% | 40% | 60% |
| Virgin Islands | 1,298 | 79 | 6% | 100% | 0% |
| Virginia | 55,260 | 17,577 | 32% | 60% | 40% |
| Washington | 94,619 | 18,663 | 20% | 48% | 52% |
| West Virginia | 34,747 | 7,830 | 23% | 34% | 66% |
| Wisconsin | 44,345 | 12,260 | 28% | 37% | 63% |
| Wyoming | 3,084 | 832 | 27% | 36% | 64% |
Source: October 1996 - June 1997 AFDC QC Data. Department of Health and Human Services, Administration for children and Families, Office of Planning, Research, and Evaluation.
Why might a parent be in the household, but not in the assistance unit?
Under AFDC, the federal government set the basic standards for who must be included or excluded from the assistance unit. The parent of a child receiving assistance had to be in the assistance unit if she lived in the household, unless she was specifically ineligible. There were three primary reasons why a parent might be ineligible: receipt of Supplemental Security Income (SSI) benefits; alien status (for example, immigrants legalized under the Immigration Reform and Control Act were specifically banned from receiving AFDC or Food Stamps for five years); and sanctions.
In the period September 1996 to July 1997, the last period for which we have national data, 23 percent of child-only cases had a parent ineligible due to SSI receipt, 16 percent of child-only cases had a parent ineligible due to alien status, and 9 percent had a parent ineligible due to sanctions. Again, there is much variation from state to state due to both demographic variation and policy choices, as shown in Table B.
| State | Child-Only Cases with Parents in the Household | Of those Cases with Parents in the Household: | |||
|---|---|---|---|---|---|
| Reasons Parents are Ineligible | |||||
| SSI Benefit | Alien Status | Sanction [ETP 12] | Other or Unknown | ||
| US Total | 563,363 | 38% | 26% | 15% | 21% |
| Alabama | 10,253 | 52% | 0% | 26% | 22% |
| Alaska | |||||
| Arizona | 12,116 | 13% | 32% | 6% | 50% |
| Arkansas | 3,748 | 56% | 1% | 8% | 34% |
| California | 152,572 | 25% | 58% | 9% | 9% |
| Colorado | 4,046 | 47% | 13% | 4% | 37% |
| Connecticut | 2,362 | 50% | 0% | 0% | 50% |
| Delaware | 1,122 | 48% | 4% | 32% | 16% |
| District of Columbia | 2,136 | 27% | 9% | 31% | 33% |
| Florida | 21,667 | 41% | 13% | 10% | 36% |
| Georgia | 17,397 | 20% | 0% | 18% | 62% |
| Guam | 205 | 0% | 0% | 18% | 83% |
| Hawaii | 1,167 | 9% | 0% | 65% | 26% |
| Idaho | 1,217 | 33% | 0% | 11% | 56% |
| Illinois | 21,253 | 44% | 11% | 21% | 24% |
| Indiana | 8,675 | 46% | 2% | 34% | 18% |
| Iowa | 2,906 | 59% | 6% | 2% | 33% |
| Kansas | 3,269 | 45% | 12% | 14% | 30% |
| Kentucky | 12,978 | 72% | 5% | 23% | 4% |
| Louisiana | 15,521 | 43% | 0% | 1% | 56% |
| Maine | 1,166 | 91% | 0% | 4% | 4% |
| Maryland | 5,291 | 36% | 3% | 39% | 22% |
| Mass | 11,075 | 49% | 10% | 12% | 29% |
| Michigan | 16,204 | 76% | 2% | 16% | 6% |
| Minnesota | 4,348 | 30% | 10% | 7% | 53% |
| Mississippi | 9,704 | 59% | 0% | 10% | 31% |
| Missouri | 9,663 | 42% | 7% | 14% | 44% |
| Montana | 656 | 14% | 0% | 29% | 57% |
| Nebraska | 1,820 | 52% | 13% | 13% | 22% |
| Nevada | 3,288 | 19% | 14% | 57% | 10% |
| New Hampshire | 483 | 43% | 0% | 0% | 57% |
| New Jersey | 10,655 | 25% | 13% | 58% | 4% |
| New Mexico | 4,482 | 26% | 4% | 30% | 40% |
| New York | 57,406 | 28% | 30% | 12% | 30% |
| North Carolina | 4,776 | 74% | 0% | 13% | 13% |
| North Dakota | 357 | 37% | 0% | 26% | 37% |
| Ohio | 22,992 | 69% | 1% | 12% | 18% |
| Oklahoma | 4,562 | 52% | 1% | 25% | 21% |
| Oregon | 4,113 | 48% | 16% | 43% | 6% |
| Pennsylvania | 12,947 | 36% | 1% | 4% | 58% |
| Puerto Rico | 2,528 | 0% | 0% | 25% | 75% |
| Rhode Island | 2,193 | 44% | 32% | 2% | 22% |
| South Carolina | 5,533 | 55% | 0% | 26% | 20% |
| South Dakota | 1,023 | 18% | 0% | 27% | 56% |
| Tennessee | 8,883 | 75% | 0% | 42% | 17% |
| Texas | 31,035 | 23% | 45% | 18% | 13% |
| Utah | 967 | 46% | 19% | 8% | 27% |
| Vermont | 487 | 92% | 0% | 0% | 8% |
| Virgin Islands | 0 | 0% | 0% | 0% | 0% |
| Virginia | 6,983 | 49% | 3% | 20% | 27% |
| Washington | 9,657 | 47% | 24% | 20% | 9% |
| West Virginia | 5,174 | 62% | 0% | 12% | 26% |
| Wisconsin | 7,770 | 65% | 4% | 13% | 18% |
| Wyoming | 532 | 24% | 0% | 33% | 42% |
Source: October 1996 - June 1997 AFDC QC Data. Department of Health and Human Services, Administration for children and Families, Office of Planning, Research, and Evaluation.
Note: an additional 13 percent of child-only cases were reported as parent in the household/ineligible for other or unknown reason. In some states, this category accounts for as many as 62 percent of child-only cases. This raises some concerns about the accuracy of the data in these states; however, the overall patterns in the data appear to be consistent.
Under TANF, states have the power to define the assistance unit and to define an eligible family. This is important, because two of the key provisions under TANF the participation rate requirement and the five-year federal time limit only apply to cases that include adults.
Information on the reasons why a case does not include an adult recipient is not collected under the Emergency TANF Data Report, but will be collected as part of the full TANF data requirements which states will begin reporting in FY 2000.
Has the child-only caseload grown in recent years?
The child-only caseload grew significantly both in absolute numbers and as a percentage of the caseload in the decade prior to PRWORA. The greatest increase came during the period 1989-1994, when the number of child only cases more than doubled. (See Table C.)
| States | Number of AFDC Cases with no Adult Recipient [In thousands] | Percent of AFDC Cases with no Adult Recipient [In percent] | ||||||||||
|---|---|---|---|---|---|---|---|---|---|---|---|---|
| 1985 | 1989 | 1993 | 1994 | 1995 | 1996 | 1985 | 1989 | 1993 | 1994 | 1995 | 1996 | |
| Alabama | 10.1 | 7.4 | 13.6 | 16.1 | 16.5 | 17.1 | 19.3 | 16.5 | 26.3 | 32.1 | 35.8 | 40.4 |
| Alaska | 0.9 | 0.5 | 0.9 | 0.8 | 0.8 | 1.1 | 14.3 | 6.7 | 7.5 | 6.6 | 6.5 | 9.1 |
| Arizona | 4.9 | 4.9 | 12.8 | 15.1 | 18.8 | 18.8 | 19.2 | 13.6 | 18.3 | 21.0 | 27.0 | 29.7 |
| Arkansas | 1.1 | 4.1 | 6.6 | 6.9 | 6.8 | 8.2 | 4.8 | 17.1 | 24.9 | 26.4 | 27.8 | 36.0 |
| California | 96.6 | 85.7 | 223.5 | 201.3 | 194.9 | 198.5 | 17.5 | 14.2 | 26.0 | 22.1 | 21.2 | 22.2 |
| Colorado | 3.3 | 2.1 | 5.1 | 6.4 | 6.1 | 6.7 | 11.8 | 6.2 | 12.1 | 15.3 | 15.8 | 18.9 |
| Connecticut | 4.5 | 3.9 | 5.5 | 6.5 | 7.2 | 6.6 | 10.7 | 10.1 | 9.6 | 11.0 | 11.8 | 11.3 |
| Delaware | 1.6 | 1.3 | 2.4 | 2.8 | 2.7 | 2.7 | 17.8 | 17.0 | 21.3 | 24.3 | 25.0 | 25.8 |
| Dist. of Col. | 3.4 | 2.4 | 4.9 | 4.5 | 4.3 | 4.4 | 15.3 | 13.3 | 19.7 | 16.5 | 16.1 | 17.0 |
| Florida | 20.5 | 27.5 | 38.2 | 47.9 | 45.9 | 47.8 | 21.1 | 23.2 | 15.0 | 19.4 | 19.9 | 22.5 |
| Georgia | 15.5 | 13.9 | 22.4 | 26.6 | 30.8 | 29.0 | 18.1 | 15.0 | 15.8 | 18.8 | 22.1 | 22.3 |
| Guam | -- | 0.0 | 0.1 | 0.1 | 0.1 | 0.1 | -- | 4.0 | 4.5 | 4.0 | 4.5 | 3.8 |
| Hawaii | 1.3 | 1.4 | 1.4 | 1.8 | 2.3 | 2.6 | 7.9 | 9.8 | 7.7 | 8.8 | 10.6 | 12.0 |
| Idaho | 0.9 | 0.3 | 0.9 | 1.4 | 1.5 | 2.3 | 14.0 | 4.8 | 11.0 | 16.7 | 17.0 | 25.8 |
| Illinois | 26.8 | 17.4 | 24.1 | 32.1 | 34.1 | 38.8 | 11.2 | 8.4 | 10.4 | 13.4 | 14.4 | 17.3 |
| Indiana | 2.9 | 3.3 | 7.9 | 10.4 | 11.8 | 13.1 | 5.2 | 6.5 | 10.8 | 14.1 | 18.0 | 24.7 |
| Iowa | 3.6 | 2.8 | 4.0 | 5.3 | 5.0 | 6.9 | 9.0 | 8.1 | 10.9 | 13.4 | 13.7 | 20.9 |
| Kansas | 2.5 | 2.6 | 4.1 | 4.1 | 5.0 | 5.5 | 11.0 | 10.2 | 13.4 | 13.8 | 17.8 | 21.7 |
| Kentucky | 8.5 | 8.6 | 12.9 | 14.8 | 17.1 | 19.9 | 14.4 | 14.6 | 15.6 | 18.5 | 22.7 | 27.7 |
| Louisiana | 12.1 | 10.9 | 17.4 | 19.4 | 20.8 | 22.5 | 15.8 | 11.8 | 19.4 | 22.3 | 26.1 | 31.9 |
| Maine | 1.5 | 0.9 | 1.1 | 1.6 | 1.8 | 1.6 | 7.6 | 5.1 | 4.8 | 6.8 | 8.2 | 7.6 |
| Maryland | 7.2 | 6.8 | 10.9 | 12.1 | 12.4 | 14.6 | 10.0 | 10.8 | 13.6 | 15.1 | 16.0 | 19.7 |
| Massachusett | 8.8 | 5.2 | 12.7 | 14.9 | 16.8 | 15.9 | 10.1 | 5.9 | 11.1 | 13.3 | 16.7 | 18.0 |
| Michigan | 5.1 | 3.0 | 17.6 | 22.0 | 24.6 | 22.6 | 2.3 | 1.4 | 7.7 | 9.8 | 12.2 | 12.7 |
| Minnesota | 3.6 | 1.9 | 5.2 | 6.4 | 6.1 | 8.1 | 7.1 | 3.5 | 8.1 | 10.2 | 10.7 | 13.8 |
| Mississippi | 11.7 | 8.3 | 12.8 | 14.9 | 13.1 | 16.5 | 22.6 | 13.8 | 21.3 | 26.3 | 25.0 | 34.3 |
| Missouri | 8.0 | 6.7 | 10.6 | 12.2 | 15.8 | 14.2 | 12.0 | 9.8 | 11.8 | 13.3 | 17.7 | 17.2 |
| Montana | 0.6 | 0.4 | 0.9 | 0.8 | 1.2 | 1.2 | 7.7 | 4.7 | 7.9 | 6.9 | 10.1 | 11.0 |
| Nebraska | 3.0 | 2.4 | 3.5 | 4.1 | 4.3 | 4.1 | 19.6 | 17.0 | 21.1 | 25.5 | 28.8 | 28.9 |
| Nevada | 1.0 | 1.4 | 2.1 | 3.5 | 5.0 | 4.9 | 20.9 | 19.8 | 16.3 | 24.6 | 31.6 | 32.9 |
| New Hampshire | 0.6 | 0.8 | 0.9 | 1.5 | 2.0 | 1.7 | 11.6 | 15.5 | 7.9 | 13.1 | 18.4 | 17.7 |
| New Jersey | 12.5 | 14.3 | 18.7 | 20.1 | 19.6 | 23.2 | 10.1 | 13.9 | 14.9 | 16.4 | 16.5 | 20.7 |
| New Mexico | 2.5 | 2.1 | 3.5 | 5.3 | 5.4 | 5.4 | 13.8 | 10.4 | 11.3 | 15.8 | 15.6 | 15.9 |
| New York | 33.8 | 16.0 | 42.6 | 62.0 | 66.1 | 76.1 | 9.1 | 4.8 | 9.8 | 13.6 | 14.5 | 17.6 |
| North | 14.9 | 12.5 | 21.4 | 26.1 | 29.7 | 33.3 | 23.5 | 16.2 | 16.4 | 19.9 | 23.7 | 29.4 |
| North Dakota | 0.3 | 0.4 | 0.6 | 0.5 | 0.7 | 0.7 | 7.6 | 6.4 | 9.8 | 9.0 | 12.5 | 14.2 |
| Ohio | 18.3 | 18.6 | 35.7 | 43.6 | 47.8 | 48.7 | 8.2 | 8.4 | 13.8 | 17.4 | 21.0 | 23.6 |
| Oklahoma | 2.8 | 3.5 | 7.2 | 6.4 | 8.0 | 8.6 | 9.9 | 9.8 | 14.8 | 13.6 | 17.9 | 22.3 |
| Oregon | 3.6 | 4.4 | 6.1 | 8.0 | 9.0 | 12.9 | 13.1 | 13.7 | 14.2 | 19.0 | 22.9 | 38.5 |
| Pennsylvania | 14.5 | 12.1 | 22.2 | 24.7 | 24.2 | 29.6 | 7.8 | 6.9 | 10.8 | 11.7 | 11.8 | 15.6 |
| Puerto Rico | -- | 6.1 | 6.4 | 6.7 | 6.2 | 5.8 | -- | 10.5 | 10.6 | 11.4 | 11.3 | 11.5 |
| Rhode Island | 1.3 | 0.8 | 2.1 | 2.4 | 2.6 | 3.2 | 8.2 | 5.1 | 9.6 | 10.6 | 11.8 | 14.9 |
| South | 9.2 | 7.3 | 13.7 | 15.3 | 15.9 | 15.7 | 21.2 | 19.6 | 25.7 | 29.5 | 32.5 | 34.4 |
| South Dakota | 1.1 | 0.7 | 1.5 | 1.5 | 1.5 | 1.6 | 18.9 | 10.1 | 20.1 | 21.8 | 23.5 | 27.2 |
| Tennessee | 10.5 | 10.0 | 14.8 | 19.5 | 21.3 | 24.2 | 18.4 | 14.1 | 13.7 | 17.6 | 20.4 | 24.4 |
| Texas | 5.8 | 21.1 | 52.1 | 53.5 | 70.9 | 67.4 | 4.9 | 11.6 | 18.7 | 18.9 | 25.8 | 26.4 |
| Utah | 1.5 | 1.2 | 2.1 | 2.7 | 2.7 | 3.0 | 11.4 | 8.0 | 11.6 | 15.1 | 16.0 | 20.4 |
| Vermont | 0.3 | 0.2 | 0.9 | 0.7 | 0.6 | 1.0 | 4.4 | 3.4 | 8.7 | 7.6 | 5.9 | 10.9 |
| Virgin | -- | 0.2 | 0.1 | 0.1 | 0.1 | 0.1 | -- | 20.7 | 9.1 | 9.4 | 8.9 | 8.6 |
| Virginia | 11.7 | 8.9 | 15.5 | 16.2 | 17.7 | 18.6 | 19.9 | 16.6 | 21.0 | 21.7 | 24.5 | 28.6 |
| Washington | 8.0 | 8.5 | 14.2 | 15.1 | 15.1 | 16.9 | 12.5 | 10.9 | 14.1 | 14.7 | 14.8 | 17.1 |
| West Virginia | 3.4 | 3.3 | 6.0 | 5.4 | 6.7 | 7.7 | 10.1 | 9.3 | 14.4 | 13.3 | 17.4 | 21.0 |
| Wisconsin | 8.2 | 8.4 | 11.6 | 13.7 | 15.3 | 15.7 | 8.6 | 10.3 | 14.5 | 17.8 | 21.2 | 26.2 |
| Wyoming | 0.5 | 0.3 | 0.7 | 0.7 | 1.1 | 1.1 | 12.1 | 6.8 | 11.1 | 11.5 | 20.7 | 23.6 |
| U.S. Total | 437 | 400 | 787 | 869 | 923 | 978 | 12.0 | 10.6 | 15.8 | 17.2 | 18.9 | 21.5 |
Source: ACF, Characteristics and Financial Circumstances of AFDC Recipients, 1996 and earlier reports.
In the mid 1990s, the rate of increase declined, and beginning after FY 1996, the number of child-only cases actually declined. Because the overall caseload declined more rapidly, however, child-only cases continued to constitute a growing fraction of the caseload. Between FY 1996 and the first 3 quarters of FY 1997, the average monthly number of child-only cases declined by 6.5 percent compared to 12.2 percent for the total caseload, so the fraction of the caseload that was child-only cases rose slightly, from 21.5 percent to 22.6 percent.
Based on the first full year of TANF data, the national average monthly number of child-only cases fell substantially from the first three quarters of FY 1997 to FY 1998 (26.8 percent), almost as rapidly as the overall caseload (27.6 percent). These national figures cover a great deal of state-tostate variation, but only six states reported increases in the average monthly number of child-only cases during this time period. (See Table D)
| States | 10/96-6/97 Total AFDC Families | 6/97-9/97 Total TANF Families | 10/97-9/98 Total TANF Families | % Change FY 97 to FY 98 | 10/96-6/97 Child-Only Families | 6/97-9/97 Child-Only Families | 10/97-9/98 Child-Only Families | % Change FY 97 to FY 98 |
|---|---|---|---|---|---|---|---|---|
| Total | 4,058,131 | 2,899,580 | 3,179,167 | -22% | 918,231 | 670,718 | 723,894 | -21% |
| Alabama | 36,728 | 28,293 | 23,792 | -35% | 16,268 | 12,126 | 11,081 | -32% |
| Alaska | 12,312 | a | 10,210 | -17% | a | a | 1,059 | -- |
| Arizona | 56,020 | 50,912 | 40,163 | -28% | 18,369 | 15,673 | 12,441 | -32% |
| Arkansas | 21,405 | a | 13,844 | -35% | 6,017 | a | 5,538 | -8% |
| California | 832,009 | 767,625 | 707,063 | -15% | 190,989 | 178,948 | 180,755 | -5% |
| Colorado | 31,182 | a | 21,193 | -32% | 6,273 | a | 5,835 | -7% |
| Connecticut | 56,051 | 55,042 | 47,189 | -16% | 6,625 | 9,040 | 8,040 | 21% |
| Delaware | 9,900 | a | 7,568 | -24% | 2,585 | a | 2,488 | -4% |
| D.C. | 24,508 | 22,954 | 21,264 | -13% | 4,780 | 4,188 | 2,752 | -42% |
| Florida | 179,170 | 147,574 | 111,143 | -38% | 50,556 | 43,168 | 40,814 | -19% |
| Georgia | 111,924 | 92,350 | 78,196 | -30% | 33,699 | 32,393 | 29,208 | -13% |
| Guam | 2,279 | a | 2,075 | -9% | 270 | a | 206 | -24% |
| Hawaii | 22,487 | a | 17,031 | -24% | 2,970 | a | 2,085 | -30% |
| Idaho | 7,710 | a | 1,860 | -76% | 1,217 | a | 798 | -34% |
| Illinois | 202,290 | a | 170,917 | -16% | 37,371 | a | 24,858 | -33% |
| Indiana | 45,813 | -- | 39,679 | -13% | 13,193 | b | 4,730 | -64% |
| Iowa | 29,365 | 27,438 | 25,167 | -14% | 5,811 | 4,851 | 4,790 | -18% |
| Kansas | 21,066 | 17,508 | 13,914 | -34% | 5,557 | 3,906 | 4,256 | -23% |
| Kentucky | 66,623 | 60,486 | 52,645 | -21% | 20,145 | 15,743 | 15,697 | -22% |
| Louisiana | 58,665 | 50,460 | 47,916 | -18% | 21,111 | 16,060 | 11,985 | -43% |
| Maine | 18,961 | 16,997 | 15,331 | -19% | 1,534 | 2,970 | 3,135 | 104% |
| Maryland | 60,950 | -- | 47,564 | -22% | 12,910 | b | 10,968 | -15% |
| Massachusetts | 79,686 | 72,898 | 66,409 | -17% | 16,425 | 17,224 | 15,670 | -5% |
| Michigan | 154,816 | 142,166 | 123,693 | -20% | 23,073 | 19,326 | 21,556 | -7% |
| Minnesota | 54,276 | a | 48,464 | -11% | 6,147 | a | 6,939 | 13% |
| Mississippi | 40,646 | 32,113 | 23,631 | -42% | 14,064 | 10,776 | 9,596 | -32% |
| Missouri | 73,635 | 66,191 | 60,074 | -18% | 17,678 | 13,782 | 14,134 | -20% |
| Montana | 9,442 | 8,179 | 7,275 | -23% | 1,167 | 1,040 | 1,069 | -8% |
| Nebraska | 13,481 | 13,900 | 13,374 | -1% | 2,233 | 3,199 | 3,152 | 41% |
| Nevada | 12,120 | 11,311 | 10,383 | -14% | 5,467 | 2,878 | 3,343 | -39% |
| New Hampshire | 8,280 | 6,820 | 6,295 | -24% | 1,337 | 1,415 | 1,559 | 17% |
| New Jersey | 102,034 | 95,167 | 81,665 | -20% | 21,194 | 19,754 | 16,782 | -21% |
| New Mexico | 29,256 | a | 21,363 | -27% | 6,143 | a | 3,248 | -47% |
| New York | 391,000 | 364,510 | 336,858 | -14% | 72,077 | 74,116 | 51,145 | -29% |
| North Carolina | 101,783 | 91,364 | 76,337 | -25% | 27,066 | 18,919 | 27,535 | 2% |
| North Dakota | 4,331 | a | 3,275 | -24% | 568 | a | 734 | 29% |
| Ohio | 191,437 | 165,009 | 140,286 | -27% | 43,212 | 37,623 | 35,417 | -18% |
| Oklahoma | 31,750 | 27,341 | 24,135 | -24% | 9,309 | 7,580 | 6,852 | -26% |
| Oregon | 25,310 | 21,297 | 18,898 | -25% | 7,259 | 4,084 | 4,014 | -45% |
| Pennsylvania | 167,933 | a | 134,995 | -20% | 26,456 | a | 25,773 | -3% |
| Puerto Rico | 48,143 | a | 42,201 | -12% | 6,294 | a | b | -- |
| Rhode Island | 19,903 | a | 19,229 | -3% | 3,125 | a | 2,529 | -19% |
| South Carolina | 35,895 | 29,170 | 25,293 | -30% | 11,605 | 9,314 | 8,673 | -25% |
| South Dakota | 5,264 | 4,629 | 3,851 | -27% | 1,921 | 1,740 | 1,452 | -24% |
| Tennessee | 73,763 | 61,067 | 57,185 | -22% | 19,763 | 16,038 | 17,955 | -9% |
| Texas | 222,162 | 169,436 | 145,232 | -35% | 56,169 | 37,965 | 35,747 | -36% |
| Utah | 12,613 | -- | 10,769 | -15% | 2,176 | b | a | -- |
| Vermont | 8,401 | 7,969 | 7,366 | -12% | 812 | 914 | 807 | -1% |
| Virgin Islands | 1,298 | a | 1,184 | -9% | 79 | a | a | -- |
| Virginia | 55,260 | 48,617 | 42,718 | -23% | 17,577 | 8,926 | 9,874 | -44% |
| Washington | 94,619 | 87,488 | 77,762 | -18% | 18,663 | 14,342 | 14,241 | -24% |
| West Virginia | 34,747 | -- | 17,351 | -50% | 7,830 | b | a | -- |
| Wisconsin | 44,345 | 33,555 | 14,649 | -67% | 12,260 | 10,101 | b | -- |
| Wyoming | 3,084 | 1,744 | 1,247 | -60% | 832 | 596 | 579 | -30% |
Note: Depending on the timing of their implementation of TANF, not all states were required to report TANF data for July-September, 1997
a: Data not reported
b: Data reported, but not reliable
It is important to note that we are relying on AFDC Quality Control Data, which is based on sample data, for FY 1996 and the first three quarters of FY 1997 (October 1996 - June 1997). For states with small total AFDC populations or small child-only caseloads this data is less reliable. For FY 1998, we are using the first full year of emergency TANF data. Although extensive work has been done by ACF to ensure its accuracy, there may be some problems with the reliability of all of the numbers as well as comparability between the two data systems. Four states and two territories either did not report data on the number of child-only cases during one of these time periods or the data was not determined reliable.
Why did the number of child-only cases increase during the early 1990s?
As shown in Table E, the childonly caseload grew by almost 150 percent from 367,000 cases in 1988 to 909,000 cases in 1997. Approximately 28 percent of the increase was due to increases in the number of child-only cases with the parents receiving SSI, and 25 percent was due to increases in the number of no-parent cases, with the other categories accounting for the remainder.
| Year | Total number of families | Child-only cases | ||||||
|---|---|---|---|---|---|---|---|---|
| No parent | Parent Present | Total | ||||||
| SSI | Non-citizen | Sanction | Other | Total | ||||
| 1988 | 3,748 | 206 | 62 | 41 | 14 | 45 | 162 | 367 |
| 1991 | 4,312 | 263 | 96 | 87 | 36 | 60 | 279 | 543 |
| 1994 | 4,984 | 321 | 176 | 145 | 62 | 118 | 501 | 822 |
| 1997 | 4,058 | 341 | 214 | 145 | 75 | 134 | 568 | 909 |
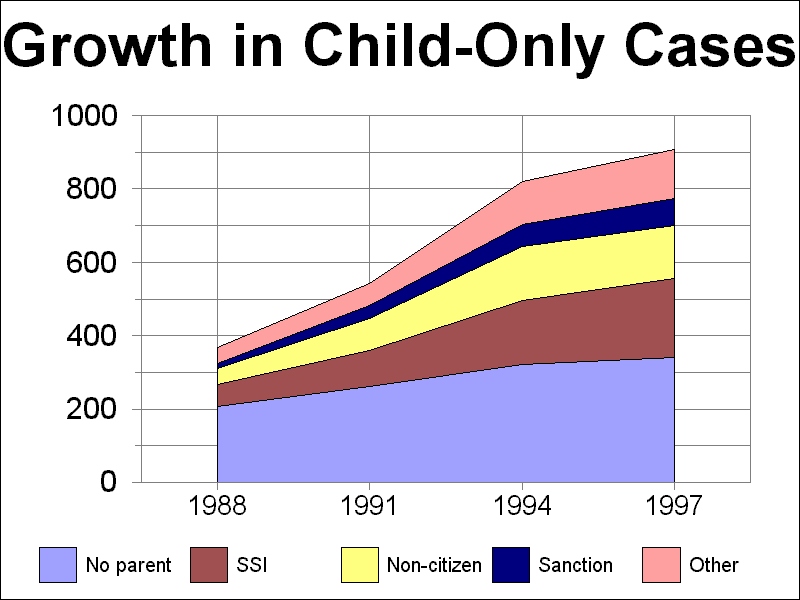
All categories of child-only cases grew during this period, but the greatest percentage growth was in those categories of childonly cases with parents in the household but not in the assistance unit. While no-parent cases grew by just 66 percent in this period, parent-present child only cases grew by over 250 percent. As a result, no-parent cases declined as a proportion of child-only cases from 56 percent to 38 percent.
Among the reasons for the increase that have been suggested by State and federal officials are:
- Changes in federal SSI eligibility, and states encouraging AFDC recipients with disabilities to apply for SSI;
- Changes in immigration policies leading to more participation by citizen children of ineligible parents;
- Expansion of mandatory work and other requirements on AFDC recipients, leading to higher sanctioning rates; and
- AIDS and the use of crack and other drugs leading to more children living in kinship care.
Why are child only cases declining less quickly than other cases?
It is not surprising that child-only cases are declining less quickly than other cases, because they have not been affected by most of the policy changes that have taken place in recent years. Child-only cases are not subject to time limits, and in most states, the responsible adults are not required to participate in work activities. Even if an adult in the household is employed, his or her income will, in most cases, not affect the child's eligibility for TANF benefits.
The increased strictness of sanction policies may affect child-only cases, but it is not clear whether it should cause them to increase or decrease. Under AFDC/JOBS, the basic sanction was the removal of the noncomplying adult from the case, resulting in a child-only case. To the extent that the same sanction is imposed under TANF, but more often, the number of child-only cases may increase. To the extent that this sanction has been replaced by fullfamily sanctions, the number of child-only cases may decrease.
Why are child-only cases treated differently than other TANF cases?
In general, states do not impose work requirements or time limits on relative caregivers who do not receive benefits themselves, because they are under no legal obligation to support the child. (If relative caregivers are included in the assistance units, however, and thus the case is not child-only, federal work requirements and time limits do apply. States may use their broad flexibility under TANF to exempt relative caregivers from state requirements and may support them using Stateonly funds.) If work requirements are imposed on such caregivers, they may choose not to house and support the children. In general, it would be much more expensive for states to care for these children through the formal foster care system. Some observers have expressed concern, however, that these policies may have the unwanted effect of encouraging parents to walk away from their children, leaving them in the care of grandparents or other relatives.
Other kinds of child-only cases are not expected to work for other reasons. SSI recipients, by definition, have a disability that is severe enough that they are not expected to be able to support themselves through work. Undocumented aliens can not legally be employed.
How is kinship care different from foster care?
There are a growing number of U.S. families in which both of a child's parents are absent and the child is being raised instead by a grandparent or other nonparent caregiver. In 1994 there were 2.15 million U.S. children (3% of all children under age 18) living in the care of relatives without a parent present, a proportion that varies substantially among the States. Such living arrangements are known as kinship care. Kinship care is more prevalent among African American children than among white children or Hispanic children of either race, and is more prevalent in the South than in other parts of the U.S. Relatives providing kinship care may receive assistance through TANF or through Federal or State foster care programs. Most children living with a relative caregiver, without a parent present, do not receive any cash assistance, even though many of them may be eligible.
In most states, relative caregivers may apply for TANF benefits on behalf of the child while they themselves are not part of the assistance unit. These families make up the largest category of childonly cases. Relative caregivers may also apply for assistance themselves. (Under AFDC, only specified relatives could apply for benefits on behalf of a dependent child; under TANF, there is no federal requirement to this effect, although many states are continuing the former policy.)
Those caring for children in foster care may be receiving benefits to support the child either through TANF or the Federal title IV-E foster care program, but not both. Payments through title IV-E are generally much higher than those available through TANF, but in order to receive such payments: (a) the child must be in foster care (i.e. the State rather than the relative or the parent(s) have legal custody of the child); (b) the home must be licensed or approved according to the State's foster care licensing criteria; and (c) the family from which the child was removed must have been welfareeligible according to the AFDC eligibility criteria in place as of July, 1996. In some cases the homes fail to meet licensing criteria (e.g. requirements regarding physical space in the home) or the child was placed in State custody long after the caregiver had already begun caring for the child informally, in which case the child would not have been "removed" from an eligible household. In these cases, Federal foster care reimbursements would not be available and the State may elect to provide either foster care reimbursement without Federal match or to support families through TANF instead. Additionally, some states are establishing separate TANF programs for kinship providers with benefit levels higher than the standard child-only allotments.
What does the TANF Final Rule say about child-only cases?
In keeping with the overall TANF policy of state flexibility, the Final Rule, published on April 12, 1999, does not regulate on the definition of a family or on which household members must be included in an assistance unit. States have broad freedom to define these terms.
Reflecting concerns that States might undermine the federal work participation rates and time limits by excluding adults (particularly parents) from their eligible cases, the TANF Data Report includes an element that will identify the specific cases in the disaggregated sample that have become child-only cases. This will allow HHS and other interested parties to examine the circumstances causing cases to become child-only and to determine whether this issue requires further attention.
What is HHS doing to understand child-only cases?
HHS routinely tabulates and analyzes the administrative data reported by states on the characteristics of their caseloads. At present, under the Emergency TANF Data Report, States are only required to report a limited set of data, which does not include information about household members who are not part of the assistance unit. Starting in FY 2000, when the data reporting requirements under the Final Rule take effect, much more detailed information will be available.
In order to understand trends in child-only cases in more detail than is possible using administrative data, ASPE has funded a study this caseload in three states. Researchers will conduct case file reviews and discussions with officials and staff in order to understand the current makeup, the trends of growth in this caseload and changes in policy or demographics which may have precipitated the growth. While this project will give us information only relevant to three states, we believe that this in-depth on-site review is necessary to thoroughly understand the composition, growth and the policies regarding these TANF cases and that three states, prudently selected, will give us valuable information about a substantial portion of this caseload. The states included in the study are California, Missouri, and Florida. This study is being conducted by the Lewin Group and a final report should be completed by November 1999.