


KEY POINTS
- The average state provider tax law, which typically taxed a hospital up to 3.5 percent of net patient revenue, resulted in an increase in ESI premiums of 1.5-1.7 percent, plus any spillover effect on interstate markets for provider resources.
- By 2026, most states had increased the hospital provider tax rates, with 33 of 47 states imposing a tax that exceeds 3.5 percent of net patient revenue.
- These findings suggest that the 2025 Working Families Tax Cut (WFTC) legislation may reduce ESI premiums by up to 2.2-2.5 percent by 2032 by lowering the provider tax safe-harbor threshold from 6 percent to 3.5 percent.
- Extrapolating from the literature this is a 0.5–0.6 percent increase in wages, or about $640-$730 in increased wages per year for the average household with ESI, in addition to their premium savings.
INTRODUCTION
Employment-sponsored health insurance (ESI) premiums have risen significantly over the past 25 years, far exceeding the rate of inflation. Coinciding with these premium increases, the price of medical care has also grown, with prices for hospital services increasing most rapidly. Prices paid for hospital services nearly doubled from 2006-2024, far exceeding the increases for prescription drugs and professional services.1 In addition to having the largest price increases, hospital services account for the largest share of spending among individuals with ESI, representing 56-57 percent of spending from 2016-2019 and serving as a primary driver of ESI premium growth.2
The impact of Medicaid provider taxes on commercial prices remains underexplored. Two Health Affairs Forefront articles argue that provider taxes and state-directed payments (SDPs) they fund create incentives for state regulators to ignore or even support hospitals raising commercial prices, as this increases Medicaid payments which are increasingly tied to commercial prices. 3,4 Through higher Medicaid payments, states maximize federal dollars coming into the state to fund Medicaid.5 By strengthening hospitals' financial position relative to independent physician practices, these policies potentially accelerate vertical consolidation, which has been identified in the literature as an important driver of hospital care cost growth.6,7,8
A recent analysis from the Department of Health and Human Services examined the role of hospital provider taxes in hospital pricing and estimate that these taxes change prices by approximately 1.41 percent for each percentage point change in the provider tax rate.9 In economic fashion, it emphasizes marginal costs and scarcity in markets for provider inputs. An alternative perspective emphasizes accounting. It suggests that provider taxes are not conventional taxes but instead financing mechanisms for Medicaid payments- namely the providers tend to get back (through an SDP) what they pay through provider taxes. In this view, provider taxes and SDPs provide the funding for providers to increase commercial prices less than they would otherwise or keep them constant. This paper helps resolve the debate by testing the alternative hypotheses empirically. If provider taxes and SDPs together fund commercial price reductions, we should find a reduction in ESI premiums following tax implementation. Alternatively, if commercial prices move with the marginal cost of serving commercial patients, we should find an increase in ESI premiums following provider-tax implementation.10 Prior to turning to our formal analyses, we first briefly explain how states use provider taxes and SDPs.
The Medicaid program is jointly financed by the federal government and states, with states contributing between 21 and 45 percent of total Medicaid spending in FY 2024.11 To help fund their share of Medicaid expenditures, nearly all states use taxes on health care providers, with taxes on hospitals being the most common. By law, these taxes must be “broad-based”- levied not only on Medicaid revenue.12 Because the provider tax payments are based on revenue or quantity supplied, they create a marginal cost— additional expenses for each beneficiary served—to health care providers. Importantly, hospitals generally receive the tax paid back in the form of an SDP which is used to increase Medicaid reimbursement rates, increasing the marginal revenue of supplying services to those with Medicaid coverage, but importantly not to those without Medicaid coverage (including those with ESI). Appendix Figure 1 demonstrates how a provider tax coupled with an SDP is expected to result in higher prices for those with ESI.
Provider taxes may increase ESI premiums because they are a marginal cost and therefore increase prices paid for non-Medicaid payers, and this price increase can be passed through to premiums. Provider taxes also fund SDPs which are payments that are increasingly set as a function of average commercial rates, which encourages providers to increase commercial rates to secure higher Medicaid payments which then flows into higher ESI premiums.6,7 In addition, by increasing Medicaid payments and therefore care provided to those with Medicaid, supply of services for those without Medicaid will decrease, increasing prices and premiums (Appendix Exhibit 1).13,14 On the other hand, provider taxes have typically been used to fund SDPs and sometimes used to finance Medicaid expansion. Through expansion, formerly uninsured individuals gained Medicaid coverage, which in turn reduced uncompensated care costs for hospitals and could thereby reduce commercial prices and ESI premiums.15 Through SDPs, hospitals receive higher Medicaid reimbursement which may be a commercial price-reducing subsidy. This study represents the first empirical test of these two competing hypotheses.
From 2009-2026, 24 states implemented provider taxes on hospitals (Figure 1). Most (18/24=75 percent) were implemented in the lead up to 2014 Medicaid expansion. Others were implemented after to finance later Medicaid expansions. For example, the Virginia legislature explicitly notes that a provider tax on acute care hospitals pays for the state’s 10 percent share of Medicaid expansion costs.16 When adopted most states applied a tax not exceeding 3.5 percent. Over time, rates were generally increased and 33 states now have a tax on hospitals between 3.5 and 6 percent (Table 1).17
Figure 1: Number of States with a Hospital Provider Tax
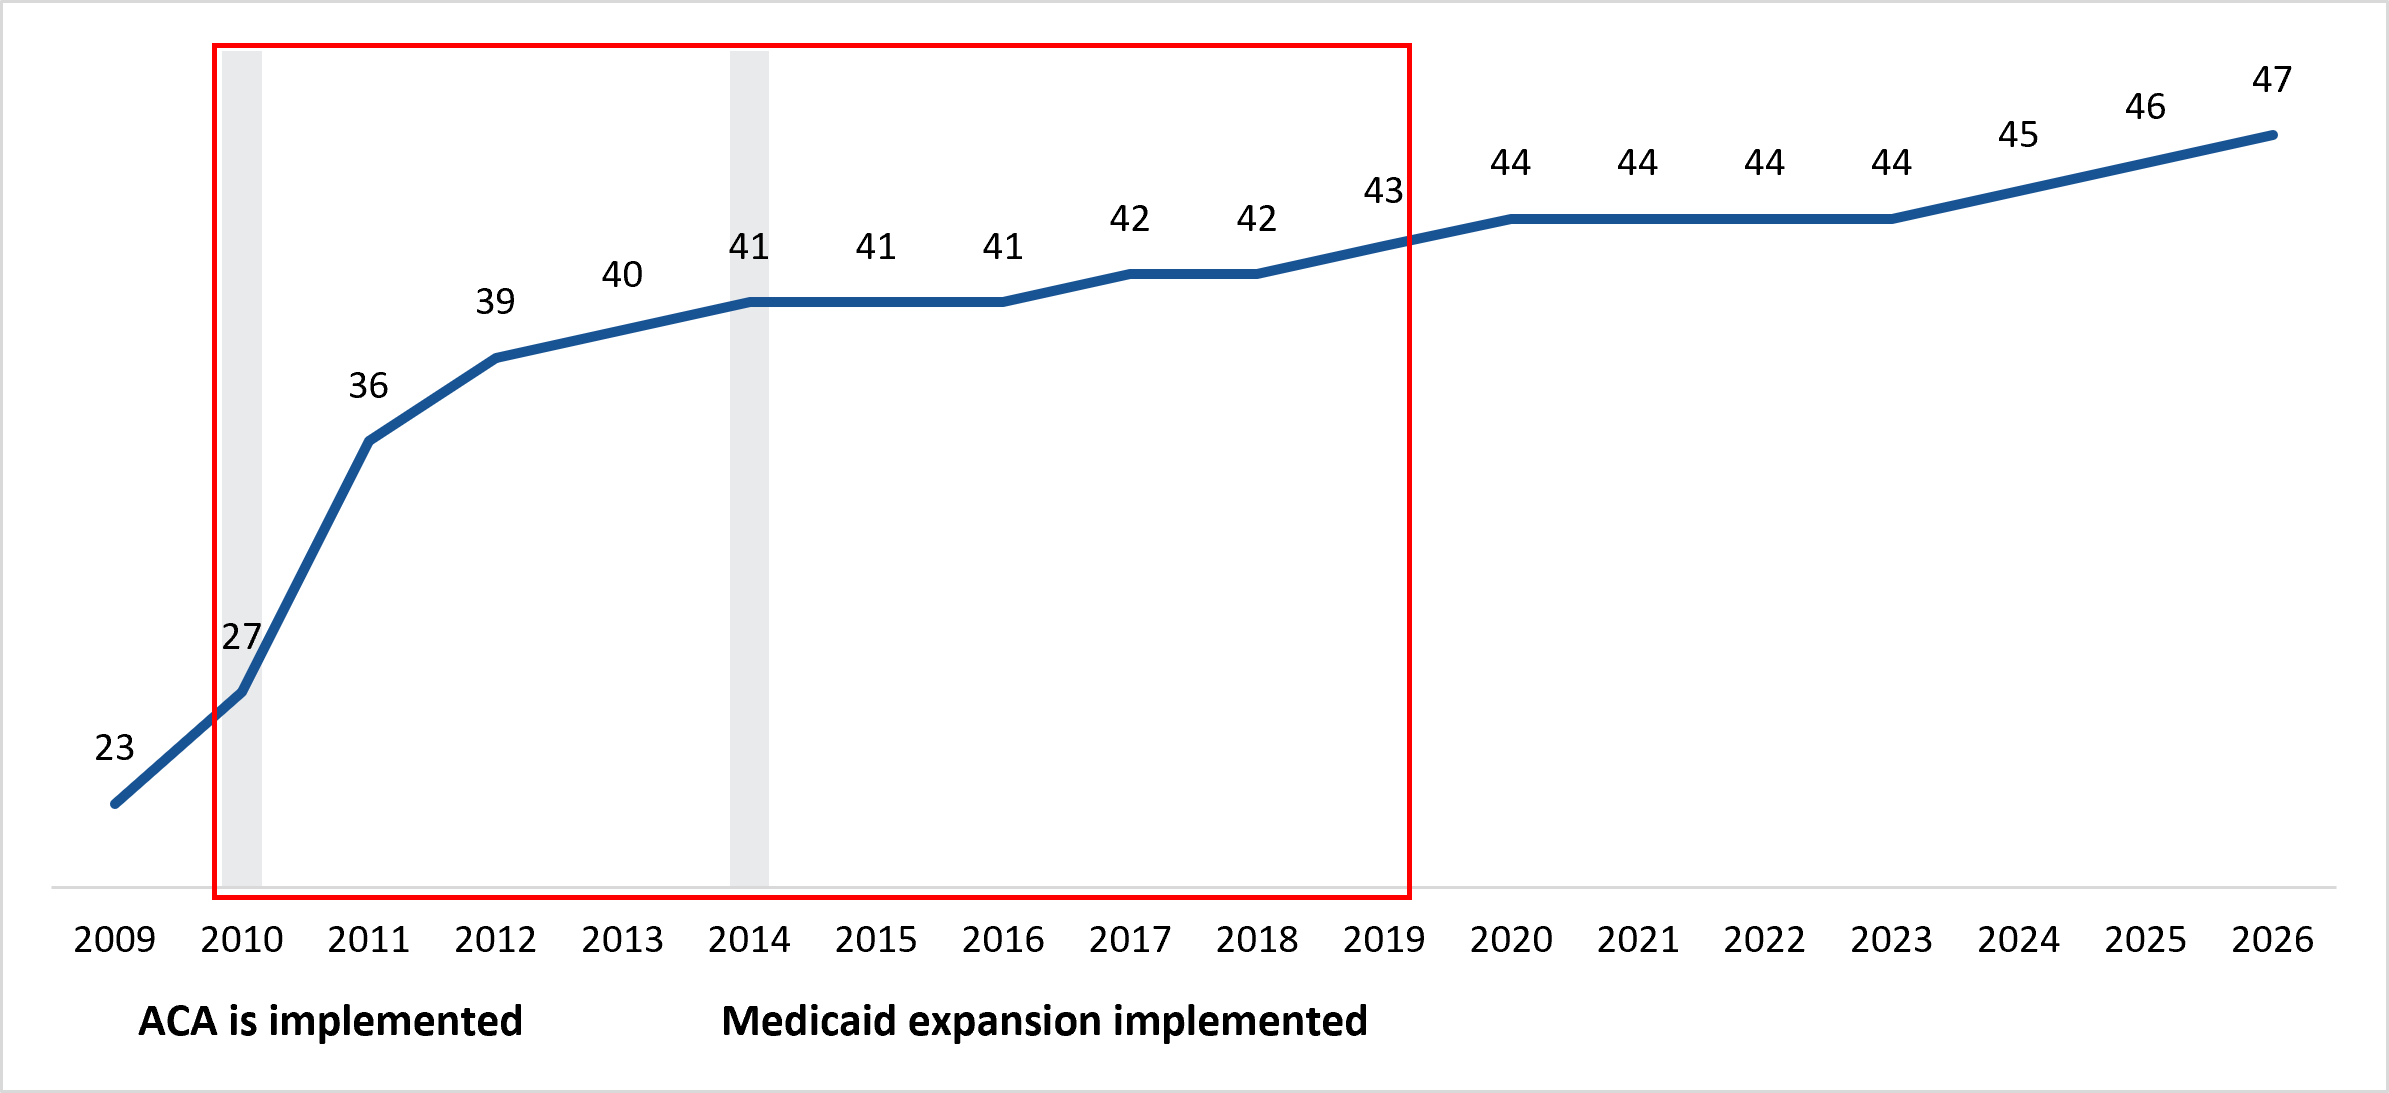
Note: Red box shows the hospital provider tax laws studied in this paper. Counts based on author analysis or KFF Medicaid Budget Survey Data.
DATA AND METHODS
For this study we used state level data from the Medical Expenditure Panel Survey- Insurance Component (MEPS-IC).18 MEPS-IC is an annual survey of private employers and state and local government. Importantly for our research, MEPS-IC includes information on total premiums cost for individual ESI coverage, by state, as well as by employer size, for workers in the private sector (85 percent of the workforce).
While 23 states passed hospital provider taxes pre-2010, our sample period spans 2003 to 2019, and evaluates state provider taxes implemented from 2010-2019, to be able to measure the effect of the most contemporaneous wave of hospital provider tax laws for external validity. In particular, a sample period that includes the implementation of the 2010 Affordable Care Act (ACA) and follows the labor market disruption of the 2008-2009 Great Recession provides a sample that we can justify extrapolating findings from for the present day. We also restrict the sample to pre-2020 in order to avoid confounding of effects from 2020 COVID-19 Public Health Emergency (PHE), given that a number of federal policies were passed that could have independently impacted hospital prices and ESI premiums, such as the passage of hospital subsidies and continuous Medicaid enrollment as part of the 2020 Families First Coronavirus Act (FFCRA).19
We also relied on KFF Medicaid Budget Surveys, which we cross-reference with our own environmental scans using generative AI (Perplexity and ChatGPT) to compile a list of states that implemented hospital provider taxes and their relative years of implementation.20 Our scan matched KFF with one exception. Table 1 provides the state level adoption dates we used for our analysis and compares them to KFF adoption dates.
Table 1: State Adoption of Hospital Provider Taxes, 2010-2019
| State | Year 1st Assessed (Author analysis) | Year 1st Assessed (KFF analysis) | Rate at Adoption | Change over time |
|---|---|---|---|---|
| Alabama | 2010 | 2010 | <=3.5% | + |
| Arizona | 2014 | 2014 | <=3.5% | + |
| Arkansas | 2010 | 2010 | <=3.5% | no change |
| California | 2011 | 2011 | <=3.5% | + |
| Colorado | 2010 | 2010 | <=3.5% | + |
| Connecticut | 2012 | 2012 | 5.5-6% | no change |
| DCτ | 2011 | 2010 | <=3.5% | no change |
| Georgia | 2011 | 2011 | <=3.5% | no change |
| Hawaii | 2013 | 2013 | <=3.5% | no change |
| Indiana | 2012 | 2012 | <=3.5% | + |
| Iowa | 2011 | 2011 | <=3.5% | + |
| Louisiana | 2017 | 2017 | <=3.5% | + |
| New Jersey | 2010 | 2010 | <=3.5% | + |
| North Carolina | 2011 | 2011 | <=3.5% | + |
| Oklahoma | 2012 | 2012 | <=3.5% | + |
| Tennessee | 2011 | 2011 | <=3.5% | + |
| Utah | 2011 | 2011 | <=3.5% | + |
| Virginia | 2019 | 2019 | <=3.5% | no change |
| Washington* | 2011 | 2010 | <=3.5% | no change |
| Wyoming | 2011 | 2011 | <=3.5% | no change |
τ We used 2011 as the year tax was first assessed for DC since our analysis of DC budget records indicate that DC did not collect any revenue from its DC bed tax till 2011. Source: (Tables 1 and 2) https://www.lincolninst.edu/app/uploads/legacy-files/gwipp/upload/sources/DC/2011/DC_Tax_Facts_by_Office_of_Revenue_Analysis_2011.pdf. *The WA legislature created a Hospital Safety Net Assessment (HSNA) Program in 2010; whereas the hospital payments/safety net was established in 2011. Source: https://lawfilesext.leg.wa.gov/biennium/202122/Htm/Bill%20Reports/Senate/1316%20SBA%20WM%2021.htm
Our analysis sample consists of 448 state-year observations, with 28 states observed over 16 years. During this sample period, 20 states passed a hospital provider tax, while 8 states had not adopted a hospital provider tax by 2019.21 Four of these states passed laws from 2020-2026 (NE, NV, NM, TX) and four never did (AK, DE, ND, SD). This provides us with natural treatment and control groups, with states that adopted from 2010-2019 (20 states) serving as the treatment groups and states that never or had not yet adopted by each respective treatment year [2010, 2011, 2012, 2013, 2014, 2017, 2019], representing the control groups. Given that our study design leverages this staggered treatment adoption, we use the Callaway Sant’Anna Difference-in-Difference (DiD) estimation strategy.22
Our model controls for state fixed effects as well as year fixed effects to account for time trends in ESI premiums, especially as the ACA passed during our sample period. However, we note that year-fixed effects capture some of the causal effect, particularly to the extent that providers in different states compete for personnel and other resources. That is, the coefficient on the policy variable in a specification with year fixed effects understates the national effect.
We also control for the state unemployment rate among 18–64-year-olds since states recovered at different rates following the Great Recession and this may independently impact ESI premiums by changing the risk pool or the types of plans being offered by employers.23 The standard errors are clustered at the state level as this is the unit of treatment.24 To account for differences in the price of ESI across states, the main dependent variable is natural log of the state-level ESI premium for single coverage. We use the single coverage premium as the outcome to avoid picking up the effect of the 2010 ACA dependent coverage mandate on family premiums.25,26 Further model details are available in the Appendix.
LIMITATIONS
The MEPS-IC does not provide state level estimates on premiums in the public sector workforce, leaving out 12 percent of the ESI population.27 Our results are also limited to those with ESI and results may be different for the Marketplace population since all marketplace plans are subject to a medical loss ratio (MLR) of 80 percent, whereas 60 percent of ESI plans are exempt given they are self-funded. Finally, the data on premiums is among employers that offer health insurance. Changes in provider taxes could indirectly affect which employers continue to offer ESI, especially small firms. If higher provider taxes lead some employers to drop coverage, the remaining sample of offering employers in MEPS-IC may shift toward larger firms and could lead to a compositional change in average premiums post tax adoption. We compare premiums among small (<50 employees) and large employers (50+) during our sample period and note there is a negligible difference (<1 percent) in their single coverage premiums, suggesting this compositional effect will have little to no effect on our estimates.
FINDINGS
Figures 2 and 3 present descriptive analyses showing premium changes before and after hospital provider tax adoption for the 2012-2019 and 2006-2013 periods, respectively, by treatment status. Given the fact that states adopted these taxes in a staggered fashion from 2010-2019, we don’t have a singular treatment and control group which is why we show trends in premiums in two distinct time periods, with two distinct treated and control groups.28 Figure 2 shows premium trends in a state that implemented provider tax in 2017 relative to states that adopted taxes in 2019 or later, or never did, from 2016-2019. Prior to tax implementation in 2017, premiums increased to a similar extent in this state and in control group states (4.3-4.9 percent). From 2012-2016, ESI single premiums cumulatively increased more in control groups states, relative to the state that adopted in 2017 (13.5 percent relative to 6.4 percent, respectively). From 2016-2019, ESI single premiums cumulatively increased more in the state that adopted in 2017, relative to the control group states (16.3 percent and 13.6 percent, respectively) (Figure 2).
Figure 2: Percent Changes in ESI Premiums, Before and After Hospital Provider Tax Adoption in 2017, by Treatment Status
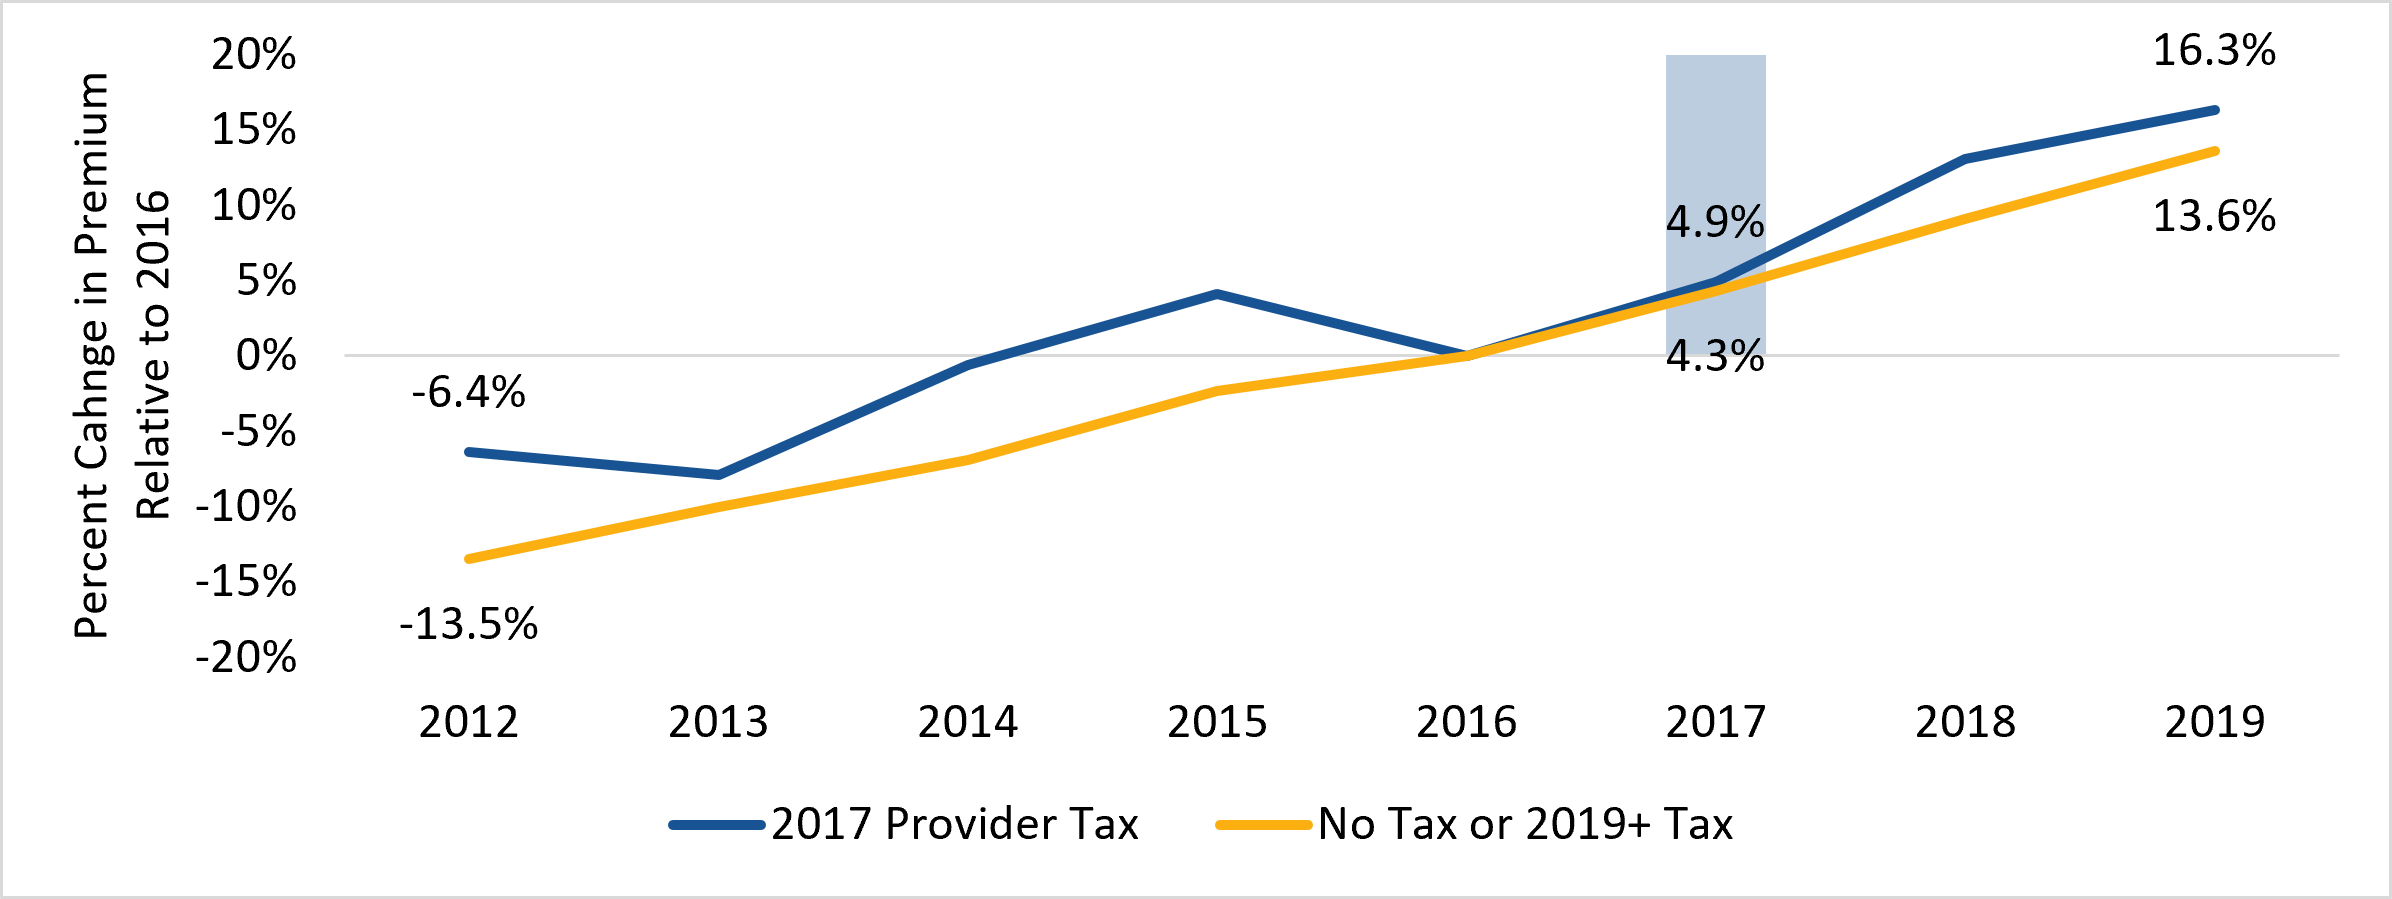
Notes: Data come from 2012-2019 MEPS Insurance Component (MEPS-IC). Treated state is a state that adopted a provider tax in 2017. Control group states are AK, DE, ND, SD, and VA. We assume no immediate effect which is why we include states that adopted a provider tax law in 2019 in the control group and use all years through 2019. Restricting the sample to 2016-2018 yields identical results.
In Figure 3 we show premium changes from 2006-2013 among states that adopted these laws in 2010 or 2011 (13 states), relative to a control group of states that never adopted or adopted in 2013 or later.29 This analysis makes clear that from 2006-2009, ESI premiums among states in our control group had similar cumulative growth in premiums as compared to states that adopted provider taxes (13 vs 12 percent or 4.3 (13/3) vs 4 (12/3) percent per year, respectively). From 2010-2013, the annual ESI premium growth rate among control group states slowed to 3.6 percent per year [(19.4-8.7)/3]. By comparison, the annual ESI premium growth rate among states that adopted hospital provider taxes in 2010 or 2011 increased to 4.7 percent per year [(18.5-4.5)/3].
Figure 3: Percent Changes in ESI Premiums, Before and After Hospital Provider Tax Adoption in 2010 or 2011, by Treatment Status
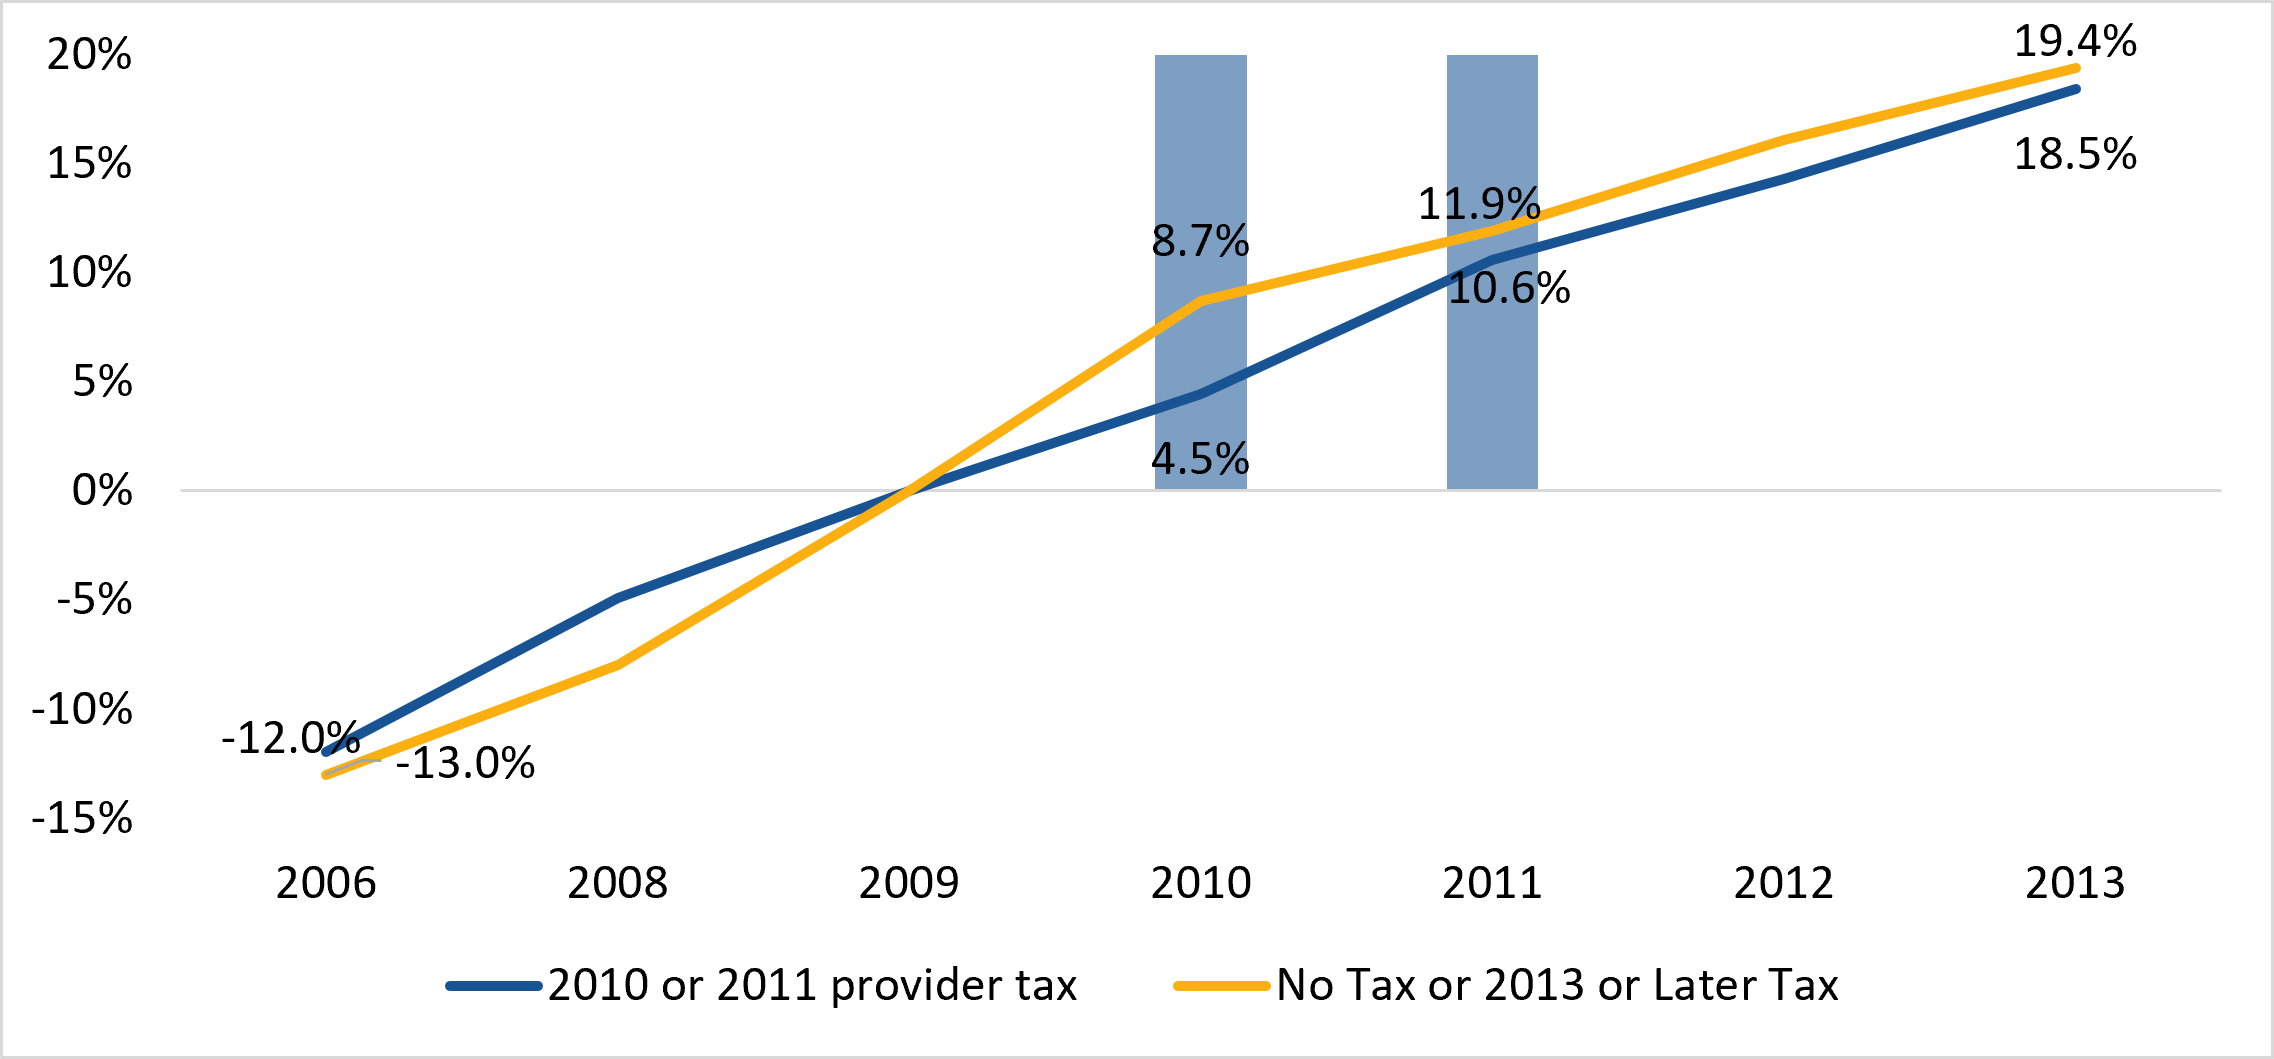
Notes: Data come from 2006-2013 MEPS Insurance Component (MEPS-IC). Treated states are (AL, AR, CA, CO, DC, GA, IA, NJ, NC, PA, TN, UT, WA, WY (Control group states are AK, AZ, DE, HI, LA, NE, NV, NM, ND, SD, TX, and VA.) We assume no immediate effect which is why we include states that adopted a provider tax law in 2013 in the control group and use all years through 2013. Restricting the sample to 2006-2013 yields identical results. MEPS-IC data was not collected in 2007.
These descriptive analyses provide suggestive evidence that hospital provider taxes may have contributed to ESI single coverage premium increases. We formally test this using a staggered treatment adoption DiD analysis and present our findings in Table 2.
Table 2 presents our main estimates from the staggered adoption DiD model (Column 1). The average treatment effect on the treated (ATT) indicates that ESI premiums for single coverage increased by 1.7 percent following the implementation of a hospital provider tax, which is similar in magnitude and not statistically different from the group average treatment effect of 1.5 percent. Overall, our main results indicate that hospital provider taxes generally increase premiums.
In a sensitivity analysis, we also re-estimated our main model using only not-yet treated states as the control group as these states may be a better counterfactual for states that implement taxes as compared to those that don’t (Column 2). The results from this model are qualitatively similar to our main findings: hospital provider taxes increase ESI premiums.30
Our primary ATT and group average treatment effects in Table 2 can be used to back out a hospital price change associated with a hospital provider tax. For this calculation, we use a premium increase of 1.6 percent (average of 1.5 and 1.7). We also assume (1) a MLR of 85 percent in the large group market, (2) a MLR of 80 percent in the small group market, (3) the share of ESI plans in the small group market (<50 employees) is 27.5 percent, and (4) the share of ESI plans that are in the large group market (>=50 employees) is 72.5 percent (Based on 2015 small group vs large employment shares and 2015 simple loss ratios).31,32 Finally, we assume hospital claims spending accounts for 56 percent of total ESI claims in this sample period.2 This indicates that if 85 percent of the premium goes to paying healthcare claims in the large group ESI market, then the hospital price increase in this market segment is 2.43 percent [0.85*1.6*(100/56)].2 In the other (small-group) market segment, we assume 80 percent of premium is spent on paying claims so the hospital price increase is 2.29 percent [0.8*1.6*(100/56)].
On average, the estimated hospital price increase is about 2.4 percent [0.725(2.43) + 0.275(2.29)]. A recent ASPE report indicates that each percentage point change in the provider tax rate changes prices by 1.41 percent. Given that prices are estimated to have increased by 2.4 percent as result of the hospital provider taxes studied, this implies that the tax rate is 1.7 percent (2.4/1.41). This is approximately the midpoint of the tax rates set at adoption in our sample (Table 1). To summarize, we find that ESI single coverage premiums increased by 1.5-1.7 percent, at an average implied rate of 1.7 percent. This indicates that each percentage point of tax raises ESI premiums by 0.88-1 percent.
Table 2: CSDID ATT, and Average Group Effects, Outcome: Ln(ESI Single Coverage Premium)
| (1) | (2) | |
|---|---|---|
Main Specification Control Group= Never + Not Yet Treated | Alternative Specification Control Group= Not Yet Treated | |
| Estimate | Coefficient (SE) | Coefficient (SE) |
| Average Treatment Effect on Treated (ATT) | 0.017* (0.009) | 0.022** (0.010) |
| Group Average Treatment Effect | 0.015** (0.008) | 0.021*** (0.008) |
| # of Observations | 448 | 384 |
Notes: Regression includes state FEs, year FEs, and controls for state-year unemployment rate. Data from 2003-2019. Standard errors clustered at the state level. 20 states implemented provider taxes from 2010-2019.
Our event study estimates in Figure 4 indicate that, conditional on covariates, premium costs were not trending differently prior to hospital provider tax adoption in states that implemented taxes relative to those that never and had not yet implemented taxes. This is evidence in favor of the conditional parallel pre-trends assumption holding and the interpretation of our parameters as causal estimates of the premium effect of hospital provider taxes. The post treatment coefficients indicate that the premium effect appears one year after tax implementation, consistent with insurance price adjustments having a one-year lag relative to price changes. The increased premium effect is then roughly constant over time, increasing by an average of 2.6 percent 1-2 years post implementation, before falling about 46 percent to 1.4 percent 3-5 years post tax implementation. This pattern is consistent with Medicaid expansion lowering uncompensated care costs at hospitals.16
Most states in our sample period adopted these taxes 3-4 years prior to the 2014 Medicaid expansion, so the coefficients showing the effects 3-5 years post provider tax adoption also reflect effects of Medicaid expansion. On average, the effect in this period (3-5 years post) is still positive but smaller than 1-2 years post adoption, suggesting that expansion ameliorates the commercial price and premium effects through reductions in uncompensated care. However, the effect of increased commercial prices still dominates.
Figure 4: Event Study Estimates of Impact of Provider Taxes of ESI Premiums

Notes: Regression includes state FEs, year FEs, and the state-year unemployment rate. Standard errors clustered at the state level. Figure shows point estimates as well as 95 percent confidence intervals.
DISCUSSION
Considerable research has highlighted that rising health care costs and premiums have reduced wage growth.33,34,35,36,37 This study provides evidence that hospital provider taxes raise ESI single coverage premiums, thereby increasing health care costs for the 181 million Americans covered by ESI and their employers.38 Therefore, a policy like the 2025 Working Families Tax Cut (WFTC) legislation that lowers health care costs for Americans will have a twofold impact on affordability; less spending on premiums and higher take-home wages. By lowering the provider tax safe-harbor threshold from 6 percent to 3.5 percent, the legislation would not only produce direct premium relief but could also slow the feedback loop between Medicaid payment policy and commercial price inflation by limiting new SDPs to set Medicaid payments at no more than 100-110 percent of the Medicare rate and delinking them from the average commercial rate. We estimate ESI premiums reductions up to 2.2 (0.88*2.5) -2.5 (1*2.5) percent when fully implemented, relative to a counterfactual of no-WFTC legislation.39,40 Extrapolating from the literature this is a 0.5–0.6 percent increase in wages,41 or about $640-$730 in increased wages per year for the average household with ESI, in addition to their premium savings.42
Our findings contribute to an emerging literature documenting the spillover effects of Medicaid financing mechanisms outside the Medicaid program itself. Provider taxes are often viewed as a way for states to draw down additional federal Medicaid funding with limited consequences for non-Medicaid populations because the taxes are largely returned to providers through higher reimbursement rates via SDPs. Our findings indicate that provider taxes raise marginal costs and fund price-increasing Medicaid payments. As states have increasingly relied on provider taxes and SDPs to finance supplemental payments and sometimes used to finance Medicaid expansions, these spillover effects have become more consequential. When assessing Medicaid financing policies, policymakers and analysts should consider not only their direct effects on state and federal budgets, but also their indirect effects on ESI, the broader commercial insurance market, and working American families.
TECHNICAL APPENDIX
The Supply-Demand Relationship Between Provider Taxes, SDPs, and Non-Medicaid Prices in the Inpatient Health Care Market
Appendix Figure 1 presents demand and residual supply curves for the inpatient hospital services market and illustrates the potential impact of provider taxes and SDPs on non-Medicaid prices. Residual supply refers to the hospital market’s capacity to provide care to other payers—such as privately insured, Medicare, or self-pay patients—after Medicaid's demand for hospital services has already been met. The main assumption we make is that the tax is levied on all hospitals regardless of payer mix.43
The non-Medicaid price of inpatient health care services is shown on the vertical axis, while non-Medicaid healthcare use (i.e., the quantity of services provided) is shown on the horizontal axis. Demand for health care services is a downward sloping line, reflecting the fact that patients generally use more health care services as prices fall. Residual supply for health care services is an upward sloping line, reflecting the fact that the hospital market provides more services when those services are better compensated. The equilibrium price and quantity in the market for hospital services occurs where these two lines intersect (P* and Q*).44
Appendix Figure 1: The Market for Inpatient Hospital Services
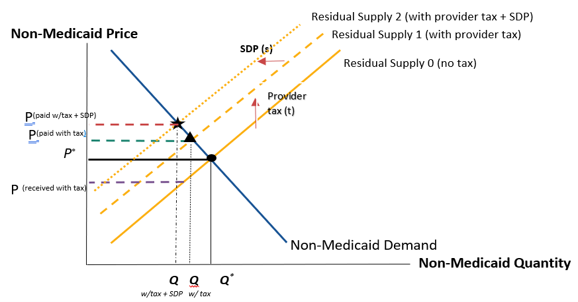
We show the effect of a tax on hospitals—specifically, a per-unit sales tax by shifting the original residual supply curve (“Residual Supply 0 (no tax)”) up by the amount of the tax (t) to a new supply curve (“Residual Supply 1 (with provider tax)”). This shows the tax has three consequences:
- There are now two effective prices: the price with the tax that non-Medicaid consumers (patients/insurers) pay: P (paid with tax), and the price net of tax, which hospitals receive: P (received with tax)
- Non-Medicaid consumers and hospitals are worse off with the tax. Before the tax, non-Medicaid patients paid the price P*, which was also what hospitals received for their services. After the tax, patients pay more (P (paid with tax) > P*), while hospitals are paid less for services rendered to non-Medicaid patients than before (P (received with tax) < P*) (“supply price”).
- Finally, non-Medicaid quantity of services is lower than it was pre-tax (Q (with tax) < Q*). This occurs because non-Medicaid patients now pay a higher price, leading to a reduction in health care demand (a movement along the residual demand curve).
While the main purpose of hospital provider taxes is to generate revenues to fund state’s share of Medicaid spending, provider tax revenue may also be used to fund SDPs for hospitals to increase Medicaid compensation rates. As noted above, imposing a tax usually makes firms, or in this case hospitals, worse off as sales and supply prices fall, leading to a decline in total revenue. However, in the unique situation of provider taxes, proceeds from the tax are used to pay the hospitals at higher Medicaid (but not commercial) rates through an SDP. Here we assume that at least some hospitals increase Medicaid volume in response to the higher payment (a supply response to higher Medicaid reimbursement), which has been observed in the prior literature.45, 46, 47, 48, 4950 As Medicaid volume increases, non-Medicaid volume may decrease in response, depending on the extent of provider entry and provider switching from non-Medicaid to Medicaid, which is shown by shifting the Residual Supply 1 curve to the left to Residual Supply 2 curve.51 This has the effect of further increasing non-Medicaid prices (namely; P (paid w/tax + SDP) > P (paid with tax ) > P*). Hospitals being able to raise prices for non-Medicaid patients and receiving revenue from the provider taxes themselves may explain why provider taxes are a rare case where an industry supports taxes being levied on itself.52,53
Staggered Adoption Differences in Differences (DiD) Model Specification
The estimating equation is:
Yst = δDst + βXst + γs + λt + εst
Where:
- Yst is the outcome of interest [Ln(ESI single premium] for state s in year t
- Dst is an indicator variable equal to 1 if state s has adopted the treatment by year t, and 0 otherwise. This variable switches on in the period of adoption and remains 1 in all subsequent periods, capturing staggered (time-varying) treatment adoption across states.
- δ is the main effect of interest: the average treatment effect of adoption.
- Xst is the unemployment rate for state s in year t, included to control for time-varying economic conditions
- γs is a vector of state fixed effects, absorbing all time-invariant unobserved heterogeneity across states
- λt is a vector of year fixed effects, absorbing aggregate time trends common to all states
- εst is an idiosyncratic error term
Main Identifying Assumption
The key identifying assumption is the parallel trends assumption: in the absence of treatment, the average outcomes of adopting and non-adopting (not-yet adopted) states would have followed parallel trajectories over time.
For the Callaway Sant’Anna DiD estimation we need the following assumption:
Conditional Parallel Trends based on “Not-Yet-Treated” Groups
For each(s,t)∈{2,...,T}×{2,...,T},g∈G such that t≥g, s≥t
E[Yt(0)−Yt−1(0)|X,Gg=1]=E[Yt(0)−Yt−1(0)|X,Ds=0,Gg=0] a.s.
This says that absent treatment, states that are about to adopt would have followed the same outcome trends as states that haven't adopted yet, conditional on the included covariates.
REFERENCES
- Kanimian S, Ho V. US Medical Prices and Health Insurance Premiums, 1999-2024. JAMA Network Open. 2025 Dec 8;8(12):e2547462.↩︎
- Health Cost Institute. Use and spending on clinician services in hospital and non-hospital settings [Internet]. [place unknown]: Health Cost Institute; [date unknown] [cited 2026 May 30]. Available from: https://healthcostinstitute.org/all-hcci-reports/hccur-data-point-use-and-spending-on-clinician-services-in-hospital-and-non-hospital-settings/↩︎
- Bai G, Kempski A. North Carolina's Medicaid expansion may expose patients to higher hospital prices. Health Affairs Forefront. 2023 Jun 21. Available from: https://www.healthaffairs.org/content/forefront/medicaid-financing-requires-reform-north-carolina-case-study↩︎
- North Carolina Medicaid Expansion Puts Employers And Workers At Risk For Higher Hospital Prices. Health Affairs Forefront. 2023 Jun 20. Available from: https://www.healthaffairs.org/content/forefront/north-carolina-medicaid-expansion-puts-employers-and-workers-risk-higher-hospital.↩︎
- KFF. Federal Medicaid spending through state directed payments nears 100 billion annually across 41 states, with new limits set to reduce funding to states [Internet]. San Francisco (CA): KFF; 2026 Jun 15 [cited 2026 Jun 15]. Available from: https://www.kff.org/medicaid/federal-medicaid-spending-through-state-directed-payments-nears-100-billion-annually-across-41-states-with-new-limits-set-to-reduce-funding-to-states/.↩︎
- Bai G, Kempski A. Medicaid Financing Requires Reform: The North Carolina Case Study. Health Affairs Forefront. 2024 Available from: https://www.healthaffairs.org/content/forefront/medicaid-financing-requires-reform-north-carolina-case-study↩︎
- North Carolina Medicaid Expansion Puts Employers And Workers At Risk For Higher Hospital Prices. Health Affairs Forefront. 2023 Jun 20. Available from: https://www.healthaffairs.org/content/forefront/north-carolina-medicaid-expansion-puts-employers-and-workers-risk-higher-hospital↩︎
- Richards MR, Seward JA, Whaley CM. Treatment consolidation after vertical integration: Evidence from outpatient procedure markets. Journal of Health Economics. 2022;81:102569. doi:10.1016/j.jhealeco.↩︎
- Mulligan, C.B, Volkov, E., Whitman, A., Lee, A., Malani, A., Knapp, C., Bai, G. An Overview of State-Directed Payments and Medicaid Provider Taxes: History and Potential Effects of the Working Families and Tax Cut Legislation on Health Care Costs. Office of the Assistant Secretary for Planning and Evaluation, U.S. Department of Health and Human Services. June 2026.↩︎
- In both case, premiums and claims move in the same direction. If claims fall due to lower prices, premiums fall. If claims rise due to higher prices, premium rises.↩︎
- Kaiser Family Foundation. Federal and state share of Medicaid spending [Internet]. San Francisco (CA): KFF; c2025 [cited 2026 Jun 8]. Available from: https://www.kff.org/medicaid/state-indicator/federalstate-share-of-spending/↩︎
- Medicaid and CHIP Payment and Access Commission (MACPAC). Health care-related taxes in Medicaid [Internet]. Washington (DC): MACPAC; 2021 May [cited 2026 Jun 24]. Available from: https://www.macpac.gov/wp-content/uploads/2020/01/Health-Care-Related-Taxes-in-Medicaid.pdf↩︎
- Neprash HT, Zink A, Sheridan B, Hempstead K. The effect of Medicaid expansion on Medicaid participation, payer mix, and labor supply in primary care. Journal of Health Economics. 2021 Dec;80:102541. Available from: https://doi.org/10.1016/j.jhealeco.2021.102541↩︎
- Tipirneni R, Rhodes KV, Hayward RA, Lichtenstein RL, Choi HJ, Reamer EN, et al. Primary care appointment availability and nonphysician providers one year after Medicaid expansion. American Journal of Managed Care. 2016;22(6):427-431. Available from: https://www.ajmc.com/view/primary-care-appointment-availability-and-nonphysician-providers-one-year-after-medicaid-expansion↩︎
- Dranove D, Garthwaite C, Ody C. Uncompensated care decreased at hospitals in Medicaid expansion states but not at hospitals in nonexpansion states. Health Affairs (Millwood). 2016;35(8):1471-1479. Available from: https://pubmed.ncbi.nlm.nih.gov/27503973/↩︎
- Virginia House Appropriations Committee. Medicaid [Internet]. Richmond (VA): Virginia General Assembly; [cited 2026 Jun 9]. Available from: https://hac.virginia.gov/subtopics/health-and-human-resources/medicaid/↩︎
- Hinton E, Williams E, Raphael J, Mudumala A, Rudowitz R, Gifford K, et al. Results from an annual Medicaid budget survey for state fiscal years 2025 and 2026 [Internet]. San Francisco (CA): KFF; 2025 Nov 13 [cited 2026 Jun 1]. Available from: https://files.kff.org/attachment/report-results-from-an-annual-medicaid-budget-survey-for-state-fiscal-years-2025-and-2026.pdf↩︎
- Agency for Healthcare Research and Quality. Medical Expenditure Panel Survey (MEPS) Insurance Component (IC) data tools [Internet]. Rockville (MD): AHRQ; [cited 2026 May 30]. Available from: https://datatools.ahrq.gov/meps-ic/?type=tab&tab=mepsich3ntl↩︎
- Families First Coronavirus Response Act, Pub L No. 116-127, 134 Stat. 178 (2020) [Internet]. Washington (DC): U.S. Government Publishing Office; 2020 [cited 2026 May 31]. Available from: Congress.gov text of Public Law 116-127↩︎
- Hinton E, Stolyar L, Guth M, Rapfogel N. Medicaid enrollment and spending growth: FY 2025 & 2026 [Internet]. San Francisco (CA): KFF; 2025 [cited 2026 May 31]. Available from: https://www.kff.org/medicaid/issue-brief/medicaid-enrollment-spending-growth-fy-2025-2026/↩︎
- 23 states had a hospital provider tax prior to 2010 and are excluded from the analysis.↩︎
- Callaway B, Sant’Anna PH. Difference-in-differences with multiple time periods. Journal of econometrics. 2021 Dec 1;225(2):200-30.↩︎
- Koh K. The Great Recession and workers' health benefits. J Health Econ. 2018;58:18-28. doi:10.1016/j.jhealeco.2018.01.003. Available from: https://www.sciencedirect.com/science/article/pii/S016762961630128X↩︎
- We also ran models using wild cluster bootstrap given concerns about standard error being too small when there is small number of clusters (28 states) and found identical results with point standard errors that were slightly bigger but still had the same statistical significance as the results shown.↩︎
- Depew B, Bailey J. Did the Affordable Care Act's dependent coverage mandate increase premiums? Journal of Health Economics. 2015;41:1–14.↩︎
- While the ACA dependent coverage did apply to all states, treatment and control states differed in whether they had a dependent coverage mandate pre-ACA, and the share of employment in fully insured firms (firms affected by state mandates) also varied, making measuring the response of the family premium less cleanly identified than the single coverage premium (even with year fixed effects). We do run this analysis and find a similar magnitude of increase 1.4-1.8 percent, but do not report these results because of the aforementioned confounding.↩︎
- In 2024 there were 19.9 million public sector employees and 139.4 million private sector employees. Thus public sector employment represents 12.5 percent of all employment. Source: 2024 MEPS-IC. https://datatools.ahrq.gov/meps-ic↩︎
- For brevity, we exclude states that adopted in 2012-2014 or 2019 (6/20 states). Of all states adopting provider tax laws from 2010-2019, 70 percent adopted in these three years (2010, 2011, 2017). These analyses are available upon request.↩︎
- MEPS-IC data was not collected in 2007.↩︎
- We also examined whether premiums effects differed among small (less than 50 employees) or larger employers (50+ employees), and found the effects were not statistically different. These results are available upon request.↩︎
- KFF. 2024 Medical Loss Ratio Rebates [Internet]. San Francisco (CA): KFF; 2024 [cited 2026 Jun 15]. Available from: https://www.kff.org/private-insurance/medical-loss-ratio-rebates/↩︎
- Agency for Healthcare Research and Quality (AHRQ). MEPS-IC Data Tools: Medical Expenditure Panel Survey Insurance Component [Internet]. Rockville (MD): AHRQ; [cited 2026 Jun 15]. Available from: https://datatools.ahrq.gov/meps-ic/↩︎
- Hager KD, Mozaffarian D, Emanuel EJ, Herring B, Lentz LK, et al. Employer-sponsored health insurance premium cost growth and the distribution of wages, 1988–2019. JAMA Netw Open. 2024;7(1).↩︎
- Are rising employee health insurance costs dampening wage growth? Liberty Street Economics [Internet]. New York, NY: Federal Reserve Bank of New York; 2026 Mar 3 [cited 2026 Jun 8]. Available from: https://libertystreeteconomics.newyorkfed.org↩︎
- Himmelsbach V, [co-authors]. Workers drop health insurance, stabilizing employer costs. Boston (MA): Center for Retirement Research at Boston College; 2025.↩︎
- Burtless G, Milusheva S. Effects of employer health costs on the trend and distribution of Social Security–taxable wages. Washington (DC): Brookings Institution; 2016 Jul 27.↩︎
- Arnold D, Whaley C. Who pays for health care costs? The effects of health care prices on wages. Cambridge (MA): National Bureau of Economic Research; 2023. (NBER Working Paper Series; No. 3261↩︎
- U.S. Census Bureau. Health Insurance Coverage in the United States: 2024. Washington (DC): U.S. Census Bureau; 2025 Sep 8 [cited 2026 Jun 8]. Available from: https://www.census.gov/library/publications/2025/demo/p60-288.html↩︎
- Among states that adopted hospital provider taxes, these have increased over time to reach the 6 percent threshold. We assume absent WFTC, all affected states would have hit the current 6 percent threshold. In addition, with limits on SDPs providers will no longer be willing to be taxed as much so taxes are expected to fall below current levels, even absent the provider tax changes.↩︎
- This calculation is based on our estimated change in ESI single coverage premiums for a 1 percent point change in provider taxes (0.88-1), and the assumption that provider taxes will be reduced up to 2.5 percent under the WFTC legislation (from 6 to 3.5 percent).↩︎
- Baicker, Katherine, and Amitabh Chandra. 2006. “The Labor Market Effects of Rising Health Insurance Premiums.” Journal of Labor Economics 24(3): 609–634.↩︎
- Average family income among individuals with ESI is $127,500 (author calculation based on 2024 American Community Survey (ACS) data).↩︎
- Prior to the WFTC legislation, some states designed taxes that would tax Medicaid volume at a higher rate than non-Medicaid volume. The WFTC legislation prohibits this practice and in January 2026, CMS codified this prohibition in the rule “Medicaid Program: Preserving Medicaid Funding for Vulnerable Populations – Closing a Health Care-Related Tax Loophole.” https://shvs.org/cms-finalizes-rule-prohibiting-certain-non-uniform-provider-taxes-including-new-compliance-deadlines/. However, this does not affect our estimates as we assume a policy of uniform taxation in the baseline and in the alternative (under WFTC legislation).↩︎
- Although supply must slope up and demand slope down as in Figure 4, the magnitude of the slopes is part of our investigation and can be different than shown in the figure.↩︎
- Daly, Rich. “Some Providers Seek More Medicaid Patients as Program’s Finances Improve.” Healthcare Financial Management Association (HFMA), Fast Finance, https://www.hfma.org/fast-finance/some-providers-seek-more-medicaid-patients-as-programs-finances-improve/↩︎
- Neprash HT, Zink A, Sheridan B, Hempstead K. The effect of Medicaid expansion on Medicaid participation, payer mix, and labor supply in primary care. Journal of Health Economics. 2021 Dec;80:102541. doi: 10.1016/j.jhealeco.2021.102541. Epub 2021 Oct 12. PMID: 34700139.↩︎
- Tipirneni, Renuka, et al. “Primary Care Appointment Availability and Nonphysician Providers One Year After Medicaid Expansion.” The American Journal of Managed Care, vol. 22, no. 6, June 2016, pp. 427–431. AJMC, https://www.ajmc.com/view/primary-care-appointment-availability-and-nonphysician-providers-one-year-after-medicaid-expansion↩︎
- Allen, Lindsay, Cong T. Gian, and Kosali Simon. “The Impact of Medicaid Expansion on Emergency Department Wait Times.” Health Services Research, vol. 57, no. 2, 2022, pp. 294–299. Wiley, https://doi.org/10.1111/1475-6773.13892↩︎
- Gertler, Paul J. “Regulated Price Discrimination and Quality: The Implications of Medicaid Reimbursement Policy for the Nursing Home Industry.” NBER Working Paper Series, no. 1667, National Bureau of Economic Research, July 1985, https://doi.org/10.3386/w1667
- If hospitals don’t increase Medicaid volume in response to these payments, there will be no shift from Residual Supply Curve 1 to 2.↩︎
- Provider entry is likely limited in the short run, so the provider switching effect is expected to dominate, especially as states set SDPs up to the ACR, leading to a decline in non-Medicaid supply.↩︎
- For example, see the American Hospital Association’s resistance to reductions in the provider tax mandated in the WFTC legislation. (https://www.aha.org/fact-sheets/2025-02-07-fact-sheet-medicaid-provider-taxes).↩︎
- This does mitigate some of the deadweight losses associated with a tax. See Summers, L. Some Simple Economics of Mandated Benefits. American Economic Review 1989;79(2):177-183.↩︎
*This content is in the process of Section 508 review. If you need immediate assistance accessing this content, please submit a request to Eden Volkov, Eden.Volkov@hhs.gov. Content will be updated pending the outcome of the Section 508 review.