


Health care provider taxes and state-directed payment policies in the Working Families and Tax Cut legislation are expected to reduce non-Medicaid prices by up to 3.5 percent in markets with provider taxes and reduce spending on Medicaid, commercial and Medicare coverage. Our spending estimates indicate that there will be an additional $29 billion in federal savings on Medicare and commercial coverage for each $100 billion that federal Medicaid spending is reduced.
KEY POINTS
- Health care provider taxes have been used to fund Medicaid supplemental payments like state-directed payments (SDPs), drawing down additional federal Medicaid funding to support higher provider rates without additional expenditures from state general funds.
- Shifts in costs from the state to the federal government reduce states’ incentives to be prudent purchasers of services.
- By 2025, all states except Alaska had Medicaid provider taxes.
- SDPs have increased considerably over time, with managed care organizations receiving $43 billion in payments in 2021, an amount that rose over three-fold to $144 billion by 2025. Payments were expected to reach over $300 billion by 2034, without the Working Families Tax Cut (WFTC) legislation, commonly referred to as the One Big Beautiful Bill Act.
- By 2025, the average service covered by an SDP was compensated at 186 percent of the Medicare rate, well above the limit newly set by the WFTC legislation.
- Reforms to provider taxes and SDPs are projected to reduce non-Medicaid prices by up to 3.5 percent, relative to a no policy baseline, benefiting non-Medicaid payers by $502-$875 billion from 2025-2034. When fully phased in, the annual benefit will be $100-$175 billion.
- Some of the savings to non-Medicaid payers also accrue to the federal government, saving an additional $97-$169 billion beyond its savings on Medicaid and reducing total federal health spending by an average of 2.9-5.1 percent, when fully phased in.
INTRODUCTION
U.S. health care spending reached $5.3 trillion or $15,474 per person in 2024, and accounts for 18 percent of the nation's Gross Domestic product (GDP). It is projected to increase to $8.6 trillion or $24,200 per person by 2033, accounting for 20 percent of GDP.1 Government (federal, state, and local) expenditures represented 48 percent of total health expenditures in 2024 and are projected to grow to 50 percent by 2033. Medicaid expenditures are projected to grow from 18 percent of total health expenditures in 2024 to 20 percent in 2033, with the federal government spending over $600 billion on Medicaid in 2024, and total state and federal spending nearing $1 trillion.2 A significant source of Medicaid expenditure growth is the proliferation of state directed payments (SDPs) – and their subsidization by provider taxes – with provider tax-supported spending growing over 270 percent from 2008 to 2018, far outpacing growth in state general fund spending.3
Since the 1980s, states have used taxes on health care providers to fund their share of Medicaid and have simultaneously paid Medicaid providers through SDPs as well as supplemental payments.i As allowable limits on SDPs shifted to the average commercial rate (ACR) and providers have asserted that additional funds are needed to cover the cost of providing care to Medicaid beneficiaries, states increased SDPs toward this limit, which is, on average, 2.25 times Medicare rates. 4,5 While there is no evidence that the dramatic increase in SDP spending has been associated with any commensurate improvement in quality of care, states’ increasing reliance on SDPs contributes to rising federal Medicaid expenditures.6 Because of provider taxes and intergovernmental transfers (IGTs), under which revenue from local governments or facilities run by state or local governments is transferred to the state, the impact of these increased Medicaid expenditures falls disproportionately on the federal budget. 7,8 In addition, by linking SDPs to the ACR, hospitals have an added incentive to negotiate higher commercial rates, increasing costs to commercial insurance beneficiaries as well.ii
In this Research Report, ASPE provides a quantitative framework for understanding how provider taxes and SDPs impact non-Medicaid prices. In addition, we provide estimated impacts of the Working Families Tax Cut (WFTC) legislation on non-Medicaid prices, as well as total and federal non-Medicaid spending.
BACKGROUND
Historical Context
The Medicaid program is jointly financed by the federal government and states, with states contributing between 21 and 45 percent of total Medicaid spending in FY 2024. 9,iii To help fund their share of Medicaid expenditures, nearly all states use taxes on health care providers. As part of the Medicaid Voluntary Contribution and Provider-Specific Tax Amendments of 1991, the federal government has placed certain restrictions on how provider taxes can be used to fund the state share of Medicaid payments.10 These restrictions indicate the taxes must be: 1) broad-based, 2) uniform and 3) they must not hold taxpayers – the providers paying the tax – harmless.11
The “hold harmless” provision essentially states that individual providers cannot have a guarantee of getting their tax payments back, but rather are paid according to Medicaid services rendered. Three tests are described in regulations to determine whether taxpayers are held harmless: a positive correlation test, a Medicaid payment test, and a guarantee test.12,iv However, states can spend provider tax revenue on supplemental Medicaid payments broadly to providers in a taxed class, and those providers may collectively get back more than they paid in taxes without necessarily violating the “hold harmless” provision.
Because the payments are based on revenue or quantity supplied, provider taxes create a marginal cost – additional expenses for each beneficiary served – to health care providers. To the extent that supplemental payments increase reimbursement rates for Medicaid services rendered, the payments by themselves reduce the marginal cost of supplying services to those with Medicaid coverage, but importantly not to those without Medicaid coverage (those with commercial insurance, Medicare, or who are self-payers).
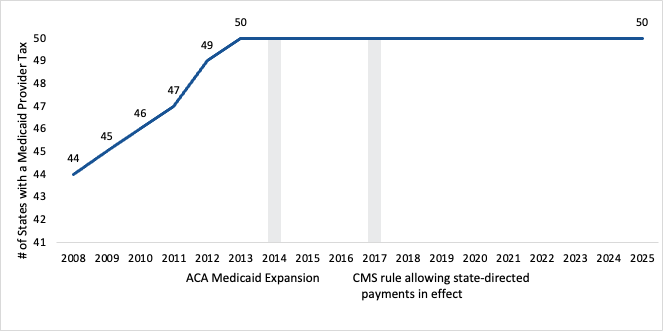
In fiscal year (FY) 2024, an estimated 68 percent of the state share of Medicaid was from state general funds (ranging from a low of 21 percent in Oklahoma to a high of 99 percent in South Dakota and Rhode Islandv), while the remaining 32 percent was paid through other state funds, including provider taxes.13,14 The number of states, including the District of Columbia, using Medicaid provider taxes increased from 46 in 2010 to 50 in 2025 (Figure 1).vi Alaska is the only state that does not have provider taxes.
Figure 1: State (including DC) Adoption of Medicaid Provider Taxes, 2010-2025
Source: Medicaid and CHIP Payment and Access Commission, Health Care-Related Taxes in Medicaid, May 2021, accessed at: https://www.macpac.gov/wp-content/uploads/2020/01/Health-Care-Related-Taxes-in-Medicaid.pdf; KFF, Medicaid Budget Surveys, accessed at: https://www.kff.org/series/medicaid-budget-survey/; ASPE staff environmental scans.
Providers often get back a portion of the taxes they paid through Medicaid supplemental payments and SDPs, financing mechanisms that increase Medicaid payment rates. When these payments are used in conjunction with provider taxes, the costs of the increased Medicaid rates shift from the state to the federal government, and the federal spending share exceeds the official FMAP. For example, a state could increase net income to providers by $400 with no net contribution from the state budget, but a significant increase in the federal spending share.vii
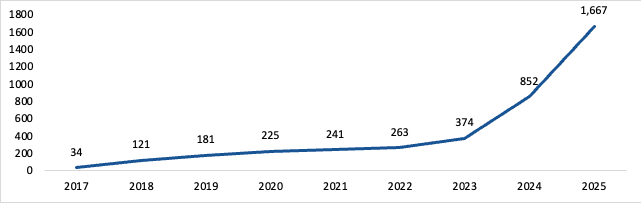
As Medicaid enrollment has shifted to managed care,15 SDPs, which were created by the Centers for Medicare & Medicaid Services (CMS) in its 2016 update to Medicaid managed care regulations, have become more prominent as they allow states to direct managed care organizations to pay providers according to specific rates or methods.16 A majority (67 percent in 2024) of SDPs are uniform payment increases above base payment rates.17 Since their creation, the number services receiving SDPs approved each year has grown substantially, rising from 34 in 2017 to 1,667 in 2025 (Figure 2).
Figure 2: Total Number of Services Receiving Approved State-Directed Payment by Calendar Year
Source: ASPE analysis of CMS OACT data on approved SDP pre-print submissions as of May 1st 2026
A 2017 Medicaid and CHIP Payment and Access Commission (MACPAC) report estimated that 80 percent of provider taxes and donations were returned to the same providers through a Medicaid payment, an estimate that the U.S. Government Accountability Office determined to be appropriate after discussions with states and a review of additional data.18,19 Of the $35.8 billion spent on SDPs in 2022, more than two-thirds of the non-federal share ($8.4 of $12.3 billion) was financed through provider taxes or IGTs.20 This effectively increased the federal share of directed payments by 14 percentage points.21 As Medicaid is jointly financed and administered by the state, it is important that states are fully participating in the financial arrangement set out in law, which requires that 40 percent of state’s share of total Medicaid expenditures must be funded through state funds.22 When provider taxes increase and state costs are shifted away from their general funds, states have less incentive to be prudent purchasers of services and ensure that both federal and state taxpayers are receiving sufficient value.
Policy Prior to the Working Families Tax Cut Legislation
While most supplemental payments are limited to a reasonable estimate of what Medicare would pay for the same services, prior to 2024, SDPs had no such limit and were only required to be reasonable and appropriate.viii In 2024, CMS updated regulations to make it easier for states to implement SDPs and formalized their policy allowing SDPs up to the ACR.23 As of June 2025, 30 states use the ACR as the benchmark for hospital or nursing facility SDPs, and 24 states have at least one SDP that reimburses providers at more than 90 percent of the ACR.24 The increased use of the ACR as the rate basis for SDPs has resulted in rates that far exceed Medicare rates. In addition, CMS has approved SDPs that are 350 percent of Medicare rates.25,ix ASPE analysis indicates that among states with approved SDPs using the ACR as the benchmark payment rate (96 percent of SDPs in 2025), the average Medicaid-to-Medicare payment rate after including the SDP payment is 186 percent, nearly doubling from the original base Medicaid-to-Medicare payment rate of 96 percent.
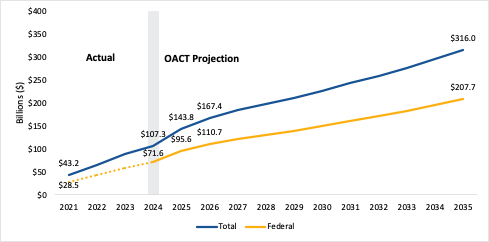
As a result of this 2024 rule, the Congressional Budget Office (CBO) projected an additional $58 billion in Medicaid spending over the 2025-2034 period, on top of $85 billion from existing growth in SDPs.26 Overall, CBO projected that SDP spending would grow by an average of 11 percent from FY 2025 to 2028, with a slower growth rate of about 4 percent annually from FY 2028 to 2034.27 However, CBO does not have access to the pre-prints submitted to CMS, limiting its ability to accurately project spending. Information available to date indicates this projection may be an underestimate. The actual growth rate from FY 2024 to 2025 was 34 percent (Figure 3), significantly higher than CBO’s projection. The Office of the Actuary (OACT) projects that absent the WFTC legislation, SDP spending would reach $316 billion, with about two-thirds of this spending coming from the federal government.28
Figure 3: SDP Spending ($ Billions) in US, Actual and OACT Projection FY 2021-2035, Absent WFTC Legislation
Source: CMS SDP pre-print submission data (includes pre-prints approved as of 5/1/2026) for 2021-2023 spending. Federal spending from 2021-2023 is extrapolated by multiplying total spending by 65% since this is the average share of federal spending assigned by OACT from 2024-2035. OACT projection based on Table 13 in https://www.federalregister.gov/documents/2026/05/22/2026-10292/medicaid-program-medicaid-managed-care-state-directed-payments-and-medicaid-fee-for-service-targeted#h-50.
Note: Projection based on extrapolating the change in SDP spending from 2021-2025 to 2026-2035. This assumes growth in spending will continue at the same rate over time and does not take into account reforms made as part of the 2025 WFTC legislation. SDPs included in the sample include SDPs that will be unaffected by the WFTCL; inpatient rural hospital SDPs. These account for 17 percent of all SDPs and 5 percent of spending in 2025.
In the following subsection, we briefly describe the economic theory behind why provider taxes that are used to fund the state share of SDPs can be expected to increase non-Medicaid prices for inpatient hospital services. The takeaways from the framework shown below can be applied broadly to all health care markets.
The Supply-Demand Relationship Between Provider Taxes, SDPs, and Non-Medicaid Prices in the Inpatient Health Care Market
Figure 4 presents demand and residual supply curves for the inpatient hospital services market and illustrates the potential impact of provider taxes and SDPs on non-Medicaid prices. Residual supply refers to the hospital market’s capacity to provide care to other payers—such as privately insured, Medicare, or self-pay patients—after Medicaid's demand for hospital services has already been met. The main assumption we make is that the tax is levied on all hospitals regardless of payer mix.x
The non-Medicaid price of inpatient health care services is shown on the vertical axis, while non-Medicaid utilization (i.e., the quantity of services provided) is shown on the horizontal axis. Demand for health care services is a downward sloping line, reflecting the fact that patients generally use more health care services as prices fall. Residual supply for health care services is an upward sloping line, reflecting the fact that the hospital market provides more services when those services are better compensated. The equilibrium price and quantity in the market for hospital services occurs where these two lines intersect (P* and Q*).xi
Figure 4: The Market for Inpatient Hospital Service
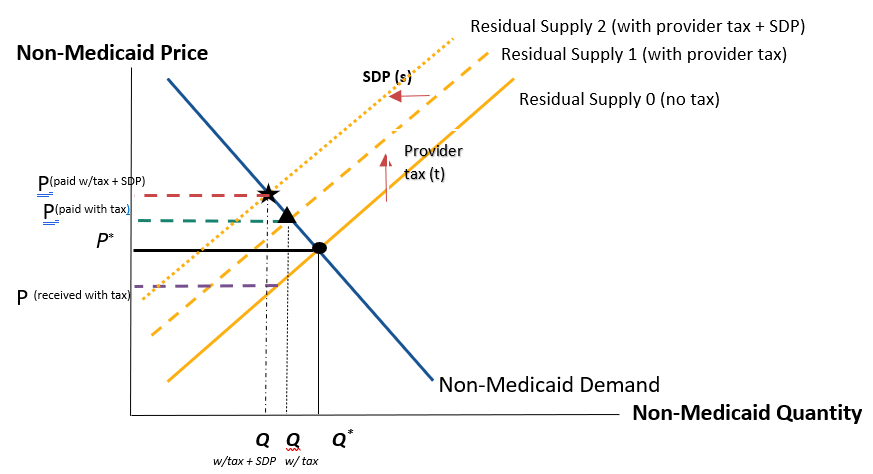
We show the effect of a tax on hospitals—specifically, a per-unit sales tax by shifting the original residual supply curve (“Residual Supply 0 (no tax)”) up by the amount of the tax (t) to a new supply curve (“Residual Supply 1 (with provider tax)”). This shows the tax has three consequences:
- There are now two effective prices: the price with the tax that non-Medicaid consumers (patients/insurers) pay: P(paid with tax), and the price net of tax, which hospitals receive: P(received with tax).
- Non-Medicaid consumers and hospitals are worse off with the tax. Before the tax, non-Medicaid patients paid the price P*, which was also what hospitals received for their services. After the tax, patients pay more (P(paid with tax) > P*), while hospitals are paid less for services rendered to non-Medicaid patients than before (P(received with tax)S < P*) (“supply price”).
- Finally, non-Medicaid quantity of services is lower than it was pre-tax (Q (with tax) < Q*). This occurs because non-Medicaid patients now pay a higher price, leading to a reduction in health care demand (a movement along the residual demand curve).
While the principal purpose of hospital provider taxes is to generate revenues to fund state’s share of Medicaid spending, provider tax revenue may also be used to fund SDPs for hospitals to increase Medicaid compensation rates. As noted above, imposing a tax usually makes firms, or in this case hospitals, worse off as sales and supply prices fall, leading to a decline in total revenue. However, in the unique situation of provider taxes, proceeds from the tax are used to pay the hospitals at higher Medicaid rates through an SDP. Here we assume that at least some hospitals increase Medicaid volume in response to the higher payment (a supply response to higher Medicaid reimbursement), which has been observed.29,xii As Medicaid volume increases, non-Medicaid volume may decrease in response, depending on the extent of provider entry and provider switching from non-Medicaid to Medicaid, which is shown by shifting the Residual Supply 1 curve to the left to Residual Supply 2 curve.xiii This has the effect of further increasing non-Medicaid prices (namely; P(paid w/tax + SDP) > P(paid with tax) > P*). That hospitals can raise prices for non-Medicaid patients and receive revenue from the provider taxes themselves may explain why provider taxes are a rare case where an industry supports taxes being levied on itself.xiv,xv
Some studies suggest that hospitals will “cost shift”—namely, if public payer (Medicare and Medicaid) reimbursement increases, private payer reimbursement rates can fall since hospitals don’t have to rely on higher private rates to make up for public payer shortfalls.30 However, even if individual providers or hospitals can cost shift, hospital employees will still want to go where compensation is higher, which will drive up compensation for private payers. Therefore, in a market which reflects supply and demand for health care services based on prices or compensation rates, cost shift does not occur on aggregate. There is also doubt whether cost shifting occurs even at a hospital level as can be seen in a variety of literature reviews and studies – one study found that a 10 percent reduction in Medicare payment was associated with a 7.7 percent reduction in private payment.31,32
Together, the supply curve shifts in Figure 4 depict how provider taxes and SDPs lead to an increase in a hospital’s non-Medicaid prices. The same analysis applies to other provider classes subject to provider tax and supplemental Medicaid payments. We turn next to discussing provider tax and SDP policy changes under the WFTC legislation as well as our quantitative analysis of how these changes can be expected to increase non-Medicaid prices and costs across health care markets affect by this legislation.
Policy Changes Under the Working Families Tax Cut Legislation
The WFTC legislation changes the Medicaid financing system in three related ways. First, it lowers the permissible payment ceiling for major SDPs. For inpatient and outpatient hospitals, nursing facilities, and academic medical center professional services, the old ceiling tied to the ACR is replaced with a Medicare-based ceiling.xvi Section 71116 of the WFTC legislation requires that expansion states are generally limited to 100 percent of Medicare, while non-expansion states are limited to 110 percent. While already-approved SDPs are grandfathered for a transition period, the WFTC legislation aims to reduce the state’s ability to shift from state to federal funds and to use SDPs to push Medicaid managed-care payments up toward commercial levels.
Second, section 71115 of the WFTC legislation restricts states’ ability to increasingly shift the financing of Medicaid to the federal government by effectively locking in provider tax rates at their July 2025 levels, with no new taxes and no increases in existing tax rates generally permissible under the law. In expansion states, the safe-harbor threshold is then phased down from the current 6 percent threshold to 3.5 percent by FY 2032 (a decline of 2.5 percentage points) in annual steps beginning in FY 2028, although nursing facilities and intermediate care facilities for individuals with intellectual disabilities (ICF/IIDs) are exempt from that phase-down. Based on hospital provider tax rates in FY 2025, among the 36 states and DC that expanded Medicaid and have a provider tax on hospitals, 11 (AZ, NE, NV, NH, NJ, NM, OH, OR, RI, VT, VA) will have to reduce their tax rates from a range of 5.5 to 6 percent in FY 2025 to at most 5.5 percent in FY 2028. By FY 2034, 29 Medicaid expansion states (~80 percent) with hospital provider tax rates above 3.5 percent will have to lower their rates to the threshold of 3.5 percent.33,xvii
Although non-expansion states are not required by WFTC legislation to cut their provider taxes, we expect that they will face local political pressure to do so. Providers had often supported the taxes because they funded SDPs magnified with federal matching, but even non-expansion states were required by WFTC to cut their SDPs enough to bring their final rate at or below 110 percent of Medicare fee-for-service (FFS) rates.xviii
Third, section 71117 of the WFTC legislation makes it more difficult to preserve aggressive tax arrangements through waiver strategies. It gives CMS more authority to scrutinize taxes that are not fully broad-based or uniform and, in particular, to reject arrangements that concentrate the tax burden on high-Medicaid providers. This will have the effect of discouraging states from designing taxes that formally satisfy the waiver tests, but that still disproportionately fall on providers most likely to be repaid through Medicaid.
The WFTC legislation’s goal is to align federal and state Medicaid financing incentives by enforcing regulations addressing tax “loopholes” that increase the federal share of funding for Medicaid beyond the statutory FMAP. Together, these provisions address both sides of the SDP financing apparatus. The SDP cap reduces the gross amount that can be directed to providers through managed care, while the provider tax provisions limit states’ ability to raise the state share needed to finance those payments. Further, by delinking Medicaid rates from commercial rates and reducing the added incentive for hospitals to negotiate higher commercial prices, the WFTC legislation will alleviate the upward pressure on commercial insurance hospital rates and hospital costs to the consumer, which in turn will reduce the likelihood of independent physician practices being acquired by hospitals.
METHODS
This Research Report uses a calibration approach with estimates from the literature to estimate the expected effects of reducing provider tax rates and SDPs on non-Medicaid prices and costs. The calibration assigns numerical values to key model parameters by drawing on estimates established in prior empirical literature, rather than estimating those parameters jointly from a particular dataset being analyzed.xix Calibration is well-suited to microeconomic policy exercises where the analyst has a clear, theoretically motivated question, but where a single dataset provides too little information (relative to the overall literature) about the magnitudes of interest. Another advantage of our calibration approach is that it generates national estimates, which are ideal given that capital and labor employed by providers are mobile across states to some degree, particularly over a longer time horizon.
Capital and labor mobility means that even states without provider taxes may be affected by the provider tax policies in other states. As a percentage of national prices, interstate “spillover” effects are small because a single state changing its policy is small relative to the nation. Nevertheless, the dollar amount of the spillover effect is comparable to the dollar amount of the state’s policy change because the small national percent change is applied to a large national volume. Because the prices in a state depend both on that state’s policies and the policies in the other states, our national calibration approach is preferable to an interstate “difference-in-differences” estimate of the “effect” of provider taxes on non-Medicaid prices. The latter would understate the effect on a state’s prices. See also Minton and Mulligan (2024) and Jaffe et al. (2026).34,35
The key predictions made in this analysis are (1) the impact of a percentage point change in the provider tax rate on the non-Medicaid price and (2) the total benefit to non-Medicaid payers when the WFTC legislation is fully phased in. In the Technical Appendix we show that (1) and (2) are functions of the price elasticity of demand for medical services, the price elasticity of supply for medical services, the federal share of state Medicaid spending, and the share of federal revenues generated through states’ use of provider taxes that is allocated towards Medicaid spending. The values we assign to each of these terms come from the literature, or are objects of sensitivity analysis, and are discussed further in the Technical Appendix. Table 1 summarizes these parameters’ estimates.
Table 1: Parameter Estimates Used for Calibrating the Non-Medicaid Price Impact of a 1 Percentage Point Change in the Provider Tax Rate and the Cost Savings from the WFTC legislation.
Parameter | Estimate |
Price Elasticity of Demand (Ed) | -0.33* |
Price Elasticity of Supply (Es) | Range [0.33, 5] |
Federal Share of Medicaid Spending (f) | 0.65ϯ |
Share of Federal Revenue from Provider tax spent on Medicaid (μ) | 0.2Ϯ |
Notes: Es range set by ASPE researchers. * is the midpoint from estimates in the literature [-0.2, -0.5]: See Technical Appendix for further details, ϯ is from FY 2024 share of federal Medicaid spending. Ϯ is the Medicaid share of total state expenditures.
Sources: Federal and State Share of Medicaid Spending, KFF. https://www.kff.org/medicaid/state-indicator/federalstate-share-of-spen…; 2025 State Expenditure Report. National Association of State Budget Officers from: https://www.nasbo.org/reports-data/state-expenditure-report.
FINDINGS
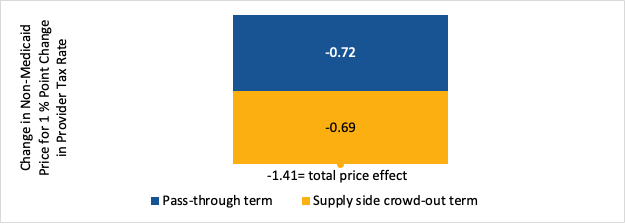
Figure 5 presents the main estimated effect of the WFTC legislation on non-Medicaid prices and the corresponding benefit for non-Medicaid payers across health care markets. The estimates in Figure 5 are based on the midpoint result from the range of estimates shown in Appendix Figure 1. Our main results indicated that a one-percentage point reduction in provider tax rates will reduce the price paid to providers by non-Medicaid payers by 0.72 percent (referred to as pass through). In addition, reduced Medicaid activity frees up resources for additional non-Medicaid services performed, which we refer to as supply-side crowd out when Medicaid payments are increased, and the reverse when they are decreased. We estimate that payment reductions associated with a one-percentage point reduction in provider tax rates will reduce non-Medicaid prices by an additional 0.69 percent from this supply side crowd effect. In total, the non-Medicaid price will be reduced by 1.41 percent (pass through + supply-side crowd out) for each percentage point reduction in the provider tax rate. For expansion states that would have ended up at the current six percent “safe harbor” threshold, the WFTC legislation reduces provider tax rates by at least 2.5 percentage points.xx This yields a total scaled effect of a 3.5 (2.5 x 1.41) percent reduction in the prices paid to providers by non-Medicaid payers when the reforms to provider taxes and SDPs are fully phased in under the WFTC legislation. The results in Figure 5 indicate that about half of the non-Medicaid price reduction will come from reducing supply side crowd out and the other half will come from reduced pass through. The results in Figures 5 and 6 put this percent reduction in non-Medicaid prices into context, showing the total estimated dollar value of the benefits to non-Medicaid consumers from this reduction in prices, as well as the projected non-Medicaid health care expenditure savings overall and for the federal government, from 2025-2034.
Figure 5: Estimated Non-Medicaid Price Effect of a One Percentage Point Cut in Provider Tax Rates
Note: Estimates are derived from the demand-supply model calibrated by ASPE economists.
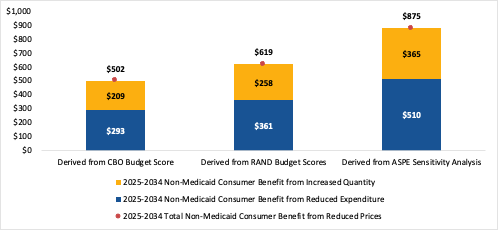
Figure 6 shows that the provider tax and SDP provisions in the WFTC legislation will generate benefits of $502-$875 billion for non-Medicaid consumers over 2025-2034. Of this total, $293-$510 billion reflects lower prices paid by non-Medicaid purchasers, while $209-$365 billion reflects the value of additional health care services they purchase in response to lower prices.
The first two estimates ($502-$619 billion) are derived from RAND and CBO projections, respectively, of the effects of the SDP and provider tax provisions in the WFTC legislation on total Medicaid spending.36,37 CBO projects $332 billion less federal Medicaid spending from 2025-2034, while RAND projects that federal spending on Medicaid is reduced by $410 billion. We rescale both to calculate a total Medicaid spending reduction of $511 and $631 billion, respectively, by noting that the federal spending share of Medicaid was 65 percent in FY 2024. xxiIn addition, we have an additional sensitivity analysis which takes into account the fact that the RAND budget score is based on only half of total SDP spending in 2025.vxxii In this sensitivity analysis, we use the RAND estimate for the federal provider tax savings estimate and scale the federal SDP savings estimate by 2, to get a total combined savings estimate of $579. Our federal savings estimate for combined effect of the provider tax and SDP provisions is about the size of the SDP effect alone ($510 billion) estimated by OACT in a recent proposed rule.29 We then scale this estimate in the same way as the prior two estimates to get the total (federal and state) savings estimate of $891 billion from 2025-2034. This yields a total benefit estimate of $875 billion from 2025-2034.
Our analytical framework quantifies the relationship between changes in Medicaid and non-Medicaid spending that result from changes in provider taxes and the supplemental Medicaid payments they finance. Because the price change comes from a change in supply to non-Medicaid consumers, their benefit is the product of the price change and their baseline purchases of health care services.
Because we have three estimates of Medicaid spending changes to support our estimates, we have three estimates of the benefit to non-Medicaid payers from the WFTC legislation’s changes in provider-tax and SDP policies. Specifically, our quantitative framework predicts that non-Medicaid payers benefit $0.98 for each dollar that provider-tax and SDP restrictions reduce Medicaid spending. Therefore, non-Medicaid cost savings (total benefits) range from $502-$875 billion from 2025-2034, or $100-$175 billion when fully phased in. Calibration details and results are available in the Technical Appendix.
Our analytical framework also quantifies the relationship between Medicaid spending changes and non-Medicaid expenditure changes that result from changes in provider taxes and the supplemental Medicaid payments they finance. Specifically, the combination of non-Medicaid consumers paying a lower price and demanding a greater quantity means that they spend $0.573 less for each dollar that provider-tax and SDP restrictions reduce Medicaid spending. Therefore, non-Medicaid spending falls $293, $361, $510 billion over ten years (relative to a baseline of no WFTC legislation), depending on whether RAND’s, CBO’s or the ASPE sensitivity analysis fiscal estimate is used, respectively.
The dollar value of the benefit to non-Medicaid payers exceeds the reduction in their spending because of the additional medical services (increased quantity) they purchase. Figure 6 shows these two components of the overall benefit, as well as their combined total of $502-$875 billion.
To summarize, we estimate that the provider tax and SDP provisions in the WFTC legislation will generate benefits of $502-$875 billion for non-Medicaid consumers of similar services over 2025-2034. Of this total, $293-$510 billion reflects less expenditure by non-Medicaid purchasers, while $209-$365 billion reflects the value of additional health care services they purchase in response to lower prices.
Figure 6: Estimated Benefit to Non-Medicaid Consumers ($Billions) from the WFTC Legislation, 2025-2034
Note: Estimates are derived from the demand-supply model calibrated by ASPE economists to budget scores.
Table 2 shows how the estimated spending reductions discussed above ($293-$510 billion) will be distributed across the federal government versus other payers (private, state, local, all other). The federal government is expected to spend $97-$169 billion less from 2025-2034 due to lower non-Medicaid prices resulting from provider tax and SDP limitations under the WFTC legislation. Specifically, the provider price reductions will reduce federal expenditures on Medicare by $50-$88 billion, as well as its tax subsidies for employer-based coverage and ACA premium tax credits by $47-$81 billion.xxiii,xxiv On an annual basis, when fully phased in, WFTC legislation will reduce federal non-Medicaid spending by $19-$34 billion. In addition to the $97-$169 billion reduction in non-Medicaid spending by the federal government from 2025-2034, these provisions in the WFTC legislation will reduce Medicaid spending by $322, $410, and $579 billion from 2025-2034, according to CBO, RAND, and our sensitivity analysis, respectively. This represents about 4-7 percent of what CBO estimated federal Medicaid spending would be prior to the WFTC legislation.38 Total federal spending is therefore expected to fall by $419-$748 billion, during this period, relative to spending levels absent this legislation, or $84-$150 billion annually when fully phased in.
Table 2: Effect of WFTC on Non-Medicaid Health Care Spending ($ billions), 2025-2034, by Budget-Score Source
CBO | RAND | ASPE Sensitivity Analysis | |
Federal spending on Medicare | -$50 | -$62 | -$88 |
Federal support of ESI and ACA | -$47 | -$58 | -$81 |
Federal Total | -$97 | -$120 | -$169 |
All other payers (state, local, self-pay, non-ACA plans) | -$196 | -$242 | -$341 |
Total | -$293 | -$361 | -$510 |
Note: Estimate are derived from the demand-supply model calibrated by ASPE economists to budget scores.
CONCLUSION
Policies in the WFTC legislation related to Medicaid health care provider taxes and SDPs are expected to reduce non-Medicaid prices by up to 3.5 percent in hospital markets and other markets that have provider taxes. From 2025-2034, the price reductions benefit non-Medicaid payers by about $502-$875 billion, or $100-$175 billion annually when fully phased in. Forty percent of the non-Medicaid consumer benefit will come from increased medical care utilization, while 60 percent will come from reduced spending on baseline utilization. In addition to reduced federal expenditures on Medicaid, the provisions related to health care provider taxes and SDPs in the WFTC legislation are expected to reduce federal expenditures in non-Medicaid markets by $97-$169 from 2025-2034, leading to a total spending reduction for the federal government of $419-$748 billion. By reducing the federal deficit, the WFTC legislation provisions also reduce inflationary pressures.
The federal government is projected to spend $2.94 trillion on health expenditures in 2033. When fully phased in, the changes to provider taxes and SDPs under the WFTC legislation are expected to reduce total government health spending by about 2.9-5.1 percent ($84-$150 billion/$2.94 trillion). This significant reduction in government health expenditures will come with reduced prices and increased health care utilization for nearly 280 million Americans (82 percent of the population), highlighting the value of this policy change.xxv With lower prices faced by non-Medicaid payers likely leading to premium reductions in these markets, a potential additional benefit of the policy change is increased take-up of non-Medicaid coverage, specifically employer and Marketplace coverage, as these coverage options become more affordable than they would be without the WFTC legislation.
In addition, this model may not fully capture the WFTC legislation’s downward pressure on commercial prices. One factor is the incentives created when linking SDPs to the ACR. Because higher commercial rates would, in the baseline, allow for a higher absolute limit on SDPs, states in the baseline are additionally incentivized to support policies that increase commercial rates in order to draw additional federal funds.39 Because hospitals receive more compensation and states receive more federal Medicaid dollars for each service provided, this will also affect hospital and state incentives to manage utilization.40,41 In addition, because SDPs disproportionately go to hospitals, elevated SDPs may also promote hospital acquisition of independent physician practices, further increasing prices.42 As a result of these dynamics, the WFTC legislation may have other positive impacts on commercial prices beyond what is modeled in this paper.
TECHNICAL APPENDIX
This appendix displays the algebra of the demand-supply model from Figure 4, measurement of the key parameters, and our treatment of the Medicare program. One key takeaway is that the featured results are fairly insensitive to assumptions about the supply of providers. If the market for providers is capacity constrained, then the pass-through rate of provider taxes is low, but Medicaid payments are a major determinant of non-Medicaid prices due to limited supply. At the other extreme, a provider market with highly elastic supply passes through essentially all provider taxation to consumers while Medicaid demand has little effect on non-Medicaid markets.
Variables of Interest
- qc: Non-Medicaid quantity
- qm: Medicaid quantity
- pc: Non-Medicaid price on the demand side
- pm: Medicaid price on the demand side
- t: provider tax, per unit quantity
- r: state-directed payment (SDP) rate, which is paid to providers per unit quantity
- D(pc): Non-Medicaid quantity demanded, which decreases with its price
- S(pc-t): supply of providers, which increases with the net price received by providers
- Es: the price elasticity of provider supply, approximated as pc S’(pc - t)/S(pc - t)
- pt: pass-through rate in the provider market.xxvi
- shm: Medicaid share of provider payer mix.
- f: federal share of total state Medicaid spending
- g: state Medicaid financing, excluding provider taxes and federal share
- μ: the share of additional federal revenue from matching the state revenue generated through provider taxes that is spent on Medicaid rather than relieving other parts of the state budget
pm corresponds to the “Medicaid base price”: what patients and plans pay providers before the addition of state-directed payments r. Although patients are paying pm+r to providers, pm is the net price or the price that the patient/insurer pays because the state finances the r part of the payment. The units of qm should be understood as units of time and effort of provider employees, or a quality-adjusted unit of quantity. These units can differ from the quantity units specified in Medicaid programs, such as number of patients or procedures. Indeed, CMS has historically described SDPs as a tool for increasing the quality of Medicaid services, which can be economically interpreted as increasing the amount of provider resources (qm) for each unit of Medicaid services.
Algebraically, the demand-supply model has three equilibrium equations, two definitions, and five sign conditions.
Equilibrium

Definitions

Sign Conditions

Interpretation of the Equilibrium Conditions
- qc=D(pc) means that non-Medicaid enrollment or utilization is determined by the non-Medicaid price faced by patients and plans. As pc changes, non-Medicaid quantity moves along the demand curve.
- qc+qm=s(pc-t) means that total quantity supplied to the market must equal the sum of non-Medicaid and Medicaid quantities. Providers choose supply based on the net-of-tax price they receive (pc-t).
- qm may also follow a demand curve. But policy also shifts the demand curve. In particular, each state has a substantial influence on Medicaid enrollment and utilization within its borders. As policies affect the rate of federal subsidy, they change states’ incentives around Medicaid policies. For brevity, here we refer to changes dqm, understanding them to be combination of price-induced movements along a Medicaid demand curve and shifts of the curve due to non-price related factors like state eligibility policies, among others.
- pc-t=pm-t+r means that providers are indifferent at the margin between serving non-Medicaid and Medicaid patients once taxes and state-directed payments are factored in. In the market equilibrium, prices adjust so that the net payment from a non-Medicaid patient is equal to the net payment from a Medicaid patient plus the state directed payment (SDP, interpreted broadly to include other supplemental Medicaid payments). In other words, this model shows whether, and how much, SDPs reduce equilibrium base rates pm.
One immediate, and familiar, result is that the pass-through rate is between zero and one.

The pass-through rate exceeds 1/2 if supply is more price-elastic than demand, which is the likely case for health care markets.
A second result is that the non-Medicaid price increases with the provider tax rate and with the Medicaid quantity. These are the two basic mechanisms that SDP policy affects health care affordability.

When transformed to a partial elasticity, dqm becomes:

where Es denotes the price elasticity of provider supply.
SDP financing and Supply-side Crowd-out
We assume that all provider-tax revenues are spent on Medicaid supplemental payments, and that the additional federal matching revenue is split μ and 1-μ between additional Medicaid spending and relaxing contributions g from the rest of the state’s budget, respectively.

The first term is provider-tax revenue. The second term is additional state financing of Medicaid. (pm+r)qm is Medicaid spending, a fraction 1-f of which is financed with state revenues, making the full term on the right-hand side total state Medicaid spending (which is equivalent to the left-hand side). The state budget constraint can be rewritten to isolate the provider tax and federal matching:

The parameter μ measures how additional federal funds are split between increasing (pm+r)qm and reducing g. Expressing the constraint in differential form, we have the effect of provider tax revenue on Medicaid spending:

In algebraic terms, we have three definitions and five equilibrium conditions linking nine model differentials (that is, actual-counterfactual differences in, or “impacts on,” nine model variables). Two of the definitions are df = 0 and dµ = 0. A third dpm = 0 holds constant the Medicaid base rate, which is a normalization because what matters for the economics and the legal requirements is not the base rate itself but rather its sum with the SDP rate r. One equilibrium condition is the differential version of the state budget constraint shown above. Another is the definition of µ, because it also relates state spending and revenue differentials. The remaining three conditions are the differential versions of the three equilibrium conditions shown on the first page of this Appendix.
Therefore, eight differentials can be expressed as functions of a nineth impulse variable. For our purposes, it does not matter whether the impulse variable is a legislated value dt (the change in the provider tax rate) or a legislated value dr (the change in the SDP rate).
The model allows for the Medicaid share of provider payments shm, the pass-through rate pt, the price elasticity of supply, and the price elasticity of demand to be affected by a legislated changes in provider tax rates or SDP payment rates.
Calibration of the Model Parameters
shm and f are the Medicaid share of provider utilization and the federal matching rate on Medicaid spending, respectively. They are well-known accounting statistics at the state level. For national-level calculations, we assume shm = 0.2 and f=0.65, which are in the middle of their respective ranges across states.
To calibrate μ for a national calculation, we use 20 percent, which approximates the share of Medicaid financing in state budgets for those states most using provider taxes.39 Health care demand is thought to be price inelastic, with many quantitative estimates in the range -0.2 to -0.5.4344454647 We use -0.33 as this is the midpoint. That leaves only the price elasticity Es of provider supply, for which we consider a wide range [-0.33,5]. As we will show, the results are not very sensitive to Es because it increases the pass-through effect on non-Medicaid prices while it reduces supply-side crowd-out.
Measuring policy changes and baselines
For the purpose of describing the price effects of the WFTC legislation on provider markets that would have ended up at the six percent “safe harbor” threshold, such states would respond to the restrictions on SDPs and provider-tax rates by reducing tax rates by an average of 2.5 percentage points.
To get a national-average price effect of the WFTC legislation, including untaxed, exempt, and grandfathered providers in the average, we build on fiscal reports published by the Congressional Budget Office (CBO) and RAND. CBO estimates that the combination of provider-tax and SDP provisions will reduce the federal deficit by $332 billion over the 2025-2034 period. Assuming that federal revenue changes contribute little to CBO’s fiscal estimates, and that the federal share of Medicaid spending is 65 percent, the total Medicaid (state and federal) spending impact that is consistent with CBO’s report is $511 billion over the 2025-2034 period ($332 billion (65%) from federal spending and $179 billion (35%) from state spending). RAND estimates that these provisions will reduce total (federal) Medicaid spending by $410 billion, which we scale to get a national impact of $631 billion. When citing results for subintervals of 2025-2034, we assume that the years 2025-2027 contribute little to the total due to the WFTC’s delayed provisions. The full phase is not until the year 2032. From this phase-in pattern, we estimate an annual effect of $102-$126 billion when fully phased in.xxvii While the provider taxes rates will not start being reduced till 2028, limits on SDPs may be in effect earlier. Furthermore, the WFTC legislation may be preventing provider-tax increases that would have otherwise occurred from 2025-2027. Given that providers may not be as willing to be taxed at current rates, as their payments are reduced, it is plausible that states may start lowering provider taxes before 2028. In this case, we have underestimated the fiscal and consumer benefits of the provider tax and SDP provisions in the WFTC legislation.xxviii
Pass-through and Supply-side Crowd-out increase non-Medicaid Prices
The aforementioned state budget dynamics allow us to quantify the effect of provider taxes on non-Medicaid prices that occur through crowding out non-Medicaid supply. This effect was previously represented as a dqm term and appears below as the second term in parentheses.

This inequality applies to tax increases and is an equality in the neighborhood of t=0.
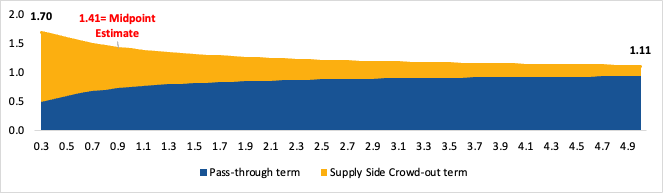
Recall that the pass-through rate pt is a function of the supply and demand elasticities. Appendix Figure 1 below graphs the estimated non-Medicaid price impact as a function of Es over the range 0.33 to 5.
Here we set μ=0.2,f=0.65,shm=0.2,pc=1,dt=1,Es=[0.33,5].
Appendix Figure 1: Non-Medicaid Price Impact per One Percentage Point Increase in Provider Tax Rate (t)
Note: Estimates are derived from the demand-supply model calibrated by ASPE economists.
The figure shows that the pass-through term increases with Es while the supply-side crowd-out term falls. This is expected, because with elastic supply market prices are primarily determined by costs such as taxes rather than quantities. With inelastic supply, it is quantities driving prices.
The question of interest is the combined effect of provider taxes on non-Medicaid prices. This also falls with Es, but much less because the pass-through term is rising. The figure shows a range of 1.11-1.70 for the combined effect. The midpoint of 1.41 is used in the main text.
For states that would have ended up at the current six percent “safe harbor” threshold, the WFTC legislation reduces provider tax rates by at least 2.5 percentage points. Applying that to Appendix Figure 1’s midpoint of 1.41 translates to a 3.5 percent reduction (2.5*1.41) in prices paid to providers by non-Medicaid payers.
Impact on Medicare
On behalf of Medicare beneficiaries, the payers include the federal government, Medicare Advantage (MA) plans, and the beneficiaries themselves. Additional provider supply benefits these payers in terms of less spending and additional quantity, as in the commercial sector. Due to Medicare rules, these benefits can take different forms than they do in the commercial sector, such as adding supplemental benefits as favorable supply conditions support lower bids by MA plans; supplemental benefits are an important way that MA plans compete for enrollees. Additional supply also reduces the deadweight loss of government-mandated prices in traditional Medicare, which is a benefit to those participants. We quantify the benefit to Medicare payers by following Shephard’s Lemma from microeconomics and applying the impact dln(pc ) to non-drug Medicare spending. However, the true benefit is greater due to the deadweight losses that are absent from the Shephard-Lemma framework.
In order to isolate the benefit to federal financing, we note that provider markets for Medicare members differ between traditional Medicare (to a first, approximation, fee for service, FFS) and MA. CMS scales its FFS Medicare payments by an annual "market basket" that is an index of input prices paid by providers. That is different from commercial payments that reflect equilibrium output prices, particularly in terms of the inclusion of taxes. In our notation, the composite of input prices is (pc-t) while the output price is pc (see also Figure 4). Both are reduced by the WFTC, especially because SDPs by themselves affect Medicaid demand and thereby move input and output prices together. The overall effect on input prices is less due to the WFTC’s change in provider taxes. Denoted the price elasticity of demand as ED < 0, the equilibrium relationship between input and output prices can be written as:

Using our midpoint parameters, this coefficient is about 0.29. We apply the same coefficient to relate commercial expenditures (at the output price) to FFS expenditures (at the input price). We do not calculate an expenditure coefficient that accounts for equilibrium effects on upcoding or supply-induced demand in Medicare but expect that it would be greater in magnitude.
In percentage terms, we expect provider spending by MA plans to resemble commercial spending because MA plans negotiate contract terms with providers. However, changes in Part A and B spending by MA plans do not translate one-for-one to federal reimbursement because the latter is a weighted average of plan bids and FFS rates. The former reflects output prices, and as already discussed, the latter reflects input prices. For a hypothetical plan with the national average bid (24 percent below the MA benchmark) and the typical rebate percentage (65 percent), the elasticity of federal MA payments with respect to commercial spending is about 0.50.
Assuming that 58 percent of Part A and B spending will be on MA beneficiaries during the time horizon that we analyze, with the other 42 percent on traditional Medicare, the spending-weighted average of these two elasticities is 0.41.
Impact on Medicaid Spending
The equilibrium change in Medicaid spending from an increase in the provider tax rate is bounded below by:

The inequality is an equality in the neighborhood of t=0. It reflects both provider taxes as a source of state Medicaid funding and their effect on increasing federal funds for Medicaid financing.
In this way, provider taxes increase Medicaid spending at the same time that they increase non-Medicaid prices. The model quantifies the rate at which the former changes relative to the latter. In the neighborhood of t=0,

The change in costs to non-Medicaid payers is the product of dln(pc) and baseline non-Medicaid expenditures. In other words, the ratio of the dollar impact on cost to the dollar impact on Medicaid spending is:

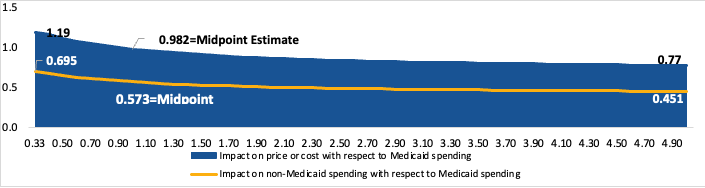
This ratio links a question of interest – the change in costs to non-Medicaid payers – to fiscal estimates (from CBO or RAND).xxix The ratio depends on the elasticity Es both directly and through pt. Appendix Figure 2 below graphs the coefficient as a function of Es over the range 0.33 to 5.
Appendix Figure 2: Impact on Non-Medicaid Costs per Dollar of Medicaid Spending Impact
Note: Estimates are derived from the demand-supply model calibrated by ASPE economists to budget scores.
The figure shows a range of 0.77-1.19 for the combined effect. The midpoint of 0.982 is used in the main text.
As already noted, the CBO fiscal report suggests that the WFTC’s effects on total state and federal Medicaid spending is a reduction of $511 billion over the 2025-2034 period. The annual reduction when fully phased would be $102 billion. Multiplying by the 0.982 midpoint, the WFTC legislation will save non-Medicaid payers $502 billion over the 2025-2034 period in the form of lower provider prices than would be the case without the WFTC legislation. When fully phased in, the annual savings will be $100 billion.xxx Using RAND estimates the total Medicaid spending reduction is $631 billion from 2025-2035, and the corresponding non-Medicaid cost reduction is $619 billion, with an annual savings of $124 billion when fully phased in.
The change in non-Medicaid expenditures is less than the change in non-Medicaid costs to the extent that payers react to lower prices by purchasing more. That expression is given by:

The figure shows a range of 0.695-0.451 for the estimated change in non-Medicaid expenditures for each unit change in Medicaid expenditures induced through provider tax and SDP reductions. The midpoint of 0.573 is used in the main text.
Calculation of Average Share of Federal Dollars Spent on Non-Medicaid, Non-Drug Personal Health Care (PHC) Expendituresxxxi
Federal share of non-Medicaid non-drug PHC expenditures is calculated as the average spending from 2025- 2034 on:
(1) Medicare PHC Excluding Prescription + (2) total federal subsidies for Employment-Based Coverage +
(3) (1.5xxxii x total federal spending on ACA Marketplace subsidies and payments for risk adjustment)
(4) total PHC Excluding Medicaid]rxxxiii
Endnotes
[1] National Health Expenditure Data. Centers for Medicare & Medicaid Services, 14 Jan. 2026, https://www.cms.gov/data-research/statistics-trends-and-reports/nationa….
[2] National Health Expenditure Data, Table 16. Centers for Medicare & Medicaid Services, 14 Jan. 2026, https://www.cms.gov/data-research/statistics-trends-and-reports/nationa…
[3] Medicaid Provider Taxes Inflate Federal Matching Funds. Committee for a Responsible Federal Budget, 28 Sept. 2023, https://www.crfb.org/sites/default/files/media/documents/MedicaidProvid….
[4] O’Hagen Karl, A., Mann, C., Polk, E.C., Rains, G. Lifelines in Jeopardy: How Medicaid State Directed Payments Support Critical Health Care Providers. Manatt Health. May 2025. Accessed at: https://www.manatt.com/insights/white-papers/2025/lifelines-in-jeopardy…
[5] Congressional Budget Office. The Prices That Commercial Health Insurers and Medicare Pay for Hospitals’ and Physicians’ Services. January 2022. Accessed at: https://cbo.gov/system/files/2022-01/57422-medical-prices.pdf
[6] Government Accountability Office. Rapid Spending Growth in State Directed Payments Needs Enhanced Oversight and Transparency. GAO-24-106202. December 2023. Accessed at: https://www.gao.gov/assets/gao-24-106202.pdf
[7] Government Accountability Office. CMS Needs More Information on States’ Financing and Payment Arrangements to Improve Oversight. GAO-21-98. December 2020. Accessed at: https://www.gao.gov/assets/gao-21-98.pdf
[8] U.S. House of Representatives, Ways and Means Committee. Health Reconciliation Options 2025. Accessed at: https://www.politico.com/f/?id=00000194-74a8-d40a-ab9e-7fbc70940000
[9] “Federal and State Share of Medicaid Spending | KFF State Health Facts.” KFF, Accessed at: https://www.kff.org/medicaid/state-indicator/federalstate-share-of-spen….
[10] United States, Congress, House. Medicaid Voluntary Contribution and Provider-Specific Tax Amendments of 1991. H.R. 3595, 102nd Cong., 1st sess., 1991. Accessed at: https://www.congress.gov/bill/102nd-congress/house-bill/3595/text
[11] Medicaid and CHP Payment and Access Commission. Health Care-Related Taxes in Medicaid. May 2021. Accessed at: https://www.macpac.gov/wp-content/uploads/2020/01/Health-Care-Related-T…
[12] Mitchell, A. Medicaid Provider Taxes. Congressional Research Service. December 30, 2024. Accessed at: https://www.congress.gov/crs-product/RS22843
[13] Mitchell, A. Medicaid Provider Taxes. Congressional Research Service. December 30, 2024. Accessed at: https://www.congress.gov/crs-product/RS22843
[14] National Association of State Budget Officers. 2024 State Expenditure Report: Fiscal Years 2022-2024. Accessed at: https://www.nasbo.org/reports-data/state-expenditure-report
[15] KFF. Total Medicaid MCO Enrollment, 2024. Accessed at: https://www.kff.org/medicaid/state-indicator/total-medicaid-mco-enrollm…
[16] Centers for Medicare & Medicaid Services. Medicaid and Children's Health Insurance Program (CHIP) Programs; Medicaid Managed Care, CHIP Delivered in Managed Care, and Revisions Related to Third Party Liability. May 2016. Accessed at: https://www.federalregister.gov/documents/2016/05/06/2016-09581/medicai…
[17] Medicaid and CHP Payment and Access Commission. Directed Payments in Medicaid Managed Care. October 2024. Accessed at: https://www.macpac.gov/wp-content/uploads/2024/10/Directed-Payments-in-…
[18] Medicaid and CHIP Payment and Access Commission. The Effect of State Approaches to Medicaid Financing on Federal Medicaid Spending. November 2021. Accessed at: https://www.macpac.gov/wp-content/uploads/2021/11/The-Effect-of-State-A…
[19] Government Accountability Office. CMS Needs More Information on States’ Financing and Payment Arrangements to Improve Oversight. GAO 21-98. December 2020. Accessed at: https://www.gao.gov/assets/gao-21-98.pdf
[20] Government Accountability Office. Rapid Spending Growth in State Directed Payments Needs Enhanced Oversight and Transparency. GAO-24-106202. December 2023. Accessed at: https://www.gao.gov/assets/gao-24-106202.pdf
[21] Government Accountability Office. Rapid Spring Growth in State Directed Payments Needs Enhanced Oversight and Transparency. December 2023. Accessed at: https://www.gao.gov/assets/gao-24-106202.pdf
[22] United States, Congress. Public Law 89-97, Social Security Amendments of 1965. 79 Stat. 286. Government Printing Office, 30 July 1965. Accessed at: https://www.govinfo.gov/content/pkg/STATUTE-79/pdf/STATUTE-79-Pg286.pdf
[23] Centers for Medicare & Medicaid Services. Medicaid and Children’s Health Insurance Program Managed Care Access, Finance, and Quality Final Rule (CMS-2439-F) Fact Sheet. April 2024. Accessed at: https://www.cms.gov/newsroom/fact-sheets/medicaid-and-childrens-health-…
[24] Hulver, S., Burns, A., Mathers, J. Reconciliation Language Could Lead To Cuts in Medicaid State-Directed Payments to Hospitals and Nursing Facilities. KFF. June 2025. Accessed at: https://www.kff.org/medicaid/reconciliation-language-could-lead-to-cuts…
[25] Ibid.
[26] Congressional Budget Office. An Update to the Budget and Economic Outlook: 2024 to 2034. Accessed at: https://www.cbo.gov/system/files/2024-06/60039-Outlook-2024.pdf
[27] Ekland, C., Hou, C., Pervin, A., Topiwala, R. Medicaid State-Directed Payments: An Update on CBO’s Modeling. September 2025. Accessed at: https://www.cbo.gov/system/files/2025-09/61699-Medicaid.pdf
[28] United States, Centers for Medicare & Medicaid Services. “Medicaid Program: Medicaid Managed Care, State Directed Payments, and Medicaid Fee-for-Service Targeted Payment Mechanisms.” Federal Register, 22 May 2026, www.federalregister.gov/documents/2026/05/22/2026-10292/medicaid-progra…. Accessed 5 June 2026.
[29] Daly, Rich. “Some Providers Seek More Medicaid Patients as Program’s Finances Improve.” Healthcare Financial Management Association (HFMA), Fast Finance, https://www.hfma.org/fast-finance/some-providers-seek-more-medicaid-pat…
[30] Dobson, Allen, Joan DaVanzo, and Namrata Sen. "The cost-shift payment ‘hydraulic’: foundation, history, and implications." Health Affairs 25.1 (2006): 22-33.
[31] Graham, John R. “Busting the Myth of Hospital Cost Shift.” Paragon Health Institute, 6 Apr. 2026, paragoninstitute.org/paragon-prognosis/busting-the-myth-of-hospital-cost-shift/.
[32] White, C. Contrary To Cost-Shift Theory, Lower Medicare Hospital Payment Rates For Inpatient Care Lead To Lower Private Payment Rates. Health Affairs. 2013; 32(5): 935-943. Accessed at: https://doi.org/10.1377/hlthaff.2012.0332
[33] Burns, Alice, et al. “5 Key Facts About Medicaid and Provider Taxes.” KFF, 1 Dec. 2025, www.kff.org/medicaid/5-key-facts-about-medicaid-and-provider-taxes/. Accessed 15 May 2026.
[34] Minton, Robert, and Casey B. Mulligan. Difference-in-Differences in the Marketplace. No. w32111. National Bureau of Economic Research, 2024. Another distinction between the prospective effects of the WFTC on provider prices and historical relationships between policies and prices is that the use of SDPs and provider taxes was expected to expand significantly beyond what is was before 2025.
[35] Jaffe, Sonia, et al. Chicago Price Theory, 2nd ed., Princeton University Press, 2026.
[36] Congressional Budget Office. Supplemental Cost Estimate: Public Law 119-21, to Provide for Reconciliation Pursuant to Title II of H. Con. Res. 14 Title IV, Committee on Commerce, Science, and Transportation Section 40002, Spectrum Auctions. Oct. 25, 2025. Accessed at: https://www.cbo.gov/system/files/2025-10/PL%20119-21-Spectrum.pdf.
[37] Rao, Preethi, et al. State-Level Impacts of Key Medicaid Provisions in the One Big Beautiful Bill Act. 26 Feb. 2026. RAND, https://www.rand.org/pubs/research_reports/RRA4098-1.html.
[38] Congressional Budget Office. Re: Mandatory Spending Under the Jurisdiction of the House Committee on Energy and Commerce. March 5, 2025. Accessed at: https://www.cbo.gov/system/files/2025-03/61235-Boyle-Pallone.pdf
[39] Kempski, A., Bai, G. Medicaid Financing Requires Reform: The North Carolina Case Study. March 2024. Accessed at: https://www.healthaffairs.org/content/forefront/medicaid-financing-requ…
[40] Kempski, A., Bai, G. Medicaid Financing Requires Reform: The North Carolina Case Study. March 2024. Accessed at: https://www.healthaffairs.org/content/forefront/medicaid-financing-requ…
[41] Hammond, J. Biden’s Medicaid Changes: High Costs, Misguided Policy. Paragon Health Institute. November 2024. Accessed at: https://paragoninstitute.org/medicaid/bidens-medicaid-changes-high-cost…
[42] 2025 State Expenditure Report. National Association of State Budget Officers, 2025, https://www.nasbo.org/reports-data/state-expenditure-report.
[43] Manning, Willard G., et al. “Health Insurance and the Demand for Medical Care: Evidence from a Randomized Experiment.” The American Economic Review, vol. 77, no. 3, 1987, JSTOR, pp. 251–77, https://www.jstor.org/stable/1804094
[44] Aron-Dine, Aviva, et al. “The RAND Health Insurance Experiment, Three Decades Later.” Journal of Economic Perspectives, vol. 27, no. 1, 2013, pp. 197–222, https://doi.org/10.1257/jep.27.1.197.
[45] Ellis, Randall P., et al. “Health Care Demand Elasticities by Type of Service.” Journal of Health Economics, vol. 55, Sept. 2017, pp. 232–43, https://doi.org/10.1016/j.jhealeco.2017.07.007.
[46] Brot-Goldberg, Zarek C., et al. What Does a Deductible Do? The Impact of Cost-Sharing on Health Care Prices, Quantities, and Spending Dynamics. National Bureau of Economic Research Working Paper Series. No. 21632, Oct. 2015, https://doi.org/10.3386/w21632.
[47] Einav, Liran, et al. “Private Provision of Social Insurance: Drug-Specific Price Elasticities and Cost Sharing in Medicare Part D.” American Economic Journal: Economic Policy, vol. 10, no. 3, 2018, pp. 122–53, https://doi.org/10.1257/pol.20160355.
Footnotes
[i] SDPs allow states to direct managed care organizations to pay providers according to specific rates or methods.
[ii] Commercial payers include employment-based and individual coverage.
[iii] For FY 2026, the Federal Medical Assistance Percentage – or the amount that the federal share of Medicaid funding for each state - ranged from 50 percent to 76.9 percent. However, states receive a different match rate for certain categories of spending, including administrative costs (50 percent) and the Medicaid expansion population (90 percent). As such, their share of total Medicaid spending is lower than their contribution based on the Federal Medical Assistance Percentage (FMAP) alone.
[iv] Under the guarantee test, if the provider tax is applied below a “safe harbor” level, which is set based on a percent of the net patient service revenues received, then it is determined to not have an indirect hold harmless guarantee and is thus permissible under the law, as long as no direct guarantee is in place and the other tests are met. Prior to the WFTC legislation, for taxes above 6 percent (the prevailing safe harbor rate), an additional test is applied to assess whether 75 percent of taxpayers in a class receive more than 75 percent of the cost of the tax back through enhanced Medicaid rates.
[v] Data for Connecticut and New Mexico were missing and were excluded from these state-level calculations. Data may not fully account for all state funds.
[vi] All states with the exception of Alaska have Medicaid provider taxes as of 2025.
[vii] Consider a state with an FMAP of 65% and a $1,000 dollar Medicaid budget; $650 financed by the federal government and $350 by the state itself. Let’s suppose this state finances a $400 SDP through a provider tax that generates $400 for the state’s general fund. The state’s Medicaid budget has now increased to $1,400, with no change in spending for the state, but an increase of $260 for the federal government. Through this financing arrangement the state share of total spending ($1,400) has decreased from 35% to 9% and the federal spending share has increased from 65% to 91%, even though the official FMAP is only 65%.
[viii] Currently, for physician services and payments to academic medical centers or safety net hospitals, supplemental payments can be made up to the average commercial rate. CMS has proposed changes to payment limits in the fee-for-service delivery system in their proposed rule “Medicaid Managed Care State Directed Payments and Medicaid Fee-for-Service Targeted Medicaid Practitioner Payments,” released May 22, 2026: https://www.govinfo.gov/app/details/FR-2026-05-22/2026-10292
[ix] Under the 2024 rule, states would have to show that these SDPs did not exceed ACR for the relevant provider group, suggesting that ACR is 3-5 times above Medicare in these states.
[x] Prior to the WFTC legislation, some states designed taxes that taxed Medicaid volume at a higher rate than non-Medicaid volume. The WFTC legislation prohibits this practice and in January 2026, CMS codified this prohibition in the rule “Medicaid Program: Preserving Medicaid Funding for Vulnerable Populations – Closing a Health Care-Related Tax Loophole.” https://shvs.org/cms-finalizes-rule-prohibiting-certain-non-uniform-pro…. However, this does not affect our estimates as we assume a policy of uniform taxation in the baseline and in the alternative (under WFTC legislation).
[xi] Although supply must slope up and demand slope down as in Figure 4, the magnitude of the slopes is part of our investigation and can be different than shown in the figure.
[xii] If hospitals don’t increase Medicaid volume in response to these payments, there will be no shift from Residual Supply Curve 1 to 2.
[xiii] Provider entry is likely limited in the short run, so the provider switching effect is expected to dominate, especially as states set SDPs up to the ACR, leading to a decline in non-Medicaid supply.
[xiv] For example, see the American Hospital Association’s resistance to reductions in the provider tax mandated in the WFTC legislation. (https://www.aha.org/fact-sheets/2025-02-07-fact-sheet-medicaid-provider…).
[xv] This does mitigate some of the deadweight losses associated with a tax. See Summers, L. Some Simple Economics of Mandated Benefits. American Economic Review 1989;79(2):177-183.
[xvi] Under the old ceiling, Medicaid payments for other services could not go up the ACR.
[xvii] Non-expansion states do not face the phase-down, but they are still prevented from expanding provider taxes beyond their current structure. The practical effect is that states cannot easily offset lower SDP caps by broadening the tax base or raising the tax rate.
[xviii] The deadline for the cuts is January 1, 2028, or earlier if the SDP was not grandfathered. The requirement is more complex, and potentially more restrictive, for nursing-facility rates that are not published by Medicare.
[xix] It is a form of Bayesian reasoning in which the prior literature is the source of Bayesian priors. Sensitivity analysis across the range of published estimates is the practical analog of integrating over a prior distribution.
[xx] Under this scenario, provider tax rates would fall by at least 2.5 percentage points, because states can set a rate below the 3.5 percent “safe harbor” threshold.
[xxi] Using 65% as the federal share of Medicaid spending from: https://www.kff.org/state-category/medicaid-chip/medicaid-spending/
[xxii] In their report, RAND notes that SDPs with approval dates prior to July 19, 2025, were included in their analysis. ASPE analysis of the full set of SDP pre-prints for services provided in 2025 indicates that this is only represents half the SDP spending in 2025.
[xxiii] The federal Medicare spending changes are derived by scaling non-Medicaid payer benefits by the product of (1) the average share of hospital and nursing facility non-Medicaid Medicare spending (30.8%), (2) the share of the spending response relative to total payer benefits (0.79), and (3) the spending share weighted average of Medicare FFS and MA price elasticity with respect to the commercial price (0.412). This yields a total Medicare savings of $50 billion ($502*0.308*0.79*0.412), $62 billion ($619*0.308*0.79*0.412), and $88 billion ($875*0.308*0.79*0.412), depending on if the budget score comes from CBO, RAND or the ASPE sensitivity analysis, respectively. The federal spending reductions coming from reduced support in the ACA and ESI market are based on scaling our total expenditure estimate by the average share of federal dollars spent on ACA + ESI, non-drug personal health care expenditures (15.9%), yielding savings estimates ranging from $47-$81, depending on if the budget score comes from CBO, RAND or the ASPE sensitivity analysis, respectively.
[xxiv] We expect that lowering provider prices will reduce federal spending in traditional FFS Medicare and Medicare Advantage (MA), although by a lesser percentage than for the commercial sector. MA negotiates hospital rates in a market setting. Facing higher market costs, MA plans rationally increase their bids, which in the aggregate determine Medicare payments to MA plans. Federal FFS costs also reflect broad market trends, because market prices influence market-basket updates linked to input prices in health care markets. The Technical Appendix explains how we quantify these effects.
[xxv] Number of Americans in 2024 without Medicaid (includes private coverage, Medicare, VA or CHAMPVA, and the uninsured) from https://www.census.gov/library/publications/2025/demo/p60-288.html
[xxvi] This is the fraction of the provider tax that is passed on to consumers in the form of higher prices. If supply is more price-elastic than demand then providers will pay a smaller share of the provider tax (and the pass-through rate will be higher), and vice versa.
[xxvii] 4 years where the rate is being phased in by being lowered by 0.5 percentage points per year and 3 years where the rate is 3.5 percentage points (fully phased in).
[xxviii] We assume that RAND and CBO have no provider tax cuts prior to 2028.
[xxix] This quantity does not include the cost in their role as federal taxpayers.
[xxx] This is based on taking an average over the phase in period (2028-2031, 4 years) and the full phase in period (2032-2034, 3 years).
[xxxi] PHC expenditures is used instead of total health expenditures as this policy change is mainly expected to affect expenditures on direct patient care and not the other terms included in total health expenditures like investment, spending on public health programs and health insurance administration costs.
[xxxii] Based on the estimated relationship between a 1% change in marketplace premiums and the resulting % change in subsidy spending. This is added to capture the fact that federal ACA subsidy spending will fall more for a given change in premium costs.
[xxxiii] (1) and (4) from Table 5 in https://www.cms.gov/files/zip/nhe-projections-tables.zip, (2) and (3) from https://www.cbo.gov/system/files/2024-06/51298-2024-06-healthinsurance…
*This content is in the process of Section 508 review. If you need immediate assistance accessing this content, please submit a request to Eden Volkov, eden.volkov@hhs.gov. Content will be updated pending the outcome of the Section 508 review.