
Derek Brown
Washington University
Benjamin Allaire and Joshua Wiener
RTI International
Printer Friendly Version in PDF Format (25 PDF pages)
ABSTRACT
Long-term services and supports (LTSS) are expensive. The average private pay cost of a private room nursing home stay in 2014 was about $88,000 a year. Although this cost is insurable through private long-term care (LTC) insurance, coverage is low. At the same time, limited data are available about people's preferences for various features of LTC insurance, inhibiting our understanding of the alignment between consumer preferences and LTC insurance options. In addition, little is known about how the American public views government and private insurance options and preferences between mandatory and voluntary approaches. To address this knowledge gap, a discrete choice experiment (DCE) was conducted as part of the 2014 Survey of Long-Term Care Awareness and Planning.
As insurers and policymakers seek to design insurance policies and initiatives to promote better financial coverage of LTSS for the American population, a key issue is what features of insurance policies consumers most desire, and what are they willing to trade off among those attributes. This study suggests that consumers have strong preferences. How to resolve those conflicts is the challenge for both insurers and policymakers.
This Issue Brief presents the findings from a DCE conducted as part of the 2014 Survey of Long-Term Care Awareness and Planning. It was authored by Derek Brown, Benjamin Allaire and Joshua Wiener. The authors gratefully acknowledge contributions of William Marton and Samuel Shipley of ASPE/HHS. The views expressed in this brief are those of the authors and do not express the views of HHS or RTI International.
Executive Summary
Long-term services and supports (LTSS) are expensive. The average private pay cost of a private room nursing home stay in 2014 was about $88,000 a year (Genworth, 2014). Although this cost is insurable through private long-term care (LTC) insurance, coverage is low. At the same time, limited data are available about people's preferences for various features of LTC insurance, inhibiting our understanding of the alignment between consumer preferences and LTC insurance options. In addition, little is known about how the American public views government and private insurance options and preferences between mandatory and voluntary approaches.
To address this knowledge gap, a discrete choice experiment (DCE) was conducted as part of the 2014 Survey of Long-Term Care Awareness and Planning, which was sponsored by the Office of the Assistant Secretary for Planning and Evaluation/U.S. Department of Health and Human Services. The DCE was designed to assess respondents' preferences over seven specific plan attributes, to measure attitudes and characteristics affecting potential demand, and to estimate the economic value of LTC insurance scenarios. The survey was conducted in the summer of 2014 with a nationally representative sample of 15,298 non-institutionalized persons aged 40-70 from the web-based KnowledgePanel®.
Key Findings:
-
Respondents generally expressed strong preferences for low-cost policies offered by private insurers with long benefit periods and high benefit amounts. A $30 per month premium was the most desired attribute and a $400 per month premium the least desired. Respondents exhibited strong preferences on the length of the benefit periods: 1-year policies were strongly undesirable, while lifetime benefits were highly desirable. Consumers did not express strong preferences about medical underwriting and deductible periods.
-
On average, respondents preferred voluntary enrollment to mandatory enrollment. They also preferred private insurance to a government plan.
-
Among persons who expressed a willingness to consider LTC insurance in some scenarios, respondents preferred a 3-year policy over a 1-year policy up to a cost of $85-$100 per month extra. To go from a $50 a day coverage policy to a $300 a day policy, respondents would be willing to pay an additional $69-$80 per month. They would pay the most, up to $175-$213 per month, to extend the benefit period from 1 year to their entire lifetime. Consumers would only be willing to pay around $30 per month to eliminate medical underwriting, much less than actuaries would calculate is necessary. Similarly, they would be willing to be pay between $12-$19 per month to have a private insurer rather than the government, suggesting that they are fairly indifferent to the type of insurer. On average, it would require $106 per month worth of extra benefits or subsidy above what they could receive through a voluntary private insurance policy for respondents to be indifferent about mandatory LTC insurance.
-
When including everyone, including those who did not choose any of the LTC insurance scenarios, the economic value of a voluntary $100 daily benefit, 3 year policy would be $178-$185 per month, whereas the economic value for a mandatory plan with the same benefits would be $125-$130 per month. (The mandatory plans have lower values because they are less desirable to consumers.) Including everyone, there is an approximately $50 per month difference between the economic value of a voluntary and mandatory plan. In other words, for this particular simulated plan, it would require $50 per month in additional benefits or subsidy for consumers to be indifferent to a requirement for a mandatory plan compared to a voluntary plan.
-
In a voluntary setting, predicted long-term take up exceed 50 percent for a $100 daily benefit and 3-year policy at approximately the $50 per month premium cost. Above this cost, fewer than half of respondents would be expected to choose LTC insurance voluntarily. Even at $25 per month, about half of consumers would not choose a LTC insurance policy.
As insurers and policymakers seek to design insurance policies and initiatives to promote better financial coverage of LTSS for the American population, a key issue is what features of insurance policies consumers most desire, and what are they willing to trade off among those attributes. This study suggests that consumers have strong preferences. How to resolve those conflicts is the challenge for both insurers and policymakers.
Introduction
The current system of financing LTSS in the United States has many problems. LTSS are expensive. The average private pay cost of a private room nursing home stay in 2014 was about $88,000 a year and exceeded $100,000 in 16 states (Genworth, 2014). Although Medicare and private insurance cover short-term skilled services in nursing homes and home health agencies, they provide little coverage for people needing care over an extended period. As a result, individuals must pay out-of-pocket for LTSS and can eventually face high costs after accessing such services. One study estimated that about 6 percent of people turning age 65 in 2005 were expected to incur out-of-pocket LTSS expenses of $100,000 or more over their remaining lifetimes and about 12 percent to incur expenses from $25,000 to $100,000 (Kemper, Komisar, & Alecxih, 2005). Thus, paying for LTSS often results in routine catastrophic out-of-pocket costs for people who use services.
Although LTC insurance market has existed since the mid-1980s, the market has remained small. In 2012, approximately 7 million LTC policies were in force, a number that has been essentially flat since 2005 (National Association of Insurance Commissioners, 2014). Approximately 11.5 percent of people aged 40-70 have some type of LTC insurance (Wiener et al., 2015). Many policies have limitations in terms of length of covered benefits and inflation adjustments, and few provide benefits in case of lapse. In addition, LTC insurance policies are expensive. According to the American Association for Long-Term Care Insurance (2015), the average cost in 2013 of an LTC insurance policy for a couple aged 55 with $162,000 each in benefits and 3 percent annual inflation protection was $3,725 a year or $310.42 per month. Because LTSS use is exponential by age, prices rise quickly as people grow older. As a result, many people find policies to be unaffordable or not worth the cost (Wiener et al., 1994). Moreover, in 2010, several major carriers announced large premium increases for existing policyholders or announced that they were leaving the market (Lieber, 2010; Tergesen & Scism, 2010).
Especially because policies are expensive, tradeoffs among policy benefits are required for most people considering purchase, but few systematic data are available about people's preferences for various features of LTC insurance. The purpose of this issue brief is to present the findings from a DCE conducted as part of the 2014 Survey of Long-Term Care Awareness and Planning, which was designed to elicit a realistic assessment of respondents' preferences and willingness to pay.
Research Questions
This issue brief provides answers to the following important policy questions:
-
What are people's preferences for LTC insurance plans?
-
Which features are most important in selecting an LTC insurance plan?
-
Given this information, what is the potential estimated demand (uptake) for a hypothetical LTC insurance plan?
-
What plan features and bundles offer the most economic value to consumers?
Background
Private LTC insurance is very non-standardized, giving consumers substantial flexibility in designing the policy they purchase. Policies vary in the number of years/amount of money provided in benefits, daily benefit level, deductible period, whether inflation adjustments are provided over time, and degree of medical underwriting. All of these characteristics combine to determine the price of the policies. This lack of standardization makes comparison of policies across insurers difficult for consumers.
Relatively few up-to-date data are available on the characteristics of current private LTC insurance policies. About half of policies purchased in 2012 had a daily benefit below $149 a day and almost all had a deductible period of 90-100 days (American Association for Long-Term Care Insurance, 2015). Policies generally have a direct relationship between the benefit amount and the price; for example, for a policy that is otherwise the same, a policy paying $200 a day costs twice as much as a policy that pays $100 a day. About 11 percent of new policies had a benefit period of 3 years or less, 31 percent had benefit periods of 3 years, 27 percent had benefit periods of 4 years, and 31 percent had benefit periods of 5 years or more. Virtually all individually sold private LTC insurance policies have medical underwriting, which means that policies will only be sold to people who are healthy and not likely to need LTSS in the near to medium term (Cohen, Kaur, & Darnell, 2013). In recent years, LTC insurance companies have tightened medical underwriting (O'Leary, 2012).
Because relatively few people have private LTC insurance (Wiener et al., 2015) and because of the barriers to its expansion (Cohen, Kaur & Darnell, 2013; O'Leary, 2012), some observers have proposed either voluntary or mandatory public LTC insurance (Wiener, 2013). Advocates of this approach contend that public insurance programs can provide benefits more efficiently, cover more people, and be financed more progressively than private LTC insurance. The Patient Protection and Affordable Care Act included the Community Living Assistance and Support Services (CLASS) Act, which was not implemented; it would have been a voluntary public LTC insurance program that targeted the working-age population for enrollment and provided a modest cash benefit (Wiener, 2010).
To address the issues raised by the CLASS Act, others have proposed mandatory, public LTC insurance programs (Butler et al., 2013). Under such a program, everyone would be eligible for benefits if disabled enough, regardless of income and assets. Although different in many ways, the program would have many similarities to Social Security and Medicare Part A in its requirement that everyone participate and help pay for the program if financially able to do so. Although numerous proposals have been put forward over the years, none has been enacted, in part because many people resist the increased government spending and the larger role of government that it would require (Wiener, Illston, & Hanley, 1994; Wiener, 2013, 2014).
Data and Methods
DCEs, also known as conjoint analysis, are a form of stated preference survey research. The DCE method is used widely to measure preferences and anticipated choice behavior in marketing, transportation, environmental economics, and health care (Orme, 2009). The basic premise of DCE is that products or services can be characterized by a series of well-defined features, or "attributes" (product characteristics). In research studies, each attribute is categorized into a set of typically 2-4 "levels," or options within an attribute. (For example, the attributes of "color," "route," and "vehicle type" describe a red westbound bus--versus, say, a blue eastbound train.) A relatively small set of attributes and levels can be combined in different ways to represent hundreds or thousands of discrete alternative options.
In this study, our goal is to understand respondents' preferences about LTC insurance to better understand what factors are more and less important to consumers. To measure these preferences, we developed a series of paired comparisons of alternative LTC insurance policies. Respondents were asked to compare a series of two hypothetical LTC insurance policies, described by specific attributes, and select which they preferred, allowing a third additional option of "neither" LTC insurance policy shown. A strength of DCE compared to other stated preference survey methods is that preferences are measured through a series of "comparison shopping" exercises. This imposes the economic ideas of budget constraints and opportunity costs (the value of the alternative not chosen), similar to what people actually face when making real-world purchases. To stay within their budget, respondents must "give up" some desirable features of one alternative to select another, and vice versa. In contrast, general or open-ended questions about how important or valuable a characteristic is are typically unconstrained and may elicit unrealistic estimates of preferences for features or participation.
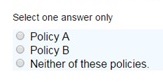
Survey. In this study, respondents completed two related sets of DCE questions, which we refer to below as "DCE1" and "DCE2." In each, participants were asked to view a comparison and to select Policy A, Policy B, or "neither of these policies" (known as an "opt-out" in the DCE literature). DCE1 asked respondents to select among plans described by six attributes: daily benefit, benefit period, deductible period, health requirements, type of insurer, and monthly premium. DCE2 included all attributes from DCE1 and added an attribute of voluntary or mandatory participation in the LTC plan. Each attribute took on 2-4 discrete levels, which are shown in Table 1. During the survey, respondents were introduced to each attribute individually on short descriptive survey screens, which included slightly longer descriptions of the concepts than in Table 1.
The attributes and levels above can be used to construct 1,024 plans in DCE1 and double that in DCE2. Although the number of unique combinations exceeds tens of thousands pairwise comparisons, the DCE literature on experimental design (Johnson et al., 2013) has established that only a small fraction are needed to estimate preferences under standard statistical assumptions. We selected 500 comparisons for DCE1 and 300 comparisons for DCE2 using accepted experimental design statistical procedures. To implement this, individual respondents were randomly assigned to one of 100 blocks of situations so that each respondent to DCE1 was asked to complete only five tasks. A similar random assignment to 100 blocks of three comparisons per respondent was used for DCE2. Figure 1 presents an example of the choice presented to respondents in DCE1. To reduce any possible order effects, within each block, the questions were randomly ordered and within each question, policies A and B were randomly selected for the left and right part of the screen. The order of the attributes or features (rows) was held constant across respondents. Respondents were also asked a variety of other questions on the survey before and after the DCE, which are described in other briefs. In this DCE analysis, we use some of the data on demographics and attitudes toward LTC insurance.
Sample. The survey was fielded by using KP, GfK's standing Internet panel.1 The survey sample consisted of non-institutionalized adults aged 40-70 residing in the United States. The survey was administered online from August 8, 2014, to September 21, 2014. Survey respondents received e-mail notifications and reminders to fill out the survey and were rewarded for their participation with 10,000 KP "points" (equivalent to about $10) that can be exchanged for merchandise and other prizes. Of the 24,878 people sampled, 15,298 completed the main survey, yielding a response rate of 61.5 percent.
From the 15,298, we removed an additional 61 people who skipped any of the DCE1 or DCE2 questions, 34 who picked policy "A" or "B" in all eight scenarios (DCE1 and DCE2), and n = 309 from the first percentile of survey response times (total, DCE1, or DCE2). The latter selection, which made little substantive difference on the results, was designed to eliminate any respondents whose response times suggested that they may not have fully considered the questions being asked. The median response time was about 2 minutes for the five DCE1 questions and about 1 minute for the three DCE2 questions. The final analytic sample size for the DCE was 14,894 people.
Six percent of respondents (897 of 14,894) chose "no plan" in all scenarios in DCE1 and DCE2. These persons are included in the analyses below because having a strong preference against the LTC plans shown does not indicate invalid data. Instead, it indicates that for the combinations of attributes that were shown, the potential benefits of LTC plans did not outweigh the premium costs that were offered. It is conceivable that these respondents might find LTC plans acceptable under a wider combination of plan options, subsidies, or other scenarios not included in the survey. (The rate of "no plan" for all five questions was 17.9 percent in DCE1 and 8.6 percent in DCE2, but the total overlap reduces the rate to 6.0 percent overall.)
Statistical Analysis. With DCEs, the pattern of stated choices made by a survey respondent provides the data for a statistical model of behavior. These are analyzed using standard discrete choice econometric techniques (e.g., Train, 2009). Specifically, we used a conditional logistic regression of the likelihood of choosing a specific A/B/no plan choice, as a function of the scenario shown to respondents. The parameter estimates indicate the relative importance to respondents of the attributes--that is, of different features of LTC insurance. These estimates are shown graphically in Figure 2 and Figure 3, numerically in Table 2. Further, we tested the interaction between personal characteristics or attitudes and the likelihood of choosing any plan in DCE1 (Table 3a and Table 3b). An additional interaction for DCE2 choices, calculated using the interaction, is shown in Table 3c between the voluntary/mandatory attribute and attitudinal characteristics. These parameter estimates directly govern the calculation of predicted choice probabilities for a hypothetical LTC insurance plan (Table 4) and the economic value of this hypothetical plan combination (Table 5).
The ratio of two preference parameters in Table 2 indicates what economists call a marginal rate of substitution--the rate at which respondents changed their selections when one attribute level was varied holding another constant. These relative preferences were also used to calculate the predicted choice probabilities for hypothetical LTC plans, estimates of economic value of attributes in the plan, and the economic value of the hypothetical plans themselves (Table 6). Note that, due to the design of the survey (with a "neither insurance" option), the ratio of these parameters represents preferences among those persons who were "in the market" for at least one plan out of the options show. Respondents who selected "neither insurance" for all options are not quantified in such a calculation since, for the options shown, they exhibited no trading off between features. However, it is possible that these persons would be in the market for a wider range of plan features that created more appealing combinations for them.
A typical way to express such marginal rates of substitution is in terms of attributes versus dollar cost, so that the ratio indicates a "marginal willingness to pay," the additional amount people would be willing to pay for each feature so as to be equally well off. For example, if a person is offered a 5-year plan instead of a 1-year plan and our estimate is $X per month, then the person is equally well off between having the 5-year plan over the 1-year plan, or in having X dollars per month. If the 5-year plan cost $X+1 per month more, then he or she would not buy it. If the 5-year plan cost $X-1 per month more, then he or she would be better off buying the 5-year plan. If the 5-year plan feature costs $X per month more than the 1-year plan, he or she would be exactly indifferent between having a 5-year policy ornot having it.
In interpreting the results, the predicted choices and economic value calculations (Table 5 and Table 6) and selected interactions (Table 3a and Table 3b) include the preferences of persons who selected "no plan." Preferences between plan features (Table 2, Table 3c, and Table 4) represent only persons who provided a Plan A/B choice for at least one comparison and did not select "no insurance" for all DCE scenarios.
These results are shown in Table 6 and provide a dollar value representation of the relative important of different attributes and levels. It is important to note that although the term "willing" is used, respondents were not formally asked about it that way (as they are in some other types of stated preference surveys). It is important to remember that these estimates, like most statistical analysis, are averages (means) of respondent data. Some portion of the sample has preferences representing with higher valuations and some portion has lower valuations.
To estimate potential LTC insurance demand or uptake, we simulated a hypothetical insurance plan with a $100 daily benefit amount and 3-year duration. (Other plan attributes--deductible, type of insurer, and health requirements--were held constant and excluded from the scenarios.) We varied the price of this plan from $25 per month to $250 per month and predicted LTC demand at these prices against an alternative of "no insurance" (Table 4).
Finally, for economic evaluation in a potential benefit-cost framework, we quantified the economic value of the three hypothetical plans to respondents. Specifically, we estimated the "consumer surplus" of each plan using a measure of "compensating variation." Compensating variation is the amount of money the individual would be willing to pay to secure an improvement in his or her economic utility (Lancsar & Savage, 2004). These estimates represent the average amount of money needed to be provided to be equally well off if that option were taken away.
Findings
Estimated Preferences for Long-Term Care Insurance Plan Features. Table 2 displays respondents' relative preferences for features of the LTC insurance policies. The estimates in this table are scaled to show respondents' relative preferences among the attributes, with 10 being the highest (most desired) and 0 being the lowest (least desired). These results are also shown graphically in Figure 2 and Figure 3. As can be seen in the figures, another dimension to these estimates is the relative importance of plan features (attributes) across their full range. Specifically, those with the largest range (i.e., premium cost) were the most important overall in determining choice behavior, and those with the smallest range (i.e., deductible levels) were least important. A 5 in this table represents an average of all the features, so larger deviations from 5 indicate more importance--desirable above 5 and undesirable below 5.
Respondents generally expressed strong preferences for voluntary, low-cost policies offered by private insurers with long benefit periods and high benefit amounts. A $30 per month premium is the most desired attribute and a $400 per month premium was the least desired attribute. There was not much variation across deductible periods. Respondents exhibited strong preferences over the length of the benefit periods: 1-year policies were strongly undesirable, while lifetime benefits were highly desirable. People strongly favored $300 a day benefits versus $50 a day benefits. A mandatory or "required" LTC insurance policy was viewed as being less desirable (4.0), while a voluntary plan was highly desired (6.9) (DCE2).
Personal Characteristics, Attitudes, and the Acceptability of Long-Term Care Insurance Policies. As described above, preferences were interacted with personal characteristics to explore how the likelihood of choosing a plan was associated with individual or attitudinal characteristics. LTC insurance acceptance increased with the level of assets owned by the respondent, with respondents far more likely to want LTC insurance if they had higher assets. In fact, assets over $100,000 represented the strongest predictor of LTC insurance uptake among the demographic interactions. Women were statistically less likely to choose an LTC plan. Holding everything else constant, being older, being married, and race/ethnicity were not statistically significant predictors of LTC insurance uptake. These results are presented in Table 3a.
The association between certain attitudinal characteristics and survey respondents' likelihood of choosing LTC plans is assessed in Table 3b. Here, the "opt-out" or "no insurance" indicator variable was interacted with binary indicators for whether or not someone agrees or strongly agrees with a series of statements. The sign and magnitude of the coefficient reflects the strength of preference for opting out. For example, respondents who agreed or strongly agreed with the statement "It is the responsibility of individuals to finance their LTC insurance" were substantially more likely to choose an LTC insurance plan.
Beliefs about financial responsibility were important indicators of intent to purchase an LTC insurance policy. Respondents were substantially more likely to opt into a plan if they felt it was their own responsibility to pay for their LTC. Surprisingly, those who believed that the government should help pay were also more prone to choosing a plan, although less strongly than those who felt the financial responsibility was on the individual. It appears that people who have strong opinions about financial responsibility for LTSS, in whatever direction, are most likely to have an intent to purchase LTC insurance.
Attitudes toward LTC insurance played a role as well. When people agreed with "Knowing that I have some LTC will give me peace of mind," they were substantially more likely to intend to purchase an LTC plan. However, reporting having "other priorities for [their] money than buying LTC" was not a significant association with intent to purchase LTC insurance.
Table 3c shows a similar analysis with interactions of attitudes toward the relative preference for mandatory enrollment in LTC plans. People preferred universal enrollment if they agreed/strongly agreed with the statement that "Everyone should have LTC and a mandatory, public program is the way to accomplish that" or that "Requiring people to buy LTC insurance is OK if the price is not too high." In contrast, those with negative universal enrollment preferences were likely to not want the government to tell them what to do about LTC insurance or trust the government to run an LTC insurance program.
Estimated Marginal Willingness to Pay for Changes in Long-Term Care Insurance. For each DCE, the average respondent's marginal willingness to pay was estimated (Table 6). Willingness to pay in this context can be interpreted as the amount of money the respondent would pay for the LTC insurance policy with the attribute shown, and represents a dollar value of the changes between categories shown in Figure 2 and Figure 3 (or Table 2). For example, respondents preferred a 3-year policy over a 1-year policy up to a cost of $100.09 per month extra. To go from a $50 a day coverage policy to a $300 a day policy, respondents were willing to pay an additional $79.84 per month.
These results mirror the relative preference ratios in that respondents were not willing to pay more than $7.83 per month eliminate the deductible period, but they would pay $175.38- $212.92 per month depending on the DCE, to extend the benefit period to their entire lifetime. Respondents would pay $27.91-$34.35 per month to forgo medical underwriting, a relatively small amount, despite the fact that the potential cost impact of the lack of medical underwriting played an important role in the decision not to implement the CLASS Act. Finally, on average, it would require $105.81 per month worth of extra benefits or subsidy above a voluntary private insurance policy for people to be indifferent to a mandatory policy.
For interpretation of these results, the marginal willingness to pay calculations represents the preferences of persons who selected LTC plans (because no substitution between features is observed among those who selected no plan). As noted above, 6.0 percent selected "no insurance" in all scenarios. These persons would likely have much lower value because the combinations shown to them were unacceptable in some or all cases. Therefore, in terms of a societal estimate of the value of a composite LTC plan, we cannot simply sum the marginal willingness to pay. The potential negative value of LTC plans, captured through the "opt-out" term, would also need to be included. Such information is shown in Table 5 and is discussed further below.
Estimated Potential Demand (Acceptability) for Simulated Long-Term Care Insurance Policies. In the LTC insurance marketplace, policies with many combination of features are purchased. Details of one hypothetical plan are shown in Table 4. This table presents the estimated market share of people who would select the simulated LTC plan or no insurance at various monthly premium costs (down the rows). In a voluntary setting, predicted long-term demand exceeds 50 percent for a $100 daily benefit and 3-year policy at approximately the $50 per month premium cost. Above this cost, less than half are expected to choose LTC insurance voluntarily.
Estimated Economic Value for Simulated Long-Term Care Insurance Packages. Table 5 presents calculations of compensating variation. These values represent a composite indication of the total value of an LTC plan including the preferences of consumers who may wish to have no plan (i.e., who place a negative value on LTC plans). Consumers would need to be paid $178.13 per month to be compensated for the removal of a simulated voluntary public plan with a $100 daily benefit amount and a 3-year duration. The plan under mandatory enrollment (based on DCE2 results) offers somewhat less value (e.g., $124.64 for a mandatory government plan vs. $178.13 for a voluntary government plan, a $53.49 difference), since this feature was less preferred.2
Table 6 presents the consumer "willingness to pay" for different LTC insurance attributes. For example, on average, in a voluntary environment, people who choose a plan are willing to pay $79.84 per month to have a policy that pays $300 per day in benefits compared to a policy that pays $50 per day in benefits. Similarly, in a voluntary environment, consumers who choose a play are willing to pay $19.41 per month to have a private rather than a government plan. This table illustrates that there are significant societal gains in terms of consumer utility and economic welfare to having these plan options. For policy analysis, such benefits would need to be considered against the full costs of providing these options.
Conclusion
This issue brief presents results of a DCE conducted as part of the 2014 Survey of Long-Term Care Awareness and Planning. The target population for the survey was the community-dwelling population aged 40-70. The goal of the DCE was to elicit consumer preferences regarding the features of LTC insurance--including benefit amount, benefit duration, deductible period, medical underwriting, and other attributes. The DCE also tested consumer choices regarding government and private LTC insurance and voluntary and mandatory policies. Although individual insurance companies may have conducted these types of studies, to the best of our knowledge this is the first DCE regarding LTC insurance for which the results are publicly available.
Although DCEs can add greatly to our understanding of consumer behavior, it is important to note that individual consumer experiences in the real world can never be fully captured on a stated preference survey. If persons were actually shown these LTC insurance options immediately after completing the survey and had to actually purchase the policies that they said they preferred, the uptake of LTC insurance would almost certainly be much lower. This result is to be expected. The DCE estimates are best thought of as hypothetical long-run potential estimates of demand and probably represent a high upper bound on the policies people would actually purchase or whether they would purchase any policy. Despite these limitations, the match between DCE data and real world behavior has been shown to be quite good over the long term in a variety of study settings, such as diabetes care (Salampessyet al., 2015), health risk reduction (Telser & Zweifel, 2007), HPV vaccination (Brown et al., 2014), hepatitis vaccination (Lambooij et al. 2015), Chlamydia screening (Ryan & Watson, 2009), physician prescribing (Mark & Swait, 2004), and emergency evacuation response (Whitehead, 2005).
This LTC insurance DCE highlights several aspects of consumer preferences. First, unless it is mandatory, substantial numbers of people will choose not to purchase an LTC insurance policy. Even at $25 per month, about half of consumers would not enroll in a policy with relatively generous benefits. This finding is consistent with the very low uptake for private LTC insurance in the actual marketplace.
Second, in declining order, consumers are mostly concerned about price, the length of coverage, and the daily benefit amount. Price is by far the most important factor to consumers. Consumers are less concerned about medical underwriting and whether the policy is offered by private insurers or the government. These findings suggest that consumers may find unappealing initiatives to make policies more affordable by reducing the length of coverage. The low value that consumers place on eliminating medical underwriting is problematic for efforts to broaden the base of people who can purchase private LTC insurance and initiatives, such as CLASS, which foundered on problems of adverse selection. The results regarding medical underwriting probably reflect the fact that only 7 percent of survey respondents reported that they had two or more chronic conditions. Thus, few people probably thought that they would benefit from elimination of medical underwriting. Although whether the insurer was a private company or the government was of middle importance and consumers preferred private insurers to government insurers, the difference was not great. On the other hand, although consumers might be open to a public LTC insurance program, respondents fairly strongly preferred that it be voluntary rather than mandatory. However, whether the policy was mandatory or voluntary had less variation than the variation regarding benefit periods and cost.
Third, acceptability of LTC insurance is related to sociodemographic characteristics and opinions regarding LTSS. Males; older people (65+); people in excellent, very good, or good health; Whites; and people with higher incomes and assets were more likely to choose an LTC insurance policy. Consistent with other research, people with high asset levels were most likely to select a policy (LifePlans, 2013). People who supported almost any government initiative to promote either private or public LTC insurance were more likely to choose an LTC insurance policy, suggesting that people who see some need for action of any kind are more likely to choose a policy.
Fourth, the DCE calculated consumer "willingness to pay" for various insurance features. In general, consumers would be willing to pay less for better features than insurers typically price those features. For example, for a voluntary plan, on average, consumers would be only willing to pay an additional $80 per month to receive a $300 a day benefit rather than a $50 a day benefit, even though insurers typically charge six times as much for a $300 benefit as for a $50 benefit. For example, at age 60, the federal LTC insurance program charges $125 per month for a 3-year policy with 5 percent inflation adjustment and a $100 a day benefit, but $374 per month for the same policy with a $300 a day benefit, almost $250 per month more (Federal Long-Term Care Insurance Program, 2015).
In terms of public policies, consumers would only be willing to pay around $30 to eliminate medical underwriting, much less than actuaries would calculate is necessary (Greenlee, 2011). Similarly, in mandatory and voluntary settings, they would be willing to be pay$12-$19 per month to have a private insurer rather than the government, suggesting that they are fairly indifferent to the type of insurer. Finally, consumers "in the market" for LTC insurance plans would be willing to pay $106 per month more to have a voluntary policy rather than a mandatory policy. Put another way, from an economist's perspective, consumers would be indifferent to a mandatory versus voluntary policy if the mandatory policy provided them with $106 per month more in benefits or subsidy. However, when the preferences of all persons are included and a particular plan is simulated, this difference drops to about $41.
As insurers and policymakers seek to design insurance policies and initiatives to promote better financial coverage of LTSS for the American population, a key issue is: what are the insurance policy features that consumers most desire and what are they willing to trade off among those attributes? This study suggests that consumers have strong preferences, some of which cannot be reconciled with actuarial estimates for the price of policies. How to resolve those conflicts is the challenge for both insurers and policymakers.
References
American Association for Long-Term Care Insurance. (2015).Long-Term Care Insurance Fact--Statistics.Westlake Village, CA. Available at http://www.aaltci.org/long-term-care-insurance/learning-center/fast-facts.php.
Brown, D.S., Poulos, C., Johnson, F.R., Chamiec-Case, L., Messonnier, M.L. (2014). Adolescent girls' preferences for HPV vaccines: A discrete choice experiment. Advances in Health Economics and Health Services Research, 24, 93-121.
Butler, L. Claypool, H., Feder, J., Ruttledge, L., & Stein, J. (2013). A Comprehensive Approach to Long-Term Services and Supports. Washington, DC: Long-Term Care Commission. Available at http://www.medicareadvocacy.org/wp-content/uploads/2013/10/LTCCAlternativeReport.pdf.
Cohen, M.A., Kaur, R., & Darnell, B. (2013). Exiting the Market: Understanding the Factors BehindCarriers' Decision to Leave the Long-Term Care Insurance Market. Waltham, MA: LifePlans, Inc. for the Office of the Assistant Secretary for Planning and Evaluation/U.S. Department of Health and Human Services. Available at https://aspe.hhs.gov/report/exiting-market-understanding-factors-behind-carriers-decision-leave-long-term-care-insurance-market.
Federal Long-Term Care Insurance Program. (2015).Premium Calculator.Washington, DC. Available at https://www.ltcfeds.com/ltcWeb/do/assessing_your_needs/ratecalcOut.
Genworth Financial. (2014). Genworth 2014 Cost of Care Survey Home Care Providers, Adult Day Health Care Facilities, Assisted Living Facilities and Nursing Homes. Richmond, VA. Available at https://www.genworth.com/dam/Americas/US/PDFs/Consumer/corporate/130568_032514_CostofCare_FINAL_nonsecure.pdf.
Greenlee, K. (2011). Memorandum on the CLASS Program to SecretarySebelius. Washington, DC: U.S. Department of Health and Human Services. Available at https://aspe.hhs.gov/sites/default/files/private/pdf/131516/CLASSmemo_0.pdf.
Johnson, F., Lancsar, E., Marshall, D., Kilambi, V., Mühlbacher, A., Regier, D.A., Bresnahan, B.W., Kanninen, B., & Bridges, J.F. (2013). Constructing experimental designs for discrete-choice experiments: Report of the ISPOR Conjoint Analysis Experimental Design Good Research Practices Task Force. Value Health, 16(1), 3-13. doi:10.1016/j.jval.2012.08.2223.
Kemper, P., Komisar, H.L., & Alecxih, L. (2005). Long-term care over an uncertain future: What can current retirees expect? Inquiry, 42(4), 335-350. Available at http://www.inquiryjournalonline.org/doi/abs/10.5034/inquiryjrnl_42.4.335.
Lambooij, M.S., Harmsen, I.A., Veldwijk, J., de Melker, H., Mollema, L., van Weert, Y., & de Wit, G.A. (2015).Consistency between stated and revealed preferences: A discrete choice experiment and a behavioural experiment on vaccination behavior compared. BMC Medical Research Methodology, 15, 19.
Lancsar, E., & Savage, E. (2004) Deriving welfare measures from discrete choice experiments: A response to Ryan and Santo Silva. Health Economics, 8(1), 3-20.
Lieber, R. (2010). When a safety net is yanked away. New York Times. Available at http://www.nytimes.com/2010/11/05/business/businessspecial5/05CARE.html?pagewanted=all&_r=1&.
LifePlans. (2013). Who Buys Long-Term Care Insurance in 2010-2011? Waltham, MA. Available at https://www.ahip.org/Issues/Content/Long-Term-Care-Insurance/Long-Term-….
Mark, T.L., & Swait, J. (2004).Using stated preference and revealed preference modeling to evaluate prescribing decisions. Health Economics, 13(6), 563-73. Available at http://www.ncbi.nlm.nih.gov/pubmed/15185386.
National Association of Insurance Commissioners. (2014). NAIC Long-Term Care Insurance Experience Exhibit Report for 2012. Kansas City, MO.
O'Leary, J. (2012). Long Term Care Insurance: Uncertainty Today--What's in Store for Tomorrow? Washington, DC: Long-Term Care Discussion Group. Available at http://www.ltcdiscussiongroup.org/archives.html.
Orme, B.K. (2009). Getting Started with Conjoint Analysis: Strategies for Product Design and Pricing Research. Madison, WI: Research Publishers.
Ryan, M., & Watson, V. (2009). Comparing welfare estimates from payment card contingent valuation and discrete choice experiments. Health Economics, 18(4), 389-401. Available at http://www.ncbi.nlm.nih.gov/pubmed/18677721.
Salampessy, B.H., Veldwijk, J., Jantine Schuit, A., van den Brekel-Dijkstra, K., Neslo, R.E.,Ardine de Wit, G., & Lambooij, M.S. (2015). The predictive value of discrete choice experiments in public health: An exploratory application. Patient. Available at http://www.ncbi.nlm.nih.gov/pubmed/25618790.
Telser, H., & Zweifel, P. (2007). Validity of discrete-choice experiments evidence for health risk reduction. Applied Economics, 39(1), 69-78.
Tergesen, A., & Scism, L. (2010). Long-term care premiums soar. Wall Street Journal. Available at http://www.nytimes.com/2010/11/05/business/businessspecial5/05CARE.html?pagewanted=all&_r=0.
Train, K. (2009). Discrete Choice Methods with Simulation. 2nd ed. Cambridge: Cambridge University Press.
Whitehead, J.C. (2005). Environmental risk and averting behavior: Predicting validity of jointly estimated revealed and stated behavior data. Environmental and Resource Economics, 32(3), 301-316.
Wiener, J.M. (2010). Implementing the CLASS Act: Six Decisions for the Secretary of Health and Human Services. Research Triangle Park: RTI Press. Available at http://www.rti.org/pubs/pb-0002-1009.pdf.
Wiener, J.M. (2012). The CLASS Act: Is it dead or just sleeping? Journal of Aging and Social Policy, 24(2), 118-135.
Wiener, J.M. (2013). After CLASS: The long-term care commission's search for a solution. Health Affairs, 32(5), 831-834.
Wiener, J.M. (2014). Financing Long-Term Care: More Same than Different, but with Some Twists. Paper presented at the RTI Policy Forum: The Past and Future of Long-Term Care: 1989-2039.
Wiener, J.M., Illston, L.H., & Hanley, R.J. (1994). Sharing the Burden: Strategies for Public and Private Long-Term Care Insurance. Washington, DC: Brookings Institution.
Wiener, J.M., Khatutsky, G., Thach, N., & Greene, A.M. (2015). Which Way for Long-Term Care Financing? Washington, DC: RTI International.
| FIGURE 1. An Example of Choices in DCE1 | |||||||||||||||||||||
|---|---|---|---|---|---|---|---|---|---|---|---|---|---|---|---|---|---|---|---|---|---|
| Choice #3 Suppose that you were offered a choice today to enroll in the following two long-term care insurance policies.
Which policy, if any, would you choose if these were the only options available? | |||||||||||||||||||||
| SOURCE: RTI International analysis of the 2014 Survey of Long-Term Care Awareness and Planning. NOTE: This is a screen shot of 1 of the 500 possible DCE1 tasks that respondents could have been randomized to see. |
| FIGURE 2. Relative Preferences for LTC Insurance Plan Features (DCE1) |
|---|
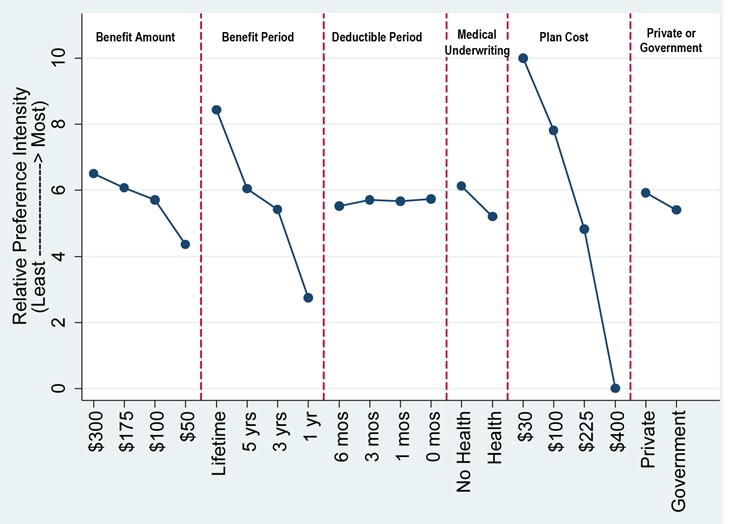 |
| SOURCE: RTI International analysis of the 2014 Survey of Long-Term Care Awareness and Planning. NOTES: Figure depicts the Table 2 results, rescaled in terms of relative importance to each other, 0 = least preferred, 10 = most preferred. |
| FIGURE 3. Relative Preferences for LTC Insurance Plan Features (DCE2) |
|---|
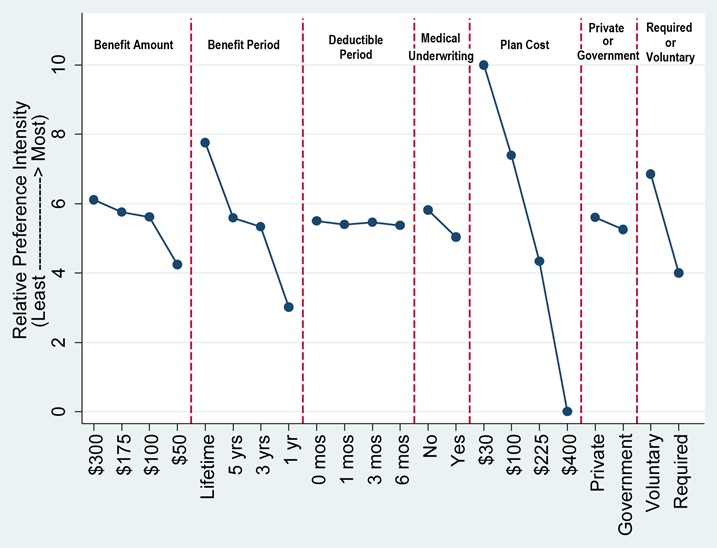 |
| SOURCE: RTI International analysis of the 2014 Survey of Long-Term Care Awareness and Planning. NOTES: Figure depicts the Table 2 results, rescaled in terms of relative importance to each other, 0 = least preferred, 10 = most preferred. |
| TABLE 1. The List of Attributes and Levels Included in the DCE | ||
|---|---|---|
| Attribute | Levels | Description |
| Daily Benefit | $300, $175, $100, $50 a day | How much the policy pays a day toward your LTC costs |
| Benefit Period | Lifetime, 5 years, 3 years, 1 year | How long the policy provides benefits |
| Deductible Period | None, 1 month, 3 months, 6 months | When you first become disabled, how long before the insurance company will pay for services |
| Health Requirements | None; Healthy and not disabled | Whether or not the plan requires a medical exam and a doctor's signature for purchase |
| Type of Insurer | Private company; Federal Government | The sponsor or seller of the insurance plan |
| Monthly Premium Cost | $30, $100, $225, $400 per month | The amount you pay each month to maintain coverage |
| Type of Enrollment (DCE questions 6-8 only) | Voluntary: no one must buy insurance; Mandatory plan: everyone must buy this policy | Whether or not purchase of the insurance plan shown is required by law |
| SOURCE: RTI International analysis of the 2014 Survey of Long-Term Care Awareness and Planning. | ||
| TABLE 2. Estimated Preferences for LTC Insurance Plan Features | ||
|---|---|---|
| Attribute: Level | DCE1 0-10 Scaled Importance Weight (Figure 2) | DCE2 0-10 Scaled Importance Weight (Figure 3) |
| Daily Benefit: $300/day | 6.5 | 6.1 |
| $175/day | 6.1 | 5.7 |
| $100/day | 5.7 | 5.6 |
| $50/day | 4.4 | 4.2 |
| Benefit Period: Lifetime | 8.4 | 7.8 |
| 5 years | 6.1 | 5.6 |
| 3 years | 5.4 | 5.3 |
| 1 year | 2.7 | 3.0 |
| Deductible Period: None | 5.7 | 5.5 |
| 1 month | 5.7 | 5.4 |
| 3 months | 5.7 | 5.5 |
| 6 months | 5.5 | 5.4 |
| Health Requirements: No | 6.1 | 5.8 |
| Yes | 5.2 | 5.0 |
| Type of Insurer: Private | 5.9 | 5.6 |
| Federal Government | 5.4 | 5.3 |
| Monthly Premium Cost: $30/month | 10.0 | 10.0 |
| $100/month | 7.8 | 7.4 |
| $225/month | 4.8 | 4.3 |
| $400/month | 0.0 | 0.0 |
| Voluntary purchase | n/a | 6.9 |
| Universal purchase | n/a | 4.0 |
| SOURCE: RTI International analysis of the 2014 Survey of Long-Term Care Awareness and Planning. NOTE: The estimates presented are the respondents' relative preferences among the attributes, with 10 being the highest (most desired) and 0 being the lowest (least desired). Thus, a $30/month premium is the most desired attribute and a $400/month premium is the least desired attribute. Among other things, the table shows that there is little variation in preference across deductible periods and that there is great variation across benefit periods, with 1-year policies being not very desirable and lifetime benefits being highly desirable. These data only include respondents who chose a plan. | ||
| TABLE 3a. Interactions of Personal Characteristics and Acceptability of LTC Plans (DCE1) | |||
|---|---|---|---|
| Attribute-Level Parameter | More (+) or Less (-) Likely to Choose LTC Plan | Estimated Coefficient | P-value |
| No insurance reference alternative ("opt-out") interacted with: | n/a | n/a | n/a |
| Constant (dummy, no interaction) | - | 0.390 | 0.001 |
| Female (vs. male) | - | 0.353 | 0.001 |
| Age 65+ (vs. age 65) | + | -0.071 | 0.048 |
| Married (vs. all other) | NS | 0.046 | 0.155 |
| Working for pay (vs. not working) | + | -0.183 | 0.001 |
| Fair/poor health (vs. excellent, very good, or good) | - | 0.099 | 0.018 |
| Black (vs. White non-Hispanic) | NS | -0.066 | 0.195 |
| Hispanic, any race (vs. White non-Hispanic) | NS | -0.047 | 0.407 |
| Other, multiple races (vs. White non-Hispanic) | NS | 0.038 | 0.576 |
| Assets $1-$100,000 (vs. no or negative assets) | + | -0.268 | 0.001 |
| >$100,000 (vs. no or negative assets) | + | -0.395 | 0.001 |
| Education: high school degree (vs. less than high school) | NS | 0.016 | 0.865 |
| Some college (vs. less than high school) | NS | -0.021 | 0.816 |
| College degree (vs. less than high school) | NS | -0.178 | 0.054 |
| Household income $15,000-40,000 (vs. $15,000) | NS | -0.074 | 0.208 |
| $40,001-100,000 (vs. $15,000) | + | -0.206 | 0.001 |
| >$100,000 (vs. $15,000) | + | -0.276 | 0.001 |
| SOURCE: RTI International analysis of the 2014 Survey of Long-Term Care Awareness and Planning. NOTE: NS = Not statistically significant. | |||
| TABLE 3b. Additional Interactions of Personal Characteristics and Acceptability of LTC Plans (DCE1) | |||
|---|---|---|---|
| Attribute-Level Parameter | More (+) or Less (-) Likely to Choose LTC Plan | Estimated Coefficient | P-value |
| Responsibility of individuals to finance their LTC, agree/strongly agree | + | -0.470 | 0.001 |
| Responsibility of children/family to finance LTC, agree/strongly agree | NS | 0.028 | 0.488 |
| If family members can no longer pay, relatives should help, agree/strongly agree | + | -0.128 | 0.001 |
| Responsibility of government to help pay for LTC, agree/strongly agree | + | -0.099 | 0.001 |
| Government should promote LTC insurance through taxes, agree/strongly agree | + | -0.262 | 0.001 |
| Government should allow LTC purchase with IRAs and 401(k)s, agree/strongly agree | + | -0.356 | 0.001 |
| Government should require all people to purchase LTC insurance, agree/strongly agree | + | -0.133 | 0.008 |
| Government should pay LTC costs when insurance benefits run out, agree/strongly agree | - | 0.141 | 0.001 |
| Government should offer voluntary, public LTC insurance plan agree/strongly agree | + | -0.203 | 0.001 |
| Government should establish mandatory, public LTC program, agree/strongly agree | + | -0.189 | 0.001 |
| Everyone should have LTC insurance and a mandatory, public program is the way to accomplish that, agree/strongly agree | + | -0.291 | 0.001 |
| Everyone should have LTC insurance, but private companies should provide the insurance, agree/strongly agree | + | -0.232 | 0.001 |
| Requiring people to buy LTC insurance is OK, if price is not too high, agree/strongly agree | + | -0.190 | 0.001 |
| Knowing that I have some LTC insurance will give me peace of mind, agree/strongly agree | + | -0.492 | 0.001 |
| Paying for LTC is individual responsibility, not government, agree/strongly agree | + | -0.375 | 0.001 |
| Government should not tell me what to do about LTC insurance, agree/strongly agree | + | 0.080 | 0.025 |
| I have other priorities for my money than buying LTC insurance, agree/strongly agree | NS | 0.049 | 0.100 |
| I do not trust government to run a LTC insurance program, agree/strongly agree | + | 0.074 | 0.028 |
| I do not trust private insurers, agree/strongly agree | + | 0.140 | 0.001 |
| I don't think I will need LTC so I don't need insurance, agree/strongly agree | NS | -0.039 | 0.418 |
| SOURCE: RTI International analysis of the 2014 Survey of Long-Term Care Awareness and Planning. NOTE: Model is the same as in Table 1, but personal characteristics (dummy-coded) are interacted with the no insurance reference alternative ("opt-out"). To reduce duplication, plan attributes and levels are not shown here. Magnitude of estimated coefficients reflects degree of importance, conditional on being statistically significance (see P-value). Each set separated by blank line and indentation represents a separate model. NS = Not statistically significant. | |||
| TABLE 3c. Interactions of Personal Characteristics and Preference for Universal Enrollment (vs. Voluntary) in LTC Plans (DCE2) | |||
|---|---|---|---|
| Attribute-Level Parameter | Larger (+) or Smaller (-) Preference for Universal Enrollment | Estimated Coefficient | P-value |
| Universal attribute interacted with dummy indicator variables for: | n/a | n/a | n/a |
| Everyone should have LTC insurance and a mandatory, public program is the way to accomplish that, agree/strongly agree | + | 0.187 | 0.001 |
| Everyone should have LTC insurance, but private companies should provide the insurance, agree/strongly agree | - | -0.108 | 0.001 |
| Requiring people to buy LTC insurance is OK, if price is not too high, agree/strongly agree | + | 0.189 | 0.001 |
| Knowing that I have some LTC insurance will give me peace of mind, agree/strongly agree | NS | 0.003 | 0.874 |
| Paying for LTC is individual responsibility, not government, agree/strongly agree | - | -0.065 | 0.001 |
| Government should not tell me what to do about LTC insurance, agree/strongly agree | - | -0.142 | 0.001 |
| I have other priorities for my money than buying LTC insurance, agree/strongly agree | NS | 0.004 | 0.809 |
| I do not trust government to run a LTC insurance program, agree/strongly agree | - | -0.106 | 0.001 |
| I do not trust private insurers, agree/strongly agree | + | 0.076 | 0.001 |
| I don't think I will need LTC so I don't need insurance, agree/strongly agree | NS | 0.014 | 0.569 |
| SOURCE: RTI International analysis of the 2014 Survey of Long-Term Care Awareness and Planning. NOTE: Model is the same as in Table 2, but attitudinal characteristics (dummy-coded) are interacted with the "mandatory enrollment" attribute. To reduce duplication, other plan attributes and levels from Table 2 are not shown here. Magnitude of estimated coefficients reflects degree of importance, conditional on being statistically significance (see P-value). | |||
| TABLE 4. Estimated Potential Demand (Acceptability) for Simulated LTC Insurance Package of $100 Daily Benefit Amount, 3-Year Duration (DCE1) | ||
|---|---|---|
| LTC Insurance Scenario | No Plan Estimated Share (95% confidence interval) | Simulated Plan Estimated Share (95% confidence interval) |
| No plan vs. $25/month plan | 45.9% (45.0, 46.7) | 54.1% (53.1, 55.0) |
| No plan vs. $50/month plan | 49.1% (48.1, 50.0) | 50.9% (50.0, 51.9) |
| No plan vs. $75/month plan | 52.2 (51.3, 53.2) | 47.8% (46.8, 48.7) |
| No plan vs. $125/month plan | 58.5 (57.5, 59.4) | 41.5% (40.6, 42.5) |
| No plan vs. $150/month plan | 61.5 (60.6, 62.4) | 38.5% (37.6, 39.4) |
| No plan vs. $250/month plan | 72.6 (71.7, 73.5) | 27.4% (26.5, 28.3) |
| SOURCE: RTI International analysis of the 2014 Survey of Long-Term Care Awareness and Planning. NOTES: Table 4 represents the simulated share of people who would select this specific LTC plan or no insurance plan if given a choice between these 2 alternatives at different prices (down the rows). Other plan features (deductible, type of insurer, health requirements) were held constant and not included in these scenarios. | ||
| TABLE 5. Estimated Economic Value (Monthly Consumer Surplus) for Simulated LTC Insurance of $100 Daily Benefit Amount, 3-Year Duration | ||
|---|---|---|
| LTC Insurance | Government (95% confidence interval) | Private (95% confidence interval) |
| Simulated plan with voluntary enrollment (per month) | $178.13 (171.03, 185.23) | $185.12 (177.75, 192.48) |
| Simulated plan with mandatory enrollment (per month) | $124.64 (119.07,130.22) | $130.12 (124.44, 135.80) |
| SOURCE: RTI International analysis of the 2014 Survey of Long-Term Care Awareness and Planning. NOTE: The economic value estimates in this table represent the compensating variation or the average amount of money that consumers would need to be equally well off if the option were taken away. For example, a consumer would need to be paid $178.13/month to be as satisfied as he or she would be without the voluntary government option of the simulated plan. | ||
| TABLE 6. Estimated Marginal Willingness-to-Pay for Changes in LTC Insurance Plan Features (DCE1 and DCE2), Per Month | ||||
|---|---|---|---|---|
| Marginal Change | Estimate (DCE1) | P-value | Estimate (DCE2) | P-value |
| Daily benefit $300 (vs. $50) | $79.84 | 0.001 | $68.85 | 0.001 |
| Daily benefit $175 (vs. $50) | $64.00 | 0.001 | $55.68 | 0.001 |
| Daily benefit $100 (vs. $50) | $50.74 | 0.001 | $51.28 | 0.001 |
| Duration lifetime (vs. 1 year) | $212.92 | 0.001 | $175.38 | 0.001 |
| Duration 5 years (vs. 1 year) | $123.79 | 0.001 | $94.83 | 0.001 |
| Duration 3 years (vs. 1 year) | $100.09 | 0.001 | $85.37 | 0.001 |
| No deductible (vs. 6 months) | $7.83 | 0.018 | -$0.32 | 0.913 |
| 1 month deductible (vs. 6 months) | $5.88 | 0.061 | -$3.54 | 0.249 |
| 3 month deductible (vs. 6 months) | $7.28 | 0.015 | -$0.37 | 0.907 |
| No health requirements (vs. requirements) | $34.35 | 0.001 | $27.91 | 0.001 |
| Private insurer (vs. Federal Government) | $19.41 | 0.001 | $12.16 | 0.001 |
| Universal plan (vs. voluntary plan) | n/a | n/a | -$105.81 | 0.001 |
| SOURCE: RTI International analysis of the 2014 Survey of Long-Term Care Awareness and Planning. NOTE: Marginal willingness to pay can be interpreted as the amount of money the respondent would pay to receive either an additional quantity of the attribute or the attribute itself. For example, to go from a 1-year policy to a 3-year policy, people would be willing to pay $100.09/month. To go from a $50 a day policy to a $300 a day policy, people would only be willing to pay $79.84/month. People would be indifferent to a mandatory plan if they could get $105.81/month worth of extra benefits or subsidy. | ||||
NOTES
-
Documentation regarding KP sampling, data collection procedures, weighting, and Institutional Review Board-bearing issues are available at the following online resources: http://www.knowledgenetworks.com/ganp/reviewer-info.html; http://www.knowledgenetworks.com/knpanel/index.html; and http://www.knowledgenetworks.com/ganp/irbsupport/.
-
This difference of $53.49 is lower than the $105.81 reported in Table 6 because the value of all insurance plans--whether voluntary or universal--is lower when the preference of persons who selected "no insurance" in some or all scenarios are considered, as they are in these total economic value calculations.
Survey on Long-Term Care Awareness and Planning
This report was prepared for U.S. Department of Health and Human Services (HHS), Office of Disability, Aging and Long-Term Care Policy (DALTCP) under contract #HHSP233201000693G with Knowledge Networks and contract #HHSP23320100021WI with the Research Triangle Institute. For additional information about this subject, you can visit the DALTCP home page at http://aspe.hhs.gov/office-disability-aging-and-long-term-care-policy-daltcp or contact the ASPE Project Officers, Samuel Shipley and William Marton, at HHS/ASPE/DALTCP, Room 424E, H.H. Humphrey Building, 200 Independence Avenue, S.W., Washington, D.C. 20201; William.Marton@hhs.gov.
Reports Available
Choosing Long-Term Care Insurance Policies: What Do People Want? Issue Brief
- HTML: https://aspe.hhs.gov/basic-report/choosing-long-term-care-insurance-policies-what-do-people-want
- PDF: https://aspe.hhs.gov/pdf-report/choosing-long-term-care-insurance-policies-what-do-people-want
Long-Term Services and Supports: What are the Concerns and What are People Willing to Do? Issue Brief
- HTML: https://aspe.hhs.gov/basic-report/long-term-services-and-supports-what-are-concerns-and-what-are-people-willing-do
- PDF: https://aspe.hhs.gov/pdf-report/long-term-services-and-supports-what-are-concerns-and-what-are-people-willing-do
What Do People Know About Long-Term Services and Supports? Issue Brief
- HTML: https://aspe.hhs.gov/basic-report/what-do-people-know-about-long-term-services-and-supports
- PDF: https://aspe.hhs.gov/pdf-report/what-do-people-know-about-long-term-services-and-supports
Which Way for Long-Term Services and Supports Financing Reform? Issue Brief