
By:
Thomas M. Fraker, Dan M. Levy, Irma Perez-Johnson, Alan M. Hershey, Demetra S. Nightingale, Robert B. Olsen, and Rita A. Stapulonis
Mathematica Policy Research, Inc.
Project Director: Alan Hershey
Submitted to:
U.S. Department of Health and Human Services
Office of the Assistant Secretary for Planning and Evaluation
Project Officer: Alana Landey
Contract No.: 100-98-0009
MPR Reference No.: 8550-122
Acknowledgements
This is the final report on a congressionally mandated evaluation of the Welfare-to-Work (WtW) grants program. Mathematica Policy Research, inc., (MPR) and its subcontractors the Urban institute (UI) and Support Services international (SSI), conducted the evaluation under contract with the office of the Assistant Secretary for Planning and Evaluation (ASPE) in the U.S. Department of Health and Human Services (HHS). The authors of this report wish to acknowledge the contributions of many individuals at these organizations and elsewhere who contributed to the evaluation.
Much of the quantitative data for the evaluation were collected by MPR through surveys of WtW grantees and the individuals that they served. Shawn Marsh and todd Ensor were instrumental in conducting these surveys under the general direction of Rita Stapulonis. Jason Markesich was responsible for the system used to enroll individuals in the evaluation. Amang Sukasih, Sonya Vartivarian, Esther Friedman, and Donsig Jang designed and implemented procedures for weighting the survey data to be representative of all WtW enrollees in the study sites and for variance estimation. Daisy Ewell and Julie Sykes performed the statistical programming that was required to analyze data from the surveys and from state administrative systems.
Staff of the Urban institute had primary responsibility for collecting and analyzing qualitative data for the evaluation through visits to the study sites. the UI process analysis site visit team included Terri Thompson, Nancy Pindus, Carolyn O'Brien, Pamela Holcomb, Lynne Fender, Edgar Lee, and Jesse Valente. John Trutko of Capital Research Associates was also a member of the UI site visit team. Michael Eigner of UI and Deo Bencio of MPR conducted the programming for the analysis of the site visit data. Karin Martinson, also of UI, was a coauthor of an early report on WtW-funded services for noncustodial parents.
At MPR, Debra Strong, Michelle VanNoy, Jacqueline Kauff, Jeanne Bellotti, and Charles Nagatoshi also conducted process analysis site visits and were coauthors of many of the reports prepared under this evaluation. the late Walter Corson conducted quality assurance reviews of many of the evaluation reports, while Paul Decker performed that role for this final report. Caitlin Johnson edited this report and Alfreda Holmes produced it.
Walter Hillabrant and his colleagues at SSI, Mack Rhoades Jr. and Judy Earp, conducted this evaluation's targeted study of tribal WtW programs, resulting in four reports.
This evaluation received valuable support for staff with several U.S. Government agencies. in particular, Alana Landey, the ASPE project officer, gave consistently good advice and guidance over the full life of the evaluation. Useful comments on this and other reports on the evaluation were provided by Canta Pian and Kelleen Kaye at ASPE and by staff from other collaborating federal agencies, including Christine Cremer, Dennis Lieberman, and Roxie Nicholson at the Department of Labor; Ken Maniha at the Administration for Children and Families, HHS; and Mark Shroder at the Department of Housing and Urban Development.
Finally, we would like to thank the many administrators and staff of the local WtW-funded programs who contributed to this evaluation by providing information on their programs and assisting in the collection of baseline data on WtW participants, and the systems analysts who provided this evaluation with data from state administrative records.
Introduction
The work requirements and time limits included in the federal welfare reforms of 1996 made it especially important to move the hardest-to-employ welfare recipients into jobs and help them become economically self-sufficient. To address this need, Congress authorized the Welfare-to-Work (WtW) grants program. This program built on the Personal Responsibility and Work Opportunity Reconciliation Act (PRWORA) of 1996, which created the work-focused, time-limited Temporary Assistance for Needy Families (TANF) program.(1) PRWORA was designed to move people off the welfare rolls and into employment quickly, and the WtW grants program provided additional resources targeted to those who were particularly disadvantaged and likely to have the greatest difficulty finding and holding a job.
This report presents findings from a multi-site evaluation of the WtW grants program. Mathematica Policy Research, Inc. (MPR), the Urban Institute, and Support Services International, Inc., conducted the congressionally mandated evaluation under contract to the U.S. Department of Health and Human Services (DHHS). The evaluation documented the implementation of WtW programs funded by the grants in states and localities across the nation and analyzed outcomes for participants in selected programs. Given the evaluations design, the findings presented here give a useful picture of how enrollees fared after entering WtW-funded programs; however, they are not indicative of the contributions that the programs themselves may have made to the enrollees employment and well-being. Exhibit I.1 summarizes the evaluations main findings and Exhibit I.2 identifies lessons learned from the evaluation regarding program design and implementation.
| Program Services |
|---|
| Study site programs focused, as intended, on employment rather than education and training, but many went beyond job readiness/ job search assistance. WtW programs in the study sites followed four models: pre-employment preparation and job placement, direct employment, post-employment skills development, and a rehabilitative model for absent fathers on probation or parole. |
| Program Cost |
| The average study site WtW program cost $3,607 per enrollee, about the same as typical JOBS programs created under the earlier Family Support Act. Average WtW costs in these sites, adjusted for inflation, were only moderately higher than in the WIN programs of the 1980s, but considerably lower than in supported work programs. |
| Program Targeting |
| WtW enrollees faced employment challenges that were typical of those faced by the TANF population after several years of caseload decline. In most sites, more than a third of WtW enrollees were high school dropouts, and more than one in five had work-limiting health problems. But the employment histories of enrollees prior to program entry were not consistently weaker than those of the TANF population, indicating that the enrollees were not harder to employ than TANF recipients in general. |
| Participants Employment Outcomes Over Two Years |
| Most enrollees found jobs, but their employment was unstable. Except in two sites that targeted employed persons, few enrollees were working at program entry, but mostВ two-thirds or moreВ worked at some time during each of the next two years. However, their jobs were often unstable; in most sites about 40 percent of enrollees were employed at the end of the second year after program entry. |
| Employment fell between the first and second years after program entry. Except for one site, WtW enrollees were less likely to have worked during the second year following entry than during the first. The median reduction in those who worked during the year was 10 percentage points. |
| Enrollees employed after two years worked a lot for low wages and limited fringe benefits. Employed enrollees worked nearly full-time, on average. Wages averaged about $8 per hour in 7 of the 11 sites, and one in five had employer-sponsored health insurance. However, wages and/or insurance coverage were somewhat better in 6 sites after two years than after the first year. |
| Participants Well-Being Two Years After Entering WtW |
| Poverty was common among WtW enrollees two years after program entry, but it was lower among those who were employed. Mean household incomes were stable from the end of the first year following entry to the end of the second, as were poverty rates, which exceeded 60 percent in all but two sites. Poverty rates were 16-43 percentage points lower for the employed than the not employed. But, even among the enrollees who were employed two years after program entry, the poverty rate exceeded 50 percent in all but two sites. |
| Effective Inter-Agency Partnerships Are Important |
|---|
| The legislation that authorized the WtW grants, the Balanced Budget Act of 1997 (BBA), required local programs funded by the grants to be implemented within a framework of partnership with local TANF agencies. However, effective partnerships were often slow to develop. In combination with falling welfare caseloads, this often resulted in low numbers of referrals of welfare recipients by TANF agencies to WtW programs, thereby exacerbating the difficulties that many local WtW programs experienced in achieving their enrollment targets. In sites where effective partnerships ultimately did develop, they resulted in improved access for welfare recipients to the workforce development system. |
| Increased Service Capacity is an Important Legacy |
| WtW grants afforded many nonprofit community-based organizations their initial opportunity to serve TANF recipients and/or noncustodial parents. Thus, the program increased the pool of qualified organizations with which TANF agencies can contract for employment services in the post-WtW era. |
| Program Flexibility Encourages Innovative Programming |
| Flexible rules allowed WtW grantees and their service providers to develop creative program service approaches and administrative practices. These included partnerships with employers, transitional and supported employment, and post-employment case management and job retention services. Some grantees pressed for additional flexibility to provide a broader range of pre-employment services, and Congress responded in 1999 with amendments to the program that permitted up to six months of pre-employment skill-enhancement training. |
| Stringent Eligibility Criteria and Fiscal Requirements May Result in Low Enrollments |
| The BBA required WtW grantees to spend at least 70 percent of their grant funds on services for enrollees who met very detailed and restrictive eligibility requirements. Up to 30 percent of grant funds could be used to provide services to enrollees who met less stringent eligibility requirements. The former requirement contributed to the widespread problems that grantees experienced in achieving enrollment targets during the early years of the WtW program. |
| A Mid-Course Correction to a Temporary Program May Be Ineffective |
| Amendments to the BBA passed in 1999 loosened the criteria that defined the enrollees on whom at least 70 percent of grant funds had to be spent. In response to requests from grantees for additional flexibility to provide a broader range of pre-employment services, the amendments also expanded the list of allowable pre-employment program activities to include up to six months of vocational education or job training. However, the potential for these changes to have effects were limited because the final program rules reflecting the amendments were published late in the life of the time-limited (five years) grants program and, in that context, grantees were reluctant to revise existing procedures and referral agreements with local TANF agencies. |
| Temporary Funding May Accentuate Program Design and Implementation Problems |
| The BBA required that grant funds be spent within three years of their receipt. The 1999 amendments extended that period by two years. Despite the extension, some local WtW administrators continued to believe that temporary funding compounded problems associated with the design and implementation of their programs. These included the reluctance of TANF and other agencies to refer clients to WtW rather than to service providers with whom they had long-term relationships. The administrators also viewed short-term funding as an impediment to identifying and correcting program design problems. |
Origin and Structure of the WtW Grants Program
Congress created the WtW grants program to complement TANFs work first focus, in recognition that certain people would require higher investments of resources over a longer period of time than the general TANF caseload to achieve employment success. The program was established by the Balanced Budget Act (BBA) of 1997.(2) WtW funds were targeted to high-poverty areas and individuals who were likely to need intensive services, including long-term welfare recipients, high school dropouts, substance abusers, and those approaching their TANF time limits. WtW programs could also serve noncustodial parents who had severe employment problems. Long-term post-employment services to achieve economic self-sufficiency were encouraged; beginning a job, either subsidized or unsubsidized, was assumed to be just the first step.
Policy Context for the WtW Grants Program
Understanding the WtW grants program requires background on how the policy decisions that created it dovetailed with the substantial policy changes incorporated in the TANF program. Welfare reform, as manifested in PRWORA, changed the nations social assistance system in three important ways, by providing:
- An Increased Focus on Work. The federal TANF legislation enacted in 1996 solidified a trend begun by many states under earlier federal waivers to link receipt of assistance with movement towards employment. Congress required that states meet steadily increasing requirements for the percentage of their TANF cases engaged in unsubsidized employment or work-related activities; the requirements reached 45 percent in fiscal year 2001 and 50 percent in 2002. To meet these goals, most state TANF policies emphasize job search activities rather than education or training, and encourage or require recipients to find employment rapidly.
- Assistance as a Temporary Support. Federal law specifies that federally funded welfare payments are intended to be a short-term step toward securing employment and self-sufficiency. The predecessor federal welfare program, Aid to Families with Dependent Children (AFDC), provided assistance indefinitely as an entitlement to families who met eligibility requirements. The TANF program provides short-term assistance only; individuals can receive federally funded cash assistance for a lifetime maximum of 60 months, and states can institute even shorter time limits. (States may use state funds to pay for some cash benefits, enabling them to extend the five-year time limit; some have opted to do so.)
- Substantial Discretion for States in Program Design. States are allowed considerably more flexibilityin implementing TANF than they had under AFDC. As a result, policies and programs vary considerably across states. States determine how to use their TANF block grant to fund cash assistance, work-related services, and other supports for low-income families with children. They also decide what work requirements are imposed on recipients and which individuals are subject to these requirements (within federal parameters).
These changes in welfare contributed to a dramatic decline in caseloads. The welfare rolls, which had already begun to shrink in the mid-1990s, continued to decline after the passage of PRWORA. The number of cases receiving cash assistance under AFDC and later TANF decreased from 5.05 million in January 1994 to 2.01 million in July 2002.(3) Prior research suggests the caseload reduction was due to a combination of a strong national economy and the welfare reform policies emphasizing employment (see, for example, Wallace and Blank 1999).
The legislation establishing the WtW program the BBA of 1997 placed it in the framework of the workforce development system, but with important ties to the TANF program. TANF recipients were the primary target group for WtW-funded services and were subject to state and federal welfare policies, which meant that WtW programs and enrollees had to follow those policies. The BBA gave the Department of Labor (DOL) administrative authority for the WtW program at the federal level and gave local workforce investment boards (WIBs) primary responsibility for local program operations. The job of moving WtW-eligible persons into employment was shared by the human services agencies responsible for TANF and its work programs, and the workforce development system that oversaw WtW-funded programs.
Although the BBA required this collaboration between human service agencies and the workforce development system, effective partnerships were often slow to develop. Most local WtW programs participating in this evaluations implementation study reported that they expected TANF agencies to refer substantial numbers of WtW-eligible welfare clients to them (Nightingale et al. 2002; summarized in Appendix G of this report). Yet the actual number of referrals was often low due in part to falling caseloads and institutional barriers to effective partnerships and this contributed to the difficulties many WtW-funded programs experienced in achieving their enrollment targets. But in sites where effective collaborations did develop, they resulted in improved access for welfare recipients to workforce development systems that, as a consequence of WtW, had more providers and offered more diverse services.
The Workforce Investment Act of 1998 (WIA) changed the institutional foundation on which the WtW grants program rested.(4) WIA consolidated existing training and workforce development programs and gave state and local agencies the responsibility for implementation. In contrast to its forerunners the Comprehensive Employment and Training Act (CETA) of 1973 and the Job Training Partnership Act (JTPA) of 1982 WIA emphasized employment preparation and placement services in addition to job training services, rather than solely or primarily encouraging the latter. WIA also required local WIBs to create one-stop centers to deliver a variety of services to job seekers and employers. Seventeen federal employment and training programs including the WtW grants program but not TANF were designated as mandatory partners for one-stop centers, meaning that program services had to be accessible to eligible persons through these centers. TANF was designated an optional partner. In this manner, both WIA and WtW played an important role in promoting linkages between TANF employment programs and the workforce development system.
Program Objectives, Funding, and Structure
The goal of the WtW grants program was to serve the hardest-to-employ TANF recipients and help them obtain employment that could ultimately result in long-term economic independence. Federal rules governing the program specified the following objectives:(5)
- To facilitate the placement of hard-to-employ welfare recipients and certain noncustodial parents into transitional employment opportunities which will lead to lasting unsubsidized employment and self-sufficiency
- To provide a variety of activities, grounded in TANFs work first philosophy, to prepare individuals for, and place them in, lasting unsubsidized employment
- To provide a variety of post-employment and job retention services which will assist the hard-to-employ welfare recipients and certain noncustodial parents to secure lasting unsubsidized employment
- To provide targeted WtW funds to high poverty areas with large numbers of hard-to-employ welfare recipients
In order to address the employment and service needs of its diverse target population, WtW grants could fund a broad range of employment services. Allowable WtW program activities, as specified in section 5001(C)(i) of the BBA, included the following:
- Community service and work experience programs
- Job creation through wage subsidies
- Job readiness, job placement, and post-employment services
- On-the-job training
- Job retention services
- Support services such as substance abuse treatment
Amendments to the BBA passed in 1999 expanded this list of allowable activities to include up to six months of pre-employment vocational education or job training.(6)
Congress authorized $3 billion $1.5 billion each for fiscal years 1998 and 1999 for the WtW grants program and specified how the WtW funds were to be distributed. About 8 percent of the total funds were set aside at the national level for the following: Indian and Native American programs, evaluation activities, and federal-level program administration, such as reporting, performance management, technical assistance, and monitoring. Of the remaining funds, about 75 percent were distributed to states as formula grants and 25 percent were used for competitive grants awarded directly by the Secretary of Labor.(7)
Formula grants totaling about $2 billion were allocated by DOL to states based on their shares of the national poverty population and TANF caseload. States were required to provide one dollar in matching non-federal funds for every two dollars of federal funds provided. They also had to pass at least 85 percent of their formula funds on to local WIBs. They could retain 15 percent of formula funds for WtW projects of their own choice (that is, as discretionary funds).
Competitive grants were awarded directly to local grantees by DOL. These grants could be sought by local WIBs, government entities, or community-based, private, and other organizations. A total of about $860 million was awarded in competitive grants in May 1998, November 1998, and October 1999.
Congress also established eligibility criteria and spending rules for the WtW grants to ensure that the funds were used primarily to help individuals who had specific disadvantages in the labor market. As originally enacted, the BBA required that WtW grantees spend at least 70 percent of their grant funds on long-term TANF recipients, those within a year of reaching a TANF time limit, or noncustodial parents of children in a long-term TANF case. These individuals were required to display two of three specific problems affecting employment prospects: (1) lack of a high school diploma or GED and low reading or math skills, (2) a substance abuse problem, and (3) a poor work history. The remaining funds (no more than 30 percent of the grant) could be spent on people who met less stringent criteria: TANF recipients, or noncustodial parents of children receiving TANF, who had characteristics associated with long-term welfare dependence, such as being a school dropout or a teen parent, or having a poor work history.
As WtW-funded programs were being implemented beginning in 1998, it became clear that the strict eligibility criteria and the 70-30 spending requirement were factors behind low rates of enrollment in local programs (Perez-Johnson and Hershey 1999, Perez-Johnson et al. 2000, Nightingale et al. 2002). In response, Congress modified the WtW legislation in the 1999 amendments to the BBA. While the amendments maintained the requirement that 70 percent of WtW funds be spent on a defined category of participants, they broadened the population in two ways to make it easier for TANF recipients and noncustodial parents to qualify for WtW services in that category:
- TANF recipients qualified simply by being long-term recipients. Rather than requiring the presence of additional barriers to self-sufficiency, such as low skills, substance abuse, or a poor work history, the amendments deemed TANF recipients eligible if they had received assistance for at least 30 months, were within 12 months of reaching a time limit, or had exhausted their TANF benefits due to time limits.
- Noncustodial parents qualified under less restrictive rules. Noncustodial parents were eligible if: (1) they were unemployed, underemployed, or were having difficulty making child support payments; (2) their minor children were receiving or eligible for TANF, received TANF in the past year, or were eligible for or received assistance under the Food Stamp, Supplemental Security Income, Medicaid, or Childrens Health Insurance programs; and (3) they made a commitment to establish paternity, pay child support, and participate in services to improve their prospects for employment and ability to pay child support.
The definition of the 30 percent category was also broadened to include youth who had been in foster care, custodial parents (regardless of TANF status) with incomes below the poverty level, and TANF recipients who faced other barriers to self-sufficiency specified by the local WIB.
The WtW grants program was created as a temporary complement to TANF-funded employment support programs, and grantees were initially expected to spend the funds within three years of their receipt. Because of the early enrollment difficulties, the 1999 amendments to the WtW program extended the funding period to five years. Nevertheless, the loosening of the eligibility criteria had limited effects for two reasons. First, DOL did not issue final rules that reflected the 1999 amendments until January 2001, well into the amended scheduled life of the program (DOL 2001). Second, the changes in eligibility criteria came so late that many local WtW programs were reluctant to revise their intake procedures, agreements with TANF agencies, forms, and reporting systems, opting instead to continue using the original eligibility criteria (Nightingale et al. 2002).
Despite the extension, the administrators of several local programs participating in this evaluation told us in 2003 as they had several years earlier that the short-term grant funding compounded the problems of implementing WtW programs (Nightingale et al. 2003; Nightingale et al. 2002). Some administrators believed that the temporary funding made it more difficult to establish ongoing referral arrangements with TANF and other agencies, which often had networks of permanent programs to which they were accustomed to referring clients. Some also noted that longer-term or permanent funding would have facilitated the development and improvement of their programs.(8)
No additional appropriations for the WtW grants program were made after fiscal year 1999, and on January 23, 2004, Congress rescinded the 1999 WtW state formula funds that remained unexpended.(9) The rescission accelerated the termination of WtW grants to the states, all of which were due to expire during fiscal year 2004. However, to ease the potential negative consequences of this early termination of the FY1999 WtW formula grants, Congress also established a process that allowed active participants in WtW-funded programs to transfer into programs funded under the Workforce Investment Act or other appropriate one-stop services.
Objectives and Design of the WtW Evaluation
When Congress established the WtW grants program, it also mandated its evaluation. Although the BBA gave DOL responsibility for administering the WtW grants program, it gave DHHS responsibility for evaluating it and reporting findings to Congress. DHHS contracted with MPR to conduct the evaluation.
Evaluation Components
The evaluation of the WtW grants program, conducted in 11 local sites,(10) had 4 core components:
- A descriptive assessment of all WtW grantees, based on two surveys administered to all WtW grantees nationwide to document program planning and early operations (Perez-Johnson and Hershey 1999; Perez-Johnson et al. 2000).
- A process and implementation analysis, based on exploratory site visits to 22 local WtW-funded programs (Nightingale et al. 2000), two rounds of in-depth visits to 11 of those sites (Nightingale et al. 2002), and follow-up telephone conversations with key administrators in each of the 11 sites (Nightingale et al. 2003).
- A program cost analysis in the in-depth study sites, documenting the total program costs and participant costs by service category and grantee site (Perez-Johnson et al. 2002).
- An enrollee outcomes analysis in the in-depth study sites, based on analysis of longitudinal data on individuals who enrolled in WtW over a period of approximately two years in each site.(11) A first report provided information on enrollees outcomes one year after program entry, based on a detailed follow-up survey of enrollees (Fraker et al. 2004). This final report adds information from a second survey of enrollees two years after entry, as well as two-year follow-up administrative data on welfare receipt, employment, and earnings.
The outcomes analysis is the source of most of the findings presented in this report. However, this report does reference selected key findings from the first three core components of the evaluation. In addition, Appendix G provides brief summaries of findings from those components.
In addition to the four core components, the evaluation included a detailed process and implementation study focused on tribal programs, as well as three special studies, each focused on either a specific WtW site or a specific segment of the WtW target population. The tribal study documented welfare and employment systems operated by American Indian and Alaska Native WtW grantees, the supportive services they provided, and how these tribal grantees integrated funds from various sources to move members from welfare to work (Hillabrant and Rhoades 2000; Hillabrant et al. 2001). Appendix A summarizes findings from the tribal study. The three special studies examined: (1) the provision of WtW services to noncustodial parents (Martinson et al. 2000), (2) a WtW-funded initiative in the state of Washington designed to increase child support payments (Perez-Johnson et al. 2003), and (3) two WtW programs in Philadelphia (VanNoy and Perez-Johnson 2004). Appendix G includes summaries of these studies.
Originally, this evaluation was to estimate, using an experimental design, the net impacts of the WtW grants program on participants and apply those estimates in an analysis of the programs costs and benefits. Slow enrollment in WtW programs rendered this evaluation design unworkable. Given service providers difficulties in meeting their enrollment goals, they were uniformly (and understandably) unwilling to allow the random assignment of enrollees to treatment and control groups, as the diversion of some eligible individuals into a control group where they would have received minimal or no services would have further hindered programs achievement of enrollment goals.
Given the impossibility of a rigorous experimental approach to estimating program impacts, DHHS consulted with its partners in the evaluations inter-agency workgroup DOL, the Department of Housing and Urban Development, and the Office of Management and Budget (OMB) and with MPR to develop an alternate evaluation design. The new design focused on analyzing participant outcomes such as employment, rather than the impact that the program had on outcomes. The alternate design and data collection instruments for all components of the evaluation received formal clearance from OMB.
A critical implication of this design change is that none of the findings presented in this report on outcomes should be interpreted as estimates of the net impacts of the local WtW programs that participated in the evaluation. This evaluation focused on program implementation and the extent to which enrollees entered and sustained employment and were able to leave the TANF rolls as intended by the program design. However, findings from the evaluation do not provide a valid basis to judge whether enrollees did so more or less than they would have in the absence of the WtW grants program.
Sources of Data on Individual WtW Enrollees
The findings for WtW enrollees that are presented in this report are based on individual-level data from three main sources:
- Baseline Forms. At the time of program entry, WtW enrollees completed a two-page background information form. These forms were completed at the WtW service providers site under the supervision of provider staff.
- Participant Surveys. Two follow-up surveys were conducted as part of the WtW evaluation. The first survey was conducted as soon as possible after the first anniversary of program entry. MPR staff conducted the approximately 35-minute interviews either by telephone or in-person using computer-assisted methodologies.(12) A second survey explored enrollee employment and overall well-being 24 months after program enrollment.
- Administrative Records. This report also includes findings on employment and earnings, TANF receipt, and other outcomes for WtW enrollees for the period beginning one year prior to WtW enrollment and ending two years after enrollment. These findings are based on data from state administrative files for Unemployment Insurance (UI), TANF, and other programs.
Purposes and Organization of the Final Report
This report presents new findings on outcomes for WtW enrollees pertaining to their experiences during the second year following program entry. It also includes earlier results from each of the core components of this WtW evaluation. With these data, the report examines employment patterns over the full two years following WtW enrollment and the well-being of participants and their families at the end of that period.
The remainder of this report is organized in five chapters. Chapter II answers the question What localities and programs were included in the evaluation? This chapter also examines the background characteristics of the WtW participants included in our study sample and, by comparing them to a reference sample of TANF recipients in the same localities, answers the question, Were WtW participants a particularly hard-to-employ segment of the TANF population? Chapter III draws on the findings from the WtW process and implementation study and examines two key research questions: What populations were targeted by the WtW programs? and What services did these programs offer? Chapter IV presents findings on whether enrollees achieved success in the labor market. Finally, Chapter V answers the question, How were WtW enrollees faring two years after entering the program? The answers to these key research questions provide the basis for our conclusions regarding the WtW program, which are presented in Chapter VI.
Appendices A and G provide individual summaries of reports on each core component or special study under this evaluation, with the exception of the outcomes analysis, which is the principal focus of the body of this report. Appendix H provides a complete list of reports prepared under the WtW evaluation.
Endnotes
(1) Public Law 104-193, section 103, August 22, 1996.
(2) Public Law 105-33, section 5001, August 5, 1997.
(3) After bottoming out at 2,006,155 families in July 2002, the U.S. total TANF caseload increased to 2,032,157 families in June 2003, which was the most recent month for which caseload statistics were available at the time this report was being written (DHHS 2004).
(4) Public Law 105-220, August 7, 1998.
(5) DOLs Employment and Training Administration wrote the final rules for the WtW grants program. They were published in the Federal Register on January 11, 2001. The objectives quoted verbatim here appear on page 2712.
(6) Public Law 106-113, Title VIII, sections 801-807, November 29, 1999.
(7) Formula and competitive grants combined totaled about $2.76 billion. Tribal programs received about $30 million. The remaining funds (about $210 million) were used for federal research, evaluation, technical assistance, administration, reporting, and monitoring.
(8) Nightingale et al. 2002 and 2003 are both summarized in Appendix G of this report.
(9) Public Law 108-199, the Consolidated Appropriations Act, Section 105, January 23, 2004, rescinded grantees formula funds that were unexpended on the date that the Act was passed. The final rescinded amount had not been determined at the time this report was being prepared because states were still closing out their grant activities.
(10) The 11 sites, described in Chapter II, were selected to include a wide range of program sponsors, geographic regions and populations, and program approaches, but do not represent the programs funded by WtW grants in a statistical sense.
(11) Evaluation sample enrollment began and ended at different times in the study sites, as sites were recruited and became ready for sample enrollment at different points. The earliest sites began sample enrollment in July 1999, and the latest ended in December 2001. In most sites, sample enrollment was conducted over 20 to 24 months, but in three sites the enrollment period ranged from 27 to 29 months.
(12) Details on how the surveys were conducted and data were processed are provided in Appendix F of this report and Appendix C of Fraker et al. (2004).
The WtW Study Sites and Program Enrollees
The WtW programs and sites discussed in this study, although not statistically representative of all WtW programs, include a broad variety of WtW-funded services and grantee organizations. The sites were purposefully selected to reflect the variation in program structure, approach, and context that was evident among WtW programs across the nation. This chapter provides background for the discussion, in subsequent chapters, of findings from the implementation and outcomes analyses. The first section highlights important features of the localities and programs included in the evaluation. The remainder of the chapter examines the characteristics of the individuals who enrolled in WtW in the study sites and the degree to which they were particularly hard to employ compared with the overall TANF population.
The Study Sites
Study sites in this evaluation are local grantees whose initiatives were funded fully or mainly by WtW grants. The sites were either WtW competitive grantees funded directly by DOL (and in one case subgrantees of a competitive grantee) or local WIBs that were subgrantees funded through a states formula grant. For simplicity, both grantees and subgrantees are referred to as grantees, as both had to adhere to the same administrative requirements. Most local grantees contracted with local service providers sometimes many of them for actual service delivery.
The evaluation included 13 sites in the implementation analysis, but only 11 in the outcomes analysis (Exhibit II.1). The 13 sites represented 11 different grantees, since the local programs in three sites Baltimore County, Maryland; St. Lucie County, Florida; and Long Beach, California were operated by subgrantees of a single competitive grantee, Johns Hopkins University (JHU). We did not include Southeastern Indiana and Long Beach in the outcomes analysis because their WtW operations were too small-scale to merit the intensive effort of tracking a group of enrollees for follow-up surveys.
| Study Site | Grantee | Type of Organization | Enrollmenta | Fundingb (millions) | Distinctive Features of Program Design |
|---|---|---|---|---|---|
| Baltimore Co., MD* | Johns Hopkins University, Institute for Policy Studies, Career Transcript System | Nonprofit Educ. Inst. | 240 | $5.2 C | Workplace liaisons worked with employed individuals and their employers to promote retention and helped participants move up a career ladder. |
| Boston, MA* | Office of Jobs and Community Services, Boston Econ. Dev. and Industrial Corp. | Public agency WIB | 900 | $11.3 F | Partnership programs: employers selected participants and collaborated with nonprofit partners on employability and skill training. |
| Chicago, IL* | Mayors Office of Workforce Development (MOWD) | Public agency WIB | 8,900 | $60 F,C | MOWD contracted with 24 agencies for case management, training, and support services. |
| Ft. Worth, TX* | Tarrant County Workforce Development Board (a.k.a. Work Advantage) | Nonprofit WIB | 350 | $7.2 F,C | Contracted with 12 CBOs for rapid work attachment services. |
| Long Beach, CA | Johns Hopkins University, Institute for Policy Studies, Career Transcript System | Nonprofit Educ. Inst. | NA | $5.2 C | Workplace liaisons worked with employed individuals and their employers to promote retention and help participants move up a career ladder. |
| Milwaukee, WI* | WI Dept. of Corrections, Div. Of Comm. Corrections, Region 3 (Milwaukee Co.) | State agency | 850 | $2 C, D | The NOW program served male noncustodial parents on probation/parole. TANF contractors provided employability/job retention services. |
| Nashville, TN* | Nashville Career Advancement Center (NCAC) | Public agency WIB | 600 | $4.2 C | Pathways entails monthly peer meetings to plan steps to employment, and intensive case management and problem-solving support. |
| Philadelphia, PA* | Transitional Work Corporation (TWC) | Nonprofit corporation | 7,500 | $22.4 F, C, D | Phil@Work provided a two-week job readiness class, six months in subsidized public/nonprofit jobs, then placement in unsubsidized jobs. |
| Phnix, AZ* | City of Phoenix Human Services Dept., Employment and Training Division | Public agency WIB | 750 | $5.95 F, C | Three weeks of pre-employment preparation, followed by job placement and retention support from career specialists. |
| Southeastern Indiana | River Valley Resources, Inc. | Nonprofit WIB | NA | $7.0 F, C | Intensive case management, job placement, and subsidized employment for less job-ready participants. |
| St. Lucie Co., FL* | Johns Hopkins University, Institute for Policy Studies, Career Transcript System | Nonprofit Educ. Inst. | 230 | $5.2 C | Workplace liaisons worked with employed individuals and their employers to promote retention and help participants move up a career ladder. |
| West Virginia (29 counties)* | Human Resources Development Foundation (HRDF) | Nonprofit foundation | 650 | $4.9 C | Four-week job readiness workshop, followed by graduated-stress supported work experience over six-month period, with skills training where possible. |
| Yakima, WA* | Tri-Valley Workforce Development Council | Nonprofit WIB | 800 | $6.4 F | Individualized case management, job search assistance, job placement, subsidized work placement, and supportive services. |
| a Approximate cumulative enrollment through mid-2003. Unknown for two sites included only in process analysis (Southeastern Indiana and Long Beach, California). b Total value of WtW grants (in Philadelphia includes private foundation funding). Codes: F = formula; C = competitive; D = discretionary. c Combined funding for seven JHU sites. * Site was included in the outcomes analysis. | |||||
Although the estimation of WtW program impacts based on an experimental design ultimately proved infeasible in this evaluation, suitability for impact analysis was a major factor in the selection of study sites.(13) Other factors were also used to ensure substantial variety among the study sites with respect to the type of grantee, target population, degree of innovation, geographic region, and urbanicity. These last factors led to inclusion of the two sites whose scales of operation made them unsuitable for the impact and outcomes analyses but that were of interest for the implementation analysis.
The sites reflected the flexibility given to WtW grantees under the BBA in terms of program structure, targeting, and service activities. The remainder of this section highlights distinguishing characteristics of the WtW initiatives and programs sponsored by grantees included in the evaluation.(14)
Type of Funding
The study site grantees often combined different types of WtW funding, and even that from other sources (Exhibit II.1). In five of the sites, the grantee agency received competitive grants alone, two sites received only formula grants, and four received both competitive and formula WtW grants (but no funding from other sources). Two of the sites received WtW grants plus supplemental funding from other sources: the Wisconsin Department of Corrections contributed funds to Milwaukees Nontraditional Opportunities for Work (NOW) program, and the Pew Charitable Trust provided funding to Philadelphias Phil@Work program.
Organizational Structure
The grantees typically did not directly provide services to WtW enrollees, but rather contracted with one or more for-profit or nonprofit organizations to provide services. Most grantees funded multiple programs operating in multiple locations, with each contractor designing its own program and operating it independently. For example, there were 20 separate WtW programs in Chicago and 7 in Ft. Worth.(15) Some study grantees for example, Milwaukee and Phoenix developed a general program model under the implementation of which in-house staff provided basic services and contractors provided additional services.
Scale of Operation
Many of the WtW programs in the study sites were operated on a modest scale by community-based organizations or local agencies. Most served only a few hundred enrollees each year. The main exceptions were Philadelphia and Chicago. The Phil@Work program, operated in a single location by the nonprofit Transitional Work Corporation with total funding exceeding $20 million, enrolled about 7,500 individuals during the evaluation period. The contractors providing services for the Chicago Mayors Office of Workforce Development enrolled about 8,900.
Sources of Data on Individual WtW Enrollees
Most of the programs included in the evaluation were open to all WtW-eligible individuals. However, in several sites, programs focused on specific subgroups of the eligible population:
- Noncustodial Parents Released from Incarceration. In Milwaukee, the NOW program targeted noncustodial parents on probation or parole or who were inmates in minimum-security facilities and soon to be released.
- Persons Already Employed. The JHU Career Transcript System programs in Baltimore County, Long Beach, and St. Lucie County targeted mainly WtW-eligible persons who had already secured employment, with the aim of helping them stay employed and advance to better jobs.
- Subgroups with Special Needs. Grantees in Chicago, Ft. Worth, and Nashville awarded some of their contracts for the provision of WtW service to organizations that specialized in serving homeless families and persons with mental or physical disabilities, limited education or English language skills, or other types of special needs.
- TANF Recipients Unsuccessful in Other Services. Another targeting strategy involved focusing WtW resources on those TANF recipients who failed to obtain employment through TANF work programs and were thus presumably particularly hard to employ. The WtW programs in Philadelphia, Nashville, and Yakima followed this strategy.
Evaluation Components
All of the grantees in the evaluation study sites emphasized employment, but none provided job search assistance or job readiness skills alone (Chapter III presents additional information on services provided). They typically offered a range of services to help enrollees prepare for and move into the labor market, with some variation in the priority given to moving participants quickly into employment versus providing skills development, and in the emphasis on post-employment services. Several WtW grantees in the study sites, however, stood out for their innovative approaches:
- Philadelphia: Temporary Subsidized Employment. The Transitional Work Corporations Phil@Work program was one of a constellation of programs available to WtW-eligible persons in Philadelphia; the evaluation focused on Phil@Work because of its use of subsidized employment on a large scale.(16) The program featured a two-week job readiness class, followed by paid work experience in a government agency or nonprofit organization for up to six months. Once participants were deemed job-ready, they were placed in unsubsidized employment.
- Nashville: A Pathways Program. The Pathways case management system, developed by Project Match in Chicago, encourages WtW participants to take small steps toward employment with close coaching and support, monthly peer support meetings, individual self-assessment, and ongoing reassessment of progress.(17) A waiver allowed Pathways participants in Nashville to count family-related tasks and volunteer activities toward the 40-hour-per-week work requirement for TANF recipients in Tennessee.
- Boston: Employer Partnerships. The WtW grantee in Boston established employer partnership programs to prepare TANF recipients for entry-level jobs. The programs linked one or more employers with a nonprofit service organization to provide occupation-specific pre-employment preparation and internships. Participating employers had to commit to hiring those who completed the program.
- Johns Hopkins University: Career Transcript System. The JHU programs in Baltimore County, Long Beach, and St. Lucie County emphasized post-employment skills assessment and improvement. Workplace liaisons worked with the WtW participants and their supervisors to help them retain their jobs and ultimately identify and move up a career ladder.
WtW Enrollees
The WtW programs in the study sites primarily served current or former TANF recipients, as intended in the authorizing legislation, the BBA of 1997 (amended in 1999). The overwhelming majority of study site enrollees were unmarried African-American women under 40 years old (Exhibit II.2). In Nashville, for example, virtually all WtW enrollees were female, 87 percent were black and non-Hispanic, 88 percent were under 40 years of age, and only 3 percent were married. There were exceptions to this pattern, however. Milwaukees NOW program, which served noncustodial parents, had a clientele that was 95 percent male. In the three primarily rural sites West Virginia, St. Lucie County, and Yakima enrollees were less likely than their counterparts in the urban sites to be women or African-American. In Boston and Ft. Worth, more than one enrollee in four was Hispanic. In contrast, only 8 percent of WtW enrollees in St. Lucie County were Hispanic, despite a large Hispanic presence in Florida.
The WtW grants program was designed to focus in particular on TANF recipients and other adults at risk for long-term dependency on public assistance. This section describes the individuals who enrolled in WtW in the 11 study sites that participated in the outcomes analysis, based on their characteristics at the time they entered the program. Enrollees are described in terms of their labor market assets and liabilities, previous involvement in the welfare system, and employment history. These characteristics were obtained from the evaluations baseline information forms (BIFs) completed by enrollees when they entered the program, state records containing employer-reported data on earnings for jobs covered by Unemployment Insurance (UI), and state records on the receipt of welfare benefits and food stamps.(18)
Labor Market Liabilities
Most WtW enrollees in the study sites had characteristics often associated with disadvantages in the labor market (Nightingale et al. 2002). These characteristics include being an unmarried parent with a young child, having little education, and experiencing work-limiting health problems.
Working can be a challenge for a single parent with a young child, and many of the WtW enrollees fit this description. In all but four sites, fewer than one in eight enrollees was married or cohabiting at program entry (Exhibit II.2). In general, the enrollees had one or more children, but there was great variation in the percentage who had a child aged 3 years or younger in the household ranging from 11 percent in Baltimore County to 42 percent in Phoenix (Exhibit II.3).
Lack of education was common among WtW enrollees. In six of the study sites, more than one-third of enrollees were high school dropouts (Exhibit II.3). In Ft. Worth, Milwaukee, Philadelphia, and Phoenix, dropouts accounted for between 40 and 55 percent of WtW enrollees. The two sites that emphasized career advancement Baltimore County and St. Lucie County had the lowest high school dropout rates among WtW enrollees, at 15 percent and 17 percent, respectively. Overall, it was clear that many WtW enrollees had already tried to acquire some form of employment-related credential; between 19 and 47 percent had received some type of vocational or technical degree or certificate by the time they entered the WtW program.
Work-limiting health problems were another factor that may have affected the employment prospects of WtW enrollees. In all but three sites, at least one in five enrollees had a work-limiting medical condition, physical disability, emotional or mental condition, drug or alcohol use, or other problem. This rate varied from 10 percent in St. Lucie County to 31 percent in Yakima.(19) There was substantial variation across the sites in the types of work-limiting health problems but, in general, a medical condition was the most common and drug or alcohol use the least.(20) The health problems or disabilities of another household member were a barrier to employment for about one in 10 WtW enrollees. These conditions, while less prevalent than the enrollees own health problems, made it difficult for them to work, attend training, or go to school.
Dependency on Tanf
The WtW sites that participated in this evaluation enrolled primarily individuals who had histories of welfare receipt. In all of the sites except Milwaukee where the WtW program targeted noncustodial parents 87 percent or more of WtW enrollees had received TANF or its predecessor AFDC under their own name at some time prior to program entry (Appendix Exhibit E.1). In contrast, only 14 percent of Milwaukees enrollees had ever received TANF or AFDC. In most of the study sites, only about one-third of the enrollees who had ever received TANF or AFDC had received those benefits for more than five years (Exhibit II.4).
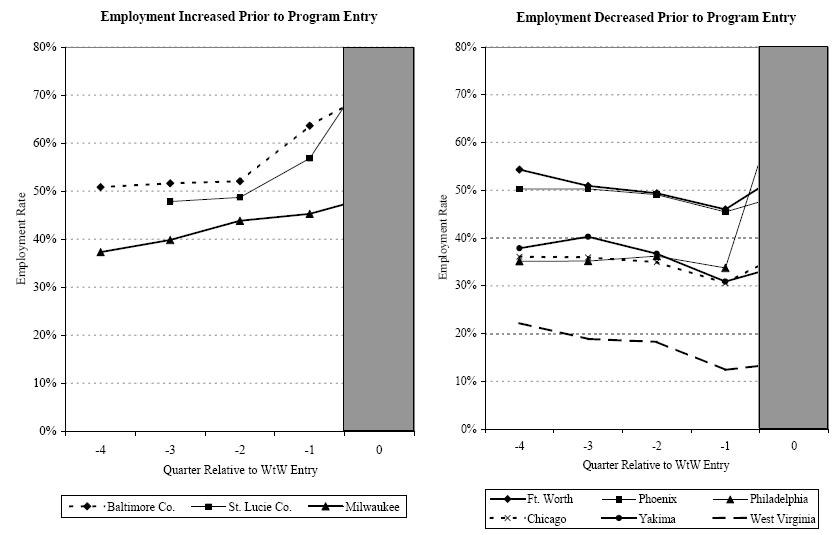
During the year immediately preceding program entry, rates of TANF receipt among WtW enrollees varied widely across the study sites. In six of the sites, 60 to 90 percent of WtW enrollees were receiving TANF in each of the first three quarters of the year prior to program entry (Exhibit II.5). In four of the other five sites, rates of TANF receipt were lower, ranging from 30 to 45 percent over the same pre-entry quarters. Milwaukees very low rates of TANF receipt during this period clearly reflect the unique population (noncustodial parents) served by the NOW program. In most sites, the rate of TANF receipt increased over the year before program entry and was markedly higher during the quarter of program entry than at any point in the year prior.(21) This observation highlights the fact that, in general, the circumstances of enrollees had taken a turn for the worse shortly before they entered WtW.(22)
Recent Work Experience
Given their extensive histories of welfare receipt, it is not surprising that WtW enrollees had limited recent work experience. In eight of the nine study sites for which state UI data were available (West Virginia being the exception), just one-third to one-half of WtW enrollees were employed in each of the first three quarters of the year prior to program entry (Exhibit II.6). The West Virginia WtW grantee, the Human Resources Development Foundation (HRDF), served a predominantly rural area where the recent employment histories of enrollees were even more limited. Over most of the year before program entry, fewer than one in five HRDF enrollees was employed. Moreover, very few WtW enrollees in any of the study sites were steadily employed during the year prior to program entry. The share of enrollees with any record of employment during all four quarters before program entry ranged from only 7 percent in West Virginia to 32 percent in Baltimore County (Appendix Exhibit E.3).
In most of the study sites, enrollee employment rates decreased over the year prior to program entry (Exhibit II.6). This decrease is to be expected; WtW programs were generally designed to help people who were not working move into jobs, so some enrollees were bound to have been referred to WtW soon after losing a job. For example, in Ft. Worth and Phoenix, quarterly employment rates were initially in the 50 to 55 percent range, and decreased by 5 to 8 percentage points during the year prior to the quarter of program entry. In Philadelphia, Chicago, and Yakima, employment rates were lower initially in the 35 to 40 percent range but also decreased over the year prior to program entry. Even in West Virginia, a very low employment rate of 22 percent in the fourth quarter prior to program entry sank even lower, to 12 percent in the quarter prior to program entry.
In three study sites, however, employment rates increased over the year prior to program entry, largely because of the nature of the programs and their target populations (Exhibit II.6). In the two sites offering the JHU program (Baltimore County and St. Lucie County), enrollees rates of employment increased by about 10 percentage points over the year prior to the quarter of program entry; not surprising, considering the program was designed primarily to provide retention and advancement support to people already working. In Milwaukee, employment rates also increased, from 37 to 45 percent, reflecting the programs focus on men who were on probation or parole. These men had little or no access to TANF, and were transitioning from incarceration which presented no opportunity for UI-covered employment to an environment wherein employment opportunities existed (although often quite limited and many of the enrollees were unable to take advantage of them).
Comparisons with the General Tanf Population
Before the 1999 BBA amendments, most WtW enrollees were required to be long-term TANF recipients and to display other employment barriers related to poor education, substance abuse, and limited work history. The amendments simplified the eligibility criteria, but the focus remained on long-term TANF recipients, reflecting the premise that this target population would be especially hard to employ, and therefore needed the extra help that WtW programs were designed to provide.
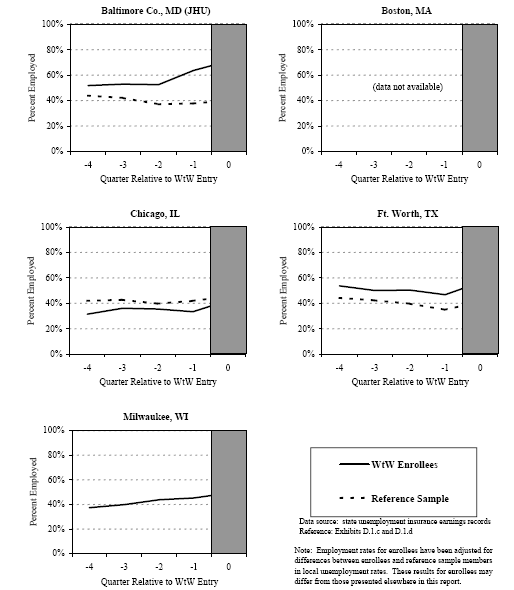
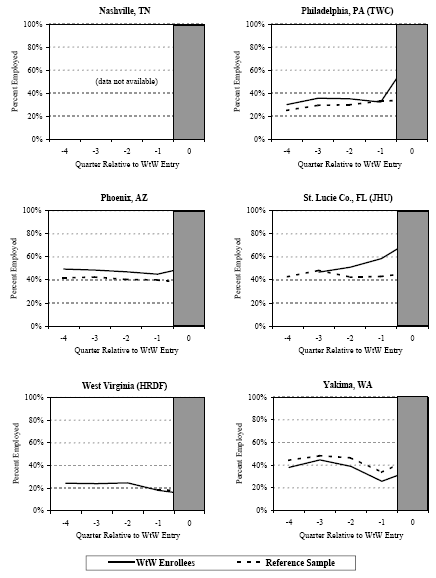
One issue addressed in this evaluation, therefore, is whether WtW enrollees in the study sites were particularly hard to employ compared with the general population of TANF recipients. To examine this issue, we collected state UI records data on employment for a cross-section of the general TANF population (a reference sample) in the WtW study sites where such data were available, except Milwaukee.(23) We then conducted a comparative analysis of trends in employment for WtW enrollees and reference sample members for the period before their program entry, controlling for differences in local unemployment rates that they faced.
The UI data indicate that WtW enrollees were not consistently harder to employ than TANF recipients in general. In Baltimore County and St. Lucie County, enrollees had higher employment rates in the year prior to program entry than reference sample members in the year prior to sample selection, reflecting the focus of the JHU program on individuals who had already found jobs (Exhibit II.7). However, in three of the study sites that did not have that focus Ft. Worth, Philadelphia, and Phoenix employment rates for WtW enrollees prior to program entry were still higher than for reference group members. In contrast, enrollees in Chicago and Yakima were less likely to be employed in the year before program entry, as compared with reference sample members in the year before sample selection. Data for reference group members in West Virginia were available only beginning with the final quarter prior to sample selection. In that quarter, reference group members had nearly the same employment rate as enrollees in the quarter prior to program entry. Thus, while many WtW enrollees had significant labor market liabilities, they were not consistently harder to employ than the general population of TANF recipients.(24)
The difficulty of demonstrating that WtW enrollees were harder to employ than TANF recipients in general may reflect the changes in the TANF population that accompanied the dramatic caseload declines of the late 1990s. WtW program staff often commented that everyone left on TANF is hard to employ, because so many of those who could readily find work had left the rolls. Although WtW staff applied the WtW eligibility criteria, these criteria may not have been making meaningful distinctions among TANF recipients with respect to their experiences of employment difficulties.
EXHIBIT II.2
DEMOGRAPHIC CHARACTERISTICS OF WELFARE-TO-WORK ENROLLEES AT PROGRAM ENTRY
(Percentages)
EXHIBIT II.3
LABOR MARKET ASSETS AND LIABILITIES OF WELFARE-TO-WORK ENROLLEES AT PROGRAM ENTRY.
(Percentages)
EXHIBIT II.4
CUMULATIVE YEARS OF WELFARE RECEIPT BY WtW ENROLLEES AT PROGRAM ENTRY
(if ever received)
EXHIBIT II.5
RATES OF TANF RECEIPT BY WtW ENROLLEES DURING THE YEAR PRIOR TO PROGRAM ENTRY
EXHIBIT II.6
EMPLOYMENT RATES FOR WtW ENROLLEES DURING THE YEAR PRIOR TO PROGRAM ENTRY
Endnotes
(13) Grantees were given favorable consideration as potential study sites if they appeared likely to meet the following requirements for a random assignment study: likelihood of serving substantial numbers of participants, ability to identify more WtW referrals than they could serve, feasibility of integrating random assignment into their intake process, clarity of the distinction between WtW services and those available to a control group, and experience working with the WtW population.
(14) Detailed descriptions of the WtW study sites are provided in Appendix A of the evaluations implementation study report (Nightingale et al. 2002). Also, detailed descriptions of selected programs sponsored by the grantees in the study sites can be found in Appendix A of the evaluations cost analysis report (Perez-Johnson et al. 2002).
(15) In Chicago, there were 24 contractors in all, but 4 delivered support and specialized services to participants enrolled in other contractors programs rather than enrolling caseloads of their own. The situation was similar in Ft. Worth, where 5 of the 12 contractors provided a variety of special support or data services.
(16) In their 2004 report (summarized in Appendix G of this report), VanNoy and Perez-Johnson provide a side-by-side analysis of participant outcomes in two WtW programs in Philadelphia: Phil@Work and Regional Service Centers. These programs differed in their target populations and their service delivery approaches. Together, however, they captured the main elements of the overall WtW strategy developed by the local WIB and WtW grantee, the Philadelphia Workforce Development Corporation.
(17) For a description of the Project Matchs Pathways case management system, see Herr and Wagner (2003).
(18) State data on UI-covered earnings could not be obtained for the Boston and Nashville study sites.
(19) These findings should be taken with caution given that a sizable portion of enrollees did not answer the BIF question related to their work-limiting health problems. In 9 of the 11 study sites, response rates for this item were in the range of 65 percent to 85 percent.
(20) This pattern may also reflect respondents unwillingness to acknowledge certain types of health problems.
(21) The quarterly TANF participation rates presented in this report are derived from monthly state TANF administrative data. The rates for the quarter of program entry (Appendix Exhibit D.2.a) are generally higher than those based on data from enrollees BIFs in the evaluations baseline survey (Appendix Exhibit E.1). The differences between these two methodologies which range in absolute value from 7 to 32 percentage points are probably due to one or more of the following: (1) rates based on baseline survey data reflect participation at a specific time, whereas those based on state administrative data reflect participation at any time during the quarter of enrollment; (2) in some sites, enrollees may not have recognized TANF because the program is known by its local program name; (3) the baseline survey asked whether the enrollee had received TANF or AFDC in his or her own name; enrollees who received TANF under anothers name may have reported no receipt; and (4) in some sites, the administration of BIFs was delayed until after enrollment, so some enrollees may have left TANF before completing a baseline form.
(22) Enrollees in the Baltimore County JHU program present a sharp contrast to the general pattern of a higher rate of TANF receipt in the quarter of program entry than in preceding quarters Exhibit III.5). This is consistent with the programs focus on employed individuals. Enrollees in Baltimore County were moving into employment during the immediate pre-entry period. With relatively high wages (discussed in Chapter IV), many of these individuals had worked their way off TANF before they entered WtW.
(23) Because Milwaukees NOW program targeted noncustodial parents rather than TANF recipients, we excluded the site from the comparative analysis of WtW enrollees with all TANF recipients. In addition, we were unable to obtain UI data for the Boston and Nashville sites.
(24) This finding should be taken with caution because data on employment and TANF receipt for WtW enrollees and/or reference sample members were not available or were incomplete in some sites. Specifically, there was no reference sample for Milwaukee, employment data were unavailable for both enrollees and reference sample members in Boston and Nashville, and only one quarter of employment data was available for reference group members in West Virginia prior to the sample selection month.
Program Models and Services
WtW grantees, allowed considerable discretion to design programs, came up with a variety of approaches to serve the enrollees described in the previous chapter. The underlying goal of the WtW grants program was to promote the long-term economic self-sufficiency of people with serious employment difficulties, particularly welfare recipients and noncustodial parents of children on welfare. In pursuing this goal, grantees generally offered similar services classified as allowable under the authorizing legislation. All the grantees in this study offered pre-employment services such as needs and skills assessments, job readiness instruction, and job search assistance. They also offered, at least to some enrollees, more intensive activities such as education, occupational training, transitional subsidized employment, or supported work experience. Some provided job retention services. Grantees diverged, however, in the relative emphasis they placed on different services, each attempting to address the needs of their target population, as they understood them.
The approaches grantees took to the provision of services can be looked at from two perspectives. First, we can classify programs into general models based on grantee service plans and descriptions of their activities, and on our observations of program services. Section A distinguishes four such program models on this basis. Second, we can examine the actual services enrollees received to determine which of the allowed WtW services were most commonly used by recipients, and how these patterns varied across sites. Section B uses data from program management information systems and follow-up interviews with enrollees to characterize the types of services received and the duration of enrollees activities. Patterns of actual service receipt may illustrate how some program model distinctions lead to different enrollee experiences. However, these two perspectives may not always be consistent. In Section C, we examine whether patterns of enrollee activity in WtW services coincide with distinctions in program models based on grantee plans and designs.
Distinctions among WtW programs, whether based on program operators plans or patterns of enrollee experiences, are typically subtle rather than dramatic. One reason is that some granteesВ especially large ones like the Chicago siteВ used their WtW funds to support multiple programs, often serving distinct target populations with different service emphases. A second reason is that despite grantees plans, their experiences with program implementation often resulted in shifts in actual practice, sometimes in ways that muted the distinctiveness of their original program ideas. Distinctions evident in program designs, moreover, may be less evident in the patterns of enrollees activities and their paths into employment, which were also a result of whether the enrollees persevered in programs long enough to be exposed to the full menu of services. Finally, it must be remembered that all grantees were focused on employment as a near-term outcome; program models involving extensive job skill training or education before entry to employment, for example, were not among the model options. Thus the programs in this study can be expected to differ only within a limited range.
Program Models
The grantees we studied provided three main services beyond initial needs assessments: (1) all offered some form of pre-employment preparation, including job readiness instruction, job search assistance, and job placement; (2) all offered some degree of education and training services; and (3) some offered job retention services to help people stay employed after finding a job. Sites differed in the emphasis their program designs placed on these services. These differences suggest four program models the employment, pre-employment, rehabilitative, and post-employment models as summarized in Exhibit III.1 and discussed below.
Employment Model
The primary objective of the employment model was to move enrollees as quickly as possible into jobs. This did not mean that programs following this model focused solely on job placement. Job preparation services were typically accompanied by individualized counseling and support, social services, and even post-employment follow up, including education in some cases. Four of the sites followed the employment model. In two of these (Phoenix and Yakima), staff generally provided substantial counseling and employment assistance to the enrollees. Grantees in Chicago and Ft. Worth each funded over a dozen separate programs that implemented various models, but most enrollees were in programs that relied heavily on self-directed job search.
Pre-Employment Model
This model is characterized by an intensive emphasis on pre-employment preparation. In addition to job search preparation, programs we consider exemplars of this model offered structured pre-employment activities such as group counseling, remedial education, or occupational preparation, and often some type of transitional employment. In Boston and Philadelphia, for example, wage-paying transitional employment was a major component, usually following several weeks of preparatory activities. HRDF in West Virginia combined group job readiness workshops with unpaid work experience, and wage supplements to those who obtained low-wage jobs. Nashville Works/Pathways emphasized ongoing supportive peer groups, intensive case management, and job coaching.
Rehabilitative Model
An emphasis on recovery came through in the rehabilitative model. The Milwaukee NOW program was unique among the study sites in that it exclusively served fathers on parole or probation. Program staff provided individual and structured services that could include rehabilitation activities, referral to counseling or treatment, and short-term work experience in addition to job search and placement services.
Post-Employment Model
Retention and advancement in employment were the hallmarks of the post-employment model. While all WtW-funded programs in the study sites included some post-employment services, the JHU program, administered by community colleges, was explicitly designed to serve people who were already employed. The program supported workplace liaisons who worked with enrollees and their workplace supervisors to assess enrollees soft skills, encourage supervisors strategies for strengthening skills, and mediate conflicts or misunderstandings between employees and supervisors. A career transcript system was designed to test enrollees soft skills and document their development.
Services Actually Received
The services that WtW enrollees actually received were heavily tilted toward employment preparation services as opposed to skill enhancement services, reflecting the requirement that WtW-funded programs complement PRWORAs work first philosophy.(25) Employment preparation services either help individuals overcome barriers that prevent them from securing employment or facilitate their progress in finding and maintaining work. Such services typically address specific problems and are of short duration. In contrast, skill enhancement services help individuals qualify for better jobs than they otherwise would. These services, typically education or training, are designed to broadly increase human capital and may be of longer duration. The BBA restricted the provision of skill enhancement services funded by WtW grants to the post-employment period.(26) However, the 1999 amendments to the BBA expanded the list of allowable pre-employment services to include education and training, but capped the duration of these services at six months.(27) This evaluations report on the implementation of the WtW grants program states that, following the amendments, the programs did not change much with respect to the provision of pre-employment education and training because they had already established particular program models and approaches (Nightingale et al. 2002, page 54).(28)
This evaluations 12-month follow-up survey asked WtW enrollees a series of questions on the employment-related services they received during the year following program entry. Respondents to the survey did not necessarily know whether WtW-funded providers or other organizations delivered the services. However, the types of services that they reported are broadly consistent with earlier findings on the services provided by the WtW programs in the study sites (Nightingale et al. 2002). Consequently, we believe that WtW-funded providers delivered many or even most of the services that enrollees reported receiving. This section uses the 12-month follow-up survey data to describe enrollees receipt of employment preparation and skill enhancement services. It also uses information gathered as part of the evaluations implementation study to describe opportunities for participation in transitional employment programs.
Employment Preparation Services
Most WtW enrollees in the 11 study sites received employment preparation services sometime during the year following program entry. These included two core services: job readiness training (instruction on appropriate behavior on a job) and job search assistance (resume preparation, interview practice, and help in finding a job); and eight ancillary services measured in this evaluation.(29) The rate of receipt of any of these services was high and did not vary dramatically across the sites ranging from a low of 68 percent in Ft. Worth to a high of 89 percent in Philadelphia (Exhibit III.2).
The employment preparation services most frequently received by WtW enrollees in all of the study sites were the two core services. Job readiness training was received by more than half of the WtW enrollees in seven of the study sites and by about four in ten enrollees in the remaining sites (Exhibit III.3). Job search assistance was equally common, with a very similar pattern of receipt across the study sites. Enrollees in Philadelphia were most likely to receive job readiness training and job search assistance, while enrollees in Ft. Worth were least likely to receive them.
Fewer enrollees received ancillary services. The most common of these were life skills training, which was received by roughly 25 to 50 percent of enrollees, and counseling, received by roughly 20 to 35 percent of enrollees (Exhibit III.3). The remaining ancillary services, including mediation and substance abuse treatment, were generally received by no more than 15 percent of enrollees in a site, with the following notable exceptions:
- Consistent with the emphasis of the JHU program model on job retention, skills development, and job advancement, WtW enrollees in Baltimore County and St. Lucie County received counseling and mediation services at higher rates than enrollees in most of the other study sites, but had lower rates of receipt of job readiness training and job search assistance.(30)
- The Project Match model on which the Nashville Works/Pathways program was based specifies the provision of intensive case management and a broad range of ancillary services in a supportive peer-group environment. Accordingly, the Nashville enrollees were more likely to receive life-skills training, counseling, structured peer support, and mediation services than those in most of the other study sites.
- Enrollees in Milwaukee had relatively high rates of receipt of life-skills training, counseling, and additional ancillary services that were rarely received by WtW enrollees in other sites including participation in peer support groups, legal assistance, and substance abuse treatment.
The typical design for employment preparation services specifies several weeks of job readiness training followed by a week or so of job search/placement assistance. But even programs in the evaluation that were broadly consistent with this design tended to incorporate significant modifications. For example, programs in some of the study sites reflected a philosophy that employment outcomes could be optimized by the provision of extended job readiness training prior to job search/placement. Conversely, job readiness training was downplayed in some other programs that targeted individuals who had already demonstrated their employability.
The duration of job readiness training reflected the diverging models adopted by the site grantees. Among enrollees who received training, the median days ranged from 6 in Ft. Worth and St. Lucie County and 8 in Baltimore County to 44 in Boston and Philadelphia.(31) The short duration of job readiness training in Baltimore County and St. Lucie County reflected the fact that the JHU program was designed to assist people who were already employed. In Ft. Worth, the short duration of training was consistent with the programs emphasis on rapid transition to employment. In contrast, the long duration of training in Boston and Philadelphia reflected structured sequences of service components leading to a paid internship or transitional work experience, and may have also reflected survey respondents perception of services they received even after their placement in a transitional job.
The design and execution of job search assistance was more consistent across sites, with much lower and less varied durations. The median duration of job search assistance was just 4 days or less in 7 of the sites, and exceeded 10 days only in Boston.
The duration of ancillary services depended on their nature, the severity and complexity of the problems they were designed to address, and enrollees capacity to persist in the activity. WtW enrollees typically received counseling, mediation, and legal services for short durations 10 days or less for counseling and 4 days or less for mediation and legal services. In contrast, enrollees often received mental health services and substance abuse treatment for long durations. For example, WtW enrollees in Baltimore County and Boston who entered substance abuse treatment programs typically received services from those programs for about 100 days.
Skill Enhancement Services
Skill training was clearly less common than basic employment preparation. In keeping with the federal WtW legislation, which de-emphasized pre-employment training to develop work skills, enrollees in the 11 study sites were only about half as likely to receive skill enhancement services during the year following program entry as they were to receive the employment preparation services discussed in the previous section. Aside from the two JHU sites that by design encouraged post-employment skill development, Nashville was the only site where more than 40 percent of enrollees participated in education or training (Exhibit III.4). The Nashville program emphasized human development and operated under Tennessees federal TANF waiver that expanded the allowable services to permit a broader set of activities to satisfy work requirements. Only between 24 and 37 percent of enrollees in the other study sites received skill enhancement services during the year after program entry.
The most common types of skill enhancement activities were high school completion or GED programs and advanced vocational or technical training. With the exception of the Milwaukee, Nashville, and JHU sites, about 10 to 20 percent of WtW enrollees in the study sites participated in GED/high school programs and about the same proportion participated in advanced education programs (Exhibit III.5).(32) Only 5 to 10 percent of enrollees participated in adult basic education (ABE) and virtually none in any site except Boston participated in English as a Second Language (ESL) programs. Restrictions on the receipt of TANF by recent immigrants may have limited the number of WtW enrollees who could benefit from ESL instruction.
Enrollees in Milwaukee and Nashville participated in GED or high school programs at relatively high rates (23 and 24 percent, respectively). Nashville enrollees also had relatively high rates of participation in ABE and in advanced education programs. Given that community colleges implemented the JHU program, it is not surprising that 28 percent of enrollees in Baltimore County and 31 percent in St. Lucie County participated in advanced education programs (Exhibit III.5).
Skill enhancement services represented a substantially larger investment in human capital than employment preparation services. The skill enhancement services received by WtW enrollees typically lasted for two to six months and entailed a commitment of 10 to 20 hours per week (Fraker et al. 2004, Exhibit III.6). Enrollees in the Milwaukee NOW program who participated in GED or high school education programs did so for 12 hours per week for five months, on average. Their counterparts in Nashville were even more intensively engaged in these programs, averaging 20 hours of participation per week for six months. Enrollees in the Baltimore County and St. Lucie County JHU programs who participated in advanced education programs did so for roughly 15 hours per week over an interval of three to four months, on average.
Transitional Employment
Even with access to employment preparation services and, under certain conditions, skill enhancement services such as job training and education, some WtW enrollees faced a difficult road to employment. TANF work requirements in some states prompted TANF-funded and WtW-funded programs to create subsidized, transitional jobs to ensure that all enrollees required to work did so. Most WtW enrollees could satisfy work requirements for a short initial period by participating in job readiness workshops. WtW program staff pointed out, however, that individuals with serious problems, such as physical or mental disabilities or low basic education attainment, often had great difficulty moving from a short job readiness activity into the unsubsidized labor market.
Transitional employment components addressed several concerns. For enrollees unable to find employment quickly, subsidized transitional employment made it possible to continue meeting TANF work requirements while developing potentially marketable skills. This was especially relevant for enrollees who were unsuccessful in finding an unsubsidized job through the front-end job readiness and placement components of a WtW program. Transitional employment could also be a bridge to unsubsidized employment. In some programs, transitional employment components were structured in such a way that participating employers were expected to hire a worker who successfully completed a trial work period.
In the WtW study sites, grantees instituted several different forms of transitional employment, with slightly different entry and exit paths:
- Temporary Work Experience. Some Chicago programs placed individuals in a temporary work experience assignment after a brief job readiness workshop. In West Virginias HRDF program, after a four-week job readiness workshop, about two-thirds of enrollees were placed for up to six months in unpaid work experience at nonprofit organizations, with no expectation of permanent employment.
- Simple Private Sector Transitional Jobs. More capable and job-ready enrollees in West Virginia were placed for up to one month in unpaid positions at private businesses or in paid on-the-job training (OJT) positions for up to six months, with the understanding that the employer would offer a job upon successful completion.
- Enhanced Transitional Jobs. In Philadelphia, TWC targeted individuals with little or no work experience who, soon after program entry, were placed in transitional jobs for 25 hours per week for six months, and participated in 10 hours of education or group training each week, but with no prospect of continuing employment.
- Sectoral Employer Partnerships. Collaborations were formed in Boston with particular employers or industries. After a pre-employment component of three or four months of job readiness skills development, WtW enrollees were placed in paid transitional internship jobs at partnering firms for four to six months, with a focus on building basic job-specific or firm-specific skills. Firms agreed to hire enrollees as regular employees at the end of the internship period.
These transitional employment variants differed with respect to the payment of wages. While enrollees were generally paid in supported/transitional work, this was not always the case. When paid, enrollees in the study sites were most likely to receive either the minimum wage (Philadelphia TWC, Yakima, and several subcontractor programs in Chicago and Ft. Worth) or the going rate for what were usually entry-level jobs. If the position was a formal OJT slot generally with a commitment to hire and provide job-specific training over a six-month period enrollees were paid at the same regular hourly as other new hires in the same positions. In some programs in Ft. Worth, enrollees received no payment for work experience hours, though they may have received some compensation for work-related expenses. In the West Virginia HRDF work experience positions, enrollees were generally unpaid but continued to receive their TANF cash grant, food stamps, and a work-related expense payment of $1.60 per hour.
Grantee descriptions of their programs indicated that all study sites made some use of transitional employment, but the emphasis on this component varied. Gauging levels of participation accurately is more difficult than with other WtW activities because respondents to the two follow-up surveys often had trouble distinguishing a regular job from a transitional job, and program MIS files often failed to clearly classify transitional jobs. However, it appears from MIS files that in West Virginia and Philadelphia, as many as 68 and 75 percent of enrollees, respectively, participated in some kind of transitional employment.(33) In Chicago, it is possible that as many as 50 percent of WtW enrollees overall had some kind of transitional placement; and we know that such placements were a core activity in Boston, although we do not have MIS files to quantify participation rates. In most of the other study sites, MIS files suggest that transitional employment involved far fewer enrollees ranging from about 5 percent in Ft. Worth to 10 percent in Phoenix, and perhaps as many as 22 percent in Nashville. Although these MIS data do not provide clear-cut documentation of transitional employment, they do appear consistent with the emphasis that program grantees reported placing on this component.
Comparison of Services with Program Models
The services that WtW enrollees actually received were broadly consistent with the program models in their respective study sites. Exhibit III.6 shows that enrollees in the four sites that adopted the pre-employment model had high rates of receipt of job readiness training (60 percent or higher), and that training was of relatively long duration, ranging from 18 days in Nashville to 44 days in Boston and Philadelphia. This training may have delayed the entry of enrollees into jobs, as the elapsed time from program entry until the first job was relatively high, averaging 4.7 months across these sites. The two sites that implemented the JHU post-employment model had relatively low rates of receipt of employment preparation services among their enrollees. But in these sites, three in ten enrollees received advanced education or training double the proportion in sites that had adopted other program models. Enrollee statistics for the four sites that adopted the employment model differ from those of the pre-employment sites in two respects that are consistent with differences between the program models. The employment sites had a lower proportion of enrollees who received job readiness training (56 percent) and shorter duration of training (16 days on average across the four sites). The elapsed time until the first job was also lower, averaging 4.4 months.
The Milwaukee site adopted a distinctive rehabilitative model that focused on the reintroduction of recently released prisoners into society and the labor force. The enrollee statistics presented in Exhibit III.6 clearly distinguish this site from those that adopted other program models. Enrollees in the NOW program were less likely to receive employment preparation services and required substantially more time (5.8 months on average) to enter their first post-enrollment job than enrollees in the other sites. As presented in Exhibit III.3, Milwaukee enrollees were more likely than those in most of the other study sites to have participated in peer support groups (28 percent) or to have received counseling (32 percent), legal assistance (14 percent), or substance abuse treatment (21 percent). The time that enrollees took to participate in these ancillary services may partially account for the long duration between their entry into WtW and the start of their first job.
Chicago and Ft. Worth are the study sites for which the services received by WtW enrollees were least consistent with our program model classification scheme. This chapter concludes with brief discussions of these two sites.
The large number and diversity of WtW programs in the Chicago study site with its 20 individual programs made the assignment of this site to a single program model problematic. Some of the programs emphasized job readiness instruction prior to job placement, others featured transitional employment in subsidized jobs, and yet others focused on the rapid attachment of enrollees to unsubsidized jobs. However, a strong work first emphasis cut across all of the WtW programs in Chicago, and most enrollees entered rapid-attachment programs. Consequently, Exhibit III.6 lists the Chicago site as having adopted the employment model. The diverse programs in Chicago account for its distinctiveness among the employment-model sites in that the Chicago enrollees received both job readiness training and job search assistance at high rates (72 percent and 66 percent, respectively) and for long periods (medians of 30 and 9 days, respectively).
Ft. Worth also stands out among the sites that adopted the employment model. Here, enrollees there were much less likely to receive employment preparation services and required an additional month, on average, to find jobs. Only 39 percent of the Ft. Worth enrollees received job readiness training and just 44 percent received job search assistance; they required an average of 5.2 months to find their first job. In principle, participation in ancillary employment preparation services might account for the delayed entry of Ft. Worth enrollees into employment but in reality, these enrollees had very low rates of receipt of such services. Earlier in this chapter we characterized the Ft. Worth site as providing primarily self-directed rather than staff-guided job search activities. The summary statistics in Exhibit III.6 suggest that the Ft. Worth enrollees might have benefited from more staff attention.
| Program Model | Study Site | Key Elements of Program Design |
|---|---|---|
| Employment | Chicago Ft. Worth Phoenix Yakima |
|
| Pre-Employment | Boston Nashville Philadelphia WV-HRDF |
|
| Rehabilitative | Milwaukee |
|
| Post-Employment | Baltimore Co.JHU St. Lucie Co.JHU |
|
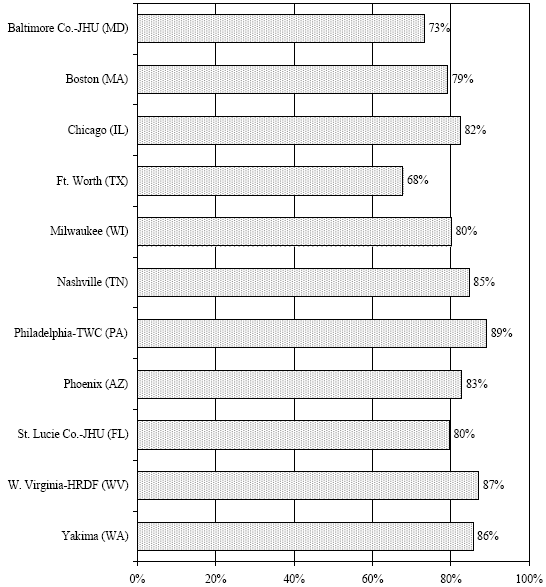
The evaluation's 12-month follow-up survey gathered information on the following employment preparation services: job readiness training, job search or placement services, life-skills classes, mental health services, substance abuse treatment, medical attention to correct a work-limiting physical condition, legal assistance, counseling, peer support/dicussion group, and mediation services.
Reference: Fraker et al. 2004, Exhibit B.1
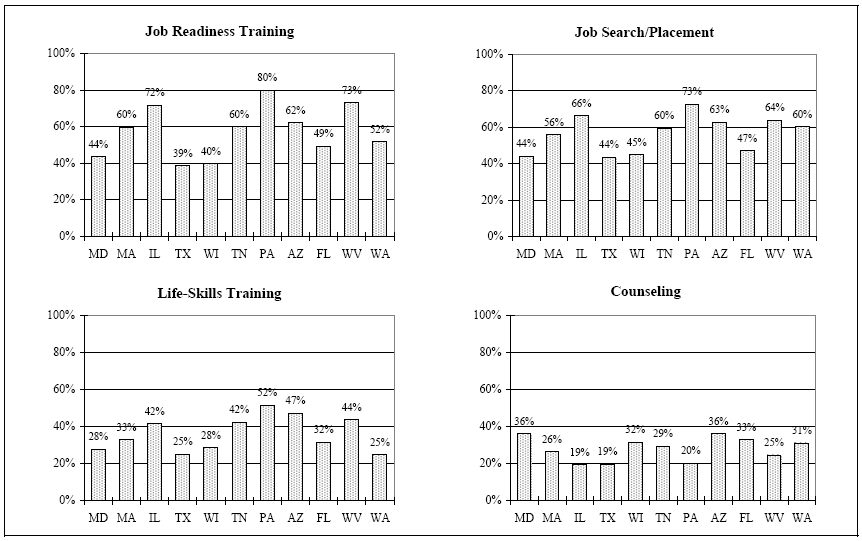
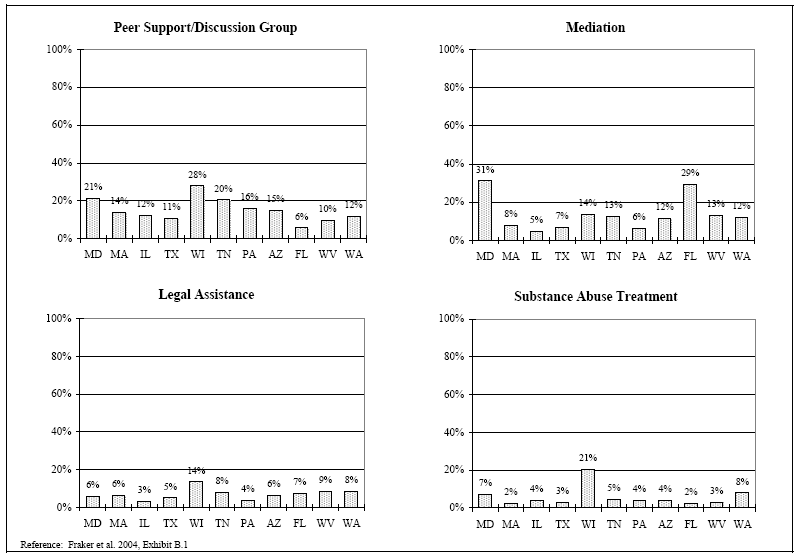
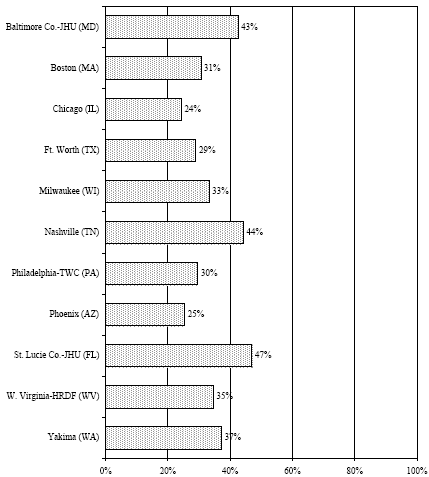
The evaluation's 12-month follow-up survey gathered information on the following skill enhancement services: GED or high school, adult basic education, English as a second language, vocational or technical training, occupational skills training, and college programs.
Reference: Fraker et al. 2004, Exhibit B.4
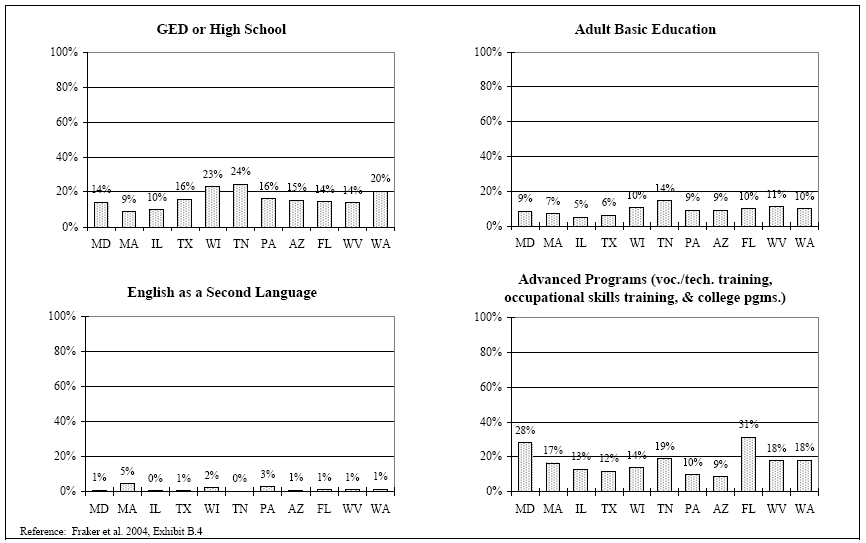
| Program Model | Study Site | Employment Preparation | Skill Enhancement | Mean Duration Until First Jobb | |||
|---|---|---|---|---|---|---|---|
| Job Readiness Training | Job Search Assistance | ||||||
| Percent Receiving | Median Durationa | Percent Receiving | Median Durationa | Advanced Educ./Training | |||
| Employment | Chicago Ft. Worth Phoenix Yakima Average | 72% 39% 62% 52% 56% | 30 days 6 days 21 days 9 days 16 days | 66% 44% 63% 60% 58% | 9 days 4 days 4 days 4 days 5 days | 13% 12% 9% 18% 13% | 4.5 mo. 5.2 mo. 3.8 mo. 4.3 mo. 4.4 mo. |
| Pre-Employment | Boston Nashville Philadelphia WV-HRDF Average | 60% 60% 80% 73% 68% | 44 days 18 days 44 days 24 days 32 days | 56% 60% 73% 64% 63% | 14 days 4 days 6 days 4 days 7 days | 17% 19% 10% 18% 16% | 4.7 mo. 4.6 mo. 4.3 mo. 5.1 mo. 4.7 mo |
| Rehabilitative | Milwaukee | 40% | 13 days | 45% | 8 days | 14% | 5.8 mo. |
| Post-Employment | Baltimore Co.JHU St. Lucie Co.-JHU Average | 44% 49% 46% | 8 days 6 days 7 days | 44% 47% 45% | 4 days 2 days 3 days | 28% 31% 29% | 4.9 mo. 4.0 mo. 4.4 mo. |
| a The median duration of a service was computed on the basis of just those enrollees who received the service in question. b The mean duration until the first job following program entry was computed on the basis of enrollees who obtained employment after program entry. Those who were employed at entry or who were never employed after entry were excluded from the computation. | |||||||
Endnotes
(25) DOLs interim rules for the WtW grants state that, Activities conducted with WtW funds must be grounded in the work first philosophy which is a fundamental tenet of the Act (PRWORA). Although a variety of activities are authorized under WtW, these activities should be viewed as employment-based developmental steps for helping individuals secure and retain unsubsidized employment (DOL 1997, pages 61593-61594).
(26) DOL states, While the legislation (PL 105-33, 1997) does not permit stand-alone training activities independent of a job, allowing them as post-employment activities only while the participant is working in a subsidized or unsubsidized job reflects the basic work first thrust of the legislation (DOL 1997, page 61594).
(27) Public Law 106-113 (1999).
(28) The allowance of limited pre-employment services under WtW in the 1999 amendments had little effect on program services because many WtW grantees had already established procedures with TANF agencies regarding eligibility, referrals, cost sharing, etc. Additionally, some grantees had already issued contracts to organizations to operate programs consistent with program models that had been specified prior to the amendments.
(29) The evaluations 12-month follow-up survey inquired about the receipt of each of eight ancillary services: (1) life-skills training, (2) mental health services, (3) substance abuse treatment, (4) medical attention to correct a work-limiting physical condition, (5) legal assistance, (6) counseling, (7) peer support/discussion group, and (8) mediation services. Longer-run education and training programs are discussed in Section B.2.
(30) Referral to education and training programs was also a distinctive feature of the JHU program design. Evidence presented later in this section documents that WtW enrollees in Baltimore County and St. Lucie County were more likely to have participated in education and training programs than enrollees in most of the other study sites.
(31) Findings on the duration of services were originally reported by Fraker et al. 2004. The results cited in this and the succeeding two paragraphs are presented in Exhibit III.3 in that report.
(32) The 12-month follow-up survey gathered information on participation in vocational or technical training, occupational skills training, and college programs.
(33) The program design in Philadelphia included transitional employment placement for all enrollees; thus, it is clear that some enrollees dropped out of the program or found a job before receiving this service.
The Labor Market Outcomes of WtW Enrollees
This chapter describes employment outcomes of WtW enrollees in the two years after they entered the program, focusing mostly on the second year after program entry.(34) This study did not attempt to estimate the net impacts of WtW-funded programs. Hence, the outcomes reported in this chapter and the next cannot be attributed to the programs and differences in outcomes across the study sites should not be regarded as indicative of differences in program efficacy.
The findings in this chapter are based on two data sources: (1) UI quarterly records and (2) follow-up surveys conducted 12 and 24 months after program entry. The UI data were used mainly to describe basic employment outcomes of WtW enrollees during the first year after program entry.(35) The survey data were used to present findings based on a richer and more recent set of employment-related outcomes.
Section A of this chapter shows that WtW enrollees who were not employed when they entered the program took an average of four to five months to be placed in a job. Although these placements initially increased the employment rate among enrollees, the gains were generally not sustained over time. In fact, Section B shows that most enrollees were not employed two years after entering the program. However, those who were employed usually worked a full or nearly full workweek, as presented in Section C. They earned about $8 per hour and rarely participated in an employer-provided health insurance plan.
Early Employment Outcomes
The WtW legislation emphasizes the initial placement of enrollees into jobs and the subsequent attainment of lasting employment;(36) it is therefore important to assess both how quickly enrollees found jobs and the extent of their employment after they entered the program. This section describes the time it took enrollees to find their first job after entering WtW, and explores trends in employment rates during the four quarters following program entry.
Did Enrollees Find Jobs?
In all sites, WtW enrollees were more likely to be employed in the quarter of program entry than in the quarter prior to program entry (Exhibit IV.2), reflecting mainly the fact that the study sites placed some enrollees into jobs shortly after program entry. Not surprisingly given its emphasis on quickly providing enrollees with subsidized employment, Philadelphia exhibited the greatest increase in employment among its enrollees around the time of program entry. In this site, the employment rate increased from 34 percent in the quarter before to 79 percent in the quarter of program entry.
WtW enrollees who were not employed when they entered the program required an average of four to five months to find their first post-enrollment jobs (Exhibit IV.1).(37) The time that it took enrollees to find jobs was determined by a host of factors, including the nature of the services they received. It tended to take enrollees less time to secure their first job in sites that provided services consistent with rapid job entry than in those that provided more extensive pre-employment services. Enrollees in Chicago, Phoenix, and Yakima which used an employment model, designed to move participants into jobs quickly obtained their first jobs in an average of 4.2 months. In the five sites emphasizing intensive pre-employment preparation, the average elapsed time until the first job tended to be longer, ranging from a low of 4.3 months in Philadelphia to a high of 5.1 months in West Virginia.(38) However, Ft. Worth represented an exception to this pattern. Despite being classified as a site that adopted the employment model, enrollees in this site took on average 5.2 months to find their first job. As described in Chapter III, enrollees in Ft. Worth were much less likely than other employment model sites to receive employment preparation services.
Extent of Employment after Program Entry
While placement into new jobs initially raised the employment rate among enrollees, the initial gains in employment were not sustained over time. In all but two of the study sites, the employment rate of WtW enrollees peaked in the quarter of program entry or the following quarter and declined thereafter (Exhibit IV.2). For example, in Phoenix the employment rate peaked at 60 percent the quarter after program entry and then steadily declined to 46 percent four quarters after program entry. However, in West Virginia and Yakima, the employment rate of enrollees increased for several quarters after program entry and then stabilized at the higher level. In West Virginia, it increased from 14 percent in the quarter of program entry to 41 percent four quarters after entry. In Yakima, the increase was less dramatic but still substantial, from 35 percent in the quarter of program entry to 44 percent four quarters later.
Relative to their pre-entry peaks, employment rates of enrollees four quarters after program entry were substantially higher for three sites West Virginia, Chicago, and St. Lucie County and were at about the same level for the remaining sites. For example, the employment rate of WtW enrollees in West Virginia four quarters after program entry was 39 percent, compared with a pre-entry peak of 22 percent; Chicago had a less dramatic but still substantial increase of about 9 percentage points. For the remaining sites, the employment rates of WtW enrollees four quarters after program entry were about the same as their pre-entry peak. For example, at 54 percent, the employment rate four quarters after program entry in Ft. Worth was the same as its pre-entry peak.
Although employment rates generally declined shortly after program entry, average earnings generally remained stable or increased gradually in the quarters following post-entry peaks in employment rates. In fact, there was no study site for which average earnings four quarters after program entry were lower than in the quarter of program entry. This pattern could be due to employment in the later quarters being associated with longer work hours and/or higher wages than employment in the earlier quarters.
Longer-Run Employment Outcomes
While the analysis in the preceding section is useful to understand initial employment outcomes and trends in employment during the first year after program entry, this section extends the analysis by using a richer and more recent set of labor market outcomes. The analysis focuses on the employment outcomes of enrollees during the second year after they entered the WtW program. The main source of data is the survey administered to enrollees in the 11 study sites 24 months after program entry. To assess whether there were significant changes over time, we compare these with similar indicators from the 12-month follow-up survey.(39)
Employment During the Second Year
Most enrollees were employed at some point during the second year after program entry. In 9 of the 11 sites, over 60 percent of enrollees held at least one job at some point during the second year (Exhibit IV.3). Not surprisingly given the relatively strong employment history of their target population, the two JHU sites exhibited the highest proportion of enrollees (about 85 percent) who held at least one job during the second year. At the opposite extreme stood Phoenix, which at 51 percent had the lowest proportion of enrollees employed during the second year.
Nevertheless, the proportion of enrollees who were employed at some point during the second year was lower than the proportion employed at some point during the first year after program entry in all of the study sites except Ft. Worth. For five of the sites, the proportion of enrollees who had some employment was at least 10 percentage points lower in the second year than in the first. The two sites that emphasized rapid job entry (Phoenix and Yakima) and the site that offered temporary subsidized employment (Philadelphia) exhibited especially large drops in the proportion of enrollees employed during the second year from that of the first year, with enrollees in Phoenix experiencing the greatest reduction of 16 percentage points. This may have occurred in part because individuals placed according to a rapid-entry strategy may not be matched to the best jobs, and those placed in temporary subsidized employment may not be able to find a job after the subsidized employment period ends.
While most enrollees were employed at some point during the second year following program entry, consistent employment throughout the year was not the norm. In six of the study sites, enrollees were employed only about 40 percent of the time, on average, during the second year after program entry (Appendix Exhibit B.2). Enrollees at the JHU sites exhibited the highest proportion of the year employed (71 percent for Baltimore County and 63 percent for St. Lucie County), while enrollees in Philadelphia and Phoenix had the lowest average proportion of time with a job (32 and 35 percent respectively).
Job Turnover During the Second Year
It was not unusual for WtW enrollees who were employed at some point in the second year to leave their jobs. Exhibit IV.4 shows that in most study sites, over 40 percent of enrollees who were employed during the second year after program entry left the first job they held that year. The rate of exit from the initial job was highest in Milwaukee (61 percent). It was lowest in Baltimore County (27 percent), where the JHU program provided services designed to reduce job loss, and in Boston (42 percent), where employer-sponsored programs fostered strong employee-employer bonds. In St. Lucie County, the other JHU program site, the rate was also relatively low (45 percent), but not as low as in Baltimore County.
Nevertheless, job stability seems to have improved over time. Enrollees tended to have more stable jobs in the second year after program entry than the first, as indicated by the exit rates from the first job they held in the year. The rate of exit from initial job was lower in the second year than in the first for 8 of the 11 study sites (Exhibit IV.4). In fact, for 7 of the 11 sites the difference in exit rates was 10 percentage points or higher. Not surprisingly, Philadelphia which offered enrollees temporary subsidized employment as an initial job after program entry exhibited one of the largest declines in exit rates, from 74 percent in the second year to 57 percent in the first year.
When enrollees left their jobs, it was usually because they had voluntarily quit or because their work period had ended (Exhibit IV.5).(40) In six study sites, a voluntary quit was the main reason for departure. Baltimore County had the highest percent of enrollees (59 percent) reporting this reason for departure. In the other five study sites, the ending of the work period was the main reason for departure, accounting for 40 percent or more of the enrollees. Dismissal by the employer for cause (firing) accounted for 12 to 17 percent of departures from the initial job.
Employment Two Years after Program Entry
In general, most enrollees were not employed two years after program entry. In five sites, the employment rate among enrollees was around 40 percent (Exhibit IV.6), very similar to the 42 percent employment rate for former TANF recipients nationwide reported by Loprest (2003).(41) In Milwaukee and Phoenix, the rate was even lower at 33 percent. Nevertheless, over two-thirds of enrollees in the two JHU sites were employed two years after entry, and about half of enrollees in West Virginia and Yakima were employed at that time.
Enrollees were much less likely to be employed at the end of the second year than at some point during that year. For example, in West Virginia and Yakima about half of the enrollees were employed at the end of the second year, but over two-thirds were employed at some point during the year. This finding and the relatively high job exit rates reported in the preceding section suggest that enrollees employment after entering the program was generally not very stable.
Employment rates among enrollees two years after program entry were remarkably similar to those one year after program entry for most sites, with both typically much higher than employment rates at program entry (Exhibit IV.6). For 9 of the 11 study sites, the employment rate two years after entry was essentially the same as it had been a year after entry. Milwaukee exhibited a particularly large decline (8 percentage points) in the employment rate among its enrollees, perhaps reflecting the fact that the clients the program served mostly noncustodial fathers with a criminal offense in their record had difficulty staying employed for very long.
Employment rates two years after program entry were slightly higher in sites that had implemented programs consistent with a pre-employment model as opposed to an employment model.(42) From Exhibit IV.6, we can determine that the sites following a pre-employment model (Boston, Nashville, Philadelphia, and West Virginia) had an average employment rate for enrollees two years after program entry of 43 percent, compared with 40 percent for the sites that were following an employment model (Chicago, Ft. Worth, Phoenix, and Yakima). However, due to differences in the populations served by the sites that followed these two models, this difference in employment outcomes is not necessarily indicative of greater efficacy of the pre-employment model. In particular, the employment rate of enrollees at the time of program entry was about 5 percentage points higher, on average, in the sites that were following a pre-employment model.
Principal Barriers to Employment
Among the WtW enrollees who were not employed two years after program entry, the most commonly cited reasons for lack of employment were (1) difficulty finding a job and (2) a health problem or disability (Appendix Exhibit B.4). In six of the sites, difficulty finding a job was the most common main barrier for employment. This was true for about one-third of the Milwaukee enrollees who were not employed and between one-sixth and one-third of their counterparts in the other study sites. A number of factors may have been underlying this reported difficulty, such as a weak local labor market, a bad match of the enrollees skills with the requirements of available jobs, and personal characteristics that present a challenge to employment. Given the additional liabilities that ex-offenders bring to the labor market, it is reasonable that WtW enrollees in Milwaukee were most likely to attribute their lack of employment to difficulty in finding a job.
An enrollees poor health or work-limiting disability was the most commonly cited reason for lack of employment in five of the study sites. About one in four enrollees in four sites Nashville, Philadelphia, West Virginia, and Yakima gave this explanation for their lack of a job one year after enrollment, as did about one in five enrollees in Phoenix. These high rates may have been due to higher incidences of poor health or disabilities in these sites and/or to a mix of available jobs that required higher levels of physical functioning.(43) For example, relatively large proportions of enrollees age 40 or older in Yakima (21 percent) and West Virginia (17 percent) may have made those groups more susceptible to health problems and disabilities.
A small number of other factors were important barriers to employment in some sites. In general, they represented a barrier for about 10 to 15 percent of enrollees without a job in these selected sites.
- Participation in education or training programs was a barrier to employment in Nashville two years after program entry. One in five enrollees in this site was in high school at the time of enrollment and may have been completing formal education two years later.
- Transportation problems were a barrier to employment in West Virginia and Ft. Worth. West Virginias TANF recipients often reside in rural areas but the states jobs are concentrated in urban centers, and Ft. Worth does not have extensive public transportation.
- Getting arrested or facing legal problems was a barrier to employment for enrollees in Milwaukee, suggesting that problems with the law remained a substantial barrier to employment.(44)
- Maternity leave, pregnancy and child care problems were a barrier to employment in St. Lucie County.
Features of Jobs Enrollees Held
Welfare policymakers are concerned not only that able-bodied TANF recipients and other at-risk adults become employed, but also that they progress to jobs that allow them to achieve substantial self-sufficiency. This section describes key features (industry and occupation, compensation, and hours worked) of the principal job held by those WtW enrollees who were employed two years after program entry. To assess progress, this section presents some comparisons between the jobs held at the end of the second year and those held at the end of the first year.
Industry and Occupation
WtW enrollees were most frequently employed in office and administrative support, sales, and personal care and services occupations. These were the three most common occupations in five of the study sites, and they were among the five most common occupations in nine sites (Appendix Exhibit B.5).
About half or more of the principal jobs held by employed enrollees in nine of the study sites were in service industries, primarily business, health, and social services (Appendix Exhibit B.6). The industries in which WtW enrollees worked likely reflect both the industrial base of the local economies and the job placement strategies of the WtW programs. For example, in Boston a major market for the provision of health care, and a site in which the WtW program partnered with several local health care providers the principal job held by 26 percent of employed enrollees was in the health services industry.
Compensation
The elements of employment compensation considered in this evaluation are the hourly wage rate and fringe benefits, with a focus on health insurance, paid sick leave, and pensions.(45) As in the previous subsection, the findings reported here are based on the principal job held by WtW enrollees who were employed two years after program entry.
WtW enrollees in seven of the study sites had a mean nominal wage rate on their primary job of about $8 per hour (Exhibit IV.7). West Virginia, Baltimore County, Boston, and Milwaukee were the exceptions to this pattern. Although enrollees in West Virginia had more favorable employment outcomes than those in many of the other study sites, their mean hourly wage rate ($6.40) was notably low. In contrast, the mean wage rates for WtW enrollees in Baltimore County ($9.89), Boston ($10.02), and Milwaukee ($9.91) were well above those for enrollees in the other sites. In all sites except West Virginia, over 90 percent of enrollees earned wages greater than the minimum wage of $5.15. West Virginia had the greatest proportion of enrollees earning wages below the minimum wage (12 percent) and below $8.00 per hour (87 percent).
The mean hourly wage rate on the principal job held two years after program entry was essentially unchanged from the year before in about half of the study sites, but was higher in the others (Exhibit IV.8). Where there was an increase, it was not dramatic, except in Milwaukee where it exceeded $2 per hour. In the other sites where there was an increase, it was in the $0.40-$0.80 range, which generally represents about 5 to 10 percent of the first-year wage. In Milwaukee, the mean hourly wage was $2.17 higher at the end of the second year than at the end of the first year, but this site exhibited a large decline in employment between the two years (about 8 percentage points, the highest among all sites). The observed increase in the mean hourly wage was partly the result of enrollees with low first-year wages losing their jobs by the end of the second year. In fact, of the enrollees who had been employed at the end of the first year, those who were still employed at the end of the second year had first-year average wages over $1 higher than those who were no longer employed.
Overall, fringe benefits were available to only modest proportions of WtW enrollees on their principal job two years after entering the program (Exhibit IV.9).(46) Consequently, the self-sufficiency of most enrollees, to the extent that they achieved it, was precarious contingent on remaining healthy and continuing to work.
Paid sick leave either was or tied for the most common of the three key fringe benefits in most study sites, followed by a pension plan. Health insurance was the least common. Rates of availability of these three benefits ranged across the study sites as follows:(47)
- Paid Sick Leave. The availability of paid sick leave ranged from a low of 25 percent in West Virginia and Milwaukee to a high of 62 percent in Baltimore County and Boston.
- Pension Plan. The availability of a pension plan ranged from a low of 21 percent in West Virginia to a high of 50 percent in Phoenix.
- Health Insurance. Participation in an employers health insurance plan ranged from a low of 16 percent in West Virginia and Yakima to a high of 47 percent in Baltimore County.
In general, there was little change over time in the availability of fringe benefits other than health insurance (Exhibit IV.10 and IV.11). Across the study sites, health insurance coverage on the principal job held two years after program entry was about the same or somewhat higher as on the principal job held at the end of the first year. Three sites Chicago, Nashville and Philadelphia exhibited increases 5 percentage points or more in the prevalence of health insurance among employed enrollees.
Hours of Work Per Week
WtW enrollees who were employed two years after program entry typically put in a full or nearly full workweek on their primary job. Exhibit IV.12 shows that the mean hours of work per week on the principal job ranged from 32 to 38 across the 11 study sites. With the exception of Nashville, in no site did more than 10 percent of employed enrollees work fewer than 20 hours per week on their principal job (Appendix Exhibit B.8). While employed enrollees worked nearly full-time hours on average in a week, they were not necessarily employed consistently week after week over the course of a month, which may have reduced their monthly earnings.
Since local programs funded by WtW grants were expected to be integrated with the corresponding state TANF programs, it is appropriate to assess the hours WtW enrollees worked in terms of the TANF work requirement, as specified in the 1996 PRWORA legislation. This requirement can be paraphrased as, The nonexempt adult head of a single-parent TANF case must spend at least 30 hours per week working on a job for pay or participating in work-related activities. Participation in education and training programs may account for no more than 10 of the required hours.(48)
In Exhibit IV.13, the TANF work requirement is used as a standard against which to assess employment outcomes for WtW enrollees two years after program entry, without regard for their actual TANF participation status at that time. The exhibit displays the percentage of enrollees who would have satisfied the TANF work requirement based on 30 or more hours of paid employment alone, based on hours worked in all jobs held at the end of the second year, not just the principal job.
The rates at which WtW enrollees would have satisfied the TANF 30-hour weekly work requirement if they had been on TANF two years after program entry were lower than their rates of employment, but the patterns of these two measures were similar across the study sites. Exhibit IV.13 shows that 50 to 60 percent of enrollees in the JHU sites were employed at levels consistent with the TANF requirement, whereas only about one-third of enrollees in the other sites were (with the exception of West Virginia, where 40 percent of enrollees were working at least 30 hours per week).(49)
The main reason for not satisfying the TANF 30-hour-per-week work standard was the absence of any employment, not insufficient hours of work (Exhibit IV.14). For example, in Chicago 61 percent of enrollees did not meet the 30-hour standard because they were not employed. Only 4 percent were working between 1 and 20 hours, and 7 percent were working between 20 and 30 hours. Even assuming that the latter group had no other work-related activities that would have allowed them to meet the TANF 30-hour requirement, the number of enrollees who did not meet the standard because they were not working was more than 5 times the number of those who did not meet it because they did not work enough hours. This ratio was similar or greater for all other sites except the two JHU sites, where it was between 2 and 3.
MEAN NUMBEROF MONTHS UNTIL WtW ENROLLEES FIRST JOB AFTER PROGRAM ENTRY
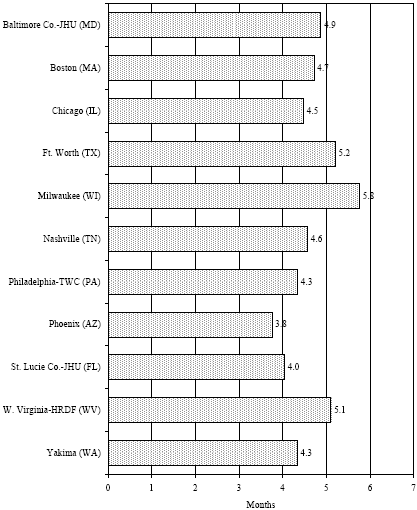
Reference: Exhibit B.7, Fraker et al. 2004
EXHIBIT IV.2
EMPLOYMENT RATES AND EARNINGS BEFORE AND AFTER PROGRAM ENTRY: ALL WtW ENROLLEES
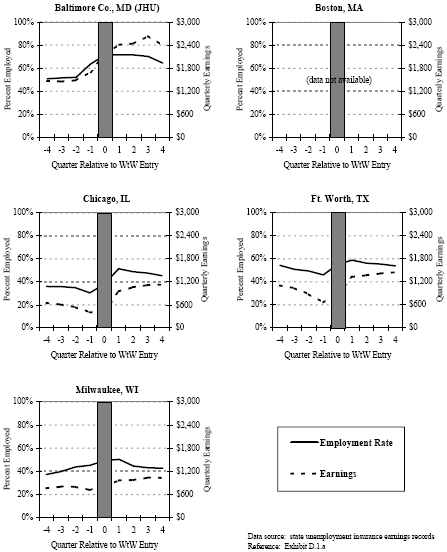
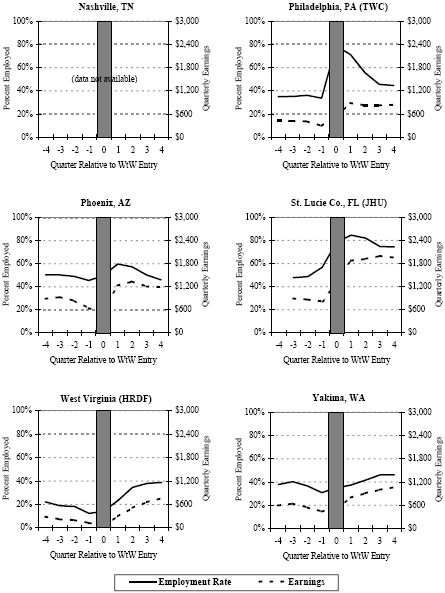
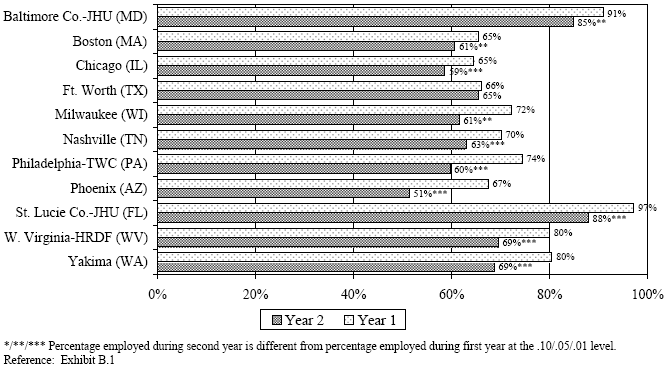
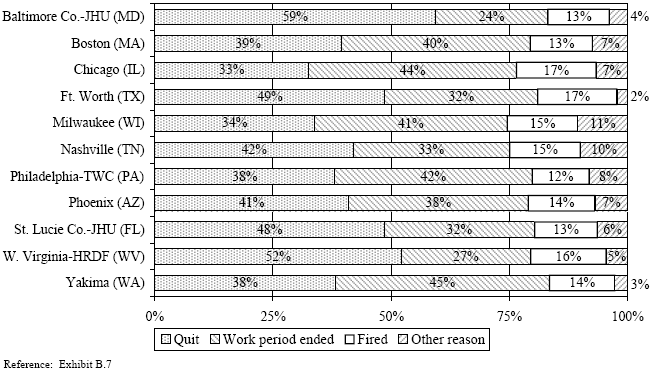
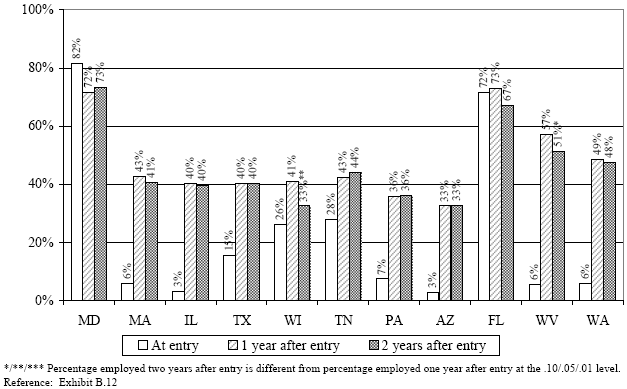
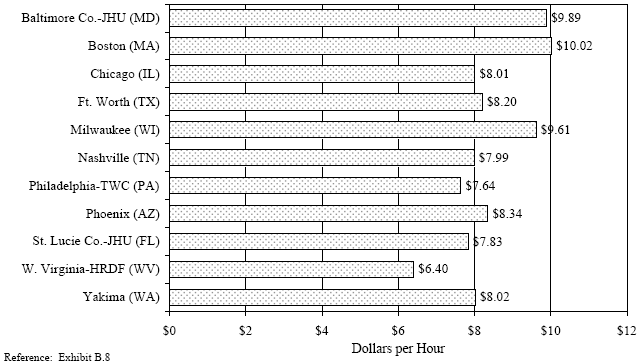
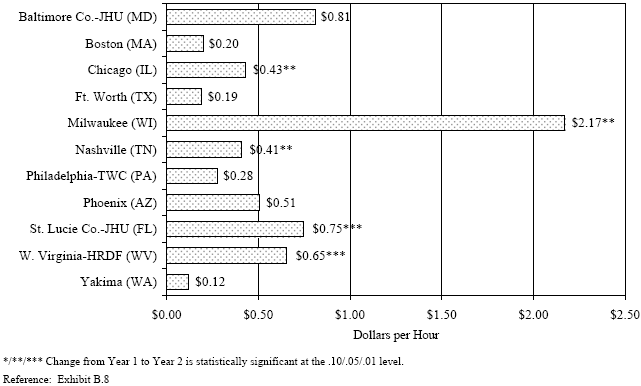
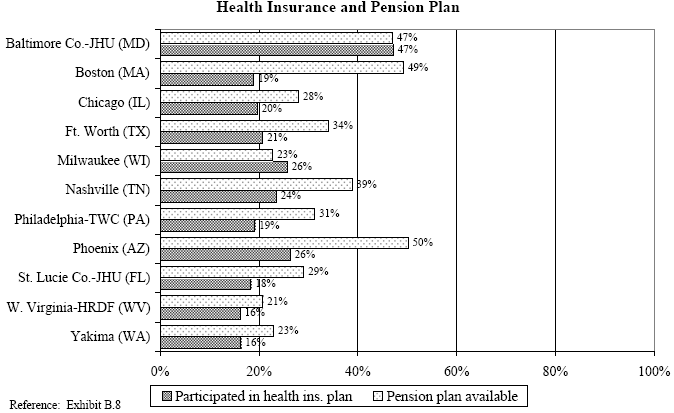
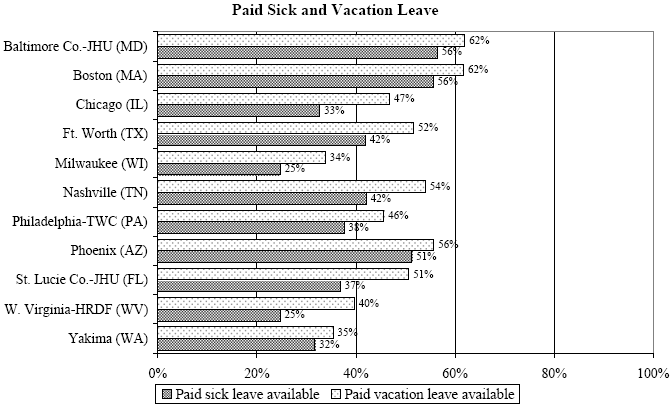
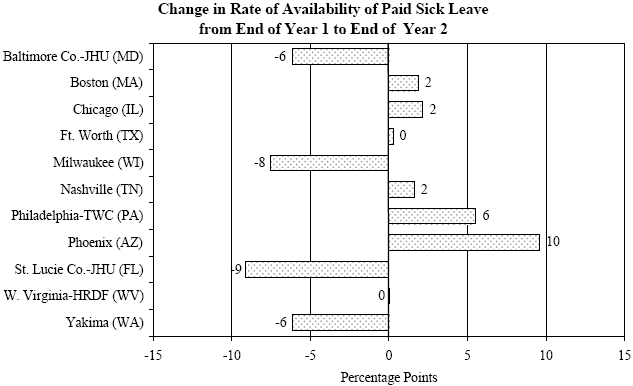
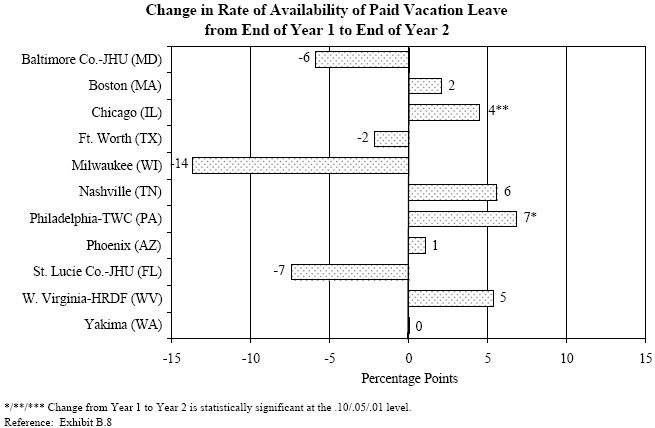
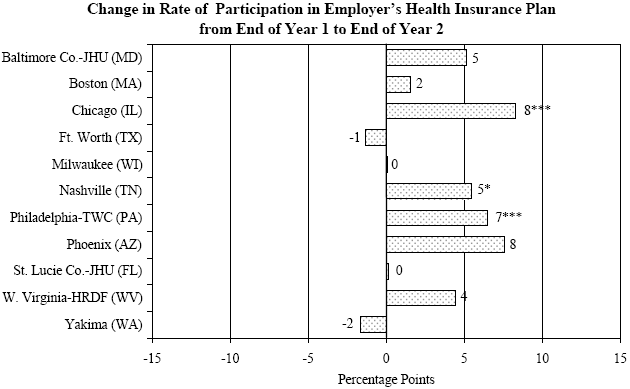
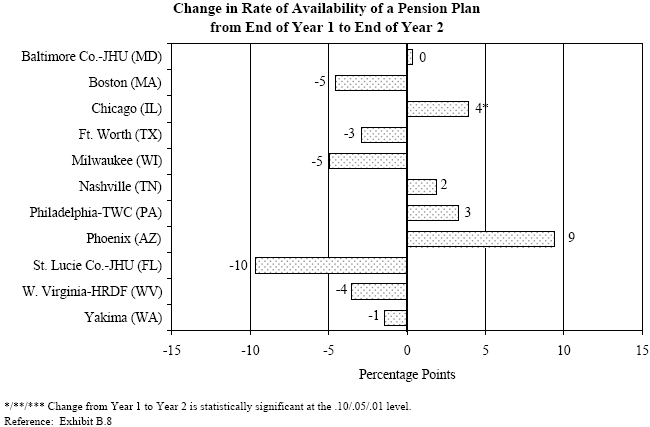
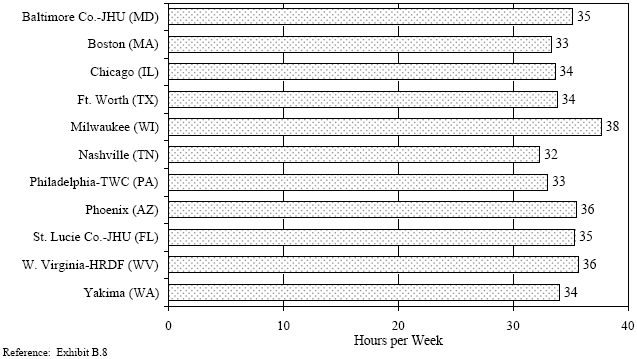
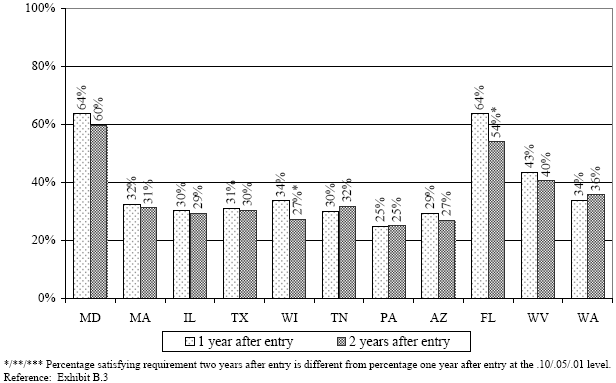
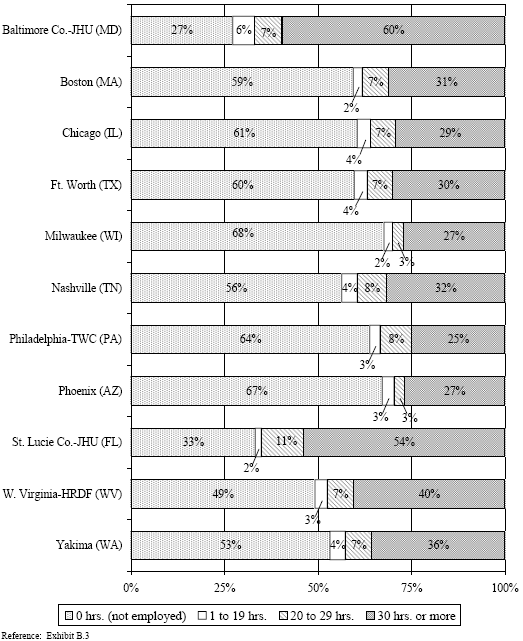
Endnotes
(34) A more detailed analysis of enrollees outcomes in the first year after program entry can be found in Fraker et al. 2004.
(35) Given the timing of data collection, UI data were available up until four quarters after program entry for all sites except Boston and Nashville (where UI data were not available at all). There were some sites for which we were able to collect UI data for a slightly longer period (five to six quarters after program entry), but since the outcomes in those additional quarters were fairly stable, we decided for purposes of comparability to report UI-based results up until four quarters after program entry for all available sites.
(36) A key objective cited in the legislation was to facilitate the placement of hard-to-employ welfare recipients and certain noncustodial parents into transitional employment opportunities which will lead to lasting unsubsidized employment and self-sufficiency (Federal Register, January 11, 2001, p. 2712).
(37) The Milwaukee site was an exception to this pattern. There, the NOW program served an especially hard-to-employ population of noncustodial parents who had been incarcerated or were on probation or parole when they enrolled in WtW. The Milwaukee enrollees who were not employed at program entry required nearly six months, on average, to obtain their first jobs.
(38) Especially in the pre-employment model sites, the measured duration until the first job may have been distorted by the difficulty that some enrollees had in distinguishing between subsidized employment (a common service in these sites) and unsubsidized employment.
(39) Employment rates based on survey data can differ from employment rates based on UI data for a number of reasons. In this particular study, employment rates based on data from the 12-month follow-up survey tend to be lower than the employer-reported UI figures for the fourth quarter after program entry. This may be due in part to the fact that the follow-up survey provides a single-point-in-time measure whereas the UI data measure employment at any time during the fourth quarter after program entry (the latter will tend to overstate employment at any specific point in time). The most salient exception to this pattern was West Virginia, a rural site in which enrollees held jobs not likely to be registered by the UI system. In this site, 51 percent of enrollees reported employment 12 months after program entry; but according to UI records, only 39 percent of enrollees were employed in the fourth quarter after program entry.
(40) The ending of a work period encompasses three similar reasons for departure from a job: (1) a layoff, (2) the ending of a temporary job, and (3) the ending of a period of self-employment.
(41) Loprest (2003) reports a 42 percent employment rate among adults who had left TANF during the two years prior to the 2002 Survey of Americas Families. Some of these individuals had returned to TANF by the time of the survey interview.
(42) This discussion of differences in employment outcomes by program model focuses on the study sites that followed either the employment or pre-employment program models. These sites served individuals who were broadly typical of WtW enrollees nationwide; most were TANF recipients who were not employed when they enrolled in WtW. Even among these sites, differences in enrollee characteristics at program entry because of variation in local settings rule out interpretation of outcomes as indications of differences in program efficacy. Including post-employment and rehabilitative program models would be even more problematic, so we have chosen not to. The populations served by the study sites that followed these two program models (already employed persons and noncustodial fathers on probation or parole) were distinctly different from the majority of WtW enrollees, not only because of variation in local settings but also by design.
(43) WtW enrollees in Yakima, West Virginia, and Nashville had the highest rates of work-limiting health problems at the time of enrollment (Exhibit II.2, Fraker et al. 2004).
(44) Enrollees in Milwaukee were also more likely than their counterparts in other sites to have recently been laid off or fired, which suggests that their labor market difficulties went beyond finding employment.
(45) This evaluation also examined the availability of dental insurance, paid holidays, and paid vacation leave. Appendix Exhibit B.8 presents findings for the six types of fringe benefits examined.
(46) Even paid vacation leave, which was common relative to other fringe benefits, was unavailable for one-third or more enrollees in all study sites.
(47) The definition of availability of a benefit varies depending on the type of benefit. Availability of health insurance refers to active participation in an employers health insurance plan. Availability of paid sick leave and a pension refers to the potential for enrollees to participate in and benefit from these plans two years after enrolling in WtW (i.e., at the time of the interviews), whether or not they did so.
(48) PL 104-193, section 407, subsections (c) and (d). The 30-hour-per-week work requirement became effective in fiscal year 2000.
(49) The rate of satisfying the TANF 30-hour work requirement two years after program entry was very similar to the rate one year after program entry for all sites except Milwaukee and St. Lucie County, where the second-year rate dropped by 7 to 10 percentage points.
The Well-Being of WtW Enrollees
The premise underlying the WtW grants program is that hard-to-employ individuals will be less dependent on TANF and their well-being will improve if they obtain jobs. The preceding chapter presented findings that two-thirds or more of WtW enrollees across the study sites obtained jobs sometime during the year following program entry. However, their employment rates were lower during the second year. By the end of that year, fewer than half of enrollees were employed in 8 of the 11 sites. Those who were employed tended to hold jobs that offered slightly higher compensation in the form of wages and fringe benefits than was true the year before. The net result of these trends was that the mean earnings of enrollees two years after program entry were about the same as one year after entry.
WtW enrollees did become less dependent on TANF following program entry; but for most, incomes did not improve to levels that allowed them to escape poverty. As described in Section A of this chapter, rates of TANF receipt by WtW enrollees fell dramatically during the two years after program entry, but enrollees remained highly dependent on assistance from a wide range of government programs. Despite earnings from employment, Section B shows that two years after program entry, two of every three enrollees had household incomes below the poverty threshold. These high poverty rates were not, however, accompanied by high levels of self-reported material distress. Section C reports on two specific hardshipsВ homelessness and lack of health insuranceВ experienced by some enrollees. Rates of homelessness were high in several study sites but fell over time. On the other hand, the proportion of enrollees without health insurance coverage increased in most sites as time passed.
Receipt of Assistance
WtW enrollees and their families were highly dependent on assistance from private and public sources two years after program entry; however, their dependency did lessen over the post-entry period. This section reports findings on the receipt of assistance based on data obtained from the studys 12- and 24-month follow-up surveys and from state administrative records.
Assistance from Private Sources
WtW enrollees relied heavily on help from nongovernmental sources of support. They were especially likely to receive assistance from family and friends. During the second year after program entry, about two of every three enrollees in each of the study sites received gifts or loans of money, help with transportation, or other types of support from extended family members and friends (Exhibit V.1). They were much less likely to receive assistance from community organizations; only about one in every three or four enrollees received assistance from food pantries, crisis centers, or other organizations that provide goods and services to needy individuals and families.
The trend over time in the receipt of private-source assistance was downward. Across the 11 study sites, rates of receipt of assistance from family and friends or from community organizations were roughly 7 percentage points lower during the second year after program entry than the first (Appendix Exhibit B.10).(50) This may reflect movement by some enrollees beyond the disruptive events that precipitated their entry into WtW at the beginning of the previous year.
Assistance from Public Sources
Two years after entering WtW, most enrollees were still receiving some form of publicly funded assistance (Exhibit V.2). Only in Baltimore County and Milwaukee were rates of receipt of such assistance lower than 70 percent.(51) By wide margins, food stamps were the most common form of government assistance; they were received by more than 60 percent of enrollees in all but the two aforementioned sites (Appendix Exhibit B.11). TANF and SSI/SSDI were the second or third most common forms of government assistance in all of the study sites except Milwaukee, where the noncustodial parents who had enrolled in the NOW program were more likely to receive Social Security retirement or survivors benefits and UI benefits than TANF.
TANF and Food Stamps. This study gathered and analyzed data on TANF and food stamp benefits from administrative files maintained by the states in which the study sites were located. These data provide a more complete picture than do survey data of changes over time in the receipt of benefits from these two programs. For each site, Exhibit V.3 presents quarterly rates of TANF and food stamp receipt calculated for the period beginning four quarters prior to program entry and ending eight quarters after program entry. Our discussion of this exhibit focuses on the interval from the quarter of program entry to the eighth quarter after entry and excludes the Milwaukee site due to its unique target population.(52)
Receipt of TANF by WtW enrollees fell sharply during the two years following program entry. In the ten study sites that are the subject of this discussion, rates of TANF receipt by WtW enrollees during the quarter of program entry ranged from a low of 38 percent in Baltimore County to a high of 100 percent in West Virginia (Exhibit V.3). Eight quarters later, the distribution of recipiency rates had shifted markedly downward, ranging from 10 percent to 64 percent. The relative reductions in rates of TANF receipt were very large in most of the study sites.(53) In seven sites Baltimore County, Boston, Chicago,(54) Ft. Worth, St. Lucie County, West Virginia, and Yakima enrollees were at least 50 percent less likely to receive TANF eight quarters after program entry than in the quarter of entry. In the remaining three sites Nashville, Philadelphia, and Phoenix the reductions ranged from 30 to 40 percent.
This was a period when families in general were leaving TANF, so the reductions in recipiency by WtW enrollees were not unusual. Administrative data for all families receiving TANF in nine of the study sites during a selected quarter in the WtW enrollment period show relative reductions in recipiency rates over the ensuing eight quarters in excess of 40 percent (Appendix Exhibit D.2.c).(55) Therefore, the reductions in TANF receipt by WtW enrollees in the study sites should not be attributed to the local WtW programs; many of the enrollees in those programs would probably have left TANF even if they had not entered WtW.
Receipt of food stamps was relatively stable as TANF recipiency plummeted following WtW entry. The reduction in the rate of receipt of food stamps between Quarter 0 and Quarter 8 averaged about 30 percent across the 10 study sites and was generally much smaller than the reduction in the receipt of TANF (Exhibit V.3).(56) The Yakima site was typical; there, the rate of TANF receipt fell by 54 percent during the two years following WtW entry, whereas the rate of receipt of food stamps fell by only 27 percent. The West Virginia site, where TANF receipt fell by 68 percent while food stamp receipt fell by only 18 percent, provides the sharpest example of the relative stability of food stamp receipt. Only in Boston were the relative reductions in the rates of receipt of these two forms of government assistance following WtW entry roughly equal at 50 percent for TANF and 53 percent for food stamps.
Any Kind of Government Assistance. Receipt of publicly funded assistance broadly defined changed little between the first and second years following program entry, despite the steep reductions in TANF receipt. The rates of receipt of any kind of government assistance, as measured by the two follow-up surveys, were roughly stable in seven of the sites, increased by 9 percentage points in St. Lucie County, and fell by 3 to 13 percentage points in Baltimore County, Chicago, and Yakima (Exhibit V.4, top panel). The mean value of all assistance from government programs was also stable during this period, rising by less than 10 percent in two sites and remaining essentially unchanged in the others (Appendix Exhibit B.13).
The receipt of any kind of government assistance changed little primarily because of patterns in receipt of food stamps and SSI or SSDI. We have seen from the administrative data that, in most of the study sites, the receipt of food stamps by enrollees remained relatively stable while their receipt of TANF fell. In a few sites, the survey data show that increases in the receipt of SSI or SSDI partially offset reductions in the receipt of TANF.(57) This pattern is exemplified by Philadelphia, where the receipt of SSI or SSDI increased by 3 percentage points during the second year after program entry (Exhibit V.4, bottom panel). Ft. Worth, St. Lucie County, and West Virginia provide additional examples of this pattern.
Independence from Tanf Through Employment
PRWORA and the authorizing legislation for the WtW grants program both hold the objective of moving families off welfare and into employment. Exhibit V.5 presents evidence from the 24-month follow-up survey on the extent to which WtW enrollees achieved this objective. This exhibit shows the percentage distribution of enrollees in each study site across the four possible combinations of employment and receipt of TANF. The darkest section of the bar for each site shows the proportion of enrollees who were employed and off TANF. Not surprisingly, this proportion is largest, about two-thirds, for the two JHU sites, which targeted individuals who were employed when they entered WtW. In the other sites, about one-fourth to one-third of enrollees were employed and off TANF two years after program entry, except in West Virginia, where 44 percent had achieved this objective.
Despite the generally modest proportions of enrollees who achieved independence from TANF through employment, several sites saw some progress toward that objective during the second year. In four of the sites, the proportion of enrollees who were employed and off TANF was 4 to 6 percentage points higher at the end of the second year after program entry than at the end of the first year; however, the estimated increase is statistically significant only for the Chicago and Nashville sites (Exhibit V.6, top panel).
There was a pronounced increase during the second year following program entry in the proportion of WtW enrollees who were neither working nor receiving TANF. In seven of the study sites, this proportion increased by between 4 and 14 percentage points; and in five of these sites the estimated increase is statistically significant (Exhibit V.6, bottom panel). St. Lucie County experienced one of the largest increases, at 10 percentage points. This was also the site where enrollee receipt of SSI or SSDI increased most dramatically, by 7 percentage points, during the second year. The Ft. Worth and West Virginia sites also experienced substantial increases in the proportion of enrollees who were neither working nor receiving TANF, accompanied by increases in the receipt of SSI or SSDI. Thus, in three of the study sites, it appears that access to SSI or SSDI benefits facilitated an increase in the proportion of WtW enrollees who were neither employed nor on TANF.
Household Income and Poverty
The household income of WtW enrollees was low or moderately low two years after program entry and was essentially unchanged from the previous year. Consequently, their poverty rates exceeded 50 percent in all of the study sites. Nevertheless, enrollees did not experience high levels of material distress during the second year following program entry in several sites, an index of such distress actually fell during the second year.
Household Income
The mean monthly household income of WtW enrollees ranged from $1,100 to $1,800 at the end of the second year following program entry. In Baltimore County, Milwaukee, St. Lucie County, and Yakima, the mean household income was $1,500 per month or more (Exhibit V.7).(58) In these sites, the mean values of earnings by all household members, including the enrollee, were highest. In Baltimore County and St. Lucie County, the enrollees themselves generated most of the household earnings, as would be expected given the population targeted by the JHU programs in these sites. In sharp contrast, in the Milwaukee site, other persons contributed almost twice as much to household earnings as enrollees themselves. In Yakima, the enrollees and other members of their households contributed equal amounts of earnings.
WtW enrollees in Boston, Nashville, Philadelphia, and West Virginia had the lowest mean total household incomes less than $1,200 per month. Earnings by the enrollees and others in their households were both low in these sites. These happen to be sites that followed a pre-employment model. Enrollees in sites that followed an employment model (Chicago, Ft. Worth, Phoenix, and Yakima) had higher mean total household incomes, but that was almost entirely due to higher earnings by other household members a difference in outcomes that is almost certainly due to differences at baseline rather than to differences in the efficacy of the two program models.
Household income was remarkably stable between the end of the first year following program entry and the end of the second. There was no site for which this study found statistically significant evidence of a change in the mean household income (Appendix Exhibit B.20). The mean household income of enrollees in Milwaukee was about $300 per month higher at the end of the second year than at the end of the first, but given the sites small sample size, this difference is not large enough to be statistically significant.(59)
Poverty Rates
Most WtW enrollees were living in poverty two years after program entry. At least half of enrollees in every study site had household incomes that were below the federal poverty threshold (Exhibit V.8). More than two-thirds of enrollees in Boston, Chicago, Ft. Worth, Nashville, Philadelphia, Phoenix, West Virginia, and Yakima were in poverty at the two-year follow-up point. As a point of comparison, Loprest (2001) reports that in 1999, 52 percent of families nationwide that had left TANF in the previous two years were living in poverty.(60) In six of the WtW study sites, most enrollees were living in severe poverty, with household incomes below 50 percent of the federal poverty threshold. Rates of poverty and severe poverty, like mean household income, were essentially unchanged from the end of the first year after program entry to the end of the second (Appendix Exhibit B.20). These findings are based on a measure of income that does not include food stamps, the earned-income tax credit (EITC), income taxes, or payroll taxes.(61)
The incidence of poverty was much lower for enrollees who were employed at the end of the second year following program entry than those who were not.(62)Exhibit V.9 shows that the poverty rate was lower for employed enrollees in every study site by between 16 percentage points (West Virginia) and 43 percentage points (Baltimore County). However, even employed enrollees had high poverty rates; between one-half and three-fourths of the enrollees who were employed two years after entering WtW were living in poverty in all of the study sites except Baltimore County and Milwaukee, where about four in ten employed enrollees were in poverty. High poverty rates among employed enrollees reflect a combination of low wages and instability in employment during the month for which household income was measured.(63)
Material Distress
A high incidence of poverty did not necessarily mean that WtW enrollees experienced especially high levels of material distress. This evaluation measured five types of material distress that enrollees and their families may have experienced during the second year after program entry: inability to fully pay the rent or mortgage, eviction, inability to fully pay a utility bill, termination of a utility, and disconnection of the telephone. Among these, inability to fully pay the rent or mortgage was most common in Milwaukee, Phoenix, and St. Lucie County, whereas inability to pay a utility bill in its entirety was most common in the other sites (Appendix Exhibit B.18). An index created for this evaluation summarizes the five types of material distress on a 0-to-1 scale, with higher values indicating greater distress.(64),(65) Across the study sites, the mean value of the index ranged from 0.20 in Baltimore County and West Virginia to 0.28 in Ft. Worth and Yakima, corresponding to the experience of between one and one-and-a-half types of distress (Exhibit V.10, upper panel).
Material distress among WtW enrollees fell in some sites between the first and second years following program entry. The mean value of the index of material distress was significantly lower in the second year in five study sites (Exhibit V.10, bottom panel). Thus, even though mean household incomes and poverty rates were unchanged in all of the study sites, material distress diminished modestly in some sites with the passage of time following program entry.
Hardships During the Second Year
Although mean household incomes and poverty rates did not change between the first and second years following program entry, several specific hardships were less stable. This section presents evidence that homelessness, which was prevalent in some sites during both years, was somewhat less common during the second. On the other hand, enrollees lack of health insurance was rare during the first year but more common in most sites during the second.
Homelessness
WtW enrollees in three of the study sites Boston, Milwaukee, and Phoenix exhibited high rates of homelessness during the second year following program entry. Exhibit V.11 illustrates that 9 percent of enrollees in Boston lived in emergency or long-term shelters sometime during the year. A more extreme form of homelessness was common among enrollees in Milwaukee and Phoenix, where 12 percent and 10 percent, respectively, lived on the streets sometime during the year.(66) In sharp contrast, the rates of these two forms of homelessness did not exceed 2 percent in the predominantly rural sites of St. Lucie County and West Virginia. In the remaining study sites, rates were 7 percent or lower.
The incidence of homelessness fell during the second year after program entry in several study sites, particularly where rates of homelessness were high. The top panel of Exhibit V.13 shows that the percentage of enrollees who lived in a shelter fell significantly during the second year in Boston, Phoenix, and Yakima. The bottom panel shows that enrollees in Boston and Chicago were significantly less likely to have lived on the streets during the second year following program entry than during the first. Among the three sites with the highest rates of homelessness during the second year, rates had actually fallen in Boston and Phoenix but not in Milwaukee.
Lack of Health Insurance
WtW enrollees had more difficulty maintaining health insurance coverage for themselves than for their children. Exhibit V.12 shows near-universal coverage (93 percent or more) by public or private health insurance for the children of WtW enrollees two years after program entry in all but the Ft. Worth (84 percent) and St. Lucie County (89 percent) sites. The coverage rates for children were essentially unchanged from the previous year, as illustrated in the top panel of Exhibit V.14. For the enrollees themselves, the median coverage rate across the study sites was just 75 percent. The enrollee coverage rate was lowest in Milwaukee, where very low rates of TANF receipt (4 percent, as shown in Exhibit V.2) by the noncustodial parent enrollees reduced the likelihood they would be covered by Medicaid (Exhibit V.12). In six sites, the percentage of enrollees covered by health insurance fell during the second year following program entry by between 4 points (Philadelphia) and 12 points (West Virginia), as shown in the bottom panel of Exhibit V.14.
Loss of Medicaid coverage following exit from TANF appears to have been a factor behind the reductions in health insurance coverage for WtW enrollees. In five of the six sites where enrollee health insurance coverage rates fell the second year after program entry, rates of receipt of TANF also fell. A comparison of the bottom panel of Exhibit V.14 with Appendix Exhibit B.12 reveals that rates of health insurance coverage and TANF receipt both fell significantly in Boston, Chicago, Ft. Worth, Philadelphia, and West Virginia. St. Lucie County was the only site where the health insurance coverage rate for WtW enrollees fell but there was no significant reduction in the rate of TANF receipt. Thus, it appears that exit from TANF exposed enrollees in about half of the study sites to a greater risk that they, but not their children, would be without health insurance coverage.(67)
PERCENTAGES OF WtW ENROLLEES WHO RECEIVED ASSISTANCE THROUGH SUPPORT NETWORKS
DURING THE SECOND YEAR AFTER PROGRAM ENTRY
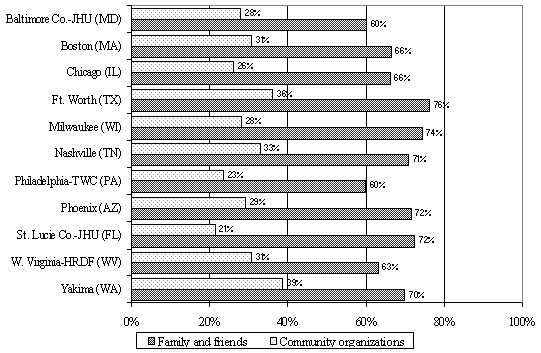
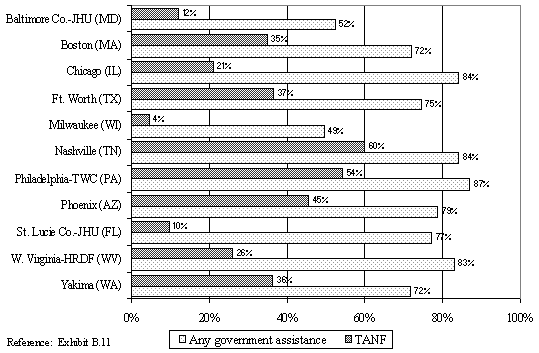
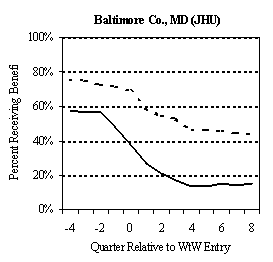
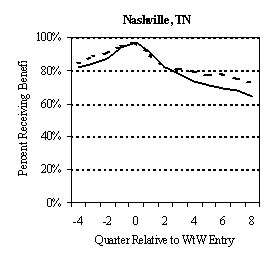
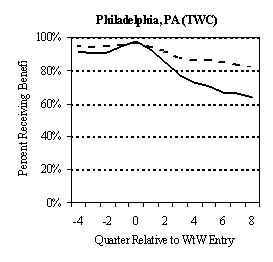
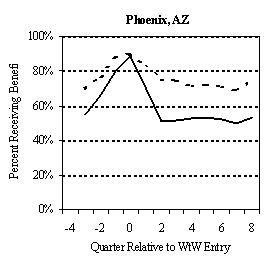
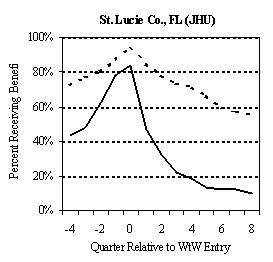
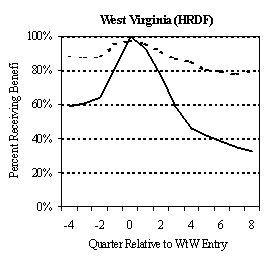
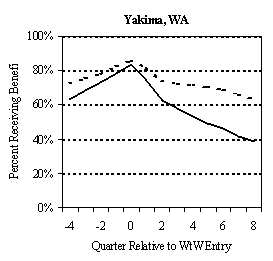

Data Source: state TANF and food stamp records
Reference: Exhibits D.2.b and D.3.b
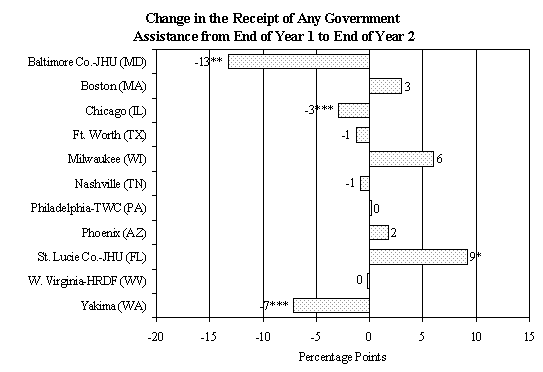
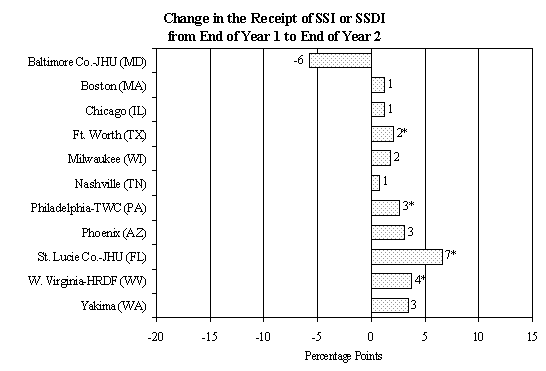
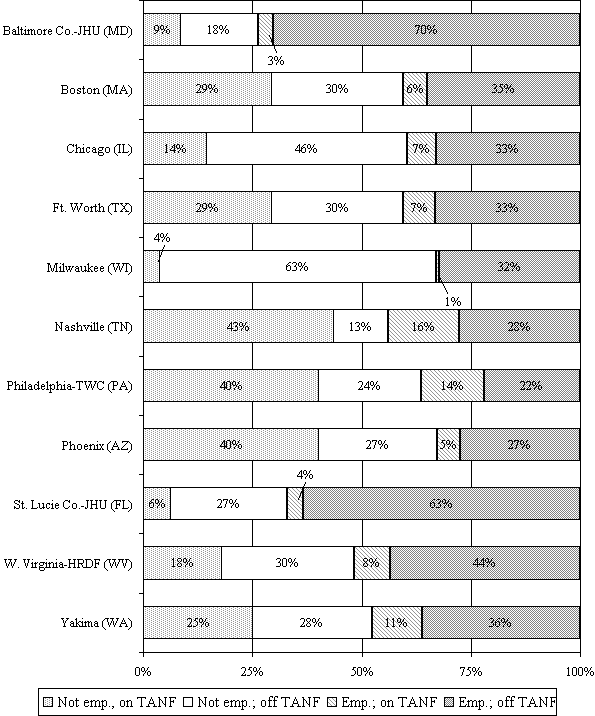
Reference: Exhibit B.14
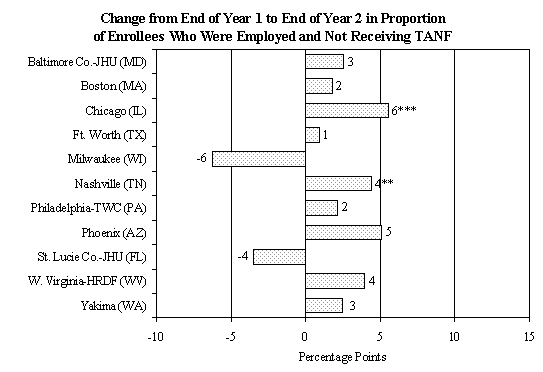
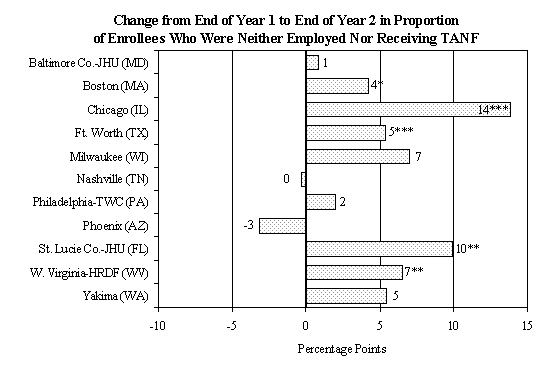
*/**/*** Change from end of Year 1 to end of Year 2 is statistically significant at the .10/.05/.01 level.
Reference: Exhibit B.15
EXHIBIT V.7
MEAN MONTHLY HOUSEHOLD INCOME OF WtW ENROLLEES,
BY SOURCE, TWO YEARS AFTER PROGRAM ENTRY
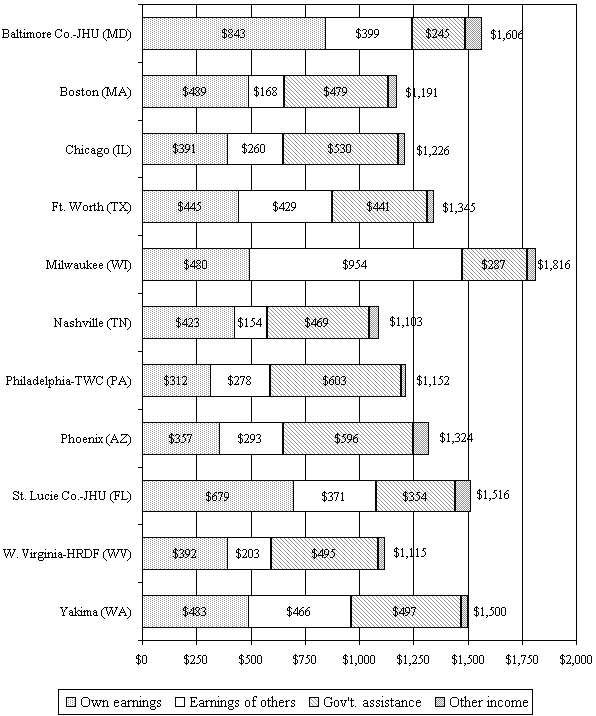
The measures of government assistance and total income include food stamps.
Reference: Exhibit B.16
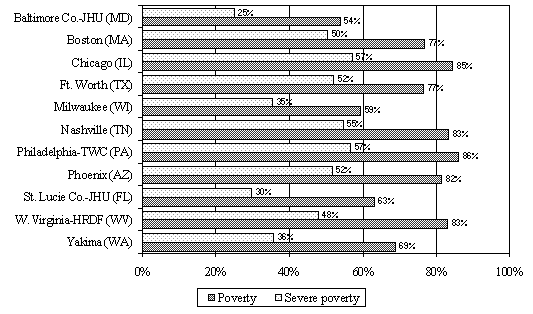
Poverty: monthly income less than 100% of federal poverty threshold.
Severe poverty: monthly income less than 50% of federal poverty threshold.
The measure of income does not include food stamps.
Reference: Exhibit B.17
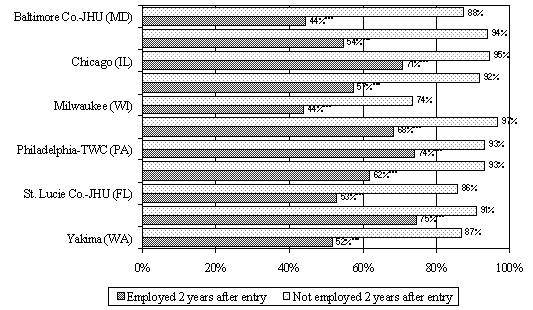
*/**/*** Difference in household poverty rate between employed and not employed is statistically significant at the .10/.05/.01 level.
Reference: Exhibit B.19
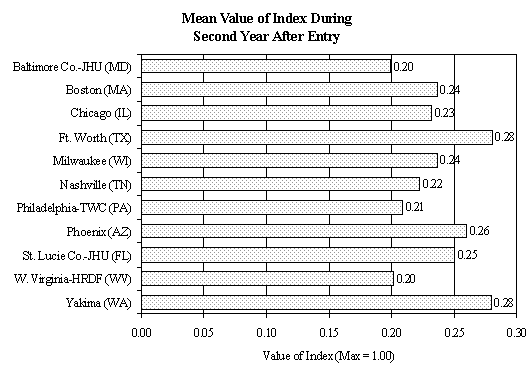
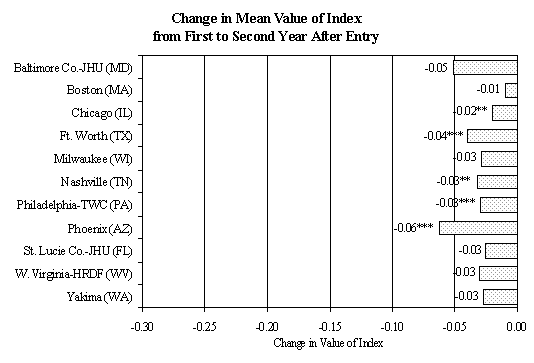
Components of the index: (1) could not pay full rent or mortgage, (2) evicted from home or apartment, (3) could not pay full utility bill, (4) one or more utilities turned off, (5) telephone disconnected.
*/**/*** Change from Year 1 to Year 2 is statistically significant at the .10/.05/.01 level.
Reference: Exhibits B.18 and B.20
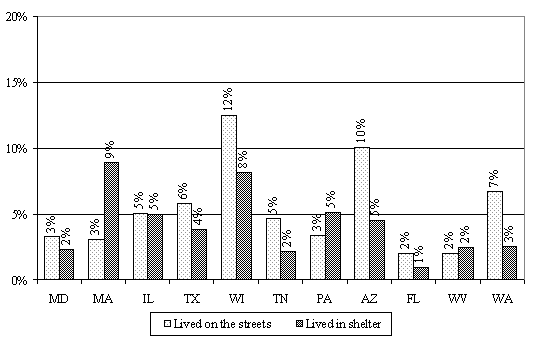
Reference: Exhibit B.18
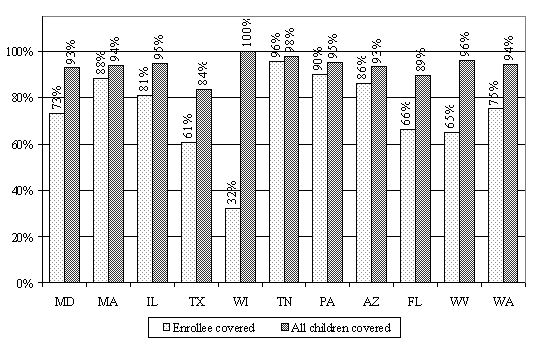
Reference: Exhibit B.21
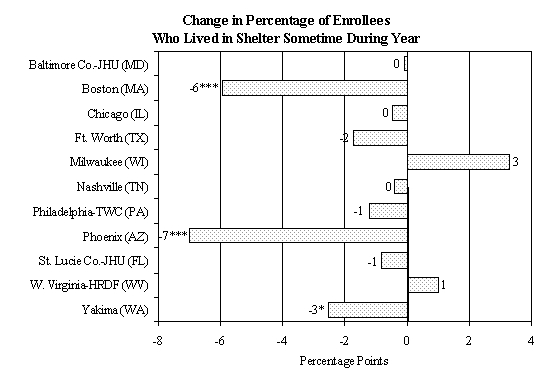
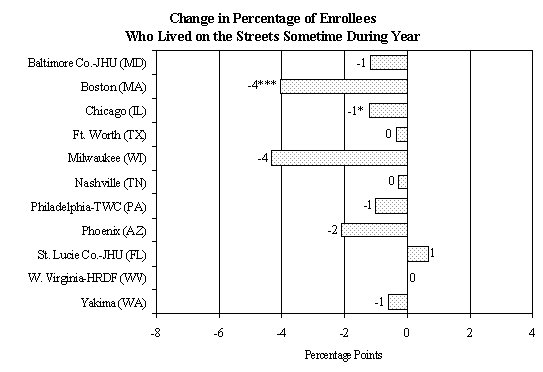
*/**/*** Change from Year 1 to Year 2 is statistically significant at the .10/.05/.01 level.
Reference: Exhibit B.22
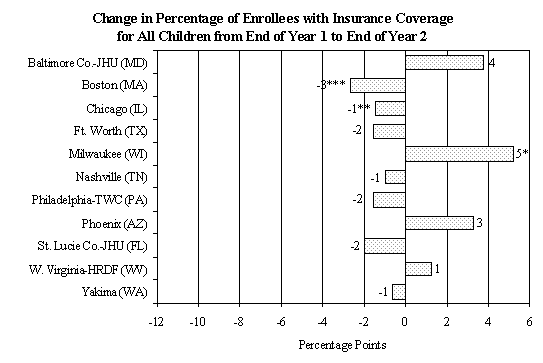
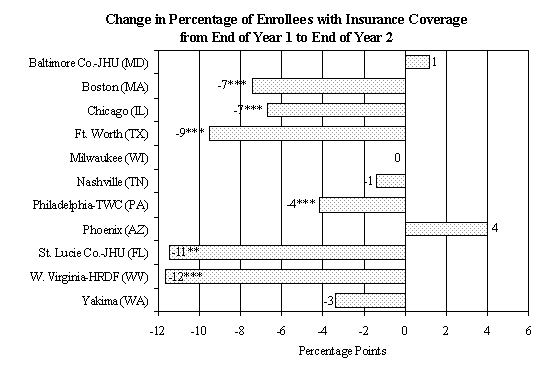
*/**/*** Change from Year 1 to Year 2 is statistically significant at the .10/.05/.01 level.
Reference: Exhibit B.22
Endnotes
(50) In Milwaukee and Philadelphia, where rates of receipt of assistance from community organizations were especially low during the first year after program entry, WtW enrollees experienced little or no erosion in such support during the second year.
(51) The government assistance programs considered in this study are: TANF, food stamps, SSI or SSDI, Social Security retirement or survivors benefits, unemployment insurance benefits, general relief or general assistance, foster care or adoption assistance, and other assistance (including workers compensation and veterans benefits but not housing or medical assistance). Appendix Exhibit B.11 presents findings on the receipt and amounts of these types of assistance.
(52) The discussion of TANF and food stamp receipt is based on data for early WtW enrollees rather than all enrollees. This is because in 10 of the study sites, a full 8 quarters of post-entry data are available only for early enrollees, whereas only six or fewer quarters of post-entry data are available for all enrollees. Early enrollees are defined as those who entered WtW prior to July 1, 2000. Chicago is the only study site in which there were no early enrollees; consequently, it is the one site for which less than 8 quarters of post-entry administrative data are available. The 4 quarters of post-entry results shown in Exhibit V.3 for Chicago are based on all WtW enrollees. Among all of the study sites, in those quarters for which administrative data are available for all enrollees as well as early enrollees, quarter-specific TANF participation rates are generally quite similar between the two groups, as shown in Appendix Exhibits D.2.a and D.2.b. This is especially true for the latest of those quarters, typically Quarters 4 through 6. Thus, we believe that our decision to focus on results for early enrollees does not distort the conclusions that we draw from these data.
(53) The relative change in the rate of TANF receipt over the two years following WtW program entry is defined as the change in the rate of receipt between Quarter 0 and Quarter 8, divided by the rate of receipt in Quarter 0 and expressed as a percentage. All percentage changes reported in this section have been calculated in this manner.
(54) The results for Chicago are based on the four quarters of post-entry administrative data that were available to this study.
(55) State administrative data for all families receiving TANF in the study sites were not available for Boston and Milwaukee.
(56) From fiscal year 2000 to June 2003, the average monthly number of individuals receiving TANF nationwide fell by 17 percent (Committee on Ways and Means of the U.S. House of Representatives 2004; DHHS 2004) while the number receiving food stamps rose by 27 percent (USDA 2004). We would not expect patterns of receipt by cohorts of individuals or families, such as those who participated in the WtW evaluation, to mirror these caseload trends. However, the caseload trends do provide supportive context for our finding that the receipt of TANF by WtW enrollees fell relative to the receipt of food stamps.
(57) This is consistent with the evaluation teams observation site visits to local TANF offices under this and other studies that many TANF agencies were making efforts to identify individuals on their caseloads who were close to exhausting their TANF five-year limit and might qualify for SSI or SSDI and to help them with their applications.
(58) The measure of income reported here is for the month prior to the month in which the 24-month survey interview was completed. It includes cash income of all types (the enrollees own earnings, earnings of other household members, cash benefits from government programs, and any other cash income), plus food stamps, received by all members of the enrollees household. See Appendix Exhibit B.16 for additional details on the calculation of total household income.
(59) The study sample size in Milwaukee was 276, of whom 195 responded to the 12-month follow-up survey and 190 responded to the 24-month follow-up survey. See Appendix F of this report and Appendix C of Fraker et al. 2004 for additional details on this studys survey data collection.
(60) Loprest (2001) based her analysis on the 1999 wave of the National Survey of Americas Families. To be included in that analysis, families had to have left TANF sometime during the two years prior to the survey interview and to have not been receiving TANF at the time of the interview. Seventy-nine percent of these families included at least one parent who was employed at the time of the interview.
(61) To be consistent with the Census Bureaus methodology for determining poverty status, we excluded food stamps from the previously-described measure of income (see footnote 58) for the purpose of the poverty analysis. For the same reason, we did not factor payroll taxes, income taxes, or the EITC into the poverty analysis.
(62) Elsewhere in this report, employment is defined as working on a job for pay at the time of the survey interview. However, to obtain a consistent reference period for earnings and employment in the analysis of poverty by employment status, employment here is defined as positive enrollee earnings in the month prior to the survey interview (the month for which income data were reported). This definition ensures that there are no employed enrollees without earnings in the analysis of poverty by employment status. If such individuals had been included in the analysis, they would have tended to exaggerate the poverty rate among employed enrollees.
(63) We simulated household poverty rates for employed enrollees under the assumptions of: (1) no income from government programs (including the EITC), (2) the enrollees actual earnings in the month prior to the month of the survey interview, and (3) whatever other income their households actually received in that month. The simulated poverty rates are as follows (in percentages): Baltimore County 51, Boston 60, Chicago 74, Ft. Worth 62, Milwaukee 41, Nashville 74, Philadelphia 81, Phoenix 63, St. Lucie County 62, West Virginia 81, and Yakima 60. We then repeated the simulation, but replaced the enrollees actual earnings with earnings calculated on the basis of the usual weekly hours of work on the principal job held at the time of the survey interview, the hourly wage on that job, and 4.3 weeks of work in the month. Poverty rates under the second simulation are less than or equal to those under the first simulation; typically, they are about 10 percentage points lower: Baltimore County 34, Boston 41, Chicago 66, Ft. Worth 56, Milwaukee 41, Nashville 62, Philadelphia 65, Phoenix 48, St. Lucie County 52, West Virginia 75, and Yakima 51. An important factor contributing to the higher simulated poverty rates based on actual earnings is lack of consistent work by employed WtW enrollees over the month preceding the survey interview. We conducted these simulations using data for enrollees who (1) had positive earnings in the month prior to the survey interview and (2) had positive hours of work and a positive wage rate on the principal job held at the time of the interview.
(64) The value of the index of material distress was computed by adding up the number of an enrollees affirmative responses to questions regarding the presence of the five types of material distress and dividing by the number of valid responses. If all five types of distress were experienced, the index took on its maximum value of 1; if only one type was experienced, it took on a value of 0.2 (assuming valid responses to all five questions); and if no type of distress was experienced, the index took on its minimum value of 0.
(65) The design of the index of material distress closely resembles that of the index of material hardship used in several random assignment evaluations of state welfare reform initiatives in the 1990s (Bloom et al. 2002, Fraker et al. 2002, and Miller et al. 2000). For this study, we omitted two of seven specific types of distress, both reflecting failure to see a health care professional when needed. We included these instead in this studys index of health-related distress (Appendix Exhibit B.22).
(66) These three study sites were the only ones in which the incidence of either form of homelessness among WtW enrollees exceeded 10 percent during the second year following program entry (Appendix Exhibit B.18).
(67) As noted in Section C.3 of Chapter IV, coverage by employer-provided health insurance increased among employed enrollees between the end of the first year following program entry and the end of the second year in Chicago, Philadelphia, and Nashville. Rates of TANF receipt, and presumably rates of own Medicaid coverage, fell among all enrollees in these same sites over that period. These two trends had opposing implications for enrollee health insurance coverage. The net effect was a reduction in health insurance coverage among enrollees in Chicago and Philadelphia and essentially no change in coverage among enrollees in Nashville.
Conclusions and Lessons Learned
Enrollees in local programs funded by WtW grants received diverse services and experienced substantial economic progress. Despite that progress, the levels of employment and self-sufficiency two years after program entry were below what policymakers and taxpayers may have anticipated. These broad conclusions are supported by the statistical findings presented in this report, which are based primarily on survey data provided by WtW enrollees in 11 study sites and secondarily on state administrative data for the TANF, Food Stamp, and Unemployment Insurance programs. This chapter summarizes key specific conclusions regarding the implementation of WtW grant-funded programs, the services received by WtW enrollees, and their labor market outcomes and well-being two years after program entry.
Program Implementation
The WtW grants program provided local grantees with funding, considerable latitude to design service packages, and some flexibility regarding target populations. The evaluations implementation study, along with a baseline survey of WtW enrollees at the time of program entry, provides the basis for three specific conclusions regarding program implementation.
DOL awarded WtW grants totaling about $2.8 billion in fiscal years 1998 and 1999, but low enrollments in grant-funded programs delayed the use of those funds to provide services. Recipient organizations originally had three years to use WtW grant funds. However, many programs funded by the grants experienced difficulty enrolling their target numbers of participants. In response, Congress amended the WtW legislation in 1999 to broaden the criteria under which individuals could qualify to receive services funded by the grants. It also extended to five years the period over which grant funds could be used to provide services. Congress rescinded any state formula grant funds that were unexpended as of January 23, 2004.
Grantee plans for WtW programs in the study sites followed four service models. Programs in 4 of the 11 study sites followed a pre-employment model, which emphasized preparation for employment prior to placement in a job. Activities included group counseling, remedial education, and transitional employment. In another four sites, programs followed an employment model, with the objective of quickly moving participants into jobs. Less common was a post-employment model, which was adopted by the two sites that were operating the JHU Career Transcript System. Designed for employed persons, this program emphasized job retention and career advancement. The rehabilitative model was adopted in just one of the study sites. It was designed to facilitate the transition of noncustodial fathers on probation or parole back into society, prepare them for employment, and place them into jobs.
The individuals who enrolled in WtW programs faced serious employment challenges, but no more so than the general TANF population. WtW enrollees were overwhelmingly female, unlikely to be married, and were typically members of racial or ethnic minority groups. About one-third had failed to complete high school or obtain a GED, and one-third were caring for a child under the age of 3. Their recent employment histories were spotty and similar to those of adult TANF recipients. In sites other than those that had adopted a post-employment model, just one-third to one-half of enrollees were employed in the second quarter prior to program entry.
Services Received
Given the diversity of program models, it is not surprising that the services enrollees received varied greatly among the study sites. The following conclusions are based on enrollee reports, rather than on the designs of the programs in which they were enrolled.
WtW enrollees were much more likely to receive employment preparation services than skill enhancement services. Consistent with the legislation that authorized the WtW grants program, more than two-thirds of enrollees in each of the study sites received services that were designed to prepare them for and move them into employment. However, there was considerable variability across the sites in the types and duration of these services. Only in the three sites that adopted either a post-employment model (Baltimore County and St. Lucie County) or rehabilitative model (Milwaukee), did more than one-third of enrollees receive services that were designed to enhance their skills so that they could qualify for better jobs.
The employment preparation services that enrollees received were more consistent with rapid job entry in some sites than in others. WtW enrollees in the Phoenix and Yakima sites, which followed an employment model, received employment preparation services that were highly consistent with a rapid transition to employment primarily brief job readiness training followed by job search assistance. In contrast, enrollees in sites that followed a pre-employment model (Boston, Nashville, Philadelphia, and West Virginia) typically received extended job readiness training or, in Nashville, education and training followed by job search assistance. The average amount of time before enrollees became employed was generally lower for the former group of sites than the latter.
Labor Market Outcomes Two Years after Program Entry
Most WtW enrollees found jobs during the first year following program entry. However, they were less likely to be employed during the second year, and the jobs they held at the end of that year tended to pay low wages and offer few fringe benefits.
Most individuals who enrolled in WtW subsequently obtained jobs, but their employment tended to be unstable. Only 5 to 25 percent of WtW enrollees in the non-JHU study sites were employed when they entered WtW. In contrast, much larger proportions between 60 and 80 percent were employed sometime during the year following program entry. Most WtW enrollees experienced some degree of success in the labor market, but had trouble sustaining it. Their rates of employment sometime during the second post-entry year were lower than during the first by about 10 percentage points. Furthermore, only about 40 percent of enrollees were working for pay at the end of the second year, an employment rate similar to that of adults nationwide who have left TANF.
Employment outcomes varied by program model, but the differences are not indicative of the relative efficacy of the models. Employment rates two years after program entry were highest in the two JHU sites, which followed a post-employment model, and lowest in the Milwaukee site, which followed a rehabilitative model. These outcomes are reflective of the distinctive populations that were served by these programs; the JHU program targeted persons who were already employed and the Milwaukee program targeted ex-offenders. Among the eight other study sites, enrollee employment rates two years after program entry were a few percentage points higher, on average, in those that followed a pre-employment model rather than an employment model. However, this difference does not imply that a pre-employment model is more effective because a similar employment gap existed among enrollees at program entry.
Enrollees who were employed worked a lot of hours but received low wages and few fringe benefits. Across the study sites, enrollees who were employed two years after entering WtW were working an average of 32 to 38 hours per week on their principal job in a typical week. However, they were not necessarily employed consistently week after week over the course of a month. Their hourly wage rate tended to be low, averaging about $10 in three study sites, about $8 in seven sites, and less than $7 in one site. Only about one in every five enrollees who was employed at the end of the second year received health insurance benefits on the principal job, except in Baltimore County, where nearly half had such coverage. Other fringe benefits, such as a pension plan and paid vacation or sick leave, were somewhat more common.
The compensation of employed enrollees edged up over time. In six of the sites, the mean wage on the principal job held by an employed WtW enrollee was higher and/or fringe benefits were more common at the end of the second year after program entry than at the end of the first year. In no site was there deterioration between the two years in any of these elements of labor compensation.
Well-Being Two Years after Program Entry
Instability in employment meant that many WtW enrollees who had been employed sometime during the second year following program entry were no longer working at the end of the year. As noted, only about 40 percent of enrollees in the non-JHU sites were employed at that time. The resulting diminished earnings among enrollees as a group forced many to rely on assistance from outside the household and caused end-of-the-year poverty rates to be higher than they would have been had employment been sustained.
Enrollees typically availed themselves of diverse sources of financial and nonfinancial support two years after entering the WtW program. In most of the study sites, TANF participation rates fell dramatically during the two years following enrollment in WtW. However, in nine of the sites, at least seven in ten enrollees continued to receive assistance from other government programs, especially food stamps, as did half of the enrollees in the remaining two sites. During the second year, about two-thirds also received assistance from extended family members or friends, whereas far fewer received help from community organizations.
Few WtW enrollees were self-sufficient one year after program entry. In the Baltimore County and St. Lucie County sites for the JHU program, about two-thirds of enrollees were self-sufficient (employed and not on TANF) two years after they entered WtW. In the other study sites, only about one-fourth to one-third of enrollees were self-sufficient, except in West Virginia, where 44 percent were. However, rates of self-sufficiency edged up by between 4 and 6 percentage points in four of the study sites between the first and second years following program entry.
Poverty was pervasive among WtW enrollees two years after entering the program, but its incidence was lower among those who were employed. Mean household incomes were stable from the end of the first year following program entry to the end of the second, as were poverty rates, which exceeded 60 percent in every site except Baltimore County. In contrast, Loprest (2001) reports a poverty rate of 52 percent among families nationwide that had recently left TANF. Obtaining and maintaining employment was often an important step out of poverty for WtW enrollees. The rate of poverty among enrollees who were employed at the end of the second year was 16 to 43 percentage points lower than that of enrollees who were not employed. But even for this group, the incidence of poverty was high in an absolute sense in excess of 50 percent in 9 of the 11 study sites.
Lessons for Program Design and Implementation
The philosophy underlying the WtW grants program was that work is the best preparation for work. The result was a program that encouraged grantees to find creative ways to move enrollees into the labor force quickly, while providing some substantial support if it appears needed for that transition more than would be typical in a simple job search/placement program. The findings from this evaluations nonexperimental outcome analysis do not allow us to draw a firm conclusion regarding whether WtW enrollees made better employment progress than they would have without the program. Although most enrollees worked at some time during the evaluations two-year follow-up period, employment problems were still widespread at the end of that period, and the jobs they held often left them in poverty.
Whether a more comprehensive approach, with greater attention to skills development before employment placement, would work better remains an open issue. Congress, responding to views on this issue expressed by grantees, amended the program in 1999 to allow local WtW programs to make some use of job training before job placement. Notwithstanding this design change, the outcomes observed in the 11 study sites suggest that there remains room for considerable improvement in our ability to move welfare recipients into sustainable employment that boosts them out of poverty. Further experimentation and research could address the contributions to that goal that could be made by greater use of job training, as well as the effects of other factors such as health care, child care, other support services, and help with family relationships.
The findings from this evaluations implementation study do provide a basis for the following six lessons regarding the design and implementation of employment programs for TANF recipients and individuals with significant labor market liabilities:
Effective inter-agency partnerships are important. The legislation that authorized the WtW grants, the Balanced Budget Act of 1997 (BBA), required local programs funded by the grants to be implemented within a framework of partnership with local TANF agencies. However, effective partnerships were often slow to develop. In combination with falling welfare caseloads, this often resulted in low numbers of referrals of welfare recipients by TANF agencies to WtW programs, thereby exacerbating the difficulties that many local WtW programs experienced in achieving their enrollment targets. In sites where effective partnerships ultimately did develop, they resulted in improved access for welfare recipients to the workforce development system.
Increased Service Capacity is an Important Legacy. WtW grants afforded many nonprofit community-based organizations their initial opportunity to serve TANF recipients and/or noncustodial parents. Thus, the program increased the pool of qualified organizations with which TANF agencies can contract for employment services in the post-WtW era.
Program Flexibility Encourages Innovative Programming. Flexible rules allowed WtW grantees and their service providers to develop creative program service approaches and administrative practices. These included partnerships with employers, transitional and supported employment, and post-employment case management and job retention services. Some grantees pressed for additional flexibility to provide a broader range of pre-employment services, and Congress responded in 1999 with amendments to the program that permitted up to six months of pre-employment skill-enhancement training.
Stringent eligibility criteria and fiscal requirements may result in low enrollments. The BBA required WtW grantees to spend at least 70 percent of their grant funds on services for enrollees who met very detailed and restrictive eligibility requirements. Up to 30 percent of grant funds could be used to provide services to enrollees who met less stringent eligibility requirements. The former requirement contributed to the widespread problems that grantees experienced in achieving enrollment targets during the early years of the WtW program.
A mid-course correction to a temporary program may be ineffective. The 1999 amendments to the BBA loosened the criteria that defined the enrollees on whom at least 70 percent of grant funds had to be spent. They also expanded the list of allowable pre-employment program activities to include up to six months of vocational education or job training. However, the potential for these changes to have effects were limited because the final program rules reflecting the amendments were published late in the life of the time-limited (five years) grants program and, in that context, grantees were reluctant to revise existing procedures and referral agreements with local TANF agencies.
Temporary funding may accentuate program design and implementation problems. The BBA required that grant funds be spent within three years of their receipt. The 1999 amendments extended that period by two years. Despite the extension, some local WtW administrators continued to believe that temporary funding compounded problems associated with the design and implementation of their programs. These included the reluctance of TANF and other agencies to refer clients to WtW rather than to service providers with whom they had long-term relationships. The administrators also viewed short-term funding as an impediment to identifying and correcting program design problems.
References
Bloom, Dan, Susan Scrivner, Charles Michalopoulos, Pamela Morris, Richard Hendra, Diana Adams-Ciardullo, Johanna Walter, and Wanda Varga. Jobs First: Final Report on Connecticuts Welfare Reform Initiative. Submitted to the Connecticut Department of Social Services. New York: Manpower Demonstration Research Corporation, 2002.
Cochran, W. The Effectiveness of Adjustment by Subclassification in Removing Bias in Observational Studies. Biometrics, vol. 24, 1968, pp. 295-313.
Committee on Ways and Means. 2004 Green Book. Washington, DC: U.S. House of Representatives, March 2004.
Eltinge, J. L. and I. S. Yansaneh. Diagnostics for Formation of Nonresponse Adjustment Cells, With an Application to Income Nonresponse in the U.S. Consumer Expenditure Survey. Survey Methodology, vol. 23, 1997, pp. 33-40.
Fraker, Thomas M., Dan M. Levy, Robert B. Olsen, and Rita A. Stapulonis. The Welfare-to-Works Grant Program: Enrollee Outcomes One Year After Program Entry." Report to Congress submitted to the Office of the Assistant Secretary for Planning and Evaluation, USDHHS. Washington, DC: Mathematica Policy Research, Inc., February 2004.
Fraker, Thomas M., Christine M. Ross, Rita A. Stapulonis, Robert B. Olsen, Martha D. Kovac, M. Robin Dion, and Anu Rangarajan. The Evaluation of Welfare Reform in Iowa: Final Impact Report. Submitted to the Iowa Department of Human Services. Washington, DC: Mathematica Policy Research, Inc., 2000.
Hamilton, Gayle. Moving People from Welfare to Work: Lessons from the National Evaluation of Welfare-to-Work Strategies. Submitted to USDHHS and the U.S. Department of Education. New York: Manpower Demonstration Research Corporation, 2002.
Herr, Toby and Suzanne L. Wagner. Self-Efficacy as a Welfare-to-Work Goal: Emphasizing Both Psychology and Economics in Program Design. Chicago: Project Match, June 2003. Available at http://www.pmatch.org/html/pub.html.
Hillabrant, Walter, Judy Earp, Mack Rhoades, Jr., and Nancy Pindus. Overcoming Challenges to Business and Economic Development in Indian Country. Submitted to the Office of the Assistant Secretary for Planning and Evaluation, USDHHS. Princeton, NJ: Mathematica Policy Research, Inc., August 2004.
Hillabrant, Walter, Mack Rhoades, Jr., and Nancy Pindus. Operating TANF: Opportunities and Challenges for Tribes and Tribal Consortia. Submitted to the Office of the Assistant Secretary for Planning and Evaluation, USDHHS. Princeton, NJ: Mathematica Policy Research, Inc., August 2003.
Hillabrant, Walter, Mack Rhoades, Jr., Nancy Pindus, and John Trutko. The Evaluation of the Tribal Welfare-to-Work Grants Program: Initial Implementation Findings. Submitted to the Office of the Assistant Secretary for Planning and Evaluation, USDHHS. Princeton, NJ: Mathematica Policy Research, Inc., November 2001.
Hillabrant, Walter, and Mack Rhoades, Jr. The Evaluation of the Tribal Welfare-to-Work Grants Program: Learning from Tribal Experience. Submitted to the Office of the Assistant Secretary for Planning and Evaluation, USDHHS. Princeton, NJ: Mathematica Policy Research, Inc., December 2000.
Holt, D. and T. M. F. Smith. Post Stratification. Journal of the Royal Statistical Society A, vol. 142, 1979, pp. 33-46.
Kish, L. Survey Sampling. New York: John Wiley & Sons. 1965.
Little, R. J. A. Post-stratification: a Modeler's Perspective. Journal of the American Statistical Association, vol. 88, 1993, pp. 1001-1012.
Loprest, Pamela. Fewer Welfare Leavers Employed in Weak Economy. Washington, DC: The Urban Institute, August 2003. Available at http://www.urban.org/UploadedPDF/310837_snapshots3_no5.pdf. (PDF format - 2 pages)
Loprest, Pamela. How Are Families That Left Welfare Doing? A Comparison of Early and Recent Welfare Leavers. Washington, DC: The Urban Institute, April 2001. Available at http://www.urban.org/UploadedPDF/anf_b36.pdf (PDF format - 8 pages).
Martinson, Karin, John Trutko, and Debra Strong. Serving Noncustodial Parents: A Descriptive Study of Welfare-to-Work Programs. Washington, DC: The Urban Institute, December 2000.
Miller, Cynthia, Virginia Knox, Lisa A. Gennetian, Martey Dodoo, Jo Anna Hunter, and Cindy Redcross. Reforming Welfare and Rewarding Work: Final Report on the Minnesota Family Investment Program. Volume I: Effects on Adults. Submitted to the Minnesota Department of Human Services. New York: Manpower Demonstration Research Corporation, 2000.
National Governors Association, Round Two Summary of Selected Elements of State Programs for Temporary Assistance for Needy Families. March 14, 1999. Available at http://www.nga.org/cda/files/TANF1998.pdf. (PDF format - 24 pages)
Nightingale, Demetra Smith, Carolyn Taylor OBrien, Michael Eigner, Nancy Pindus, and John Trutko. "Welfare-to-Work Grants Programs: Adjusting to Changing Circumstances." Submitted to the Office of the Assistant Secretary for Planning and Evaluation, USDHHS. Princeton, NJ: Mathematica Policy Research, Inc., November 2003.
Nightingale, Demetra Smith, Nancy Pindus, John Trutko, and Michael Eigner. The Implementation of the Welfare-to-Work Grants Program. Submitted to the Office of the Assistant Secretary for Planning and Evaluation, USDHHS. Princeton, NJ: Mathematica Policy Research, Inc., August 2002.
Nightingale, Demetra Smith, Terri Thompson, Nancy Pindus, Pamela Holcomb, Edgar Lee, Jesse Valente, and John Trutko. Early Implementation of the Welfare-to-Work Grants Programs: Findings from Exploratory Site Visits and Review of Program Plans. Submitted to the Office of the Assistant Secretary for Planning and Evaluation, USDHHS. Washington, DC: The Urban Institute, February 2000.
Perez-Johnson, Irma, Jacqueline Kauff, and Alan Hershey. Giving Noncustodial Parents Options: Employment and Child Support Outcomes of the SHARE Program. Submitted to the Office of the Assistant Secretary for Planning and Evaluation, USDHHS. Princeton, NJ: Mathematica Policy Research, Inc., October 2003.
Perez-Johnson, Irma, Debra Strong, and Michelle VanNoy. Doing What It Takes: Understanding the Costs of the DOL Welfare-to-Work Grants Program, Final Report. Submitted to the Office of the Assistant Secretary for Planning and Evaluation, USDHHS. Princeton, NJ: Mathematica Policy Research, Inc., June 2002.
Perez-Johnson, Irma, Alan Hershey, and Jeanne Bellotti. Further Progress, Persistent Constraints: Findings from a Second Survey of the Welfare-to-Work Grants Program. Submitted to the Office of the Assistant Secretary for Planning and Evaluation, USDHHS. Princeton, NJ: Mathematica Policy Research Inc., June 2000.
Perez-Johnson, Irma, and Alan Hershey. Early Implementation of the Welfare-to-Work Grants Program: Report to Congress. Submitted to the Office of the Assistant Secretary for Planning and Evaluation, USDHHS. Princeton, NJ: Mathematica Policy Research, Inc., March 1999.
Research Triangle Institute. SUDAAN Users Manual, Release 8.0. Research Triangle Park, NC: Research Triangle Institute, 2001.
Ruppert, David. Trimming and Winsorization. In Encyclopedia of Statistical Sciences, vol. 9, edited by Samuel Kotz and Norman L. Johnson. New York: John Wiley and Sons, 1988, pp. 348-53.
Rust, K. F., and J. N. K. Rao. Variance Estimation for Complex Surveys Using Replication Techniques. Statistical Methods in Medical Research, vol. 5, no. 3, September 1996.
Stapulonis, Rita, Shawn Marsh, and Jason Markesich. The National Evaluation of the Welfare-to-Work Grants Program: 12 Month Follow-Up Survey Instrument. Submitted to the Office of the Assistant Secretary for Planning and Evaluation, USDHHS. Princeton, NJ: Mathematica Policy Research, Inc., 2003. Available at http://www.mathematica-mpr.com/PDFs/wtw12que.pdf. (PDF format - 136 pages)
U.S. Department of Agriculture. Food Stamp Program Participation and Costs (FS Summary), and Food Stamp Program (FS Monthly). Available at http://www.fns.usda.gov/pd/fssummar.htm and http://www.fns.usda.gov/pd/fsmonthly.htm. Accessed July 12, 2004.
U.S. Department of Health and Human Services. TANF: Total Number of Families and Recipients, Percent Change from March 2003 to June 2003. Available at http://www.acf.hhs.gov/news/press/2003/mar03_jun03.htm. Accessed July 12, 2004.
U.S. Department of Health and Human Services. State by State Welfare Caseloads Since 1993 (Families), TANF: Total Number of Families, by State, FY 2002, and TANF: Total Number of Families and Recipients, by State, Mar02-Mar03. Available at http://www.acf.hhs.gov/news/stats/newstat2.shtml. Accessed November 4, 2003.
U.S. Department of Labor, Employment and Training Administration. Welfare-to-Work (WtW) Grants; Final Rule; Interim Final Rule. Federal Register, vol. 66, no. 8, January 11, 2001, pp. 2689-2723. Available at http://www.doleta.gov/whatsnew/wtw_regs1_01.txt. Accessed October 30, 2003.
U.S. Department of Labor, Employment and Training Administration. Welfare-to-Work (WtW) Grants; Interim Rule. Federal Register, vol. 62, no. 222, November 18, 1997, pp. 61587-61613. Available at http://www.doleta.gov/regs/fedregs/final/97_29966.pdf. Accessed October 30, 2003.
VanNoy, Michelle, and Irma Perez-Johnson. Targeted Help for the Hard to Employ: Outcomes of Two Philadelphia Welfare-to-Work Programs. Submitted to the Office of the Assistant Secretary for Planning and Evaluation, USDHHS. Princeton, NJ: Mathematica Policy Research, Inc., August 2004.
Wallace, Geoffrey, and Rebecca M. Blank. What Goes Up Must Come Down? Explaining Recent Changes in Public Assistance Caseloads. In Economic Conditions and Welfare Reform, edited by Sheldon H. Danziger. Kalamazoo, MI: Upjohn Institute, 1999.
Appendix A: Summary of the WtW Tribal Study
In enacting PRWORA and the BBA,(1),(2) Congress made special provisions to help American Indian tribes move their members from welfare to work. This legislation authorized five new programs: Tribal TANF, Indian and Native American Welfare-to-Work, Native Employment Works, Tribal Child Care, and Tribal Child Support Enforcement. These programs gave tribal governments new latitude to combine funds from different sources to promote employment and to design certain aspects of the programs to meet their unique needs and circumstances. In addition to the core evaluation of the WtW Grants Program, the BBA called for a study of WtW initiatives undertaken by tribes and tribal organizations. This tribal study comprised the following features:
- A Focus on the Implementation Experience. Given the diversity of circumstances and cultures across the 561 federally recognized tribes, rigorous statistical evaluations of program impacts were infeasible. Instead, the study emphasized developing a clear understanding of program designs, implementation experiences, promising approaches, and lessons learned. The tribal study employed intensive site visits and telephone interviews in three waves of data collection conducted from 1999 to 2003. Each wave included at least 10 sites; the first focused on tribal WtW grantees, the second on tribal TANF grantees, and the third on Indian tribes and Alaska Native Regional corporations. While efforts were made to obtain diversity in such factors as geographic location, population size, and level of unemployment in each of the three study samples, the study results should not be considered representative of every tribe and Alaska Native village.
- Input from a Tribal Working Group. An advisory group with expertise in employment and training programs and welfare reform in Indian country helped to identify potential methodological problems and develop solutions, select sites for the implementation study, and guide the dissemination of results.
- Two-Way Involvement of Tribal Leaders at Study Sites. The study team sought and obtained the approval of relevant tribal authorities for all site visits. Site-specific findings were circulated in draft to the participating tribes, tribal consortia, and Alaska Native Regional corporations for comment before they were included in the study reports.
- Focused Topical Papers. The tribal study had three components, with separate reports produced for each. The first was an evaluation of tribal WtW grants programs for which two reports were prepared. The first report, written for tribal leaders and managers, described preliminary findings of tribal experiences in designing and implementing WtW programs (Hillabrant and Rhoades 2000). The second report on the first component was written for a wide audience and assessed the implementation and operation of tribal WtW programs, describing social, cultural, economic, programmatic, and other factors affecting their operation (Hillabrant, Pindus, Rhoades, and Trutko 2001). The second component of the tribal study examined tribal TANF programs (Hillabrant, Rhoades, and Pindus 2003). The third component focused on innovative economic development efforts in Indian country and their role in moving tribal members from welfare to work (Hillabrant, Earp, Pindus, and Rhoades 2004). The salient aspects and findings of these components are summarized below.
Evaluation of Tribal WtW Grants Programs (Hillabrant and Rhoades 2000; Hillabrant, Rhoades, Pindus, and Trutko 2001)
This component of the tribal study addressed the socio-economic context of welfare reform in Indian country, the scope and services provided, the lessons learned, and promising approaches developed by tribal WtW programs. The evaluation revealed that welfare reform has had both positive and negative consequences in Indian country. On the positive side, welfare reform is consistent with the traditional values tribes place on self-reliance and contribution to the well-being of family and community. Yet, participants in the evaluation expressed concern that welfare reform might push tribal members into more dire straits because too few jobs are available or are being generated to provide employment in much of Indian country. Because many tribes have high unemployment but typically just below the 50 percent unemployment threshold that relieves the 60-month TANF lifetime limit large numbers of Indians and Alaska Natives may be left without support, no matter how hard they try to find work. Some participants said that denial of TANF under such circumstances would conflict with treaty-based federal trust responsibilities to Indian tribes.
Tribal WtW grantees offered many of the same services as the WtW formula and competitive grantees. All of the tribal grantees in the study provided some pre-employment job readiness preparation usually workshops or individualized counseling to help participants overcome and address serious barriers to employment. The tribal grantees commonly made available, either directly or through referral, a variety of supportive services such as transportation assistance, child care, substance abuse treatment and counseling, uniforms or other clothing, work tools, and equipment.
In several respects, however, tribal WtW grantees operated differently from the formula and competitive grantees. If the tribe did not operate the TANF program, then its WtW program had to develop agreements with state agencies to promote referrals from TANF offices. Typically, a memorandum of understanding was developed between the tribal WtW program and local TANF agency. In some cases, agreements with multiple counties (and even multiple states) were needed. Despite successful negotiation of such agreements, some state TANF agencies were unable to refer tribal members to appropriate tribal programs because they were unable to identify tribal members. While states and counties may record the race/ethnicity of TANF recipients, they seldom record the particular tribe to which recipients who are American Indians belong. As a result, some tribal WtW programs had difficulty recruiting participants.
Lessons learned from the evaluation of tribal WtW grants programs include the need to:
- Enhance coordination with other tribal programs. The modest scale of WtW funding and its limited duration make linkages with other programs and agencies, especially TANF, critical for recruiting WtW participants, referring them to needed services, and addressing their longer-term education and employment needs.
- Collaborate with state agencies and programs, especially TANF and Child Support Enforcement. Tribes can benefit from agreements with state TANF and child support agencies to promote referrals from TANF offices to tribal WtW programs, and find noncustodial parents residing off-reservation so that support can be collected according to tribal court decisions.
- Expand child care and transportation resources. Tribal programs have used approaches such as training TANF recipients to become licensed child care providers, providing van services, leasing or otherwise providing refurbished automobiles, and reimbursing transportation costs.
- Utilize the Indian Employment, Training, and Related Services Demonstration Act (the 477 program) to streamline and coordinate employment and training activities.(3) Service integration can be enhanced if the tribe participates in the 477 program, which allows unified management of funds from various federal sources for training, education, support services, job development and placement, and other services. Tribal agencies then no longer have to refer clients between programs if one has exhausted its funds; this is especially valuable to small tribes whose limited WtW funds often support no more than a part-time staff position.
- Use WtW funds to promote economic development. Tribal WtW programs can do little to directly stimulate economic development. But, in addition to providing high-quality services to enrollees, the programs can support economic development by (1) documenting the number and skills of WtW enrollees for employers who may be considering moving into the area and (2) having a plan for upgrading skills in response to the needs of prospective employers.
Evaluation of tribal TANF programs (Hillabrant, Rhoades, and Pindus 2003)
This component of the tribal study addressed the benefits of tribes operating their own TANF programs, the challenges and problems encountered, and the lessons learned. The ultimate impact of tribal TANF programs remains a question, however, because this study was not designed to measure impacts on employment outcomes. Furthermore, the persistent lack of employment opportunity in Indian country is an ongoing challenge to tribal TANF programs no matter how well they are run.
Assuming responsibility for TANF presents tribes with important opportunities that affect many members. In addition to increasing participants employability and opportunities, it can bring an infusion of federal and state dollars under tribal control, enhance program coordination, and improve the tribes reputation and image. However, operating TANF also poses risks and costs for tribes and tribal consortia. A tribal TANF program contends for resources with other tribal programs. Funding levels are based on 1994 Aid to Families with Dependent Children (AFDC) caseloads, and tribes (as with state TANF agencies) report that they cannot guarantee their ability to serve all eligible participants if unexpected events or circumstances arise, such as a natural disaster. Failure to operate the program successfully might harm the most vulnerable tribal members, set back other tribal self-determination initiatives, raise difficult personnel issues, and create or exacerbate problems with the state.
Despite these possible drawbacks, the overall experiences of tribes/Native corporations with operating their own TANF programs have been positive. In fact, cooperation on welfare reform may represent one of the best examples of tribal-state collaboration, and can serve as a model for other areas. For example, state governments have worked with tribes in the study sites to plan and carry out the transfer of responsibility for operating TANF from the state to the tribe or tribal consortium. The states have provided training and technical assistance to tribal staff and shared their approaches to TANF data collection, management, and reporting. Most of the states examined in the evaluation provided the tribal TANF programs with some or all of the matching funds they would be required to provide in a state-run program.
Several lessons were learned from the evaluation of tribal TANF programs. Reports of the number of tribal members on AFDC in 1994 are critical to the financial soundness of tribal TANF programs, but some of these reports were based on estimates that were subject to error. Refinement of some TANF program policies and procedures might help tribal programs.(4) In addition, cooperation with the state can smooth the transition to a successful tribal TANF program. State policies and services are critical to the success of tribal TANF programs: states can deliver training, provide TANF services for a transition period, share state information systems and equipment, and ensure that tribal TANF participants have access to other state services.
Analysis of Economic Development in Indian Country (Hillabrant, Earp, Rhoades, and Pindus, 2004)
American Indian tribes and Alaska Native villages have embraced the goals, objectives, and programs associated with welfare reform, but the lack of jobs threatens the success of tribal programs such as TANF and WtW. Recognizing the scope and importance of this problem, the federal government has promoted business and economic development (BD/ED) in Indian country. This last component of the tribal study examined: (1) examples of BD/ED activities and the federal initiatives utilized by a convenience sample of eight tribes and two Alaska Native Regional corporations, (2) the legal, historical, and cultural context of tribal BD/ED, and (3) the challenges tribes/Native corporations face in pursuing BD/ED, as well as the promising approaches they are developing to minimize or overcome them.
Every tribe/Native corporation in the study benefited from one or more federal programs promoting BD/ED; however, no single program/initiative was especially beneficial to all tribes in the study. The most helpful were gaming, USDA rural development programs in combination with the Empowerment Zones and Enterprise Communities (EZ/EC) program, and the Small Business Administration 8(a) and HUBZone programs. Some tribes identified the Indian Gaming Regulatory Act(5) as the federal initiative with the greatest impact on their BD/ED. In 2001, 201 of the 561 federally recognized tribes had gaming operations, with total revenues of $12.7 billion. While gaming has transformed some tribal economies and provided a stimulus to others, most tribes do not participate in gaming operations and some that do participate have been unsuccessful or have produced only modest profits.
The tribes/Native corporations in the study have developed a wide range of BD/ED activities that build on their natural resources and other favorable conditions for example, location near such tourism and recreation attractions as national parks and monuments. These tribes have developed businesses in the service sector (gaming, tourism, banking), manufacturing, farming, natural resource management and development (mining, forest products), and more. Two tribes in the study have experienced significant success, transforming their economies, creating jobs, and dramatically reducing unemployment and poverty on their reservations. Another gradually developed a diverse and strong economy and has achieved one of the lowest unemployment rates (10 percent) in Indian country. Other tribes, often using innovative and aggressive BD/ED planning and operations, have developed new businesses and industries and created jobs.
Yet despite some notable successes in the area of economic development, the number of jobs created and the wealth produced in Indian country continue to be outpaced by the large numbers of tribal members who lack employment and live in poverty. Many Indian tribes and Alaska Native villages experience levels of unemployment exceeding 45 percent, and levels of poverty exceeding 36 percent. Study participants in seven of the eight tribes and one of the Alaska Native corporations in the sample reported unemployment rates exceeding 45 percent with the highest at 80 percent.
The study participants identified four critical challenges to their BD/ED efforts: (1) legal and administrative barriers such as zoning regulations, tax policies, and/or incomplete commercial codes, (2) pressure from elected officials or tribal stockholders on business activities that is inconsistent with long-term planning and investment, (3) lack of investment capital (debt and equity financing), and (4) poor coordination of business-related activities within the tribe and with neighboring cities and counties.
(1) Public Law 104-193, section 103, August 22, 1996.
(2) Public Law 105-33, section 5001, August 5, 1997.
(3) Public Law 102-477, 1992.
(4) For example, facilitating the use of state TANF reporting systems by tribal grantees could make the required quarterly reports easier to compile. In addition, waivers or other procedural changes could facilitate participation by tribal TANF recipients in state-run Food Stamp, Medicaid, and SCHIP programs.
(5) Public Law 100-497, 1988.
Appendix B: Supporting Exhibits for Chapters IV and V: Enrollee Outcomes, Based on Data From the Second Follow-Up Survey
This appendix is available in PDF format only. (29 pages)
Appendix C: Standard Errors for Estimates of Enrollee Outcomes Presented in Appendix B
This appendix is available in PDF format only. (29 pages)
Appendix D: Supporting Exhibits for Chapters II, IV, and V: Enrollee Outcomes, Based on Administrative Data
This appendix is available in PDF format only. (12 pages)
Appendix E: Supporting Exhibits for Chapter II: Characteristics of Enrollees at Program Entry
This appendix is available in PDF format only. (5 pages)
Appendix F: Survey Weights and Statistical Methods
By:
Amang S. Sukasih, Sonya L. Vartivarian, Esther M. Friedman, and Donsig Jang
This appendix is only available in PDF format. (25 pages)
Appendix G: Brief Summaries of Selected Reports on the National Evaluation of the WtW Grants Program
The following pages summarize selected earlier reports on the results of the National Evaluation of the Welfare-to-Work Grants Program, undertaken by Mathematica Policy Research Inc., and its subcontractors the Urban Institute and Support Services International.
Targeted Help for the Hard to Employ: Outcomes of Two Philadelphia Welfare-to-Work Programs
This report examines the outcomes of participants in two programs that were central to Philadelphias WtW strategy: the Regional Service Centers (RSCs) and the Transitional Work Corporation (TWC). These programs differed in that the RSCs offered 30 days of basic job search assistance to the broad WtW-eligible population, while TWC provided paid work experience for up to six months and targeted those with little or no work experience. The study examined the employment, earnings, and TANF receipt outcomes of participants in these programs. Key findings included the following:
- TWC and RSC participants worked more, earned more, and were less likely to receives TANF after program entry. Participants in both programs had increases in employment immediately after program entry, followed by declines. One-and-a-half years after program entry, participants from both programs still had higher employment rates than before program entry. They also had higher earnings and lower rates of TANF receipt than before program entry.
- Consistent with the targeting and sequencing of the programs, RSC and TWC participants differed in their outcomes over time. RSC participants had higher rates of employment, higher earnings, and lower rates of TANF receipt than TWC participants one and a half years after program entry. However, RSC and TWC participants also differed in their employment, earnings, and TANF receipt prior to program entry.
- Observable factors explained RSC and TWC participants difference in employment and some of their differences in earnings and TANF receipt. Controlling for demographic characteristics, prior work and TANF receipt, and economic conditions accounts for the simple observed differences in the percentage of RSC and TWC participants employed one and a half years after program entry. Differences in earnings and TANF receipt remained, with about one-third of the difference explained by these observable factors.
- Further research is needed to clarify how programs like the RSCs and TWC contribute to participant outcomes. The results offer a hint that the intensive TWC intervention might have partially made up for the greater employment challenges faced by TWC participants. However, the study raises questions that only a more rigorous evaluation can answer most notably, how did TWC participants outcomes compare to how they would have fared in the absence of this intervention?
[Full report: Targeted Help for the Hard to Employ: Outcomes of Two Philadelphia Welfare-to-Work Programs]
Welfare-to-Work Grants Programs: Adjusting to Changing Circumstances
This report, based on telephone calls to WtW grant administrators in 2003, documented program status, future plans, program adjustments, and lessons from WtW. Most programs were phasing down at the time of this study two sites completed their grant periods in 2001; the others in late 2003 or early 2004. Enrollment continued until about six months before the grant ended. About one month before the end-date, remaining participants were usually transferred to other, mainly WIA-funded, programs. In half the sites, there was increased emphasis on particular groups, especially noncustodial fathers. Among the main findings were:
- In most sites, long-term funding for programs was uncertain. Administrators were especially concerned about whether TANF or WIA funds would be available to serve participants who were hardest to employ. Some programs (in about two-thirds of the sites) expected being able to continue for a year or two using TANF or WIA funds.
- No adjustments were made due to TANF or WIA policies or the economy. Although many participants hit time limits, WtW and TANF were able to help for example, via more job development, or moving cases to state-funded welfare. There was some concern that one-stop career centers might not be sensitive to welfare recipients, but in only one study site did a center decrease its priority on welfare clients in 2003. Despite the slow economy in 2003, participants were still able to find jobs, but it took longer and they had fewer options (e.g., lower wages, fewer hours per week). Employer partnerships, however, were harder to maintain because firms were less able to commit to hiring individuals who successfully completed the programs.
- Grantee administrators were generally positive about the WtW grants program and its legacy. In particular, they cited (1) the local flexibility in program design and (2) the momentum to increase collaboration among WIA, TANF agencies, and community-based organizations. The report noted several key lessons learned from the WtW programs, chiefly:
- Complicated eligibility criteria contribute to operational difficulties. Program startup was delayed as inter-agency agreements were developed to verify eligibility and refer individuals from TANF. Congress broadened eligibility in 1999, in a move welcomed by programs, but to little effect. Programs had already been designed, service contracts were in effect, and WtW-TANF agreements continued to use the original rules.
- Longer-term or permanent funding is important when targeting hard-to-serve groups. Program development, recruitment, and referral took longer than expected. The five-year period was considered too short.
- More specific technical assistance on service issues is important. Grantees were glad to have discretion in programming, but reported that they would have liked more help on some issues, such as understanding TANF policies, performance goals, and data systems, and effective recruitment and outreach strategies.
[Full report: Welfare-to-Work Grants Programs: Adjusting to Changing Circumstances ]
Giving Noncustodial Parents Options: Employment and Child Support Outcomes of the SHARE Program
This report examined a special initiative called SHARE (Support Has a Rewarding Effect) that operated with WtW grant support and targeted noncustodial parents (NCPs) in three counties in the state of Washington. SHARE offered three options to NCPs whose children were receiving TANF and who were in arrears of their child support obligations: (1) start paying support, (2) enroll in a WtW program, or (3) face possible incarceration. The main objective of the study was to examine the employment, earnings, and child support outcomes from this innovative collaboration involving the welfare system, child support enforcement agencies, the workforce investment system, and employment and training providers. Key findings included the following:
- NCPs took different paths through SHARE. About half of the targeted NCPs appeared at a mandatory hearing at which the program was explained to them. Many NCPs never learned about SHARE because staff could not locate them.
- NCPs worked more, earned more, and paid more child support after referral to SHARE than before. The employment rate among all NCPs referred to SHARE increased from one-quarter just before referral to one-third in the quarter of referral, and remained about one-third for the following nine quarters. Average earnings increased 39 percent between the quarter immediately preceding referral and the quarter of referral, and continued to climb. The rate of child support payment nearly doubled just after referral and consistently exceeded pre-referral highs.
- Outcomes improved for NCPs who took part in SHARE, but also for those who did not. NCPs who appeared at a hearing and learned about SHARE nevertheless had higher employment rates, average earnings, and child support payments than NCPs who never appeared at such a hearing.
- SHARE probably contributed to the observed increases in employment, earnings, and child support payments. Factors other than SHARE such as unobserved characteristics of the NCPs or natural ebbs and flows in their employment and ability to pay support probably played some role in the outcomes observed. However, differences in key outcomes for NCPs who took different paths through the initiative insignificant before referral to SHARE become more marked and significant after referral to the program. This suggests that all or some of SHAREs components may have played a role in the improvements observed for NCPs who did engage in the initiative.
[ Full report: Giving Noncustodial Parents Options: Employment and Child Support Outcomes of the SHARE Program]
The Implementation of the Welfare-to-Work Grants Program
The evaluations process and implementation component was the subject of this report, which described the service delivery operations of WtW-funded programs in 11 study sites. The findings based on formal site visits, interviews with administrators and staff, and analyses of program management data included:
- The programs were decentralized. There were more than 90 programs some operating in multiple locations that used varying service delivery organizations and different arrangements for collaboration with TANF agencies. WIBs were the most common grantee, and most had a formal arrangement with TANF agencies; for example, to operate all or part of the TANF work program. Nonprofit organizations (and one university) also played a major role, typically as program operators under subcontract to a WtW grantee or as providers of special services.
- Sites used one of three general program models, reflecting their primary approach. Among the 11 sites, the following approaches were identified: (1) Enhanced Direct Employment Models, which emphasized individualized pre-employment job search assistance, counseling, case management, and post-employment support; (2) Developmental/Transitional Employment Models emphasizing skills development, usually in a transitional, subsidized, or community service job; and (3) Intensive Post- Employment Skills Development Models, wherein the dual objectives were job retention and skills development for individuals who have already started a job.
- Employment pathways varied, but most enrollees who found employment received only job readiness and search assistance. In the eight sites where data were available, about half of the participants obtained regular unsubsidized employment. Regardless of the program model, about 60 percent of participants who became employed, did so with just job search assistance or job readiness services. Another 20 percent became employed after participating in a transitional or subsidized job, and 5 percent after receiving job training or education. The rest (15 percent) received a mix of services from the program (job search assistance along with a transitional job and possibly training or education.
- Sites used several innovative strategies. While this component of the evaluation did not address program effectiveness, a number of potentially promising approaches were identified in the sites. Among these were: (1) extensive involvement of nonprofit organizations as program operators and special service providers, particularly to provide services to special populations; (2) collaborations with employers for example, in designing pre-employment components, sponsoring internships, and partnering with post-employment skills development; and (3) transitional work components, such as paid community service jobs, part-time community service job plus wrap-around education, supervised temporary employment, sheltered workshops, and on-the-job training. Nearly all grantees operated the latter to some extent, with the aim of providing a bridge to regular employment.
- The findings suggest a number of policy and operations lessons for serving welfare recipients and low-income parents with employment problems. Among them: (1) detailed eligibility and fiscal provisions can delay program implementation; (2) temporary funding and authority imposes added challenges to program implementation; (3) programs benefit from public and private partnerships and collaborations at the local level; and (4) carefully designed programs can reach populations with serious employment problems particularly those utilizing nonprofit community-based organizations and systematic outreach and recruitment efforts, and offering comprehensive services.
[Full report: The Implementation of the Welfare-to-Work Grants Program]
Doing What It Takes: Understanding the Costs of DOL Welfare-to-Work Grants Programs, Final Report
This report examined the costs of 18 WtW programs in nine sites that operated with federal grant support. The main objectives of the analysis were to understand the cost structure of selected programs, and the factors influencing it. Program evaluators and planners should find this information useful in assessing the outcomes of WtW programs and in making decisions about future programs with similar objectives. Key findings from the study included the following:
- The average WtW program spent $3,607 to serve each participant. The least costly WtW program spent $1,887 per participant, while the most costly spent $6,641.
- WtW costs per participant reflected meaningful differences in program design. Variations in WtW costs per participant reflected three dominant service approaches. Enhanced Direct Employment programs (average cost: $3,559) emphasized quick entry to employment while also offering pre-employment preparation and retention support. Transitional Employment programs either emphasized paid work experience (average cost: $4,346) or helped WtW participants prepare for jobs with employer partners (average cost: $4,513). Post-employment Services programs cost less (average cost: $2,178) because they provided mostly intensive case management to already employed individuals.
- WtW programs cost more than WIN, less than Supported Work, and about the same as JOBS programs. Differences in WtW costs per participant as compared to earlier interventions reflected three factors. First, WtW programs targeted hard-toemploy individuals who were excluded from participation mandates (as in WIN) or often deferred from participation (as in WIN and JOBS). Second, although WtW programs did not emphasize education and training (as in JOBS), they sought to build a foundation for employment through direct work experience and other skill upgrade activities more closely linked to employment. Third, to maintain their simultaneous focus on employment and human capital development for hard-to-employ participants, WtW programs expanded case management and other services. Nevertheless, WtW efforts were not as comprehensive as those undertaken by Supported Work programs.
- Future efforts could cost as much as, or more than, WtW. Expanded individual and aggregate TANF work requirements may motivate states to continue to focus on hardto- employ individuals and even intensify elements such as structured job readiness, paid work experience, or post-placement case management which could raise average costs. Increased flexibility in program design could also lead to greater use of education and training activities, which might also be costly.
[Full report: Doing What It Takes: Understanding the Costs of DOL Welfare-to-Work Grants Programs, Final Report]
Serving Noncustodial Parents: A Descriptive Study of Welfare-to-Work Programs
This report examines the strategies used by 11 WtW grantees to design programs for and delivery services to low-income noncustodial parents (NCPs). Two of the sites were in-depth study grantees for the formal WtW evaluation; the other nine were selected to represent a range of services and approaches. Six of the programs were operated by workforce development agencies, four by nonprofit community-based organizations, and one by a corrections department. The programs brought together a wide range of partners, including workforce development agencies, child support agencies, courts, and TANF agencies. For most grantees, the availability of the WtW funds often spurred an interest in or further impetus for serving NCPs.
- Programs used similar services, focusing primarily on job search assistance. All programs conducted some type of employability assessment and job search assistance (usually in a group setting) and post-employment support to help participants retain jobs. The programs also provided a case manager for each participant. Some programs offered education and job training, but most participants were uninterested, preferring to get a regular job. Parenting and relationship services were typically not emphasized, although a few programs placed high priority on these issues (all programs could refer participants to other special agencies for assistance).
- A variety of public and private organizations can establish and operate programs for NCPS. no single model or provider is necessarily preferable, and collaboration among agencies can ensure a range of services to address families varied problems
- Outreach and recruitment are major components of and challenges to NCP programs. The target population was difficult to reach and often initially reluctant to participate, fearing repercussions from the child support enforcement agency. Programs developed a variety of approaches to outreach and to retaining participants in the program once enrolled.
- A combination of positive incentives and pressures may prove more successful than either a voluntary or harshly punitive program. Positive incentives may not only enhance outcomes, but facilitate recruitment. Among the positive incentives for participating were employment services, transportation assistance, vouchers for workrelated expenses, and help in communicating with the child support agency. Requirements and sanctions in some programs took the form of a threat of incarceration for nonpayment of child support. Most programs, though, were voluntary.
- Helping NCPs understand and navigate the child support enforcement system may be an important program service. Most of the programs incorporated some focus on child support, including helping participants work with child support, often with a designated worker at the child support agency.
[Full report: Serving Noncustodial Parents: A Descriptive Study of Welfare-to-Work Programs]
Further Progress, Persistent Constraints: Findings from a Second Survey of the Welfare to Work Grants Program
This report documented the continuing implementation progress of the WtW grants program. To capture changes as program implementation advanced, the survey of WtW grantees nationwide, noted above, was repeated in late 1999. Although this second survey identified signs of progress, it also found that the eligibility criteria continued to constrain enrollment (Congressional action to expand the eligible population had not yet taken effect at the time of the survey). Other findings suggested some operational changes, but confirmed many of the findings from the first survey. The main findings from the second survey were as follows:
- WtW program implementation had advanced but participation levels still lagged. Most grantees, except those who were recently funded, were delivering services and operating at a somewhat larger scale than that observed in the first survey a yearearlier. However, restrictive eligibility rules still in effect in late 1999 continued to impede enrollment. As a result, the average pace of enrollment had not increased.
- The scale at which WtW programs were projected to operate remained modest. Respondents to the second survey had formulated more conservative participation targets, largely reflecting the enrollment difficulties encountered prior to the survey. Despite the declines in TANF rolls, survey respondents perceived no decline in overall need for WtW services.
- Grantees emphasized unsubsidized employment but set realistic placement goals. While an unsubsidized job was the ultimate goal for all WtW participants, respondents expected some program attrition and had some reservations about the availability of jobs. They anticipated placing somewhat less than half of all WtW enrollees in unsubsidized employment.
- Most placements to date had been in low-wage, service occupations. Grantees moved expeditiously to place WtW participants enrolled in their programs. They succeeded in placing about a quarter of their projected placements more than 50,000 individuals. Most participants were placed in services and administrative support positions, which were available even to those with limited skills and poor work history. Participants placement wages averaged just $6.81 per hour and opportunities for advancement appeared limited.
[Full report: Further Progress, Persistent Constraints: Findings from a Second Survey of the Welfare to Work Grants Program]
Early Implementation of the Welfare-to-Work Grants Program, Report to Congress
This report responded to a congressional mandate for rapid findings on WtW program implementation. Responses to an early survey of WtW grantees nationwide, conducted at the end of 1998, provided an outline of the federally funded WtW programs and their initial start-up experiences. The WtW grantee survey provided an overall description of program structure, sponsorship, target populations, services provided, scale of operations, outcomes achieved, and challenges encountered. Early survey findings included the following:
- From the outset, WtW programs emphasized rapid attachment to supportive work. WtW grantees allocated substantial resources to getting participants quickly into work activities. In addition, the grantees emphasized supported employment through wage subsidies and worksite training over simple placement in regular jobs.
- Grantees were in the very early stages of implementation. About half of the grantees surveyed were not awarded grants until the latter part of 1998, and it took them several months to begin delivering services. By late 1998, about 40 percent of grantees had started enrolling participants but each had enrolled an average of only 60 people. Many grantees were having trouble recruiting at their anticipated pace in the early months, suggesting that overall enrollment numbers could be lower than grantees had planned.
- Grantees felt that the WtW eligibility criteria were too strict. Most grantees reported that the original eligibility criteria excluded some people from their programs who had serious barriers to employment, most notably individuals who had earned a high school credential but still had low skills.
[Full report: Early Implementation of the Welfare-to-Work Grants Program, Report to Congress]
Appendix H: Comprehensive Bibliography of Reports on the National Evaluation of the WtW Grants Program
This appendix provides a comprehensive list of reports prepared under the National Evaluation of the Welfare-to-Work Grants Program. All of these reports were submitted to the evaluations project officer, Alana Landey, in the Office of the Assistant Secretary for Planning and Evaluation, U.S. Department of Health and Human Services. Most can be downloaded from the sections of the ASPE and MPR websites that are devoted to the evaluation:
http://aspe.hhs.gov/hsp/hspwelfare.htm#WtW
http://www.mathematica-mpr.com/welfare/welwork1.asp
Printed copies of reports can be obtained by calling the MPR publications department at (609) 275-2350.
Core Evaluation
Fraker, Thomas M., Alan M. Hershey, Dan M. Levy, Demetra S. Nightingale, Irma Perez-Johnson, Robert B. Olsen, and Rita A. Stapulonis. The National Evaluation of the Welfare-to-Work Grants Program: Final Report. Washington, DC: Mathematica Policy Research, Inc., September 2004.
Fraker, Thomas M., Dan M. Levy, Robert B. Olsen, and Rita A. Stapulonis. The Welfare-to-Work Grants Program: Enrollee Outcomes One Year After Program Entry, Report to Congress. Washington, DC: Mathematica Policy Research, Inc., February 2004.
Nightingale, Demetra Smith, Carolyn Taylor OBrien, Michael Eigner, Nancy Pindus, and John Trutko. "Welfare-to-Work Grants Programs: Adjusting to Changing Circumstances." Princeton, NJ: Mathematica Policy Research, Inc., November 2003.
Nightingale, Demetra Smith, Nancy Pindus, John Trutko, and Michael Eigner. The Implementation of the Welfare-to-Work Grants Program. Princeton, NJ: Mathematica Policy Research, Inc., August 2002.
Perez-Johnson, Irma, Debra Strong, and Michelle VanNoy (with contributions by Charles Nagatoshi). Doing What It Takes: Understanding the Costs of DOL Welfare-to-Work Grants Programs, Final Report. Princeton, NJ: Mathematica Policy Research, Inc., June 2002.
Nightingale, Demetra Smith. Program Structure and Service Delivery in Eleven Welfare-to-Work Grant Programs. Washington, DC: The Urban Institute, January 2001.
Fender, Lynne, Alan Hershey, and Demetra Smith Nightingale. Welfare-to-Work Grant Programs Tackle Recruitment Challenges. The National Evaluation of the Welfare-to-Work Grants Programs. Occasional Brief, Series No. 00-01. Washington, DC: The Urban Institute, November 2000.
Perez-Johnson, Irma, Alan M. Hershey, and Jeanne Bellotti. Further Progress, Persistent Constraints: Findings from a Second Survey of the Welfare-to-Work Grants Program. Princeton, NJ: Mathematica Policy Research, Inc., June 2000.
Nightingale, Demetra Smith, Terri Thompson, Nancy Pindus, Pamela Holcomb, Edgar Lee, Jesse Valente, and John Trutko. Early Implementation of the Welfare-to-Work Grants Program: Findings from Exploratory Site Visits and Review of Program Plans. Princeton, NJ: Mathematica Policy Research, Inc., February 2000
Hershey, Alan M., Thomas M. Fraker, Demetra Nightingale, Stephen H. Bell, and Rita Stapulonis. The National Evaluation of the Welfare-to-Work Grants Program: Design Report. Princeton, NJ: Mathematica Policy Research, Inc., October 1999.
Perez-Johnson, Irma, and Alan M. Hershey. Early Implementation of the Welfare-to-Work Grants Program, Report to Congress. Princeton, NJ: Mathematica Policy Research, Inc., March 1999.
Tribal Evaluation
Hillabrant, Walter, Judy Earp, Mack Rhoades, Jr., and Nancy Pindus. Overcoming Challenges to Business and Economic Development in Indian Country. Princeton, NJ: Mathematica Policy Research, Inc., August 2004.
Hillabrant, Walter, Mack Rhoades, Jr., and Nancy Pindus. Operating TANF: Opportunities and Challenges for Tribes and Tribal Consortia. Princeton, NJ: Mathematica Policy Research, Inc., August 2003.
Hillabrant, Walter, Mack Rhoades, Jr., Nancy Pindus, and John Trutko. The Evaluation of the Tribal Welfare-to-Work Grants Program: Initial Implementation Findings. Princeton, NJ: Mathematica Policy Research, Inc., November 2001.
Hillabrant, Walter, and Mack Rhoades, Jr. The Evaluation of the Tribal Welfare-to-Work Grants Program: Learning from Tribal Experience. Princeton, NJ: Mathematica Policy Research, Inc., December 2000.
Special Studies
VanNoy, Michelle, and Irma Perez-Johnson. Targeted Help for the Hard to Employ: Outcomes of Two Philadelphia Welfare-to-Work Programs. Princeton, NJ: Mathematica Policy Research, Inc., August 2004.
Perez-Johnson, Irma, Jacqueline Kauff, and Alan Hershey. Giving Noncustodial Parents Options: Employment and Child Support Outcomes of the SHARE Program. Princeton, NJ: Mathematica Policy Research, Inc., October 2003.
Martinson, Karin, John Trutko, and Debra Strong. Serving Noncustodial Parents: A Descriptive Study of Welfare-to-Work Programs. Washington, DC: The Urban Institute, December 2000.
Survey Instruments
Stapulonis, Rita, Shawn Marsh, Jason Markesich, Alan Hershey, Thomas Fraker, and Robert Olsen. The Welfare-to-Work Grants Program 24-Month Follow-up Questionnaire. Princeton, NJ: Mathematica Policy Research, Inc., 2001.
Stapulonis, Rita, Shawn Marsh, Jason Markesich, Alan Hershey, Thomas Fraker, and Robert Olsen. The Welfare-to-Work Grants Program 12-Month Follow-up Questionnaire. Princeton, NJ: Mathematica Policy Research, Inc., 2000.
Stapulonis, Rita, Shawn Marsh, Jason Markesich, Alan Hershey, and Thomas Fraker. The Welfare-to-Work Grants Program Baseline Information Form. Princeton, NJ: Mathematica Policy Research, Inc., 1999.
Public Use Data Files
Ewell, Daisy and Julie Sykes. Documentation for Public Use Data Files from the National Evaluation of the Welfare-to-Work Grants Program. Washington, DC: Mathematica Policy Research, Inc., September 2004.