
ASPE ISSUE BRIEF
By Susan R. Todd and Benjamin D. Sommers
Contents
-
Introduction
-
Overall Health Insurance Coverage
-
How Many Americans are Uninsured?
-
Who Are The Uninsured?
-
Endnotes
Introduction
- The Census Bureau released data on health insurance coverage and the uninsured for 2011 on September 12, 2012. Although there are four major government surveys that produce estimates of health insurance coverage, the Current Population Survey (CPS) is the most widely cited and receives national media attention.
- The percentage of people without health insurance in 2011 decreased from 2010. In 2011, the percentage was 15.7%, compared to 16.3% in 2010. During 2011, an estimated 48.61 million people were without insurance, a statistically significant decrease of 1.34 million from the estimated 49.95 million uninsured in 2010.
- Young adults (18-34) are the age group most likely to be uninsured. However, 19-25 year olds were the age group that experienced the greatest decline in the percentage without insurance over the past year, from 29.8% in 2010 to 27.7% in 2011. This represents more than half a million more young adults with health insurance than the year before. In contrast, there was no significant change in coverage for young adults 26-34. The Affordable Care Act allows young adults to remain on their parents? plans until age 26, and this policy took effect for insurance plan renewals beginning on September 23, 2010.[1]
- For the first time in the last 10 years, the rate of private insurance coverage did not decline in 2011. Employer-sponsored insurance continues to be the largest source of health insurance coverage in 2011, covering 55.1% of the population, which was not statistically different from 2010.
- The percentage of children under age 18 without health insurance in 2011 was 9.4%, stable from 2010. The uninsured rate for children has decreased significantly from 12.0% in 1999, when the Children?s Health Insurance Program (CHIP) was beginning to be implemented.
The following figures summarize key points about the health insurance coverage data released today.
Overall Health Insurance Coverage
| Note: The total does not equal 100% because some people have more than one type of coverage. Source: U.S. Census Bureau, Income Poverty and Health Insurance Coverage in the United States: 2011 |
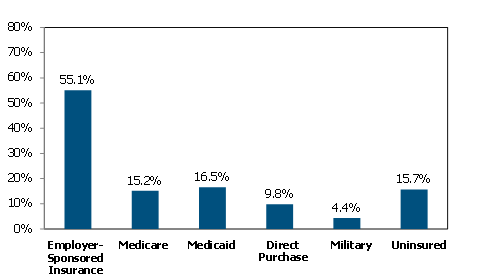 |
- For calendar year 2011 (Figure 1):
- 55.1% of the population was covered by employer-sponsored insurance
- 15.2% of the population was covered by Medicare
- 16.5% of the population was covered by Medicaid
- 15.7% of the population was uninsured
- The percentage of people covered by employer-sponsored insurance for 2011 was 55.1%, statistically unchanged from the 55.3% in 2010. Previously, the percentage of people covered by employer-sponsored insurance had experienced a steady decline over the past decade.
How Many Americans are Uninsured?
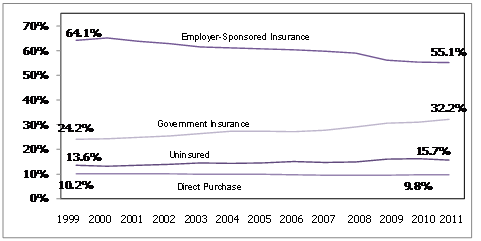
- The percentage of individuals without health insurance in 2011 decreased to 15.7% from 16.3% percent in 2010 (Figure 2).
- The estimated number of people without health insurance in 2011 was 48.61 million. This is a decrease of 1.34 million from the estimated 49.95 million in 2010.
| Notes: Data is for the entire US population. Percentages do not add up to 100% because some people have more than one type of coverage. In 2010, the Census Bureau updated its coverage data for current and prior years to reflect changes in the methods used to impute health insurance for non-repondents. Government insurance includes military coverage. Source: U.S. Census Bureau, Income Poverty and Health Insurance Coverage in the United States: 2011 |
 |
Who Are The Uninsured?
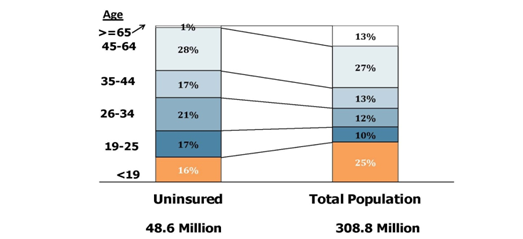
- Age: Young adults (19-34) are the age group most likely to be uninsured (Figure 3). However, as discussed above, the rates of insurance coverage for adults 19-25 has increased significantly under the Affordable Care Act, which allows young adults to remain on their parents? plans until age 26.
- Race/Ethnicity: In 2011, three in ten individuals of Hispanic origin (30.1%) were uninsured, unchanged from 2010. Blacks were more likely to be uninsured than non-Hispanic whites, with 19.5% lacking insurance, down from 20.8% in 2010, and 16.8% of Asians were uninsured, down from 18.4% in 2010. Uninsured rates for non-Hispanic whites decreased from 11.6% in 2010 to 11.1% in 2011.
- Employment: Working full-time increases the likelihood of having insurance, though one in seven full-time workers (15.3%) was uninsured. Uninsured rates were higher among part-time workers and the unemployed.
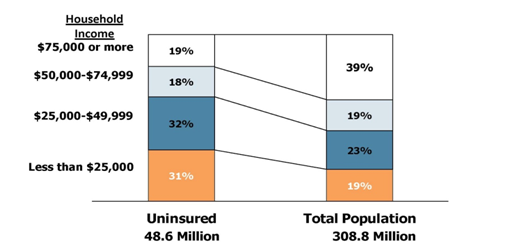
- Income: Uninsured rates were highest for low-income families (25.4% among those with less than $25,000 a year in household income), though many middle-income families were also uninsured: 21.5% among those earning $25,000 to $49,999, and 15.4% among those earning $50,000 to $74,999. While the majority of the uninsured were low-income, 37.4% of the uninsured had a household income above $50,000 (Figure 4).
| Notes:Totals may not sum to 100% due to rounding. Source: U.S. Census Bureau, Income Poverty and Health Insurance Coverage in the United States: 2011 |
 |
| Notes:Totals may not sum to 100% due to rounding. Source: U.S. Census Bureau, Income Poverty and Health Insurance Coverage in the United States: 2011 |
 |
| Percent of the Total Population | Percent of the Uninsured2 | Uninsured Rate3 | ||
| Age | Under 19 | 25.4% | 15.7% | 9.7% |
| 19-25 | 9.7% | 17.0% | 27.7% | |
| 26-34 | 12.0% | 21.1% | 27.5% | |
| 35-44 | 12.9% | 17.3% | 21.0% | |
| 45-64 | 26.5% | 27.5% | 16.3% | |
| 65 and older | 13.4% | 1.4% | 1.7% | |
| Race/Ethnicity | White, Non-Hispanic | 64.3% | 45.3% | 11.1% |
| Black | 13.1% | 16.1% | 19.5% | |
| Asian | 5.3% | 5.6% | 16.8% | |
| Hispanic (any race) | 17.3% | 33.0% | 30.1% | |
| Household Income | Less than $25,000 | 19.0% | 30.7% | 25.4% |
| $25,000-$49,999 | 23.3% | 31.8% | 21.5% | |
| $50,000-$74,999 | 18.5% | 18.1% | 15.4% | |
| $75,000 more | 39.2% | 19.3% | 7.8% |
Endnotes
[1] Estimates from the National Health Interview Survey suggest that more than 3 million young adults gained health insurance due to the Affordable Care Act (Sommers BD. Number of Young Adults Gaining Health Insurance Due to the Affordable Care Act Now Tops 3 Million. Office of the Assistant Secretary for Planning and Evaluation, Department of Health and Human Services, 2012. http://aspe.hhs.gov/aspe/gaininginsurance/rb.shtml). This is based on a comparison of the rates of coverage in September 2010 and December 2011. The CPS numbers reported here cover a different time frame: the uninsured rate throughout all of 2010 (which includes 3-4 months after the ACA?s provision for young adults had taken effect) and the uninsured rate throughout all of 2011. Since the CPS is designed for annual estimates, it may not be ideal for assessing the effects of policy interventions that occur mid-year such as the expansion of coverage for young adults which began on September 23, 2010.
[2]Percent of uninsured is the number of uninsured people in the specified category divided by the total uninsured population. For Race/Ethnicity, it is the percent of those that reported Race/Ethnicity in one of the four categories.
[3]Uninsured rate is the number of uninsured people in the specified category divided by the total number of people in that specific category.