
A Framework for Evaluating Price Transparency Initiatives in Health Care
Final Report
Prepared by:
Ha T. Tu Johanna R. Lauer
October 2, 2007
Prepared for:Office of the Assistant Secretary for Planning and Evaluation (ASPE)U.S. Department of Health and Human Services (HHS)
This report is available on the Internet at:http://aspe.hhs.gov/health/reports/08/pricetransparency/report.html
Printer Friendly Version in PDF format (49 pages)
Table of Contents
- PROJECT DESCRIPTION
- PRICE TRANSPARENCY LITERATURE REVIEW
- PROGRAM EVALUATION FRAMEWORK
- PROGRAM EVALUATION FRAMEWORK AS APPLIED TO PRICE TRANSPARENCY
- CASE STUDIES
- CASE STUDY 1: FLORIDA PRESCRIPTION DRUG PRICE WEB SITE
- CASE STUDY 2: NEW HAMPSHIRE HEALTHCOST WEB SITE
- KEY TAKEAWAY POINTS
- APPENDIX 1: INTERVIEW RESPONDENTS
- APPENDIX 2: KEY SOURCES
- FOOTNOTES
Tables
Exhibits
PROJECT DESCRIPTION
Research Objectives: To develop a framework for assessing the impact of health care price transparency initiatives. In developing this framework, two major research questions are addressed:
- What are the characteristics and processes of a program evaluation that will result in an effective and unbiased evaluation of a price transparency initiative?
- What are the most important substantive issues (evaluation questions) that a program evaluator must address in assessing the success of a price transparency initiative, and what methods should be used to address these questions?
Background and Brief Description
During the past few years, health care price transparency has become a significant policy issue for several reasons:
- Concern that uninsured consumers pay substantially higher prices for services they receive than are paid on behalf of insured consumers;
- Concern that, for selected items and services, Medicare may be paying substantially higher prices than those negotiated by other payers;
- Concern that traditional third-party insurance coverage with low cost-sharing requirements insulates insured consumers from the true costs of their care;
- New market-based strategies (e.g., consumer-directed health plans), aimed at containing costs and improving quality, rely on consumers motivated and informed enough to shop for the best value in health services. There is concern that current price information is inadequate in helping consumers shop among health care providers.
In response to these issues, many federal and state policymakers, insurers, provider organizations, and third-party entities have begun to make some type of price information available, either to the general public or to enrollees of particular health plans. In the most prominent mandate on price transparency thus far, President Bush issued an executive order in August 2006 requiring each federal agency that administers or sponsors a health care program to make the prices that it or its health insurance plans pay to contracted providers available to the beneficiaries or enrollees of that program. The mandate leaves the specifics of public dissemination of price data to the discretion of each agency.
Many states have mandated certain types of price disclosures to the general public, including hospital charges and pharmaceutical prices. In addition, some health plans have begun to provide information to their enrollees about the contract prices they have negotiated with providers for certain procedures.
While both voluntary and mandatory price reporting programs have proliferated, little is known about what impact, if any, these initiatives may have had on consumer price consciousness and shopping behavior or provider competition. Indeed, there has been little discussion about how the impact or success of price transparency initiatives can or should be measured.
The aim of this project is to develop a framework for assessing the impact of price transparency initiatives in health care. In developing this framework, we reviewed the literature on program evaluation and price transparency and interviewed experts on these topics (see Appendices 1 and 2). This report begins with a brief overview of the literature on price transparency. This section is followed by a discussion of the framework and practice of program evaluation, which incorporates a literature review, insights offered by program evaluation experts in interviews, and our own analysis of the aspects of program evaluation most pertinent to assessments of price transparency programs. The next section of the report is an in-depth discussion of how the standard program evaluation framework would be applied to price transparency programs. We provide a detailed description of the steps involved in evaluating a ?generic? price transparency program, including the formulation of a logic model, evaluation questions and evaluation design. To provide more concrete examples, this section is followed by two price transparency evaluation case studies. Although these case studies are by no means intended to be comprehensive evaluations, they highlight key ideas and methods that would be used by an evaluator of such programs. In the final section, we summarize our report with eight key takeaway points that underline important concepts related to both the design and the evaluation of price transparency programs.
PRICE TRANSPARENCY LITERATURE REVIEW
A substantial amount of information is available describing specific price transparency initiatives, but the body of literature that provides a conceptual framework for an in-depth analysis of price transparency issues is quite limited. This is not surprising, given that health care price transparency is still a relatively new topic. Two recent (2007) background papers have proven very helpful in providing context, conceptual organization and clarity to issues surrounding price transparency. These are Health Care Price Transparency and Price Competition, by Mark Merlis for the National Health Policy Forum (NHPF), and Background Paper on Health Care Cost and Price Transparency: Usable, Audience-Specific Information on Costs and Prices, by Mark Legnini for the National Quality Forum (NQF).
The NHPF paper is particularly useful in clearly describing the different types of provider prices that are potentially relevant in determining what a consumer must pay for care (including provider charges, contracted prices, and maximum allowances); the different levels of cost sharing for which health plan enrollees are responsible under different health plan designs; and the types of price information currently being provided (or not) to consumers under different price transparency initiatives. In particular, the paper provides clear examples of the types of price data consumers would need for making different types of provider comparisons. For example, to make accurate out-of-pocket cost comparisons between in-network and out-of-network services, an enrollee in a typical preferred provider organization (PPO) plan would need access not only to contract prices but also provider charges and plan maximum allowances. The paper also discusses some of the barriers to public disclosure of certain types of provider prices that would be useful to consumers (e.g., large data collection burden in the case of out-of-network provider charges; health plan resistance in the case of maximum allowances).
The NQF paper is particularly useful in laying out (1) the objectives that a price transparency initiative should accomplish: (a) sensitizing consumers to the cost of care, (b) encouraging consumers who have a choice of provider to ?price shop,? (c) encouraging providers to be more efficient, possibly in response to consumer price shopping but more likely in response to the ?sunshine? effect of seeing their prices relative to others?, and (d) linking price and quality information so consumers will know the comparative value of choices available to them and so purchasers can pursue better value; and (2) the principles that should guide the presentation of cost/price information to consumers, including ?actionable? characteristics such as being easy to understand, readily available, timely, credible, customized (taking into account insurance coverage, health status, demographics), enabling comparison of costs among providers, treatment options, and episodes of care, and allowing consumers to assess differences and trade-offs in both cost and quality.
Both the NHPF and NQF papers draw on a paper by Paul Ginsburg (?Shopping For Price in Medical Care,? Health Affairs 2007), laying out the conditions that are most favorable for effective price shopping for consumers:
- Services are not complex
- Need for services is not urgent
- Diagnosis has already been made (because prior to diagnosis, there is more uncertainty about what treatment will be needed)
- Bundled prices are the norm for the service (otherwise, patients typically do not know exactly what services they will require)
- For insured patients, the benefit structure provides incentives to choose lower-priced providers (e.g., a large deductible, and a percentage coinsurance instead of a fixed-dollar copayment)
The Ginsburg paper also addresses some of the unintended outcomes that might result from price transparency initiatives, including the potential for public price disclosures to bring about price increases rather than decreases in cases where the degree of seller concentration is high.
These background papers, along with other analyses not specifically referenced here but noted in the Key Sources section, help to provide a framework for evaluating the success or impact of price transparency programs. Specifically in the context of a program evaluation, the issues raised in these analyses help to shape the logic model and define the evaluation questions that an evaluator needs to ask about any price transparency initiative under assessment.
PROGRAM EVALUATION FRAMEWORK
1. Types of Program Evaluation
Historically, program evaluations were used to determine the ultimate success or failure of a program. Over the years, however, program evaluation has evolved and become an integral part of the planning and implementation stages of program development. Program evaluation can be much more than a simple analysis of outcomes; it also can be a tool for program improvement. As a result, several kinds of program evaluation have emerged, each tailored to a specific stage of program development.
Although terminology varies slightly throughout the literature, there are three primary types of program evaluation that we have found most useful, including the following:
- Formative evaluation: This evaluation begins during the development of the program and is typically conducted by the program managers. The purpose of a formative evaluation is to develop a logic model and theory of change. A theory of change is a description of the environment in which the program will operate, the individuals involved in the program, the activities that will take place and the outcomes the program hopes to achieve.
- Process evaluation: Unlike typical goals-based evaluations, process studies examine how something happens and whether it has been implemented as planned. Consequently, process evaluations often try to take into account unexpected variables or outcomes.
- Summative evaluation: Also referred to as an outcomes or impact evaluation, this method is used to assess whether a mature project has achieved its goals. Unlike a formative evaluation, summative evaluations are conducted after the implementation of the program by objective observers. The analysis may focus on both long-term and short-term outcomes, as well as the reasons for their success or failure.
For a summative evaluation, it is especially important to choose an unbiased evaluator who will be able to offer an impartial analysis of both the impact of the program, as well as the logic model and theory of change. Although a program designer might initially have a better understanding of the program, an outside observer is more likely to question assumptions regarding causality, leading to a more thorough evaluation.
In the rest of this report, we will focus on summative evaluations as they are most applicable for studying price transparency initiatives that have already been implemented; however, we will take a broad definition of summative evaluations, by including steps that would normally be conducted separately in formative and process evaluations. This approach can be particularly useful for studying poorly planned programs that have already been implemented. Overall, a generic summative evaluation includes activities in the following order:
- Define primary terms and identify the fundamental purpose of the program and evaluation
- Develop logic model for the program, if it was not already created during a previous formative evaluation
- Using the logic model, formulate evaluation questions that will meet the fundamental purpose of the evaluation
- Develop observable measures that will provide indicators for the evaluation questions drawn from the logic model
- Develop and implement evaluation design and data collection methods
- Revise logic model and/or program goals to reflect a more appropriate theory of change and program objectives
The following section will discuss each of these activities in greater depth, providing examples drawn from price transparency programs.
2. Steps in a Summative Program Evaluation
2a. Develop definition of primary terms and identify evaluation purpose, program objectives and target audience
It is important to begin by defining the primary terms, such as ?price transparency,? discussed in the program to ensure that all stakeholders agree on what is being evaluated. After working definitions are developed, evaluators must then decide what is the fundamental purpose of the evaluation. Often, an evaluation may be conducted to determine whether a program is having a significant impact that warrants further funding. At its most basic level, however, a broad summative evaluation tries to answer two primary questions: first, whether the program has met its stated goals, and second, whether the goals are optimal. Consequently, it is also the role of the evaluator to question the stated objectives of the program and investigate whether there are any underlying issues driving the program that may or may not have a positive impact on the outcome of the program. Tied to the analysis of objectives is a review of the program?s target audience. Before beginning the evaluation, the evaluator must also consider whether the target audience is appropriate given the environmental constraints.
2b. Develop logic model
The second step in all evaluations is to develop a theory of change, which is graphically depicted in a logic model: a common tool used to lay out the program?s elements and describe the causal linkages that are assumed to exist in order for the program to achieve its goals. It is important to begin an evaluation with the development of a logic model, as it is later used to inform the choice of specific evaluation questions and measures.
Planners and managers of well-designed programs would construct a logic model during the initial design process or formative evaluation. Outside evaluators can then use that logic model for the summative evaluation. If a logic model does not already exist, evaluators must create the logic model themselves, using their own independent knowledge, and also by consulting with the program manager and stakeholders when possible.
Although logic models may vary in design, they typically include six major elements, connected by arrows and illustrated below:
The elements of the program are listed within each of these categories. Inputs include the resources that are used for the project, such as project funding and, in a price transparency program, the raw price data itself. The activities are the actions taken by project managers to achieve the goals of the project; examples include data collection and Web-site development. Outputs are the immediate results of the initiative, such as the number of consumers who visited a price transparency Web site. Outputs are often confused with outcomes; however, outputs are tied directly to a program activity and provide evidence that an activity has occurred, though not necessarily that a program has achieved its purpose. Outcomes, on the other hand, are the desired accomplishments or changes that show movement toward the program?s ultimate objectives. Outcomes typically are divided into short-term, intermediate and long-term subsets. In the case of price transparency initiatives, a short-term outcome might be consumers? heightened awareness of health care prices; an intermediate outcome might be consumers? increased shopping for different providers and treatment options; and a long-term outcome, often the ultimate goal of the initiative, might be an increase in provider competition and efficiency, in response to changing consumer behavior.
In addition to these basic elements, logic models also include information on the program?s environment and barriers. Environmental factors describe the context in which the program operates. A well-designed program will take into account the environment, though it will not attempt to solve these larger external issues (which, indeed, are generally beyond the reach of the program). In a price transparency logic model, one environmental factor would be that the nature of some health services, such as those resulting from medical emergencies, makes them unfeasible candidates for comparison shopping. Program planners who are aware of, and appropriately account for, such environmental factors may choose to focus on reporting prices of non-urgent services, which would likely be more usable information for consumers. Program evaluators also must be aware of external factors when measuring program performance and impact. A failure to identify such factors can lead to a poorly designed program as well as a flawed evaluation.
Barriers are a subset of environmental factors; they represent those external issues that the program will attempt to address. Consequently, each barrier should be matched with a program activity that is designed to reduce or eliminate the barrier. Listing the barriers in the logic model allows program managers to identify the necessary steps that must be taken to achieve successful results. In a price transparency model, a barrier might be consumers? reluctance to shop on price information alone, without access to corresponding quality data. A well-designed price transparency program would address this barrier by reporting quality information to accompany price data or selecting services that are regarded as being undifferentiated in provider quality.
2c. Formulate evaluation questions
The next step in a broad summative evaluation is the creation of evaluation questions, which guide the focus of the evaluation and delineate the different dimensions in which the program will be judged. The evaluation questions are developed by pairing the logic model with a framework known as Bennett?s hierarchy. Illustrated below, next to the corresponding categories of a logic model, Bennett?s hierarchy is a list of the types of evidence that may be examined by an evaluator to determine the overall impact of the program.[1] Information from the lower levels helps to explain the results from the upper levels, which are often more long-term. Additionally, as the evaluator moves up the hierarchy, the evidence often becomes more difficult and expensive to obtain. For example, evidence of actions?behavioral changes in the target audience?may require consumer surveys and focus groups or interviews, while evidence of program resource use may simply require an expenditure review. It is, therefore, important to start at the bottom of the hierarchy and work up the ladder of questions, verifying that the program has met a minimum level of achievement, prior to expending significant resources to answer the upper-level evaluation questions. Evidence from further up the hierarchy, however, generally provides a stronger indication of whether the program has achieved its larger goals.
2d. Develop observable measures
In addition to defining the evaluation questions, researchers must translate the lines of inquiry into observable measures. This step operationalizes the qualitative evaluation questions into measurable indicators. Although the appropriate indicator might be obvious for some evaluation questions, such as those regarding funding, they may be more difficult to select for questions regarding abstract concepts like ?leadership? or ?knowledge.? For more complex questions, it may be necessary to select several indicators to capture the core issues adequately.
Once the observable measure is chosen for the evaluation question, the second step must be to define what level of change will be considered significant. It is important to define what constitutes significant change prior to beginning data collection as it prevents bias, ensuring that the results of the evaluation are not skewed by the beliefs of the evaluator.
2e. Develop and implement evaluation design and analyze findings
The next step is for evaluators to develop an evaluation design, determining the most precise and feasible methods for gathering data. Although a particular evaluation method might yield the most accurate information, it may be impractical given funding, staffing and time constraints. Therefore, feasibility must be a primary consideration when selecting one or multiple methodological approaches and data collection instruments for each evaluation question.
These evaluation methods fall into two general categories: quantitative and qualitative. An example of a quantitative tool would be a survey of the target audience to understand reactions to the program. Surveys are useful for gauging the response of a large group, but the information gathered is limited to the questions asked on the survey.
In contrast, qualitative methods, such as a focus group, can be helpful in collecting more in-depth information on the thought processes and behavioral changes of program participants. Since a focus group requires a greater time commitment from respondents, the sample size is much smaller than for surveys, though it yields more in-depth information, and is particularly helpful in understanding unexpected program results.
An additional qualitative method that may be used is a direct assessment by the evaluator of the program Web site or other program products. This should include an assessment of the validity and accuracy of the information disseminated by the program.In addition, the evaluator can perform the assessment from the perspective of the consumer?testing, for example, whether the information is presented in clear, easy-to-understand language and whether the Web site is well-designed and easy to navigate. Although the evaluator?s assessment from the consumer perspective is not necessarily as credible as input from consumer focus groups, it is a cost-effective method for analyzing program features that affect end-users of the program.
Each of the methods discussed above has different strengths and limitations. Consequently, a mixed-method approach often yields the best results. By using several methods to answer each evaluation question, evaluators can develop a more complete understanding of the effects of the program. In addition, a mixed-method approach can reduce the chance of external factors either inflating or diluting the impact of the program. The influence of such factors can be particularly problematic when measuring long-term outcomes, which are more likely to be affected by the larger environment. Using a rigorous evaluation design will help ensure that evaluation data are collected and analyzed appropriately, and that the resulting evaluation report is based upon sound conclusions.
2f. Revise logic model
In some situations, program designers may not have had the resources or expertise to develop a well-constructed program. This may result in a flawed, or even the lack of, a logic model and unrealistic program goals, which might become apparent during an evaluation. In this case, an evaluator, using knowledge of the program development process, and by consulting with experts and stakeholders, might offer recommendations on how to improve the program and revise the logic model. This step is called an explanatory evaluation and is sometimes included in a broad summative evaluation. An explanatory evaluation goes beyond simply measuring if the program met its goals and, instead, attempts to answer why the program failed or succeeded. Evaluators analyze the logic model, questioning each of the linkages between the components of the model, and make recommendations for revised activities, inputs and program goals where appropriate.
PROGRAM EVALUATION FRAMEWORK AS APPLIED TO PRICE TRANSPARENCY
1. Framework of a Summative Evaluation of a Generic Price Transparency Program
The following section applies the theory of program evaluation to price transparency programs. Unlike the programs discussed in the previous chapter, price transparency initiatives are subject to the limitations of their environment, often lacking adequate funding, staff and resources. Consequently, in our research, we did not encounter any price transparency program whose designers had conducted a formal formative evaluation or developed a detailed logic model. If a formal formative evaluation?including logic model development?is not feasible, program designers and managers should at least have detailed discussions about how they expect the program to achieve its goals and function within a complex environment. Whether through a formative evaluation or a more informal discussion, the process of defining clear, achievable objectives and translating them into a logical theory of change is vital to the success of a program. Without a comprehensive logic model or understanding of the theory of change, it is less likely that the program will have even a modest impact. In such cases, an extensive summative evaluation of the long-term outcomes may not be necessary to judge the program, especially if the evaluator can easily recognize a flaw in the program?s theory of change.
The following evaluation questions and corresponding measurement processes can be visualized as a ladder. The uppermost rungs, or evaluation questions regarding long-term outcomes, only need to be reached during evaluations of the most well-designed and well-developed programs (those that show evidence of success on program outputs and short-term outcomes). For some price transparency programs, it may only be necessary to conduct a mini-formative evaluation, analyzing the evaluation questions on the lowest rung of the ladder?those dealing with inputs or resources. Nevertheless, the following section will discuss the framework for a full summative evaluation, though we have made an effort to identify points at which evaluators might consider halting the evaluation for less-developed programs.
1a. Develop definition of primary terms and identify evaluation purpose, program objectives and target audience
Many organizations, including health plans, federal and state governments, employer groups and not-for-profit entities, are increasingly developing price transparency initiatives. These initiatives are designed around a broad range of definitions of ?price transparency.? For the sake of this paper, however, we will use a stricter definition?one that was developed by the National Quality Forum (NQF) after thorough consultation with experts, with the aim of encouraging the development of useful and influential price transparency programs. This definition of price transparency is ?the provision of usable financial information to a specific audience.?[2] NQF notes that the emphasis on usability means that the information must be meaningful, accurate, comprehensive and reliable. The audience of price transparency programs may be purchasers, consumers and/or providers, though we will primarily focus on consumers.
Similar to the definition of ?price transparency,? the objectives of programs vary considerably depending upon the sponsor, resources and environmental factors. Furthermore, the sponsor may have underlying intentions, outside of the program?s publicly stated purpose that can influence the design of the program. For example, in the case of insurers, large employers have come to expect access for their employees to price transparency Web sites. Consequently, the true objective of the insurer is not necessarily to create a sophisticated price transparency program, but rather, to appease important customers. Although these underlying intentions might align with the public purpose of the program, evaluators must objectively question all aspects of the program and consider their effect on the program?s overall impact.
In general, however, the primary goal of most price transparency programs is to lower health care costs and to improve the quality of care, which the NQF breaks down into four distinct objectives[3]:
- Inform consumers about the cost of care
- Encourage consumers who have a choice of providers to price shop
- Encourage providers to be more efficient in response to either consumer shopping or the ?sunshine effect?
- Link price and quality information so consumers will understand the comparative value of their choices and purchasers can pursue better value
Ideally, a price transparency program will seek to achieve all of these objectives. In some situations, however, environmental factors or lack of funds may prevent the sponsor from pursuing all four. For example, the developer of a price transparency program might know that they will not be able to present accompanying quality data. An evaluator, however, may still judge the program positively if it meets its stated goals and acknowledges its shortcomings, without overstating its intentions. As explained in the previous chapter, a program evaluation is conducted first to determine if the program met its goals, and second to consider whether the goals were optimal and comprehensive.
Implicit in the selection of objectives is the identification of an appropriate target audience. Although program managers would ideally like to influence all consumers, this is often not possible because of environmental constraints. For example, the realistic audience of a price transparency program would consist only of those consumers who need a service that allows them to shop for prices, have a significant financial stake in their health care decision, and can afford the additional time, transportation, and other costs associated with using a different provider. Consequently, the evaluator must consider whether program designers have appropriately limited both their objectives and target audience.
1b. Develop logic model
As discussed in the previous chapter, the second step in an evaluation is to develop a logic model, which illustrates the components of the program and their causal linkages. Although the program designers themselves should ideally develop the logic model, we have found that few price transparency initiatives are based on a clearly defined theory of change. As a result, it becomes the role of the evaluator, through consultation with the program managers, to create the logic model so that its components can be analyzed. As an objective observer, however, the evaluator must be careful to delineate the true components, as well as underlying objectives, of the program in the logic model. In addition, the logic model should include all of the environmental factors and barriers that might influence the program, given its objectives.
The components of the logic model and the number of barriers vary depending on the scope of the program. For example, a pharmacy price transparency program?s logic model will be much simpler than one for medical services, for reasons such as the following: (a) a prescription already is bundled in units that are completely comparable across providers; it need not be further bundled by episode of care; and (b) the price of a drug does not vary depending on consumer characteristics such as health status. As a result, the logic model for a pharmacy price transparency program need not include any barriers or activities relating to bundling of services or risk adjustment.
To act as a guide for the creation of price transparency logic models, we have attempted to create a generic logic model. This logic model is not tailored specifically for medical services or pharmaceuticals, or for an insurer?s vs. a government?s program. Instead, it attempts to provide a comprehensive list of the activities necessary to achieve the objectives outlined above. In addition, the generic logic model includes the barriers and environmental factors that may affect price transparency programs and, consequently, should be considered by evaluators when creating logic models for real programs. It may also be used as a comparison tool to identify missing components of real program?s logic models. The generic logic model is pictured graphically and its components are described in detail on the following pages.
Fig. 1 Generic Price Transparency Logic Model
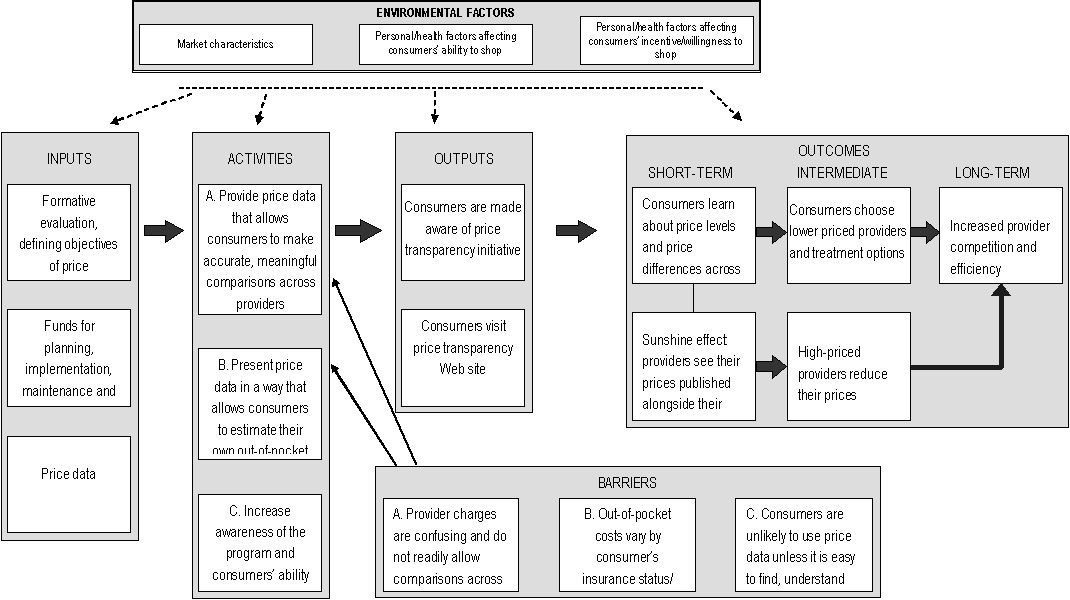
Large rectangular box, with the words, "Environmental Factors" at the top. Four lines are drawn from this large box to four other large boxes, which contain the words:"inputs", "activities", "outputs", and "short-term, intermediate, and long-term"at the top of each, respectively. This box contains three smaller boxes. The contents of these boxes are: box 1-- "Market characteristics"; box 2--"Personal/health factors affecting consumers’ ability to shop"; box 3-- "Personal/health factors affecting consumers’ incentive/willingness to shop".
1. Contents: three boxes with the contents-- "Formative evaluation, defining objectives of price transparency initiative". Line connected to box with contents: "Funds for planning, implementation, maintenance and monitoring of price reporting", line connected to box with contents: "Price data". A line is drawn from the "input" box to another large box-- "Activities".
2.Contents: first box --"A. Provide price data that allows consumers to make accurate, meaningful comparisons across providers-- "B. Present price data in a way that allows consumers to estimate their own out-of-pocket costs"; third box-- "C. Increase awareness of the program and consumers’ ability to use it-- . Line drawn from "activities" box to "outputs" box.
3.Contents: first box --"Consumers are made aware of price transparency initiative"; second box-- "Consumers visit price transparency Web site". Line drawn from "outputs box to "Short-term, intermediate, and long-term" box.
4.Contents: "short-term"- firstbox-- "Consumers learn about price levels and price differences across providers" line connected to a box below with the contents, "Sunshine effect: pharmacies see their prices published alongside their competitors’ prices", and line drawn to a box with "Consumers choose lower priced providers and treatment options", which is under the "internediate" heading.
5.Lline drawn to box under the intermediate heading with contents:"High-priced providers reduce their prices", which has a line drawn to a box with contents "Increased provider competition and efficiency", which is under the "Long-term" heading.
6.Line drawn to a box with "Increased provider competition and efficiency" in the contents, which is under the "Long-term" heading.
7. At the bottom of the graphic is a box titled "Barriers". This box has three lines drawn from the first text box--"A. Provider charges are confusing and do not readily allow comparisons across providers" --to the text boxes, "C. Increase awareness of the program and consumers’ ability to use it", B. Present price data in a way that allows consumers to estimate their own out-of-pocket costs", and "A. Provide price data that allows consumers to make accurate, meaningful comparisons across providers." The other two boxes have the contents--"B. Out-of-pocket costs vary by consumer’s insurance status/ coverage and other characteristics", and "C. Consumers are unlikely to use price data unless it is easy to find, understand and navigate".
Inputs
Inputs are the resources necessary for the successful implementation and completion of program activities. Without access to appropriate price data, the creation of a useful price transparency Web site would be impossible, and without adequate funding, the creation of such a Web site would be difficult at best. Although a formal formative evaluation is not strictly necessary, it is vital to the success of the program that the designers rigorously consider all significant external factors that might affect the program and question both the components of the program and the assumed casual linkages. During this process, the designer should create a logic model and match each barrier with a corresponding activity to ensure that all external factors that must be dealt with to yield the stated objectives, are being addressed. This process ensures a logical theory of change and, ultimately, the success of the program.
Environmental Factors
The environmental factors that affect price transparency programs can be grouped into three conceptual categories: market characteristics, personal/health factors affecting consumers? ability to shop and personal/health factors affecting consumers? incentive/willingness to shop. Within each of these categories are a number of external factors?listed below?that should be taken into account by planners and evaluators.
Although the program cannot solve these issues, designers must consider the environmental factors to limit the scope of the project appropriately and define the target audience. For example, many health services are provided during emergencies, which prevents consumer shopping. Similarly, other services, such as a visit to a primary care doctor, may vary considerably in quality between providers, which may not be accurately captured through quality statistics, ultimately influencing the usefulness of price information. A well-informed program designer will consider these environmental factors and limit the scope of the program to non-emergent, simple or more homogenous services.
- Market characteristics
- In some markets, there may be a lack of price variation for some services, thus reducing the benefit of price shopping.
- Some markets may be too concentrated to allow for shopping.
- Providers and insurers might object to sharing proprietary price information or bearing the economic burden of reporting price data.
- Personal/health factors affecting consumers? ability to shop
- For services characterized by medical urgency, consumers have no time or ability to comparison shop.
- For services for which a diagnosis has not been made (e.g., when patients visit their doctor with symptoms) the specific treatments needed are not yet known, making comparison shopping difficult and imprecise at best.
- Personal/health factors affecting consumers? incentive/willingness to shop
- Consumers? incentives to shop vary by insurance status and benefit design. For example, consumers who are subject only to flat-dollar copayments, or who have met their annual out-of-pocket maximum requirements, have no incentive to shop among in-network providers.
- Consumers subject to a percentage coinsurance amount have a modest incentive to shop, while those paying completely out-of-pocket (e.g., uninsured, insured with high deductible still to be met) have the greatest incentive to shop.
- Patients may be reluctant to change physicians and sever existing relationships over price.
- The cost of shopping for a provider may outweigh or substantially reduce the economic benefit of shopping (e.g., in situations where an in-person exam is required to obtain an accurate price quote, or where substantial transportation costs are required to use the lowest-priced provider).
- Consumers? inclination to seek price information varies by personal characteristics, such as education and age.
Barriers
Unlike the environmental factors listed above, barriers are environmental factors that well-designed and -implemented programs can and should address. Accordingly, each barrier should be matched to one or more program activities designed to address that barrier. In our generic logic model, we have broken down the possible barriers into three categories, each containing more specific barriers. Each of these individual barriers, listed below, has a corresponding activity that attempts to ?solve? the issue. Ideally, a real price transparency program will address all of the identified barriers; however, we have listed them in order of priority to indicate which issues are most important to the success of the program. Therefore, although barrier No. 10 may be important, a price transparency program will be unable to meet its primary purpose unless barrier No. 1 is first addressed.
- Provider charges are complex and do not readily allow comparisons across providers
- Consumers cannot comparison shop without access to provider-specific price data
- Providers may bundle services differently; services may include components provided by multiple providers who generate separate bills
- Costs of services differ according to the severity of the patient?s condition, co-morbidities and age
- Consumers may be reluctant to comparison shop on price alone, without corresponding quality information
- Provider prices may change
- Insured consumers need information on both out-of-network and in-network prices
- Out-of-pocket costs vary by the consumer?s insurance coverage
- Different prices may apply, depending on insurance status (as insured consumers generally are eligible for lower prices negotiated by their health plans)
- For insured consumers, out-of-pocket costs vary, based on consumer?s benefit structure and health spending to date
- Consumers are unlikely to use price data unless it is easy to find, understand and navigate
- Consumers often are not aware of the existence of price transparency resources or the benefits of using them
- Consumers are unlikely to use Web sites that are not accessible, easy to navigate and understand, or responsive to user questions
- Some consumers lack access to the Internet or are less comfortable using the Internet to obtain information
Activities
The activities are those actions that must be taken by a program manager to create a price transparency program that achieves the four NQF objectives and provides usable financial information. The activities below are divided into three general categories, which are displayed on the logic model, and are numbered to correspond with the barriers that they attempt to address. In some cases, however, as with barrier No. 10, several activities are necessary to address the relevant barrier; as a result, activities 10a, 10b and 10c are listed below.
- Provide price data that allows consumers to make accurate, meaningful comparisons across providers
- Provide provider-specific price data, not just market averages
- Report prices bundled by total episode costs or other meaningful units, regardless of the billing entity
- Account for differences in provider patient mix (severity of condition, co-morbidities, and age) by one of the following methods: (1) directly risk adjusting the price estimates, (2) providing separate price estimates for different levels of patient complexity, or (3) providing one non-risk-adjusted price estimate per service per provider, but show an accompanying indicator of patient complexity
- Provide provider-specific quality data (preferably quality measures specific to the service for which the price is being reported)
- Update price data frequently
- For in-network vs. out-of-network provider comparisons, present all the prices necessary, including plan maximum allowances and provider charges, as well as contracted rates
- Present price data in a way that allows consumers to estimate their own out-of-pocket costs
- Present prices relevant to each target audience, depending on insurance status and type of coverage
- (For insured consumers) Customize out-of-pocket cost information, based on consumer?s benefit structure and year-to-date deductible spending
- Increase awareness of the program and consumers? ability to use it
- Provide outreach to make target audience aware of price transparency Web site
- Design Web site to be user-friendly: easy to understand and navigate, and easy to generate usable price reports
- Provide Web site instructions and documentation in clear, accessible language
- Provide support to Web site users who have questions or comments
- Report price data through alternative information channels (e.g., print media) for consumers less able or inclined to use the Internet (Addressing this barrier is likely to be very costly; therefore, it may be only practical for price transparency programs to target consumers who use the Internet for obtaining consumer information.)
Outputs
The outputs of the price transparency initiative are two-fold:
- Consumers become aware of the price transparency initiative, either through direct program outreach activities, or through other means such as media coverage or word-of-mouth information.
- After becoming aware of the price transparency initiative, some consumers will visit the price transparency Web site (or alternative information channel used by the price transparency initiative) and access the available price information.
Outcomes
The intended outcomes of the price transparency initiative are the changes in behavior by consumers and providers that ultimately will accomplish the objectives of the program:
- Consumers who use the price transparency Web site will learn, in the short term, about overall price levels for different services, as well as price differences across providers; this will lead some consumers, in the intermediate term, to choose more efficient providers (and, depending on the nature of the service, perhaps more efficient treatment options); in the long term, the need to compete for cost-conscious consumers will lead providers to become more efficient.
- Some experts believe that an effect that is likely to be more powerful than the consumer shopping effect is the ?sunshine? effect on providers, of seeing their prices relative to those of their competitors. According to this theory of change, knowing that their prices will be publicly compared may have a ?shaming? effect that causes high-priced providers to reduce their prices, even if they are not losing market share.
1c. Formulate evaluation questions
As discussed in the previous chapter on program evaluation, the evaluation questions are drawn from the logic model and meshed with the Bennett Hierarchy, which outlines the types of evidence or evaluation questions that must be gathered or researched to evaluate the program. The following table presents a broad list of evaluation questions based on the generic logic model. Each of the identified activities and barriers has a corresponding question in the table. In a real evaluation, these questions might vary or include sub-questions depending upon the local context. Nevertheless, these evaluation questions may guide evaluators and allow them to compare a real price transparency program against our generic program, which was developed to achieve the NQF?s ideal objectives.
| 4. Evaluators must investigate both the intended and unintended effects of programs. One potential unintended effect of a price transparency initiative would be that insufficient risk adjustment may lead providers with sicker than average patients (or less compliant patients) to appear more expensive. This can mislead consumers and harm those providers. Evaluators can investigate any unintended effects through qualitative interviews described in detail on p. 23-24. | ||
| Logic Model | Bennett Hierarchy | Evaluation Questions |
| Outcomes (Long-term) | Impact | Has there been an increase in provider efficiency and competition? |
| Did the program have any unintended effects?[note4] | ||
| Outcomes (Intermediate) | Actions | Has the program affected consumer decision-making (e.g., selection of providers or treatments)? If so, are those effects consistent with the program’s objectives? |
| Has the program, through the sunshine effect, influenced provider prices (e.g., narrowing them toward the mean price)? | ||
| Outcomes (Short-term) | Learning | Did consumers who visited the Web site become more knowledgeable about the price of health care services and the differences across providers? |
| Did providers become more knowledgeable about how their prices compare to competitors? | ||
| Outputs | Participation | Is the target audience aware of the initiative? |
| How many consumers visited the Web site? | ||
| How many providers visited the Web site? | ||
| Reactions | How do consumers perceive the initiative? | |
| Activities | Activities | Does the program provide price data that allow consumers to make accurate, meaningful comparisons across providers? |
| Does the program present price data in a way that allows consumers to estimate their own out-of-pocket costs? | ||
| Do program managers work to increase awareness of the program and consumers’ ability to use it? | ||
| Is each identified barrier addressed by an activity? | ||
| Inputs | Resources | Did the program planners develop clear objectives, defining: the target audience(s)the types of behaviors that the initiative will impacthow program activities will lead to desired outcomes (possibly through the creation of a logic model or formative evaluation)? |
| Are the objectives achievable given the available price informationthe environmental factors detailed in the logic model? | ||
| Does the program have access to adequate funding and staffing for planning, implementation, maintenance and monitoring of the price reporting activities? | ||
The evaluation questions and Bennett Hierarchy represent the framework of the entire evaluation, defining its scope and purpose; however, it should not be considered an immutable structure. Instead, it is helpful to think of the evaluation questions as a ladder, up which the evaluator must climb depending upon the characteristics and limitations of the program. As mentioned above, many price transparency programs lack a logical theory of change. As a result, it is not necessary to consider evaluation questions from the outcomes or even outputs levels, since the program would not be able to achieve a minimum level of success at the inputs or activities levels. This is a pragmatic approach to program evaluation, meant to conserve resources, rather than misuse funds by evaluating programs that are unlikely to have had any impact.
As an example, several states mandate public reporting of lists of hospitals? retail prices (charges). By definition, however, these chargemasters do not provide price transparency (i.e., usable price information) to consumers because (a) they are too disaggregated and detailed to enable consumers to shop, (b) they often do not include charges that are required as part of a visit or episode of care but are billed by other parties (e.g., physicians), and (c) very few consumers actually are charged these prices, with insured consumers usually subject to lower prices negotiated by their health plans, and uninsured consumers usually eligible for sliding-scale income-based discounts off the charges. Therefore, an evaluator of such a program might conduct a mini-formative evaluation by developing the logic model and analyzing it based on their knowledge of price transparency principles outlined in the generic logic model. Rather than continuing with a complete summative evaluation, and moving up through the ladder of evaluation questions, the evaluator might simply report on the flawed theory of change, and offer an explanatory evaluation with recommendations for how to improve the program (e.g., exploring alternative data sources and/or limiting the reporting of prices to those services deemed most amenable to comparison shopping).
1d. Develop observable measures
As the evaluator moves up the ladder of evaluation questions, he or she must select an observable measure and define the minimum level of success for each evaluation question. This step operationalizes the qualitative evaluation questions, and converts them into measurable quantities. Although this is a simple process for evaluation questions on the inputs level, it can be more difficult for questions such as, ?Did consumers who visited the Web site become more knowledgeable about the price of health care services and the differences across providers?? In this case, one indicator of improved knowledge could be the opinion of a participating consumer about whether their knowledge of prices has improved as a result of using the Web site. Alternatively, another indicator could be the ability of a consumer, who has actually shopped for and had a particular procedure, to name low-priced providers and describe the approximate high-low price spread for providers in their geographic area and insurance network.
After selecting an appropriate indicator, the evaluator must also define what level of change will be considered significant or meaningful. This step should be taken before any data have been collected and analyzed, so that neither the evaluator nor the sponsor of the evaluation will be influenced by the data results. What constitutes a significant level of change will depend upon the specifics of the program, including the resources consumed by the program and the overall expectations of the stakeholders. Consequently, it would not be possible or appropriate to define a generic level of significant change for each evaluation question.
This process of selecting an observable measure and minimum level of success only needs to be completed for those evaluation questions that the evaluator deems necessary for judging the program. As discussed in the previous section, it is unnecessary to identify observable measures for higher levels of questions if the program is poorly planned and cannot pass the input/resources level.
1e. Develop and implement evaluation design and analyze findings
The evaluator?s next task is to develop the evaluation design or methods for each evaluation question and corresponding indicator. For some evaluation questions, such as those on the lower rungs of the ladder, in the inputs and activities levels, the selection of methods is fairly simple. For example, the majority of the activities evaluation questions can be answered through an analysis of the logic model and an assessment of the Web site by the evaluator, in some cases supplemented by interviews with program designers and managers. For those programs that pass these lower levels of evaluation, however, the evaluator will need to use a wider (and much more resource-intensive) variety of qualitative or quantitative methods to measure the outputs and outcomes.
The evaluation methods must be selected based on both accuracy and feasibility, which can often be a difficult trade-off. This issue is exemplified within the generic price transparency program model for the evaluation question, ?How many consumers visited the Web site?? Of the price transparency programs that we have researched, program managers typically attempted to answer this question by collecting data on the number of Web site ?hits,? or visits to the Web site. Although this is a very low-cost method, it does not provide accurate information on the target audience?s use of the program since there is no reliable method to discern whether the ?hit? came from a true consumer or from other users such as researchers, government agency staff, commercial entities, etc. In addition, each unique visitor to the Web site can generate a large number of Web hits, so counting the number of Web hits is not an acceptable approximation of the number of Web site users. Consequently, it is necessary to conduct a survey of the target audience to estimate how many people used the Web site. Although this approach is much more expensive, it yields credible results while a Web-hit counter does not.
If an evaluator did conduct a survey, it would be most efficient to include questions relating to several evaluation questions, including the following:
- To what extent are consumers aware of the price transparency initiative?
- Among those who are aware of the initiative, did they visit the Web site? If not, why not?
- Among those who visited the Web site, did they find the price information useful in comparing providers? Did they find the Web site clear, accessible and user-friendly? Did they become more knowledgeable about provider prices for the services they needed? Did they use price information from the Web site to choose a provider?
If resource constraints were not a consideration, the ideal type of consumer survey to conduct would be a large survey based on a probability sample (such as a random telephone survey). Such a survey would generate results that are inferable to the general population, plus or minus the sampling error. However, given the resources likely to be available to a price transparency evaluation, a large, random consumer survey is certain to be prohibitively expensive, in part because a very large sample likely would be needed to identify a large enough pool of respondents who had used the price transparency Web site.
A more feasible consumer survey for an evaluator to conduct would be a survey based on a convenience sample. With this type of sample, sampling error is not known, so inferences to the population cannot reliably be made. However, these kinds of surveys, if properly designed and carried out, can provide a useful, relatively affordable way of estimating the magnitude of program outputs and outcomes.
The easiest convenience sample to use would be consumers who visited the price transparency Web site, and the lowest-cost survey method would be a pop-up survey administered from the Web site. This type of survey could gather information on questions such as the Web site?s perceived usefulness and its effects on consumer knowledge and shopping behavior. However, a pop-up survey (or other survey based only on Web-site users) has important limitations: No information would be obtained about members of the target audience who did not visit the Web site, and no estimates of prevalence of Web site use among the target audience could be generated (because it is not possible to calculate a denominator for the measure).
An alternative convenience sample?one that is broader and more meaningful but also involves higher costs and greater effort than a sample of Web-site users?would be the subset of consumers who need and use the health services whose prices are reported by the price transparency initiative. One effective approach toward reaching these consumers is for the evaluator to first identify providers of the relevant services and then solicit cooperation from some of these providers in distributing the survey. For example, for a pharmacy price transparency initiative that reports retail prescription drug prices, an evaluator might seek the cooperation of local pharmacies in distributing copies of a brief survey with each filled prescription. With this type of survey, information is not limited to consumers who visited the price transparency Web site; data also can be collected and analyzed about awareness of the initiative and prevalence of Web site use among the larger pool of consumers needing and using prescription drugs.
In addition to collecting data directly, consumer surveys also serve as a useful tool for identifying respondents who are willing to be contacted later to participate in follow-up interviews or focus groups?methods that can enhance an evaluator?s understanding of consumer perceptions and behavior beyond what can be conveyed in survey questions and responses. Employing a mixed-method approach (consumer survey supplemented by focus groups or interviews) is likely to be the evaluator?s best strategy for gaining a clear understanding of the reach of the program and elements in need of improvement.
For programs that have shown significant impact at the program output and short-term/intermediate outcome levels, the evaluator can develop measures and methods for assessing the program?s long-term impact. This often represents the most challenging aspect of program evaluation, because (a) long-term outcomes may be very difficult to observe and measure; and (b) long-term outcomes may show a significant level of change because of factors other than the program.
Indeed, one mistake commonly made by program managers and outside observers is to attribute any observed changes in long-term outcome measures (e.g., reduction in provider prices) to the impact of the program, without carefully considering other potential causes. This is a pitfall that the evaluator of a price transparency initiative can avoid by identifying and interviewing key experts and stakeholders who can speak to pricing and competition in the local market(s) where the price transparency initiative has been implemented. If the prevailing opinion of these experts is that the program?s desired long-term outcomes (e.g., increased competition and decreased provider prices) either did not occur, or occurred because of factors external to the program (e.g., technological changes, market developments, policy initiatives), it would not be valid for the evaluator to conclude that the program had been successful in achieving its long-term objectives. If, however, at least some market experts express the view that the program had made a positive impact in reducing provider prices, the evaluator then can attempt to validate this by conducting a multivariate quantitative analysis to supplement the initial qualitative data collection approach.
In evaluating some price transparency initiatives, it may be impossible to conduct a multivariate analysis because the necessary data are not available. For example, a price transparency initiative that is national in scope will have no control groups (i.e., there will be no local markets for which price transparency is absent), and thus is not an appropriate candidate for a multivariate analysis. A promising candidate for multivariate analysis would be a price transparency program that (a) is available only in some markets and not others; and (b) reports prices of services whose price data the evaluator can readily obtain for markets with and without price transparency programs. An example would be pharmacy price transparency programs, which are provided in some states but not others. An evaluator could gather time-series data on retail prices for a set of common prescription drugs in major metropolitan areas, in states with and without price transparency initiatives (with the latter serving as the control group). The evaluator can then conduct a type of multivariate analysis known as a ?difference-in-difference? estimation, to test whether the direction and magnitude of drug price changes over time have significantly differed in the ?transparency markets? vs. the ?non-transparency markets,? after controlling for all observable differences in market characteristics. This type of analysis can help the evaluator conduct a rigorous assessment that avoids the error of attributing desired outcomes to a program when these outcomes are, in fact, caused by other factors.
To ensure that the appropriate data are collected accurately, a variety of methods should be used. For some evaluation questions, multiple methods should be employed in a specific order to increase efficiency and fully answer the evaluation question. Each data collection method, however, should only be implemented as necessary, depending upon the results of the lower inputs and activities evaluation levels. The following table summarizes the above discussion and lists the appropriate order of evaluation methods as they correspond to the evaluation questions.[5]
1f. Revise logic model
The final step in program evaluation is to revise the logic model as part of an explanatory evaluation. This process is particularly important for those price transparency initiatives that have not been designed around a logical theory of change. Even for those programs, however, that reach a higher rung in the ladder of evaluation questions, the evaluator may still offer recommendations on methods for improving the program.
CASE STUDIES
The following two case studies are meant to provide examples of how evaluation processes might be applied to real-world price transparency initiatives. Although program managers/designers were interviewed by HSC researchers for each of the case studies, the following assessments are by no means intended to be comprehensive evaluations. Instead, we sought to highlight key ideas and methods that would be employed by an evaluator of such a program. Each case study will loosely follow the program evaluation framework, but not provide final judgments regarding the impact of the program.
CASE STUDY 1: FLORIDA PRESCRIPTION DRUG PRICE WEB SITE
Background
Under a Florida state law enacted in 2004, the state?s Agency for Health Care Administration (AHCA) and the Office of the Attorney General were charged with creating a Web site to aid Floridians in comparison shopping for prescription drug prices across retail pharmacies. The Web site, MyFloridaRx.com, was launched in 2005. AHCA collects the pharmacy price data and transmits it on a monthly basis to the Office of the Attorney General, which developed the Web site and is responsible for maintaining and updating it.
The prices reported on MyFloridaRx.com are ?usual and customary? prices reported by retail pharmacies to AHCA for Medicaid prescription drug transactions within each reporting month. The usual and customary prices are set by pharmacies and represent the undiscounted prices that cash-paying customers without insurance generally would pay. If a pharmacy did not fill a Medicaid prescription for a particular drug during the month, the Web site will not contain any price information on that drug for that pharmacy.
The MyFloridaRx.com Web site currently contains pricing information by city or county for 30-day supplies of 100 of the most commonly used prescription drugs. Because most drugs are available in multiple dosages and formulations, the total number of drugs listed on MyFloridaRx.com is greater than 650.
Objectives and Target Audience
Through interviews with program managers and staff, we learned that the objectives of the program, stipulated by the 2004 ?Affordable Healthcare for Floridians Act,? are to offer a free Web site that will allow consumers to compare prices among specific providers within a certain geographic area. Although the target audience is all consumers, program managers say they expect the Web site to be most useful to the uninsured, underinsured, Medicare beneficiaries and those with consumer-directed health plans; however, program managers acknowledge that the Web site was not designed with any specific audience in mind.
Logic Model
No formal logic model was developed by program designers or managers; consequently, we created a model based on our interviews with the designers. Compared to the generic logic model for health services, the MyFloridaRx.com logic model has a simplified framework and components, because pharmacy services are widely considered to be relatively undifferentiated across providers (so that quality considerations are generally not a major concern), and because pricing (for a 30-day supply) is straightforward and comparable across providers. As a result, risk adjustment of price data and provision of quality information are not necessary or even applicable.[6] Consequently, we were able to eliminate the following environmental factors and barriers?listed on the generic logic model?from the pharmacy logic model:
- Non-applicable environmental factors:
- ?For services characterized by medical urgency, consumers have no time or ability to comparison shop.? This limitation may apply to some prescription drugs (e.g., pain medication for a severe/acute condition), but for most prescriptions, consumers do have the time/ability to price shop.
- ?For services for which a diagnosis has not been made (e.g., when patients visit their doctor with symptoms) the specific treatments needed are not yet known, making comparison shopping difficult and imprecise at best.? Getting a prescription filled is a simple process that involves no uncertainty.
- ?Patients may be reluctant to change physicians and sever existing relationships over price.? This is generally not a major issue with prescription drugs, although some consumers may have an established relationship with a pharmacist that they may be reluctant to disrupt. Also, for consumers with multiple medications, buying each medication separately at different pharmacies may result in drug interaction problems that no single pharmacist is aware of.
- ?Pharmacies may object to sharing proprietary price information or the cost of reporting data.? The prices reported by MyFloridaRx.com are retail prices, therefore not proprietary; reporting burden may be an issue for other pharmacy price transparency programs using alternative data sources, but MyFloridaRx.com data (drawn directly from Medicaid claims data) involves no additional reporting burden for pharmacies.
- Non-applicable barriers (whose corresponding activities are also not necessary):
- Providers may bundle services differently; services may include components provided by multiple providers who generate separate bills
- Costs of services differ according to patient?s severity of condition, co-morbidities, and age
- Consumers may be reluctant to comparison shop on price alone, without corresponding quality information
The following logic model reflects the simplified framework for pharmaceuticals, and the activities taken by the program designers. The causal relationships illustrated in the model are those that the program designers assume to exist to achieve the posited outcomes. Similarly, only those barriers identified and addressed by the program designers are listed in the logic model. It is the role of the evaluator to question all of these components.
Fig 2. MyFloridaRx.com LOGIC MODEL
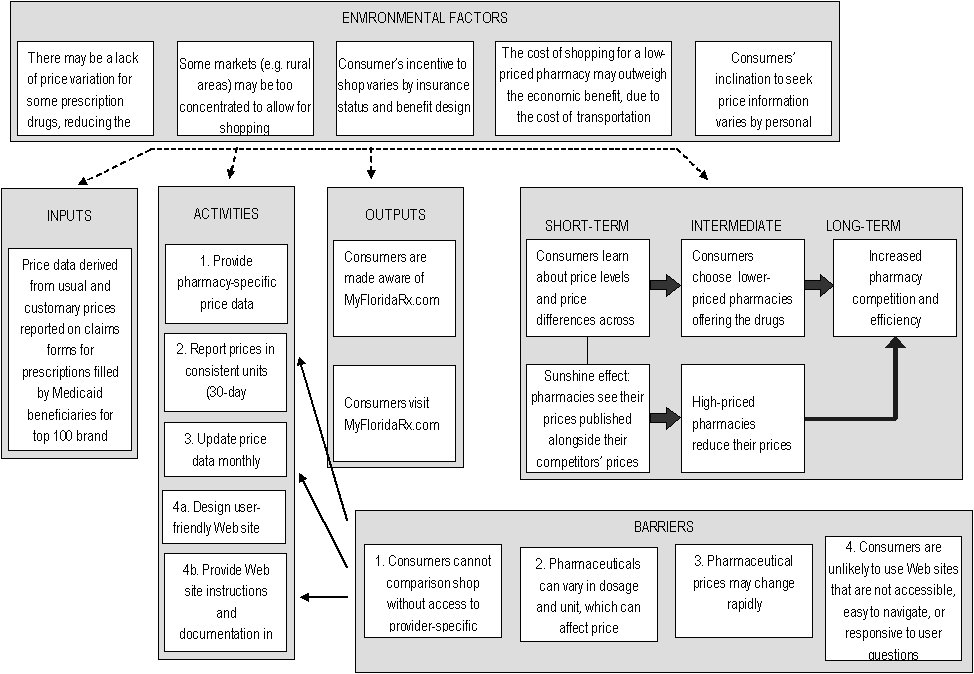
Large rectangular box, with the words, "Environmental Factors" at the top. Four lines are drawn from this large box to four other large boxes, which contain the words:"inputs", "activities", "outputs", and "short-term, intermediate, and long-term"at the top of each, respectively.This box contains five smaller boxes. The contents of these boxes are: box 1-- "There may be a lack of price variation for some prescription drugs, reducing the benefit of shopping"; box 2--"Some markets (e.g. rural areas) may be too concentrated to allow for shopping"; box 3-- "Consumer’s incentive to shop varies by insurance status and benefit design"; box 4--"The cost of shopping for a low-priced pharmacy may outweigh the economic benefit, due to the cost of transportation"; box 5--"Consumers’ inclination to seek price information varies by personal characteristics".
1. Contents: "Price data derived from usual and customary prices reported on claims forms for prescriptions filled by Medicaid beneficiaries for top 100 brand name drugs". Line drawn to "Activities" box.
2.Contents: first box --"1. Provide pharmacy-specific price data"; second box-- "2. Report prices in consistent units (30-day prescription supply)"; third box-- "3. Update price data monthly"; fourth box-- "4a. Design user-friendly Web site"; fifth box-- "4b. Provide Web site instructions and documentation in clear, accessible language". Line drawn to "outputs" box.
3.Contents: first box --"Consumers are made aware of MyFloridaRx.com"; second box-- "Consumers visit MyFloridaRx.com". Line drawn to "Short-term, intermediate, and long-term" box.
4.Contents: "short-term"- firstbox-- "Consumers learn about price levels and price differences across pharmacies" line connected to a box below with the contents, "Sunshine effect: pharmacies see their prices published alongside their competitors’ prices", and line drawn to a box with "Consumers choose lower-priced pharmacies offering the drugs they need", which is under the "internediate" heading.
5.line drawn to box under the intermediate heading with contents:" High-priced pharmacies reduce their prices", which has a line drawn to a box with contents "Increased pharmacy competition and efficiency", which is under the "Long-term" heading.
6. line drawn to a box with "Increased pharmacy competition and efficiency" in the contents, which is under the "Long-term" heading.
7. At the bottom of the graphic is a box titled "Barriers". This box has three lines drawn from the first text box--"1. Consumers cannot comparison shop without access to provider-specific price data" --to the text boxes, "2. Report prices in consistent units (30-day prescription supply), "3. Update price data monthly", and "4b. Provide Web site instructions and documentation in clear, accessible language." The last two boxes in the "Barriers" box contain the contents, "3. Pharmaceutical prices may change rapidly", and "4. Consumers are unlikely to use Web sites that are not accessible, easy to navigate, or responsive to user questions", respectively.
Evaluation
As described in the chapter on program evaluation, an efficient evaluation will begin at the bottom of the Bennett Hierarchy and travel up the ladder as necessary. In the following section, we will describe the evaluation questions?primarily derived from the generic model?observable measures and data collection methods that would be used to evaluate the MyFloridaRx.com program, as the evaluator moves up the Hierarchy.
Inputs/Resources
The following evaluation questions from the inputs/resources level of the generic model, allow the evaluator to assess the Web site at its most basic level.
- Did the program planners develop clear objectives, defining:
- the target audience(s)
- the types of behaviors that the initiative will impact
- how program activities will lead to desired outcomes?
- Are the objectives achievable given:
- the available price information
- factors external to the program (e.g., extent of consumer incentives)
- Does the program have access to adequate funding and staffing for planning, implementation, maintenance and monitoring of the price reporting activities?
For these questions, the observable measures are rather straightforward, including the stated objectives and target audience, and funds dedicated to the program. And, rather than defining a significant level of change, we can use the generic logic model as a comparative example that already fulfills each of the evaluation questions. The data collection methods we used were interviews with program designers and managers, a review of the legislation that outlines the purpose of the Web site and an analysis of the logic model. Based on these sources we found that (1) while the legislation mandating the program did state general objectives and a target audience, neither the bill nor the program designers developed a logic model to help inform the design of the program. Furthermore, in relation to question (2), a cursory analysis of the logic model suggests that given the lack of customization of price data for insured consumers, the Web site will not be useful to the entire target audience of ?all consumers,? preventing the achievement of the objectives.[7] In addition, lacking a formative evaluation it is unclear whether the program designers accounted for the environmental factors. Finally (3), as the program has no dedicated staff or funding, but rather was absorbed by the Office of the Attorney General and AHCA, it may not have adequate resources to fulfill all of the activities, which is something the evaluator can assess by further analyzing the program?s activities.
Activities
Again, we will use the evaluation question derived from the generic logic model to assess MyFloridaRx.com. Each activities level question is listed below, followed by a description of the observable measures and data collection methods.
1. Does the program provide price data that allows consumers to make accurate, meaningful comparisons across providers?
Question (1) can be measured using three indicators: accuracy, comprehensiveness and currency of the price data. To check accuracy, the evaluator can contact retail pharmacies by phone to check whether the quoted prices are consistent with the prices reported on the Web site. How many prices are checked depends on the resources available to the evaluation. The evaluator must also decide what level of accuracy is considered necessary. As pharmacy prices change frequently, it is unlikely the prices on the Web site will match exactly with those reported during a phone check. HSC researchers?evaluating MyFloridaRx.com for another study?found that while prices at large pharmacy chains and retailers were accurate, those for independent pharmacies sometimes diverged significantly from prices reported on the Web site. In exploring MyFloridaRx.com, HSC researchers discovered another accuracy problem: Some outliers had such high prices (many orders of magnitude higher than other pharmacies? prices for the same drug) that they appeared to be reporting errors. Program managers, asked about this problem, said that the program does not currently have a method for checking for outliers and either editing or removing them but managers hoped to introduce such a method within the next year.
Checking comprehensiveness of drug information is a two-step approach: (1) checking how many drugs are included on the Web site; and (2) how complete price information is for the drugs that are listed on the Web site. For part (1), an evaluator would find (as HSC researchers have found on another study) that some common drugs are excluded from MyFloridaRx.com because they are considered to be subject to abuse. (For example, many common prescription pain medications are excluded.) For part (2), the evaluator can choose common drugs listed on the Web site and investigate how many pharmacies have price data for these drugs. An analysis conducted by HSC researchers found that MyFloridaRx.com contained very incomplete pharmacy-specific price data. This is a direct result of the program?s data source: Using the state?s Medicaid claims database means that if a pharmacy has not sold a drug to a Medicaid beneficiary during the reporting period, MyFloridaRx.com will not be able to report a price for that drug for that pharmacy. This is perhaps the greatest shortcoming of a price transparency initiative using this type of data. HSC researchers found that even for the most commonly prescribed drugs, MyFloridaRx.com?s price database contained so much missing data that its usefulness as a comparison-shopping tool was severely limited. This was true across all types of local markets (urban, suburban and rural), but the problem was especially acute in some local markets (e.g., higher-income suburban markets) that had fewer Medicaid prescription drug transactions.
To check the currency of price data, the evaluator can review both the duration of the data reporting period and the frequency of Web site data updates by examining Web site documentation and interviewing program managers.[8] MyFloridaRx.com has a one-month reporting period and aims to update the Web site within a few weeks after the reporting period ends. For example, April 2007 claims data would be reported on the Web site by late May 2007 and would be replaced by May 2007 data in late June 2007. In practice, however, an evaluator would find that April 2007 data remained on the Web site until early August 2007; program managers discovered the time lapse in updating price data only after researchers asked about it. The lack of timeliness in updating prices might be related to the fact that MyFloridaRx.com, like many similar publicly sponsored initiatives, has no dedicated staff or funding, and responsibility for price updating is shared by two agencies. Although the program objectives do not clearly state how frequently the Web site must be updated, it is likely that it should at least be reviewed monthly as planned.
The brevity of the reporting period poses problems for the comprehensiveness of the price data (i.e., the number of pharmacies reporting a price for each drug). To address this problem, MyFloridaRx.com managers are considering whether to increase the program?s reporting period from one month to six months. While the change would certainly improve the comprehensiveness of the Web site?s drug price data, it also would decrease the currency and therefore the accuracy of the information. This highlights an inherent trade-off between data comprehensiveness and currency/timeliness that program managers and evaluators always need to take into consideration.
2. Does the program present price data in a way that allows consumers to estimate their own out-of-pocket costs?
The observable measure for question (2) would be accurate out-of-pocket prices, applicable for different types of consumers, including both the uninsured and insured with various benefit structures. Given the objectives, it would be necessary for all Floridians, regardless of insurance status and type, to be able to estimate their out-of-pocket costs. This measure could be observed using two methods: (1) an analysis of the logic model or (2) an assessment of the Web site by the evaluator, acting as different consumers with various benefit structures, and testing the accuracy of the reported prices compared to the actual out-of-pocket costs. In the case of MyFloridaRx.com, the evaluator could conserve resources by simply analyzing the logic model and comparing it to the generic logic model, which quickly reveals that the following barriers relating to accurate price reporting were not identified by program designers or addressed by an activity:
- For insured consumers, out-of-network prices may differ from in-network prices ?
- Different prices apply, depending on insurance status ?
- For insured consumers, out-of-pocket costs vary based on consumer?s benefit structure and health spending to date
Since program designers did not take into account these barriers, the Web site cannot provide accurate out-of-pocket pharmaceutical price information for all consumers. (An uninsured consumer generally would be subject to the usual and customary prices reported by MyFloridaRx.com, but most insured consumers with pharmacy coverage?even if paying entirely out-of-pocket because their deductible still must be met?generally are eligible for lower drug prices negotiated by their insurers? pharmacy benefit managers (PBMs).) As a result, at this stage, the evaluator might suggest a revision of the logic model, including a refinement/narrowing of program objectives and target audience (in particular, identifying the uninsured as the primary target audience for the program).
3. Do program managers work to increase awareness of the program and consumers? ability to use it?
Question (3) may be broken down into two parts: first, whether program managers conducted any outreach to consumers, and second, whether program managers designed a Web site that is easy to navigate and clearly documented. Part one may be answered using interviews with program managers. In our investigation we learned that in fact, no outreach was conducted other than a standard press release. If some outreach had occurred, however, the evaluator would then analyze the information campaign in more detail, using such observable measures as brochures, advertisements, briefings and other outreach tools.
Part two refers to activities (4a) and (4b) in the logic model. To measure whether or not the Web site is easy for consumers to use, the evaluator would assess the Web site on dimensions including user-friendliness of the Web interface, ease of generating price reports and clarity of documentation. Alternatively, a more expensive, though more accurate, evaluation method would be to conduct focus groups drawn from the target audience to test the usability of the Web site from the consumer?s standpoint.
4. Is each identified barrier addressed by an activity?
Although this question is partially answered by the initial three questions, it can be confirmed by a simple comparison of the generic logic model and the MyFloridaRx.com model. Such an analysis reveals that the Web site does not address the barriers relating to insurance status, listed above, or the following:
- Consumers often are not aware of the existence of price transparency resources or the benefits of using them
- Some consumers lack access to the Internet or are less comfortable using the Internet to obtain information
The failure of the program designers to identify and address each of these barriers suggests a flawed theory of change, which would likely inhibit the success of the program.
Question (4) also requires evaluators to consider whether each barrier that the program purports to address is actually dealt with by the corresponding activity. Part of this process can be accomplished by simply reviewing the results from evaluation question (1), which suggests that activity (1)?to provide pharmacy-specific price data?was not designed in such a way as to address the corresponding barrier. Similarly, as discussed in the analysis of evaluation question (1), activity (3)?to update price data monthly?was not implemented as planned, leaving the barrier unaddressed. Furthermore, the results from evaluation question (3) would indicate whether activities (4a) and (4b) had been carried out as planned. Activity (2), however, once identified as a necessary step by program designers, is a simple process that does not require evaluation. Using these methods, the evaluator could determine whether the program designers identified all relevant barriers and developed activities to adequately address each issue.
Explanatory Evaluation or Outputs Evaluation
In light of the shortcomings identified in the program?s inputs and activities, the evaluator might reasonably recommend halting the evaluation at this point, as the flaws in the logic model make it unlikely that the program has achieved the desired outputs and outcomes. Rather than using valuable resources to confirm the impact, or lack of impact of the program, the evaluator could instead complete an explanatory evaluation, offering recommendations for the improvement of the logic model. As discussed above, the primary issues inhibiting the success of the MyFloridaRx.com program relate to the source of price information. Consequently, the evaluator might recommend both scaling back the program objectives and target audience to reflect what is achievable given the available price data and considering an alternative data source. Regarding the latter, the evaluator might recommend that instead of relying on Medicaid claims data, which results in a very incomplete price database, policymakers might consider mandating that full prescription drug price lists from each retail pharmacy be submitted to a state agency, which could then publish that information for consumers.
When considering an alteration of the logic model, however, evaluators and program stakeholders must consider the consequences of such a change. Any attempt to require pharmacies to submit full price lists on a regular basis would likely encounter strong resistance from pharmacies, because of the added reporting burden. (Thoroughly weighing the costs and benefits of using alternative price data sources is likely to be beyond the scope of a program evaluation, but the evaluator needs to be aware of basic trade-offs when revising the logic model and making recommendations.) Furthermore, using a different data source and data collection practices might require additional program funding and staff time. Consequently, it is important to weigh the impact of all changes, though regardless, it is crucial that the objectives and target audience be appropriately limited to align with the logic model and theory of change.
In some cases, political considerations or other external factors might require evaluators to continue with the evaluation rather than choosing an explanatory approach. If this is the case, the evaluator should still offer recommendations regarding the logic model, but also can proceed with an evaluation of at least the outputs level. Consumer awareness and use of MyFloridaRx.com can be measured through a convenience-sample survey, distributed to consumers filling prescriptions at local pharmacies. This approach was discussed in detail earlier in this report (p. 21-22).
In terms of measuring outcomes, it would be reasonable for an evaluator to conclude that it is not worth investing resources in measuring outcomes until the logic model has been revised and program inputs and activities have been altered accordingly. However, if a consumer survey already is being conducted to measure program outputs (awareness and use of the program), the marginal cost of adding survey questions on short-term and intermediate program outcomes (changes in consumer knowledge and behavior) would be minimal.
Measuring long-term outcomes is very resource-intensive and should not be carried out unless the consumer survey results indicate that MyFloridaRx.com had a significant impact on consumer shopping behavior for prescription drugs. The methods for measuring long-term outcomes are, first, a qualitative analysis based on interviews with market experts and stakeholders, and second, a quantitative analysis comparing price changes over time in local markets in Florida versus price changes in similar markets without price transparency efforts. These methods were discussed in detail earlier in this report (p. 22-23).
CASE STUDY 2: NEW HAMPSHIRE HEALTHCOST WEB SITE
Background
In 2003, the New Hampshire legislature enacted HB670, mandating that the Department of Health and Human Services and the Department of Insurance develop the Comprehensive Health Care Information System (CHIS), which would collect claims data from health insurers. Shortly thereafter, an advisory group was established to develop a program, more specifically a Web site, to provide patients with information on the price of health care services, using the newly collected claims data.
Over the next several years, members of the advisory group and the Department of Insurance worked to create the NH HealthCost Web site, which was eventually launched on February 28, 2007. NH HealthCost reports the median cost for 33 different services, broken down by the consumer?s geographic location, insurance status, and insurance carrier and product. The Web site reports both the amount paid by the insurer and the amount paid by the enrollee. For each service, the reported cost is for a bundled visit, including both hospital and physician charges; the Web site does not include information on the cost of the total episode of care, though this is not a major concern as the majority of the selected services are discrete, simple outpatient services. Along with information on the cost of the service, the Web site provides general information on the variability of the data?indicating the accuracy of the reported price?and information on patient complexity. The latter is not a risk adjustment per se, but rather a separate measure estimating the prevalence and severity of chronic conditions within the specific patient population for each service at each provider.
One of the strengths of NH HealthCost is that its data are based on actual claims rather than hospital charges, and thus are more relevant for insured consumers. Another strength of the program is the degree of thoughtfulness by program managers in selecting the 33 services for which data are reported. Program managers used the following criteria to select a limited number of services that would be most useful to consumers and applicable within the framework of the environmental factors:
- Frequency?whether the service was commonly used ?
- Recognizability?whether consumers can easily recognize the service and therefore use the Web site for price comparisons
- Relevance of deductible?whether the cost of the service is typically subject to the deductible (some preventive services are covered in full) and whether the service is inexpensive enough so that the deductible still applies
After the services were chosen, the claims records were statistically analyzed, removing outliers and confirming that the data were reasonable. The current prices on the Web site reflect data from an 18-month reporting period, ending in September 30, 2006. The Web site will soon be updated through March 2007, though program managers plan to update the Web site on a quarterly basis in the future.
Similar to the MyFloridaRx.com program, since price data are collected based on claims, there are limits to the reporting capabilities of the Web site. In some areas there may be too few claims from a provider for a given insurer, preventing program managers from calculating and reporting a median cost. An additional limitation of the NH HealthCost Web site is that it does not report any quality information. The Department of Insurance decided that the reporting of quality information was outside its scope of work but did address quality concerns indirectly by selecting for inclusion on the Web site many services that are widely regarded as commodities (that is, having minimal quality variations across providers). Almost two-thirds of the services reported by NH HealthCost are imaging services, which have been widely considered to be undifferentiated in terms of quality.[9]
Objectives and Target Audience
The primary objective of the NH HealthCost Web site is clearly stated on the site: to give patients information about the cost of health care services and to help them make informed decisions when purchasing health care services. The advisory group also considered the target audience for the program and eventually chose to focus solely on patients (rather than employers). However, as the price data is derived from claims information, the Web site, by default, is most useful to the insured. Nevertheless, general cost estimates are reported for uninsured consumers, using the claims data and applying a standard 15 percent reduction. Although program managers acknowledge that this methodology does not take into account differences in health between the uninsured and insured, nor the variation in discounts offered by providers to the uninsured, the prices for the uninsured are still reported on the Web site with a short disclaimer and the phone number for the providers? financial services offices.
Logic Model
Overall, the NH HealthCost logic model is fairly similar to the generic logic model. The inputs, outputs and outcomes are primarily the same. In addition, all of the environmental factors still apply except for the reluctance of insurers to share proprietary price information and report price data.Although this was originally an issue, the 2003 legislation ended the debate and mandated that all insurers report claims data.
Similarly, the majority of the generic barriers also apply to the NH HealthCost program. The following, however, is a list of the barriers that program managers have not attempted to address through any corresponding activity. It is the role of the evaluator to decide how important it is for the program to have addressed these barriers.
- Consumers may be reluctant to comparison shop on price alone, without corresponding quality information: though this was partially addressed through the selection of simple services
- For insured consumers, out-of-network prices differ from in-network prices: the median costs reported by NH HealthCost are likely to reflect in-network transactions, since out-of-network transactions (whose costs are higher) are likely to be removed as outliers in the data editing process
- Some consumers lack access to the Internet or are less comfortable using the Internet to obtain information: price data is only available through the Internet
Finally, the activities for the NH HealthCost Web site are parallel to the generic version?excluding those relating to the above barriers, as listed below:
- Provide price data that allow consumers to make accurate, meaningful comparisons across providers
- Provide provider-specific price data, not just market averages ?
- Report prices for a bundled visit, combining hospital and physician charges ?
- Account for differences in provider patient mix by providing an indicator of patient complexity ?
- Update price data frequently
- Present price data in a way that allows consumers to estimate their own out-of-pocket costs ?
- Present prices relevant to each target audience, depending on insurance status and type of coverage ?
- (For insured consumers) Customize out-of-pocket cost information, based on consumer?s benefit structure and year-to-date deductible spending
- Increase awareness of the program and consumers? ability to use it ?
- Provide outreach to make target audience aware of price transparency website ?
- Design Web site to be user-friendly: easy to understand and navigate, easy to generate usable price reports ?
- Provide website instructions and documentation in clear, accessible language ?
- Provide support to Web site users who have questions or comments
Evaluation
Following the Bennett Hierarchy, we begin the evaluation at the bottom of the ladder.
Inputs/Resources
To analyze the inputs and resources of the program, the evaluator relies on the logic model, interviews with program managers, evaluator analysis of the Web site and other relevant documentation or legislation. Using the same observable measures and significant level of change outlined in the MyFloridaRx.com evaluation, we found that although program managers and the advisory board did not conduct a traditional formative evaluation, they did define the objectives and target audience. Though the program does slightly exaggerate its ability to estimate costs for the uninsured, the Web site does clearly document the methodology for calculating costs for the uninsured. Furthermore, our analysis of the logic model suggests that overall the general objective?to give patients information about the cost of health care services and to help them make informed decisions when purchasing health care services?is achievable given the available price information and external factors. In addition, the program is well-funded and has dedicated staff members.[10] The evaluator must next proceed to the activities level evaluation, however, to analyze whether the activities were implemented in such as way that the outputs and outcomes could actually be achieved.
Activities
As in the MyFloridaRx.com case study, the activities level evaluation can be broken down using the four evaluation questions from the generic model.
1. Does the program provide price data that allows consumers to make accurate, meaningful comparisons across providers?
As discussed in the previous case study, this evaluation question is indicated by the observable measures: accuracy, comprehensiveness and currency of the price data. Unlike pharmacy price transparency programs, which report retail prices that can be readily observed and validated by the evaluator, it is much more difficult to measure accuracy for price transparency programs like NH HealthCost that use insurance claims data and report median amounts paid from those claims. To independently verify data accuracy, an evaluator would need to (1) obtain authorization to access the confidential claims data, (2) validate data accuracy from the claims forms themselves, (3) replicate the program?s methodology for data cleaning and editing (e.g., removal of data outliers). That approach would be very resource-intensive and most likely not cost-effective. Instead, an evaluator might reasonably decide that it is more practical to forgo verifying the underlying claims data, and instead to focus on assessing whether the program?s statistical methodology meets acceptable standards. HSC researchers, after reviewing NH HealthCost statistical documentation and discussing the methodology with program managers, found the methodology to be well-conceived, rigorous, and thoroughly and clearly documented. Another aspect of data accuracy in which NH HealthCost does well is that?in contrast to most other public price transparency programs?NH HealthCost?s use of claims data allows the program to report the total median cost for a bundled visit (regardless of billing entity) by insurer, thus enabling more accurate, meaningful provider comparisons than would be possible with alternative data sources.
The comprehensiveness indicator refers to both the number of services for which prices are reported and whether the price data is complete for all providers and insurers. Although prices are reported for a limited number of services, we would not consider this a limitation as it improves the applicability of the price data. It is still important, however, to measure the completeness of the price data. Using the same spot-checking method as employed in the MyFloridaRx.com example, it would be possible to measure the availability of price data for a random selection of services, insurers and geographic locations.
Finally, to assess how current the price data are, the evaluator can simply review Web site documentation and interview the program manager to determine both the duration of the data reporting period and the frequency of Web site data updates and assess whether these are reasonable.[11] We found that the NH HealthCost data has been and will continue to updated on a quarterly basis?which seems a reasonable schedule.
A larger issue in terms of data currency is that the reporting period for the NH HealthCost Web site is an 18-month period (currently for the period ending September 30, 2006, soon to be updated to the period ending March 31, 2007). One of the problems with such a long reporting period is that prices can change significantly during that time frame. (In addition, once the reporting period ends, the program needs several months to collect and analyze the claims data before it can report the median costs on the Web site; this lag time further reduces the currency of the data.) The problem for a program like NH HealthCost, which reports costs that are not only provider-specific but also insurer product-specific, is that a shorter, more current reporting period would yield much less data overall and therefore more blank or sparse data cells (i.e., there would be more procedures for which costs cannot be reported for a specific provider by insurance product). Given the inherent trade-off between data currency/accuracy and comprehensiveness, the 18-month reporting period seems a reasonable approach, but program managers and evaluators both need to be aware that reported prices may diverge from current prices.
2. Does the program present price data in a way that allows consumers to estimate their own out-of-pocket costs?
This question can be answered by conducting an analysis of the logic model and an assessment of the Web site by the evaluator, acting as different consumers with various benefit structures. We found that although NH HealthCost stands out from other public initiatives by providing information on the out-of-pocket costs of both the insured and uninsured, the Web site design requires insured consumers to know their deductible and coinsurance rate, and assumes that consumers still have to meet 100 percent of their deductible.[12] In addition, the Web site does not address the barrier dealing with in-network vs. out-of-network prices, suggesting that consumers would be unable to estimate their out-of-pocket costs unless they are sure that the provider is in their network.[13]
Uninsured consumers are provided with basic price information using a standard 15 percent deduction off charges shown on the claims forms.[14] Program managers acknowledge that this methodology does not take into account differences in health between the uninsured and insured or the variation in discounts offered by providers to the uninsured. Consequently, the prices that are reported for the uninsured are followed by a short disclaimer and the phone number for the providers? financial services offices.
3. Do program managers work to increase awareness of the program and consumers? ability to use it?
HSC researchers? examination of NH HealthCost showed the Web site to be easy to understand, navigate and use, and its documentation to be exceptionally thorough and clear. In terms of increasing awareness of the program, however, our interview with program managers indicated that no outreach activities had occurred beyond a press release, which generated some media coverage at the time of the program launch.
4. Is each identified barrier addressed by an activity?
As discussed above, a comparison of the NH HealthCost logic model and the generic logic model reveals that three barriers were not addressed by the program. The preceding analysis of evaluation questions (1), (2) and (3), and discussion of the logic model however, indicates that overall the other barriers have been addressed well enough so as to warrant a continuation of the evaluation to the outputs level, once the program has had more time to mature. As noted above, the NH HealthCost Web site has been available to the public for only approximately six months, so measuring program outputs at this point would be premature. It would be more reasonable to begin assessing program outputs after the Web site has been available to the public for 12-24 months.
Outputs
Program managers currently collect data on the number of Web site hits; however, as discussed in the previous chapter, this method does not provide an accurate estimate of consumer use of the Web site. Consequently, it would be necessary to conduct a convenience-sample survey as discussed earlier in this report (p. 21-22). Evaluators would likely target the survey at consumers who had recently used those health care services that are reported on the Web site and are most amenable to consumer shopping (e.g. imaging services). To be cost-effective, the survey would include questions not only on the outputs?consumer awareness and use of the Web site?but also the short-term and intermediate outcomes (consumer knowledge of provider price differences and consumer shopping decisions). Then, depending on the survey results and available funds, evaluators and stakeholders may or may not choose to continue to analyze the outcomes level with a more long-term focus. At the very least, however, the information gained from the lower level evaluations should be used to revise the logic model and make recommendations aimed at improving program performance.
Outcomes
If the consumer survey results indicate that the program has had a significant impact on consumer behavior, the evaluator (and the sponsor of the evaluation) may choose to proceed with an evaluation of long-term outcomes. The evaluator would begin by conducting a qualitative analysis based on interviews with market experts and stakeholders, to obtain their views on whether the program has affected consumer and provider behavior. If this qualitative analysis suggests that the program had an impact, the evaluator may follow up with a quantitative analysis comparing price changes over time for the services in question in New Hampshire vs. similar markets without price transparency efforts. However, this quantitative analysis would be difficult and costly to conduct: The evaluator first would need to gain access to claims data for insurers both in New Hampshire and in the control markets, and then conduct a difference-in-difference estimation. Given the resistance of insurers in New Hampshire to providing contract data, it is hard to conceive of insurers in other states providing such information to New Hampshire. Considering all the cost and data access requirements, this analysis may not be feasible given the resources available to a typical evaluation.
KEY TAKEAWAY POINTS
Although price transparency program evaluation requires a very detailed approach, we identified several key points that are particularly important for any evaluator to consider. The first three key points, listed below, relate to the design of price transparency programs. We have included these points in our discussion of program evaluation since many price transparency programs have not been developed appropriately, which impacts both the course of the evaluation and its results. The final five points, listed below, relate more generally to program evaluation and are meant to guide an evaluator in collecting useful and accurate information about the effects of the program.
1. Formative evaluations improve a program?s chance of success
A thorough formative evaluation, conducted in an early design phase of a program, requires program designers to lay out in specific terms their key objectives and target audiences. As part of this process, developing a detailed logic model requires them to identify precisely the program inputs and activities needed to achieve the desired objectives, the various environmental factors and barriers that may affect the program?s ability to achieve those objectives, and the exact assumptions that the program makes about causal linkages. Two aspects of a formative evaluation are particularly important?defining a realistic target audience and reporting meaningful price data for that target audience. These issues are explained in detail as items 2 and 3.
By conducting a formative evaluation prior to program implementation, program managers/designers can avoid errors that may not become apparent until a summative evaluation is performed, at which point significant resources may already have been expended on processes that will not achieve the program?s objectives. Therefore, it is more cost-effective to conduct a formative evaluation than to wait for a summative evaluation. We were unable, however, to identify any price transparency initiatives that had been based on formative evaluations. In such cases, the summative evaluator must complete a formative evaluation as part of the summative evaluation. Determining program impact cannot reliably be done without first mapping out the program?s logic model and using that to guide the evaluation questions.
2. Target audiences should be realistically estimated
Price transparency initiatives tend to state their target audiences in very general terms: ?consumers? or ?residents of a state.? Ideally, during an early stage of program development, program designers and managers should identify their target audience much more precisely than ?all consumers.? If this has not been done, then it is left to the evaluator to accurately identify the target audience, guided by the following principles: (a) the target audience of a price transparency program is limited to those consumers who need and use the services whose prices are reported by the program, (b) the target audience is further limited to those consumers who have a financial stake in choosing lower-cost providers of those services, and (c) the target audience is yet further limited by the environmental context in which the program operates. (These external factors were described earlier in this report, in the section titled ?Program Evaluation Framework as Applied to Price Transparency.?) Using secondary data sources, an evaluator should be able to calculate realistic empirical estimates of the true target audience, which will be only a proportion?in some cases, a modest proportion?of all consumers.
3. Reported prices should be meaningful to the target audience
Some price transparency programs report prices that are not useful and relevant to the vast majority of consumers (e.g., hospital chargemasters). In these cases, there is a misalignment of the reported price data and the target audience. If program designers and managers have proceeded with program implementation without addressing this underlying flaw, it becomes the evaluator?s responsibility to draw attention to this issue. The evaluator might need to propose fundamental program changes, including recommendations that program designers explore alternative, potentially more useful data sources instead of continuing with the existing approach.
Other programs report prices that may be quite useful and relevant, but only to a subset of consumers (e.g., usual and customary prices that apply to uninsured consumers, but not to insured consumers eligible for lower prices negotiated by their health plans). In such cases, the evaluator likely would recommend that the program?s logic model be revised to reflect the fact that the program?s key objectives and target audience are more limited than program designers and managers originally had conceptualized and stated.
4. Evaluator should consider the hierarchy of activities when judging a price transparency program
When analyzing a program?s activities, it is the responsibility of the evaluator to not only enumerate those activities that have been overlooked or implemented incorrectly by program designers/managers, but also to draw conclusions regarding the ability of the program to achieve its goals. This step requires the evaluator to prioritize the importance of each activity to the success of the program. The list of activities for the generic logic model (p. 17) offers a standardized hierarchy that may act as a guide for evaluators of price transparency programs. The list of generic activities reflects the belief that program designers must first select a meaningful and accurate source of price data that will allow comparisons across providers; second, present that data so as to allow consumers to estimate their own out-of-pockets costs; and third, work to increase awareness of the program among the target audience and their ability to use it. Although each category of activities is important to the success of the program, it is much simpler to fix problems relating to the third level of activities, rather than the first, which often requires a much more fundamental retooling of the program (e.g., identifying and obtaining access to a completely different data source). Consequently, those programs that have successfully implemented activities from the first two levels, but not the third, may be considered much closer to achieving its objectives than a program that has completed the activities only from the second and third levels, but not the first.
5. Evaluator might be able to address program impact without needing to proceed through all the levels of the evaluation process
For some programs with flawed inputs and activities (such as the first example in item 3 above), an evaluator might be able to determine at a very early stage of the evaluation that the program is unable to achieve its desired outcomes. In such cases, it would be a waste of evaluation resources to proceed through all the evaluation levels depicted by the Bennett hierarchy. Instead, it might be more reasonable for the evaluator to shift to an explanatory evaluation, describing why the program in its current configuration is unable to make an impact, and possibly suggesting alternative data sources and approaches (that may be more limited in scope but better targeted for achieving objectives).
Terminating an evaluation early in such cases makes sense particularly because evaluating higher-level questions (those having to do with program outputs and outcomes) is substantially more difficult and resource-intensive than evaluating lower-level questions, and often requires multiple observable measures and evaluation methods to address one question.
6. To measure program reach to target audience, a consumer survey must be conducted
Price transparency programs frequently use counts of Web site ?hits? to estimate the program?s reach to its target audiences. For several reasons, however, this is not an acceptable approximation of program reach. First, Web site hits are a misleading (inflated) indicator because (a) the Web site is visited by many non-consumers, such as researchers, government agency staff, and the media; and (b) each user can generate a very large number of Web site hits. In addition, counts of Web site hits cannot convey any information about how useful the information was to consumers, and whether it affected their behavior.
To gauge the extent of program reach, an evaluator must conduct a survey of the target audience. A probability-sample survey (such as a random survey) would be most statistically reliable and inferable, but its costs likely would exceed the resources available to the evaluation effort. A convenience-sample survey would be more feasible; one approach would be to identify providers of the services whose prices are listed on the Web site and to solicit the cooperation of a subset of these providers in distributing a survey to consumers receiving the services. Such a survey could address both program outputs (awareness of price transparency initiative; use of the Web site; perceptions of the Web site) and outcomes (among Web site users, any knowledge gained, and any changes in decision-making).
7. Program reach should not be confused with program impact
Some program managers and external observers of price transparency initiatives use measures of program reach (e.g., the number of consumers visiting the Web site) as an approximation of program impact. However, as noted in item 5 above, program outputs are conceptually distinct from program outcomes. Success on program outputs (e.g., a significant proportion of the target audience visiting the Web site) is necessary but not sufficient to bring about success on program outcomes (e.g., a significant proportion of the target audience learning about and choosing low-priced providers). And, it is the program outcomes that determine the success or impact of a program.
8. Observed changes in long-term outcomes should only be attributed to the program after careful analysis
It is not valid to observe changes in long-term outcomes (e.g., reduced provider prices) and assume that the program was responsible for effecting the changes. The observed changes could have been caused by a variety of factors external to the program (e.g., market developments, policy initiatives). To assess whether the program made an impact, an evaluator needs to design and carry out a thorough qualitative analysis, identifying and interviewing a broad spectrum of local experts and stakeholders. If the results of this qualitative analysis suggest that the program may have had an impact in reducing prices, then the evaluator (data permitting) can proceed with a careful quantitative analysis (such as a difference-in-difference estimation) to test whether price changes differed significantly in ?transparency markets? vs. ?non-transparency markets.?
APPENDIX 1: INTERVIEW RESPONDENTS
In accordance with HSC?s confidentiality policy, we do not reveal the names of our interview respondents or attribute comments to specific individuals in our report. The following is a list of interview respondents, categorized by topic:
- Program Evaluation: 2 respondents (Mathematica Policy Research, Inc.)
- Specific Evaluation Methods: 2 respondents (1 HSC, 1 independent consultant)
- Price Transparency: 2 respondents (independent consultants ? authors of background papers on price transparency)
- MyFloridaRx.com: 4 respondents (Florida Agency for Health Care Administration)
- New Hampshire HealthCost: 1 respondent (New Hampshire Department of Insurance)
APPENDIX 2: KEY SOURCES
Price Transparency
Ginsburg, Paul, ?Shopping for Price in Medical Care,? Health Affairs, Vol. 26, No. 2 (February 6, 2007).
Hibbard, Judith and Ellen Peters, ?Supporting Informed Consumer Health Care Decisions: Data Presentation Approaches that Facilitate the Use of Information in Choice,? Annual Review of Public Health, Vol. 24 (2003).
Legnini, Mark W. for the National Quality Forum, Background Paper on Hospital Cost and Price Transparency: Usable, Audience-Specific Information on Costs and Prices (July 25, 2007).
Merlis, Mark, ?Health Care Price Transparency and Price Competition,? National Health Policy Forum (March 28, 2007).
Program Evaluation
Evaluation Handbook, W.K. Kellogg Foundation (June 1, 2005).
Frechtling, Joy A., Logic Modeling Methods in Program Evaluation, John Wiley and Sons, Inc. (2007).
Frechtling, Joy A., The 2002 User-Friendly Handbook for Project Evaluation, National Science Foundation (NSF) Division of Research, Evaluation and Communication (January 2002).
Patton, Michael Quinn, Qualitative Research and Evaluation Methods, 3rd Edition, Sage Publications Inc. (2002).
Taylor-Powell, Ellen, Sara Steele and Mohammad Douglah, Planning a Program Evaluation, University of Wisconsin-Extension: Cooperative Extension (February 1996).
US General Accounting Office, GAO-02-923, Program Evaluation: Strategies for Assessing How Information Dissemination Contributes to Agency Goals (September 2002).
Footnotes
1. The following section describing Bennett’s hierarchy and its application is drawn directly from: Ellen Taylor-Powell, Sara Steele and Mohammad Douglah, Planning a Program Evaluation, University of Wisconsin-Extension: Cooperative Extension, (February 1996), http://learningstore.uwex.edu/Planning-a-Program-Evaluation--P1033C238.aspx (Accessed August 7, 2007).
2. Mark W. Legnini for the National Quality Forum, Background Paper on Hospital Cost and Price Transparency: Usable, Audience-Specific Information on Costs and Prices (July 25, 2007).
3. Mark W. Legnini for the National Quality Forum, Background Paper on Hospital Cost and Price Transparency: Usable, Audience-Specific Information on Costs and Prices (July 25, 2007).
4. Evaluators must investigate both the intended and unintended effects of programs. One potential unintended effect of a price transparency initiative would be that insufficient risk adjustment may lead providers with sicker than average patients (or less compliant patients) to appear more expensive. This can mislead consumers and harm those providers. Evaluators can investigate any unintended effects through qualitative interviews described in detail on p. 23-24.
5. Those methods that should be conducted in a specific order are numbered, while those that are bulleted may be conducted in any order or combination depending on evaluation resources.
6. There is some debate about the extent of quality differentiation in retail pharmacy services. While the drugs themselves can be considered to be commodities across pharmacies, location and customer service are two dimensions along which retail pharmacies differ in quality. However, some observers believe that consumers may not need additional (external) support to assess these aspects of quality.
7. In addition, many insured consumers may have a benefit structure that allows them to pay the same co-pay amount at any retail pharmacy within their PBM’s network, thus effectively eliminating all variation in prices and making a pharmacy price comparison Web site irrelevant to these consumers.
8. The data reporting period refers to the period during which the transactions occurred for which prices are reported on the Web site.
9. However, this assumption has been called into question by recent media reports suggesting quality variations for MRIs and mammograms.
10. Although NH HealthCost does not have dedicated funding, the Department of Insurance set-aside funding to pay for consultants and a statistician to develop to the Web site.
11.The data reporting period refers to the period during which the transactions occurred for which prices are reported on the Web site.
12.Only insurer-sponsored sites are likely to be able to provide precise information on a consumer’s year-to-date deductible spending. NH HealthCost appears to provide as much customized out-of-pocket spending information as is possible for a publicly-sponsored program.
13.However, it should not be difficult for consumers to find out which providers are in their network.
14.The charges used as cost estimates for the uninsured are full charges, not insurer-allowed charges.