
LifePlans, Inc.
This policy brief was prepared under contract between the U.S. Department of Health and Human Services (HHS), Office of Disability, Aging and Long-Term Care Policy (DALTCP) and LifePlans, Inc. For additional information about the study, you may visit the DALTCP home page at http://aspe.hhs.gov/_/office_specific/daltcp.cfm or contact the ASPE Project Officer, Hunter McKay, at HHS/ASPE/DALTCP, Room 424E, H.H. Humphrey Building, 200 Independence Avenue, SW, Washington, DC 20201. His e-mail address is: Hunter.McKay@hhs.gov.
I. BACKGROUND
One of the more ambitious proposals for encouraging growth in the private insurance market was the passage of the Long Term Care Security Act (Public Law 106-265). This act was passed in the summer of 2000 and was signed into law on September 19th of that year. It authorized the U.S. Office of Personnel Management (OPM) to contract for a long-term care (LTC) insurance program for federal employees. Medically underwritten coverage was made available to active federal employees and annuitants (civilian retirees), as well as active and retired members of the uniformed services. It was also made available to other qualified relatives, who would include current spouses of employees and annuitants, including surviving spouses of members and retired members of the uniformed services who are receiving a survivor annuity, adult children of living employees and annuitants, and parents, parents-in-law, and stepparents of living active employees. Because this coverage is medically underwritten, certain medical conditions prevented some people from being approved for coverage. OPM expected that, like the health and life insurance programs it administers, the Federal Long-Term Care Insurance Program (FLTCIP) would become the largest employer-sponsored LTC insurance program in the nation.
Naturally it was expected that implementation of the program would spur additional interest and growth in the market. The program began in earnest in July of 2002, which constituted the beginning of the open enrollment period. The carriers underwriting the program -- John Hancock and MetLife -- formed a joint venture called Long Term Care Partners, LLC, which is devoted exclusively to administering the program.
Long Term Care Partners conducted one of the largest LTC educational campaigns ever. More than one million people requested enrollment kits. As of August 2003, 273,000 applications had been received. About 64% of enrollees were active employees and spouses, 31% annuitants and their spouses, and another 5% surviving spouses, parents/in-laws and adult children. Thus, in relatively short order, the FLTCIP became the largest group programs in the United States. In part this was due to the significant marketing and enrollment activities including more than 2,100 educational meetings, briefings to human resources staff and outreach programs to affinity groups.
The large number of enrollments affords a unique opportunity to better understand the attitudes and perspectives of both working and retired individuals regarding LTC concerns, the importance of planning, and the role that insurance may (or may not) play in meeting the needs of disabled individuals. An examination of such attitudes can assist policymakers as well as insurers to better understand marketplace opportunities and barriers, and devise strategies to encourage growth in the market.
II. PURPOSE
The purpose of this project is to analyze survey data collected by Long Term Care Partners from members of the federal family regarding the LTC insurance offering available to them. The analysis focuses on the attitudes, opinions and motivations of both active employees and retirees who have enrolled in the program (buyers), those who have expressed an interest in the program but chosen not to enroll (non-buyers), and those who are members of the federal family but have not enrolled or expressed any interest in doing so (non-responders). As part of this project, we also compare the results to available data from other studies of non-federal buyers and non-buyers in both the individual and group markets. In this way we are able to determine the extent to which there are significant differences, which could influence both the marketing and future design of LTC insurance. Finally, we examine specific issues within each of he three sample groups.
This is the fifth in a series of data briefs based on the information collected for a study of buyers, non-buyers, and non-responders to the FLTCIP. The purpose of this data brief is to analyze survey data about the promotional and educational activities associated with the program and collected from all federal family members -- active buyers, non-buyers and non-responders and retired buyers, non-buyers and non-responders. The analysis focuses on the exposure, extent of engagement, and effectiveness of the marketing and promotional activities for the federal offering. Relevant research questions answered in this brief include but are not limited to the following:
- How do the samples differ with respect to their exposure to and utilization of promotional activities and their belief about their helpfulness?
- Did the samples engage in different types of promotional activities?
- Were there particular characteristics associated with the type of promotional activity a respondent engaged in?
- Were individuals who were exposed to or engaged in more promotional activities more likely to become buyers of the FLTCIP?
III. METHOD AND SAMPLE
We used mail surveys to collect information from five of the six samples and an on-line survey for the sixth. For purposes of this research, the active sample consists of federal employees who are actively working (in either the civilian, postal or military sectors of the government) and the retired sample consists of those federal family members who have retired from a civilian, military or postal position. A buyer is someone who has purchased the insurance plan through the federal program and paid premiums beyond the free look period. A non-buyer is defined as someone who expressed interest in the FLTCIP by requesting an information kit and application, but had not purchased the plan at the time we drew the sample. A non-responder is defined as someone who did not request an information kit and application and was not enrolled in the FLTCIP at the time we drew the sample. Data was collect between the months of January 2003 and April 2003. Final sample sizes for analysis are as follows: 1,756 buyers (642 active and 1,114 retired), 1,161 non-buyers (575 active and 586 retired) and 7,357 non-responders (6,870 active and 487 retired). Because analyses for this brief focus on promotional activities and segment the samples to investigate differences, sample sizes will be reported with all figures.
IV. FINDINGS
A. Use of Promotional Activities
The underwriters of the program, working closely with the Office of Personnel Management (OPM), undertook an extensive marketing and educational campaign associated with enrolling federal family members in the FLTCIP. They provided a number of different avenues for people to find out about the program, and about LTC needs and financing in general. We were interested in finding out the level of exposure, participation, and use of promotional/informational activities and whether or not those who engaged in the various activities found them to be helpful. To that end, we asked all respondents to tell us whether they engaged in any of the promotional activities that were offered to both retired and active members of the federal family.1 These activities included: talking to colleagues, talking to a human resources representative or benefits officer, reading the bulletin series entitled Get Smart About Your Future, reading advertisements in federal publications, visiting a website, reading banner ads on internet sites, reading articles in local or national newspapers, reading general brochures or other printed material, and calling the toll-free number. Active employees also had the opportunity to attend educational meetings at work and view satellite broadcasts from the workplace.
One would expect that individuals who have been exposed to or engaged in more promotional/educational activities would also be more likely to become buyers of the product. We tested this proposition and identified whether significant differences in exposure/engagement differentiated the three samples -- buyers, non-buyers and non-respondents.2 For clarity, we will first discuss the active sample and then the retired sample.
1. Active Sample
Figure 1 shows that, across the range of promotional/educational activities those who did more, were also more likely to become buyers of the program.3 Active buyers were more likely than either non-buyers and non-responders to talk to colleagues, attend educational meetings at work, view satellite broadcasts, read Get Smart About Your Future, visit the federal website, and call the toll-free number with questions. Higher proportions of individuals who ultimately become buyers engaged in almost all of the activities listed in Figure 1.
| FIGURE 1: Proportion of Active Sample that Engaged in Promotional Activities |
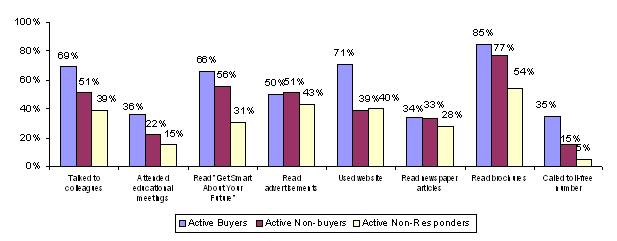 |
| Source: Analysis of Buyer Data from Federal Long-Term Care Insurance Program, 2003. |
Respondents across each of the three samples of active employees were asked whether they were familiar or knew about a specific promotional/educational activity. Clearly the program sponsors did a good job of casting a wide net of such activities because the vast majority of respondents were at least aware of one activity. In fact, even among non-responders, 84% were aware of a particular activity. Again, the 18% of non-responders who indicated that they never heard about the federal program were not even asked about promotional activities; thus the figure applies only to those who knew about the program. Not surprisingly, those who ultimately became buyers were the most familiar with the various activities.
We also wanted to understand if there was a difference in the level of research completed by members from each of the three samples. To this end, we created an index to measure the average number of activities in which people engaged. Figure 2 shows that out of a possible 11 activities, those who became active buyers engaged in an average of 4.5 activities, whereas those who remained non-buyers only did 2.9 activities. The non-responders were the least active in this regard, having only undertaken an average of 2.1 activities.
| FIGURE 2: Index for Exposure to Promotional Activities for the Active Sample |
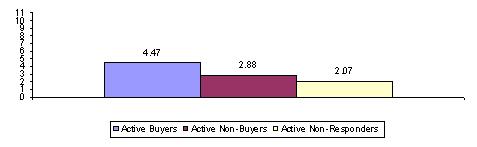 |
| Source: Analysis of data from the Federal Long-Term Care Insurance Program, 2003. The index was created based on those who responded to questions about all 11 promotional activities. |
2. Retired Sample
In general, findings in the retired sample mirrored those observed for the active sample. It is important to note, however, that 68% of the retired non-responder sample surveyed indicated that they did not know about the federal program. Figure 3 is based on those individuals who did know about the program. It shows that those who ultimately became buyers were significantly more likely to have engaged in promotional/educational activities (with the exception of reading newspaper articles) than were non-buyers and non-responders. Interestingly, the greatest difference between the three sub-samples relates to use of the website and the toll-free number; future buyers were much more likely to have visited the website or talked to someone at the toll-free number than were those who ultimately chose not to become buyers of the program. Again, the majority of respondents in all samples had general awareness of at least one of the many promotional/educational activities.
| FIGURE 3: Proportion of Retired Sample that Engaged in Promotional Activities |
 |
| Source: Analysis of data from the Federal Long-Term Care Insurance Program, 2003. |
The same index of promotional activities was created for the 9 activities available to the retired sample. Figure 4 shows that on average, those who became buyers, had engaged in more promotional/educational activities than those who remained uninsured.
| FIGURE 4: Index for Exposure to Promotional Activities for the Retired Sample |
 |
| Source: Analysis of data from the Federal Long-Term Care Insurance Program, 2003. The index was created based on those who responded to questions about all 9 promotional activities. |
One could argue that making information available to people is only useful if the users of the information find it to be helpful. For each promotional/educational activity, we asked respondents whether or not they found it to be helpful.4 The majority of all six samples found the activities to be helpful for them and as expected, for almost every activity (with the exception of reading banner ads for both active and retired and visiting the website for retired samples) a higher percentage of individuals who ultimately became buyers found the various promotional activities to be helpful.
B. Characteristics Associated with Using Promotional Activities
There are many different factors that can influence whether a person uses or engages in promotional activities. Given that there were a fairly large number and wide range of activities available to people, we thought it would be useful to classify the types of activities into conceptually distinct groups and then determine whether certain responder characteristics were associated with having engaged in these classes of activities.
We identified three classes of activities. First, there were those activities that were passive and did not really require a person to seek them out. Five of the nine activities fall in to this category. These include: reading Get Smart About Your Future, reading advertisements, reading internet banner ads, reading newspaper articles or other general brochures. Exposure to these activities would not necessarily require a person to actively seek out information, but simply look at the information that they happened upon.
The second category of activities is considered active and would require some action on the part of the person participating in them. Four promotional activities fall into this category and include: talking to colleagues, talking to human resources, visiting the website and calling the toll-free number. This group of activities shows some initiative and motivation on the part of the person who engages in them. Those individuals who did not engage or participate in any of the promotional activities comprise the third group.
We then used an ordered probit to identify the factors associated with being in one of three types of promotional activities: active, passive or none. Ordered probit is the analytic technique of choice when a dependent variable is comprised of more than two categories and those categories imply a continuum or index, with a low end and a high end. In this case, we assume the low-end category is non-participation in any promotional activity and the high-end category as active participation in aggressive promotional activities.
Table 1 summarizes the results of our analysis.5 The analysis shows that many of the socio-economic variables that were tested are related to the degree to which someone engages in promotional activities. Most importantly, the regression shows that holding relevant demographic variables constant, those who become buyers are more likely than both non-buyers and non-responders to have engaged in active promotional activities. Married people are also more likely to engage in active promotional activities, as are those with college educations and high levels of income, that is, incomes over $50,000. Gender does make a difference (although the coefficient is significant at the .10 level) and shows that women are more likely to engage in the active promotional activities than men. Being a caregiver was also associated with more active participation in promotional activities, which shows that even while holding all other variables constant (including whether someone was a buyer or not), having provided care for a friend or family member influences the type of promotional activity in which a person chooses to participate.
| TABLE 1: Variables Related to Engaging in Active Promotional | |
| Variables | Ordered Probit Coefficients(standard errors) |
| Age | 0.008***(4.35) |
| Gender | 0.094**(2.53) |
| Marital status (1 if married) | 0.065*(1.66) |
| Education (1 if college degree) | 0.171***(4.58) |
| Income (1 if income >= $50,000) | 0.150***(3.24) |
| Assets (1 if assets >= $150,000) | 0.064(1.54) |
| Have been a caregiver (1=yes) | 0.085**(2.09) |
| Dummy variable for employment status (1=active) | 0.820***(12.14) |
| Dummy for being a buyer (1= buyer) | 0.772***(11.91) |
| Dummy for being a non-responder (1= non-responder) | -0.500***(8.51) |
| Dummy for being a civilian employee versus member of the uniformed services | 0.212***(3.38) |
| Observations | 5557 |
| R2 | .0677 |
| Absolute value of z statistics in parentheses.*** significant at the 1% level; ** significant at the 5% level; * significant at the 10% level | |
As mentioned previously, one way to view non-buyers is as potential buyers. These people requested information and an application, but did not buy the insurance. Non-buyers were in fact asked, When you initially requested information and an application, or attended an educational meeting about the FLTCIP, how likely did you think it was that you would buy it? A significant number (75% of active non-buyers and 54% of retired non-buyers) indicated that they thought buying the FLTCIP was likely or very likely. This is a particularly interesting sub-group and we wanted to determine if their participation in and experience with promotional activities differed from those of the buyers, that is, those who actually took the next step and bought the FLTCIP.
Clearly, there are many factors (other than promotional activities) that could have influenced this group of non-buyers in their decision-making, but we looked at the number of activities that they participated in and then the percentage of those activities they found helpful. Our analyses showed that on average, buyers engaged in more activities than those non-buyers who said that they were likely or very likely to buy a policy -- roughly 4 activities compared to 3 for the non-buyers.
We then created a standardized score for each respondent by summing the number of activities each person found helpful and dividing by the number of activities in which they engaged. There were some people who did not do any activities, but it was more common that people did some and not others. Results show that individuals who went on to become buyers found 93% of the activities that they did to be helpful. In contrast, among those non-buyers who thought it was very likely that they in fact would buy a policy, only found 77% of the activities they did were evaluated as helpful. In other words, buyers were significantly more likely to find the activities they did helpful than non-buyers who said they were likely or very likely to buy the FLTCIP. Again, it is important to note that there may be other factors that influenced a non-buyers decision. The results presented here certainly suggest that activities can and do have an important effect on buying behavior.
V. CONCLUSIONS
The vast majority of those federal family members we surveyed had contact with or participated in at least some of the promotional and/or educational activities implemented by the program sponsors. As expected, individuals who participated in more activities, which they also found helpful, were more likely to become buyers of the program. A multivariate analysis of the factors associated with varying levels of participation in promotional/educational activities further supports this finding. This suggests that the extensive marketing and educational campaign by the program sponsors did influence buying behavior, and in a positive way.
NOTES
-
Non-responders who indicated that they were not aware of the FLTCIP (18% of actives and 68% of retired) were not asked about promotional activities.
-
All significance tests are based on 5% level or higher.
-
Due to space limitations, some categories for the active sample were omitted from Figure 1. For a complete list of activities and their proportions please see the tables in the Appendix that follow this brief.
-
See Appendix for detailed activity-by-activity level statistics.
-
Respondents who filled out non-buyer and non-responder surveys but indicated that they have LTC insurance (other than the FLTCIP) have been excluded from the analysis.
APPENDIX
Notes for Tables
Unless otherwise indicated, the analysis of the data is based on the responses of 642 active buyers, 575 active non-buyers, 6870 non-responders, 1114 retired buyers, 586 retired non-buyers and 487 retired non-responders.
All significance tests are based on 5% level or better. Notations for significance are as follows: If one category out of three contains the symbol (*), then the category starred is statistically different from each of the other two categories, but the non-starred categories are not different from each other. If two categories out of the three contain the symbol (*), then those two categories are statistically different from each other, but each of those categories is not statistically different from the third one. If all three categories contain the symbol (*), then all three are statistically different from each other.
Unless otherwise specified, only the response category that has a notation of significance was tested against all other categories. In some cases, it was determined that a combination of categories would be tested. These are indicated in the footnotes. It also may be the case that if categories were or were not combined, it would change the results of the test of significance.
| TABLE A-1: Exposure to Promotional Activities Among Active Buyers, Non-Buyers and Non-Responders1 | |||
| Promotional Activities | ActiveBuyers | ActiveNon-Buyers | ActiveNon-Responders |
| Did you do any of the following: | |||
| a) talk to colleagues about the federal program | |||
| Did not talk to colleagues | 31%* | 49%* | 61%* |
| Did talk to colleagues | 69 | 51 | 39 |
| Found it to be helpful | 72* | 56 | 57 |
| Did not find it to be helpful | 28 | 44 | 43 |
| b) talk to human resource representative | |||
| Did not talk to human resource representative | 83 | 81 | 88* |
| Did talk to human resource representative | 17 | 19 | 12 |
| Found it to be helpful | 82* | 70 | 67* |
| Did not find it to be helpful | 18 | 30 | 33 |
| c) attend educational meetings | |||
| Did not attend educational meetings | 59* | 66* | 75* |
| Did not know about the educational meetings | 5 | 12 | 10 |
| Did attend educational meetings | 36* | 22* | 15* |
| Found them to be helpful | 94* | 80 | 77 |
| Did not find them to be helpful | 6 | 20 | 23 |
| d) view satellite broadcasts | |||
| Did not view satellite broadcasts | 71* | 76 | 78* |
| Did not know about the satellite broadcasts | 10 | 16 | 13 |
| Did view satallite broadcasts | 19* | 8 | 9 |
| Found them to be helpful | 90* | 63 | 70 |
| Did not find them to be helpful | 10 | 37 | 30 |
| e) read "Get Smart About Your Future" | |||
| Did not read "Get Smart About Your Future" | 27 | 33 | 58 |
| Did not know about "Get Smart About Your Future" | 7 | 11 | 11 |
| Did read "Get Smart About Your Future" | 66* | 56* | 31* |
| Found it to be helpful | 95* | 87* | 75* |
| Did not find it to be helpful | 5 | 13 | 25 |
| f) read advertisements | |||
| Did not read advertisements | 42 | 38 | 50* |
| Did not know about advertisements | 8 | 11 | 7 |
| Did read advertisements | 50 | 51 | 43* |
| Found them to be helpful | 90* | 75 | 69 |
| Did not find them to be helpful | 10 | 25 | 31 |
| g) visit websites describing the federal program | |||
| Did not visit websites describing the federal program | 26* | 51 | 54 |
| Did not know about websites describing the federal program | 3 | 10 | 6 |
| Did visit websites describing the federal program | 71* | 39 | 40 |
| Found them to be helpful | 98* | 83 | 77 |
| Did not find them to be helpful | 2 | 17 | 23 |
| h) read banner ads | |||
| Did not read banner ads | 73 | 72 | 72 |
| Did not know about the banner ads | 12 | 15 | 9 |
| Did read banner ads | 15 | 13 | 19* |
| Found them to be helpful | 64 | 54 | 57 |
| Did not find them to be helpful | 36 | 46 | 43 |
| i) read newspaper articles | |||
| Did not read newspaper articles | 58 | 53* | 64* |
| Did not know about the newspaper articles | 8 | 14 | 8 |
| Did read newspaper articles | 34 | 33 | 28 |
| Found them to be helpful | 89* | 70 | 71 |
| Did not find them to be helpful | 11 | 30 | 29 |
| j) read general brochures | |||
| Did not read general brochures | 14 | 18 | 42* |
| Did not know about general brochures | 1 | 5 | 4 |
| Did read general brochures | 85 | 77 | 54* |
| Found them to be helpful | 97* | 82* | 74* |
| Did not find them to be helpful | 3 | 18 | 26 |
| k) call toll-free number | |||
| Did not call a toll-free number | 61* | 75* | 85* |
| Did not know about the toll-free number | 4 | 10 | 10 |
| Did call a toll-free number | 35* | 15* | 5* |
| Found it to be helpful | 94* | 71 | 66 |
| Did not find it to be helpful | 6 | 29 | 34 |
|
|||
| TABLE A-2: Exposure to Promotional Activities Among Retired Buyers, Non-Buyers and Non-Responders1 | |||
| Promotional Activities | RetiredBuyers | RetiredNon-Buyers | RetiredNon-Responders |
| Did you do any of the following: | |||
| a) talk to colleagues about the federal program | |||
| Did not talk to colleagues | 72% | 79% | 93%* |
| Did talk to colleagues | 28 | 21 | 7 |
| Found it to be helpful | 79 | 66 | 69 |
| Did not find it to be helpful | 21 | 34 | 31 |
| b) talk to human resource representative | |||
| Did not talk to human resource representative | 97 | 96 | 97 |
| Did talk to human resource representative | 3 | 4 | 3 |
| Found it to be helpful | 90 | 53 | 67 |
| Did not find it to be helpful | 10 | 47 | 33 |
| c) read "Get Smart About Your Future" | |||
| Did not read "Get Smart About Your Future" | 28* | 40* | 76* |
| Did not know about "Get Smart About Your Future" | 6 | 12 | 12 |
| Did read "Get Smart About Your Future" | 66* | 48* | 12* |
| Found it to be helpful | 97* | 86 | 75 |
| Did not find it to be helpful | 3 | 14 | 25 |
| d) read advertisements | |||
| Did not read advertisements | 36* | 45* | 70* |
| Did not know about advertisements | 4 | 11 | 10 |
| Did read advertisements | 60* | 44* | 20* |
| Found them to be helpful | 94* | 79 | 76 |
| Did not find them to be helpful | 6 | 21 | 24 |
| e) visit websites describing the federal program | |||
| Did not visit websites describing the federal program | 54 | 77 | 86* |
| Did not know about websites describing the federal program | 4 | 11 | 10 |
| Did visit websites describing the federal program | 42* | 12 | 4 |
| Found them to be helpful | 96 | 90 | 90 |
| Did not find them to be helpful | 4 | 10 | 10 |
| f) read banner ads | |||
| Did not read banner ads | 85 | 82 | 89 |
| Did not know about the banner ads | 8 | 14 | 8 |
| Did read banner ads | 7 | 4 | 3 |
| Found them to be helpful | 72 | 60 | 63 |
| Did not find them to be helpful | 28 | 40 | 37 |
| g) read newspaper articles | |||
| Did not read newspaper articles | 58 | 55 | 70* |
| Did not know about the newspaper articles | 5 | 9 | 8 |
| Did read newspaper articles | 37 | 36 | 22* |
| Found them to be helpful | 92* | 72 | 67 |
| Did not find them to be helpful | 8 | 28 | 33 |
| h) read general brochures | |||
| Did not read general brochures | 12* | 26* | 64* |
| Did not know about general brochures | 1 | 6 | 11 |
| Did read general brochures | 87* | 68* | 25* |
| Found them to be helpful | 98* | 85 | 83 |
| Did not find them to be helpful | 2 | 15 | 17 |
| i) call toll-free number | |||
| Did not call a toll-free number | 55* | 79 | 88 |
| Did not know about the toll-free number | 2 | 7 | 10 |
| Did call a toll-free number | 43* | 14* | 2* |
| Found it to be helpful | 98* | 77* | 75 |
| Did not find it to be helpful | 2 | 23 | 25 |
|
|||
A total of nine Policy Briefs are available from the Office of Disability, Aging and Long-Term Care on this subject:
- A Comparison of Demographic and Attitudinal Characteristics Among Active and Retired Buyers, Non-Buyers and Non-Responders to the Federal Long-Term Care Insurance Program [http://aspe.hhs.gov/daltcp/reports/charcom.htm] Posted June 2005
- A Comparative Analysis of the Socio-Demographic and Attitudinal Characteristics of Active Buyers and Non-Buyers of Long-Term Care Insurance in the Federal, Private and Public Sectors [http://aspe.hhs.gov/daltcp/reports/LTCIchar.htm] Posted February 2006
- A Demographic and Attitudinal Profile of Buyers of the Federal Long-Term Care Insurance Program [http://aspe.hhs.gov/daltcp/reports/buyprof.htm] Posted June 2005
- A Demographic and Attitudinal Profile of Non-Buyers of the Federal Long-Term Care Insurance Program [http://aspe.hhs.gov/daltcp/reports/nonbuyprof.htm] Posted September 2005
- A Demographic and Attitudinal Profile of Non-Responders of the Federal Long-Term Care Insurance Program [http://aspe.hhs.gov/daltcp/reports/nonresprof.htm] Posted September 2005
- Does Geographic Location Make a Difference? A Comparative Analysis of the Socio-Demographic and Attitudinal Characteristics of Active Buyers and Non-Buyers of the Federal Long-Term Care Insurance Program [http://aspe.hhs.gov/daltcp/reports/FLTCIloc.htm] Posted February 2006
- Marketing Activities: A Comparative Analysis of Engagement and Participation Among Buyers, Non-Buyers and Non-Responders of the Federal Long-Term Care Insurance Program [http://aspe.hhs.gov/daltcp/reports/markact.htm] Posted July 2005
- Multivariate Analysis of Buyers and Non-Buyers of the Federal Long-Term Care Insurance Program [http://aspe.hhs.gov/daltcp/reports/FLTCIanal.htm] Posted September 2005
- What We Know About Buyers and Non-Buyers of Private Long-Term Care Insurance: A Review of Studies [http://aspe.hhs.gov/daltcp/reports/LTCIlr.htm] Posted September 2005