
Brenda Spillman
Urban Institute
December 2014
Printer Friendly Version in PDF Format: http://aspe.hhs.gov/pdf-report/why-do-elders-receiving-informal-home-care-transition-long-stay-nursing-home-residency (47 PDF pages)
ABSTRACT
High stress reported by informal (unpaid, mostly family) caregivers providing functional assistance to chronically disabled elders residing in the community is a very powerful predictor of care recipients' subsequent transition from community living to long-stay nursing home residence. Factors associated with reports of high caregiver stress include high physical strain, high financial strain, care recipients having frequent behavior problems, caregiver reports of their own sleep being frequently disturbed, and caregiver reports of poor health, needing help with caregiving and/or a break from caregiving. These stressors could potentially be reduced by appropriate interventions.
DISCLAIMER: The opinions and views expressed in this report are those of the authors. They do not necessarily reflect the views of the Department of Health and Human Services, the contractor or any other funding organization.
TABLE OF CONTENTS
Methods
Source of Key Analytic Measures
Variables Included in the Models
APPENDIX A. ADDITIONAL TABLES
LIST OF FIGURES
FIGURE 1: Predicted Percent with High Stress by Presence of High Physical or Financial Strain
FIGURE 2: Simulated Reduction in Nursing Home Days Over 1 Year from Reducing Physical or Financial Strain
LIST OF TABLES
TABLE 1: Outcome Variables, Endogenous Regressors, and Instruments, Nursing Home Model
TABLE 2: Care Recipient Characteristics and Other Explanatory Variables
TABLE 3: Instrumental Variables Estimation: Admission to a Nursing Home Episode of 60 Days or Longer, Pooled 1999 and 2004 Data
TABLE 4: Instrumental Variables Estimation: Expected Days of Longer-Stay Use, Pooled 1999 and 2004 Data
TABLE 5: Simulated Reduction in Nursing Home Entry from Reducing Caregiver Stress
TABLE 6: Marginal Effects of Caregiver and Caregiving Characteristics on the Likelihood that Caregiver is Highly Stressed
TABLE 7: Simulated Reduction in Nursing Home Entry from Reducing Sources of High Caregiver Stress
TABLE A1a: OLS Estimation: Admission to a Nursing Home Episode of 60 Days or Longer, Pooled 1999 and 2004 Data
TABLE A1b: OLS Estimation: Expected Days of Longer-Stay Use, Pooled 1999 and 2004 Data
TABLE A2: First Stage Regressions from IV Models, Pooled 1999 and 2004 Data
TABLE A3: Personal and Caregiving Characteristics of Primary Informal Caregivers, 1999 and 2004
TABLE A4: Probit Estimation of the Reduced Form Model of High Caregiver Stress
TABLE A5: Support Service Use and Perceived Effectiveness by Caregiver
ACRONYMS
The following acronyms are mentioned in this report and/or appendix.
| ACL | Administration for Community Living |
|---|---|
| ADL | Activity of Daily Living |
| CMS | Centers for Medicare and Medicare Services |
| DALTCP | Office of Disability, Aging and Long-Term Care Policy |
| HCBS | Home and Community-Based Services |
| HMO | Health Maintenance Organization |
| IADL | Instrumental Activity of Daily Living |
| ICS | Informal Caregiver Supplement |
| IV | Instrumental Variable |
| LTSS | Long-Term Services and Supports |
| MDS | Minimum Data Set |
| MSA | Metropolitan Statistical Area |
| NFCSP | National Family Caregiver Support Program |
| NHATS | National Health and Aging Trend Study |
| NLTCS | National Long-Term Care Survey |
| NSOC | National Study of Caregiving |
| OLS | Ordinary Least Squares |
| SPMSQ | Short Portable Mental Status Questionnaire |
INTRODUCTION
Informal caregiving has long been recognized as the foundation of long-term care for the older population in the United States, accounting for more than 75% of total care hours provided outside of institutional settings (Spillman 2009; Johnson & Wiener 2006). Estimates from the 2011 National Health and Aging Trend Study (NHATS) and its companion National Study of Caregiving (NSOC) indicate that 18 million informal caregivers were assisting about 9 million care recipients age 65 or older in 2011, providing 1.3 billion hours of care monthly (Spillman et al. 2014). Consistent with earlier studies, NHATS estimates indicate that 95% of the older population living in settings other than nursing homes receive informal care, nearly two in three receive only informal care, and the remainder receive some formal, paid care (Freedman & Spillman 2014; Spillman 2009; Kaye, Harrington & LaPlante 2010).
Although informal caregivers report substantial rewards from their role, caregiving also exacts a toll, particularly among those providing large numbers of hours to recipients with severe disability or cognitive impairment (Spillman et al. 2014). A substantial literature has examined caregiving-related stress, burden, and their consequences, especially among caregivers to persons with cognitive impairment (Pinquart & Sorensen 2003, 2007). These consequences include decisions to end caregiving (Kasper 1994), and institutionalization of the care recipient (Spillman & Long 2009).
Although institutional long-term care has declined in recent decades, the aging of the population makes nursing home use a continuing concern for both individual well-being and private and public program costs. Policy concerns are not limited to direct effects on the older population, but also encompass ways to support the efforts of informal caregivers and impacts on Medicaid, which may pay for care if private resources are insufficient. Notable policy efforts include the Administration for Community Living's (ACL's) National Family Caregiver Support Program (NFCSP) and Aging and Disability Resource Centers, and more recently the U.S. Department of Health and Human Services National Plan to Address Alzheimer's Disease. Available support nevertheless remains modest relative to the number of caregivers and recipients who might benefit (Doty & Spillman forthcoming).
In this study, we update and extend analyses in Spillman and Long (2009) to examine the role of formal and informal care hours and primary caregiver stress in nursing home entry and expected days of care over periods of 1-2 years. As in the earlier study, instrumental variable (IV) methods are used for estimation. Simulations from the earlier study, which examined only nursing home entry using data from the 1999 National Long-Term Care Survey (NLTCS) and its companion Informal Caregiver Supplement (ICS) linked with administrative data, indicated that hypothetical interventions to eliminate high levels of caregiver stress could reduce nursing home entry by 3.3 percentage points over 2 years and potentially avoid about one in four admissions that would be expected at prevailing levels of caregiver stress. Further simulations indicated that reducing two highly significant predictors of caregiver stress that are amenable to interventions--physical or financial strain from caregiving--could accomplish 60% of the reduction in nursing home entry simulated from eliminating high stress.
In this study, we pool data nationally representative data from the 1999 and 2004 NLTCS and ICS linked with administrative data for a 2-year follow-up period, as in the previous study, to examine:
-
How do formal care hours, informal care hours, and high caregiver stress relate to nursing home entry and expected days of care?
-
How many admissions and expected days of care could be avoided by eliminating high stress and addressing specific factors associated with high levels of caregiving stress?
-
What are the potential implications for nursing home spending and public policy?
DATA AND METHODS
The NLTCS was the dominant nationally representative longitudinal survey focused on disability and long-term care in the Medicare population age 65 or older for two decades prior to its discontinuation after the 2004 survey year. The survey, which includes beneficiaries in both community and institutional settings, began in 1982 and was repeated at 5-year intervals from 1984 through 2004. The Office of Disability, Aging and Long-Term Care Policy (DALTCP) within the Office of the Assistant Secretary for Planning and Evaluation supported a companion ICS in 1982, 1989, 1999, and 2004, to gather detailed information from primary caregivers about their caregiving experience, including stress and associated caregiving burden they experienced.
Throughout the survey's history, Medicare beneficiary and claims data were linked to respondents, providing continuous longitudinal information on Medicare service use and spending. Beginning in the 1999 survey year, DALTCP supported linkage of Outcome and Assessment Information Set and Minimum Data Set (MDS) assessments, the latter with the particular intent of being able to observe nursing home admissions occurring in the intervals between interviews (Spillman & Long 2009).
The analysis sample for this study is drawn from about 1,000 informal care recipients and their primary caregivers from the 1999 NLTCS/ICS and about 1,500 from the 2004 surveys, linked to MDS assessments over a 2-year follow-up period. Data are pooled for multivariate modeling, yielding a sample of about 2,400, with the small number of recipients (152) appearing in both cross-sections randomly assigned to 1999 or 2004.
Methods
The analysis focuses on older persons receiving help with chronic disabilities living in traditional community housing or non-institutional supportive settings, such as assisted living, who have an established informal care arrangement. The model uses baseline hours of formal and informal care and level of caregiver stress to predict admission to an episode of care lasting at least 60 days within 1 year, 18 months, and 2 years of survey interview.
The conceptual framework is based on the following assumptions:
-
Consistent with the literature, nursing home care is a less preferred option for both care recipients and caregivers as long as informal and formal community-based care is able to meet care needs.
-
The sustainability of community care arrangements depends on the level of care required and the level of stress experienced by the informal caregiver.
-
The demand for nursing home care, formal care, and informal care are a function of the needs of the care recipient, the ability to pay for care, access to care providers, and the cost of care, and are jointly determined by recipient and family decisions.
-
Caregiver stress affects and is affected by decisions about formal and informal care, and has a direct effect on the nursing home entry decision.
-
The baseline situation reflects the outcome of past decisions, and the factors that influenced past decisions also affect future decisions.
-
For any individual with chronic disabilities, frailty and care needs, and with them, caregiver stress, tend to increase over time, although changes in the baseline situation, such as changes in functional status, care arrangements or other factors, such as death or illness of the primary caregiver, that may affect future decisions about nursing home entry cannot be observed in the data.
The model can be expressed as follows:
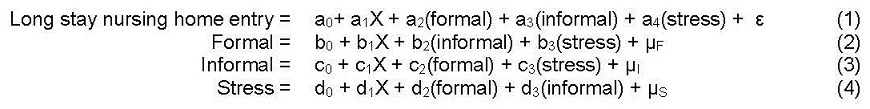 |
where X is a vector of recipient, local health care market, and other characteristics, including the availability and cost of nursing home care, formal and informal are hours of care the recipient received in the week prior to interview, and stress is an indicator of high stress perceived by the primary caregiver at baseline.
The joint determination of the amount of formal care, informal care, and caregiver stress makes them endogenous to the nursing home decision. For example, increased informal care may forestall nursing home entry, but also may increase caregiver stress and result in the addition of formal care to the care arrangement. Other unobserved differences across individuals and families also may affect formal care, informal care, stress, and nursing home entry. Both endogeneity and such unobserved differences may result in biased estimates if the endogenous regressors are entered directly in the nursing home equation because of correlation among the error terms in the four equations. One approach to addressing these complexities is an IV model in which predicted values for formal care, informal care, and stress respectively are obtained in a first stage estimation and then entered as regressors in the nursing home equation. The first stage equations are as follows:
 |
Where X is the vector of explanatory variables other than formal and informal care hours and stress included in the main equation and Z is a vector of instruments selected because they are correlated with formal care, informal care, and stress but not with the error term in the main equation.
The challenge in IV estimation is finding strong instruments that meet the criteria of being strongly correlated with the instrumented regressors but uncorrelated with the main equation error term. The challenge is greater when there are multiple endogenous regressors, as in this analysis. The starting specification used the instruments identified in the original analysis and then examined alternatives in sensitivity analyses. The final set of instruments selected are discussed below, and tests for their validity are discussed in the results section.
To identify primary factors associated with high caregiver stress for simulations of reductions in nursing home use associated with eliminating particular stress factors, a reduced form model of high stress including a richer array of caregiver and caregiving characteristics developed from the ICS data also was estimated.
All descriptive estimates and model results were produced using the survey (svy) commands in Stata (StataCorp 2009). Svy:ivreg was used to estimate the IV model for both nursing home entry and expected days, and ivreg2 with a general correction for clustering was used for tests of the IV model not available for survey commands. The reduced form model of caregiver stress was estimated using svy:probit.
Source of Key Analytic Measures
Nursing home use was constructed from MDS data for the calendar years 1999-2009. The focus is on long stay episodes, defined as an episode of nursing home use of at least 60 days with no intervening period of community residence of 30 days or more, as a measure of use that is likely to be a permanent placement, rather than a short-term post-acute or respite admission. Outcome variables are indicators of a long stay episode beginning within follow-up periods of 1 year, 18 months, or 2 years, and the number of days of care in long stay episodes occurring within each time period, valued 0 for those with no admission in the period.
Formal and informal care hours provided by all caregivers were constructed from care recipient reports on the amount of care provided in the last week by all persons providing care. NLTCS respondents who report receiving help with at least one activity of daily living (ADL) or instrumental activity of daily living (IADL) were asked to identify all persons who assist them. Included ADLs are eating, transferring, getting around inside, dressing, bathing, and toileting. Included IADLs are housework, laundry, meal preparation, shopping, getting around outside, managing money, taking medications, and telephoning. For each caregiver, respondents report the number of hours of care provided, and, if the caregiver is not a relative, whether the caregiver is paid. All respondents reporting ADL or IADL assistance also are asked to identify the primary informal caregiver to be interviewed in the ICS, generally based on the amount of care provided.
Stress is assessed using the primary caregiver's report of the total level of stress they experience as a result of their caregiving activities on a scale from 1 to 10. The measure used in the models is an indicator that the caregiver rated stress at a level of 6 or higher, as in the previous study. Specifications using a continuous scale did not yield qualitatively different results, but the indicator was chosen for the final model because of the difficulty of interpreting the meaning of a one-unit change in subjective stress, particularly in simulations of potential effects of policies that would reduce stress.
Variables Included in the Models
Table 1 provides means of the outcome variables, endogenous regressors, and instruments included in the model for 1999, 2004, and the pooled sample. Notably, there are no significant differences between respondents in the 1999 and 2004 cross-sections in either long stay nursing home use or in the proportion with a highly-stressed caregiver, although average hours of formal and informal care both fell between 1999 and 2004.
Instruments are grouped according to their conceptual relationship to each endogenous regressor, although in the models, most are strongly related more than one of the three, but in combination contribute to overall strength of the full set of instruments in identifying the model. In all cases, the choice of instruments depends on an assumption they have no direct effect on nursing home entry and are not correlated with unobserved factors affecting nursing home entry after controlling for other covariates in the main equation.
For formal care hours, the instruments are the number of home health agencies per 1,000 persons age 65 or older in the respondent's county of residence, living in a supportive community care setting; the number of executive function-related limitations the recipient has; and a dummy for 2004. Both the number of home health agencies and living in a supportive setting, which increased significantly between 1999 and 2004, measure the availability of formal care providers. Executive function-related activities are a measure of the recipient's need for help with independent living activities not associated with health or the need for personal care. Conceptually limitations in these activities are related to the number of hours of help, both formal and informal, required, but not with nursing home use, after controlling for the recipient's personal care needs and cognitive status, both of which are explicit components of nursing home pre-admission screening (Tonner, LeBlanc & Harrington 2001). The average number of executive function-related activities declined significantly between 1999 and 2004. Although the indicator that the observation was from 2004 is not a conventional instrument, its inclusion is based conceptually on continued reductions in access to Medicare home health after 1999 associated with the introduction of prospective payment, particularly among those with severe disabilities, and potentially other secular changes in disability care, such as increased use of assistive devices among those receiving assistance (Spillman 2014).
| TABLE 1. Outcome Variables, Endogenous Regressors, and Instruments, Nursing Home Model | |||
|---|---|---|---|
| 1999 | 2004 | Pooled Samplea | |
| Longer Stay Nursing Home Use Within Follow-Up Period | |||
| 1 year | 0.07 | 0.07 | 0.07 |
| 18 months | 0.10 | 0.10 | 0.10 |
| 2 years | 0.12 | 0.13 | 0.13 |
| Days of use over 2 years | 38.24 | 35.03 | 38.48 |
| Endogenous Regressors | |||
| Formal care hours at baselineb | 7.13 | 5.398 | 6.20 |
| Informal care hours at baselineb | 34.50 | 31.218 | 32.02 |
| Caregiver perceives high stress (6 or higher on a scale of 1-10) | 0.20 | 0.18 | 0.18 |
| Instruments for Endogenous Regressors | |||
| Formal Care | |||
| Home health agencies per 1,000 persons 65+ in county of residencec | 0.24 | 0.22 | 0.23 |
| Recipient lives in community residential care | 0.04 | 0.0788 | 0.06 |
| Number of executive function-related limitations (out of 4)d | 1.73 | 1.4888 | 1.57 |
| Year is 2004 | 0.00 | 1.00 | 0.62 |
| Informal Care | |||
| Recipient lives alone | 0.23 | 0.26 | 0.25 |
| Number of daughters living within 1 hour of recipientb | 0.77 | 0.77 | 0.77 |
| Primary caregiver has minor children | 0.10 | 0.0788 | 0.08 |
| High Caregiver Stress | |||
| Caregiver reports high physical strain from caregivinge | 0.31 | 0.278 | 0.29 |
| Recipient had behavior problems 3+ times last week | 0.35 | 0.37 | 0.36 |
| Average Weight | 2,722 | 2,801 | 2,753 |
| Sample Size | 1,006 | 1,535 | 2,394 |
| SOURCE: Tabulations of data from the 1999 and 2004 NLTCS and companion ICS. NOTES:
**(*) Statistically different from the 1999 value at the 5%(10%) level in a two-tailed test. | |||
For informal care, instruments are associated with availability of and ease of access to informal care, specifically, whether the recipient lives alone, the number of daughters living nearby, and whether the caregiver has minor children, which fell slightly between 1999 and 2004. For high caregiver stress, we include two instruments that we hypothesize, based on the literature and results in the previous study, increase the level of stress experienced by the caregiver, but have no direct effect on nursing home entry, specifically high caregiver physical strain, which also fell slightly between 1999 and 2004, and frequent recipient behavior problems.
| TABLE 2. Care Recipient Characteristics and Other Explanatory Variables | |||
|---|---|---|---|
| 1999 | 2004 | Pooled Samplea | |
| Recipient Characteristics | |||
| Age | 79.99 | 80.14 | 80.20 |
| Female | 0.67 | 0.67 | 0.67 |
| White race | 0.89 | 0.86 | 0.87 |
| High school graduate | 0.24 | 0.27 | 0.26 |
| Some college | 0.20 | 0.19 | 0.20 |
| Income last year $20,000 - $40,000 | 0.23 | 0.30 | 0.27 |
| Income last year >$40,000 | 0.09 | 0.10 | 0.09 |
| Enrolled in Medicaid | 0.20 | 0.26** | 0.23 |
| HMO enrollee any month in the last 6 months | 0.13 | 0.12 | 0.12 |
| Number of ADL disabilities (out of 6) | 3.16 | 3.09 | 3.11 |
| Receives help with transfer/mobility most of the time | 0.54 | 0.54 | 0.54 |
| Disability has lasted 1-5 years | 0.48 | 0.50 | 0.50 |
| Disability has lasted 5 years or longer | 0.38 | 0.40 | 0.38 |
| Cognitively impaired | 0.36 | 0.29** | 0.32 |
| Obese | 0.20 | 0.23 | 0.22 |
| Total inpatient hospital spending last 6 months ($)b | 2,131 | 2,197 | 2,250 |
| Nursing Home Market and Area Characteristics | |||
| Nursing home beds per 1,000 persons 65+ (county of residence)c | 6.05 | 2.94** | 3.96 |
| State Medicare nursing facility reimbursement per diem/mediand | 1.02 | 1.01 | 1.02 |
| Physicians per 1,000 persons (county of residence)c | 1.94 | 2.06 | 2.02 |
| Hospital beds per 1,000 persons (county of residence)c | 3.57 | 3.42 | 3.49 |
| Northeast region | 0.19 | 0.19 | 0.19 |
| Northcentral region | 0.24 | 0.22 | 0.23 |
| South | 0.39 | 0.40 | 0.39 |
| West | 0.18 | 0.19 | 0.18 |
| MSA | 0.69 | 0.74 | 0.72 |
| Percent of population in poverty (country of residence)c | 12.72 | 13.26 | 13.01 |
| Median household income (country of residence)c | 40.54 | 43.20 | 42.21 |
| Percent of population age 65 or older (county of residence)c | 7.89 | 8.07 | 7.99 |
| Proxy Respondent and Survival | |||
| Respondent is a proxy for sampled person | 0.37 | 0.56** | 0.49 |
| Months of 2-year follow-up period survivedb | 20.57 | 20.62 | 20.45 |
| Sample Size | 1,006 | 1,535 | 2,394 |
| SOURCE: Tabulations of data from the 1999 and 2004 NLTCS and companion ICS. NOTES:
**(*) Statistically different from the 1999 value at the 5%(10%) level in a two-tailed test. | |||
Table 2 provides means for the remaining variables included in the model to control for factors hypothesized to directly affect nursing home entry. Chief among them are the recipient's physical and cognitive status, measured by a count of the number of ADL limitations, the frequency with assistance is needed for getting in or out of bed or moving around indoors, the duration of disabilities, and whether the respondent has cognitive impairment. Cognitive status is measured by a combination of reports that the recipient has Alzheimer's disease, mental retardation, or senility; proxy responses regarding the reason for proxy; and, in 2004 only, the recipient's score on the Short Portable Mental Status Questionnaire (SPMSQ). Because the SPMSQ was not available in the survey in 1999, the decline in cognitive impairment between 1999 and 2004 cannot be assumed to be valid. Previous analysis of the NLTCS indicated that cognitive impairment declined among all persons age 65 or older between 1994 and 2004, when measures were consistent, but did not decline among those with chronic disabilities (Spillman 2011). The large increase in proxy response in 2004 also may support suspicion regarding the validity of the decline in cognitive impairment, although there are other reasons for proxy response, including physical illness. Differences in measurement also may account for the apparent significant increase in Medicaid enrollment at baseline. Medicaid beneficiary data and claims were available and used in identifying enrollment in 2004 but not in 1999. The large decline in the supply of nursing facility beds, on the other hand, is based on the same variables from the Area Resource File in both years.
RESULTS
Table 3 and Table 4 present the results of IV estimation of the association of formal care hours, informal care hours, and high caregiver stress with admission to an episode of care lasting at least 60 days (Table 3) and expected days of care (Table 4) occurring within each time period. Ordinary least square (OLS) estimates ignoring endogeneity of the primary explanatory variables (see Appendix Table A1a and Table A1b) showed a negative but insignificant relationship with nursing home admission and with expected days of care for informal care hours in each time period, and a significant positive relationship for both formal care hours and high stress for admission in all periods, and for expected days over 1 year and 2 year follow-up periods.
In contrast, the IV results show no significant relationship for formal care in any time period for either admission or expected days, a larger negative and significant relationship for informal care in all periods for admission and over 2 years for expected days, and a significant positive relationship for high stress that is much larger (by factors 2-4) for both admissions and expected days in all periods. The results indicate that high caregiver stress is associated with a 13 percentage point increase in the likelihood of admission over 1 year and a 20 percentage point increase over 2 years, very similar to the result in the original study. High stress also is associated with an increase of 26 days in expected use over 1 year, and an increase of 72 days over 2 years. Higher informal care hours were associated with a 2.2 percentage point lower rate of admission over 2 years and nearly 8 fewer expected days of care.
IV specification tests at the bottom of Table 3 and Table 4 indicate that, as required by the model, the instruments are uncorrelated with the nursing home error term and properly excluded from the main equation and that the IV bias is no more than 5% of the bias in OLS estimation. The first stage equations (see Appendix Table A2) show strong explanatory power for the instruments for formal care hours, informal care hours, and high stress and that at least one instrument is a strong predictor for each endogenous variable but unrelated to the other two. The final test for model specification in Table 3 and Table 4 rejects the null hypothesis that the instrumented variables are exogenous in the main equation over 18 months and 2 years and comes close to rejection at the 10% level over the 1-year follow-up period for admission. The null hypothesis for expected days can be rejected only over the 2-year follow-up, but approaches rejection at the 10% level over 18 months.
| TABLE 3. Instrumental Variables Estimation: Admission to a Nursing Home Episode of 60 Days or Longer, Pooled 1999 and 2004 Dataa | ||||||
|---|---|---|---|---|---|---|
| Within 1 Year | Within 18 Months | Within 2 Years | ||||
| Coefficient | P>|t| | Coefficient | P>|t| | Coefficient | P>|t| | |
| Endogenous Regressors | ||||||
| Formal care hoursb | 0.000 | 0.963 | -0.004 | 0.680 | 0.001 | 0.943 |
| Informal care hoursb | -0.015 | 0.102 | -0.028 | 0.013** | -0.022 | 0.077* |
| Caregiver perceives high stressc | 0.131 | 0.001** | 0.202 | 0.000** | 0.204 | 0.000** |
| Recipient Characteristics | ||||||
| Age | 0.002 | 0.005** | 0.003 | 0.001** | 0.004 | 0.000** |
| Female | 0.006 | 0.613 | 0.000 | 0.996 | 0.006 | 0.668 |
| White race | 0.016 | 0.303 | 0.000 | 0.985 | 0.013 | 0.575 |
| High school graduate | 0.017 | 0.228 | 0.016 | 0.320 | 0.018 | 0.308 |
| Some college | -0.002 | 0.898 | -0.005 | 0.814 | -0.008 | 0.723 |
| Income last year $20,000 - $40,000 | 0.014 | 0.368 | 0.013 | 0.454 | 0.018 | 0.345 |
| Income last year >$40,000 | -0.014 | 0.405 | 0.000 | 0.992 | 0.002 | 0.941 |
| Enrolled in Medicaid | 0.002 | 0.900 | -0.005 | 0.782 | 0.002 | 0.916 |
| HMO enrollee any month in the last 6 months | 0.022 | 0.244 | 0.015 | 0.445 | 0.004 | 0.841 |
| Number of ADL disabilities (out of 6) | 0.005 | 0.231 | 0.008 | 0.218 | 0.006 | 0.420 |
| Receives help with transfer/mobility most of the time | 0.006 | 0.648 | -0.005 | 0.763 | -0.001 | 0.965 |
| Disability has lasted 1-5 years | 0.006 | 0.740 | 0.023 | 0.263 | 0.029 | 0.182 |
| Disability has lasted 5 years or longer | 0.010 | 0.583 | 0.025 | 0.203 | 0.028 | 0.186 |
| Cognitively impaired | 0.032 | 0.063* | 0.049 | 0.009** | 0.052 | 0.011** |
| Obese | -0.003 | 0.837 | -0.011 | 0.543 | -0.014 | 0.454 |
| Total inpatient hospital spending last 6 months ($)b | 0.002 | 0.098* | 0.004 | 0.016** | 0.003 | 0.065* |
| Nursing Home Market and Area Characteristics | ||||||
| Nursing home beds per 1,000 persons 65+ (county of residence)d | 0.000 | 0.738 | 0.000 | 0.747 | 0.000 | 0.992 |
| State Medicare nursing facility reimbursement per diem/mediane | 0.046 | 0.386 | 0.115 | 0.107 | 0.096 | 0.237 |
| Physicians per 1,000 persons (county of residence)d | 0.013 | 0.079* | 0.014 | 0.068* | 0.015 | 0.069* |
| Hospital beds per 1,000 persons (county of residence)d | -0.001 | 0.646 | -0.001 | 0.509 | -0.002 | 0.311 |
| Northcentral region | 0.013 | 0.614 | 0.025 | 0.383 | 0.013 | 0.684 |
| South | -0.025 | 0.299 | -0.008 | 0.792 | -0.035 | 0.319 |
| West | -0.055 | 0.059* | -0.065 | 0.041** | -0.085 | 0.016** |
| MSA | -0.042 | 0.046** | -0.027 | 0.194 | -0.033 | 0.172 |
| Percent of population in poverty (country of residence)d | -0.006 | 0.009** | -0.008 | 0.005** | -0.007 | 0.046** |
| Median household income (country of residence)d | -0.003 | 0.012** | -0.005 | 0.001** | -0.004 | 0.009** |
| Percent of population age 65 or older (county of residence)d | 0.005 | 0.211 | 0.004 | 0.401 | 0.005 | 0.283 |
| Proxy Respondent and Survival | ||||||
| Respondent is a proxy for sampled person | 0.032 | 0.007** | 0.046 | 0.002** | 0.056 | 0.001** |
| Months of 2-year follow-up period survivedb | 0.047 | 0.000** | 0.056 | 0.000** | 0.063 | 0.000** |
| Constant | -0.134 | 0.186 | -0.196 | 0.128 | -0.279 | 0.046** |
| Sample Size | 2,394 | 2,394 | 2,394 | |||
| R2 | 0.038 | 0.014 | 0.040 | |||
| Tests of IV Model Specification | P-value | P-value | P-value | |||
| Hansen's J (H0: instruments are uncorrelated with the error term and correctly excluded from the main equation) | 2.73 | 0.84 | 5.18 | 0.52 | 7.63 | 0.27 |
| Weak identification test: Cragg-Donald (N-L)*minEval/L2 F-statf | 17.65 | 17.62 | 17.59 | |||
| Davidson-MacKinnon endogeneity test (H0: instrumented variables are exogenous in the main equation) | 2.12 | 0.103 | 4.46 | 0.005** | 3.70 | 0.014** |
| SOURCE: Stata svy:ivreg estimation using pooled data from the 1999 and 2004 NLTCS and companion ICS. NOTES:
**(*) Statistically different from 0 at the 5%(10%) level. | ||||||
| TABLE 4. Instrumental Variables Estimation: Expected Days of Longer-Stay Use, Pooled 1999 and 2004 Dataa | ||||||
|---|---|---|---|---|---|---|
| Within 1 Year | Within 18 Months | Within 2 Years | ||||
| Coefficient | P>|t| | Coefficient | P>|t| | Coefficient | P>|t| | |
| Endogenous Regressors | ||||||
| Formal care hoursb | -0.627 | 0.681 | -0.263 | 0.913 | 0.325 | 0.922 |
| Informal care hoursb | -2.713 | 0.150 | -4.983 | 0.103 | -7.754 | 0.067* |
| Caregiver perceives high stressc | 25.977 | 0.004** | 46.432 | 0.001** | 72.370 | 0.000** |
| Recipient Characteristics | ||||||
| Age | 0.379 | 0.031** | 0.756 | 0.008** | 1.122 | 0.004** |
| Female | 1.644 | 0.515 | 4.475 | 0.242 | 5.796 | 0.241 |
| White race | 2.454 | 0.492 | 0.775 | 0.894 | -2.127 | 0.801 |
| High school graduate | 4.244 | 0.177 | 5.121 | 0.297 | 4.660 | 0.487 |
| Some college | 1.376 | 0.724 | 0.483 | 0.937 | -1.115 | 0.893 |
| Income last year $20,000 - $40,000 | 0.468 | 0.881 | 2.422 | 0.636 | 5.725 | 0.417 |
| Income last year >$40,000 | -2.979 | 0.437 | -1.624 | 0.806 | 2.654 | 0.780 |
| Enrolled in Medicaid | 3.115 | 0.414 | 4.016 | 0.520 | 5.091 | 0.568 |
| HMO enrollee any month in the last 6 months | 2.866 | 0.442 | 5.927 | 0.315 | 5.627 | 0.446 |
| Number of ADL disabilities (out of 6) | 1.247 | 0.126 | 1.757 | 0.222 | 2.457 | 0.251 |
| Receives help with transfer/mobility most of the time | 2.975 | 0.215 | 2.748 | 0.477 | 2.204 | 0.681 |
| Disability has lasted 1-5 years | -0.271 | 0.944 | 0.148 | 0.982 | 0.853 | 0.925 |
| Disability has lasted 5 years or longer | -1.281 | 0.733 | -2.607 | 0.655 | -2.767 | 0.724 |
| Cognitively impaired | 6.727 | 0.050** | 13.115 | 0.021** | 20.824 | 0.009** |
| Obese | -0.647 | 0.828 | -0.620 | 0.902 | -1.840 | 0.799 |
| Total inpatient hospital spending last 6 months ($)b | 0.515 | 0.080* | 0.736 | 0.086* | 0.839 | 0.143 |
| Nursing Home Market and Area Characteristics | ||||||
| Nursing home beds per 1,000 persons 65+ (county of residence)d | 0.002 | 0.982 | 0.066 | 0.744 | 0.115 | 0.708 |
| State Medicare nursing facility reimbursement per diem/mediane | -7.488 | 0.563 | -4.713 | 0.809 | -5.093 | 0.859 |
| Physicians per 1,000 persons (county of residence)d | 3.252 | 0.100* | 4.928 | 0.119 | 5.953 | 0.150 |
| Hospital beds per 1,000 persons (county of residence)d | -0.286 | 0.271 | -0.404 | 0.380 | -0.561 | 0.420 |
| Northcentral region | 5.006 | 0.347 | 11.198 | 0.182 | 18.274 | 0.107 |
| South | -5.608 | 0.258 | -5.684 | 0.460 | -7.759 | 0.482 |
| West | -5.421 | 0.379 | -9.038 | 0.352 | -12.123 | 0.353 |
| MSA | -7.593 | 0.069* | -12.086 | 0.062* | -15.033 | 0.092* |
| Percent of population in poverty (country of residence)d | -1.289 | 0.009** | -2.173 | 0.012** | -2.561 | 0.050** |
| Median household income (country of residence)d | -0.664 | 0.025** | -1.086 | 0.034** | -1.328 | 0.070* |
| Percent of population age 65 or older (county of residence)d | 0.523 | 0.541 | 0.551 | 0.665 | 0.400 | 0.809 |
| Proxy Respondent and Survival | ||||||
| Respondent is a proxy for sampled person | 5.138 | 0.036** | 10.461 | 0.006** | 15.371 | 0.003** |
| Months of 2-year follow-up period survivedb | 10.386 | 0.000** | 18.027 | 0.000** | 26.583 | 0.000** |
| Constant | -5.183 | 0.797 | -26.443 | 0.431 | -56.108 | 0.256 |
| Sample Size | 2,394 | 2,394 | 2,394 | |||
| R2 | 0.040 | 0.044 | 0.046 | |||
| Tests of IV Model Specification | P-value | P-value | P-value | |||
| Hansen's J (H0: instruments are uncorrelated with the error term and correctly excluded from the main equation) | 6.05 | 0.418 | 6.40 | 0.380 | 7.16 | 0.306 |
| Weak identification test: Cragg-Donald (N-L)*minEval/L2 F-statf | 17.65 | 17.62 | 17.59 | |||
| Davidson-MacKinnon endogeneity test (H0: instrumented variables are exogenous in the main equation) | 1.32 | 0.271 | 2.08 | 0.107 | 3.17 | 0.027** |
| SOURCE: Stata svy:ivreg estimation using pooled data from the 1999 and 2004 NLTCS and companion ICS. NOTES:
**(*) Statistically different from 0 at the 5%(10%) level. | ||||||
Simulations provided in Table 5 illustrate the potential implications of the results in Table 3 and Table 4 for a hypothetical highly effective intervention that could reduce the level of stress perceived by primary caregivers below the high-stress threshold used in the IV models. Simulated effects rely entirely on the coefficient associated with the indicator of high caregiver stress. All other explanatory variables remain at their actual values in the sample. The total number of informal care recipients in the first row is taken from the 2004 survey to represent the more recent cross-section. Results for admission are shown in the top panel, and results for expected days of care are shown in the bottom panel. For each nursing home measure two simulations are provided, the first for eliminating high stress among all caregivers and the second for eliminating high stress among the subset of caregivers to persons with substantial disability, defined as having 3+ ADL disabilities or having cognitive impairment and receiving help with at least one ADL. About two-thirds of all care recipients and 80% of those with highly stressed caregivers have this level of disability.
| TABLE 5. Simulated Reduction in Nursing Home Entry from Reducing Caregiver Stress | |||
|---|---|---|---|
| Within 1 Year | Within 18 Months | Within 2 Years | |
| Predicted Entry | |||
| Number of Informal Care Recipients | 3,317,612 | 3,317,612 | 3,317,612 |
| Nursing Home Entry with Current Levels of Caregiver Stress | |||
| Number of entrants | 244,791 | 348,079 | 439,136 |
| Percent of care recipients | 7.4% | 10.5% | 13.2% |
| Simulated Impact of Intervention Eliminating High Stress | |||
| Targeted to all caregivers | |||
| Percent entering nursing homes after intervention | 5.0% | 6.8% | 9.5% |
| Reduction in nursing home entry (percentage) | 32% | 35% | 28% |
| Admissions avoided | 78,791 | 121,420 | 122,663 |
| Targeted to caregivers for those with substantial disabilitya | |||
| Percent entering nursing homes after intervention | 5.5% | 7.6% | 10.3% |
| Reduction in nursing home entry (percentage) | 26% | 28% | 22% |
| Admissions avoided | 63,229 | 97,438 | 98,436 |
| Expected Days of Use | |||
| Expected Days of Use with Current Levels of Caregiver Stress | 13 | 25 | 38 |
| Total Days of Care (000s) | 43,905 | 82,578 | 127,669 |
| Simulated Impact of Intervention Eliminating High Stress | |||
| Targeted to all caregivers | |||
| Expected days of use after intervention | 9 | 16 | 25 |
| Reduction in nursing home entry (percentage) | 36% | 34% | 34% |
| Total days of care avoided | 15,651 | 27,974 | 43,601 |
| Targeted to caregivers for those with substantial disabilitya | |||
| Expected days of use after intervention | 9 | 18 | 28 |
| Reduction in nursing home entry (percentage) | 29% | 27% | 27% |
| Total days of care avoided (000s) | 12,559 | 22,449 | 34,989 |
| SOURCE: Analysis of pooled data from the 1999 and 2004 NLTCS and companion ICS. NOTE:
| |||
For nursing home entry, the simulations indicate that reducing stress below the high-stress threshold for all caregivers would reduce longer-stay admissions over 1 year by 32%, from 7.4% of informal care recipients to 5%. Over 2 years, the cumulative admission rate of 13.2% would be reduced to 9.5%, a 28% reduction. Simulated reductions for targeting those with substantial disability are, smaller, but still amount to 26% of admissions over 1 year and 22% over 2 years. A similar pattern is evident for expected days of care, which reflect both effects on the likelihood of admission and the average days if admitted. The 38 expected days of care predicted for prevailing levels of caregiver stress would fall to 25 days over 2 years under a successful intervention applied to all caregivers, and to 28 days for an intervention limited to caregivers to persons with substantial disability. Together, the simulations indicate the potential avoidance of about 100,000 admissions, and 30-40 million days of care over a 2-year period.
Table 5 simulations are stylized and intended only to illustrate the potential scope of reductions in nursing home use that might be accomplished by expanded access to effective caregiver supports. They do not consider which aspects of caregiving might most effectively targeted to accomplish reductions in caregiver stress. To explore potential sources of stress that may be amenable to policy interventions, a reduced form model of high caregiver stress was estimated starting with the factors included in the nursing home model and then sequentially adding additional factors related to caregiver characteristics and aspects of the caregiving experience that may make it more burdensome. Significant predictors are shown in Table 6. (See Appendix Table A3 and Table A4 for means of the added factors and full regression results.)
| TABLE 6. Marginal Effects of Caregiver Characteristics on the Likelihood that Caregiver is Highly Stresseda | ||
|---|---|---|
| Marginal Effect | P>|z| | |
| High physical strain from caregivingb | 0.208 | 0.000 |
| High financial strain from caregivingb | 0.100 | 0.000 |
| Recipient had behavior problems 3+ times last week | 0.097 | 0.000 |
| Caregiver is recipient's child | 0.095 | 0.000 |
| Caregiver's sleep was disturbed 3+ times last week | 0.076 | 0.002 |
| Caregiver's health is fair or poor | 0.065 | 0.000 |
| Caregiver is female | 0.049 | 0.007 |
| Help with caregiving needed | 0.043 | 0.020 |
| A break from caregiving/free time needed | 0.038 | 0.042 |
| Number of executive function-related limitations recipient has (out of 4)c | 0.022 | 0.003 |
| Caregiver has backup if needed | -0.045 | 0.004 |
| SOURCE: Stata svy:probit estimation using pooled data from the 1999 and 2004 NLTCS and companion ICS. NOTES:
| ||
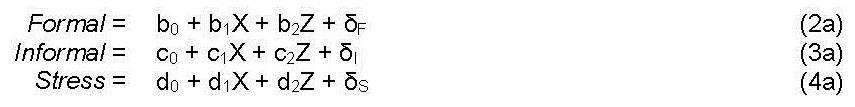
As in the earlier model, high physical strain is by far the strongest predictor, associated with a 20% increase in high stress. High financial strain is second, associated with a 10% increase in high stress, and is larger in magnitude and more highly significant in the pooled sample than it was for the 1999 sample alone. Both are potentially addressable through policies such as financial assistance, tax credits for caregivers, respite, or other direct caregiving assistance, and perhaps increased access to assistive devices or other technology. Also as in the earlier analysis, fair or poor caregiver health is an important factor but its marginal effect was far larger in magnitude before adding high physical strain from caregiving to the model. This finding may suggest that the mismatch between the recipient's needs and the caregiver's health as reflected in physical strain may be more important to consider in assessing caregiver burden or stress than health alone. In an alternative reduced form model (not reported), caregiver-reported hours of care provided, which were found to be strongly related to both larger negative aspects of caregiving and reduced caregiver subjective well-being in descriptive analysis of the analysis of the 2011 NHATS and NSOC (Spillman et al. 2014), had a larger positive association with high stress (22%) than that found for high physical strain in the reported model. Hours of care remained significant as measures of potential burdensomeness of caregiving were added to the model, but shrank in value to only 1.5%, and did not affect the magnitude of the effects of high physical or financial strain, shown in Figure 1. As in the predictions reported earlier, all other explanatory variables are left at their actual values to focus on the marginal contribution of physical and financial strain on the level of high stress among caregivers.
| FIGURE 1. Predicted Percent with High Stress by Presence of High Physical or Financial Strain |
|---|
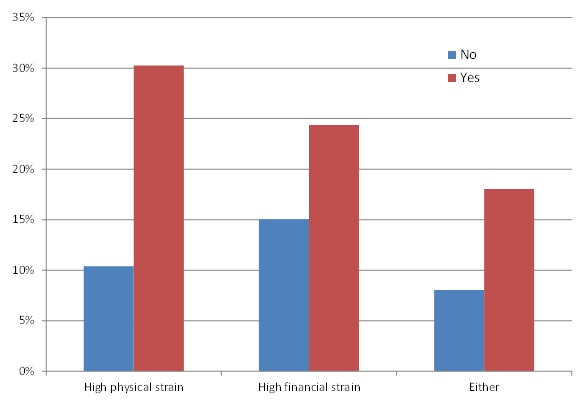 |
Table 7 shows simulated longer-stay nursing home entry and expected days of care for the 2004 cross-section under the assumption that interventions would be able to reduce physical and physical strain enough to eliminate high levels of each, in turn reducing the proportion of primary caregivers experiencing high stress from the prevailing rate of 18% (Table 1) to the simulated lower rates associated with not experiencing high strain shown in Figure 1. The simulations indicate that eliminating both high physical and financial strain would reduce admissions by 15.6% over 2 years and expected days by 19% if targeted to all caregivers, primarily due to the large reduction in high stress associated with physical strain. Targeting to caregivers for recipients with substantial disability would reduce admissions by 12.5% and days by 15.3%. Eliminating high financial strain alone would result in a 4%-5% reduction in admissions and a 5%-6% reduction in expected days of care.
| TABLE 7. Simulated Reduction in Nursing Home Entry from Reducing Sources of High Caregiver Stress | |||
|---|---|---|---|
| Within 1 Year | Within 18 Months | Within 2 Years | |
| Predicted Entry | |||
| Number of Care Recipients | 3,317,612 | 3,317,612 | 3,317,612 |
| Nursing Home Entry with Current Levels of Caregiver Stress | |||
| Number of entrants | 244,791 | 348,079 | 439,136 |
| Percent of care recipients | 7.4% | 10.5% | 13.2% |
| Simulated Impact of Intervention Reducing Stress Factors | |||
| Targeted to all caregivers | |||
| Eliminate high physical straina | 13.8% | 14.9% | 12.0% |
| Eliminate high financial hardshipa | 5.5% | 6.0% | 4.8% |
| Eliminate high physical strain and financial hardship | 17.9% | 19.4% | 15.6% |
| Targeted to caregivers for those with substantial disabilityb | |||
| Eliminate high physical straina | 11.1% | 12.1% | 9.7% |
| Eliminate high financial hardshipa | 4.3% | 4.7% | 3.7% |
| Eliminate high physical strain and financial hardship | 14.4% | 15.6% | 12.5% |
| Expected Days of Use | |||
| Expected Days of Use with Current Levels of Caregiver Stress | 13 | 25 | 38 |
| Total Days of Care (000s) | 43,905 | 82,578 | 127,669 |
| Simulated Impact of Intervention Reducing Stress Factors | |||
| Targeted to all caregivers | |||
| Eliminate high physical straina | 15.3% | 14.5% | 14.6% |
| Eliminate high financial hardshipa | 6.1% | 5.8% | 5.9% |
| Eliminate high physical strain and financial hardship | 19.8% | 18.9% | 19.0% |
| Targeted to caregivers for those with substantial disabilitya | |||
| Eliminate high physical straina | 12.3% | 11.7% | 11.8% |
| Eliminate high financial hardshipa | 4.8% | 4.5% | 4.6% |
| Eliminate high physical strain and financial hardship | 16.0% | 15.2% | 15.3% |
| SOURCE: Analysis of pooled data from the 1999 and 2004 NLTCS and companion ICS. NOTES:
| |||
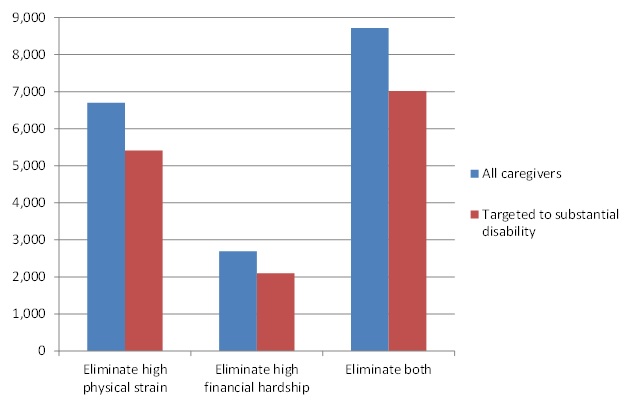
Figure 2 further illustrates the magnitude of the simulated reductions in nursing home use over a 1-year period resulting from reduced high caregiver stress accomplished by hypothetical interventions to eliminate high physical and financial strain. The simulated nearly 20% reduction in expected days of care over 1 year from elimination of high caregiver physical and financial strain among all caregivers would amount to of 8.7 million days of care avoided among the 3.3 million informal care recipients in 2004; 7 million days of care if high strain was eliminated for caregivers assisting recipients with substantial disability. For a 2-year period, the estimates would be 24 million and 19 million, respectively.
| FIGURE 2. Simulated Reduction in Nursing Home Days (000s) Over 1 Year from Reducing Physical or Financial Strain |
|---|
 |
DISCUSSION
The results in this analysis confirm findings from the previous study that substantial potential reductions in longer-stay nursing home entry would be possible if the rate of high stress among primary caregivers to the older population with disabilities could be reduced. Findings in this study are extended to examine the expected number of days of care that potentially could be avoided by effective interventions, which also are substantial. Simulations indicate that reducing caregiver stress below the high-stress threshold used in the analysis is associated with one-quarter to nearly one-third fewer admissions to episodes of at least 60 days over a 1-year period, depending on the target population of caregivers, and with 29%-36% fewer expected days of nursing home use. Reductions in high stress associated with eliminating high physical and financial strain are associated with reductions of 14%-18% in admissions over 1 year and reductions of 16% to nearly 20% in expected days of care, again depending on the target population. The implied 1-year nursing home savings associated with eliminating high caregiver stress would range from about $730 million to $1 billion, depending on targeting, if simulated total days of care are valued at $104, the minimum private nursing home per diem reported in Genworth's 2014 Cost of Care Survey (Genworth Financial, Inc. 2014).
Strengths of the analysis are the use of nationally representative data on the population age 65 or older who receive informal care in non-institutional settings and their informal caregivers and linked administrative data on nursing home use, rather than survey reports. Use of IV techniques avoids or at least reduces biases resulting from the joint determination of caregiver stress and care arrangements and unobserved factors that may affect both the key explanatory variables and the outcome. Results from the reduced form equations reported in the Appendix also provide useful information about the factors associated with formal and informal care provided and caregiver stress.
For example, the first stage regressions indicate that Medicaid enrollment at interview was associated with significantly higher formal care hours but had no significant association with informal care hours or caregiver stress. Interestingly, with controls for other characteristics of the recipient and caregiver, the number of ADL disabilities was associated with higher formal and informal care hours, and the presence of cognitive impairment was associated with higher informal care hours, but neither ADLs nor cognitive impairment was associated with high caregiver stress. As discussed earlier, in specifications not reported, hours of care provided by the primary caregiver is a significant predictor of high stress, but shrinks substantially in magnitude when other caregiver-specific factors such as fair or poor health or perceived physical strain are taken into account. And, in the nursing home model, higher total hours of care received from all informal caregivers was significantly associated with reduced nursing home entry, but was swamped by the large effect of high stress. Combined, these findings are consistent with the interpretation of findings in Savundranayagam et al. (2010) that the workload alone is not the major predictor of caregiver outcomes including nursing home placement.
The analysis has a number of limitations. Estimates of effects of formal and informal care hours and high stress still may be biased because the model cannot capture all relevant unobserved factors, notably changes in recipient needs and caregiver circumstances over time. The model shows strong results for caregiver stress, and tests indicate that instruments used are strong. Although the IV estimation results in the expected negative association of higher hours of informal care with nursing home entry, no significant association was found for formal care hours. This result may be attributable in part to the inability to distinguish recipient reported hours of formal care associated with long-term support from acute use of home health care. The simulations presented are, of course, stylized and should be interpreted as indicative of the potential outcomes of effective programs to support informal caregivers, rather than as estimates of the effects that could be achieved by actual interventions. The focus also is on the single outcome of nursing home placement, when other effects, such as improved health and well-being for recipient and caregiver, and potential reductions in other health care costs also are relevant. Finally, the analysis is not able to address the mechanisms though which interventions might accomplish reductions in high stress, physical or financial strain, or other factors associated with high stress, such as fair or poor caregiver health; the magnitude of effects from any actual intervention; or the cost of interventions that could accomplish reductions of the magnitude estimated.
Nevertheless, the estimates do provide evidence that expansion of successful strategies for supporting informal caregivers' efforts and reducing stress or burden has the potential to generate substantial savings. Evidence from previous research points to a number of forms supports might take and to the extent to which supports currently available fall short of the potential demand for them.
For example, increased access to respite care, caregiver training and counseling, and information about and assistance in accessing existing supports are included in the menu of supports offered through the ACL's NFCSP. An evaluation is underway to assess the NFCSP's effects on a number of outcomes, including the ability of recipients to remain in community settings, when desired by recipient and family members is (ACL 2014) and may be able to provide direct national evidence about the effectiveness of supports provided. NFCSP's funding has been flat at $154 million since 2008, however, and the program served 700,000 caregivers in 2010, far fewer than the 3.3 million primary caregivers and recipients in the present study, all of whom meet the program criterion of being a caregiver to a recipient age 60 or older, or even the 2 million caregivers to recipients with substantial disability.
Tabulations from the 2004 NLTCS/ICS suggest indicate that caregivers experiencing high stress already are significantly more likely to have used all caregiver supports included in the survey than were those reporting low to moderate stress (Appendix Table A5). Yet, only about 18% reported ever having received respite or other caregiver supports from a government source, while far larger proportions reported having used formal help with personal care or nursing (44%), made home modifications (41%), or obtained assistive devices for the care recipient (73%). Highly stressed caregivers also were significantly less likely to report that the formal care, home modifications, and assistive devices they used fully met their needs, which could indicate that service use was less than needed in amount or duration or that in some cases modifications or devices were not well-matched with the specific care recipient or caregiver needs. The survey questions do not assess whether use of the various supports is ongoing.
Accommodations such as assistive technology and home modifications well adapted to the particular care situation logically could contribute to more independent functioning by care recipients and potentially to reduced physical strain on caregivers. Only a handful of local NFCSPs focus on increasing access to assistive technologies and home modifications (Lewin Group 2012). However, according to a literature review conducted by these same researchers, a number of the studies reviewed found that use of assistive technologies was associated with reduced dependence on human assistance with daily activities, as did a 2013 study using the 2004 NLTCS (Anderson & Wiener 2013). Other research examining use of assistive technology among NLTCS respondents 1984-2004 (Spillman 2014) found a steady upward trend over this 20-year period, with recent increases concentrated among those also receiving human assistance. Descriptive findings indicated that within the nearly two in three community-residing respondents with disabilities who used both help and devices, those who were able to accommodate limitation in at least one activity with devices alone received significantly fewer hours of care per week. Multivariate analysis confirmed that independent device use for at least one activity was significantly associated with lower hours of care after controlling for disability level and other characteristics, but not with higher rates of reported unmet need for care. These results suggest that interventions to assist care recipients and their caregivers in identifying and acquiring appropriate devices and other environmental accommodations might be able to reduce hours of formal and informal care needed and reduce informal caregiver burden, without increasing unmet need.
Many state Medicaid programs offer home and community-based services (HCBS) waiver coverage that includes a broader range of assistive technologies (including ramps and other home modifications) than the most often used devices that are covered under Medicare's durable medical equipment benefit. Research on funding for assistive technologies and home modifications via Medicaid HCBS waivers (Kitchener et al. 2008) found, however, that few HCBS waiver participants actually received authorization to receive assistive technology or home modifications and that authorizations occurred disproportionately for participants in waiver programs for individuals with intellectual developmental disabilities rather than for participants in waivers targeted toward aged/disabled Medicaid beneficiaries at risk of nursing home placement.
Previous research on various supports, including counseling, support groups, training and health education programs, has found that they can be effective in addressing sources of caregiver stress, delaying institutionalization, and reducing use of other health services. But most studies have been based on small samples and most often focus on dementia caregivers (see Spillman & Long 2009). A recent review of the literature on dementia caregivers concluded, however, that the most effective interventions in reducing stress or burden, improving quality of life, and delaying institutionalization were likely to be multifactorial and tailored to the individual situation of the recipient and caregiver (Etters, Goodall & Harrison 2008). Similarly, findings from Savundranayagam et al. (2010) highlight that caregiving burden or stress has multiple components and that to be effective interventions likely need to take into account which components are most important for the specific caregiver.
In recent years, advocates for family caregivers (e.g., the Family Caregiver Alliance, AARP's Public Policy Institute) have called for targeting more publicly-funded services and supports directly to the needs of family caregivers, as distinct from the predominant focus of Medicaid and most other public programs on the functional assistance needs of their care recipients. Caregiver input has been identified as a key domain as states consider development of a uniform person-centered assessment tool for HCBS (Atkins & Gage 2014; Gage et al. 2014). As of the end of 2012, 15 states included some level of caregiver assessment, and several others were planning to do so, but about half the states had none (Kelly, Gibson & Feinberg 2013). Caregiver needs also can be incorporated through alternative Medicaid HCBS benefit models, such as a cash benefit or a "budget" (with flexible rules about allowable spending), which allow beneficiaries to choose the services and supports they think will most help them and their family caregivers, rather than a standard package of HCBS benefits. The Cash and Counseling Demonstration and Evaluation found that primary informal caregivers of treatment group members reported statistically significant reductions in indicators of stress associated with caregiving, including reductions in physical strain and financial hardship (Foster, Dale & Brown 2007). The evaluation also found significant reductions in nursing home use and costs over a 3-year follow-up period in Arkansas, the only one of the four evaluation states where the eligible population was dominated by older participants at risk for nursing home admission (Dale & Brown 2006).
CONCLUSION
The current analysis finds substantial potential savings from reduced nursing home use that might be accomplished by reducing the level of caregiver stress. Other research has found reductions in hours of care and caregiver burden associated with various supports, including the types offered through the Older Americans Act-funded NFCSP, use of assistive devices (some of which are or could be funded by Medicare or Medicaid), and home modifications (which can be Medicaid covered, at state option, under certain HCBS funding authorities). Besides the potential for reductions in costly nursing home care examined in this study, additional savings might accrue from other outcomes, such as such as improved health and well-being for recipient and caregiver, and potential reductions in other health care costs. Family caregivers increasingly are recognized as making direct contributions to the health of care recipients through their large role in helping with navigation of the health care system and direct health-related care. If such savings can be demonstrated, a clear case could be made that increased caregiver supports could achieve better outcomes without drawing from already limited program funding for long-term services and supports (LTSS). Making the link between findings in this analysis and the literature and actual applications would require evaluative studies that could provide direct evidence. One potential and feasible source of such evidence might be studies comparing service packages, costs, and nursing home placements for LTSS recipients in states that do and do not include caregiver assessment in Medicaid HCBS eligibility determination and care planning.
REFERENCES
Administration for Community Living (ACL). 2014. Evaluation of Title III-E National Family Caregiver Support Program (NFCSP). http://www.aoa.acl.gov/Program_Results/Program_Evaluation.aspx.
Anderson, W, and J Wiener. 2013. "The impact of assistive technologies on formal and informal home care." The Gerontologist. DOI:101093/gerontologist/gnt165, first published online December 30, 2013. http://gerontologist.oxfordjournals.org/content/early/2013/12/29/geront.gnt165.short.
Atkins, BL, and B Gage. 2014. The Need to Standardize Assessment Items for Persons in Need of LTSS. Long Term Quality Alliance. http://www.ltqa.org/wp-content/themes/ltqaMain/custom/images//LTQA-The-Need-to-Standardize-Assessment-Items-4-14-1.pdf.
Dale, S, and R Brown. 2006. "Reducing nursing home use through consumer-directed personal care services." Medical Care, 44(8): 760-767.
Etters, L, D Goodall, and BE Harrison. 2008. "Caregiver burden among dementia patient caregivers: A review of the literature." Journal of the American Academy of Nurse Practitioners, 20(8): 423-428.
Freedman, VA, and BC Spillman. 2014. "Disability and care needs of older Americans." Milbank Quarterly, 92(3), published online in advance of print: DOI10.1111_1468-0009.12076.
Foster, L, S Dale, and R Brown. 2007. "How caregivers and workers fared in Cash and Counseling, in putting consumers first in long-term care: Findings from the Cash & Counseling demonstration and evaluation." A Special Issue of HSR, AE Benjamin and ML Fennell, Guest Editors. HSR, 42(1) 2007 (February) Part II: 510-532.
Gage, B, GL Atkins, E Blair, and D Marion. 2014. Charting a Path Forward for Uniform Assessment of LTSS. Long Term Quality Alliance Round Table Report. http://www.ltqa.org/wp-content/themes/ltqaMain/custom/images//LTQA-Charting-A-Path-Forward-Report-Final-Report-6-10-14-.pdf.
Genworth Financial, Inc. 2014. Genworth 2014 Cost of Care Survey. https://www.genworth.com/dam/Americas/US/PDFs/Consumer/corporate/130568_032514_CostofCare_FINAL_nonsecure.pdf.
Johnson, R, and J Wiener. 2006. A Profile of Frail Older Americans and Their Caregivers. Washington, DC: Urban Institute.
Kasper, JD, U Steinbach, and J Andrews. 1994. "Caregiver role appraisal and caregiver tasks as factors in ending caregiving." J of Aging and Health, 6(3): 397-414.
Kaye, H, C Harrington, and M LaPlante. 2010. "Long-term care: Who gets it, who provides it, who pays, and how much?" Health Aff (Millwood), 29: 11-21.
Kitchener, M, T Ng, HY Lee, and C Harrington. 2008. "Assistive technology in Medicaid home-and community-based waiver programs." The Gerontologist, 48(2): 181-189.
Kelly, K, N Wolfe, MJ Gibson, and L Feinberg. 2013. Listening to Family Caregivers: The Need to Include Family Caregiver Assessment in Medicaid Home and Community Based Service Waiver Programs. AARP Public Policy Institute, December 2013. http://www.aarp.org/content/dam/aarp/research/public_policy_institute/ltc/2013/the-need-to-include-family-caregiver-assessment-medicaid-hcbs-waiver-programs-report-AARP-ppi-ltc.pdf.
Lewin Group. 2012. Accelerating Adoption of Assistive Technology to Alleviate Physical Strain Among Family Caregivers of the Chronically Disabled Elderly Living at Home. http://aspe.hhs.gov/report/accelerating-adoption-assistive-technology-reduce-physical-strain-among-family-caregivers-chronically-disabled-elderly-living-home.
National Alliance for Caregiving. 2009. Caregiving in the U.S.: A Focused Look at Those Caring for Someone Age 50 or Older. Sponsored by the National Alliance for Caregiving and AARP and funded by the MetLife Foundation. http://www.caregiving.org/pdf/research/FINALRegularExSum50plus.pdf.
Pinquart, M, and S Sorensen. 2007. "Correlates of physical health of informal caregivers: A meta-analysis." J Gerontol B Psychol Sci Soc Sci, 62: P126-37.
Pinquart, M, and S Sorensen. 2003. "Differences between caregivers and noncaregivers in psychological health and physical health: A meta-analysis." Psychol Aging, 18: 250-67.
Savundranayagam, MY, RJV Montgomery, and K Kosloski. 2010. "A dimensional analysis of caregiver burden among spouses and adult children."The Gerontologist, doi:10.1093/geront/gnq102.
Spillman, B. 2009, unpublished. Analyses of Caregiving Patterns and Caregiver Characteristics Using the 1999 and 2004 National Long-Term Care Surveys. Analyses conducted for the U.S. Department of Health and Human Services, Office of the Assistant Secretary for Planning and Evaluation, Office of Disability, Aging and Long-Term Care Policy.
Spillman, BC. 2014. Updated Analyses of Trends in Use of Assistive Devices. Report to the U.S. Department of Health and Human Services, Office of the Assistant Secretary for Planning and Evaluation, Office of Disability, Aging and Long-Term Care Policy. http://aspe.hhs.gov/report/updated-analyses-trends-use-assistive-devices.
Spillman, BC, and SK Long. 2009. "Does high caregiver stress predict nursing home entry?" Inquiry, 46(2): 140-161.
Spillman, B, J Wolff, V Freedman, and J Kasper. 2014. Informal Caregiving for Older Americans: An Analysis of the 2011 National Survey of Caregiving. Analyses conducted for the U.S. Department of Health and Human Services, Office of the Assistant Secretary for Planning and Evaluation, Office of Disability, Aging and Long-Term Care Policy./report/informal-caregiving-older-americans-analysis-2011-national-study-caregiving.
Tonner, MC, AJ LeBlanc, and C Harrington. 2001. "State long-term care screening and assessment programs." Home Health Care Services Quarterly, 19(3):57-85.
APPENDIX A. ADDITIONAL TABLES
| TABLE A1a. OLS Estimation: Admission to a Nursing Home Episode of 60 Days or Longer, Pooled 1999 and 2004 Dataa | ||||||
|---|---|---|---|---|---|---|
| Within 1 Year | Within 18 Months | Within 2 Years | ||||
| Coefficient | P>|t| | Coefficient | P>|t| | Coefficient | P>|t| | |
| Endogenous Regressors | ||||||
| Formal care hoursb | 0.004 | 0.088* | 0.003 | 0.233 | 0.0057 | 0.052* |
| Informal care hoursb | -0.004 | 0.233 | -0.005 | 0.210 | -0.0041 | 0.390 |
| Caregiver perceives high stressc | 0.041 | 0.019** | 0.047 | 0.016** | 0.0570 | 0.009** |
| Recipient Characteristics | ||||||
| Age | 0.0023 | 0.003** | 0.0032 | 0.000** | 0.0038 | 0.000** |
| Female | 0.0037 | 0.732 | -0.0017 | 0.877 | 0.0041 | 0.753 |
| White race | 0.0157 | 0.282 | -0.0002 | 0.992 | 0.0137 | 0.545 |
| High school graduate | 0.0160 | 0.247 | 0.0160 | 0.325 | 0.0173 | 0.327 |
| Some college | 0.0016 | 0.925 | 0.0032 | 0.858 | 0.0001 | 0.994 |
| Income last year $20,000 - $40,000 | 0.0093 | 0.553 | 0.0030 | 0.855 | 0.0089 | 0.636 |
| Income last year >$40,000 | -0.0225 | 0.188 | -0.0143 | 0.532 | -0.0110 | 0.641 |
| Enrolled in Medicaid | -0.0007 | 0.962 | -0.0095 | 0.590 | -0.0001 | 0.995 |
| HMO enrollee any month in the last 6 months | 0.0236 | 0.206 | 0.0176 | 0.370 | 0.0059 | 0.754 |
| Number of ADL disabilities (out of 6) | 0.0042 | 0.197 | 0.0045 | 0.247 | 0.0041 | 0.357 |
| Receives help with transfer/mobility most of the time | 0.0048 | 0.688 | -0.0052 | 0.740 | -0.0006 | 0.974 |
| Disability has lasted 1-5 years | 0.0050 | 0.778 | 0.0191 | 0.317 | 0.0259 | 0.217 |
| Disability has lasted 5 years or longer | 0.0086 | 0.616 | 0.0207 | 0.248 | 0.0248 | 0.231 |
| Cognitively impaired | 0.0310 | 0.040** | 0.0464 | 0.003** | 0.0528 | 0.003** |
| Obese | -0.0027 | 0.858 | -0.0101 | 0.561 | -0.0140 | 0.450 |
| Total inpatient hospital spending last 6 months ($)b | 0.0020 | 0.100* | 0.0034 | 0.010** | 0.0030 | 0.033** |
| Nursing Home Market and Area Characteristics | ||||||
| Nursing home beds per 1,000 persons 65+ (county of residence)d | -0.0002 | 0.516 | 0.0000 | 0.943 | -0.0002 | 0.800 |
| State Medicare nursing facility reimbursement per diem/mediane | 0.0400 | 0.450 | 0.1040 | 0.139 | 0.0856 | 0.286 |
| Physicians per 1,000 persons (county of residence)d | 0.0142 | 0.056* | 0.0173 | 0.030** | 0.0172 | 0.030** |
| Hospital beds per 1,000 persons (county of residence)d | -0.0002 | 0.868 | -0.0005 | 0.705 | -0.0013 | 0.369 |
| Northcentral region | 0.0104 | 0.676 | 0.0203 | 0.453 | 0.0083 | 0.789 |
| South | -0.0248 | 0.286 | -0.0076 | 0.785 | -0.0354 | 0.296 |
| West | -0.0517 | 0.070* | -0.0600 | 0.049** | -0.0806 | 0.018** |
| MSA | -0.0406 | 0.053* | -0.0257 | 0.221 | -0.0318 | 0.191 |
| Percent of population in poverty (country of residence)d | -0.0061 | 0.008** | -0.0081 | 0.003** | -0.0071 | 0.036** |
| Median household income (country of residence)d | -0.0033 | 0.015** | -0.0049 | 0.002** | -0.0044 | 0.011** |
| Percent of population age 65 or older (county of residence)d | 0.0044 | 0.253 | 0.0034 | 0.485 | 0.0048 | 0.346 |
| Proxy Respondent and Survival | ||||||
| Respondent is a proxy for sampled person | 0.0337 | 0.004** | 0.0465 | 0.001** | 0.0572 | 0.001** |
| Months of 2-year follow-up period survivedb | 0.0484 | 0.000** | 0.0582 | 0.000** | 0.0649 | 0.000** |
| Constant | -0.1093 | 0.230 | -0.1794 | 0.106 | -0.2625 | 0.037** |
| Sample Size | 2,394 | 2,394 | 2,394 | |||
| R2 | 0.059 | 0.064 | 0.073 | |||
| SOURCE: Stata svy:regress estimation using pooled data from the 1999 and 2004 NLTCS and companion ICS. NOTES:
**(*) Statistically different from 0 at the 5%(10%) level. | ||||||
| TABLE A1b. OLS Estimation: Expected Days of Longer-Stay Use, Pooled 1999 and 2004 Dataa | ||||||
|---|---|---|---|---|---|---|
| Within 1 Year | Within 18 Months | Within 2 Years | ||||
| Coefficient | P>|t| | Coefficient | P>|t| | Coefficient | P>|t| | |
| Endogenous Regressors | ||||||
| Formal care hoursb | 1.130 | 0.035** | 1.742 | 0.040** | 2.678 | 0.016** |
| Informal care hoursb | -0.565 | 0.395 | -1.244 | 0.257 | -2.207 | 0.160 |
| Caregiver perceives high stressc | 11.222 | 0.004** | 14.777 | 0.018** | 20.354 | 0.021** |
| Recipient Characteristics | ||||||
| Age | 0.3203 | 0.043** | 0.6914 | 0.006** | 1.0443 | 0.003** |
| Female | 0.9896 | 0.690 | 3.6284 | 0.340 | 4.6751 | 0.340 |
| White race | 2.0390 | 0.547 | 0.4972 | 0.928 | -2.2682 | 0.778 |
| High school graduate | 4.0774 | 0.200 | 4.8548 | 0.327 | 4.2496 | 0.528 |
| Some college | 1.6887 | 0.640 | 1.7365 | 0.757 | 1.2318 | 0.873 |
| Income last year $20,000 - $40,000 | -0.2237 | 0.941 | 0.7579 | 0.880 | 2.9175 | 0.676 |
| Income last year >$40,000 | -4.4523 | 0.251 | -4.5189 | 0.492 | -1.9525 | 0.834 |
| Enrolled in Medicaid | 1.9164 | 0.582 | 2.7646 | 0.627 | 3.7401 | 0.651 |
| HMO enrollee any month in the last 6 months | 3.4418 | 0.363 | 6.6894 | 0.269 | 6.6300 | 0.388 |
| Number of ADL disabilities (out of 6) | 0.6156 | 0.296 | 1.1798 | 0.246 | 1.9563 | 0.184 |
| Receives help with transfer/mobility most of the time | 2.3245 | 0.300 | 2.2307 | 0.538 | 1.7997 | 0.722 |
| Disability has lasted 1-5 years | -0.2488 | 0.948 | -0.0943 | 0.988 | 0.3568 | 0.967 |
| Disability has lasted 5 years or longer | -1.2172 | 0.735 | -2.8838 | 0.600 | -3.3850 | 0.644 |
| Cognitively impaired | 5.7254 | 0.061* | 12.6462 | 0.012** | 21.0112 | 0.002** |
| Obese | -0.3380 | 0.909 | -0.3794 | 0.939 | -1.6777 | 0.811 |
| Total inpatient hospital spending last 6 months ($)b | 0.4211 | 0.127 | 0.6728 | 0.097** | 0.8088 | 0.127 |
| Nursing Home Market and Area Characteristics | ||||||
| Nursing home beds per 1,000 persons 65+ (county of residence)d | -0.0205 | 0.824 | 0.0262 | 0.894 | 0.0547 | 0.856 |
| State Medicare nursing facility reimbursement per diem/mediane | -8.4439 | 0.508 | -6.8544 | 0.721 | -8.6688 | 0.759 |
| Physicians per 1,000 persons (county of residence)d | 3.4359 | 0.091* | 5.4026 | 0.094* | 6.7667 | 0.108 |
| Hospital beds per 1,000 persons (county of residence)d | -0.1989 | 0.381 | -0.2717 | 0.494 | -0.3740 | 0.529 |
| Northcentral region | 4.7695 | 0.356 | 10.3499 | 0.197 | 16.7052 | 0.120 |
| South | -5.2876 | 0.272 | -5.4524 | 0.457 | -7.6167 | 0.464 |
| West | -4.6893 | 0.451 | -7.9287 | 0.411 | -10.5599 | 0.408 |
| MSA | -7.2461 | 0.080* | -11.5626 | 0.071* | -14.2794 | 0.106 |
| Percent of population in poverty (country of residence)d | -1.3115 | 0.007** | -2.1997 | 0.009** | -2.5901 | 0.042** |
| Median household income (country of residence)d | -0.6487 | 0.031** | -1.0729 | 0.040** | -1.3167 | 0.078* |
| Percent of population age 65 or older (county of residence)d | 0.4505 | 0.598 | 0.3958 | 0.758 | 0.1408 | 0.933 |
| Proxy Respondent and Survival | ||||||
| Respondent is a proxy for sampled person | 5.3697 | 0.016** | 10.9818 | 0.002** | 16.2957 | 0.001** |
| Months of 2-year follow-up period survivedb | 10.7468 | 0.000** | 18.4706 | 0.000** | 27.0435 | 0.000** |
| Constant | 4.6782 | 0.813 | -15.2423 | 0.637 | -42.2713 | 0.370 |
| Sample Size | 2,394 | 2,394 | 2,394 | |||
| R2 | 0.060 | 0.068 | 0.076 | |||
| SOURCE: Stata svy:regress estimation using pooled data from the 1999 and 2004 NLTCS and companion ICS. NOTES:
**(*) Statistically different from 0 at the 5%(10%) level. | ||||||
| TABLE A2. First Stage Regressions from IV Models (entry and expected days), Pooled 1999 and 2004 Dataa | ||||||
|---|---|---|---|---|---|---|
| First Stage Regressions | ||||||
| Formal Hours | Informal Hours | High Stressb | ||||
| Coefficient | P>|t| | Coefficient | P>|t| | Coefficient | P>|t| | |
| Recipient Characteristics | ||||||
| Age | 0.0181 | 0.04** | -0.0131 | 0.00** | -0.0012 | 0.21 |
| Female | 0.3396 | 0.01** | -0.0740 | 0.41 | 0.0090 | 0.53 |
| White race | 0.1273 | 0.49 | 0.0830 | 0.51 | 0.0038 | 0.89 |
| High school graduate | 0.1324 | 0.33 | -0.0018 | 0.99 | 0.0004 | 0.98** |
| Some college | 0.3224 | 0.06* | -0.0576 | 0.58 | 0.0514 | 0.03 |
| Income last year $20,000 - $40,000 | 0.0795 | 0.61 | 0.1327 | 0.14 | -0.0194 | 0.34 |
| Income last year >$40,000 | 0.2604 | 0.24 | -0.0278 | 0.82 | -0.0472 | 0.09* |
| Enrolled in Medicaid | 0.6502 | 0.00** | 0.0838 | 0.45 | -0.0192 | 0.35 |
| HMO enrollee any month in the last 6 months | -0.1738 | 0.29 | 0.0097 | 0.94 | 0.0079 | 0.70 |
| Number of ADL disabilities (out of 6) | 0.2528 | 0.00** | 0.1668 | 0.00** | 0.0023 | 0.61 |
| Receives help with transfer/mobility most of the time | 0.4141 | 0.01** | 0.0425 | 0.60 | 0.0188 | 0.26 |
| Disability has lasted 1-5 years | -0.1454 | 0.52 | 0.2920 | 0.02** | 0.0029 | 0.91 |
| Disability has lasted 5 years or longer | -0.1950 | 0.45 | 0.2639 | 0.04** | 0.0012 | 0.97 |
| Cognitively impaired | 0.1675 | 0.31 | 0.1733 | 0.06* | 0.0035 | 0.86 |
| Obese | -0.1319 | 0.39 | 0.0040 | 0.96 | -0.0104 | 0.56 |
| Total inpatient hospital spending last 6 months ($)c | 0.0595 | 0.00** | 0.0165 | 0.02** | 0.0018 | 0.19 |
| Nursing Home Market and Area Characteristics | ||||||
| Nursing home beds per 1,000 persons 65+ (county of residence)d | 0.0024 | 0.68 | -0.0014 | 0.67 | -0.0002 | 0.65 |
| State Medicare nursing facility reimbursement per diem/mediane | -0.5118 | 0.41 | -0.1618 | 0.66 | -0.0400 | 0.60 |
| Physicians per 1,000 persons (county of residence)d | -0.0081 | 0.91 | -0.0579 | 0.06* | 0.0099 | 0.17 |
| Hospital beds per 1,000 persons (county of residence)d | -0.0553 | 0.01** | 0.0124 | 0.14 | 0.0027 | 0.41 |
| Northcentral region | -0.3688 | 0.03** | 0.1238 | 0.31 | -0.0299 | 0.26 |
| South | -0.4910 | 0.01** | 0.1867 | 0.14 | 0.0030 | 0.92 |
| West | -0.4774 | 0.02** | 0.0914 | 0.57 | 0.0128 | 0.68 |
| MSA | -0.0328 | 0.82 | 0.0239 | 0.84 | 0.0063 | 0.78 |
| Percent of population in poverty (country of residence)d | 0.0432 | 0.05** | 0.0350 | 0.01** | 0.0009 | 0.71 |
| Median household income (country of residence)d | 0.0091 | 0.42 | 0.0168 | 0.02** | 0.0005 | 0.72 |
| Percent of population age 65 or older (county of residence)d | -0.0416 | 0.25 | -0.0334 | 0.13 | -0.0053 | 0.18 |
| Proxy Respondent and Survival | ||||||
| Respondent is a proxy for sampled person | -0.2248 | 0.11 | 0.3240 | 0.00** | 0.0011 | 0.95 |
| Months of 2-year follow-up period survivedc | -0.0778 | 0.59 | -0.0831 | 0.39 | 0.0126 | 0.58 |
| Controls for Omitted Endogenous Variables | ||||||
| Home health agencies per 1,000 persons 65+ (county of residence)d | 0.8587 | 0.01** | -0.2438 | 0.26 | -0.0349 | 0.33 |
| Recipient lives in community resident care | 2.6421 | 0.00** | -1.6592 | 0.00** | -0.0289 | 0.31 |
| Number of executive function-related limitations (out of 4)f | 0.3596 | 0.00** | 0.1879 | 0.00** | 0.0279 | 0.00** |
| Year is 2004 | -0.3357 | 0.02** | -0.6131 | 0.00** | -0.0050 | 0.75 |
| Recipients lives alone | 1.5605 | 0.00** | -1.0170 | 0.00** | 0.0034 | 0.84 |
| Number of daughters living within 1 hour of recipientc | -0.0329 | 0.20 | 0.0592 | 0.00** | -0.0002 | 0.95 |
| Primary caregiver has minor children | -0.0197 | 0.94 | -0.1525 | 0.33 | 0.0601 | 0.07* |
| Caregiver reports caregiving is a physical straing | -0.0733 | 0.54 | 0.0932 | 0.33 | 03054 | 0.00** |
| Recipient had behavior problems 3+ times last week | 0.1180 | 0.37 | 0.1443 | 0.09* | 0.1442 | 0.00** |
| Constant | -6.0831 | 0.00** | 2.4561 | 0.00** | 0.0671 | 0.60 |
| Sample Size | 2,394 | 2,394 | 2,394 | |||
| R2 | 0.291 | 0.297 | 0.271 | |||
| Test of Excluded Instruments | P>F | P>F | P>F | |||
| Partial R2 | 0.08 | 0.10 | 0.18 | |||
| F(9, 107) | 41.75 | 0.00** | 32.86 | 0.00** | 46.74 | 0.00** |
| Shea's partial R2 | 0.14 | 0.18 | 0.21 | |||
| SOURCE: Stata svy:regress estimation using pooled data from the 1999 and 2004 NLTCS and companion ICS. NOTES:
**(*) Statistically different from 0 at the 5%(10%) level. | ||||||
| TABLE A3. Personal and Caregiving Characteristics of Primary Informal Caregivers, 1999 and 2004 | |||
|---|---|---|---|
| 1999 | 2004 | Pooled Samplea | |
| Personal Characteristics | |||
| Caregiver Demographics | |||
| Age | 62.0 | 62.2 | 62.3 |
| Relationship to recipient | |||
| Son | 0.14 | 0.15 | 0.15 |
| Daughter | 0.37 | 0.35 | 0.36 |
| Spouse | 0.37 | 0.37 | 0.37 |
| Other | 0.12 | 0.12 | 0.12 |
| Female | 0.67 | 0.64 | 0.65 |
| Non-spouse caregiver has minor children | 0.10 | 0.07* | 0.08 |
| Non-spouse caregiver is married | 0.34 | 0.34 | 0.35 |
| Caregiver Stress | |||
| Mean level of stress (scale of 1-10) | 3.46 | 3.31 | 3.38 |
| Percent with stress level 3 | 0.59 | 0.64** | 0.62 |
| Percent with stress level >3 | 0.19 | 0.17 | 0.18 |
| Caregiver Health | |||
| Health is fair or poor | 0.30 | 0.28 | 0.28 |
| Health is worse since began caregiving | 0.13 | 0.14 | 0.14 |
| Caregiving Characteristics | |||
| Amount of Care Provided | |||
| Hours provided in a typical week | 29.97 | 28.96 | 29.04 |
| 20 hours or more in a typical week | 0.50 | 0.45* | 0.47 |
| Number of ADLs caregiver helps with | 1.48 | 1.44 | 1.45 |
| Number of IADLs caregiver helps with | 5.36 | 5.10** | 5.17 |
| Intensity of Caregiving Demands | |||
| Recipient can be left alone at home 2 hours | 0.34 | 0.32 | 0.32 |
| Recipient can be left alone in room 2 hours | 0.17 | 0.14* | 0.15 |
| Caregiver sleep disturbed 3+ times last week | 0.17 | 0.16 | 0.17 |
| Recipient had behavior problems 3+ times last week | 0.35 | 0.37 | 0.37 |
| Caregiver has backup if needed | 0.58 | 0.65** | 0.62 |
| Caregiving History | |||
| Has provided care for 2+ years | 0.70 | 0.71 | 0.70 |
| Level of caregiving has increased | 0.51 | 0.54 | 0.53 |
| Types of Help Caregiver Has Ever Used | |||
| Paid help with caregiving | 0.41 | 0.35** | 0.37 |
| Paid help with IADLs | 0.32 | 0.32 | 0.33 |
| Assistive devices or home modifications | 0.57 | 0.62* | 0.59 |
| Physical and Financial Demands of Caregiving | |||
| Caregiving is a financial hardship (3+ on a scale of 5) | 0.26 | 0.20** | 0.22 |
| Caregiving is a physical strain (3+ on a scale of 5) | 0.31 | 0.28 | 0.29 |
| Caregiver's Reported Needs | |||
| Nothing needed | 0.32 | 0.51** | 0.44 |
| Help with caregiving | 0.20 | 0.21 | 0.20 |
| A break from caregiving/free time | 0.21 | 0.16** | 0.18 |
| Financial help | 0.33 | 0.23** | 0.27 |
| Sample Size | 956 | 1,456 | 2,230 |
| SOURCE: Tabulations of data from the 1999 and 2004 NLTCS and companion ICS. NOTE:
**(*) Statistically different from the 1999 value at the 5%(10%) level in a two-tailed test. | |||
| TABLE A4. Probit Estimation of the Reduced Form Model of High Caregiver Stressa | ||||||||||
|---|---|---|---|---|---|---|---|---|---|---|
| Marginal Effect | P>|z| | Marginal Effect | P>|z| | Marginal Effect | P>|z| | Marginal Effect | P>|z| | Marginal Effect | P>|z| | |
| Recipient Characteristics | ||||||||||
| Age | -0.002 | 0.028** | -0.004 | 0.001** | -0.003 | 0.015** | -0.003 | 0.005** | -0.002 | 0.017** |
| Female | -0.012 | 0.509 | -0.008 | 0.694 | 0.008 | 0.689 | 0.010 | 0.593 | 0.013 | 0.426 |
| White race | -0.003 | 0.921 | -0.003 | 0.920 | -0.009 | 0.750 | -0.007 | 0.810 | -0.014 | 0.562 |
| High school graduate | 0.001 | 0.972 | 0.012 | 0.614 | 0.010 | 0.660 | 0.009 | 0.681 | 0.020 | 0.381 |
| Some college | 0.040 | 0.168 | 0.053 | 0.072* | 0.044 | 0.117 | 0.042 | 0.130 | 0.054 | 0.060* |
| Income last year $20,000 - $40,000 | -0.033 | 0.116 | -0.011 | 0.591 | -0.002 | 0.934 | -0.007 | 0.730 | 0.006 | 0.792 |
| Income last year >$40,000 | -0.059 | 0.010** | -0.031 | 0.214 | -0.022 | 0.379 | -0.022 | 0.379 | -0.004 | 0.885 |
| Enrolled in Medicaid | 0.010 | 0.662 | -0.009 | 0.660 | -0.008 | 0.73 | -0.016 | 0.431 | -0.026 | 0.106 |
| HMO enrollee any month in the last 6 months | 0.024 | 0.354 | 0.024 | 0.351 | 0.031 | 0.232 | 0.021 | 0.410 | 0.014 | 0.484 |
| Number of ADL disabilities (out of 6) | 0.019 | 0.000** | 0.017 | 0.001** | 0.008 | 0.117 | 0.006 | 0.241 | 0.000 | 0.930 |
| Receives help with transfer/mobility most of the time | 0.017 | 0.381 | 0.022 | 0.236 | 0.022 | 0.237 | 0.018 | 0.321 | 0.010 | 0.577 |
| Disability has lasted 1-5 years | 0.013 | 0.663 | 0.004 | 0.885 | 0.008 | 0.776 | 0.012 | 0.663 | 0.013 | 0.602 |
| Disability has lasted 5 years or longer | 0.006 | 0.856 | 0.001 | 0.979 | -0.002 | 0.956 | 0.003 | 0.928 | 0.006 | 0.831 |
| Cognitively impaired | 0.029 | 0.201 | 0.036 | 0.113 | 0.007 | 0.719 | 0.013 | 0.526 | 0.012 | 0.493 |
| Obese | -0.023 | 0.206 | -0.025 | 0.144 | -0.024 | 0.186 | -0.022 | 0.207 | -0.028 | 0.090* |
| Total inpatient hospital spending last 6 months ($)b | 0.003 | 0.043** | 0.003 | 0.064* | 0.001 | 0.398 | 0.001 | 0.580 | 0.000 | 0.975 |
| Respondent is a Proxy for Sampled Person | 0.014 | 0.521 | 0.011 | 0.626 | 0.009 | 0.660 | 0.009 | 0.640 | -0.011 | 0.520 |
| Controls for Omitted Endogenous Regressors | ||||||||||
| Formal Care | ||||||||||
| Home health agencies per 1,000 persons 65+ in county of residencec | -0.042 | 0.346 | -0.032 | 0.483 | -0.052 | 0.230 | -0.054 | 0.202 | -0.042 | 0.269 |
| Recipient lives in community residential care | -0.054 | 0.040** | -0.050 | 0.046** | 0.004 | 0.881 | 0.016 | 0.617 | 0.017 | 0.595 |
| Number of executive function-related limitations (out of 4)d | 0.043 | 0.000** | 0.040 | 0.000** | 0.028 | 0.001** | 0.025 | 0.002** | 0.022 | 0.003** |
| Year is 2004 | 0.001 | 0.948 | 0.004 | 0.813 | -0.003 | 0.840 | -0.004 | 0.817 | 0.006 | 0.705 |
| Informal Care | ||||||||||
| Recipient lives alone | -0.027 | 0.160 | -0.032 | 0.068* | -0.012 | 0.506 | -0.012 | 0.523 | 0.005 | 0.762 |
| Number of daughters living within 1 hour of recipientb | 0.001 | 0.867 | -0.002 | 0.488 | -0.002 | 0.558 | -0.001 | 0.672 | -0.003 | 0.293 |
| Primary caregiver has minor children | 0.095 | 0.014** | 0.071 | 0.054* | 0.069 | 0.049** | 0.060 | 0.086* | 0.036 | 0.292 |
| Caregiver Characteristics | ||||||||||
| Caregiver is recipient's child | 0.084 | 0.000** | 0.082 | 0.000** | 0.078 | 0.000** | 0.095 | 0.000** | ||
| Caregiver is female | 0.070 | 0.001** | 0.060 | 0.002** | 0.052 | 0.009** | 0.049 | 0.007** | ||
| Caregiver's health is fair or poor | 0.141 | 0.000** | 0.097 | 0.000** | 0.095 | 0.000** | 0.065 | 0.000** | ||
| Intensity of Caregiving | ||||||||||
| Recipient had behavior problems 3+ times last week | 0.153 | 0.000** | 0.139 | 0.000** | 0.097 | 0.000** | ||||
| Recipient can be home alone for less than 2 hours | -0.016 | 0.480 | -0.013 | 0.585 | -0.022 | 0.310 | ||||
| Caregiver's sleep was disturbed 3+ times last week | 0.127 | 0.000** | 0.114 | 0.000** | 0.076 | 0.002** | ||||
| Caregiver has backup if needed | -0.086 | 0.000** | -0.073 | 0.000** | -0.045 | 0.004** | ||||
| Caregiver's Reported Needs | ||||||||||
| A break from caregiving/free time | 0.096 | 0.000** | 0.038 | 0.042** | ||||||
| Help with caregiving | 0.078 | 0.000** | 0.043 | 0.020** | ||||||
| Physical and Financial Demands | ||||||||||
| Caregiver reports high physical strain from caregivinge | 0.208 | 0.000** | ||||||||
| Caregiver reports high financial strain from caregivinge | 0.100 | 0.000** | ||||||||
| SOURCE: Stata svy:probit estimation using data from the 1999 and 2004 NLTCS and companion ICS. NOTES:
**(*) Statistically different from 0 at the 5%(10%) level. | ||||||||||
| TABLE A5. Support Service Use and Perceived Effectiveness by Caregiver | ||
|---|---|---|
| Low to Moderate Stress | High Stress | |
| Supports Caregivers Reported Using | ||
| Any respite or caregiver support from government source | 9.6 | 17.7** |
| Information about financial support for care recipient | 9.3 | 21.1** |
| Support group | 4.6 | 8.6** |
| Temporary care service | 6.7 | 17.0** |
| Adult day care | 4.0 | 8.0** |
| Formal help with personal care or nursing | 26.1 | 43.9** |
| Housework help | 17.3 | 23.8** |
| Meals service | 11.2 | 15.4* |
| Transportation | 10.4 | 16.8** |
| Home modifications | 26.1 | 41.2** |
| Assistive devices | 52.0 | 72.3** |
| Support Fully Met Caregiver Needs | ||
| Financial information | 38.7 | 30.8 |
| Support group | 48.8 | 51.8 |
| Temporary care service | 63.3 | 57.8 |
| Adult day care | 71.6 | 65.7 |
| Formal help with personal care or nursing | 73.3 | 51.5** |
| Housework help | 71.2 | 63.2 |
| Meals service | 56.8 | 39.6** |
| Transportation | 78.4 | 68.6 |
| Home modifications | 82.7 | 70.6** |
| Assistive devices | 80.9 | 73.9** |
| SOURCE: Analysis of data from the 2004 ICS. **(*) Statistically different from the value for low to moderate stress caregivers at the 5%(10%) level. | ||
This report was prepared under contract #HHSP23337033T between the U.S. Department of Health and Human Services (HHS), Office of Disability, Aging and Long-Term Care Policy (DALTCP) and the Urban Institute. For additional information about this subject, you can visit the DALTCP home page at http://aspe.hhs.gov/office-disability-aging-and-long-term-care-policy-daltcp or contact the ASPE Project Officer, Pamela Doty, at HHS/ASPE/DALTCP, Room 424E, H.H. Humphrey Building, 200 Independence Avenue, S.W., Washington, D.C. 20201. Their e-mail addresses are: Pamela.Doty@hhs.gov.