
Truven Health Analytics
Printer Friendly Version in PDF Format (60 PDF pages)
ABSTRACT
This project assessed changes in Opioid Use Disorder (OUD) treatment utilization and expenditures in the employer-sponsored private health insurance market at two timepoints, 2006-2007 and 2014-2015, that mark the periods before and after implementation of the Mental Health Parity and Addiction Equity Act (MHPAEA), the Affordable Care Act, the introduction and expanded use of new opioid treatment medications, and other initiatives to expand substance use disorder treatment access.
DISCLAIMER: The opinions and views expressed in this report are those of the authors. They do not necessarily reflect the views of the Department of Health and Human Services, the contractor or any other funding organization. This report was completed and submitted on March 30, 2018.
TABLE OF CONTENTS
- Data Sources
- Study Population
- Study Periods
- Health-Related Expenses
- Sample Characteristics
- Health-Related Expenses
- Coverage Changes Between 2007 and 2014
- Cost Trends in OUD Treatment Related to MAT
- Cost Trends in Other OUD Services
- Limitations
- Future Directions
APPENDICES
- APPENDIX A: ICD-9 and ICD-10 Diagnostic Codes for OUD
- APPENDIX B: NDC Codes Identifying MAT
- APPENDIX C: CPT, Revenue, and Healthcare Common Procedure Coding System Service Codes
LIST OF FIGURES
- FIGURE 1: Total Number of Enrollees in Large Employer-Sponsored Private Health Insurance Plans Who Have OUD, by Plan Type, 2004 and 2014
- FIGURE 2A: Change in Total Payments During the Study Period for the Receipt of an Ideal MAT Treatment Protocol for Enrollees in Large Employer-Sponsored Private Health Insurance Plans Who Have OUD, 2007, 2014, and 2018
- FIGURE 2B: Annualized Percent Change in Payments During the Study Period for the Ideal MAT Treatment Protocol for Enrollees in Large Employer-Sponsored Private Health Insurance Plans Who Have OUD, 2007-2014 and 2007-2018
- FIGURE 3A: Mean Co-payment for the Receipt of an Ideal MAT Treatment Protocol for Enrollees in Large Employer-Sponsored Private Health Insurance Plans Who Have OUD, 2007, 2014, and 2018
- FIGURE 3B: Annualized Percent Change in the Mean Co-payment for the Receipt of an Ideal MAT Treatment Protocol for Enrollees in Large Employer-Sponsored Private Health Insurance Plans Who Have OUD, 2007-2014 and 2007-2018
- FIGURE 4: Proportion of Insurance Plans Covering Common SUD Services, 2003 and 2010
- FIGURE 5: Cost of an Ideal 12-Month MAT Protocol by Health Plan Type if Services Were Delivered Entirely Out-of-Network
LIST OF TABLES
- TABLE 1: National Measures of Inflation and Wage Growth, in Percent
- TABLE 2: Types of Health-Related Expenses Considered in This Investigation
- TABLE 3: Attributes of Insurance Plan Types Examined in This Investigation
- TABLE 4: OUD Treatment Service Category Definitions
- TABLE 5: Inflation Factors Used to Calculate Projections
- TABLE 6A: Characteristics of Enrollees in Large Employer-Sponsored Private Health Insurance Plans Who Have OUD, Total and by Plan Type, 2007
- TABLE 6B: Characteristics of Enrollees in Large Employer-Sponsored Private Health Insurance Plans Who Have OUD, Total and by Plan Type, 2014
- TABLE 7A: Average Payment per Unit of Service in 2007, 2014, and 2018 for Enrollees in Large Employer-Sponsored Private Health Insurance Plans Who Have OUD, Annualized Percent Change Between 2007 and 2014, and Projected Change Through 2018
- TABLE 7B: Change in Total Payments During the Study Period for the Receipt of Services Outside of an Ideal MAT Treatment Protocol for Enrollees in Large Employer-Sponsored Private Health Insurance Plans Who Have OUD, 2007, 2014, and 2018
- TABLE 8A: Average Deductibles and Premiums for Employer-Sponsored Health Insurance from the 2007 and 2014 KEHB
- TABLE 8B: Combined Average Deductibles and Premiums for Employer-Sponsored Health Insurance from the 2007 and 2014 KEHB
- TABLE 9: Co-payments for the Receipt of Common OUD Treatments for Enrollees in Large Employer-Sponsored Private Health Insurance Plans Who Have OUD, 2007, 2014, and 2018
- TABLE 10: Mean Co-payment for Services for the Receipt of Common OUD Treatments Outside of an Ideal MAT Treatment Protocol for Enrollees in Large Employer-Sponsored Private Health Insurance Plans Who Have OUD, by Plan Type, 2007, 2014, and 2018
- TABLE 11: Co-insurance Rates for the Receipt of Common OUD Treatments for Enrollees in Large Employer-Sponsored Private Health Insurance Plans Who Have OUD, 2007 and 2014
- TABLE 12: Mean Co-insurance Rates for the Receipt of Common OUD Treatments Outside of an Ideal MAT Treatment Protocol for Enrollees in Large Employer-Sponsored Private Health Insurance Plans Who Have OUD, by Plan Type, 2007 and 2014
- TABLE 13: Median Out-of-Network Amount Paid for the Receipt of Common OUD Treatments for Enrollees in Large Employer-Sponsored Private Health Insurance Plans Who Have OUD, 2007 and 2014
- TABLE 14: Proportion of Service Received Out-of Network Services for Common OUD Treatments for Enrollees in Larger Employer-Sponsored Private Health Insurance Plans Who Have OUD, 2007 and 2014
- TABLE 15: Estimated Effect, per Enrollee in Large Employer-Sponsored Private Health Insurance Plans Who Have OUD, of Lack of Coverage on Out-of-Pocket Expenditures for Common OUD Treatment Services, by Plan Type, 2007 and 2014
- TABLE 16: Median Out-of-Network Amount Paid for the Receipt of Common OUD Treatments Outside of the Ideal MAT Treatment Protocol for Enrollees in Large Employer-Sponsored Private Health Insurance Plans Who Have OUD,by Plan Type, 2007, 2014, and 2018
ABSTRACT
This project assessed changes in the amount paid for medication-assisted treatment for opioid use disorder (OUD) across 2 years, 2007 and 2014, and projected the changes to 2018. These years were chosen because they include periods before and after implementation of federal legislation designed to increase access to general health care and behavioral health care, and they encompass a time when new medications to treat OUD were introduced. We used the Truven Health MarketScan® Commercial Claims and Encounters Database of private employer-sponsored health plans (enrollees aged 12-64 years). We also used data from the Kaiser Employer Health Benefits Survey and coverage trends from the Brandeis Health Plan Surveys. Using recommendations from the American Society of Addiction Medicine[1] and the Substance Abuse and Mental Health Services Administration,[2] we approximated the ideal treatment protocol for a typical individual with OUD, then approximated the total payments to physicians (combined insurance and out-of-pocket) to deliver that protocol. We found that the total payments for the ideal protocol rose from $5,927 to $6,886 based on the median price paid for each component. We found that the payments for nearly all types of OUD treatment services rose between 2007 and 2014, except for the payments for psychotherapy provided by psychiatrists or other physicians--a service for which the codes used for billing changed during the period under investigation making comparability difficult. The increase in the median payment for all other services, with the exception of outpatient detoxification, was greater than the increase in inflation during the study period. We also explored changes at the plan type level, and found that in 2014 a greater share of individuals with OUD were enrolled in plans with higher deductibles than in 2007, which would increase the out-of-pocket expenses experienced by those individuals. This increased out-of-pocket burden on patients may act as a barrier to optimal service utilization for individuals with OUD.
ACRONYMS
The following acronyms are mentioned in this report and/or appendices.
| ASAM | American Society of Addiction Medicine |
|---|---|
| BH | Behavioral Health |
| BLS | Bureau of Labor Statistics |
| CCAE | Commercial Claims and Encounters |
| CDHP | Consumer-Directed Health Plan |
| CPI | Consumer Price Index |
| CPT | Current Procedural Terminology |
| CSAT | SAMHSA Center for Substance Abuse Treatment |
| DX | Diagnosis code |
| ED | Emergency Department |
| EMTALA | Emergency Medical Treatment and Labor Act |
| FDA | Food and Drug Administration |
| FIL | Buccal Film |
| FQHC | Federally Qualified Health Center |
| GER | Gluteal Extended Release |
| HDHP | High-Deductible Health Plan |
| HMO | Health Maintenance Organization |
| ICD-9 | International Classification of Diseases, Ninth Revision |
| ICD-10 | International Classification of Diseases, Tenth Revision |
| IM | Intramuscular |
| KEHB | Kaiser Employer Health Benefits Survey |
| MAT | Medication-Assisted Treatment |
| MM | Mucous Membrane |
| N/A | Not Available |
| NDC | National Drug Code |
| NSD | Not Sufficient Data |
| OR | Odds Ratio |
| OUD | Opioid Use Disorder |
| POS | Point of Service |
| PPO | Preferred Provider Organization |
| Rev | Revenue code |
| RHC | Rural Health Clinic |
| Rx | Prescription fill |
| SAMHSA | Substance Abuse and Mental Health Services Administration |
| SD | Standard Deviation |
| SL | Sublingual |
| SUD | Substance Use Disorder |
| TAB | Tablet |
| TMS | Transcranial Magnetic Stimulation |
| Tx | Treatment code |
EXECUTIVE SUMMARY
Introduction
Out-of-pocket expenditures--the amount of money that patients are responsible for paying for their health care--are often a barrier to treatment for individuals with substance use disorders (SUDs).[3] The expenditures can include cost-sharing, which the U.S. Department of Health and Human Services website Healthcare.gov defines as "the share of costs covered by your insurance that you pay out of your own pocket. This term generally includes deductibles, co-insurance, and co-payments, or similar charges."[4] Out-of-pocket expenditures also include the amount paid for services for which an individual's insurance does not provide coverage, which would be all services for individuals with no insurance.
Our analysis estimated the typical components of out-of-pocket expenses experienced by individuals who receive medication-assisted treatment (MAT) for opioid use disorder (OUD) and are enrolled in one of the three most common types of insurance plans. Additionally, to help provide a fuller picture of the expenses individuals incur, we included the average premium and contributions associated with those plan types. The out-of-pocket expenses are calculated and premiums and contributions are identified for 2007 and 2014. The premiums and contributions then were projected for 2018, and the out-of-pocket expenses were evaluated for the projection.
We selected the years 2007 and 2014 because they represent timepoints before and after the implementation of two laws with provisions intended to improve coverage for SUD treatment. Existing research shows that these laws increased the proportion of plans that offer any coverage for OUD services.[5] However, less research has focused on the extent to which these laws influenced out-of-pocket expenditures from patients. The projected year of 2018 is in the near future, but it allows enough time for key aspects of the major legislation that was passed to be implemented. These projections trend 2014 data forward but do not account for changes such as new federal regulations or changes in recommended treatment that may occur in the interim.
Objectives
This optional component of the project is a supplement to the main task report and summarizes the out-of-pocket expenses faced by individuals with OUD by type (deductible, co-payment, co-insurance) for an individual receiving a standard, guideline-concordant episode of MAT treatment. We compared these changes to benchmarks for inflation and wage growths to understand whether insured individuals faced higher expenses over time. This report includes data tables for the years mentioned, including projections for the future.
Methods
Data. We used data from the Truven Health MarketScan® Commercial Claims and Encounters (CCAE) Research Database for calendar years 2007 and 2014. The MarketScan CCAE Database contains private insurance claims from approximately 150 large employers for employees, their dependents, and early retirees. It is the largest commercial convenience sample in the United States.
Study population. We included private employer-sponsored health plan members, which encompassed employees, spouses, and dependents aged 12-64 years. We excluded enrollees younger than 12 years because of the low prevalence of OUD and enrollees older than 64 years because of Medicare eligibility and the possibility of having secondary insurance. We required at least 10 out of 12 months of enrollment in each calendar year to capture a complete or nearly complete treatment picture for each individual. We excluded plans (and all of their enrollees) that lacked prescription drug claims because of the importance of having complete service records for each enrollee and the need to capture use of MAT. We subdivided our analysis into four plan types and then created a separate all-plan category. The four plan types were health maintenance organizations (HMOs), preferred provider organizations, point of service (POS) plans, and a combined group of consumer-directed health plans and high-deductible health plans (CDHP/HDHP). We excluded claims covered by capitated plans that did not include reimbursement information.
Study periods. This study assessed changes in the levels and types of out-of-pocket expenses for patients receiving OUD treatment paid by employer-sponsored health insurance plans at two points in time--one before (calendar year 2007, i.e., Time 1) and one after (calendar year 2014, i.e., Time 2) implementation of major federal legislation enacted to increase insurance coverage and expand access to coverage of behavioral health care. We also used the results of our Time 2 analysis to inform estimates of projected out-of-pocket costs in 2018.
Analytic file. Our analytic file was constructed at the claims level to allow us to report on utilization and spending in aggregate for each category of plan we considered, as well as at the individual level. We used source claims-level analytic files, which included all inpatient admissions, outpatient services, and prescription drug fills. We categorized the individual claims records to create service categories and to construct the financial variables. The summary spending variables totaled the amount paid for a service, which included the insurer payment and beneficiary out-of-pocket expense.
Variable definitions. We constructed variables to identify individuals with an OUD, to characterize the sample and health plans, and to define service types. Below we describe how we defined each of these variables.
-
Opioid use disorder. The analytic data files included members with an OUD, defined as either having an OUD diagnosis or receiving OUD treatment, presuming that individuals receiving treatment qualified for an OUD diagnosis even if the diagnostic code was missing from the claims record. Specifically, individuals were classified as having an OUD and included in the analytic files if they: (1) had two or more outpatient visits on different days or one inpatient stay with an OUD diagnosis in any claims field; (2) had a MAT prescription fill; or (3) had a MAT administration procedure code for buprenorphine/naloxone, naltrexone, or methadone.
-
Enrollee and plan characteristics. The analytic files included member age, sex, relationship to insured (employee, spouse, or dependent), and physical and behavioral health conditions. They also included the number of months enrolled and health plan type. We also included information on the type of health insurance plan for the four primary plan categories defined above.
-
Service categories. We classified all OUD treatment services into specific service categories using Current Procedural Terminology codes, revenue codes, Healthcare Common Procedure Coding System codes, prescription drug National Drug Codes, and codes to identify the place of service (e.g., physician's office). We defined the following service categories: inpatient treatment (including detoxification), outpatient detoxification, residential services, intensive outpatient or partial hospitalization services, emergency department visits, outpatient physician office visits, and psychotherapy. Use of MAT was captured through the prescription claims codes for buprenorphine and buprenorphine/naloxone.
-
Utilization. We created variables for the frequency of use for each of the OUD-related services considered within each of the four plan categories specified above, as well as across all insurance plan categories for which an individual had a diagnosed OUD.
-
Financial variables. From health expenses, defined below, we computed variables to reflect insurer and individual spending. This included the mean and median of expenditures for each category of services. The variables included total provider payment, co-payment amount, co-insurance rate, and whether the service was delivered in or out of the insurance plan's provider network. We also considered premium and deductible data from the Kaiser Employee Health Benefits Survey and plan coverage from the Brandeis Health Plan Surveys.
Types of health expenses. We considered many types of expenses that are related to health care for individuals with OUD. First, we considered the price paid for services. This price includes the amount paid by the insurer and the out-of-pocket expenses experienced by the plan beneficiary, including co-insurance and co-payments. These results were calculated using data from the MarketScan CCAE Database. Second, we considered the price of insurance (i.e., premium) and the plan deductibles. These data were collected from the Kaiser Employee Health Benefit Survey. We specifically considered the portion of the plan premium that employees were responsible for paying. Lastly, we considered changes in plan coverage over time using data from the Brandeis Health Plan Survey.
Analytical approach. We calculated the amount paid per service using the median total payment, combining insurer and beneficiary payments. This was done at the claims level across all insurance plan types, and then separately for each individual plan type. We calculated the co-payments charged for each service by calculating the mean co-payment charged for all services, as well as the median co-payment charged for services which charged any co-payment. We also considered trends in the proportion of services with any co-payment charged between 2007 and 2014. We calculated the mean co-insurance rate for each service, and the median co-insurance rate when any co-insurance was charged. As with co-payments, we evaluated whether there was a change in the proportion of services with any co-insurance charged over time. To calculate the payments for services not paid for by insurance, we considered median amount paid for each service when the service was provided outside of a beneficiary's insurance network. We estimated the impact of lack of coverage on the average patient by using data on the proportion of health plans that did not provide coverage for specific OUD services from the Brandeis Health Plan Survey. Based upon Time 2 total payments, co-payments, and out-of-network payments we projected results to future years using appropriate health sector specific adjustment factors from the Bureau of Labor Statistics.
Results
Using recommendations from the American Society of Addiction Medicine[6] and the Substance Abuse and Mental Health Services Administration,[7] we approximated the ideal treatment protocol for a typical individual with OUD as 18 physician office visits, 15 psychotherapy visits, and 12 monthly buprenorphine prescription fills. The amount paid for this bundle increased from $5,927 to $6,886 based on the median price paid for each component. This corresponded to a 2.2 percent annual increase on average, which was slightly above the average rate of inflation of 1.9 percent during that period. Moreover, there was a large increase in average plan deductibles and the proportion of premiums paid by employees during the study period. This resulted in patients experiencing larger amounts of health care costs before their insurance benefits took effect. The combination of the average deductible payment and the employee's share of the premium increased at rates ranging from 10.3 percent per year for individuals enrolled in HMOs to 4.8 percent per year for individuals enrolled in CDHPs/HDHPs. However, CDHPs/HDHPs had the highest baseline level of premiums and deductibles, and therefore they remained the most expensive for patients that reached the deductible during both study periods. Moreover, there was significant movement in our sample toward CDHP/HDHP insurance.
We found that even with higher deductibles, patients with OUD still experience significant levels of co-insurance, which may reflect that costs of care for individuals with OUD often exceed the deductible. In fact, we found that the mean level of co-insurance paid per unit of service for the most common opioid treatment services increased during the study period from 5 percent to 6 percent per visit for psychotherapy and from 1 percent to nearly 3 percent per buprenorphine prescription fill.
The levels of co-payments for services did not increase dramatically during our study period, which reflects the fact that other forms of cost-sharing have replaced co-payments in shifting service costs from insurers to patients. The mean payment for an office visit decreased from $13 to $11, and the mean payment for a buprenorphine/naloxone prescription fill decreased from $33 to $27. These results indicate that co-payments had less of an impact on patient expenditures over time relative to the growth in deductibles and co-insurance.
Results from the Brandeis Health Plan Survey indicated that insurance coverage for buprenorphine expanded dramatically during the period considered, particularly among POS and HMO health plans. Because of the high cost of buprenorphine for individuals without insurance coverage, this represents a massive out-of-pocket expense to patients that has been mitigated since legislation has changed.
Directions for Future Research
Our main task results revealed that the growth in the population with OUD exceeded the rate of growth in the number of individuals that use MAT treatment services, which may indicate that the expenses are deterring use. We have added to the literature on the cost of treatment for individuals receiving treatment for OUD, but additional research is needed to understand how much money individuals are willing to pay for OUD services. It is possible that individuals are more willing to pay for OUD treatment services now than in the past because the characteristics of the populations receiving treatment have changed or because the perceived value of treatment has risen. It is also important to consider the role of Medicaid in service use over time.
INTRODUCTION
This analysis is a supplement to the commercial opioid use disorder (OUD) main task report titled Use of Medication-Assisted Treatment (MAT) for Opioid Use Disorders in Employer-Sponsored Health Insurance. It estimated the typical components of out-of-pocket expenses experienced by individuals who received medication-assisted treatment (MAT) for OUD and who were enrolled in one of the three most common types of insurance plans. Additionally, to help provide a fuller picture of the expenses incurred by individuals, we included the average premium and contributions associated with those plan types. The out-of-pocket expenses were calculated and premiums and contributions are identified for 2007 and 2014.
We selected the years 2007 and 2014 because they represent timepoints before and after the implementation of two laws with provisions intended to improve coverage and access to SUD treatment. Existing research shows that these laws increased the proportion of plans that offer any coverage for OUD services.[8] However, less research has focused on the extent to which these laws influenced out-of-pocket expenditures for individuals with OUD.. The projected year of 2018 is in the near future, but it allows enough time after the passage of major legislation for spending trends to normalize. These projections trended 2014 data forward, but did not account for factors such as new federal regulations or changes in recommended treatments that may occur in the future.
OBJECTIVES
This Optional Task Analysis summarizes the health expenditures faced by individuals with OUD by type (premium, deductible, co-payment, co-insurance) for an ideal treatment protocol for OUD involving buprenorphine/naloxone MAT, as well as other related SUD treatment services such as detoxification. Using recommendations from the American Society of Addiction Medicine (ASAM)[9] and the Substance Abuse and Mental Health Services Administration (SAMHSA),[10] we attempted to quantify this protocol. The results are presented stratified by plan type where data were available. We compared the rates of changes to measures of inflation and wage growth during the same time periods. We also formulated projections of costs into future years. This report is a supplement to the main task report produced under this contract.
The Main Task Analysis Report[11] investigated changes in OUD treatment utilization and expenditures in the employer-sponsored private health insurance market at two timepoints (2006-2007 and 2014-2015), which overlap with the timepoints we consider. It contains results of an investigation to determine whether access to treatment among individuals with private insurance improved over time and to identify where treatment gaps (e.g., lack of coverage for specific types of services) and access barriers (e.g., high out-of-pocket costs) still may exist. It provided important information that is not considered in this report, because it analyzed service use at the treatment episode-level, rather than the claim level. Although the current analysis looked at the prices associated with various services and a hypothetical course of treatment, the analysis in the main report evaluated how treatment episodes for actual individuals in OUD care changed over time.
METHODS
Data Sources
We used the Truven Health MarketScan Commercial Claims and Encounters (CCAE) Research Database for calendar years 2007 and 2014. The MarketScan CCAE Database contains private insurance claims (primarily large group plans) from approximately 150 large employers for employees, their dependents, and early retirees. The MarketScan CCAE Database is the largest commercial convenience sample in the United States. Although the database has fluctuated in size and contributors over time, it has maintained the same age and sex distribution as reported by the U.S. Census Bureau for individuals with employer-sponsored insurance.
We included private employer-sponsored health plan members, which comprised employees, spouses, and dependents aged 12-64 years. We excluded enrollees younger than 12 years because of the low prevalence of OUD and enrollees older than 64 years because of Medicare eligibility and the possibility of having secondary insurance. We required at least 10 out of 12 months of enrollment in each calendar year to capture a complete or nearly complete treatment picture for each individual. We excluded plans (and all of their enrollees) that lacked prescription drug claims because of the importance of having complete service records for each enrollee and the need to capture use of MAT, and we excluded claims covered by capitated plans that did not include reimbursement information. Our unit of analysis was the medical claim. A claim is a bill for a specific service created by a provider and submitted to an insurer or patient. We did not track changes in individual expenditures over time; instead, we calculated the payments for treatment based on medical claims in two time periods.
We also used the results of the Brandeis Health Plan Surveys on Alcohol, Drug Abuse, and Mental Health Services.[12] These nationally representative surveys provide information and coverage on how various mental health and SUD treatment services offered by health insurance plans of various categories change over time.[13] We used a weighted sample methodology to determine that the 2003 survey represented 7,469 private health plans, and the 2014 survey represented 6,974 health plans.[14] Thus, the results are quite representative of insurance coverage in the United States. We used the estimated proportion of plans that provide coverage for "opioid treatment programs" reported in the Brandeis Health Plan Surveys[15] as a proxy measure of the proportion of insurance plans in each category that provided coverage for specialty OUD treatment coverage. Services considered specialty OUD treatment included residential, intensive outpatient or partial hospitalization, detoxification, and administration of methadone.
We also used data from the Kaiser Employer Health Benefits Survey (KEHB), for the years 2007 and 2014. This survey is conducted nationally and is representative of the insurance coverage available to privately and publicly employed individuals and their families in the United States. It includes information on premiums, deductibles, and cost-sharing and is gathered from a representative group of employers in the United States.[16]
Finally, we used inflation and wage growth data from the Bureau of Labor Statistics (BLS) to calculate estimated industry-specific rates of change to use for projecting our 2014 data to 2018 and as benchmarks against which to compare the changes between 2007 and 2014. The BLS develops national measures of inflation and wage growth that show how the income of the population, prices, and the value of money change over time. We used the BLS data to project wage growth so that we could determine whether prices were rising at a rate that exceeded the average person's ability to pay. We used inflation data to determine whether price changes represented true increases or just reflected a decrease in the value of a dollar over time. We also looked at BLS data to construct projections by health sector. This process is described in greater detail later in the report. The inflation rate and wage growth rate are presented in Table 1.
| TABLE 1. National Measures of Inflation and Wage Growth, in Percent | |||
|---|---|---|---|
| Service Category | Annualized 2007-2014 | Annualized 2014-2018 (projected) | Annualized 2007-2018 (projected) |
| BLS National Inflation Ratea | 1.9 | 0.9 | 1.6 |
| BLS Wage Growth Rateb | 2.4 | 2.3 | 2.4 |
| |||
Study Population
We included large private employer-sponsored health plan members, which encompassed employees, spouses, and dependents aged 12-64 years. We excluded enrollees younger than 12 years because of the low prevalence of OUD and enrollees older than 64 years because of Medicare eligibility and the possibility of having secondary insurance. We required at least 10 out of 12 months of enrollment in each calendar year to capture a complete or nearly complete treatment picture for each individual. We excluded plans (and all of their enrollees) that lacked prescription drug claims because of the importance of having complete service records for each enrollee and the need to capture use of MAT. We subdivided our analysis into four plan types and then created a combined all-plan category. The four plan types were health maintenance organizations (HMOs), preferred provider organizations (PPOs), point of service (POS) plans, and a combined group of consumer-directed health plans and high-deductible health plans (CDHPs/HDHPs); (see Table 3 for additional information on plan types). We excluded claims covered by capitated plans that did not include reimbursement information.
Study Periods
We assessed changes in the levels and types of out-of-pocket expenses for patients receiving OUD treatment paid by employer-sponsored health insurance plans during 2007 and 2014, which represent years before and after implementation of major health care legislation. We also used the results of our analysis to project expenses into 2018.
In Table 2, we list the types of out-of-pocket expenses considered, as well as the associated data sources used.
| TABLE 2. Types of Health-Related Expenses Considered in This Investigation | ||
|---|---|---|
| Expense Type | Description | Data Source |
| Deductibles | The amount patients must spend on their own clinical care before their health insurance benefits begin to pay for their treatmenta | Kaiser Employee Health Benefit Survey |
| Premiums | The price, typically paid by plan beneficiaries and their employers, to have insurance coverage for a given length of timea | Kaiser Employee Health Benefit Survey |
| Co-payments | A set amount beneficiaries pay for each unit of service they receiveda | MarketScan CCAE Database |
| Co-insurance | The proportion of the costs of health care that plan beneficiaries must pay after their deductible has been met, subtracting any co-payments | MarketScan CCAE Database |
| Expenditures on services not covered by insurance | The cost of treatment for a service that is not covered by an individual's insurance, or costs for an individual that lacks insurance | The estimated proportion of plans that provide coverage for "opioid treatment programs" reported in the Brandeis Health Plan Surveys |
| ||
We computed out-of-pocket expenditures for four primary categories of plans: PPOs, POS plans, HMOs, and a combined group of CDHPs/HDHPs.
As shown in Table 3, plans within each of these categories share costs with patients in different ways. For example, HDHPs, as the name suggests, have higher deductible levels. They offer limited coverage until the deductible amount is met, which was at least $1,300 for an individual or $2,600 for a family in 2016.[17] HMOs typically have low or no deductible or cost-sharing for services within their provider networks, but they may require higher premiums and provide negligible coverage for services delivered outside of their provider network. PPOs are a form of insurance that provides lower levels of cost-sharing for services delivered by in-network providers and higher levels of cost-sharing for services delivered outside of the provider network.
| TABLE 3. Attributes of Insurance Plan Types Examined in This Investigation | ||||
|---|---|---|---|---|
| Type of Plan | Average Deductible for Individual, $a | Requires Primary Care Provider | Needs Referrals | Covers Out-of- Network Care |
| HMO | 917 | Yes | Yes | No |
| PPO | 1,028 | No | No | Yes |
| HDHP | 2,199 | Varies | Varies | Varies |
| POS | 1,737 | No | No | Yes, but costlier |
| ||||
Ideal 12-Month MAT Treatment Protocol
We defined an ideal 12-month MAT treatment protocol on the basis of recommendations from ASAM,[18] the SAMHSA Center for Substance Abuse Treatment (CSAT),[19] and the report titled SUMMIT: Procedures for Medication-Assisted Treatment of Alcohol or Opioid Dependence in Primary Care produced by RAND Corporation.[20] Both CSAT and ASAM indicated that the maintenance phase should continue indefinitely. However, we conducted an analysis of TEDS data that indicated the median duration of treatment for individuals successfully completing MAT was less than 1 year,[21] so we estimated the expenditures on the basis of a year of treatment.
Both CSAT and ASAM guidelines indicated the potentially useful role that psychotherapy could offer in conjunction with opioid agonist treatment, though ASAM highlighted that evidence is mixed for its effectiveness relative to treatment by medication alone. In particular, cognitive behavioral therapy has been found to be useful as an adjunct to medication. According to the Mayo Clinic,[22] cognitive behavioral therapy typically involves 10-20 sessions; therefore, we assumed that 15 sessions were typical for a patient receiving MAT.
We determined that an ideal MAT treatment protocol for a 12-month period of OUD treatment should include the following:
-
Office-based induction with daily visits to assess efficacy of dosing (which is 3 days according to CSAT guidelines, though the SUMMIT guidelines suggest it could be 4 days).
-
Transitions to weekly visits after stable dosing is achieved.
-
Office visits to the provider continuing at least monthly during the maintenance phase after the patient becomes stable for 1 month.
For our calculations for the cost of an ideal MAT treatment protocol for a 12-month period of OUD treatment, we included the amount paid for the following:
-
Three daily physician office visits.
-
Four weekly physician office visits.
-
Eleven monthly visits to physician offices, for a total of 18 office visits.
-
Twelve months of buprenorphine/naloxone prescription fills for 28-30 days.
-
Fifteen visits to a behavioral health provider for psychotherapy (i.e., cognitive behavioral therapy).[23]
All Services Considered
In addition to the services included in the MAT treatment protocol, we also looked at costs for other OUD-related services, including inpatient stays, intensive outpatient treatment, detoxification services, and emergency department visits. These services are individualized and therefore are not included in the cost of an ideal treatment protocol. However, their high associated costs make them a relevant consideration when analyzing treatment-related expenses. The total list of services included in the analysis is in Table 4.
| TABLE 4. OUD Treatment Service Category Definitions | |
|---|---|
| Service Category | Definition |
| Inpatient, including detoxifications | Inpatient stays in hospitals, including those involving patients detoxifying from substances and not receiving further treatment |
| Outpatient detoxification | Detoxification services often delivered as residential, intensive outpatient, or partial hospitalization services |
| Residential treatment | Short-term and long-term residential treatment services |
| Intensive outpatient or partial hospitalization services | Intensive outpatient (e.g., day programs) or partial hospitalization (24 hour) services |
| Treat-and-release ED visits | ED visits that resulted in a discharge (i.e., did not end in an inpatient admission) |
| Outpatient visit | Evaluation, management, and other outpatient services not elsewhere classified |
| Psychotherapy | Psychotherapy delivered in an outpatient setting |
| Buprenorphine/naloxone prescription | Buprenorphine prescription drug fill of 28-30 days |
Health-Related Expenses
Amount Paid Per Service by the Insurer and the Beneficiary
We identified the amount paid for each of these services and for the MAT treatment protocol. We calculated the median amount paid using the claims data for each service overall and separately for each plan type. We excluded claims where the total amount paid was less than or equal to zero because we were only interested in the amount paid for a claim, not claims where the provider was not compensated or claims where the data may have been inaccurate. These amounts included the total amount paid by the insurer and the insured.
Deductibles and Premiums
We described deductibles and premiums reported in the KEHB for the four most common categories of plans (HMO, PPO, POS, CDHP/HDHP). This step involved summarizing the data on the premium and deductible amounts for each plan type reported in the KEHB for calendar years 2007 and 2014 to understand trends in insurance expenses, specifically in deductibles and premiums, over the study period.
In this section of the analysis, we also presented data from multiple sources regarding inflation, wage growth between 2007 and 2014, and projected growth in 2018. This information can be used to compare rates of change so that we can further understand whether there were real increases, as opposed to nominal changes. This process is especially important when looking at the wage growth data, because it allows us to understand how the change in health expenditures affect patients relative to changes in their expected earnings. For example, if expenditure growth exceeds wage growth, then the disposable income of individuals with OUD decreases over time as the proportion of their income devoted to medical expenditures increases.
Co-payment
In addition to the above, we identified the co-payment for services in each category listed in Table 4. For this stage, we used the claims data. When we calculated the average co-payment for a service in each category, we separately considered two things. First, to determine the impact of co-payments on the cost of the MAT treatment protocol, we used the mean co-payment per unit of service used by plan type. This was a weighted average that considered services where a co-payment was charged and services where a co-payment was not charged. The result reflected the cost of care from co-payments experienced by individuals using services, on average. Second, to determine the customary level of co-payments per service by plan type, we calculated the median co-payment for services for which a co-payment was charged.
As a supplementary analysis, we calculated to the proportion of services with a co-payment charged in each of the 2 years for which we had data. This allowed us to understand whether there was a change in the proportion of services with co-payments across points in time.
Co-insurance Amount Per Service
In addition to deductibles, co-payments, and premiums, co-insurance may represent an out-of-pocket cost to individuals receiving MAT. As with co-payments, we identified the co-insurance rate for services in each category listed in Table 4 using the MarketScan CCAE. Our methodology for calculating the co-insurance rate differed slightly from others described above.
Co-insurance, unlike the other costs to beneficiaries, is a proportion of the cost of a service after deductible and co-payments are excluded. Therefore, we calculated it by dividing the total co-insurance amount for a unit of service by the total price of that service after subtracting deductibles and co-payments.
As with co-payments, we calculated the mean co-insurance per unit of service (which is a weighted average and includes zeros), the proportion of services for which co-insurance was charged, and the median co-insurance rate for services for which any co-insurance was charged. This allowed us to explore trends in co-insurance levels, as well as the change the frequency of use and impact on clients with OUD.
Costs to the Uninsured and Rate of Out-of-Network Service Use
Individuals with insurance may be enrolled in plans that do not provide coverage for all services. Therefore, we attempted to quantify the costs of treatment for services not covered by insurance. Moreover, recent research has shown that a significant number of individuals receiving services from psychiatrists, relative to other health care providers, have had to receive this care out-of-network.[24] That same research indicates that the amount paid to providers is greater when a service is out-of-network than in-network. To evaluate this, we calculated rates of out-of-network service use in each year. We also calculated the amount paid for services by the uninsured by assuming that the uninsured would pay a rate comparable to the rate charged for out-of-network services, because these rates are not pre-negotiated by an insurance plan.
Additionally, we used the out-of-network price to calculate the cost to patients for specialty OUD treatment that insurance plans may not cover. This was necessary because insured individuals without coverage for specific services may be required to pay completely out-of-pocket for these services. We used the rates for the years reported that are closest to the years analyzed in our study from results of the Brandeis health insurance plan survey reported by Reif and colleagues.[25]
Projection to Future Years
To project costs in 2018, we used results of our analysis of the 2014 MarketScan data. We only created projections for data points for which we had sufficient data, defined as at least 10 services used by the study population during the year for which a claim was submitted to an insurer. We adjusted for inflation by using relevant BLS Consumer Price Index (CPI) categories. The category used for each service is presented in Table 5.
To develop the trend factors, available months of data were used from the 2014 midpoint (July 1, 2014) to the last available month (September 1, 2017). To create the factor to the midpoint of 2018 (July 1, 2018), a 3-month moving average was applied for the remaining time period. The mean and median values were projected as appropriate. The Health Insurance CPI factor[26] was the only factor that was not seasonally adjusted, because seasonal adjustment was not available. For factors where both seasonally adjusted and not seasonally adjusted estimates were available, the differences between the two were small.
| TABLE 5. Inflation Factors Used to Calculate Projections | |
|---|---|
| Service Category | Inflation Factor Used |
| Inpatient, including detoxification | Inpatient hospital servicesa |
| Outpatient detoxification | Outpatient hospital servicesb |
| Residential | Nursing homes and adult day servicesc |
| Intensive outpatient or partial hospitalization service | Outpatient hospital servicesb |
| Treat-and-release ED visit | Outpatient hospital servicesb |
| Outpatient visit for opioid disorder | Physician servicesd |
| Psychotherapy | Physician servicesd |
| Buprenorphine/naloxone prescription | Prescription drugse |
| |
RESULTS
Sample Characteristics
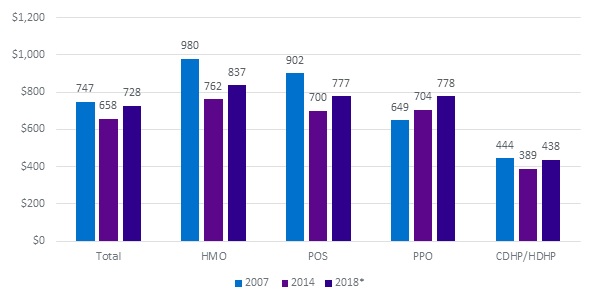
We report health plan enrollment statistics and sample characteristics in this section. There was a shift in the proportion of the population according to plan type (Figure 1). Compared with 2007, in 2014 a greater percentage of people were enrolled in HDHPs (from 1.9 percent to 17.7 percent), with a corresponding decrease in the percentage enrolled in HMOs and POS plans.
| FIGURE 1. Total Number of Enrollees in Large Employer-Sponsored Private Health Insurance Plans Who Have OUD, by Plan Type, 2004 and 2014 | |
|---|---|
| 2007 | 2014 |
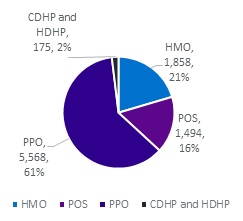 | 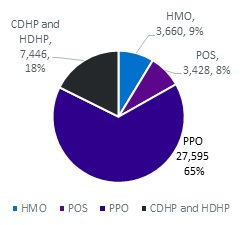 |
| SOURCE: Truven Health MarketScan CCAE Database, 2007, 2014. | |
Table 6A and Table 6B provide descriptive information about the eligible study samples for each of the two periods, overall and by plan type. In both years, the study sample was disproportionately male (56 percent in 2007, 59 percent in 2014). There do not appear to be significant differences in the plan type by the individual's sex, with each plan type being between 39 percent and 47 percent female in both study periods. There does not appear to be much evidence of discrimination in plan type by age, although the mean age is lowest in CDHPs and HDHPs in both periods. Individuals in PPO plans were disproportionately in the 45-64 age group in the 2007 sample. This age group accounted for 41 percent of the individuals in PPOs in 2007 (as opposed to 38 percent across all plan types). However, in 2014 the number of individuals aged 45-64 in PPOs was equal to the average across all plans in 2014, with 31 percent in each.
There was a large increase in the proportion of adults aged 19-26 enrolled as a dependent child/other on their insurance plan that both had OUD and accessed services in 2014 relative to 2007 (increasing from 12.0 percent to 27.9 percent).
| TABLE 6A. Characteristics of Enrollees in Large Employer-Sponsored Private Health Insurance Plans Who Have OUD, Total and by Plan Type, 2007 | ||||||||||
|---|---|---|---|---|---|---|---|---|---|---|
| Characteristics | Total N | Total % | HMO N | HMO % | POS N | POS % | PPO N | PPO % | CDHP/ HDHP N | CDHP/ HDHP % |
| Totals | 9,095 | 100.0 | 1,858 | 100.0 | 1,494 | 100.0 | 5,568 | 100.0 | 175 | 100.0 |
| Sex | ||||||||||
| Male | 5,109 | 56.2 | 1,064 | 57.3 | 838 | 56.1 | 3,114 | 55.9 | 93 | 53.1 |
| Female | 3,986 | 43.8 | 794 | 42.7 | 656 | 43.9 | 2,454 | 44.1 | 82 | 46.9 |
| Age Group | ||||||||||
| 12-17 | 414 | 4.6 | 82 | 4.4 | 63 | 4.2 | 256 | 4.6 | 13 | 7.4 |
| 18-44 | 5,209 | 57.3 | 1,160 | 62.4 | 921 | 61.6 | 3,023 | 54.3 | 105 | 60.0 |
| 45-64 | 3,472 | 38.2 | 616 | 33.2 | 510 | 34.1 | 2,289 | 41.1 | 57 | 32.6 |
| Among 19-26 | ||||||||||
| 19-26 (all covered) | 1,607 | 17.7 | 310 | 16.7 | 282 | 18.9 | 988 | 17.7 | 27 | 15.4 |
| 19-26 (dependent child/other) | 1,089 | 12.0 | 214 | 11.5 | 157 | 10.5 | 709 | 12.7 | 9 | 5.1 |
| Relationship to Insured | ||||||||||
| Employee | 4,126 | 45.4 | 820 | 44.1 | 729 | 48.8 | 2,500 | 44.9 | 77 | 44.0 |
| Spouse | 3,196 | 35.1 | 677 | 36.4 | 501 | 33.5 | 1,946 | 34.9 | 72 | 41.1 |
| Child/Other | 1,773 | 19.5 | 361 | 19.4 | 264 | 17.7 | 1,122 | 20.2 | 26 | 14.9 |
| Region | ||||||||||
| North East | 1,271 | 14.0 | 240 | 12.9 | 394 | 26.4 | 620 | 11.1 | 17 | 9.7 |
| North Central | 2,478 | 27.2 | 452 | 24.3 | 245 | 16.4 | 1,747 | 31.4 | 34 | 19.4 |
| South | 3,429 | 37.7 | 592 | 31.9 | 647 | 43.3 | 2,114 | 38.0 | 76 | 43.4 |
| West | 1,864 | 20.5 | 557 | 30.0 | 198 | 13.3 | 1,061 | 19.1 | 48 | 27.4 |
| Unknown | 53 | 0.6 | 17 | 0.9 | NSD | NSD | 26 | 0.5 | NSD | NSD |
| SOURCE: Truven Health MarketScan CCAE Database, 2007. | ||||||||||
| TABLE 6B. Characteristics of Enrollees in Large Employer-Sponsored Private Health Insurance Plans Who Have OUD, Total and by Plan Type, 2014 | ||||||||||
|---|---|---|---|---|---|---|---|---|---|---|
| Characteristics | Total N | Total % | HMO N | HMO % | POS N | POS % | PPO N | PPO % | CDHP/ HDHP N | CDHP/ HDHP % |
| Totals | 42,129 | 100.0 | 3,660 | 100.0 | 3,428 | 100.0 | 27,595 | 100.0 | 7,446 | 100.0 |
| Sex | ||||||||||
| Male | 24,980 | 59.3 | 2,229 | 60.9 | 1,951 | 56.9 | 16,369 | 59.3 | 4,431 | 59.5 |
| Female | 17,149 | 40.7 | 1,431 | 39.1 | 1,477 | 0.4 | 11,226 | 40.7 | 3,015 | 40.5 |
| Age Group | ||||||||||
| 12-17 | 783 | 1.9 | 76 | 2.1 | 59 | 1.7 | 468 | 1.7 | 180 | 2.4 |
| 18-44 | 8,208 | 67.0 | 2,432 | 66.4 | 2,168 | 63.2 | 18,477 | 67.0 | 5,131 | 68.9 |
| 45-64 | 13,138 | 31.2 | 1,152 | 31.5 | 1,201 | 35.0 | 8,650 | 31.3 | 2,135 | 28.7 |
| Among 19-26 | ||||||||||
| 19-26 (all covered) | 13,093 | 31.1 | 1,206 | 33.0 | 934 | 27.2 | 8,526 | 30.9 | 2,427 | 32.6 |
| 19-26 (dependent child/other) | 11,744 | 27.9 | 1,134 | 31.0 | 821 | 23.9 | 7,618 | 27.6 | 2,171 | 29.2 |
| Relationship to Insured | ||||||||||
| Employee | 16,540 | 39.3 | 1,332 | 36.4 | 1,488 | 43.4 | 10,974 | 39.8 | 2,746 | 36.9 |
| Spouse | 12,172 | 28.9 | 1,030 | 28.1 | 978 | 28.5 | 7,965 | 28.9 | 2,199 | 29.5 |
| Child/Other | 13,417 | 31.8 | 1,298 | 35.5 | 962 | 28.1 | 8,656 | 31.4 | 2,501 | 33.6 |
| Region | ||||||||||
| North East | 10,223 | 24.3 | 690 | 18.9 | 1,136 | 33.1 | 7,161 | 26.0 | 1,236 | 16.6 |
| North Central | 7,360 | 17.5 | 1,207 | 33.0 | 293 | 8.5 | 4,417 | 16.0 | 1,443 | 19.4 |
| South | 17,392 | 41.3 | 850 | 23.2 | 1,403 | 0.4 | 11,591 | 42.0 | 3,548 | 47.6 |
| West | 6,931 | 16.5 | 851 | 23.3 | 596 | 17.4 | 4,353 | 15.8 | 1,131 | 15.2 |
| Unknown | 223 | 0.5 | 62 | 1.7 | --- | 0.0 | 73 | 0.3 | 88 | 1.2 |
| SOURCE: Truven Health MarketScan CCAE Database, 2014. | ||||||||||
Health-Related Expenses
Amount Paid Per Service by the Insurer and the Beneficiary
Table 7A highlights the change in payments for the services considered across the study period and projected into 2018. Results indicate that the fastest rate of growth was the amount paid for residential treatment, with an average growth rate of 16.3 percent per year from 2007 through 2014.
The slowest rate of growth was observed for psychotherapy, which experienced a decline in payments at the median.
This result likely is explained by a change in Current Procedural Terminology (CPT®) codes,[27] which decreased the amount of reimbursement per minute of a psychotherapy visit by decoupling the evaluation and management component from the psychotherapy component. The slowest rate of growth in services for which the CPT codes did not change was in the amount paid for outpatient detoxification. In general, the results indicate an increase in the median amount paid for an OUD service that exceeds the inflation rate.
| TABLE 7A. Average Payment per Unit of Service in 2007, 2014, and 2018 (projected) for Enrollees in Large Employer-Sponsored Private Health Insurance Plans Who Have OUD, Annualized Percent Change Between 2007 and 2014, and Projected Change Through 2018 | |||||
|---|---|---|---|---|---|
| Service Category | 2007, $ | 2014, $ | Projected 2018, $ | Annualized % Change 2007-2014 | Annualized % Change 2007-2018 |
| Inpatient, including detoxification, per day | 896 | 1,200 | 1,415 | 4.3 | 4.2 |
| Outpatient detoxification, per day | 250 | 275 | 323 | 1.4 | 2.4 |
| Residential, per day | 156 | 450 | 510 | 16.3 | 11.4 |
| Intensive outpatient or partial hospitalization, per day | 180 | 345 | 406 | 9.7 | 7.7 |
| Treat-and-release ED visits (all visits that never become inpatient stays) | 328 | 756 | 889 | 12.7 | 9.5 |
| Outpatient office visit | 75 | 90 | 95 | 2.7 | 2.2 |
| Psychotherapy or behavioral therapy office visit | 79 | 67 | 71 | -2.4 | -1.0 |
| Buprenorphine or buprenorphine naloxone prescription fill | 283 | 355 | 417 | 3.3 | 3.5 |
| SOURCE: Truven Health MarketScan CCAE Database, 2007, 2014. | |||||
Figure 2A shows that the amount paid for the 12-month MAT treatment protocol grew at a rate slightly faster than the rate of inflation. The amount paid for the protocol grew an average of 2.2 percent per year across all plans between 2007 and 2014. Moreover, the growth of the total was much slower than the rate of growth in HMOs and POS plans. This is because in the second period the sample included a greater percentage of individuals enrolled in HDHP and PPO plans, which had lower amounts paid at baseline than the other plan types. These plans had lower unit payments for services than the other insurance plan types; therefore, as their share of the study sample increased, it reduced the rate of growth in the median unit payments for these services.
| FIGURE 2A. Change in Total Payments During the Study Period for the Receipt of an Ideal MAT Treatment Protocol for Enrollees in Large Employer-Sponsored Private Health Insurance Plans Who Have OUD, 2007, 2014, and 2018 (projected) |
|---|
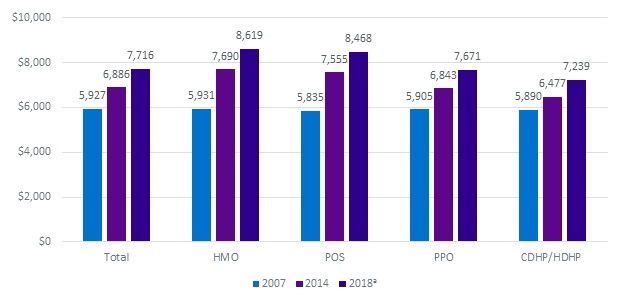 |
| SOURCE: Truven Health MarketScan CCAE Database, 2007, 2014. NOTE: We approximate an ideal treatment protocol containing three intake office visits, with buprenorphine administration (note the price of buprenorphine administration is not included in the ideal basket due to a lack of sufficient data on this measure for certain plan types), 4 weekly office visits, 12 months of buprenorphine medication, 11 monthly office visits, and 15 psychotherapy visits.
|
Another potential confounder was the change in CPT codes for psychotherapy. To assess the effects of this coding change, we conducted a sensitivity analysis restricted to psychotherapy provided by psychologists and social workers. These individuals provide most of psychotherapy to the MarketScan population and were not affected by the change in billing codes, which did not change billing for non-physician clinicians. The result was that the growth in the amount paid for the protocol grew at a rate slightly above the rate of inflation.
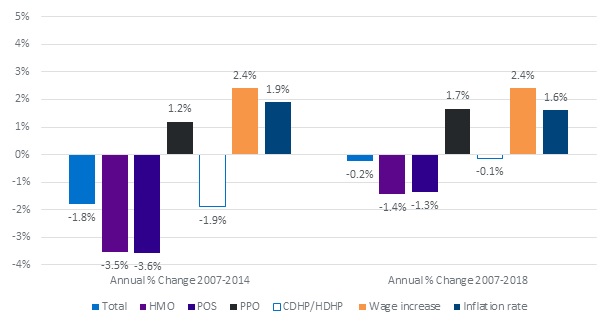
| FIGURE 2B. Annualized Percent Change in Payments During the Study Period for the Ideal MAT Treatment Protocol for Enrollees in Large Employer-Sponsored Private Health Insurance Plans Who Have OUD, 2007-2014 and 2007-2018 (projected) |
|---|
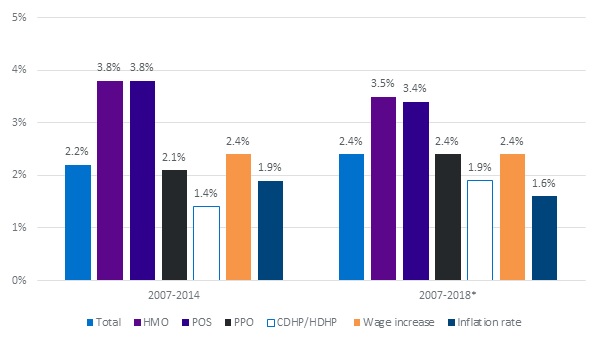 |
| SOURCE: Truven Health MarketScan CCAE Database, 2007, 2014. NOTE: We approximate an ideal treatment protocol containing 3 intake office visits, with buprenorphine administration (note the price of buprenorphine administration is not included in the ideal basket due to a lack of sufficient data on this measure for certain plan types), 4 weekly office visits, 12 months of buprenorphine medication, 11 monthly office visits, and 15 psychotherapy visits. |
Between 2007 and 2014, there was annualized growth in the combined insurance and out-of-pocket payments for the three most common services outside of the MAT treatment protocol, across all insurance plan types (Table 7B). The largest growth in the amount paid for inpatient treatment was observed for PPOs, with a rate of 5.1 percent during that period; the least growth was observed for HMOs, with a rate of 0.9 percent. The largest growth in the amount paid for intensive outpatient treatment was observed within PPOs, with a rate of 10.8 percent during that period; the least growth was observed for HMOs, with a rate of 3.8 percent. The largest growth in the amount paid for treat-and-release emergency department (ED) treatment was observed within PPOs, with a rate of 15.1 percent during that period; the least growth was observed for POS plans, with a rate of 7.5 percent. This same trend is projected to continue between 2014 and 2018, with data indicating an increase in total payments for the three services across this time period.
| TABLE 7B. Change in Total Payments During the Study Period for the Receipt of Services Outside of an Ideal MAT Treatment Protocol for Enrollees in Large Employer-Sponsored Private Health Insurance Plans Who Have OUD, 2007, 2014, and 2018 (projected) | ||||||
|---|---|---|---|---|---|---|
| Plan Type | Service Category | Median 2007, $ | Median 2014, $ | Median 2018, $ (projected) | Annualized % Change 2007-2014 | Annualized % Change 2007-2018 (projected) |
| HMO | Inpatient, including detoxification, per day | 978 | 1043 | 1230 | 0.9 | 2.1 |
| HMO | Intensive outpatient or partial hospitalization per day | 200 | 260 | 306 | 3.8 | 3.9 |
| HMO | Treat-and-release ED visits (all visits that never become inpatient stays) | 445 | 745 | 876 | 7.6 | 6.3 |
| PPO | Inpatient, including detoxification, per day | 850 | 1205 | 1421 | 5.1 | 4.8 |
| PPO | Intensive outpatient or partial hospitalization per day | 172 | 354 | 416 | 10.8 | 8.3 |
| PPO | Treat-and-release ED visits (all visits that never become inpatient stays) | 289 | 772 | 908 | 15.1 | 11.0 |
| POS | Inpatient, including detoxification, per day | 922 | 1162 | 1370 | 3.4 | 3.7 |
| POS | Intensive outpatient or partial hospitalization per day | 175 | 285 | 335 | 7.2 | 6.1 |
| POS | Treat-and-release ED visits (all visits that never become inpatient stays) | 404 | 672 | 790 | 7.5 | 6.3 |
| CDHP/HDHP | Inpatient, including detoxification, per day | 948 | 1302 | 1535 | 4.6 | 4.5 |
| CDHP/HDHP | Intensive outpatient or partial hospitalization per day | 256 | 383 | 450 | 5.9 | 5.3 |
| CDHP/HDHP | Treat-and-release ED visits (all visits that never become inpatient stays) | 280 | 729 | 857 | 14.7 | 10.7 |
| SOURCE: Truven Health MarketScan CCAE Database, 2007, 2014. | ||||||
Deductibles and Premiums
Table 8A reveals how deductibles and premiums changed during the study period. Between 2007 and 2014, annualized deductibles increased for all types of health plans at a rate faster than inflation. The greatest increase in both percentage terms and in total dollar value occurred in HMOs. Premiums rose faster than inflation during the study period, as did the payments for insurance to the employer and to the beneficiary. PPOs had the slowest rate of premium growth, and HMOs had the fastest rate of growth. The highest total deductibles were in CDHPs/HDHPs, and PPOs had the lowest. However, even though the PPO had the most generous plan in terms of deductibles for individuals on single-person coverage, it still required surmounting a deductible of $843 on average, which was an increase of 83 percent from 2007.
| TABLE 8A. Average Deductibles and Premiums for Employer-Sponsored Health Insurance from the 2007 and 2014 KEHB | |||||||
|---|---|---|---|---|---|---|---|
| Plan Type | All Regions | 2007, Single, $ | 2007, Family, $ | 2014, Single, $ | 2014, Family, $ | Annual Race of Change 2007-2014, Single, % | Annual Race of Change 2007-2014, Family, % |
| HMO | Deductible | 401 | 759 | 1,032 | 2,328 | 14.5 | 17.4 |
| HMO | Premium | 4,299 | 11,879 | 6,223 | 17,383 | 5.4 | 5.6 |
| HMO | Individual cost | 711 | 3,311 | 1,182 | 5,254 | 7.5 | 6.8 |
| HMO | Employer contribution | 3,588 | 8,568 | 5,041 | 12,129 | 5.0 | 5.1 |
| POS | Deductible | 621 | 1,359 | 1,215 | 2,470 | 10.1 | 8.9 |
| POS | Premium | 4,337 | 11,588 | 6,166 | 16,037 | 5.2 | 4.8 |
| POS | Individual cost | 628 | 3,659 | 984 | 4,849 | 6.6 | 4.1 |
| POS | Employer contribution | 3,709 | 7,929 | 5,182 | 11,188 | 4.9 | 5.0 |
| PPO | Deductible | 461 | 1,040 | 843 | 1,954 | 9.0 | 9.4 |
| PPO | Premium | 4,638 | 12,443 | 6,217 | 17,333 | 4.3 | 4.8 |
| PPO | Individual cost | 717 | 3,236 | 1,134 | 4,877 | 6.8 | 6.0 |
| PPO | Employer Contribution | 3,921 | 9,207 | 5,083 | 12,456 | 3.8 | 4.4 |
| HDHP* | Deductible | 1,729 | 3,596 | 2,215 | 4,522 | 3.6 | 3.3 |
| HDHP* | Premium | 3,869 | 10,693 | 5,299 | 15,401 | 4.6 | 5.4 |
| HDHP* | Individual cost | 522 | 2,856 | $905 | 4,385 | 8.2 | 6.3 |
| HCHP* | Employer contribution | 3,347 | 7,837 | 4,394 | 11,016 | 4.0 | 5.0 |
| SOURCES: Henry J. Kaiser Family Foundation and Health Research & Educational Trust (2007). Employer Health Benefits 2007 Annual Survey. Henry J. Kaiser Family Foundation and Health Research & Educational Trust. Retrieved from: https://kaiserfamilyfoundation.files.wordpress.com/2013/04/76723.pdf. Henry J. Kaiser Family Foundation and Health Research & Educational Trust (2014). Employer Health Benefits 2014 Annual Survey. Henry J. Kaiser Family Foundation and Health Research & Educational Trust. Retrieved from: https://kaiserfamilyfoundation.files.wordpress.com/2014/09/8625-employer-health-benefits-2014-annual-survey6.pdf. * HDHP with savings option. | |||||||
Given that the deductibles were always below the cost of treatment for the MAT treatment protocol, as shown in Table 8B, we could add the deductible to the individual payments for insurance to get an estimate of the annual expenditure for the patient before any of their insurance benefits become effective. From this, we found that for an individual with OUD receiving an appropriate treatment protocol, the payments for the premium and deductible were greatest for an individual with the HDHP plan. However, the rate of growth for premiums and deductibles combined was lowest for HDHP plans. Conversely, PPOs had the lowest combined payments for the employee's portion of premium and deductible in 2014. This was not the case in 2007, when HMOs had a lower associated amount paid but experienced the fastest increase during the study period.
| TABLE 8B. Combined Average Deductibles and Premiums for Employer-Sponsored Health Insurance from the 2007 and 2014 KEHB | ||||
|---|---|---|---|---|
| Plan Type | Unit of Coverage | 2007, $ | 2014, $ | Annualized Rate of Change 2007-2014 |
| HMO | Individual | 1,112 | 2,214 | 10.3 |
| HMO | Family | 4,070 | 7,582 | 9.3 |
| POS | Individual | 1,249 | 2,199 | 8.4 |
| POS | Family | 5,018 | 7,319 | 5.5 |
| PPO | Individual | 1,178 | 1,977 | 7.7 |
| PPO | Family | 4,276 | 6,831 | 6.9 |
| HDHP | Individual | 2,251 | 3,120 | 4.8 |
| HDHP | Family | 6,452 | 8,907 | 4.7 |
| Total | Individual | N/A | 3,296 | N/A |
| Total | Family | N/A | N/A | N/A |
| SOURCES: Henry J. Kaiser Family Foundation and Health Research & Educational Trust (2007). Employer Health Benefits 2007 Annual Survey. Henry J. Kaiser Family Foundation and Health Research & Educational Trust. Retrieved from: https://kaiserfamilyfoundation.files.wordpress.com/2013/04/76723.pdf. Henry J. Kaiser Family Foundation and Health Research & Educational Trust (2014). Employer Health Benefits 2014 Annual Survey. Henry J. Kaiser Family Foundation and Health Research & Educational Trust. Retrieved from: https://kaiserfamilyfoundation.files.wordpress.com/2014/09/8625-employer-health-benefits-2014-annual-survey6.pdf. | ||||
Co-payment
Table 9 and Table 10, and Figure 3A and Figure 3B, indicate how co-payments changed over the study period. For our sample, the mean co-pay for the 12-month protocol of services declined from $747 in 2007 to $658 in 2014. We projected that it will rise to $728 in 2018. The change between 2007 and 2014 primarily was due to the decrease in the average co-payment for buprenorphine prescription fills and outpatient visits. However, because of the increase in deductibles, this change did not indicate a decrease in cost-sharing. In general, co-payments did not affect the results until medical expenses exceeded the deductible. It is likely that with the increased utilization of CDHP/HDHP plan types and the increase in deductibles in all plans, looking at trends in co-payments alone understates the shift of expenses from insurers to patients. This is made obvious by the fact that PPOs had the lowest average deductibles but the largest increases in co-payments during the study period. With that said, when we restricted our analysis to visits that included a co-payment, we found that the median co-payment for a service in which a co-payment was charged decreased dramatically for detoxification and residential treatment services. Additionally, among the services that comprise the ideal MAT treatment protocol, only the amount paid for a psychotherapy co-pay increased (from $17 to $20). Therefore, we did not find evidence in our analysis that changes in co-payments represented a new or increasing barrier to OUD treatment during the study period.
Between 2007 and 2014, there were variable rates of change in the co-payments of the four most common services outside of the bundle of services included in MAT, across all insurance plan types. It should be noted that there were insufficient data for some services, which could affect overall results. The greatest growth in the amount paid for inpatient treatment was observed within CDHPs/HDHPs, with a rate of 18.5 percent during that period; the least co-payment growth was observed for POS plans, which had a decline of 14.3 percent. There was a decline in the co-payment of intensive outpatient treatment across all plan types. The slowest decline was observed within PPOs, with a rate of -7.2 percent during that period; the fastest decline was observed for CDHPs/HDHPs, with a rate of -25.4 percent. The greatest growth in the amount paid for treat-and-release emergency department treatment was observed within PPOs, with a rate of 12.1 percent during that period; the least growth was observed for POS plans, with a rate of 4.0 percent. The greatest growth in the amount paid for co-payments for outpatient detoxification services were observed in PPOs, with an annual increase of 0.1 percent; the least growth was observed for POSs, with a rate of -0.3 percent. In contrast, we projected a growth in the amount paid for co-payments between 2014 and 2018 for all service types considered.
| FIGURE 3A. Mean Co-payment for the Receipt of an Ideal MAT Treatment Protocol for Enrollees in Large Employer-Sponsored Private Health Insurance Plans Who Have OUD, 2007, 2014, and 2018 (projected) |
|---|
 |
| SOURCE: Truven Health MarketScan CCAE Database, 2007, 2014. * 2018 is projected. |
| FIGURE 3B. Annualized Percent Change in the Mean Co-payment for the Receipt of an Ideal MAT Treatment Protocol for Enrollees in Large Employer-Sponsored Private Health Insurance Plans Who Have OUD, 2007-2014 and 2007-2018 (projected) |
|---|
 |
| SOURCE: Truven Health MarketScan CCAE Database, 2007, 2014. |
| TABLE 9. Co-payments for the Receipt of Common OUD Treatments for Enrollees in Large Employer-Sponsored Private Health Insurance Plans Who Have OUD, 2007, 2014, and 2018 (projected) | |||||||||
|---|---|---|---|---|---|---|---|---|---|
| Service Category | % of Visits with Co-pay, 2007 | % of Visits with Co-pay, 2014 | % of Visits with Co-pay, 2018 | Mean Co-pay for All Visits, 2007, $ | Mean Co-pay for All Visits, 2014, $ | Mean Co-pay for All Visits, 2018, $ | Median Co-pay When Co-pay Was Charged, 2007, $ | Median Co-pay When Co-pay Was Charged, 2014, $ | Median Co-pay When Co-pay Was Charged, 2018, $ |
| Inpatient, including detoxification, per day | 30 | 19 | N/A | 28 | 18 | 21 | 50 | 50 | 59 |
| Outpatient detoxification, per day | 12 | 23 | N/A | 10 | 11 | 13 | 39 | 20 | 24 |
| Residential, per day | 8 | 9 | N/A | 6 | 5 | 6 | 50 | 22 | 26 |
| Intensive outpatient or partial hospitalization, per day | 18 | 10 | N/A | 12 | 7 | 8 | 20 | 20 | 24 |
| Treat-and-release ED visits (all visits that never become inpatient stays) | 34 | 37 | N/A | 24 | 39 | 45 | 52 | 80 | 94 |
| Outpatient office visit | 49 | 44 | N/A | 13 | 11 | 12 | 20 | 20 | 21 |
| Psychotherapy or behavioral therapy office visit | 35 | 40 | N/A | 8 | 9 | 9 | 17 | 20 | 21 |
| Buprenorphine or buprenorphine naloxone prescription fill | 88 | 78 | N/A | 33 | 27 | 31 | 34 | 25 | 29 |
| SOURCE: Truven Health MarketScan CCAE Database, 2007 and 2014. | |||||||||
| TABLE 10. Mean Co-payment for Services for the Receipt of Common OUD Treatments Outside of an Ideal MAT Treatment Protocol for Enrollees in Large Employer-Sponsored Private Health Insurance Plans Who Have OUD, by Plan Type, 2007, 2014, and 2018 (projected) | ||||||
|---|---|---|---|---|---|---|
| Plan Type | Service Category | 2007, $ | 2014, $ | 2018, $ (projected) | Annualized Change, % 2007-2014 | Annualized Change, % 2007-2018 (projected) |
| HMO | Inpatient, including detoxification, per day | 33.0 | 35.6 | 42.0 | 1.1 | 2.2 |
| HMO | Intensive outpatient or partial hospitalization, per day | 18.1 | 10.2 | 12.0 | -7.8 | -3.6 |
| HMO | Treat-and-release ED visits (all visits that never become inpatient stays) | 33.7 | 64.2 | 75.4 | 9.6 | 7.6 |
| PPO | Inpatient, including detoxification, per day | 24.9 | 14.7 | 17.4 | -7.2 | -3.2 |
| PPO | Intensive outpatient or partial hospitalization, per day | 6.6 | 3.9 | 4.6 | -7.2 | -3.2 |
| PPO | Treat-and-release ED visits (all visits that never become inpatient stays) | 19.7 | 44.0 | 51.7 | 12.1 | 9.2 |
| POS | Inpatient, including detoxification, per day | 38.6 | 13.1 | 15.5 | -14.3 | -8.0 |
| POS | Intensive outpatient or partial hospitalization, per day | 13.2 | 2.5 | 2.9 | -21.3 | -12.8 |
| POS | Treat-and-release ED visits (all visits that never become inpatient stays) | 32.1 | 42.1 | 49.4 | 4.0 | 4.0 |
| CDHP/HDHP | Inpatient, including detoxification, per day | 7.2 | 23.6 | 27.9 | 18.5 | 13.1 |
| CDHP/HDHP | Intensive outpatient or partial hospitalization, per day | 154.9 | 19.9 | 23.4 | -25.4 | -15.8 |
| CDHP/HDHP | Treat-and-release ED visits (all visits that never become inpatient stays) | NSD | 4.4 | 5.2 | NSD | NSD |
| SOURCE: Truven Health MarketScan CCAE Database, 2007 and 2014. | ||||||
Co-insurance Amount Per Service
We observed several interesting relationships in our data on co-insurance, shown in Table 11 and Table 12. First, the proportion of visits with any co-insurance billed increased for all services except intensive outpatient care and outpatient detoxification. Second, the median co-insurance percentage for services with any co-insurance increased or remained the same for all services except for psychotherapy, for which it was lowered. Third, the mean amount of co-insurance for an ideal protocol of services increased by 0.6 percentage points in 2014, or 13.0 percent relative to 2007, even though the mean for all insurance plan types except HMOs decreased during that period. This was a result of the increased use of CDHP/HDHP and PPO plan types, which had the highest mean co-insurance during the study period, and was not a reflection of the fact that these plans began instituting higher co-insurance levels on the average service considered. As with co-payment data, these results should be interpreted with caution. Higher deductibles may mitigate the effect of co-insurance on the mean service, because more services will be provided under the deductible and thus may not be subject to co-insurance.
| TABLE 11. Co-insurance Rates for the Receipt of Common OUD Treatments for Enrollees in Large Employer-Sponsored Private Health Insurance Plans Who Have OUD, 2007 and 2014 | ||||||
|---|---|---|---|---|---|---|
| Service Category | % of Visits With Co-insurance, 2007 | % of Visits With Co-insurance, 2014 | Mean for All Visits, 2007, % | Mean for All Visits, 2014, % | Median Among Visits With Co-insurance, 2007, % | Median Among Visits With Co-insurance, 2014, % |
| Inpatient, including detoxification, per day | 41.3 | 52.4 | 5 | 7 | 10 | 10 |
| Outpatient detoxification per day | 43.0 | 33.2 | 12 | 8 | 20 | 20 |
| Residential per day | 26.5 | 30.3 | 3 | 8 | 10 | 20 |
| Intensive outpatient or partial hospitalization per day | 32.1 | 30.0 | 6 | 7 | 10 | 20 |
| Treat-and-release ED visits (all visits that never become inpatient stays) | 23.5 | 31.8 | 4 | 6 | 15 | 20 |
| Outpatient office visit | 24.8 | 26.9 | 6 | 6 | 20 | 20 |
| Psychotherapy or behavioral therapy office visit | 19.2 | 23.5 | 5 | 6 | 29 | 20 |
| Buprenorphine or buprenorphine naloxone prescription fill | 12.4 | 16.2 | 2 | 4 | 11 | 20 |
| SOURCE: Truven Health MarketScan CCAE Database, 2007 and 2014. | ||||||
As shown in Table 12, between 2007 and 2014 there was growth in the mean co-insurance for the three most common services outside of the MAT treatment protocol. This growth occurred for all insurance plan types except for intensive outpatient services for PPOs and inpatient services for CDHPs/HDHPs. It should be noted that there was insufficient data for some services, which could affect overall results. The greatest growth of inpatient treatment was observed within HMOs, with a rate of 8.3 percent during that period; the least growth was observed for CDHPs/HDHPs, with a rate of -1.4 percent. The greatest growth of intensive outpatient treatment was observed within HMOs, with an annualized growth rate of 24.5 percent during that period; the least growth was observed for PPOs, with a rate of -1.6 percent. The greatest growth of treat-and-release emergency department treatment was observed within HMOs, with a rate of 32.2 percent during that period; the least growth was observed for PPOs, with a rate of 0.1 percent.
| TABLE 12. Mean Co-insurance Rates for the Receipt of Common OUD Treatments Outside of an Ideal MAT Treatment Protocol for Enrollees in Large Employer-Sponsored Private Health Insurance Plans Who Have OUD, by Plan Type, 2007 and 2014 | ||||||
|---|---|---|---|---|---|---|
| Plan Type | Service Category | Mean 2007, % | Mean 2014, % | Absolute Difference 2007-2014, Percentage Point | Aggregate Change 2007-2014, % | Annualized Change 2007-2014, % |
| HMO | Inpatient, including detoxification, per day | 1.2 | 2.2 | 0.9 | 74.4 | 8.3 |
| HMO | Intensive outpatient or partial hospitalization per day | 0.4 | 1.8 | 1.4 | 362.7 | 24.5 |
| HMO | Treat-and-release ED visits (all visits that never become inpatient stays) | 0.2 | 1.1 | 1.0 | 606.9 | 32.2 |
| PPO | Inpatient, including detoxification, per day | 6.7 | 8.3 | 1.6 | 24.5 | 3.2 |
| PPO | Intensive outpatient or partial hospitalization per day | 7.7 | 6.9 | -0.8 | -10.4 | -1.6 |
| PPO | Treat-and-release ED visits (all visits that never become inpatient stays) | 5.6 | 5.6 | 0 | 0.4 | 0.1 |
| POS | Inpatient, including detoxification, per day | 4.3 | 5.6 | 1.3 | 30.5 | 3.9 |
| POS | Intensive outpatient or partial hospitalization per day | 2.4 | 4.1 | 1.7 | 69.1 | 7.8 |
| POS | Treat-and-release ED visits (all visits that never become inpatient stays) | 2.3 | 4.1 | 1.8 | 79.0 | 8.7 |
| CDHP/HDHP | Inpatient, including detoxification, per day | 8.4 | 7.6 | -0.8 | -9.2 | -1.4 |
| CDHP/HDHP | Intensive outpatient or partial hospitalization per day | 3.2 | 8.9 | 5.6 | 174.6 | 15.5 |
| CDHP/HDHP | Treat-and-release ED visits (all visits that never become inpatient stays) | NSD | 9.4 | NSD | NSD | NSD |
| SOURCE: Truven Health MarketScan CCAE Database, 2007 and 2014. | ||||||
Coverage Changes Between 2007 and 2014
To determine the way coverage for OUD services changed between 2007 and 2014, we considered findings from a study by Horgan and colleagues (2016) using the Brandeis Health Insurance Survey (see Figure 4). The study showed that by 2010, more than 99.6 percent of health plans covered inpatient detoxification and inpatient hospitalization for substance abuse, and 100 percent covered outpatient counseling and therapy. However, only between 86 percent and 84 percent of health plans covered residential rehabilitation, which represented a decline in the availability of this service. Moreover, the study found that 100 percent of health plans covered treatment for buprenorphine pharmacy in 2010. For our analysis, we considered the 2003 data from the Horgan et al. study to represent coverage prior to parity (2007), and data from 2010 and later to approximate coverage after parity.
| FIGURE 4. Proportion of Insurance Plans Covering Common SUD Services, 2003 and 2010 |
|---|
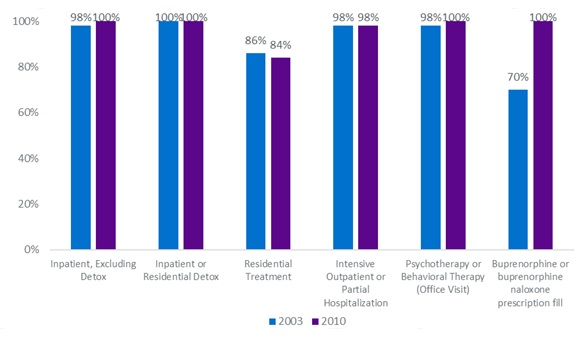 |
| SOURCE: Horgan CM, Stewart MT, Reif S, et al. Behavioral health services in the changing landscape of private health plans. Psychiatric Services. 2016; 67(6): 622-629. |
Costs to the Uninsured and Rate of Out-of-Network Service Use
In terms of out-of-network service use within the ideal protocol of services, we found a large increase in use of out-of-network psychotherapy, as shown in Table 13 and Table 14. In 2007, only 15.3 percent of psychotherapy was delivered out-of-network, and this increased to 25.5 percent in 2014. This increase was noted across all plan types, with the largest increase in the share of out-of-network office visits occurring within CDHP/HDHP and PPO plan types. There was a decrease in the proportion of office visits and buprenorphine prescription fills that were provided out-of-network; however, we did not have extensive data on buprenorphine prescription fills.
| TABLE 13. Median Out-of-Network Amount Paid for the Receipt of Common OUD Treatments for Enrollees in Large Employer-Sponsored Private Health Insurance Plans Who Have OUD, 2007 and 2014 | ||||||||||
|---|---|---|---|---|---|---|---|---|---|---|
| Service Category | HMO, 2007, $ | HMO, 2014, $ | PPO, 2007, $ | PPO, 2014, $ | POS, 2007, $ | POS, 2014, $ | CDHP/ HDHP, 2007, $ | CDHP/ HDHP, 2014, $ | All Plans, 2007, $ | All Plans, 2014, $ |
| Inpatient, including detoxification, per day | N/A | N/A | N/A | N/A | N/A | N/A | N/A | N/A | N/A | N/A |
| Outpatient detoxification, per day | NSD | 1,100 | NSD | 927 | NSD | 873 | NSD | 1,275 | NSD | 964 |
| Residential, per day | 165 | 250 | NSD | 1,311 | NSD | 3,951 | NSD | 1,390 | 76 | 1,500 |
| Intensive outpatient or partial hospitalization, per day | 110 | 1,095 | 198 | 865 | 195 | 623 | 2678 | 839 | 198 | 850 |
| Treat-and-release ED visits (all visits that never become inpatient stays) | NSD | 506 | 209 | 526 | NSD | 500 | NSD | 612 | 250 | 524 |
| Outpatient office visit | 108 | 126 | 78 | 114 | 71 | 119 | 145 | 109 | 80 | 113 |
| Psychotherapy or behavioral therapy office visit | 80 | 140 | 100 | 125 | 67 | 125 | 107 | 125 | 90 | 125 |
| Buprenorphine or buprenorphine naloxone prescription fill | 563 | 439 | 321 | 307 | NSD | NSD | NSD | NSD | 563 | 539 |
| SOURCE: Truven Health MarketScan CCAE Database, 2007, 2014. | ||||||||||
Additionally, for out-of-network services, there was a decrease in the amount paid for an ideal protocol of services, but this was driven almost exclusively by a decrease in the amount paid for buprenorphine out-of-network. This finding may be related to the fact that in 2014, 100 percent of insurance plans surveyed by Brandeis covered buprenorphine for the treatment of OUD, so they may have negotiated rates. It is also worth noting that additional drugs received Food and Drug Administration (FDA) approval during the study period. Another factor may be increasing use of generic formulations of buprenorphine in 2014.[28]
| TABLE 14. Proportion of Service Received Out-of-Network Services for Common OUD Treatments for Enrollees in Larger Employer-Sponsored Private Health Insurance Plans Who Have OUD, 2007 and 2014 | ||||||||||
|---|---|---|---|---|---|---|---|---|---|---|
| Service Category | HMO, 2007, $ | HMO, 2014, $ | PPO, 2007, $ | PPO, 2014, $ | POS, 2007, $ | POS, 2014, $ | CDHP/ HDHP, 2007, $ | CDHP/ HDHP, 2014, $ | All Plans, 2007, $ | All Plans, 2014, $ |
| Inpatient, including detoxification, per day | N/A | N/A | N/A | N/A | N/A | N/A | N/A | N/A | N/A | N/A |
| Outpatient detoxification, per day | NSD | 22.4 | NSD | 22.9 | NSD | 36.4 | NSD | 30.1 | NSD | 25.9 |
| Residential, per day | 28.9 | 9.6 | NSD | 51.6 | NSD | 42.6 | NSD | 46.9 | 8.4 | 46.8 |
| Intensive outpatient or partial hospitalization, per day | 1.9 | 9.7 | 12.5 | 46.8 | 4.6 | 50.5 | 10.3 | 49.4 | 9.4 | 45.4 |
| Treat-and-release ED visits (all visits that never become inpatient stays) | 2.3 | 5.5 | 7.5 | 9.1 | 0.9 | 4.4 | 10.0 | 2.2 | 5.3 | 7.0 |
| Outpatient office visit | 7.8 | 5.2 | 21.7 | 15.7 | 21.0 | 14.6 | 6.8 | 21.4 | 18.9 | 15.8 |
| Psychotherapy or behavioral therapy office visit | 3.9 | 6.7 | 15.6 | 24.5 | 34.3 | 34.5 | 21.7 | 36.5 | 15.3 | 25.5 |
| Buprenorphine or buprenorphine naloxone prescription fill | 2.2 | 2.2 | NSD | 0.0 | NSD | NSD | NSD | NSD | 0.4 | 0.2 |
| SOURCE: Truven Health MarketScan CCAE Database, 2007, 2014. | ||||||||||
| FIGURE 5. Cost of an Ideal 12-Month MAT Treatment Protocol by Health Plan Type if Services Were Delivered Entirely Out-of-Network |
|---|
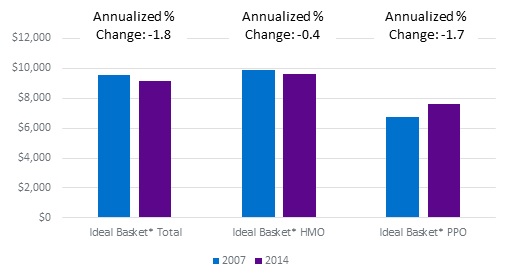 |
| SOURCE: Truven Health MarketScan CCAE Database, 2007 and 2014. NOTE: Data were insufficient for PPOs, POS plans, CDHPs/HDHPs. |
For the purposes of getting a sense of the proportional effect of lack of comprehensive insurance coverage on all individuals with OUD in private health insurance, we approximated the expenditure on a per enrollee basis, assuming that individuals are equally likely to be enrolled in any plan type. That is, in Table 15, we approximate the expense for not having coverage for a specific service on commercially insured individuals with OUD. We multiplied the out-of-network price paid for services by the proportion of plans in each category that did not provide coverage for that service. The only service for which we could calculate the amount paid at the plan type level was buprenorphine prescription fills; however, a limitation of our data was that we did not have any out-of-network claims for buprenorphine prescription fills among POS plans in our dataset. Nevertheless, we can see that increasing the rate of insurance coverage vastly reduced out-of-pocket expenses for individuals that would otherwise have had to pay the full out-of-network rate. This expense savings amounted to $2,027 per person on average across all insured individuals for buprenorphine alone.
| TABLE 15. Estimated Effect, per Enrollee in Large Employer-Sponsored Private Health Insurance Plans Who Have OUD, of Lack of Coverage on Out-of-Pocket Expenditures for Common OUD Treatment Services, by Plan Type, 2007 and 2014 | ||||||||||
|---|---|---|---|---|---|---|---|---|---|---|
| Service Category | HMO, 2007, $ | PPO, 2007, $ | POS, 2007, $ | CDHP, 2007, $ | All Plans, 2007, $ | HMO, 2014, $ | PPO, 2014, $ | POS, 2014, $ | CDHP, 2014, $ | All Plans, 2014, $ |
| Inpatient, including detoxification, per day | N/A | N/A | N/A | N/A | No data | N/A | N/A | N/A | N/A | No data |
| Outpatient detoxification, per day | N/A | N/A | N/A | N/A | NSD | N/A | N/A | N/A | N/A | 3.86 |
| Residential, per day | N/A | N/A | N/A | N/A | 10.64 | N/A | N/A | N/A | N/A | 240 |
| Intensive outpatient or partial hospitalization, per day | N/A | N/A | N/A | N/A | 3.96 | N/A | N/A | N/A | N/A | 14.45 |
| Treat-and-release ED visits (all visits that never become inpatient stays) | N/A | N/A | N/A | N/A | N/A | N/A | N/A | N/A | N/A | N/A |
| Outpatient office visit | N/A | N/A | N/A | N/A | N/A | N/A | N/A | N/A | N/A | N/A |
| Psychotherapy or behavioral therapy office visit | N/A | N/A | N/A | N/A | 2.07 | N/A | N/A | N/A | N/A | 0 |
| Buprenorphine or buprenorphine naloxone prescription fill | 208.29 | 18.32 | NSD | N/A | 168.89 | 0 | 0 | 0 | 0 | 0 |
| SOURCES: Truven Health MarketScan CCAE Database, 2007, 2014. Horgan CM, Stewart MT, Reif S, et al. Behavioral health services in the changing landscape of private health plans. Psychiatric Services. 2016; 67(6): 622-629. | ||||||||||
Table 16 shows that between 2007 and 2014 there was growth in the out-of-network payments for the three most common services outside of the bundle of services included in MAT, except for intensive outpatient treatment in CDHPs/HDHPs. We do not have information on insurance coverage for these services from the Brandeis dataset. It should be noted that data were insufficient for some services, which could affect overall results, and data were unavailable for the rate of change for inpatient treatment across all service types. The greatest growth in the amount paid for intensive outpatient treatment was observed within HMOs, with a rate of 38.9 percent during that period; the least growth was observed for CDHPs/HDHPs, with a rate of -15.3 percent. The greatest growth in the amount paid for treat-and-release emergency department treatment was observed within PPOs, with a rate of 14.1 percent during that period. Data were insufficient for all other service types. We projected that for the time between 2014 and 2018 there would be a trend of growth for out-of-network payments across all service types.
| TABLE 16. Median Out-of-Network Amount Paid for the Receipt of Common OUD Treatments Outside of the Ideal MAT Treatment Protocol for Enrollees in Large Employer-Sponsored Private Health Insurance Plans Who Have OUD, by Plan Type, 2007, 2014, and 2018 (projected) | ||||||
|---|---|---|---|---|---|---|
| Plan Type | Service Category | Mean 2007, % | Mean 2014, % | Median 2018, $ (projected) | Aggregate Change 2007-2014, % | Annualized Change 2007-2018, % (projected) |
| HMO | Inpatient, including detoxification, per day | N/A | N/A | N/A | N/A | N/A |
| HMO | Intensive outpatient or partial hospitalization, per day | 110 | 1,095.0 | 1,287.3 | 38.9 | 25.1 |
| HMO | Treat-and-release ED visits (all visits that never become inpatient stays) | NSD | 506 | 594.9 | NSD | NSD |
| PPO | Inpatient, including detoxification, per day | N/A | N/A | N/A | N/A | N/A |
| PPO | Intensive outpatient or partial hospitalization, per day | 198.0 | 865.0 | 1016.9 | 23.4 | 16.0 |
| PPO | Treat-and-release ED visits (all visits that never become inpatient stays) | 209.4 | 526.1 | 618.5 | 14.1 | 10.3 |
| POS | Inpatient, including detoxification, per day | N/A | N/A | N/A | N/A | N/A |
| POS | Intensive outpatient or partial hospitalization, per day | 195.0 | 623.4 | 732.8 | 18.1 | 12.8 |
| POS | Treat-and-release ED visits (all visits that never become inpatient stays) | NSD | 500.4 | 588.3 | NSD | NSD |
| CDHP/HDHP | Inpatient, including detoxification, per day | N/A | N/A | N/A | N/A | N/A |
| CDHP/HDHP | Intensive outpatient or partial hospitalization, per day | 2,677.5 | 839.4 | 986.9 | -15.3 | -8.7 |
| CDHP/HDHP | Treat-and-release ED visits (all visits that never become inpatient stays) | NSD | 611.5 | 718.9 | NSD | NSD |
| SOURCE: Truven Health MarketScan CCAE Database, 2007, 2014. | ||||||
DISCUSSION
This study investigated changes in the amounts paid of MAT for OUD for individuals with employer-sponsored health insurance. We included individuals covered by HMOs, POS plans, PPOs, and combined CDHPs and HDHPs. We reported the results by plan type and for the total sample. The analyses focused on an ideal 12-month MAT treatment protocol, but we also included payments across all plan types for five additional services, and payments at the plan type level for three additional services that individuals with OUD often need. Data were from 2007 and 2014, which were before and after phased implementation of major federal legislation enacted to increase insurance coverage and expand access to coverage of behavioral health care. This time period also encompassed the emergence of new FDA-approved opioid treatment medications. We projected results for certain variables into 2018 to better estimate near-future costs of care for individuals with OUD.
Cost Trends in OUD Treatment Related to MAT
Although the total amount paid for a 12-month MAT treatment protocol across all plan types did not increase relative to inflation, high growth in the health insurance premiums, deductibles, and co-insurance resulted in greater treatment expenses to beneficiaries. However, it is very important to note that our results showed that prior to 2007 (2003 was the only pre-2010 year data were available), 37 percent of HMOs and nearly 45 percent of POS plans did not offer coverage for buprenorphine-based treatments for OUD.[29] Our analysis indicates that lack of coverage would have resulted in out-of-pocket expenses of over $1,000 per insured person on average. That cost would be exclusively on those without coverage for this treatment and therefore would have been a much greater burden on some individuals than others. Between 2007 and 2014, the combined annual amount paid for the employee portion of health insurance and deductibles increased on average in excess of 10 percent per year for HMOs, which experienced the most rapid growth, and in excess of 4 percent per year for HDHPs, which had the highest combined deductibles and premiums paid by employees in both time periods. We did not find comparable increases in co-payments during the years studied. In particular, we found that among all plans considered, the proportion of office visits and buprenorphine prescription fills where a co-payment was charged decreased between 2007 and 2014. This may have been related to increased deductibles, which would have made it more difficult for patients to achieve spending at a level where co-payments could be charged. Finally, we found that the co-payments for the ideal 12-month MAT treatment protocol decreased during the study period.
Cost Trends in Other OUD Services
In addition to considering the services that were part of an ideal protocol of care for individuals receiving MAT for OUD, we also looked by plan type at the three most common other treatment types that were commonly used by the individuals with OUD in our sample. These service categories were inpatient treatment, including detoxification; intensive outpatient or partial hospitalization; and treat-and-release emergency department visits, or all emergency department visits that never become inpatient stays. Moreover, across all plan types we considered residential treatment, per day, and outpatient detoxification, per day.
Examination of the treatments outside the MAT treatment protocol over the course of our first study period (2007-2014) revealed that all treatment types had a general growth in amounts paid over time. This trend is projected to continue through 2018. Between 2007 and 2014, for the four types of health plans considered, the total payments for the three non-MAT treatment protocol treatment types that we considered at the plan type level increased annually by an excess of 3 percent per year, except for the cost of inpatient care in an HMO, which only grew by 0.9 percent per year during that period. Payments are projected to continue to increase through 2018. Moreover, for the two less common services, outpatient detoxification, per day, the rate of growth was lower than the rate of inflation between 2007 and 2004, 1.4 percent, and the rate of growth in daily payments for residential care was much faster at 16.3 percent.
The amount of growth for co-payments, co-insurance, and out-of-network payments was more varied over these same time periods. The mean co-payment paid for these three services across all types of insurance in the sample decreased for intensive outpatient treatment and inpatient care, including detoxification services. The lower co-payment across all plan types may be partially explained by a shift to plans with higher deductibles, which would result in more services being delivered below the deductible and thus not subject to co-payments. When we restricted the analysis to co-payments on services for which any co-payment was charged, we found that the median co-payment for these services remained constant between 2007 and 2014. For the services which we considered each specific plan type, only inpatient treatment services for PPOs and POS plans had a decline in the mean amount paid. Between 2014 and 2018, the amount paid for co-payments is projected to increase across all service types and insurance plans. The mean co-insurance rates also generally increased annually across all plan types, except for CDHP and HDHP coverage of inpatient treatment and PPO coverage of intensive outpatient treatment, which decreased. This result may be partially explained by higher deductibles, which resulted in fewer services involving co-insurance and would have the effect of reducing the mean co-insurance paid per service. Out-of-network payments also increased between 2007 and 2014 for all types of care except intensive outpatient treatment covered by CDHPs and HDHPs. We project that the expenses will continue to rise between 2014 and 2018.
It is possible that trends in increasing total expenses for these services across all plan types considered are a function of increasing demand for OUD treatment. As described in the Methods section, we consider it likely that the amounts paid for these treatments will follow more general trends in the cost of comparable health care services between 2014 and 2018 as the impact of policy changes stabilizes.
Limitations
Our study has several potential limitations. First, the composition of the sample differs between 2007 and 2014. Access to insurance, as well as the coverage available, expanded as a result of the policies that were implemented during our study period. Therefore, we do not know for certain if the costs of care for the individuals that were in our sample in 2007 would have been higher in 2014 by the exact amount we estimate. Moreover, the MarketScan CCAE Database sample is a convenience sample and this may be a limitation of our analysis as it is not representative of all commercially insured individuals in the United States. That said, it is a very large convenience sample, with 9,400,751 individuals in 2007 and 14,063,641 in 2014 that met the criteria of being in an employer-sponsored plan, with prescription drug data, enrolled at least 10 months of the year, aged 12-64 and enrolled in one of the four categories of plans considered. Thus, some of the risks of bias are reduced. An additional potential limitation is that we constructed an ideal 12-month treatment protocol for MAT that assumes that all individuals would need a specific bundle of services. However, we know that certain individuals may require services outside of that protocol. To overcome this limitation, we incorporate estimates of the costs of care for services outside of that protocol, which allows for supplemental calculation of the amounts paid including those services in the protocol. A final limitation is that we use data on employer-sponsored insurance from three sources to construct our estimates, each with different samples. Therefore, the results from each may not be generalizable to the others. Nevertheless, we assumed that they would be representative of the health insurance marketplace for our calculations, but this is a limitation of our approach. The direction of potential bias caused by this is unknown.
Future Directions
Our study indicates the need to assess whether an individual's willingness to pay for OUD treatment has changed in recent years. Although prior research indicates that behavioral health treatment use is highly "price inelastic,"[30], [31] we found increased utilization of behavioral health services even after the expenses increased. This finding may indicate that the composition of the sample of individuals with OUD has changed over time, and we may need to re-evaluate our understanding of the way in which these individuals decide whether to use services. Perhaps the perceived marginal value of treatment is higher now. With that said, our main task results revealed that the growth in the population with OUD exceeded the rate of growth in the utilization of these services, which may indicate that the expenses are deterring use. Further research is needed to understand whether this is the case.
It is also important to consider the role that Medicaid plays in service use over time. Additional research is needed to identify whether trends in Medicaid prices paid influence the price paid by private insurers or the out-of-pocket costs of the privately insured.
APPENDIX A. ICD-9 AND ICD-10 DIAGNOSTIC CODES FOR OUD
| ICD-9-CM | ICD-9 Description |
|---|---|
| 30400 | Opioid dependence-unspecified |
| 30401 | Opioid dependence-continuous |
| 30402 | Opioid dependence-episode |
| 30403 | Opioid type dependence in remission |
| 30470 | Opioid/other dep-unspecified |
| 30471 | Opioid/other dep-continuous |
| 30472 | Opioid/other dep-episode |
| 30473 | Opioid w/other drug dependence in remission |
| 30550 | Opioid abuse-unspecified |
| 30551 | Opioid abuse-continuous |
| 30552 | Opioid abuse-episodic |
| 30553 | Opioid abuse in remission |
| 96500 | Poisoning by opium (alkaloids), unspecified |
| 96501 | Poisoning by heroin |
| 96502 | Poisoning by methadone |
| 96509 | Poisoning by other opiates |
| E8500 | Accidental poisoning by heroin |
| E8501 | Accidental poisoning by methadone |
| E8502 | Accidental poisoning by other opiates and related narcotics |
| E9800 | Undetermined cause poisoning by opiates |
| ICD-10 | ICD-10 Description |
|---|---|
| F111 | Opioid abuse |
| F1110 | Opioid abuse uncomplicated |
| F1112 | Opioid abuse with intoxication |
| F11120 | Opioid abuse with intoxication uncomplicated |
| F11121 | Opioid abuse with intoxication delirium |
| F11122 | Opioid abuse w/intoxication w/perceptual disturb |
| F11129 | Opioid abuse with intoxication unspecified |
| F1114 | Opioid abuse with opioid-induced mood disorder |
| F1115 | Opioid abuse with opioid-induced psychotic disorder |
| F11150 | Opioid abuse w/induced psychosis d/o w/delusions |
| F11151 | Opioid abuse w/induced psychosis d/o w/hallucinations |
| F11159 | Opioid abuse w/opioid-induced psychosis d/o unspecified |
| F1118 | Opioid abuse with other opioid-induced disorder |
| F11181 | Opioid abuse w/opioid-induced sexual dysfunction |
| F11182 | Opioid abuse with opioid-induced sleep disorder |
| F11188 | Opioid abuse with other opioid-induced disorder |
| F1119 | Opioid abuse w/unspecified opioid-induced disorder |
| F112 | Opioid dependence |
| F1120 | Opioid dependence, uncomplicated |
| F1121 | Opioid dependence, in remission |
| F11220 | Opioid dependence with intoxication, uncomplicated |
| F11221 | Opioid dependence with intoxication delirium |
| F1122 | Opioid dependence with intoxication |
| F11222 | Opioid dependence with intoxication with perceptual disturbance |
| F11229 | Opioid dependence with intoxication, unspecified |
| F1123 | Opioid dependence with withdrawal |
| F1124 | Opioid dependence with opioid-induced mood disorder |
| F1125 | Opioid dependence with opioid-induced psychotic disorder |
| F11250 | Opioid dependence with opioid-induced psychotic disorder with delusions |
| F11251 | Opioid dependence with opioid-induced psychotic disorder with hallucinations |
| F11259 | Opioid dependence with opioid-induced psychotic disorder, unspecified |
| F1128 | Opioid dependence with other opioid-induced disorder |
| F11281 | Opioid dependence with opioid-induced sexual dysfunction |
| F11282 | Opioid dependence with opioid-induced sleep disorder |
| F11288 | Opioid dependence with other opioid-induced disorder |
| F1129 | Opioid dependence with unspecified opioid-induced disorder |
| F1190 | Opioid use, unspecified, uncomplicated |
| F11920 | Opioid use, unspecified with intoxication, uncomplicated |
| F11921 | Opioid use, unspecified with intoxication delirium |
| F11922 | Opioid use, unspecified with intoxication with perceptual disturbance |
| F11929 | Opioid use, unspecified with intoxication, unspecified |
| F1193 | Opioid use, unspecified with withdrawal |
| F1194 | Opioid use, unspecified with opioid-induced mood disorder |
| F11950 | Opioid use, unspecified with opioid-induced psychotic disorder with delusions |
| F11951 | Opioid use, unspecified with opioid-induced psychotic disorder with hallucinations |
| F11959 | Opioid use, unspecified with opioid-induced psychotic disorder, unspecified |
| F11981 | Opioid use, unspecified with opioid-induced sexual dysfunction |
| F11982 | Opioid use, unspecified with opioid-induced sleep disorder |
| F11988 | Opioid use, unspecified with other opioid-induced disorder |
| F1199 | Opioid use, unspecified with unspecified opioid-induced disorder |
| T400X1A | Poisoning by opium, accidental (unintentional), initial encounter |
| T400X2A | Poisoning by opium, intentional self-harm, initial encounter |
| T400X4A | Poisoning by opium, undetermined, initial encounter |
| T401X1A | Poisoning by heroin, accidental (unintentional), initial encounter |
| T401X2A | Poisoning by heroin, intentional self-harm, initial encounter |
| T401X4A | Poisoning by heroin, undetermined, initial encounter |
| T402X1A | Poisoning by other opioids, accidental (unintentional), initial encounter |
| T402X2A | Poisoning by other opioids, intentional self-harm, initial encounter |
| T402X4A | Poisoning by other opioids, undetermined, initial encounter |
| T403X1A | Poisoning by methadone, accidental (unintentional), initial encounter |
| T403X2A | Poisoning by methadone, intentional self-harm, initial encounter |
| T403X4A | Poisoning by methadone, undetermined, initial encounter |
APPENDIX B. NDC CODES IDENTIFYING MAT
| NDC | Product Name | Route of Admin | Master Form Code | Strength in MG | Generic Name |
|---|---|---|---|---|---|
| 00054-0188-13 | BUPRENORPHINE-NALOXONE | SL | TAB | 2-0.5 | Buprenorphine/Naloxone |
| 00054-0189-13 | BUPRENORPHINE-NALOXONE | SL | TAB | 8-2 | Buprenorphine/Naloxone |
| 00093-5720-56 | BUPRENORPHINE-NALOXONE | SL | TAB | 2-0.5 | Buprenorphine/Naloxone |
| 00093-5721-56 | BUPRENORPHINE-NALOXONE | SL | TAB | 8-2 | Buprenorphine/Naloxone |
| 00228-3154-03 | BUPRENORPHINE-NALOXONE | SL | TAB | 2-0.5 | Buprenorphine/Naloxone |
| 00228-3154-73 | BUPRENORPHINE-NALOXONE | SL | TAB | 2-0.5 | Buprenorphine/Naloxone |
| 00228-3155-03 | BUPRENORPHINE-NALOXONE | SL | TAB | 8-2 | Buprenorphine/Naloxone |
| 00228-3155-73 | BUPRENORPHINE-NALOXONE | SL | TAB | 8-2 | Buprenorphine/Naloxone |
| 00406-1923-03 | BUPRENORPHINE-NALOXONE | SL | TAB | 2-0.5 | Buprenorphine/Naloxone |
| 00406-1924-03 | BUPRENORPHINE-NALOXONE | SL | TAB | 8-2 | Buprenorphine/Naloxone |
| 00490-0051-00 | SUBOXONE | SL | TAB | 2-0.5 | Buprenorphine/Naloxone |
| 00490-0051-30 | SUBOXONE | SL | TAB | 2-0.5 | Buprenorphine/Naloxone |
| 00490-0051-60 | SUBOXONE | SL | TAB | 2-0.5 | Buprenorphine/Naloxone |
| 00490-0051-90 | SUBOXONE | SL | TAB | 2-0.5 | Buprenorphine/Naloxone |
| 12496-1202-01 | SUBOXONE | SL | FIL | 2-0.5 | Buprenorphine/Naloxone |
| 12496-1202-03 | SUBOXONE | SL | FIL | 2-0.5 | Buprenorphine/Naloxone |
| 12496-1204-01 | SUBOXONE | SL | FIL | 4-1 | Buprenorphine/Naloxone |
| 12496-1204-03 | SUBOXONE | SL | FIL | 4-1 | Buprenorphine/Naloxone |
| 12496-1208-01 | SUBOXONE | SL | FIL | 8-2 | Buprenorphine/Naloxone |
| 12496-1208-03 | SUBOXONE | SL | FIL | 8-2 | Buprenorphine/Naloxone |
| 12496-1212-01 | SUBOXONE | SL | FIL | 12-3 | Buprenorphine/Naloxone |
| 12496-1212-03 | SUBOXONE | SL | FIL | 12-3 | Buprenorphine/Naloxone |
| 12496-1278-02 | SUBUTEX | SL | TAB | 2 | Buprenorphine |
| 12496-1283-02 | SUBOXONE | SL | TAB | 2-0.5 | Buprenorphine/Naloxone |
| 12496-1306-02 | SUBOXONE | SL | TAB | 8-2 | Buprenorphine/Naloxone |
| 12496-1310-02 | SUBUTEX | SL | TAB | 8 | Buprenorphine |
| 16590-0666-05 | SUBOXONE | SL | TAB | 2-0.5 | Buprenorphine/Naloxone |
| 16590-0666-30 | SUBOXONE | SL | TAB | 2-0.5 | Buprenorphine/Naloxone |
| 16590-0667-05 | SUBOXONE | SL | TAB | 8-2 | Buprenorphine/Naloxone |
| 16590-0667-30 | SUBOXONE | SL | TAB | 8-2 | Buprenorphine/Naloxone |
| 16590-0667-90 | SUBOXONE | SL | TAB | 8-2 | Buprenorphine/Naloxone |
| 23490-9270-03 | SUBOXONE | SL | TAB | 8-2 | Buprenorphine/Naloxone |
| 23490-9270-06 | SUBOXONE | SL | TAB | 8-2 | Buprenorphine/Naloxone |
| 23490-9270-09 | SUBOXONE | SL | TAB | 8-2 | Buprenorphine/Naloxone |
| 35356-0004-07 | SUBOXONE | SL | TAB | 8-2 | Buprenorphine/Naloxone |
| 35356-0004-30 | SUBOXONE | SL | TAB | 8-2 | Buprenorphine/Naloxone |
| 42291-0174-30 | BUPRENORPHINE-NALOXONE | SL | TAB | 2-0.5 | Buprenorphine/Naloxone |
| 42291-0175-30 | BUPRENORPHINE-NALOXONE | SL | TAB | 8-2 | Buprenorphine/Naloxone |
| 43063-0184-07 | SUBOXONE | SL | TAB | 8-2 | Buprenorphine/Naloxone |
| 43063-0184-30 | SUBOXONE | SL | TAB | 8-2 | Buprenorphine/Naloxone |
| 49999-0395-07 | SUBOXONE | SL | TAB | 2-0.5 | Buprenorphine/Naloxone |
| 49999-0395-15 | SUBOXONE | SL | TAB | 2-0.5 | Buprenorphine/Naloxone |
| 49999-0395-30 | SUBOXONE | SL | TAB | 2-0.5 | Buprenorphine/Naloxone |
| 49999-0638-30 | SUBUTEX | SL | TAB | 2 | Buprenorphine |
| 49999-0639-30 | SUBUTEX | SL | TAB | 8 | Buprenorphine |
| 50383-0287-93 | BUPRENORPHINE-NALOXONE | SL | TAB | 8-2 | Buprenorphine/Naloxone |
| 50383-0294-93 | BUPRENORPHINE-NALOXONE | SL | TAB | 2-0.5 | Buprenorphine/Naloxone |
| 52959-0304-30 | SUBOXONE | SL | TAB | 8-2 | Buprenorphine/Naloxone |
| 52959-0749-30 | SUBOXONE | SL | TAB | 2-0.5 | Buprenorphine/Naloxone |
| 53217-0138-30 | BUPRENORPHINE-NALOXONE | SL | TAB | 8-2 | Buprenorphine/Naloxone |
| 54123-0114-30 | ZUBSOLV | SL | TAB | 11.4-2.9 | Buprenorphine/Naloxone |
| 54123-0914-30 | ZUBSOLV | SL | TAB | 1.4-0.36 | Buprenorphine/Naloxone |
| 54123-0929-30 | ZUBSOLV | SL | TAB | 2.9-0.71 | Buprenorphine/Naloxone |
| 54123-0957-30 | ZUBSOLV | SL | TAB | 5.7-1.4 | Buprenorphine/Naloxone |
| 54123-0986-30 | ZUBSOLV | SL | TAB | 8.6-2.1 | Buprenorphine/Naloxone |
| 54569-5496-00 | SUBOXONE | SL | TAB | 2-0.5 | Buprenorphine/Naloxone |
| 54569-5739-00 | SUBOXONE | SL | TAB | 8-2 | Buprenorphine/Naloxone |
| 54569-5739-01 | SUBOXONE | SL | TAB | 8-2 | Buprenorphine/Naloxone |
| 54569-5739-02 | SUBOXONE | SL | TAB | 8-2 | Buprenorphine/Naloxone |
| 54569-6399-00 | SUBOXONE | SL | FIL | 8-2 | Buprenorphine/Naloxone |
| 54569-6408-00 | BUPRENORPHINE-NALOXONE | SL | TAB | 8-2 | Buprenorphine/Naloxone |
| 54868-5707-00 | SUBOXONE | SL | TAB | 8-2 | Buprenorphine/Naloxone |
| 54868-5707-01 | SUBOXONE | SL | TAB | 8-2 | Buprenorphine/Naloxone |
| 54868-5707-02 | SUBOXONE | SL | TAB | 8-2 | Buprenorphine/Naloxone |
| 54868-5707-03 | SUBOXONE | SL | TAB | 8-2 | Buprenorphine/Naloxone |
| 54868-5707-04 | SUBOXONE | SL | TAB | 8-2 | Buprenorphine/Naloxone |
| 54868-5750-00 | SUBOXONE | SL | TAB | 2-0.5 | Buprenorphine/Naloxone |
| 55045-3784-03 | SUBOXONE | SL | TAB | 8-2 | Buprenorphine/Naloxone |
| 55700-0147-30 | SUBOXONE | SL | FIL | 8-2 | Buprenorphine/Naloxone |
| 55700-0184-30 | BUPRENORPHINE-NALOXONE | SL | TAB | 2-0.5 | Buprenorphine/Naloxone |
| 55887-0312-04 | SUBOXONE | SL | TAB | 8-2 | Buprenorphine/Naloxone |
| 55887-0312-15 | SUBOXONE | SL | TAB | 8-2 | Buprenorphine/Naloxone |
| 59385-0012-01 | BUNAVAIL | MM | FIL | 2.1-0.3 | Buprenorphine/Naloxone |
| 59385-0012-30 | BUNAVAIL | MM | FIL | 2.1-0.3 | Buprenorphine/Naloxone |
| 59385-0014-01 | BUNAVAIL | MM | FIL | 4.2-0.7 | Buprenorphine/Naloxone |
| 59385-0014-30 | BUNAVAIL | MM | FIL | 4.2-0.7 | Buprenorphine/Naloxone |
| 59385-0016-01 | BUNAVAIL | MM | FIL | 6.3-1 | Buprenorphine/Naloxone |
| 59385-0016-30 | BUNAVAIL | MM | FIL | 6.3-1 | Buprenorphine/Naloxone |
| 63629-4028-01 | SUBOXONE | SL | TAB | 2-0.5 | Buprenorphine/Naloxone |
| 63629-4034-01 | SUBOXONE | SL | TAB | 8-2 | Buprenorphine/Naloxone |
| 63629-4034-02 | SUBOXONE | SL | TAB | 8-2 | Buprenorphine/Naloxone |
| 63629-4034-03 | SUBOXONE | SL | TAB | 8-2 | Buprenorphine/Naloxone |
| 63629-4092-01 | SUBUTEX | SL | TAB | 8 | Buprenorphine |
| 63874-1084-03 | SUBOXONE | SL | TAB | 8-2 | Buprenorphine/Naloxone |
| 63874-1085-03 | SUBOXONE | SL | TAB | 2-0.5 | Buprenorphine/Naloxone |
| 63874-1173-03 | SUBUTEX | SL | TAB | 8 | Buprenorphine |
| 63874-1174-03 | SUBUTEX | SL | TAB | 2 | Buprenorphine |
| 65162-0415-03 | BUPRENORPHINE-NALOXONE | SL | TAB | 8-2 | Buprenorphine/Naloxone |
| 65162-0416-03 | BUPRENORPHINE-NALOXONE | SL | TAB | 2-0.5 | Buprenorphine/Naloxone |
| 66336-0015-30 | SUBOXONE | SL | TAB | 2-0.5 | Buprenorphine/Naloxone |
| 66336-0016-30 | SUBOXONE | SL | TAB | 8-2 | Buprenorphine/Naloxone |
| 68071-1380-03 | SUBOXONE | SL | TAB | 8-2 | Buprenorphine/Naloxone |
| 68071-1510-03 | SUBOXONE | SL | TAB | 2-0.5 | Buprenorphine/Naloxone |
| 68258-2999-03 | SUBOXONE | SL | TAB | 2-0.5 | Buprenorphine/Naloxone |
| 63459-0300-42 | VIVITROL | IM | GER | 380 | VIVITROL |
| 65757-0300-01 | VIVITROL | IM | GER | 380 | VIVITROL |
APPENDIX C. CPT, REVENUE, AND HEALTHCARE COMMON PROCEDURE CODING SYSTEM SERVICE CODES
| Category | Code | Description of CPT or Revenue Code | Additional Codes |
|---|---|---|---|
| Residential | H0010 | Alcohol and/or drug services; subacute detoxification (residential addiction program inpatient) | DX |
| Residential | H0011 | Alcohol and/or drug services; acute detoxification (residential addiction program inpatient) | DX |
| Residential | H0017 | Behavioral health; residential (hospital residential treatment program), without room and board, per diem | DX |
| Residential | H0018 | Behavioral health; short-term residential (non-hospital residential treatment program), without room and board, per diem | DX |
| Residential | H0019 | Behavioral health; long-term residential (non-medical, non-acute care in a residential treatment program where stay is typically longer than 30 days), without room and board, per diem | DX |
| Residential | T2048 | Behavioral health; long-term care residential (non-acute care in a residential treatment program where stay is typically longer than 30 days), with room and board, per diem | DX |
| Residential | H0012 | Alcohol and/or drug services; subacute detoxification (residential addiction program outpatient) | DX |
| Residential | H0013 | Alcohol and/or drug services; acute detoxification (residential addiction program outpatient) | DX |
| Residential | 1001 (rev) | Residential treatment--psychiatric | DX |
| Residential | 1002 (rev) | Residential treatment--chemical dependency | DX |
| Residential | 90791 | Psychiatric diagnostic evaluation, initial diagnostic interview, excludes medical services | DX, POS |
| Residential | 90792 | Psychiatric diagnostic evaluation with medical services | DX, POS |
| Residential | 90801 | Diagnostic interview examination *code deleted in 2013 and replaced by 90791* | DX, POS |
| Residential | 90802 | Interactive diagnostic interview examination *code deleted in 2013 replaced by 90792* | DX, POS |
| Residential | 90816 | Individual psychotherapy, 20-30 min *code deleted in 2013* | DX, POS |
| Residential | 90817 | Individual psychotherapy with E/M, 20-30 min *code deleted in 2013* | DX, POS |
| Residential | 90818 | Individual psychotherapy, 45-50 min *code deleted in 2013* | DX, POS |
| Residential | 90819 | Individual psychotherapy with E/M, 45-50 min *code deleted in 2013* | DX, POS |
| Residential | 90821 | Individual psychotherapy, 75-80 min *code deleted in 2013* | DX, POS |
| Residential | 90822 | Individual psychotherapy with E/M, 75-80 min *code deleted in 2013* | DX, POS |
| Residential | 90823 | Interactive individual psychotherapy 20-30 min *code deleted in 2013* | DX, POS |
| Residential | 90824 | Interactive individual psychotherapy with E/M 20-30 min *code deleted in 2013* | DX, POS |
| Residential | 90826 | Interactive individual psychotherapy, 45-50 min *code deleted in 2013* | DX, POS |
| Residential | 90827 | Interactive individual psychotherapy with E/M 45-50 min *code deleted in 2013* | DX, POS |
| Residential | 90828 | Interactive individual psychotherapy, 75-80 min *code deleted in 2013* | DX, POS |
| Residential | 90829 | Interactive individual psychotherapy with E/M 75-80 min *code deleted in 2013* | DX, POS |
| Residential | 90832 | Psychotherapy, 30 min | DX, POS |
| Residential | 90833 | E/M plus psychotherapy add-on, 30 min | DX, POS |
| Residential | 90834 | Psychotherapy, 45 min | DX, POS |
| Residential | 90836 | E/M plus psychotherapy add-on, 45 min | DX, POS |
| Residential | 90837 | Psychotherapy, 60 min | DX, POS |
| Residential | 90839 | Psychotherapy for crisis | DX, POS |
| Residential | 90840 | Psychotherapy for crisis, add-on for each additional 30 min | DX, POS |
| Residential | 90845 | Psychoanalysis | DX, POS |
| Residential | 90847 | Family psychotherapy, conjoint psychotherapy with patient present | DX, POS |
| Residential | 90849 | Multiple-family group psychotherapy | DX, POS |
| Residential | 90853 | Group psychotherapy, more than of a multiple-family group | DX, POS |
| Residential | 90857 | Interactive group psychotherapy *code deleted in 2013* | DX, POS |
| Residential | 90862 | Pharmacologic management *code deleted in 2013* | DX, POS |
| Residential | 90867 | Therapeutic repetitive TMS | DX, POS |
| Residential | 90868 | Subsequent TMS Delivery and Management | DX, POS |
| Residential | 90869 | Subsequent TMS Motor Threshold Re-Determination with Delivery and Management | DX, POS |
| Residential | 90870 | Electroconvulsive Therapy | DX, POS |
| Residential | 90875 | Individual Psychophysiological Therapy Incorporating Biofeedback Training by any Modality, 20-30 min | DX, POS |
| Residential | 90876 | Individual Psychophysiological Therapy Incorporating Biofeedback Training by any Modality, 45-50 min | DX, POS |
| Residential | 99221 | Initial hospital care, per day, for the evaluation and management of a patient, low severity | DX, POS |
| Residential | 99222 | Initial hospital care, per day, for the evaluation and management of a patient, moderate severity | DX, POS |
| Residential | 99223 | Initial hospital care, per day, for the evaluation and management of a patient, high severity | DX, POS |
| Residential | 99231 | Inpatient services, subsequent hospital care, low complexity | DX, POS |
| Residential | 99232 | Inpatient services, subsequent hospital care, moderate complexity | DX, POS |
| Residential | 99233 | Inpatient services, subsequent hospital care, unstable or high complexity | DX, POS |
| Residential | 99238 | Hospital discharge services, 30 min or less | DX, POS |
| Residential | 99239 | Hospital discharge services, more than 30 min | DX, POS |
| Residential | 99251 | Inpatient consultation, self-limited or minor, 20 min at bedside | DX, POS |
| Residential | 99252 | Inpatient consultation, low severity, 40 min at bedside | DX, POS |
| Residential | 99253 | Inpatient consultation, moderate severity, 55 min at bedside | DX, POS |
| Residential | 99254 | Inpatient consultation, moderate to high severity, 80 min at bedside | DX, POS |
| Residential | 99255 | Inpatient consultation, moderate to high severity, 110 min at bedside | DX, POS |
| IOP or Partial Hosp. | G0410 | Group psychotherapy other than of a multiple-family group, in a partial hospitalization setting, approximately 45-50 min | DX |
| IOP or Partial Hosp. | G0411 | Interactive group psychotherapy, in a partial hospitalization setting, approximately 45-50 min | DX |
| IOP or Partial Hosp. | H0015 | Alcohol and/or drug services; intensive outpatient (treatment program that operates at least 3 hours/day and at least 3 days/week and is based on an individualized treatment plan), including assessment, counseling; crisis intervention, and activity therapies or education | DX |
| IOP or Partial Hosp. | H0035 | Mental health partial hospitalization, treatment, less than 24 hours | DX |
| IOP or Partial Hosp. | H2001 | Rehabilitation program, per 1/2 day | DX |
| IOP or Partial Hosp. | H2012 | Behavioral health day treatment, per hour | DX |
| IOP or Partial Hosp. | S0201 | Partial hospitalization services, less than 24 hours, per diem | DX |
| IOP or Partial Hosp. | S9480 | Intensive outpatient psychiatric services, per diem | DX |
| IOP or Partial Hosp. | S9484 | Crisis intervention mental health services, per hour | DX |
| IOP or Partial Hosp. | S9485 | Crisis intervention mental health services, per diem | DX |
| IOP or Partial Hosp. | 0905 (rev) | Intensive outpatient services--psychiatric | DX |
| IOP or Partial Hosp. | 0906 (rev) | Chemical dependency | DX |
| IOP or Partial Hosp. | 0907 (rev) | Community behavioral health program--day treatment | DX |
| IOP or Partial Hosp. | 0912 (rev) | Partial hospitalization-less intensive | DX |
| IOP or Partial Hosp. | 0913 (rev) | Partial hospitalization-intensive | DX |
| IOP or Partial Hosp. | h0009 | Alc/drug services--acute detox (hosp inpt) | DX, POS |
| IOP or Partial Hosp. | g0378 | Hospital observation service, per hour | DX, POS |
| IOP or Partial Hosp. | 90791 | Psychiatric diagnostic evaluation, initial diagnostic interview, excludes medical services | DX, POS |
| IOP or Partial Hosp. | 90792 | Psychiatric diagnostic evaluation with medical services | DX, POS |
| IOP or Partial Hosp. | 90801 | Diagnostic interview examination *code deleted in 2013 and replaced by 90791* | DX, POS |
| IOP or Partial Hosp. | 90802 | Interactive diagnostic interview examination *code deleted in 2013 replaced by 90792* | DX, POS |
| IOP or Partial Hosp. | 90816 | Individual psychotherapy, 20-30 min *code deleted in 2013* | DX, POS |
| IOP or Partial Hosp. | 90817 | Individual psychotherapy with E/M, 20-30 min *code deleted in 2013* | DX, POS |
| IOP or Partial Hosp. | 90818 | Individual psychotherapy, 45-50 min *code deleted in 2013* | DX, POS |
| IOP or Partial Hosp. | 90819 | Individual psychotherapy with E/M, 45-50 min *code deleted in 2013* | DX, POS |
| IOP or Partial Hosp. | 90821 | Individual psychotherapy, 75-80 min *code deleted in 2013* | DX, POS |
| IOP or Partial Hosp. | 90822 | Individual psychotherapy with E/M, 75-80 min *code deleted in 2013* | DX, POS |
| IOP or Partial Hosp. | 90823 | Interactive individual psychotherapy 20-30 min *code deleted in 2013* | DX, POS |
| IOP or Partial Hosp. | 90824 | Interactive individual psychotherapy with E/M 20-30 min *code deleted in 2013* | DX, POS |
| IOP or Partial Hosp. | 90826 | Interactive individual psychotherapy, 45-50 min *code deleted in 2013* | DX, POS |
| IOP or Partial Hosp. | 90827 | Interactive individual psychotherapy with E/M 45-50 min *code deleted in 2013* | DX, POS |
| IOP or Partial Hosp. | 90828 | Interactive individual psychotherapy, 75-80 min *code deleted in 2013* | DX, POS |
| IOP or Partial Hosp. | 90829 | Interactive individual psychotherapy with E/M 75-80 min *code deleted in 2013* | DX, POS |
| IOP or Partial Hosp. | 90832 | Psychotherapy, 30 min | DX, POS |
| IOP or Partial Hosp. | 90833 | E/M plus psychotherapy add-on, 30 min | DX, POS |
| IOP or Partial Hosp. | 90834 | Psychotherapy, 45 min | DX, POS |
| IOP or Partial Hosp. | 90836 | E/M plus psychotherapy add-on, 45 min | DX, POS |
| IOP or Partial Hosp. | 90837 | Psychotherapy, 60 min | DX, POS |
| IOP or Partial Hosp. | 90839 | Psychotherapy for crisis | DX, POS |
| IOP or Partial Hosp. | 90840 | Psychotherapy for crisis, add-on for each additional 30 min | DX, POS |
| IOP or Partial Hosp. | 90845 | Psychoanalysis | DX, POS |
| IOP or Partial Hosp. | 90847 | Family psychotherapy, conjoint psychotherapy with patient present | DX, POS |
| IOP or Partial Hosp. | 90849 | Multiple-family group psychotherapy | DX, POS |
| IOP or Partial Hosp. | 90853 | Group psychotherapy, more than of a multiple-family group | DX, POS |
| IOP or Partial Hosp. | 90855 | psych eval hosp records dx purposes | DX, POS |
| IOP or Partial Hosp. | 90857 | Interactive group psychotherapy *code deleted in 2013* | DX, POS |
| IOP or Partial Hosp. | 90862 | Pharmacologic management *code deleted in 2013* | DX, POS |
| IOP or Partial Hosp. | 90867 | Therapeutic repetitive TMS | DX, POS |
| IOP or Partial Hosp. | 90868 | Subsequent TMS Delivery and Management | DX, POS |
| IOP or Partial Hosp. | 90869 | Subsequent TMS Motor Threshold Re-Determination with Delivery and Management | DX, POS |
| IOP or Partial Hosp. | 90870 | Electroconvulsive Therapy | DX, POS |
| IOP or Partial Hosp. | 90875 | Individual Psychophysiological Therapy Incorporating Biofeedback Training by any Modality, 20-30 min | DX, POS |
| IOP or Partial Hosp. | 90876 | Individual Psychophysiological Therapy Incorporating Biofeedback Training by any Modality, 45-50 min | DX, POS |
| IOP or Partial Hosp. | 99221 | Initial hospital care, per day, for the evaluation and management of a patient, low severity | DX, POS |
| IOP or Partial Hosp. | 99222 | Initial hospital care, per day, for the evaluation and management of a patient, moderate severity | DX, POS |
| IOP or Partial Hosp. | 99223 | Initial hospital care, per day, for the evaluation and management of a patient, high severity | DX, POS |
| IOP or Partial Hosp. | 99224 | Subsequent observation care/day 15 min | DX, POS |
| IOP or Partial Hosp. | 99225 | Subsequent observation care/day 25 min | DX, POS |
| IOP or Partial Hosp. | 99226 | Subsequent observation care/day 35 min | DX, POS |
| IOP or Partial Hosp. | 99231 | Inpatient services, subsequent hospital care, low complexity | DX, POS |
| IOP or Partial Hosp. | 99232 | Inpatient services, subsequent hospital care, moderate complexity | DX, POS |
| IOP or Partial Hosp. | 99233 | Inpatient services, subsequent hospital care, unstable or high complexity | DX, POS |
| IOP or Partial Hosp. | 99234 | Observation/inpatient hospital care 40 min | DX, POS |
| IOP or Partial Hosp. | 99235 | Observation/inpatient hospital care 50 min | DX, POS |
| IOP or Partial Hosp. | 99238 | Hospital discharge services, 30 min or less | DX, POS |
| IOP or Partial Hosp. | 99239 | Hospital discharge services, more than 30 min | DX, POS |
| IOP or Partial Hosp. | 99251 | Inpatient consultation, self-limited or minor, 20 min at bedside | DX, POS |
| IOP or Partial Hosp. | 99252 | Inpatient consultation, low severity, 40 min at bedside | DX, POS |
| IOP or Partial Hosp. | 99253 | Inpatient consultation, moderate severity, 55 min at bedside | DX, POS |
| IOP or Partial Hosp. | 99254 | Inpatient consultation, moderate to high severity, 80 min at bedside | DX, POS |
| IOP or Partial Hosp. | 99255 | Inpatient consultation, moderate to high severity, 110 min at bedside | DX, POS |
| ED Visits | 0450 (rev) | ER-General | DX |
| ED Visits | 0451 (rev) | EMTALA emergency medical screening services | DX |
| ED Visits | 0452 (rev) | ER beyond EMTALA screening | DX |
| ED Visits | 0456 (rev) | Urgent Care | DX |
| ED Visits | 0459 (rev) | Other | DX |
| ED Visits | 0981 (rev) | Professional fees-ER | DX |
| ED Visits | 99281 | ED Services, self-limited or minor | DX |
| ED Visits | 99282 | ED Services, low or moderate severity | DX |
| ED Visits | 99283 | ED Services, moderate severity | DX |
| ED Visits | 99284 | ED Services, high severity | DX |
| ED Visits | 99285 | ED Services, high severity and pose immediate and significant threat to life or physiological function | DX |
| Outpatient Visit | 98960 | Education and training for patient self-management by a qualified, non-physician health care professional using a standardized curriculum, face-to-face with the patient; individual patient | DX |
| Outpatient Visit | 98961 | Education and training for patient self-management by a qualified, non-physician health care professional using a standardized curriculum, face-to-face with the patient; 2-4 patients | DX |
| Outpatient Visit | 98962 | Education and training for patient self-management by a qualified, non-physician health care professional using a standardized curriculum, face-to-face with the patient; 5-8 patients | DX |
| Outpatient Visit | 99078 | Physician educational services rendered to patients in a group setting | DX |
| Outpatient Visit | 99201 | Office or Other outpatient services, new patient, self-limited or minor, 10 min | DX |
| Outpatient Visit | 99202 | Office or Other outpatient services, new patient, low to moderate severity, 20 min | DX |
| Outpatient Visit | 99203 | Office or Other outpatient services, new patient, moderate severity, 30 min | DX |
| Outpatient Visit | 99204 | Office or Other outpatient services, moderate to high severity, 45 min | DX |
| Outpatient Visit | 99205 | Office or Other outpatient services, moderate to high severity, 60 min | DX |
| Outpatient Visit | 99211 | This code is used for a service that may not require the presence of a physician. Presenting problems are minimal, and 5 min is the typical time that would be spent performing or supervising these services. | DX |
| Outpatient Visit | 99212 | Established patient, self-limited or minor, 10 mins | DX |
| Outpatient Visit | 99213 | Established patient, low to moderate severity, 15 mins | DX |
| Outpatient Visit | 99214 | Established patient, moderate to high severity, 25 min | DX |
| Outpatient Visit | 99215 | Established patient, moderate to high severity, 40 mins | DX |
| Outpatient Visit | 99217 | This code is used to report all services provided on discharge from "observation status" if the discharge occurs after the initial date of "observation status." | DX |
| Outpatient Visit | 99218 | Initial observation care, low severity | DX |
| Outpatient Visit | 99219 | Initial observation care, moderate severity | DX |
| Outpatient Visit | 99220 | Initial observation care, high severity | DX |
| Outpatient Visit | 99241 | Office or other outpatient consultations, self-limited or minor, 15 min | DX |
| Outpatient Visit | 99242 | Office or other outpatient consultation, low severity, 30 min | DX |
| Outpatient Visit | 99243 | Office or other outpatient consultation, moderate severity, 40 min | DX |
| Outpatient Visit | 99244 | Office or other outpatient consultation, moderate to high severity, 60 min | DX |
| Outpatient Visit | 99245 | Office or other outpatient consultation, moderate to high severity, 80 min | DX |
| Outpatient Visit | 99341 | Home services, new patient, low severity, 20 min | DX |
| Outpatient Visit | 99342 | Home services, new patient, moderate severity 30 min | DX |
| Outpatient Visit | 99343 | Home services, new patient, moderate to high severity, 45 min | DX |
| Outpatient Visit | 99344 | Home services, new patient, high severity, 60 min | DX |
| Outpatient Visit | 99345 | Home services, new patient, patient unstable or developed significant new problem, 75 min | DX |
| Outpatient Visit | 99347 | Home services, established patient, low severity, 20 min | DX |
| Outpatient Visit | 99348 | Home services, established patient, low to moderate severity 25 min | DX |
| Outpatient Visit | 99349 | Home services, established patient, moderate to high severity, 40 min | DX |
| Outpatient Visit | 99350 | Home services, established patient, moderate to high severity, patient may be unstable, 60 min | DX |
| Outpatient Visit | 99384 | Initial evaluation of new patient, 12-17 years | DX |
| Outpatient Visit | 99385 | Initial evaluation of new patient, 18-39 years | DX |
| Outpatient Visit | 99386 | Initial evaluation of new patient, 40-64 years | DX |
| Outpatient Visit | 99387 | Initial evaluation of new patient, 65 and over | DX |
| Outpatient Visit | 99394 | Initial evaluation of established patient, 12-17 years | DX |
| Outpatient Visit | 99395 | Initial evaluation of established patient, 18-39 years | DX |
| Outpatient Visit | 99396 | Initial evaluation of established patient, 40-64 years | DX |
| Outpatient Visit | 99397 | Initial evaluation of established patient, 65 and over | DX |
| Outpatient Visit | 99401 | Preventive medicine counseling and/or risk factor reduction intervention(s) provided to an individual (separate procedure); approximately 15 min | DX |
| Outpatient Visit | 99402 | Preventive medicine counseling and/or risk factor reduction intervention(s) provided to an individual (separate procedure); approximately 30 min | DX |
| Outpatient Visit | 99403 | Preventive medicine counseling and/or risk factor reduction intervention(s) provided to an individual (separate procedure); approximately 45 min | DX |
| Outpatient Visit | 99404 | Preventive medicine counseling and/or risk factor reduction intervention(s) provided to an individual (separate procedure); approximately 60 min | DX |
| Outpatient Visit | 99408 | Counseling risk factor reduction and behavior change, 15-30 min, includes the administration of an alcohol and/or substance abuse screening tool and brief intervention | DX |
| Outpatient Visit | 99409 | Counseling risk factor reduction and behavior change, 30 min or more | DX |
| Outpatient Visit | 99411 | Group counseling services, preventative medicine, 30 min | DX |
| Outpatient Visit | 99412 | Group counseling services, preventative medicine, 60 min | DX |
| Outpatient Visit | 99510 | Home visit for individual, family, or marriage counseling | DX |
| Outpatient Visit | 99605 | Medication therapy initial, 15 min new patient | DX |
| Outpatient Visit | 99606 | Medication therapy initial, 15 min established pt | DX |
| Outpatient Visit | G0155 | Services of clinical social worker in home health or hospice settings, each 15 min | DX |
| Outpatient Visit | G0176 | Activity therapy, such as music, dance, art or play therapies not for recreation, related to the care and treatment of patient's disabling mental health problems, per session (45 min or more) | DX |
| Outpatient Visit | G0177 | Training and educational services related to the care and treatment of patient's disabling mental health problems per session (45 min or more) | DX |
| Outpatient Visit | G0396 | Alcohol and/or substance (other than tobacco) abuse structured assessment (e.g., audit, dast), and brief intervention 15-30 min | DX |
| Outpatient Visit | G0397 | Alcohol and/or substance (other than tobacco) abuse structured assessment (e.g., audit, dast), and intervention, greater than 30 min | DX |
| Outpatient Visit | G0409 | Social work and psychological services, directly relating to and/or furthering the patient's rehabilitation goals, each 15 min, face-to-face; individual (services provided by a corf-qualified social worker or psychologist in a corf) | DX |
| Outpatient Visit | G0443 | Brief face-to-face behavioral counseling for alcohol misuse, 15 min | DX |
| Outpatient Visit | G0463 | Hospital outpatient clinic visit for assessment and management of a patient | DX |
| Outpatient Visit | H0001 | Alcohol and/or drug assessment | DX |
| Outpatient Visit | H0002 | Behavioral health screening to determine eligibility for admission to treatment program | DX |
| Outpatient Visit | H0004 | Behavioral health counseling and therapy, per 15 min | DX |
| Outpatient Visit | H0005 | Alcohol and/or drug services; group counseling by a clinician | DX |
| Outpatient Visit | H0007 | Alcohol and/or drug services; crisis intervention (outpatient) | DX |
| Outpatient Visit | H0014 | Alc/drug ambulatory detox | DX |
| Outpatient Visit | H0016 | Alcohol and/or drug services; medical/somatic (medical intervention in ambulatory setting) | DX |
| Outpatient Visit | H0022 | Alcohol and/or drug intervention service (planned facilitation) | DX |
| Outpatient Visit | H0031 | Mental health assessment, by non-physician | DX |
| Outpatient Visit | H0034 | Medication training and support, per 15 min | DX |
| Outpatient Visit | H0036 | Community psychiatric supportive treatment, face-to-face, per 15 min | DX |
| Outpatient Visit | H0037 | Community psychiatric supportive treatment program, per diem | DX |
| Outpatient Visit | H0039 | Assertive community treatment, face-to-face, per 15 min | DX |
| Outpatient Visit | H0040 | Assertive community treatment program, per diem | DX |
| Outpatient Visit | H2000 | Comprehensive multidisciplinary evaluation | DX |
| Outpatient Visit | H2010 | Comprehensive medication services, per 15 min | DX |
| Outpatient Visit | H2011 | Crisis intervention service, per 15 min | DX |
| Outpatient Visit | H2013 | Psychiatric health facility service, per diem | DX |
| Outpatient Visit | H2014 | Skills training and development, per 15 min | DX |
| Outpatient Visit | H2015 | Comprehensive community support services, per 15 min | DX |
| Outpatient Visit | H2016 | Comprehensive community support services, per diem | DX |
| Outpatient Visit | H2017 | Psychosocial rehabilitation services, per 15 min | DX |
| Outpatient Visit | H2018 | Psychosocial rehabilitation services, per diem | DX |
| Outpatient Visit | H2019 | Therapeutic behavioral services, per 15 min | DX |
| Outpatient Visit | H2020 | Therapeutic behavioral services, per diem | DX |
| Outpatient Visit | H2035 | Alcohol and/or other drug treatment program, per hour | DX |
| Outpatient Visit | H2036 | Alcohol and/or other drug treatment program, per diem | DX |
| Outpatient Visit | H0046 | Mental health services not otherwise specified | DX |
| Outpatient Visit | H0047 | Alc/drug abuse svc not otherwise specified | DX |
| Outpatient Visit | H0050 | Alc/drug brief intervention, per 15 min | DX |
| Outpatient Visit | M0064 | Brief office visit for the sole purpose of monitoring or changing drug prescriptions used in the treatment of mental psychoneurotic and personality disorders | DX |
| Outpatient Visit | S9475 | Ambulatory setting substance abuse tx/detox | DX |
| Outpatient Visit | T1006 | Alcohol and/or substance abuse services, family/couple counseling | DX |
| Outpatient Visit | T1012 | Alcohol and/or substance abuse services, skills development | DX |
| Outpatient Visit | T1015 | Clinic visit/encounter, all-inclusive | DX |
| Outpatient Visit | 0510 (rev) | General clinic visit | DX |
| Outpatient Visit | 0513 (rev) | Psychiatric clinic | DX |
| Outpatient Visit | 0515 (rev) | Pediatric clinic | DX |
| Outpatient Visit | 0516 (rev) | Urgent care clinic | DX |
| Outpatient Visit | 0517 (rev) | Family practice clinic | DX |
| Outpatient Visit | 0519 (rev) | Other clinic | DX |
| Outpatient Visit | 0520 (rev) | Freestanding clinic, general | DX |
| Outpatient Visit | 0521 (rev) | Clinic visit by member to RHC/FQHC | DX |
| Outpatient Visit | 0522 (rev) | Home visit by RHC/FQHC practitioner | DX |
| Outpatient Visit | 0523 (rev) | Family practice clinic | DX |
| Outpatient Visit | 0526 (rev) | Urgent care clinic | DX |
| Outpatient Visit | 0527 (rev) | Visiting nurse services to member's home in a home health shortage area | DX |
| Outpatient Visit | 0528 (rev) | Visit by RHC/FQHC practitioner to other non-RHC/FQHC site (e.g., scene of accident) | DX |
| Outpatient Visit | 0529 (rev) | Other Freestanding clinic | DX |
| Outpatient Visit | 0900 (rev) | BH Treatment/services, general | DX |
| Outpatient Visit | 0902 (rev) | Milieu therapy | DX |
| Outpatient Visit | 0903 (rev) | Play therapy | DX |
| Outpatient Visit | 0904 (rev) | Activity therapy | DX |
| Outpatient Visit | 0911 (rev) | Rehabilitation | DX |
| Outpatient Visit | 0914 (rev) | Individual therapy | DX |
| Outpatient Visit | 0915 (rev) | Group therapy | DX |
| Outpatient Visit | 0916 (rev) | Family therapy | DX |
| Outpatient Visit | 0917 (rev) | Biofeedback | DX |
| Outpatient Visit | 0919 (rev) | BH treatments | DX |
| Outpatient Visit | 0944 (rev) | Drug rehabilitation | DX |
| Outpatient Visit | 0945 (rev) | Alcohol rehabilitation | DX |
| Outpatient Visit | 0982 (rev) | Outpatient services, fees | DX |
| Outpatient Visit | 0983 (rev) | Clinic, fees | DX |
| Outpatient Visit | 90791 | Psychiatric diagnostic evaluation, initial diagnostic interview, excludes medical services | DX, POS |
| Outpatient Visit | 90792 | Psychiatric diagnostic evaluation with medical services | DX, POS |
| Outpatient Visit | 90801 | Diagnostic Interview Examination | DX, POS |
| Outpatient Visit | 90802 | Interactive diagnostic interview examination | DX, POS |
| Outpatient Visit | 90862 | Pharmacologic management *code deleted in 2013* | DX, POS |
| Outpatient Visit | 90867 | Therapeutic repetitive TMS | DX, POS |
| Outpatient Visit | 90868 | Subsequent TMS Delivery and Management | DX, POS |
| Outpatient Visit | 90869 | Subsequent TMS Motor Threshold Re-Determination with Delivery and Management | DX, POS |
| Outpatient Visit | 90870 | Electroconvulsive Therapy | DX, POS |
| Outpatient Codes: Psychotherapy Codes | 90785 | Psychotherapy complex interactive, add-on for "difficult" patient | DX, POS |
| Outpatient Codes: Psychotherapy Codes | 90804 | Individual psychotherapy, insight-oriented, behavior modifying and/or supportive, in an office or outpatient facility, 20-30 min | DX, POS |
| Outpatient Codes: Psychotherapy Codes | 90805 | Individual psychotherapy, insight-oriented, behavior modifying and/or supportive, in an office or outpatient facility, with medical evaluation and management | DX, POS |
| Outpatient Codes: Psychotherapy Codes | 90806 | Individual therapy, 45-50 min | DX, POS |
| Outpatient Codes: Psychotherapy Codes | 90807 | Individual therapy with med management | DX, POS |
| Outpatient Codes: Psychotherapy Codes | 90808 | Individual therapy, 75-80 min | DX, POS |
| Outpatient Codes: Psychotherapy Codes | 90809 | Individual therapy with med management | DX, POS |
| Outpatient Codes: Psychotherapy Codes | 90810 | Interactive therapy 20-30 min | DX, POS |
| Outpatient Codes: Psychotherapy Codes | 90811 | Interactive therapy, med management | DX, POS |
| Outpatient Codes: Psychotherapy Codes | 90812 | Interactive therapy, 45-50 min | DX, POS |
| Outpatient Codes: Psychotherapy Codes | 90813 | Interactive therapy, med management | DX, POS |
| Outpatient Codes: Psychotherapy Codes | 90814 | Interactive therapy, 75-80 min | DX, POS |
| Outpatient Codes: Psychotherapy Codes | 90815 | Interactive therapy, med management | DX, POS |
| Outpatient Codes: Psychotherapy Codes | 90857 | Interactive group psychotherapy *code deleted in 2013* | DX, POS |
| Outpatient Codes: Psychotherapy Codes | 90832 | Psychotherapy, 30 min | DX, POS |
| Outpatient Codes: Psychotherapy Codes | 90833 | E/M plus psychotherapy add-on, 30 min | DX, POS |
| Outpatient Codes: Psychotherapy Codes | 90834 | Psychotherapy, 45 min | DX, POS |
| Outpatient Codes: Psychotherapy Codes | 90836 | E/M plus psychotherapy add-on, 45 min | DX, POS |
| Outpatient Codes: Psychotherapy Codes | 90837 | Psychotherapy, 60 min | DX, POS |
| Outpatient Codes: Psychotherapy Codes | 90838 | Individual Psychotherapy, 60 min with patient and/or family member when performed with an evaluation and management service | DX, POS |
| Outpatient Codes: Psychotherapy Codes | 90853 | Group psychotherapy, more than of a multiple-family group | DX, POS |
| Outpatient Codes: Psychotherapy Codes | 90839 | Psychotherapy for crisis | DX, POS |
| Outpatient Codes: Psychotherapy Codes | 90840 | Psychotherapy for crisis, add-on for each additional 30 min | DX, POS |
| Outpatient Codes: Psychotherapy Codes | 90844 | Psychotherapy 45-50 min | DX, POS |
| Outpatient Codes: Psychotherapy Codes | 90845 | Psychoanalysis | DX, POS |
| Outpatient Codes: Psychotherapy Codes | 90847 | Family psychotherapy, conjoint psychotherapy with patient present | DX, POS |
| Outpatient Codes: Psychotherapy Codes | 90849 | Multiple-family group psychotherapy | DX, POS |
| Outpatient Codes: Psychotherapy Codes | 90863 | Pharm management w/ psych add-on for prescribing psychologist in certain states | DX, POS |
| Outpatient Codes: Psychotherapy Codes | 90875 | Individual psychophysiological therapy incorporating biofeedback training by any modality, 20-30 min | DX, POS |
| Outpatient Codes: Psychotherapy Codes | 90876 | Individual psychophysiological therapy incorporating biofeedback training by any modality, 45-50 min | DX, POS |
| Outpatient Codes: Psychotherapy Codes | 99355 | Individual psychophysiological therapy incorporating biofeedback training by any modality, 45-50 min | DX, POS |
| Outpatient Codes: Psychotherapy Codes | 90823 | Interactive individual psychotherapy 20-30 min *code deleted in 2013* | DX, POS |
| Outpatient Codes: Psychotherapy Codes | 90824 | Interactive individual psychotherapy with E/M 20-30 min *code deleted in 2013* | DX, POS |
| Outpatient Codes: Psychotherapy Codes | 90825 | Interactive individual psychotherapy, 45-50 min *code deleted in 2013* | DX, POS |
| Outpatient Codes: Psychotherapy Codes | 90826 | Interactive individual psychotherapy with E/M 45-50 min *code deleted in 2013* | DX, POS |
| Outpatient Codes: Psychotherapy Codes | 90827 | Interactive individual psychotherapy, 75-80 min *code deleted in 2013* | DX, POS |
| Outpatient Codes: Psychotherapy Codes | 90828 | Interactive individual psychotherapy with E/M 75-80 min *code deleted in 2013* | DX, POS |
| Outpatient Codes: Psychotherapy Codes | 90829 | Interactive individual psychotherapy with E/M 75-80 min *code deleted in 2013* | DX, POS |
| Outpatient Codes: Psychotherapy Codes | 90839 | Psychotherapy for crisis | DX, POS |
| Outpatient Codes: Psychotherapy Codes | 90840 | Psychotherapy for crisis, add-on for each additional 30 min | DX, POS |
| Outpatient: Peer Support | H0038 | Self-help/peer services, per 15 min | DX, POS |
| Outpatient: Bupr service admin. | J0571 | Buprenorphine/naloxone, oral, less than or equal to 3mg buprenorphine (Buprenorphine oral 1mg) | none |
| Outpatient: Bupr service admin. | J0572 | Buprenorphine/naloxone, oral, less than or equal to 3mg buprenorphine (Bupren/nal up to 3mg bupreno) | none |
| Outpatient: Bupr service admin. | J0573 | Buprenorphine/naloxone, oral, greater than 3mg, but less than or equal to 3.1-6mg (Bupren/nal 3.1-6mg bupren) | none |
| Outpatient: Bupr service admin. | J0574 | Buprenorphine/naloxone, oral, greater than 6mg, but less than or equal to 10mg buprenorphine (Bupren/nal 6.1-10mg bupre) | none |
| Outpatient: Bupr service admin. | J0575 | Buprenorphine/naloxone, oral, greater than 10mg buprenorphine (Bupren/nal over 10mg bupreno) | none |
| Outpatient: Methadone | H0020 | Alcohol and/or drug services; methadone administration and/or service (provision by a licensed program) | none |
| Outpatient: Methadone | S0109 | Methadone, oral, 5mg | none |
| Outpatient: Methadone | J1230 | Methadone, injection, up to 10mg | none |
| Outpatient: Naltrexone | J2315 | Vivitrol, injection, 1mg | none |
| Outpatient: Naloxone | J2310 | Naloxone Hydrochloride, injection, per 1mg | none |
| Outpatient: case management | H0006 | Alcohol/and or drug services case management | DX, POS |
| Outpatient: case management | T1007 | Treatment plan dev and/or mod for alcohol/sa | DX, POS |
| Outpatient: case management | T1017 | Targeted case management, each 15 min | DX, POS |
| Outpatient: case management | T2023 | Targeted case management, per month | DX, POS |
| Outpatient: case management | T1016 | Case management, each 15 min | DX, POS |
| IOP or Partial Hosp. | H0008 | Alcohol and/or drug services; subacute detoxification (hospital inpatient) | DX, POS |
| IOP or Partial Hosp. | H0009 | Alc/drug services--acute detox (hosp inpt) | DX, POS |
| Residential | H0010 | Alcohol and/or drug services; subacute detoxification (residential addiction program inpatient) | DX |
| Residential | H0011 | Alcohol and/or drug services; acute detoxification (residential addiction program inpatient) | DX |
| Residential | H0012 | Alcohol and/or drug services; subacute detoxification (residential addiction program outpatient) | DX |
| Residential | H0013 | Alcohol and/or drug services; acute detoxification (residential addiction program outpatient) | DX |
| Outpatient Visit | H0014 | Alc/drug ambulatory detox | DX |
| Outpatient Visit | S9475 | Ambulatory setting substance abuse tx/detox | DX |
NOTES
-
American Society of Addiction Medicine. The National Practice Guideline for the Use of Medications in the Treatment of Addiction Involving Opioid Use. June 2015. https://www.asam.org/docs/default-source/practice-support/guidelines-and-consensus-docs/asam-national-practice-guideline-supplement.pdf?sfvrsn=24.
-
Center for Substance Abuse Treatment. Clinical Guidelines for the Use of Buprenorphine in the Treatment of Opioid Addiction. 4 Treatment Protocols. Treatment Improvement Protocol (TIP) Series, No. 40. Rockville, MD: Substance Abuse and Mental Health Services Administration; 2004. https://www.ncbi.nlm.nih.gov/books/NBK64246/.
-
Mojtabai R, Chen LY, Kaufmann CN, Crum RM. Comparing barriers to mental health treatment and substance use disorder treatment among individuals with comorbid major depression and substance use disorders. Journal of Substance Abuse Treatment. 2014; 46(2): 268-273.
-
HealthCare.gov. Cost sharing. https://www.healthcare.gov/glossary/cost-sharing/.
-
Reif S, Creedon TB, Horgan CM, et al. Commercial health plan coverage of selected treatments for opioid use disorders from 2003 to 2014. Journal of Psychoactive Drugs. 2017; 49(2): 1-9.
-
American Society of Addiction Medicine. The National Practice Guideline for the Use of Medications in the Treatment of Addiction Involving Opioid Use. June 2015. https://www.asam.org/docs/default-source/practice-support/guidelines-and-consensus-docs/asam-national-practice-guideline-supplement.pdf?sfvrsn=24.
-
Center for Substance Abuse Treatment. Clinical Guidelines for the Use of Buprenorphine in the Treatment of Opioid Addiction. 4 Treatment Protocols. (Treatment Improvement Protocol (TIP) Series, No. 40.) Rockville, MD: Substance Abuse and Mental Health Services Administration; 2004. https://www.ncbi.nlm.nih.gov/books/NBK64246/.
-
Reif S, Creedon TB, Horgan CM, et al. Commercial health plan coverage of selected treatments for opioid use disorders from 2003 to 2014. Journal of Psychoactive Drugs. 2017; 49(2): 1-9.
-
American Society of Addiction Medicine. The National Practice Guideline for the Use of Medications in the Treatment of Addiction Involving Opioid Use.June 2015. https://www.asam.org/docs/default-source/practice-support/guidelines-and-consensus-docs/asam-national-practice-guideline-supplement.pdf?sfvrsn=24.
-
Center for Substance Abuse Treatment. Clinical Guidelines for the Use of Buprenorphine in the Treatment of Opioid Addiction. 4 Treatment Protocols. Treatment Improvement Protocol (TIP) Series, No. 40. Rockville, MD: Substance Abuse and Mental Health Services Administration; 2004. https://www.ncbi.nlm.nih.gov/books/NBK64246/.
-
Windham A, Gibbons B, Martinez D, Hughey L, Roberts J. (2018). Use of Medication-Assisted Treatment for Opioid Use Disorders in Employer-Sponsored Health Insurance: Final Report.
-
Heller School for Social Policy and Management. Brandeis Health Plan Surveys on Alcohol, Drug Abuse, and Mental Health Services. https://sihp.brandeis.edu/ibh/brandeis-health-plan-survey/index.html.
-
Horgan CM, Garnick DW, Merrick EL, Hodgkin D. Changes in how health plans provide behavioral health services. Journal of Behavioral Health Services & Research. 2009; 36(1): 11-24.
-
Reif S, Creedon TB, Horgan CM, et al. Commercial health plan coverage of selected treatments for opioid use disorders from 2003 to 2014. Journal of Psychoactive Drugs. 2017; 49(2): 1-9.
-
Reif S, Creedon TB, Horgan CM, et al. Commercial health plan coverage of selected treatments for opioid use disorders from 2003 to 2014. Journal of Psychoactive Drugs. 2017; 49(2): 1-9.
-
Henry J. Kaiser Family Foundation and Health Research & Educational Trust (2014). Employer Health Benefits 2014 Annual Survey: Survey Design and Methods. Henry J. Kaiser Family Foundation and Health Research & Educational Trust. https://kaiserfamilyfoundation.files.wordpress.com/2014/09/8625-methods.pdf.
-
Internal Revenue Service. Publication 969: Health Savings Accounts and Other Tax-Favored Health Plans IRS Cat. No. 24216S. February 10, 2017. https://www.irs.gov/pub/irs-pdf/p969.pdf.
-
American Society of Addiction Medicine. The National Practice Guideline for the Use of Medications in the Treatment of Addiction Involving Opioid Use.June 2015. https://www.asam.org/docs/default-source/practice-support/guidelines-and-consensus-docs/asam-national-practice-guideline-supplement.pdf?sfvrsn=24.
-
Center for Substance Abuse Treatment. Clinical Guidelines for the Use of Buprenorphine in the Treatment of Opioid Addiction. Treatment Protocols. (Treatment Improvement Protocol (TIP) Series, No. 40. Rockville, MD: Substance Abuse and Mental Health Services Administration; 2004. https://www.ncbi.nlm.nih.gov/books/NBK64246/.
-
Heinzerling KG, Ober AJ, Lamp K, et al. SUMMIT: Procedures for Medication-Assisted Treatment of Alcohol or Opioid Dependence in Primary Care. RAND Corporation; 2016. http://www.integration.samhsa.gov/clinical-practice/mat/RAND_MAT_guidebook_for_health_centers.pdf.
-
Substance Abuse and Mental Health Services Administration, Center for Behavioral Health Statistics and Quality. Treatment Episode Data Set (TEDS): 2003-2013. National Admissions to Substance Abuse Treatment Services. BHSIS Series S-75, HHS Publication No. (SMA) 15-4934. Rockville, MD: Substance Abuse and Mental Health Services Administration, 2015.
-
Mayo Clinic. Cognitive Behavioral Therapy. https://www.mayoclinic.org/tests-procedures/cognitive-behavioral-therapy/about/pac-20384610.
-
Mayo Clinic. Cognitive Behavioral Therapy. https://www.mayoclinic.org/tests-procedures/cognitive-behavioral-therapy/about/pac-20384610.
-
Mark TL, Olesiuk W, Ali MM, et al. Differential reimbursement of psychiatric services by psychiatrists and other medical providers. Psychiatric Services. E-pub ahead of print. December 1, 2017. https://doi.org/10.1176/appi.ps.201700271.
-
Reif S, Creedon TB, Horgan CM, et al. Commercial health plan coverage of selected treatments for opioid use disorders from 2003 to 2014. Journal of Psychoactive Drugs. 2017; 49(2): 1-9.
-
BLS Inflation Data, CPI-All Urban Consumers (Current Series), Health insurance in U.S. city average, all urban consumers, not seasonally adjusted. Retrieved from: https://beta.bls.gov/dataViewer/view/timeseries/CUUR0000SEME.
-
Mark TL, Olesiuk W, Ali MM, et al. Differential reimbursement of psychiatric services by psychiatrists and other medical providers. Psychiatric Services. E-pub ahead of print. December 1, 2017. https://doi.org/10.1176/appi.ps.201700271.
-
Sontag D. Addiction treatment with a dark side. The New York Times. November 16, 2013.
-
Reif S, Creedon TB, Horgan CM, et al. Commercial health plan coverage of selected treatments for opioid use disorders from 2003 to 2014. Journal of Psychoactive Drugs. 2017; 49(2): 1-9.
-
Soumerai SB, McLaughlin TJ, Ross-Degnan D, Casteris CS, Bollini P. Effects of limiting Medicaid drug-reimbursement benefits on the use of psychotropic agents and acute mental health services by patients with schizophrenia. New England Journal of Medicine, 1994; 331(10): 650-655.
-
Barry CL, Frank RG, McGuire TG. The costs of mental health parity: still an impediment? Health Affairs, 2006; 25(3): 623-634.
Use of Medication-Assisted Treatment for Opioid Use Disorders in Employer-Sponsored Health Insurance
This report was prepared under contract #HHSP233201600023I between the U.S. Department of Health and Human Services (HHS), Office of Disability, Aging and Long-Term Care Policy (DALTCP) and Truven Health Analytics. For additional information about this subject, you can visit the DALTCP home page at http://aspe.hhs.gov/office-disability-aging-and-long-term-care-policy-daltcp or contact the ASPE Project Officers, Laurel Fuller and D.E.B. Potter, at HHS/ASPE/DALTCP, Room 424E, H.H. Humphrey Building, 200 Independence Avenue, S.W., Washington, D.C. 20201; Laurel.Fuller@hhs.gov.
Reports Available
Use of Medication-Assisted Treatment for Opioid Use Disorders in Employer-Sponsored Health Insurance: Final Report
- HTML: https://aspe.hhs.gov/basic-report/use-medication-assisted-treatment-opioid-use-disorders-employer-sponsored-health-insurance-final-report
- PDF: https://aspe.hhs.gov/pdf-report/use-medication-assisted-treatment-opioid-use-disorders-employer-sponsored-health-insurance-final-report
Use of Medication-Assisted Treatment for Opioid Use Disorders in Employer-Sponsored Health Insurance: Out-of-Pocket Costs