
Truven Health Analytics
Printer Friendly Version in PDF Format (67 PDF pages)
ABSTRACT
This project assessed changes in Opioid Use Disorder (OUD) treatment utilization and expenditures in the employer-sponsored private health insurance market at two timepoints, 2006-2007 and 2014-2015, that mark the periods before and after implementation of the Mental Health Parity and Addiction Equity Act (MHPAEA), the Affordable Care Act, the introduction and expanded use of new opioid treatment medications, and other initiatives to expand substance use disorder treatment access.
DISCLAIMER: The opinions and views expressed in this report are those of the authors. They do not necessarily reflect the views of the Department of Health and Human Services, the contractor or any other funding organization. This report was completed and submitted on March 30, 2018.
TABLE OF CONTENTS
- Legislation to Expand Access to Treatment
- Private Insurance Coverage for Opioid Use Disorder Treatment
- Opioid Use Disorder Treatment
- Medication-Assisted Treatment
- Data
- Study Population
- Study Periods
- Analytic Files
- Variable Definitions
- Coverage
- Utilization
- Spending
- Summary Statistics
- Health Plan Coverage of Services
- Member Service Use
- Spending
- Key Findings
- Implications
- Future Directions
APPENDICES
- APPENDIX A: ICD-9 and ICD-10 Diagnostic Codes for OUD
- APPENDIX B: NDCs Identifying MAT
- APPENDIX C: CPT, Revenue, and HCPCS Service Codes
- APPENDIX D: Sample Attrition Table
LIST OF FIGURES
- FIGURE ES1: Percentage of Employer-Sponsored Commercial Insurance Plans Paying for OUD Treatment Services in the 2-Year Periods, 2006-2007 and 2014-2015
- FIGURE ES2: Percentage of Employer-Sponsored Health Plan Enrollees with OUD Who Accessed OUD Services, 2006-2007 and 2014-2015
- FIGURE ES3: Average Annualized Per Person Out-of-Pocket Spending Adjusted for Inflation for OUD Services by Plan Enrollees with OUD
- FIGURE 1: Timeline of MAT FDA Approval and Federal Legislation Affecting Access to Substance Use Treatment
- FIGURE 2: Percentage of Claim Paid by Insurer for Persons with OUD Aged 12-64 Years Old and Enrolled in Employer-Sponsored Commercial Insurance Plans, 2006-2007 and 2014-2015
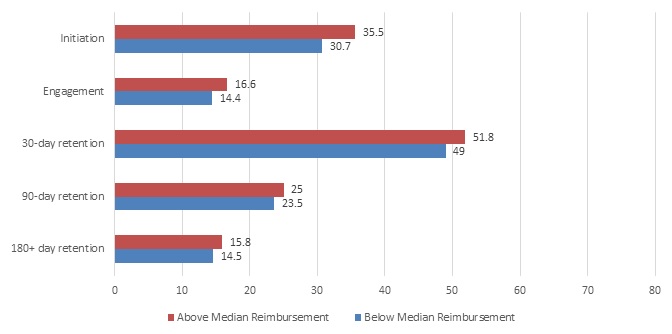
- FIGURE 3: Average Plan-Level Percentage of Episodes That Met Each Outcome Stratified by Falling Above or Below the Median Reimbursement Rate of 78.5% Among Persons with OUD Aged 12-64 Years Old and Enrolled in Employer-Sponsored Commercial Insurance Plans, 2014-2015
LIST OF TABLES
- TABLE 1: OUD Treatment Service Category Definitions
- TABLE 2: Descriptive Information on Plan, Individual, Episode, and Claims-Level Analytic Datasets from Employer-Sponsored Commercial Insurance Plans by Time Period, 2006-2007 and 2014-2015
- TABLE 3: Percentage of Employer-Sponsored Commercial Insurance Plans Paying for OUD Treatment Services in the 2-Year Periods, 2006-2007 and 2014-2015
- TABLE 4: Utilization of OUD Services among Persons with OUD Aged 12-64 Years Old and Enrolled in Employer-Sponsored Commercial Insurance Plans, 2006-2007 and 2014-2015
- TABLE 5: Change in Rates in OUD Service Use among Persons with OUD Aged 12-64 Years Old and Enrolled in Employer-Sponsored Commercial Insurance Plans, by Respective OUD Treatment Service Category, 2006-2007 and 2014-2015
- TABLE 6: Among Persons with OUD Aged 12-64 Years Old and Enrolled in Employer-Sponsored Commercial Insurance Plans, Number and Percentage of OUD Treatment Episodes That Included Each Service Type, 2006-2007 and 2014-2015
- TABLE 7: Member Characteristics among Persons with OUD Aged 12-64 Years Old and Enrolled in Employer-Sponsored Commercial Insurance Plans, by Whether Persons with OUD Accessed MAT, 2006-2007 and 2014-2015
- TABLE 8: Average Total Spending Per Enrollee with OUD Aged 12-64 Years Old and Enrolled in Employer-Sponsored Commercial Insurance Plans Standardized to a 12-Month Enrollment Period, 2006-2007 and 2014-2015
- TABLE 9: Per Capita Out-of-Pocket Spending Per Enrollee with OUD Aged 12-64 Years Old and Enrolled in Employer-Sponsored Commercial Insurance Plans Standardized to a 12-Month Enrollment Period, 2006-2007 and 2014-2015
- TABLE 10: Mean Amount Paid per Service Claim for Total Payments for Persons with OUD Aged 12-64 Years Old and Enrolled in Employer-Sponsored Commercial Insurance Plans, 2006-2007 and 2014-2015
ABSTRACT
This project assessed changes in Opioid Use Disorder (OUD) treatment utilization and expenditures in the employer-sponsored private health insurance market at two timepoints, 2006-2007 and 2014-2015, that mark the periods before and after implementation of the Mental Health Parity and Addiction Equity Act, the Patient Protection and Affordable Care Act, and the introduction and expanded use of new opioid treatment medications. We used the Truven Health Analytics MarketScan® Commercial Claims and Encounters Database of private employer-sponsored health plans. We included employees, spouses, and dependents aged 12-64 years, required at least 10 out of 12 months of enrollment in each calendar year, and excluded capitated plans and plans without prescription drug claims. Employer-sponsored health plans paid for a much broader range of OUD treatment services, including medication-assisted treatment (MAT) at the second period. MAT use was similar in the two periods, with buprenorphine being the most common and naltrexone seeing a substantial increase in use. In 2014-2015, there was a shift in the types of services used during treatment episodes, with outpatient office visits having the highest frequency (56.2 percent) compared with other OUD services. Women with an OUD were significantly less likely than men with an OUD to receive MAT. The age group with the highest MAT use was 18-44-year-olds. There was a shift in 2014-2015 toward the insured member being more likely than spouses or dependents to receive MAT. Both insurers and enrollees paid more for substance use disorder treatment in the second period, and in 2014-2015, insurers paid a lower portion of total treatment costs. Treatment initiation, engagement, and retention all were positively associated with plan level of reimbursement. The association was strongest with treatment initiation and more modest with engagement and retention.
ACRONYMS
The following acronyms are mentioned in this report and/or appendices.
| ACA | Patient Protection and Affordable Care Act |
|---|---|
| ASAM | American Society of Addiction Medicine |
| BH | Behavioral Health |
| CCAE | Commercial Claims and Encounters |
| CI | Confidence Interval |
| CPT | Current Procedural Terminology |
| DX | Diagnosis code |
| ED | Emergency Department |
| EMTALA | Emergency Medical Treatment and Labor Act |
| FDA | Food and Drug Administration |
| FIL | Buccal Film |
| FQHC | Federally Qualified Health Center |
| GER | Gluteal Extended Release |
| HCPCS | Healthcare Common Procedure Coding System |
| HEDIS | Healthcare Effectiveness Data and Information Set |
| ICD-9 | International Classification of Diseases, Ninth Revision |
| ICD-10 | International Classification of Diseases, Tenth Revision |
| IM | Intramuscular |
| MAT | Medication-Assisted Treatment |
| MHPAEA | Mental Health Parity and Addiction Equity Act |
| MM | Mucous Membrane |
| N/A | Not Available |
| NDC | National Drug Code |
| NQTL | Non-Quantitative Treatment Limit |
| NSDUH | National Survey on Drug Use and Health |
| OR | Odds Ratio |
| OTP | Opioid Treatment Program |
| OUD | Opioid Use Disorder |
| POS | Place Of Service |
| Rev | Revenue code |
| RHC | Rural Health Clinic |
| Rx | Prescription fill |
| SD | Standard Deviation |
| SL | Sublingual |
| SUD | Substance Use Disorder |
| TAB | Tablet |
| TMS | Transcranial Magnetic Stimulation |
| Tx | Treatment code |
EXECUTIVE SUMMARY
Introduction
Drug overdose from illegal (e.g., heroin) and prescription (e.g., oxycodone, hydrocodone) opioids is now the leading cause of accidental death in the United States. Among a total of 52,404 deaths from a drug overdose in 2015, 63.1 percent involved opioids.[1] Federal policy initiatives and advancements in treatment for opioid use disorder (OUD) have expanded access to treatment by increasing the number of people with health insurance, requiring health insurance plans to cover substance use disorder (SUD) treatment at the same benefit level that physical health services are covered, and expanding medication-assisted treatment (MAT) options for OUD.
Consequently, private insurance has become a more prominent payer of SUD treatment services. Between 2004 and 2014, the share of the total spending for SUD treatment in the United States paid for by private insurance increased from 13 percent to 18 percent.[2] Among those with commercial insurance, professional charges (e.g., those for physician or psychologist who bill for services) for OUD treatment rose by more than ten-fold from 2011 to 2015 (from $71.66 million to $721.80 million). In 2014 opioid treatment programs (OTPs) were a covered service in 97 percent of private plans, and all health plans covered the treatment medication buprenorphine under the pharmacy benefit in 2010.[3]
Treatment options for OUD include individual or group counseling, medication, and support services to help with housing, employment, or other resources needed to sustain recovery.[4] Generally, both counseling and support services are recommended in conjunction with medication to maximize treatment success. Treatment may be offered in a variety of settings depending on the severity of the SUD and the availability of services. Alignment of treatment intensity with the severity and complexity of an individual's OUD has been shown to improve treatment outcomes.[5]
To understand SUD treatment patterns in private insurance, we used commercial insurance claims data to evaluate OUD treatment paid for by employer-sponsored health insurance plans before and after the implementation of the Mental Health Parity and Addiction Equity Act (MHPAEA) and the Patient Protection and Affordable Care Act (ACA) and the introduction of new forms of MAT. The sample of plans included primarily large health plans, but also included small plans. This study expands on the existing literature by examining both the receipt of MAT and other OUD services and settings (i.e., detoxification, psychotherapy) among the population with private insurance.
Objectives
This project assessed changes in OUD treatment utilization and expenditures in the employer-sponsored private health insurance market at two timepoints, 2006-2007 and 2014-2015, that mark the periods before and after implementation of the MHPAEA, the ACA, the introduction and expanded use of new opioid treatment medications, and other initiatives to expand SUD treatment access. It is not an evaluation of any specific law or event, but rather an investigation of: (1) whether access to treatment among those with private insurance improved over time; and (2) any remaining treatment gaps--for example, lack of coverage for specific types of services--and access barriers--for example, high out-of-pocket costs. We organized the analyses around understanding changes in the types of services plans covered, the volume and types of services individuals received, and the associated spending by plans and individuals.
Specifically, we analyzed the following:
-
Coverage. The coverage analyses examined whether a higher percentage of plans paid for treatment and whether there were changes in the types of services paid for--that is, whether plans paid for a broader range of services. We did not have information on which services were covered by the plans, therefore, we approximated coverage by reporting what services plans paid for.
-
Utilization. The utilization analyses examined whether a higher percentage of members with an OUD received any treatment or specific types of services including MAT and psychosocial therapy, whether those in treatment used services more frequently, and how treatment episodes compared in terms of the average length of treatment, the types of services received during an episode, and whether there were differences in the characteristics of members who received MAT compared with those who did not.
-
Spending. The spending analyses examined total spending disaggregated by insurer and out-of-pocket spending, spending per user, and spending per unit of service for different types of services. Further, we investigated whether initiation, engagement, and retention in treatment was influenced by the relative share of treatment costs paid by insurers and individuals.
Methods
Data. We used the Truven Health Analytics MarketScan® Commercial Claims and Encounters (CCAE) Database for calendar years 2006, 2007, 2014, and 2015. The Marketscan CCAE Database contains private insurance claims from approximately 150 large employers for employees, their dependents, and early retirees. It is the largest commercial convenience sample in the United States.
Study population. We included private employer-sponsored health plan members, which included employees, spouses, and dependents aged 12-64 years. We excluded enrollees under age 12 years because of the low prevalence of OUD and enrollees over age 64 because of Medicare eligibility and the possibility of having secondary insurance. We required at least 10 out of 12 months of enrollment in each calendar year to capture a complete or nearly complete treatment picture for each individual. We excluded plans without prescription drug claims because of the importance of having complete service records for each enrollee and the need to capture use of MAT. And we excluded claims covered by capitated plans that did not include reimbursement information.
We restricted the enrollee-level analyses to enrollees with OUD, as defined below, and we restricted the plan-level analyses to plans with at least ten enrollees with OUD. For the analyses of the relationship between insurer level of reimbursement and treatment initiation and engagement, we further restricted the sample of plans to exclude plans with fewer than ten treatment episodes, plans with fewer than ten people, and individuals below the 25th and above the 99th percentile of total costs.
Study periods. We examined two study periods over a 10-year timeframe--2006-2007 and 2014-2015--before and after important federal policy changes and changes in the availability and accessibility of OUD treatment. We selected 2-year periods so that we would have enough enrollees with OUD and sufficient volume of less commonly used service types to report detailed service use.
Analytic files. We constructed several analytic files to allow us to report on utilization and spending from the perspectives of what plans paid for, what services individuals used, the composition of treatment episodes, and costs to insurers and enrollees. These included the source claims-level analytic files, which included all inpatient admissions, outpatient services, and prescription drug fills and an individual-level file which included summary variables on service use and spending; demographic and health plan characteristics, and mental and physical health conditions. We aggregated the individual-level file to the plan-level in order to report the percentage of plans that paid for particular OUD services.
Variable definitions. We constructed variables to define OUD, characterize the sample and health plans, and to define service types and utilization rates, number of treatment episodes, and financial variables. Below we describe how we defined each of these variables.
-
Opioid use disorder. As described, the analytic data files included members with OUD defined on the basis of either having an OUD diagnosis or receiving OUD treatment, presuming that individuals receiving treatment qualified for an OUD diagnosis even if the diagnostic code was missing from the claims record. Specifically, individuals were classified as having OUD and included in the analytic files if they: (1) had two or more outpatient visits on different days or one inpatient stay with an OUD diagnosis in any claims field; (2) had an MAT prescription fill; or (3) had an MAT administration procedure code.
-
Service categories. We classified all OUD treatment services into specific service categories using standard billing codes. We defined the following service categories: inpatient treatment, residential services, intensive outpatient or partial hospitalization services, emergency department visits, outpatient visits, psychotherapy, peer support, case management, and outpatient detoxification. Use of MAT was captured through the prescription claims codes for buprenorphine and naltrexone, as well as service administration codes, which are used to bill for MAT administration--for example, giving a Vivitrol injection or administering methadone in an OTP.
-
Utilization. We created binary variables indicating whether the member used each service type. We then computed the number of times that each respective service was used and computed a 12-month utilization rate for each service.
-
Coverage. For each included plan, we created binary variables indicating whether any OUD service and each respective OUD service was received by a health plan enrollee.
-
Financial variables. We computed variables to reflect insurer and individual (plan enrollee) spending. These included total payment, insurance payment, and out-of-pocket payment. Out-of-pocket payments included deductibles, co-payments, and co-insurance. They did not include the cost of insurance premiums.
-
Treatment initiation, engagement, and retention. We defined whether each treatment episode met the Healthcare Effectiveness Data and Information Set treatment initiation and engagement criteria.[6] Additionally, we categorized treatment episode length into 30, 90, and 180+ days to capture varying lengths of treatment.
This project investigated changes in OUD treatment coverage, utilization, and expenditures in the private health insurance market before (2006-2007) and after (2014-2015) phased implementation of the MHPAEA and the ACA and the emergence of new Food and Drug Administration (FDA)-approved MATs. The coverage analyses examined the percentage of plans paying for any OUD treatment and specific types of treatment. The utilization analyses examined overall treatment use, use of specific service types, and patterns of MAT use by individuals. The spending analyses examined total spending for OUD treatment, cost-sharing between insurers and members, and the impact of cost-sharing on OUD treatment initiation, engagement, and retention.
Results
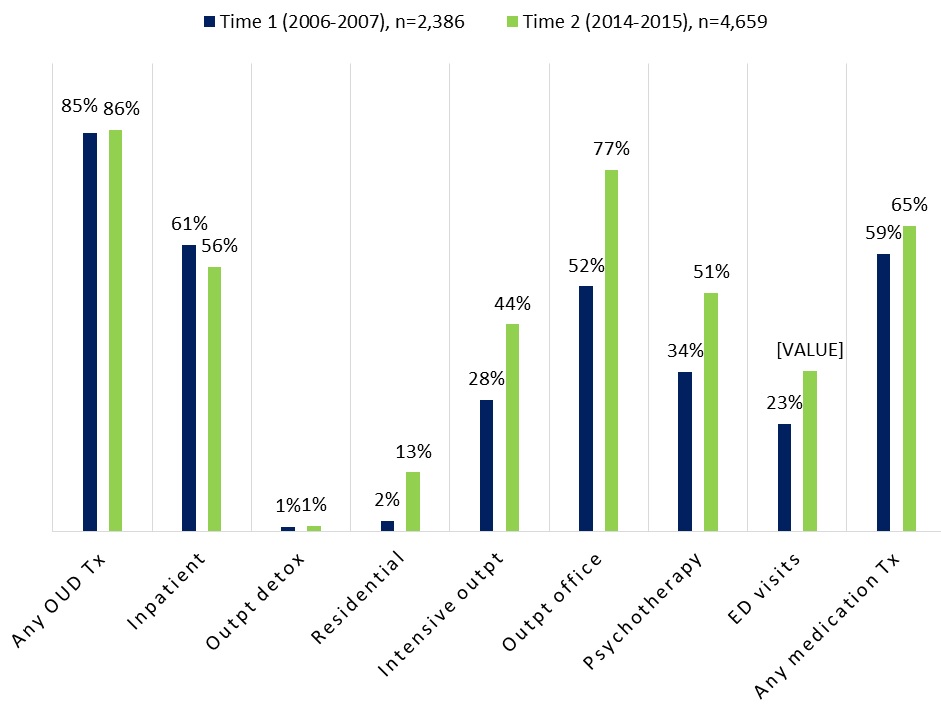
Coverage. We found that a higher percentage of plans paid for OUD treatment at the second period, and they paid for a much broader range of services, including MAT (Figure ES1). Notably, a higher percentage of plans paid for intensive outpatient treatment, outpatient office visits, and psychotherapy. This increase may have resulted from health plans adjusting their coverage requirements in accordance with the MHPAEA and the ACA, health plans recognizing the need to increase services given the increasing rates of OUD, or an emphasis on providing support services in conjunction with MAT.[7] Although there was a substantial increase in residential treatment, still only 13 percent of plans paid for this type of treatment in 2014-2015. The general trend of increasing the range of services paid for suggests improved adherence to American Society of Addiction Medicine (ASAM) criteria; however, the continued lower coverage of higher-intensity services--residential, intensive outpatient, and partial hospitalization--reflects a lack of coverage for higher-intensity services.
| FIGURE ES1. Percentage of Employer-Sponsored Commercial Insurance Plansa Paying for OUD Treatment Services in the 2-Year Periods, 2006-2007 and 2014-2015b |
|---|
 |
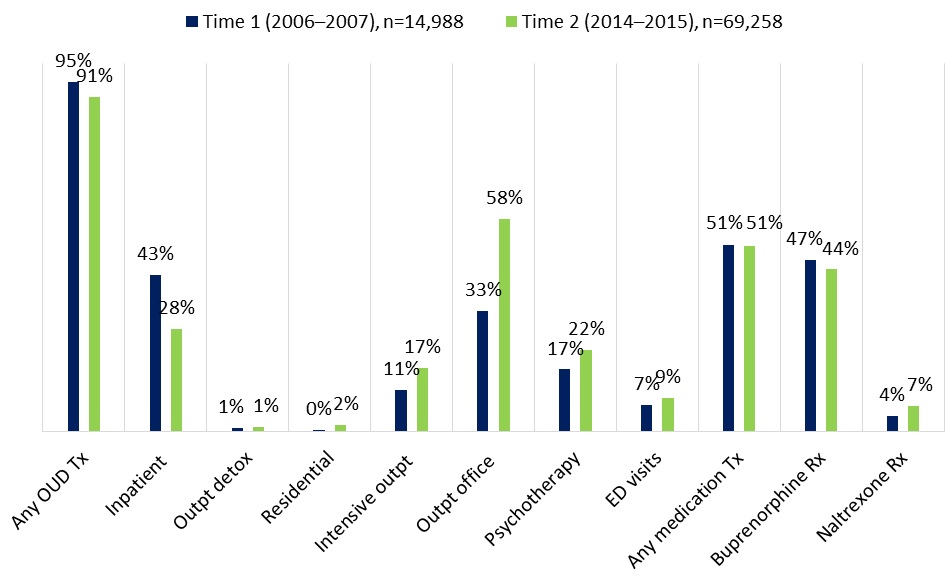
|
Utilization. We found that members in OUD treatment used intensive outpatient treatment, outpatient office visits, and psychotherapy more frequently compared with other OUD services and settings in 2014-2015 (Figure ES2). Overall MAT use was similar in the two time periods, with buprenorphine being the most common and naltrexone seeing a substantial increase in use. These findings reflect a long-term trend in the field of behavioral health, shifting away from long-term inpatient and residential stays toward placing more emphasis on effective medication treatment and community-based care.[8]
| FIGURE ES2. Percentage of Employer-Sponsored Health Plan Enrolleesa with OUD Who Accessed OUD Services, 2006-2007 and 2014-2015b |
|---|
 |
|
In 2006-2007, the types of services received during an episode of treatment with the highest frequency included receiving any MAT (54.6 percent) and buprenorphine prescription fills/service administration (50.7 percent). In 2014-2015, there was a shift in the types of services used during treatment episodes, with outpatient office visits having the highest frequency (56.2 percent) compared with other OUD services. Private health plan management strategies of prior authorization and step therapy may partly explain why our findings revealed decreases in the percentage of episodes that included any MAT and buprenorphine prescription fills between the time periods.
The decrease in the percentage of episodes that included any MAT and buprenorphine prescription fills between the time periods may reflect a shortage of waivered physicians qualified to prescribe buprenorphine.
Women with an OUD were significantly less likely than men with an OUD to receive MAT in both periods. The age group with the highest MAT use was 18-44-year-olds, in which the differences were more pronounced in 2014-2015. There was a shift in 2014-2015 toward the insured member being more likely than spouses or dependents to receive MAT. This finding may reflect greater recognition of the impact of the opioid epidemic and lower stigma associated with receiving treatment among employed individuals.
Spending. In 2006-2007, insurers paid 84 percent of the total treatment costs. This fell to 79 percent in 2014-2015. The most substantial cost shifts were for more intensive services, that is, inpatient and residential services. However, insurers began paying a larger portion of MAT costs (from 78 percent to 81 percent) and intensive outpatient/partial hospitalization costs (from 84 percent to 85 percent).
Out-of-pocket spending for all OUD services and settings increased between the time periods (Figure ES3). The largest increase in cost per user was for intensive outpatient or partial hospitalization, which went from $221 (inflation-adjusted) in Time 1 to $794 in Time 2. Among all types of OUD services and settings, inpatient services accounted for the highest out-of-pocket costs per user for both time periods. However, less intensive services--outpatient office visits and psychotherapy--saw only modest increases.
| FIGURE ES3. Average Annualizeda Per Person Out-of-Pocket Spending Adjustedb for Inflation for OUD Services by Plan Enrollees with OUDc |
|---|
 |
|
We used the plan level of reimbursement to assess the association between coverage level and treatment initiation, engagement, and retention at 30, 90, and 180+ days. Each treatment outcome was positively associated with plan level of reimbursement. The association was strongest with treatment initiation and more modest with the engagement and retention indicators. This finding suggests that plan level of reimbursement more strongly influenced whether patients began treatment than whether they persisted in treatment. This may relate to deductible requirements that could be a barrier to initiating treatment.
In terms of cost per unit of service, adjusting for inflation, most services types increased in cost. The most substantial increase was for residential services which increased by 160.5 percent. The per unit costs for outpatient office visits and methadone administration fell over time.
The observed increases in total spending by private insurance aligns with national spending trends for SUD which report that private insurance accounted for 18 percent of total SUD spending in 2014, up from 13 percent in 2007.[9]
Conclusion
These findings highlight how the MHPAEA and the ACA as well as new FDA-approved MAT expanded OUD treatment coverage, utilization, and expenditures in the private health insurance market between 2006-2007 and 2014-2015. Overall, our findings reflect expanded availability, greater use of OUD treatment services, and higher payments to service providers for enrollees in large employer-sponsored health plans. The trend toward increasing the range of service types paid for suggests improved adherence to ASAM treatment criteria and reflects a long-term trend in behavioral health, shifting away from long-term inpatient and residential stays toward a greater emphasis on medication treatment and community-based care.
However, there remain significant barriers to treatment access. The higher cost and lower insurance reimbursement for inpatient care and lower utilization of residential services reflects a lack of availability of higher-intensity services which may be needed for more severe cases of OUD, particularly during treatment initiation before patients can be transitioned successfully to outpatient treatment. Further, only half of those who could potentially benefit from MAT received it, and access to MAT was even lower for women and enrollees below or above the 18-44 year age range. It is critical to ensure widespread availability of MAT and access to the range of service types including higher-intensity services.
INTRODUCTION
Drug overdose from illegal (e.g., heroin) and prescription (e.g., oxycodone, hydrocodone) opioids now is the leading cause of accidental death in the United States. Overdose deaths resulting from prescription opioids have quadrupled since 1999, with approximately 15,000 prescription opioid-related deaths in 2015.[10] Among a total of 52,404 deaths from a drug overdose in 2015, 63.1 percent involved illegal or prescription opioids.[11] As described below, federal policy initiatives and advancements in available treatments for opioid use disorder (OUD) have expanded access to treatment by increasing the number of people with health insurance, requiring health insurance plans to cover substance use disorder (SUD) treatment at the same benefit level that physical health services are covered, and expanding medication-assisted treatment (MAT) options for OUD.
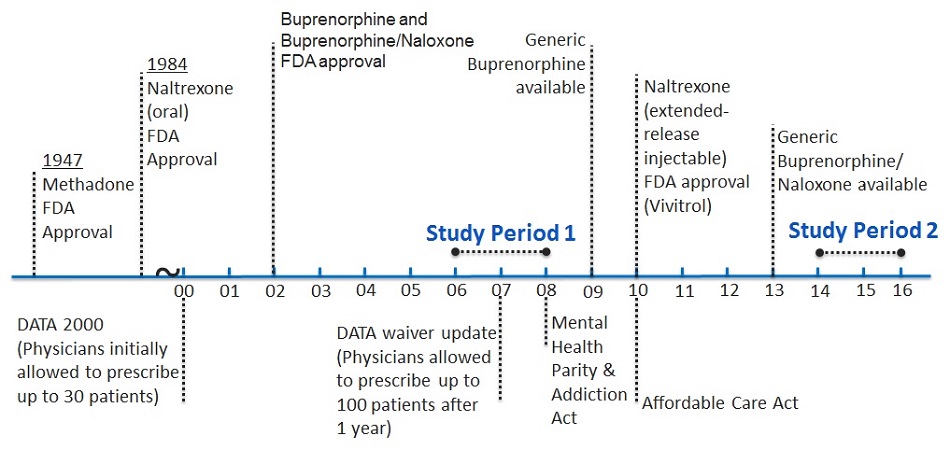
This paper examines changes in OUD treatment use and spending among those with private insurance before and after these developments. Below we describe the legislative acts and the MAT advancements and their anticipated impacts on OUD treatment among those with privately insurance. Figure 1 illustrates the timeline of key developments in relation to the time periods selected for the study.
| FIGURE 1. Timeline of MAT FDA Approval and Federal Legislation Affecting Access to Substance Use Treatment |
|---|
 |
Legislation to Expand Access to Treatment
Despite the availability of effective treatment, use of treatment services has remained extremely low. The National Survey on Drug Use and Health (NSDUH) estimated that in 2015, just 14 percent of adults aged 18-64 years with an SUD received treatment in the past year. Among those with private insurance, just 10 percent received treatment. Based on our own analysis of NSDUH data, an estimated 0.33 percent of individuals aged 18-64 with private insurance had a diagnosis of opioid dependence in 2014, up from 0.23 percent in 2007. These rates of opioid dependence are about half those found in the general population, but show a similar increase over this time period.[12] In addition to several state and local actions to increase access to SUD treatment, two major pieces of federal legislation were enacted to expand access to health services in general and mental health and SUD treatment specifically--the Paul Wellstone and Pete Domenici Mental Health Parity and Addiction Equity Act (MHPAEA) of 2008 and the Patient Protection and Affordable Care Act (ACA) of 2010. These laws and their potential impact on access to SUD treatment are described below.
The MHPAEA required that the cost-sharing and treatment limitations for SUD treatment, if covered by a health plan, must be comparable to and no more restrictive than medications for other medical or surgical needs.[13] These requirements apply to both quantitative and non-quantitative treatment limits (NQTLs), which include some of the utilization management techniques commonly applied to MAT medications, for example, prior authorization and step therapy.
The MHPAEA prohibits the use of any NQTLs for mental health or SUD benefits unless the processes, strategies, evidentiary standards, or other factors used in applying the NQTLs to the behavioral health benefits in the classification are comparable to, and applied no more stringently than, the processes, strategies, evidentiary standards, or other factors used in applying the NQTLs to medical benefits in the same benefit classification (e.g., the prescription drug benefit classification). Both federal-level and state-level efforts have attempted to improve enforcement of the MHPAEA, which should improve access to treatment, including MAT.[14]
A study examining the direct effect of the MHPAEA on SUD treatment outcomes found that, after the first year of implementation, no significant change was observed in patient initiation or engagement.[15] However, the direct effects of this law on patient outcomes may be delayed as health plans adjust to and incorporate their new coverage requirements. Health plans also still are in the process of satisfying more recent regulatory requirements,[16] which may influence implementation and ultimately access and use of treatment services.
The ACA expanded both public and private insurance coverage, providing greater access to health care. Regarding SUD treatment, the ACA eliminated lifetime caps on treatment services and restricted the annual caps that insurance plans can impose.[17] Reducing these insurance-related barriers to treatment may affect the number of individuals initiating and continuing to engage in SUD services, although lack of treatment resources in certain areas may continue to impede access to those services.[18]
The ACA allows young adults to remain on their parents' insurance coverage through the year they turn 26. This provision shifts the insurance pool to include younger enrollees who have higher rates of substance use, which could increase the percentage of private insurance enrollees needing SUD treatment. Initial assessments of the effect of the legislation on young adults' use of SUD services failed to reveal any significant change in treatment uptake.[19] However, given the relatively high rates of substance abuse for this age group,[20] expanded coverage ultimately may promote increased uptake of treatment services.
Private Insurance Coverage for Opioid Use Disorder Treatment
As a result, private insurance has become a more prominent payer of mental health and substance use treatment services. Between 2004 and 2014, the share of the total spending for SUD treatment in the United States paid for by private insurance increased from 13 percent to 18 percent.[21] Through telephone surveys with commercial health plan representatives, Reif et al. (2017) found that opioid treatment programs (OTPs) were a covered service in 64.5 percent of commercial health plans in 2003, 69 percent in 2010, and 97 percent in 2014. Buprenorphine was covered under the pharmacy benefit for 70 percent of commercial plans in 2003 and in all health plans in 2010.[22] Another study found that OTPs were more likely to provide buprenorphine if they had a higher percentage of clients with private instead of public insurance.[23] Evidence also shows that, among those with commercial insurance, professional charges for OUD treatment rose by more than 1,000 percent from 2011 to 2015 (from $71.66 million to $721.80 million).[24]
It is unclear whether the increase in overall SUD spending is due to a greater number of enrollees receiving treatment, enrollees receiving more intensive or frequent treatment, or higher costs of treatment. Further, the spending and utilization patterns for OUD treatment and MAT among those with private insurance are unknown. This study examines these issues by examining changes in the number and percent of private health plan enrollees receiving services, the frequency and volume of services, and the unit cost of services.
Opioid Use Disorder Treatment
Treatment options for OUD include individual or group counseling, medication, and support services to help with housing, employment, or other resources needed to sustain recovery. These services may be offered alone or in combination. Generally, both counseling and support services are recommended in conjunction with medication to maximize treatment success. Treatment may be offered in a variety of settings depending on the severity of the SUD and the availability of services. Alignment of treatment intensity with the severity and complexity of an individual's OUD has been shown to improve treatment outcomes.[25] The American Society of Addiction Medicine (ASAM) developed a set of National Practice Guidelines in 2015 for the use of medications in the treatment of addiction involving opioid use.[26] In addition to outlining the recommendations for treating OUD with MAT, ASAM presented the following four levels of treatment settings:
-
Level 1: General outpatient location (i.e., clinician's practice site).
-
Level 2: Intensive outpatient treatment or partial hospitalization program that could be operated within a specialty addiction treatment facility or community mental health center.
-
Level 3: Residential addiction treatment facility or detoxification facility.
-
Level 4: Hospital for inpatient services.
The ASAM guideline stresses that "the venue in which treatment is provided is as important as the specific medication selected".[27] The guideline also recommends that psychosocial treatment be provided to patients receiving each type of MAT. It is important to assess the types and combination of services that individuals with OUD are receiving and evaluate the extent to which services are provided across a continuum of intensity to determine whether patients are receiving optimal, effective care.
Medication-Assisted Treatment
MAT is an effective treatment for OUD.[28], [29], [30], [31], [32] The seriousness of the current epidemic has spurred increased interest in expanding access to MAT as well as other treatment services. New medications, developed over the last decade have expanded OUD treatment options and the venues in which MAT can be provided. The various MAT options have trade-offs that influence their usefulness, accessibility, and acceptability in treatment. Their introduction and some of the key issues that influence their use in treatment are described below.
Methadone was the first MAT approved by the Food and Drug Administration (FDA) for treatment of OUD. Introduced in 1947, methadone comes in liquid form and is dispensed in highly regulated OTPs. To acquire the medication, patients are required to attend treatment daily. In certain circumstances, take-home doses are permitted; however, the requirement for daily attendance,[33] the stigma associated with attending a treatment program,[34] the limited locations of OTPs,[35] and the high cost of care[36] make methadone treatment a burdensome treatment option.
In 2002, FDA approved buprenorphine and the combination buprenorphine/naloxone for treatment of OUD. These products are sublingual tablets and can be prescribed in office-based settings, referred to as office-based outpatient treatment. However, because the medications are classified as Schedule III by FDA because of their abuse potential, there are limitations on prescribing practices. The Drug Addiction Treatment Act of 2000 allowed physicians to prescribe the Schedule III-V opioids approved by FDA. Physicians initially were allowed to prescribe buprenorphine to up to 30 patients after obtaining a waiver from the federal Drug Enforcement Agency from the registration requirements of the Narcotic Addict Treatment Act of 1974.[37] After 1 year of treating patients, qualified physicians were allowed to file for a second waiver to treat up to 100 patients, and the final rule expanded treatment to up to 275 patients in 2016.[38] Despite this expansion, Jones et al. (2015)[39] found that in 2012 approximately 46 states and the District of Columbia had OUD rates that exceeded their buprenorphine treatment capacity rates.
A third MAT for OUD, naltrexone, first was approved by FDA in 1984 as an oral agent for treating OUD but was not widely used for treatment.[40] In 2010, FDA approved the extended-release injectable formulation of naltrexone (Vivitrol). Studies have found that Vivitrol significantly improved treatment retention and lowered relapse[41], [42] as well as opioid-related mortality compared with no treatment.[43] However, recent studies showed that, although Vivitrol is effective for preventing relapse, its use is not as widespread as that of other MATs, in part because of cost, less extensive evidence base compared with methadone and buprenorphine, and its more limited inclusion in payer formularies.[44] Barriers to the use of Vivitrol include complexity of ordering and administering the medication, cost, health plan reimbursement policies, and lack of knowledge about the medication.[45], [46], [47]
With the increased availability of MAT, passage of the MHPAEA and the ACA as well as other state and local efforts, and shift from public to private coverage for SUD, research is needed to understand whether treatment rates and use of MAT and other recommended services have increased over time for private insurance enrollees, particularly since the prevalence of OUD has increased in this population.[48] Additionally, as payment for SUD shifts from public funding to private insurance, to evaluate financial barriers to receiving care it is important to consider the costs of care shifted to patients--that is, the out-of-pocket costs.
To understand SUD treatment patterns in private insurance, this report evaluates OUD treatment paid for by employer-sponsored health insurance plans before and after the implementation of the MHPAEA and the ACA and the introduction of new forms of MAT using commercial insurance claims data. This study expands on the existing literature by examining both the receipt of MAT and OUD services and settings (i.e., detoxification, psychotherapy) among the population with private insurance.
OBJECTIVES
This project investigated changes in OUD treatment utilization and expenditures in the employer-sponsored private health insurance market at two timepoints (2006-2007 and 2014-2015) that mark the periods before and after implementation of the MHPAEA and the ACA, the introduction and expanded use of new opioid treatment medications, and other initiatives to expand SUD treatment access. It is not an evaluation of any specific law or event but rather an investigation of whether access to treatment among those with private insurance improved over time and where treatment gaps may still exist--for example, lack of coverage for specific types of services--and access barriers--for example, high out-of-pocket costs. We organized the analyses around understanding changes in the types of services plans covered, the volume and types of services individuals received, and the associated spending by plans and individuals.
Specifically, we analyzed the following:
-
Coverage. The coverage analyses examined whether a higher percentage of plans paid for treatment and whether there were changes in the types of services paid for--that is, whether plans paid for a broader range of services. We did not have information on which services were covered by the plans, therefore, we approximated coverage by reporting what services plans paid for.
-
Utilization. The utilization analyses examined whether a higher percentage of members with OUD received any treatment or specific types of services including MAT and psychosocial therapy; whether those in treatment used services more frequently; and how treatment episodes compared in terms of average length of treatment, types of services received during an episode, and whether there were differences in the characteristics of members who received MAT compared with those who did not.
-
Spending. The spending analyses examined total spending disaggregated by insurer and out-of-pocket spending, spending per user, and spending per unit of service for different types of services. Further, we investigated whether initiation, engagement, and retention in treatment was influenced by the relative share of treatment costs paid by insurers and individuals.
METHODS
Data
We used the Truven Health MarketScan® Commercial Claims and Encounters (CCAE) Database for calendar years 2006, 2007, 2014, and 2015. The Marketscan CCAE Database contains private insurance claims from approximately 150 large employers for employees, their dependents, and early retirees. The MarketScan CCAE Database is the largest commercial convenience sample in the United States. Although the database has fluctuated in size and contributors over time, it has maintained the same age and sex distribution as reported by the U.S. Census Bureau for individuals with employer-sponsored insurance. We linked four MarketScan source files to create the analytic files: (1) the inpatient file containing all inpatient admissions; (2) the outpatient file containing all outpatient services including treat-and-release emergency department (ED) visits; (3) the prescription drug claims file of all prescription drug fills; and (4) the enrollment file to identify enrollees with at least 10 out of 12 months of enrollment in each year.
Study Population
We included private employer-sponsored health plan members, which comprised employees, spouses, and dependents aged 12-64 years. We excluded enrollees under age 12 years because of the low prevalence of OUD and enrollees over age 64 years because of Medicare eligibility and the possibility of having secondary insurance. We required at least 10 out of 12 months of enrollment in each calendar year to capture a complete or nearly complete treatment picture for each individual. We excluded plans without prescription drug claims because of the importance of having complete service records for each enrollee and the need to capture use of MAT. We also excluded claims covered by capitated plans that did not include reimbursement information.
We restricted the analyses to enrollees with OUD, as defined in the Variable Definition section below, and for the plan-level analyses, we restricted the analyses to plans with at least ten enrollees with OUD. For the analyses of the relationship between insurer level of reimbursement and treatment initiation and engagement, to avoid having the results biased by outliers, we further restricted the sample of plans to exclude plans with fewer than ten treatment episodes, plans with fewer than ten people, and individuals below the 25th and above the 99th percentile of total costs.
Study Periods
We examined two study periods over a 10-year timeframe. Study Period 1 included 2006 and 2007. Study Period 2 included 2014 and 2015. We selected 2-year periods so that we would have enough enrollees with OUD and sufficient volume of less commonly used service types to report detailed service use. As described, the study periods are before and after important policy changes such as the MHPAEA and the ACA, as well as changes in the availability of treatment, for example, the introduction of generic buprenorphine/naloxone (see Figure 1). Further, opioid overdose deaths spiked between the time periods. Thus, we were able to examine how coverage, treatment patterns, and spending changed over a decade when there was both a large increase in the number of individuals needing treatment and advancements in policy and treatment approaches to address those increasing needs.
Analytic Files
From the files described above, we constructed several analytic files that would allow us to report on utilization and spending from the perspectives of what plans covered, what services individuals used, the composition of treatment episodes, and costs to insurers and enrollees. Below we describe the construction of these files.
Claims-Level File
The source claims-level analytic files included all inpatient admissions, outpatient services, and prescription drug fills. We categorized the individual claims records to create the service category types described below and to construct the financial variables. The raw claims files served as the building blocks for the individual and episode-level files. We used the claims-level file to report the percentage of plans paying for the various types of services and to estimate service level costs.
Individual-Level File
The individual-level file contained one record per person and included summary variables on service use and spending. The file contained member characteristics including age, sex, relationship to insured (employee, spouse, or dependent), and mental and physical health conditions as defined below. Service use summary variables included binary indicators for use of the defined categories of treatment as well as counts of total services used by service type. The summary spending variables totaled insurer reimbursement and enrollee out-of-pocket amounts paid from the raw claims files to create the total insurer spending and total out-of-pocket spending variables, respectively. We aggregated the individual-level file to create a plan-level file for reporting plan-level results such as the percent of plans having claims for particular service types.
Episode-Level File
The episode-level file was structured as one record per treatment episode and included all episodes of care for persons identified in the individual analytic file. We used the service categories listed in Table 1 to define treatment episodes from the full spectrum of OUD treatments. To separate services into specific episodes of treatment, we determined the set of services that would trigger a new treatment episode and the appropriate length of time between services that would identify the end of one episode and the beginning of a new one.
Episode-triggering events. We used services included in the Healthcare Effectiveness Data and Information Set (HEDIS) Initiation measure[49] criteria to define a new episode. This includes any outpatient visit, intensive outpatient or partial hospitalization service, residential service, detoxification, inpatient admission, or emergency department visit in which there is an OUD diagnosis on the service claim. Additionally, we modified the initiation measure criteria to include any MAT, including prescription drug fills or MAT administration codes.
Defining the end of a treatment episode. SUD treatment is commonly marked by starting, stopping, and often restarting treatment after a lapse in receiving services. Defining treatment episodes required defining the length of time between service encounters that would mark distinct episodes of care. To define this "gap," we considered patterns of utilization of both service encounters and MAT fills. We considered clinical guidelines and conventions for frequency of services and the literature on relapse after discontinuing MAT. For non-MAT service encounters--for example, psychotherapy or outpatient visits--we used a treatment gap of 35 days or longer to differentiate between treatment episodes. However, if the last service in question was an MAT prescription fill (Rx), we used a gap length of 15 days after the last day that the person should have had any medication from his or her prescription fill. We used the shorter gap length for MAT prescriptions because of the high risk of relapse and overdose following discontinuation of MAT.[50] In the few cases in which the data field that indicated the number of days of the prescription was missing, we assumed a days-filled value of 7 days for buprenorphine and 30 days for naltrexone.
Episodes could range from one encounter--for example, an emergency department visit with no follow-up or one prescription fill--to continued treatment for the duration of the observation period. They could contain any combination of service types and enrollees could have multiple episodes. Table 2 provides descriptive information for the episodes (i.e., the average number of episodes per person and the average length of episodes).
For all records in the episode-level file, we included a person identifier, the episode number for individuals with multiple episodes, the episode triggering service, identifiers for all service types used in the treatment episode, the count of services in the episode, the length of the episode in days, the reason for the episode end, and whether the episode met the HEDIS definitions[51] for treatment initiation and engagement that are defined below.
Variable Definitions
We constructed variables to identify individuals with OUD, to characterize the sample and health plans, and to define service types and utilization rates, number of treatment episodes, and financial variables. Below we describe how we defined each of these variables.
Opioid Use Disorder
As described, the analytic data files included members with OUD defined on the basis of either having an OUD diagnosis or receiving OUD treatment, presuming that individuals receiving treatment qualified for an OUD diagnosis even if the diagnostic code was missing from the claims record. We used this multipronged approach to include individuals with claims for OUD treatment but who did not have a recorded OUD diagnosis, for example, they had a pharmacy claim for an MAT but no record of an encounter with a provider. Specifically, individuals were classified as having OUD and included in the analytic files if they: (1) had two or more outpatient visits on different days or one inpatient stay with an OUD diagnosis in any claims field (see Appendix A for OUD diagnoses); (2) had an MAT prescription fill; or (3) had an MAT administration procedure code for buprenorphine/naloxone, naltrexone, or methadone.
Thus, we used OUD diagnosis codes, service procedure codes (from the outpatient files), and national drug codes (NDCs) to identify OUD. The International Classification of Diseases, Ninth Revision (ICD-9) and International Classification of Diseases (for diagnoses on claims with a service date before October 1, 2015), Tenth Revision (ICD-10) (for diagnoses on claims dated October 1, 2015, or latter), diagnostic codes used are listed in Appendix A. The NDCs used to identify buprenorphine/naloxone and naltrexone prescription drug fills are listed in Appendix B. The service administration codes are listed in Appendix C.
Enrollee and Plan Characteristics
The analytic files included member age, sex, relationship to insured (employee, spouse, or dependent), and physical and behavioral health conditions. They also included the number of months enrolled and health plan-type.
We used the Agency for Healthcare Research and Quality Clinical Classification Software[52] to measure physical and mental health conditions. The behavioral health conditions included alcohol use disorder, other drug use disorder, depression, bipolar disorder, schizophrenia, anxiety, and other mental health disorder. For these conditions, we required at least two outpatient claims or one inpatient claim with the respective diagnosis. For physical health conditions, we required just one diagnosis--inpatient or outpatient.
Service Categories for OUD Treatment
We classified all OUD treatment services into specific service categories. The categories were defined using the following types of codes: Current Procedural Terminology (CPT®) codes, revenue codes, Healthcare Common Procedure Coding System (HCPCS) codes, prescription drug NDCs, and codes to identify the place of service (e.g., office-based). The service categories are listed in Table 1 with brief definitions and notes on codes used. All service categories are mutually exclusive except for detoxification, which usually occurs in residential or intensive outpatient/partial hospitalization service settings but also can occur in an inpatient hospital setting and the outpatient setting.
We captured use of MAT through the prescription claims codes for buprenorphine and naltrexone, as well as through service administration codes, which are used to bill for MAT administration, for example, giving a Vivitrol injection or administering methadone in an OTP. For most analyses, we reported "any MAT," which includes a claim for any prescription or administration claim, and additionally reported the individual categories.
| TABLE 1. OUD Treatment Service Category Definitions | ||
|---|---|---|
| Service Category | Definition | Codes Used |
| Inpatient | Inpatient stays | DX (primary) |
| Outpatient detoxification | Detoxification services often delivered as residential, intensive outpatient, or partial hospitalization services | DX, HCPCS, POS |
| Residential SUD care | Short-term and long-term residential treatment services | DX, CPT, Rev, HCPCS, POS |
| Intensive outpatient or partial hospitalization services | Intensive outpatient (e.g., day programs) or partial hospitalization (24 hours) services | DX, CPT, Rev, HCPCS, POS |
| Outpatient office visit | Includes evaluation and management and other outpatient services not elsewhere classified | DX, CPT, Rev, HCPCS, POS |
| Psychotherapy | Psychotherapy delivered in an outpatient setting | DX, CPT, POS |
| Peer support services | Outpatient peer support services | DX, HCPCS |
| Case management | Outpatient case management services | DX, HCPCS, POS |
| Treat-and-release ED visits | ED visits that resulted in a discharge (i.e., did not end in an inpatient admission) | DX, CPT, Rev |
| Buprenorphine prescriptiona | Buprenorphine/naloxone Rx or Subutex Rx | NDC |
| Buprenorphine administration | Outpatient oral buprenorphine/naloxone provided by physicianb | HCPCS |
| Methadone administration | Outpatient methadone service administration in an OTP for MAT (i.e., not for pain) | HCPCS |
| Naltrexone prescription | Naltrexone prescription drug fill | NDC |
| Naltrexone administration | Outpatient Naltrexone (Vivitrol) injection | HCPCS |
| ||
Utilization
We created binary variables indicating whether the member used each OUD service type. We then computed the number of times that each service was used among those using each respective service and computed a 12-month utilization rate for each service by dividing the number of times the service was used by the number of months enrolled and multiplying by 12.
Coverage
For each included plan, we created binary variables indicating whether any OUD service and each respective OUD service was received by a health plan enrollee.
Financial Variables
We computed the following variables to reflect insurer and individual spending, adjusting the 2006-2007 results based in the gross domestic product deflator:
-
Total payment: For each service, the total amount paid to providers.
-
Insurance payment: For each service, the total amount paid by insurance to providers.
-
Out-of-pocket payment: For each service, the total amount paid to providers by the member (includes deductibles, co-payments, and co-insurance, does not include insurance premiums).
Treatment Initiation, Engagement, and Retention
We defined whether each treatment episode met the HEDIS treatment initiation and engagement criteria.[53] To meet the initiation criteria, a treatment episode must have a clinical follow-up visit that is not an emergency department visit within 14 days of the episode start. The treatment engagement criteria require two clinical visits within 30 days of treatment initiation, and especially important, the episode must have met the initiation criteria in order to meet the engagement criteria. We did not count an MAT prescription fill toward meeting the initiation and engagement criteria because treatment guidelines stress the importance of clinical visits at the start of treatment. Episodes that start with an inpatient admission automatically qualify as meeting treatment initiation. Additionally, we categorized treatment episode length into 30, 90, and 180+ days to capture varying lengths of treatment.
ANALYTIC APPROACH
We used descriptive methods to examine changes in coverage, utilization, and spending over time. We used multivariable regression models to examine differences in the characteristics of enrollees with OUD who received MAT and those who did not. We used Students t-tests to evaluate statistical significance in the analyses of the relationship between insurer level of reimbursement and treatment initiation, engagement, and retention. Additional details of these analyses are provided below.
Coverage
Using plan-level data, this descriptive coverage analyses examined whether there was a change in the percentage of health plans paying for any OUD service and each specific type of service. We computed the percentage of individuals who accessed each service type for each plan and reported the number and percentage of enrollees receiving each type of service over each of the 2-year study periods.
Utilization
Descriptive Analysis. The utilization analyses involved individual-level and episode-level analyses. We computed the percentage of individuals with OUD across all plans who accessed each type of service, and the percentage receiving any service in each 2-year time period. Second, we computed the average number of services per user standardized to a 12-month period. We calculated the percent change in utilization between the timepoints using the following formula: percent change = [(Time 2 rate - Time 1 rate) / Time 1 rate].
For the episode-level comparison we compared the length of treatment episodes to see whether treatment retention, which is related to improved outcomes,[54] improved over time. Further, we compared differences in service types used during treatment episodes to assess whether members received care that was consistent with guidelines related to having access to different levels of the care--including inpatient, residential, intensive outpatient, and outpatient--depending on their individual needs and circumstances.
Multivariable Analysis: Comparison of MAT Versus Non-MAT. Among the OUD population we analyzed individual characteristics associated with using MAT at both timepoints. We compared MAT users to non-MAT users in terms of sex, age, relationship to insured (insured, spouse, or dependent), mental health comorbidity, and physical health comorbidity. We ran separate logistic regression models for each period with the dependent variable being a 0-1 binary variable that indicated whether the individual received any MAT services in the associated time period. Explanatory variables include age, sex, and relationship to insured categorical variables, as well as binary indicator variables of behavioral health comorbidities and physical health comorbidities. Summary statistics included the odds ratio (OR) and 95 percent confidence intervals.
Spending
The spending analyses included an examination of OUD treatment spending by insurers and enrollees, amounts paid per user and per claim, cost-sharing between insurers and enrollees, and the impact of cost-sharing on OUD treatment initiation, engagement, and retention. Additional details are provided below.
Insurer and enrollee spending for OUD treatment. For this descriptive analysis we computed insurer and out-of-pocket spending variables for each type of service from the individual-level file. Each service claim details the amount paid by the insurer for the particular service and the out-of-pocket payments for which the member is responsible. The insurer and out-of-pocket spending variables are the sum of payments over the 2-year period for each service type, as well as total service spending. For inpatient stays, we produced insurer and out-of-pocket spending per stay. To control for varying number of months of enrollment, we standardized all spending variables to 12 months of enrollment (e.g., for someone with the full 24 months of enrollment). To annualize spending we divided the resulting spending amount by two. We computed summary statistics (mean, standard deviation, min, max) comparing the time periods.
Cost-sharing between insurers and enrollees. Using the 12-month standardized spending variables, we computed the percentage payment by insurer. These were calculated as the standardized insurer payment divided by the sum of the standardized insurer payment and the standardized out-of-pocket payment per member.
Reimbursement. Using the individual-level file from each period, we reported summary statistics (mean, standard deviation, minimum, maximum) for the following payment variables for each service type: total payment, insurer payment, and out-of-pocket payment. We also reported summary statistics for the percentage payment by insurer variable described above. We also produced summary statistics at the plan-level to compare the mean reimbursement amount between plans in each period.
Relationship between insurer level of reimbursement (cost-sharing) and treatment. We examined the relationship between insurer level of reimbursement for OUD services and treatment initiation, engagement, and retention to understand whether higher reimbursement was associated with increased use of services. We approached this research question as a demand side analysis, in which we hypothesized that higher levels of reimbursement by the insurance plan, which by definition, imply lower out-of-pocket costs to the enrollee, were positively associated with treatment initiation, engagement, and retention using the episode-level dataset described above. For each treatment episode, we created indicators of whether the episode met the HEDIS definitions of treatment initiation and engagement and achieved varying levels of retention (30, 90, and 180+ days) as defined above. We then aggregated the episode results to create a plan-level dataset with indicators for the percentage of episodes in each plan that achieved each utilization outcome.
We implemented exclusions on both the episode-level and person-level files prior to aggregating to the plan-level analysis file to avoid having outliers skew the results. We excluded plans with fewer than ten treatment episodes, plans with fewer than ten people, and individuals below the 25th and above the 99th percentile of total costs.
To assess the association between level of coverage and treatment initiation, engagement, and retention, we stratified plan reimbursement levels at the median. We then calculated the mean and standard deviation of the outcome percentages across plans for plans with levels of reimbursement that were above and below the median. We used Students t-tests to evaluate the statistical significance of the differences in means on each outcome.
RESULTS
Summary Statistics
Table 2 provides summary statistics for the plan, individual, episode, and claims-level analytic files. The eligible samples based on applying the exclusion criteria to the person-level file included 11,307,960 enrollees at Time 1 and 16,802,208 enrollees at Time 2. Of these, 0.13 percent of members from Time 1 and 0.41 percent of members from Time 2 were identified with an OUD and included in the individual-level data file (i.e., OUD person-level study population). Appendix D contains the full attrition table for the individual-level file.
Compared with the total insured population, in both time periods, members with an OUD were more likely to be male, to be in the 18-44-year age category, and to have significantly higher rates of both physical and behavioral health comorbidity. There was a difference in the distribution of the samples at the time periods by the relationship to insured (insured, spouse, or dependent). At Time 2, a larger portion of the total insured sample were dependents and fewer were the spouse of the insured. This finding reflects the ACA provision that allows adult children up to age 26 years to stay on their parent's insurance. Further, at Time 2, dependents constituted a larger portion of the OUD-affected population. Dependents were 23.1 percent of the total insured population but accounted for 30.6 percent of the OUD-affected sample. Appendix D provides a detailed comparison of the total insured population compared with the analytic sample composed of members with OUD.
| TABLE 2. Descriptive Information on Plan, Individual, Episode, and Claims-Level Analytic Datasets from Employer-Sponsored Commercial Insurance Plans by Time Period, 2005-2007 and 2014-2015a | ||
|---|---|---|
| Variable | 2006-2007 | 2014-2015 |
| Individuals | ||
| Number of eligible individuals | 11,307,960 | 16,802,208 |
| Number of individuals with OUD | 14,988 (0.13%) | 69,258 (0.41%) |
| Plans | ||
| Number of plans | 2,386 | 4,659 |
| Number of plans included in the insurer coverage analysisb | N/A | 1,242 |
| Treatment episodes | ||
| Number of episodes | 24,063 | 114,494 |
| Average number of episodes per person | 6.77 | 10.1 |
| Average length of episodes in days | 77.9 | 82.4 |
| Claims | ||
| Number of OUD claims | 174,874 | 1,771,549 |
| Average number of OUD claims per person | 11.7 | 25.6 |
| ||
Health Plan Coverage of Services
We investigated the change in the percentage of health plans paying for any OUD treatment and specific service types over each 2-year period. Overall, there was essentially no change in the percentage of plans paying for OUD treatment (see Table 3). At each time period, approximately 15 percent of plans that had an individual identified with OUD did not reimburse for any OUD treatment services. This occurred when OUD was recorded on a claim, but the service provided was for something other than OUD treatment, for example the individual was hospitalized for a physical health condition, but OUD was recorded on the claim.
However, in the second period, a greater percentage of plans paid for every type of service except inpatient treatment, demonstrating that plans shifted away from paying for inpatient services but started paying for a broader range of services. For example, the percentage of plans paying for outpatient office visits increased from 52.3 percent to 77.2 percent. Additionally, there was an increase in the percentage of plans paying for psychotherapy (from 34.0 percent to 50.9 percent). Coverage for residential treatment increased substantially, from 2.3 percent to 12.6 percent, but still was relatively uncommon compared with other service types. Coverage of peer support services and case management remained extremely rare; however, a small percentage of plans paid for them at the second period, suggesting a trend toward increasing coverage for these types of support services.
| TABLE 3. Percentage of Employer-Sponsored Commercial Insurance Plansa Paying for OUD Treatment Services the 2-Year Periods, 2006-2007 and 2014-2015a | ||||
|---|---|---|---|---|
| Variable | 2006-2007 n=2,386a n | 2006-2007 n=2,386a % | 2014-2015 n=4,659b n | 2014-2015 n=4,659b % |
| Any treatment service (including MAT) | 2,028 | 85.0 | 3,996 | 85.8 |
| Inpatient treatment | 1,458 | 61.1 | 2,627 | 56.4 |
| Outpatient detoxification/withdrawal management | 20 | 0.8 | 252 | 5.4 |
| Residential services | 56 | 2.3 | 588 | 12.6 |
| Intensive outpatient or partial hospitalization | 670 | 28.1 | 2,059 | 44.2 |
| Outpatient office visits | 1,248 | 52.3 | 3,597 | 77.2 |
| Psychotherapy | 811 | 34.0 | 2,371 | 50.9 |
| Peer support services | 0 | 0.0 | 10 | 0.2 |
| Case management | 2 | 0.1 | 150 | 3.2 |
| Treat-and-release ED visits | 548 | 23.0 | 1,599 | 34.3 |
| Any MAT prescription or administration | 1,413 | 59.2 | 3,039 | 65.2 |
| Buprenorphine prescription | 1,350 | 56.6 | 2,884 | 61.9 |
| Buprenorphine administration | 0 | 0.0 | 40 | 0.9 |
| Methadone administration | 115 | 4.8 | 408 | 8.8 |
| Naltrexone prescription | 336 | 14.1 | 1,288 | 27.6 |
| Naltrexone administration | 21 | 0.9 | 633 | 13.6 |
| ||||
The percentage of plans paying for all types of MAT increased between the time periods. In particular, the percentage of plans that had claims for naltrexone prescriptions almost doubled--increasing from 14.1 percent to 27.6 percent. Plans paying for naltrexone administrations increased from 0.9 percent to 13.6 percent.
Member Service Use
Percentage of members with OUD receiving treatment. Consistent with the plan-level results, Table 4 shows that a higher percentage of members with OUD received all types of services except inpatient treatment which decreased and MAT which stayed essentially the same. In the earlier period, inpatient treatment was the most common form of treatment, but the frequency of inpatient treatment decreased from 42.5 percent to 27.8 percent between the two periods. At Time 2, the most common service was outpatient office visits, with 57.8 percent of members having an office visit, up from 32.7 percent at Time 1. Use of outpatient office visits increased from 32.7 percent to 57.8 percent.
| TABLE 4. Utilization of OUD Services among Persons with OUD Aged 12-64 Years Old and Enrolled in Employer-Sponsored Commercial Insurance Plans, 2006-2007 and 2014-2015a | ||||
|---|---|---|---|---|
| OUD Services and Settings | 2006-2007 n=14,988b n | 2006-2007 n=14,988b % | 2014-2015 n=69,258b n | 2014-2015 n=69,258b % |
| Any treatment service | 14,208 | 94.8 | 62,971 | 90.9 |
| Inpatient treatment | 6,376 | 42.5 | 19,267 | 27.8 |
| Outpatient detoxification/withdrawal management | 150 | 1.0 | 727 | 1.0 |
| Residential services | 64 | 0.4 | 1,310 | 1.9 |
| Intensive outpatient or partial hospitalization | 1,713 | 11.4 | 11,884 | 17.2 |
| Outpatient office visits | 4,900 | 32.7 | 40,020 | 57.8 |
| Psychotherapy | 2,534 | 16.9 | 15,396 | 22.2 |
| Peer support services | 0 | 0.0 | 10 | 0.01 |
| Case management | 2 | 0.01 | 215 | 0.3 |
| Treat-and-release ED visits | 1,090 | 7.3 | 6,399 | 9.2 |
| Any MAT prescription or administration | 7,583 | 50.6 | 35,066 | 50.6 |
| Buprenorphine prescription | 6,972 | 46.5 | 30,487 | 44.0 |
| Buprenorphine administration | 0 | 0.0 | 43 | 0.06 |
| Methadone administration | 193 | 1.3 | 973 | 1.4 |
| Naltrexone prescription | 650 | 4.3 | 4,864 | 7.0 |
| Naltrexone administration | 23 | 0.2 | 1,297 | 1.9 |
| ||||
Overall, use of MAT stayed at the same level in the later period, in part because of greater use of naltrexone, which increased from 4.3 percent to 7.0 percent; use of buprenorphine decreased slightly from 46.5 percent to 44.0 percent.
Average number of services per user. As described, compared with Time 1, in Time 2 plans paid for a broader range of services and greater percentages of enrollees received most types of services. Additionally, as shown in Table 5, the average number of services used per user increased for all services except residential services. As shown in Table 5, members used an average of 5.2 intensive outpatient or partial hospitalization services in 2006-2007, but this rate increased by 158.5 percent to 13.5 in 2014-2015. Although the percentage of members using residential services was greater between 2014 and 2015 (1.9 percent per Table 4), the average number of days receiving residential services among those receiving residential services decreased from 5.0 to 2.5.
| TABLE 5. Change in Rates of OUD Service Use among Persons with OUD Aged 12-64 Years Old and Enrolled in Employer-Sponsored Commercial Insurance Plans, by Respective OUD Treatment Service Category, 2006-2007 and 2014-2015a,b,c | |||
|---|---|---|---|
| Treatment Service | Mean Number of Services per User 2006-2007 n=14,208 | Mean Number of Services per User 2014-2015 n=62,971 | Percent Change Between Time Periods |
| Inpatient treatment | 0.86 | 1.06 | 23.3 |
| Outpatient detoxification/ withdrawal management | 2.27 | 3.17 | 39.6 |
| Residential services | 5.01 | 2.54 | -49.2 |
| Intensive outpatient or partial hospitalization | 5.23 | 13.53 | 158.7 |
| Outpatient office visits | 3.79 | 5.20 | 37.2 |
| Psychotherapy | 6.76 | 8.00 | 18.3 |
| Peer support services | N/A | 6.25 | N/A |
| Case management | 0.75 | 3.34 | N/A |
| Treat-and-release ED visits | 0.76 | 0.88 | 15.8 |
| Methadone dispensing visits | 13.34 | 32.75 | 145.5 |
| Buprenorphine Rx or service administrationd,e | 5.62 | 9.06 | 61.2 |
| Extended-release naltrexone Rx or service administrationd,f | 1.49 | 2.26 | 51.7 |
| |||
Composition of treatment episodes. To better understand the array of services that members received, we constructed treatment episodes on the basis of service dates as described in the Methods section. Table 6 shows that among the 14,208 (Time 1) and 62,971 (Time 2) members who received any treatment, there were 24,063 treatment episodes in Time 1 and 114,494 in Time 2. Mean episode length was slightly longer at Time 2 (82.4 days) than at Time 1 (77.9 days).
In 2006-2007, the most common type of service included in an episode was MAT (54.6 percent), consisting mostly of buprenorphine prescription fills, but this dropped to 42.9 percent at Time 2. In 2014-2015, there was a shift in the types of services used during treatment episodes, with outpatient office visits having the highest frequency (56.2 percent) compared with other OUD services. Although the use of MAT decreased slightly in Time 2, the percentage of episodes with intensive outpatient or partial hospitalization services increased.
| TABLE 6. Among Persons with OUD Aged 12-64 Years Old and Enrolled in Employer-Sponsored Commercial Insurance Plans, Number and Percentage of OUD Treatment Episodes That Included Each Service Type, 2006-2007 and 2014-2015a | ||||
|---|---|---|---|---|
| Variable | 2006-2007 n=24,063 n | 2006-2007 n=24,063 % | 2014-2015 n=114,494 n | 2014-2015 n=114,494 % |
| Inpatient treatment | 7,545 | 31.4 | 24,142 | 21.1 |
| Outpatient detoxification/withdrawal management | 152 | 0.6 | 665 | 0.6 |
| Residential services | 74 | 0.3 | 1,378 | 1.2 |
| Intensive outpatient or partial hospitalization | 1,835 | 7.6 | 13,958 | 12.2 |
| Outpatient office visits | 6,355 | 26.4 | 64,372 | 56.2 |
| Psychotherapy | 3,511 | 14.6 | 17,929 | 15.7 |
| Treat-and-release ED visits | 1,227 | 5.1 | 7,538 | 6.6 |
| Any MAT prescription or administrationb | 13,137 | 54.6 | 49,110 | 42.9 |
| Methadone dispensing visits | 288 | 1.2 | 1,016 | 0.9 |
| Buprenorphine Rx/service administration | 12,188 | 50.7 | 42,326 | 37.0 |
| Extended-release naltrexone Rx/service administration | 792 | 3.3 | 6,956 | 6.1 |
| ||||
Medication-assisted treatment. We compared the characteristics of individuals with OUD who received MAT with the characteristics of those not receiving MAT. As shown in Table 7, males, and those in the 18-44-year age category were more likely to get MAT in both time periods. Women had decreased odds of receipt of MAT compared with men (OR = 0.71 in 2006-2007; OR = 0.67 in 2014-2015). Individuals aged 12-17 years and individuals aged 46-64 years also had decreased odds of receiving MAT, compared with individuals aged 18-44 years. The odds ratios for both age categories were more extreme in 2014-2015, demonstrating a shift toward MAT being even more concentrated in the middle age group. In 2006-2007, there was no association between relationship to insured and receiving MAT. However, in 2014-2015, both spouses and particularly dependents (OR = 0.66) with OUD were less likely to receive MAT compared with the insured member.
In terms of comorbid mental and physical health conditions, individuals receiving MAT tended to have lower prevalence of most of the behavioral and physical health conditions in both time periods. The differences were slightly less extreme in 2014-2015 suggesting improvement in the use of MAT among individuals with comorbid conditions, as evidenced by fewer statistically significant results in 2014-2015. For example, individuals with a mood disorder had slightly decreased odds of receiving MAT in 2006-2007 (OR = 0.86), whereas the OR for the same variable in 2014-2015 was not statistically significant (OR = 1.00). A concerning result for comorbid behavioral health conditions was a further decreased odds of receiving MAT for individuals with schizophrenia or other psychotic disorder (OR = 0.70 in 2006-2007; OR = 0.63 in 2014-2015).
| TABLE 7. Member Characteristics among Persons with OUD Aged 12-64 Years Old and Enrolled in Employer-Sponsored Commercial Insurance Plans, by Whether Persons with OUD Accessed MAT, 2006-2007 and 2014-2015a | ||||||||
|---|---|---|---|---|---|---|---|---|
| Variable | 2006-2007 MATb % | 2006-2007 No MAT % | 2006-2007 OR | 2006-2007 CI | 2014-2015 MAT % | 2014-2015 No MAT % | 2014-2015 OR | 2014-2015 CI |
| Sex | ||||||||
| Male (reference) | 59.7 | 51.5 | Ref. | 63.1 | 51.7 | Ref. | ||
| Female | 40.3 | 48.5 | 0.71* | (0.66-0.76) | 36.9 | 48.3 | 0.67* | (0.65-0.70) |
| Age group, years | ||||||||
| 12-17 | 3.5 | 9.0 | 0.36* | (0.30-0.43) | 1.1 | 4.4 | 0.22* | (0.19-0.25) |
| 18-44 (reference) | 62.0 | 50.2 | Ref. | 73.9 | 53.8 | Ref. | ||
| 45-64 | 34.5 | 40.8 | 0.70* | (0.65-0.76) | 25.0 | 41.8 | 0.56* | (0.54-0.58) |
| Relationship to insured | ||||||||
| Insured (reference) | 48.2 | 43.4 | Ref. | 42.2 | 38.2 | Ref. | ||
| Spouse | 33.3 | 34.7 | 0.95 | (0.88-1.03) | 26.3 | 32.1 | 0.91* | (0.87-0.94) |
| Dependent | 18.5 | 21.9 | 0.90 | (0.81-1.00) | 31.5 | 29.6 | 0.66* | (0.63-0.69) |
| Behavioral health conditions | ||||||||
| Alcohol use disorder | 15.2 | 19.9 | 0.79* | (0.72-0.86) | 19.1 | 21.7 | 0.83* | (0.79-0.86) |
| Anxiety disorder | 20.2 | 23.9 | 0.95 | (0.87-1.03) | 42.3 | 43.8 | 1.19* | (1.15-1.23) |
| Mood disorder | 43.6 | 52.3 | 0.86* | (0.80-0.93) | 44.9 | 50.4 | 1.00 | (0.97-1.04) |
| Other mental health disorder | 17.4 | 23.8 | 0.80* | (0.73-0.87) | 28.4 | 31.6 | 0.96 | (0.93-1.00) |
| Other SUD | 36.9 | 44.0 | 0.83* | (0.77-0.89) | 45.1 | 44.7 | 1.01 | (0.98-1.05) |
| Schizophrenia/other psychotic disorder | 2.5 | 4.7 | 0.70* | (0.58-0.85) | 2.6 | 5.1 | 0.63* | (0.57-0.69) |
| Physical health conditions | ||||||||
| Acquired hypothyroidism | 12.8 | 12.7 | 1.21* | (1.09-1.34) | 13.3 | 18.1 | 1.10* | (1.05-1.15) |
| Acute myocardial infarction | 1.1 | 1.9 | 0.83 | (0.61-1.11) | 0.6 | 1.7 | 0.75* | (0.63-0.88) |
| Alzheimer's disease and other dementias | 2.4 | 4.3 | 0.78 | (0.64-0.95) | 2.1 | 3.9 | 0.89 | (0.80-0.98) |
| Anemia | 13.4 | 16.0 | 0.99 | (0.89-1.09) | 12.3 | 19.1 | 0.95 | (0.91-1.00) |
| Asthma | 11.1 | 11.8 | 1.07 | (0.97-1.20) | 11.0 | 15.5 | 0.85* | (0.81-0.89) |
| Atrial fibrillation (dysrhythmia) | 15.3 | 18.2 | 0.98 | (0.89-1.08) | 16.2 | 23.6 | 0.87* | (0.84-0.91) |
| Cancer | 9.7 | 10.5 | 1.01 | (0.90-1.12) | 8.6 | 13.2 | 0.86* | (0.82-0.91) |
| Chronic kidney disease | 0.9 | 2.0 | 0.61* | (0.45-0.83) | 1.2 | 3.8 | 0.58* | (0.51-0.65) |
| Chronic obstructive pulmonary disease | 14.5 | 17.2 | 0.95 | (0.86-1.05) | 11.4 | 16.6 | 0.99 | (0.95-1.04) |
| Congestive heart failure | 2.5 | 4.4 | 0.80 | (0.65-0.98) | 1.7 | 4.0 | 0.93 | (0.84-1.04) |
| Diabetes | 11.3 | 13.6 | 0.91 | (0.82-1.02) | 12.8 | 21.6 | 0.82* | (0.78-0.86) |
| HIV/AIDS | 0.7 | 0.6 | 1.34 | (0.88-2.03) | 0.7 | 0.6 | 1.20 | (0.99-1.46) |
| Hepatitis C | 2.7 | 3.2 | 1.00 | (0.82-1.22) | 4.6 | 3.4 | 1.60* | (1.48-1.74) |
| Hyperlipidemia | 24.5 | 24.0 | 1.12* | (1.03-1.22) | 22.1 | 33.2 | 0.89* | (0.85-0.93) |
| Hypertension | 30.2 | 33.5 | 0.94 | (0.86-1.02) | 27.4 | 40.1 | 0.85* | (0.81-0.88) |
| Ischemic heart disease | 7.0 | 9.7 | 0.86 | (0.75-0.99) | 4.0 | 8.6 | 0.86* | (0.80-0.93) |
| Non-traumatic joint disorders | 46.6 | 47.4 | 1.08 | (1.00-1.15) | 40.2 | 57.0 | 0.65* | (0.62-0.67) |
| Stroke/transient ischemic attack | 4.7 | 7.3 | 0.82* | (0.70-0.95) | 3.4 | 7.7 | 0.76* | (0.71-0.82) |
* A single asterisk next to the OR represents a statistically significant result at the 0.01 significance level. | ||||||||
For comorbid physical health conditions, results generally suggest decreased odds of receiving MAT for individuals with physical health conditions, with a few exceptions. Two results that stand out are the decreased odds of receipt of MAT for individuals with chronic kidney disease (OR = 0.61 in 2006-2007; OR = 0.58 in 2014-2015) and the increased odds of receipt of MAT for individuals with Hepatitis C in the 2014-2015 results (OR = 1.60).
Spending
Total Insurer spending per user. We compared average total insurer spending per enrollee for each type of OUD service between 2006-2007 and 2014-2015. As shown in Table 8, the costs for all OUD services and settings increased substantially between the time periods. Although a lower percentage of people used inpatient treatment, the cost per user increased by 61 percent for inpatient services from $6,837 (inflation-adjusted) in Time 1 to $11,000 in Time 2. The cost was almost triple the amount between Time 1 and Time 2 for residential services. The largest increase in cost per user was for intensive outpatient or partial hospitalization, which went from $1,994 (inflation-adjusted) in Time 1 to $8,263 in Time 2. Increases for less intensive services--outpatient office visits (18.1 percent) and psychotherapy (23.6 percent)--were more modest.
| TABLE 8. Average Total Spending Per Enrollee with OUD Aged 12-64 Years Old and Enrolled in Employer-Sponsored Commercial Insurance Plans Standardizeda to a 12-Month Enrollment Period, 2006-2007 and 2014-2015b | ||||||
|---|---|---|---|---|---|---|
| OUD Services and Settings | 2006-2007 n | 2006-2007 Mean, $ | 2006-2007 Adjusted Mean, $c | 2014-2015 n | 2014-2015 Mean, $ | % Change in Meand |
| Any treatment servicee | 14,208 | 3,495 | 4,385 | 62,971 | 7,118 | 62.3 |
| Inpatient treatment | 6376 | 5,449 | 6,837 | 19,267 | 11,000 | 60.9 |
| Outpatient detoxification/withdrawal management | 2,436 | 227 | 285 | 35,267 | 424 | 48.8 |
| Residential services | 64 | 1,541 | 1,933 | 1,310 | 4,536 | 134.6 |
| Intensive outpatient or partial hospitalization | 1,713 | 1,589 | 1,994 | 11,884 | 8,263 | 314.5 |
| Outpatient office visits | 4,900 | 413 | 518 | 40,020 | 612 | 18.1 |
| Psychotherapy | 2,534 | 555 | 696 | 15,396 | 861 | 23.6 |
| Peer support services | 0 | N/A | N/A | 10 | N/A | N/A |
| Case management | 2 | N/A | N/A | 215 | 510 | N/A |
| Treat-and-release ED visits | 1,090 | 320 | 401 | 6,399 | 660 | 64.4 |
| Any MAT prescription or administrationf | 7,583 | 1,023 | 1,283 | 35,066 | 2,141 | 66.9 |
| ||||||
Total out-of-pocket spending per user. We compared total out-of-pocket spending per enrollee for each type of OUD service between 2006-2007 and 2014-2015 (Table 9). Similar to insurer spending, out-of-pocket spending for all OUD services and settings increased between the time periods. Specifically, the amount paid per user increased substantially for residential services from $130 (inflation-adjusted) in Time 1 to $579 in Time 2. The largest increase in cost per user was for intensive outpatient or partial hospitalization, which went from $221 (inflation-adjusted) in Time 1 to $794 in Time 2. Among all types of OUD services and settings, inpatient services accounted for the highest out-of-pocket costs per user for both time periods. Treat-and-release emergency department visits also increased from $38 to $117. However, less intensive services--outpatient office visits and psychotherapy--saw only modest increases.
| TABLE 9. Per Capita Out-of-Pocket Spending Per Enrollee with OUD Aged 12-64 Years Old and Enrolled in Employer-Sponsored Commercial Insurance Plans Standardizeda to a 12-Month Enrollment Period, 2006-2007 and 2014-2015b | ||||||
|---|---|---|---|---|---|---|
| OUD Services and Settings | 2006-2007 n | 2006-2007 Mean, $ | 2006-2007 Adjusted Mean, $c | 2014-2015 n | 2014-2015 Mean, $ | % Change in Meand |
| Any treatment servicee | 14,208 | 361 | 463 | 62,971 | 892 | 92.5 |
| Inpatient treatment | 6,376 | 384 | 493 | 19,267 | 974 | 97.6 |
| Outpatient detoxification/ withdrawal management | 2,436 | 86 | 110 | 35,267 | 148 | 34.5 |
| Residential services | 64 | 101 | 130 | 1,310 | 579 | 345.4 |
| Intensive outpatient or partial hospitalization | 1,713 | 172 | 221 | 11,884 | 794 | 259.3 |
| Outpatient office visits | 4,900 | 102 | 131 | 40,020 | 169 | 29.0 |
| Psychotherapy | 2,534 | 122 | 157 | 15,396 | 185 | 17.8 |
| Peer Support services | 0 | N/A | N/A | 10 | 0 | N/A |
| Case management | 2 | N/A | N/A | 215 | 49 | N/A |
| Treat-and-release ED visits | 1,090 | 38 | 49 | 6,399 | 117 | 138.8 |
| Any MAT prescription or administrationf | 7,583 | 173 | 222 | 35,066 | 332 | 49.5 |
| ||||||
Percentage payment by insurer. As described in the Methods section, we used the standardized spending variables (standardized to a 12-month enrollment period) to compute the average percentage of spending paid for by the insurer. As shown in Figure 2, the average percentage paid for by the insurer decreased slightly between 2006-2007 and 2014-2015 for inpatient, residential, treat-and-release emergency department visits, outpatient office visits, and psychotherapy increasing the financial burden on the enrollee. The average percent paid for by insurer remained over 80 percent for inpatient, residential, and intensive outpatient or partial hospitalization in both time periods. The percentage paid for by the insurer for MAT increased from 78 percent in Time 1 to 81 percent in Time 2. Peer support services and case management also saw change in insurer coverage in 2014-2015, with no insurance reimbursements in Time 1 to some services being reimbursed for in Time 2.
| FIGURE 2. Percentage of Claim Paid by Insurer for Persons with OUD Aged 12-64 Years Old and Enrolled in Employer-Sponsored Commercial Insurance Plans, 2006-2007 and 2014-2015 |
|---|
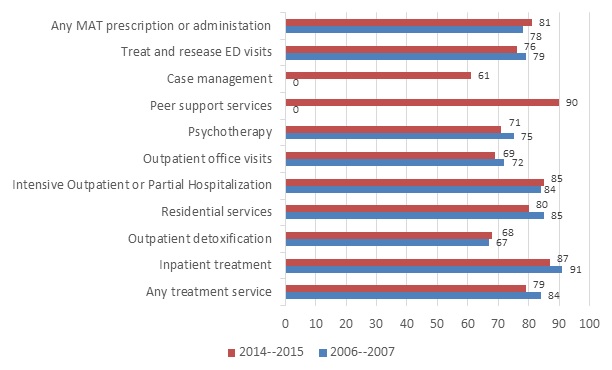 |
|
Unit cost of services. Table 10 shows the average amount paid per unit of service for each service type. Controlling for inflation, the average total payment for most service types increased between the time periods. Inpatient treatment services had the highest average cost per unit of service compared with the other OUD services. Residential treatment services had the largest percentage increase between the time periods. Specifically, the total average cost per unit of residential treatment services nearly tripled. Outpatient visits had a small decrease in the total average cost per unit between the periods. Outpatient methadone administration also decreased substantially.
| TABLE 10. Mean Amount Paid per Service Claim for Total Payments for Persons with OUD Aged 12-64 Years Old and Enrolled in Employer-Sponsored Commercial Insurance Plans, 2006-2007 and 2014-2015 | ||||||||
|---|---|---|---|---|---|---|---|---|
| OUD Services and Settings | 2006-2007 n | 2006-2007M ean, $ | 2006-2007S D | 2006-2007A djusted Mean, $b | 2014-2015n | 2014-2015M ean, $ | 2014-2015S D | % Change in Meanc |
| Inpatient treatment | 8,526 | 6,851 | 14,610 | 8,596 | 31,843 | 11,292 | 17,508 | 31.4 |
| Outpatient detoxification/ withdrawal management | 428 | 270 | 208 | 338 | 3,377 | 448 | 524 | 32.5 |
| Residential services | 503 | 302 | 752 | 379 | 10,405 | 987 | 1,532 | 160.4 |
| Intensive outpatient or partial hospitalization | 15,801 | 293 | 709 | 368 | 288,326 | 585 | 721 | 59.0 |
| Outpatient office visits | 33,150 | 115 | 330 | 144 | 385,762 | 126 | 208 | -12.5 |
| Psychotherapy | 30,580 | 87 | 120 | 109 | 215,624 | 117 | 191 | 7.2 |
| Peer support services | N/A | N/A | N/A | N/A | 89 | 194 | 121 | N/A |
| Case management | 2 | 63 | 88 | 79 | 1,377 | 139 | 148 | 75.9 |
| Treat-and-release ED visits | 1,909 | 327 | 501 | 410 | 16,029 | 510 | 665 | 24.3 |
| Buprenorphine prescription | 65,451 | 218 | 174 | 274 | 443,247 | 274 | 200 | 0.0 |
| Buprenorphine administration | N/A | N/A | N/A | N/A | 536 | 163 | 348 | N/A |
| Methadone administration | 4,501 | 84 | 123 | 105 | 65,533 | 60 | 108 | -42.9 |
| Naltrexone prescription | 1,622 | 317 | 409 | 398 | 15,261 | 574 | 660 | 44.3 |
| Naltrexone administration | 43 | 447 | 373 | 561 | 4,682 | 1,084 | 579 | 93.2 |
| ||||||||
Relationship between plan level of reimbursement and treatment initiation, engagement, and retention. We hypothesized that plans with higher levels of reimbursement would have higher utilization rates, anticipating that lower out-of-pocket costs would increase patients' ability to initiate and continue in treatment. A total of 1,242 plans in the 2014-2015 period met the inclusion criteria described in the Methods section. The median level of reimbursement across plans was 78.5 percent.
We found positive correlations between plan level of reimbursement and initiation, engagement, and each of the retention variables (Figure 3). Plans with above median level of reimbursement had a higher average percentage of members meeting each outcome compared with plans with lower median reimbursement rates. The mean differences were statistically significant at the 0.05 level for all outcomes. Despite being statistically significant, the difference in means was small in magnitude for all outcomes except for initiation. For example, the difference in mean plan-level percentages was 2.8 percentage for episodes that are at least 30 days, 1.5 percentage points for episodes that are at least 90 days, and 1.3 percentage points for episodes that are at least 180 days. This result suggests that plans above and below the median level of reimbursement are not very different in terms of how long patients are persisting in treatment. There was a larger difference (4.8 percentage points) in the plan-level mean percentage for episodes that meet the initiation definition. This result suggests that the plan level of reimbursement may have more of an influence on whether patients begin treatment and less of an influence on whether patient persist in treatment. This may relate to having to meet deductibles at the beginning of treatment.
| FIGURE 3. Average Plan-Level Percentage of Episodes That Met Each Outcome Stratified by Falling Above or Below the Median Reimbursement Rate of 78.5% Among Persons with OUD Aged 12-64 Years Old and Enrolled in Employer-Sponsored Commercial Insurance Plans, 2014-2015a |
|---|
|
|
CONCLUSION
This project investigated changes in OUD treatment coverage, utilization, and expenditures in the private, employer-sponsored health insurance market before (2006-2007) and after (2014-2015) phased implementation of the MHPAEA and the ACA and the emergence of new FDA-approved MATs and subsequent development of generic formulations. The study sample had similar rates of OUD compared to national estimates of opioid dependence among the commercially insured indicating that the analysis sample was similar to the general population with private insurance in terms of rates of OUD. According to our own analysis of NSDUH data, an estimated 0.33 percent of individuals aged 18-64 with private insurance had a diagnosis of opioid dependence in 2014, up from 0.23 percent in 2007. By comparison, 0.13 percent and 0.41 percent of the MarketScan samples were identified with OUD in 2006-2007 and 2014-2015, respectively.
The coverage analyses examined the percentage of plans paying for any OUD treatment and specific types of treatment. The utilization analyses examined overall treatment use, use of specific service types, and patterns of MAT use by individuals with OUD. The spending analyses examined total spending for OUD treatment (total payments made to treatment providers), cost-sharing between insurers and enrollees, and the impact of cost-sharing on OUD treatment initiation, engagement, and retention.
Key Findings
Coverage. We found that a similar percentage of plans with enrollees with OUD paid for OUD treatment at the second period, but that they paid for a much broader range of services, including MAT. Notably, a higher percentage of plans paid for intensive outpatient treatment, outpatient office visits, and psychotherapy. This increase may have resulted from health plans adjusting their coverage requirements in accordance with the MHPAEA and the ACA, health plans recognizing the need to increase services given the increasing rates of OUD, or an emphasis on providing support services in conjunction with MAT.[55] However, although there was a substantial increase in coverage of residential treatment, still only 12.6 percent of plans paid for this type of treatment in 2014-2015 (a type of treatment for which the ASAM Guidelines define as a necessary type of SUD care on the continuum of care). The general trend paying for a broader range of services suggests improved adherence to ASAM criteria; however, the continued lower coverage of higher-intensity services--residential, intensive outpatient, and partial hospitalization--reflects a lack of coverage for higher-intensity services.
These findings are consistent with the work of Reif et al. (2017) who found through interviewing health plan representatives that OTPs were covered by 97 percent of commercial health plans in 2014, compared with only 64.5 percent of plans in 2003. Buprenorphine was covered under the pharmacy benefit for 70 percent of commercial plans in 2003 and for all health plans in 2010.[56]
Although Reif et al. (2017) did not assess plan coverage of naltrexone extended-release injections (Vivitrol), we found that the percentage of plans paying for Vivitrol increased from 0.9 percent in Time 1 to 13.6 percent in Time 2. Despite FDA approval of Vivitrol in 2010, this finding illustrates the slow progression of private insurance plans to include Vivitrol in their formulary for covered medical procedures. A higher percentage of plans paid for prescription oral naltrexone in 2014-2015 (27.6 percent) compared with Time 1 (14.1 percent). The higher percentage of plan coverage for oral instead of injection naltrexone may have resulted from the longer availability of both generic and brand name naltrexone tablets. In addition, the tiering of medications[57] and higher cost of Vivitrol ($1,104 in 2010) compared with generic and brand oral naltrexone ($128 and $258 in 2010, respectively), also may have prevented private insurance companies from adding Vivitrol to their formularies.[58] Despite the introduction of a generic form of buprenorphine/naloxone in 2013, the percentage of plans paying for buprenorphine only increased from 56.6 to 61.9.
Utilization. Research has shown that individuals needing OUD treatment often do not access it because of the lack of adequate insurance coverage.[59] Because we found that more private insurance plans paid for OUD service types endorsed by the ASAM's National Practice Guideline for OUD Treatment,[60] we next examined whether there was a higher percentage of members with OUD who used treatment services in 2014-2015. We found that enrollees with OUD used intensive outpatient treatment and outpatient office visits more frequently compared with other OUD services and settings in 2014-2015. The percentage of enrollees using inpatient treatment fell from 42.5 percent to 27.8 percent. These findings reflect a long-term trend described by Mark et al. (2016) in the field of behavioral health shifting away from long-term inpatient and residential stays toward placing more emphasis on effective medication treatment and community-based care.[61]
In 2006-2007, the types of services received during an episode of treatment with the highest frequency included receiving any MAT (54.6 percent) and buprenorphine prescription fills/service administration (50.7 percent). In 2014-2015, there was a shift in the types of services used during treatment episodes, with outpatient office visits having the highest frequency (56.2 percent) compared with other OUD services. Private health plan management strategies of prior authorization and step therapy may partly explain why our findings revealed decreases in the percentage of episodes that included any MAT and buprenorphine prescription fills between the time periods. Reif et al. (2016) found that between 2003 and 2010, commercial health plans increased their requirements of physicians to obtain prior authorization (plan approval for treatment) for brand oral naltrexone and buprenorphine. Injectable naltrexone (Vivitrol) was the only medication to have both prior authorization and step therapy restrictions in 2010.[62] However, efforts are underway to remove these requirements. For example, the American Medical Association has recommended that insures from the prior approval requirement[63] the State of Pennsylvania has removed the requirement for its Medicaid program.[64]
The percentage of enrollees receiving MAT was similar in the time periods and there was a decrease in the percentage of episodes that included any MAT and buprenorphine prescription fills, despite the availability of the generic formulation. This may reflect a shortage of waivered physicians qualified to prescribe buprenorphine. Stein et al. (2015) used the 2008-2011 Buprenorphine Waiver Notification System data to calculate the number of buprenorphine-waivered physicians/100,000 county residents. They found that 43 percent of United States counties had no buprenorphine-waivered physicians and 7 percent had 20 or more waivered physicians.[65] In addition, Jones et al. (2015) reported a gap between treatment need for OUD and buprenorphine treatment capacity among 46 states and the District of Columbia.[66]
It should be noted however, that use of methadone cannot be captured reliably in claims data. Some enrollees may be receiving methadone through a different payment source, so overall use of MAT may be under-represented in the sample.
Women with OUD were significantly less likely than men to receive MAT in both periods. This finding, though not well-understood, is consistent with other research showing lower treatment rates among women.[67] Many women entering treatment may have more complex needs such as comorbid mental health conditions and other social problems that require more specialized services, as well has having increased need for child care services.[68] The age group with the highest MAT use was 18-44-year-olds, in which the differences were more pronounced in 2014-2015. There was a shift in 2014-2015 toward the insured member being more likely to receive MAT compared with spouses or dependents. This finding may reflect greater recognition of the impact of the opioid epidemic and lower stigma associated with receiving treatment among those employed.
Spending. The spending analyses examined OUD treatment expenditures by plans and individuals (excluding premiums), cost-sharing between plans and individuals, the unit cost of services, and the relationship between cost-sharing and treatment initiation, engagement, and retention. Between the two periods, per person expenditures increased for both plans and individuals for all services.
We computed the share of OUD treatment costs paid for by insurers. In 2006-2007, insurers paid 84 percent of the total treatment costs. This fell to 79 percent in 2014-2015. The most substantial cost shifts were for more intensive services, that is, inpatient and residential services. Insurers began paying a larger portion of MAT costs (from 78 percent to 81 percent) and intensive outpatient/partial hospitalization costs (from 84 percent to 85 percent). However, savings for these less intensive/lower cost services does not offset the higher costs associated with more intensive services.
We used the calculated plan level of reimbursement to assess the association between coverage level and treatment initiation, engagement, and retention at 30, 90, and 180+ days. Each of the treatment outcomes were positively associated with plan level of reimbursement. The association was strongest with treatment initiation and more modest with the engagement and retention indicators. This suggests that plan level of reimbursement more strongly influenced whether patients began treatment than whether they persisted in treatment. This may relate to deductible requirements that could be a barrier to initiating treatment.
In terms of cost per unit of service, adjusting for inflation, most services types increased in cost. The most substantial increase was for residential services which increased by 160.5 percent. The per unit costs for outpatient office visits, and methadone administration fell over time.
The observed increases in average total spending by private insurance aligns with national spending trends for SUD reported in the most recent Behavioral Health Expenditure and Use Accounts report, which reported that private insurance accounted for 18 percent of total SUD spending in 2014 compared with 13 percent in 2007.[69] The percentage increase in insurer spending, which we estimated at 103.4 percent, was in line with growth in general health care spending over the same period of 104 percent.
Implications
Our study findings highlight how the MHPAEA and the ACA as well as new FDA-approved MAT expanded OUD treatment coverage, utilization, and expenditures in the private health insurance market between 2006-2007 and 2014-2015. Federal legislation such as the 21st Century Cures Act passed in December 2016 is expected to continue with this effort. Specifically, the Cures Act has allotted $1 billion for states to use over 2 years to combat the opioid epidemic. This Act also enhances parity enforcement of the MHPAEA.[70] In July 2016, federal regulations under DATA 2000 expanded buprenorphine treatment by permitting qualified physicians to treat up to 275 patients.[71] In addition, the Comprehensive Addiction and Recovery Act of 2016 amended the Controlled Substances Act to allow qualifying nurse practitioners and physician assistants to receive a DATA 2000 waiver and prescribe buprenorphine up to 30 patients initially, and up to 100 patients following waiver approval after the first year.[72]
Overall, our findings reflect expanded availability, greater use of OUD treatment services, and higher payments to service providers among enrollees in large employer-sponsored health plans. The trend toward increasing the range of services paid for suggests improved adherence to ASAM criteria and reflects a long-term trend in behavioral health, shifting away from long-term inpatient and residential stays toward a greater emphasis on medication treatment and community-based care. However, there still are significant barriers to be addressed. The lower coverage of inpatient care and lower utilization of residential services reflects a potential lack of coverage for higher-intensity services which may be needed for more severe cases of OUD, particularly during treatment initiation, before patients can be transitioned successfully to outpatient treatment. Further, only half of those who could potentially benefit from MAT received it, and access to MAT was even lower for women and enrollees outside the 18-44 year age range. It is critical that MAT be made available to those could benefit from it. Cost-sharing, that is, the relative percentage of total costs paid for by the insurer versus the enrollee impacted treatment initiation. Higher out-of-pocket costs represent a serious barrier to starting treatment.
Future Directions
Our results point to several potential avenues for future research. First, although overall use of buprenorphine increased, the percentage of those with OUD who accessed buprenorphine MAT fell in the second period. We know that prevalence escalated during the period and that capacity is limited. More research is needed on the supply of providers; finding a provider, particularly one that is affordable (i.e., in-network) and accessible (easy-to-get appointments, not too far in distance) is a barrier to MAT treatment and exploring other financial barriers to initiating treatment. Secondly, additional research is needed on the determinants of treatment retention to better understand what contributes to maintaining recovery. Finally, additional research is needed to better understand why women and individuals outside the 18-44 year age range are less likely to receive MAT and how mental and physical health comorbidity may affect participation in SUD treatment.
APPENDIX A. ICD-9 AND ICD-10 DIAGNOSTIC CODES FOR OUD
| ICD-9-CM | ICD-9 Description |
|---|---|
| 30400 | Opioid dependence-unspecified |
| 30401 | Opioid dependence-continuous |
| 30402 | Opioid dependence-episode |
| 30403 | Opioid type dependence in remission |
| 30470 | Opioid/other dep-unspecified |
| 30471 | Opioid/other dep-continuous |
| 30472 | Opioid/other dep-episode |
| 30473 | Opioid w/other drug dependence in remission |
| 30550 | Opioid abuse-unspecified |
| 30551 | Opioid abuse-continuous |
| 30552 | Opioid abuse-episodic |
| 30553 | Opioid abuse in remission |
| 96500 | Poisoning by opium (alkaloids), unspecified |
| 96501 | Poisoning by heroin |
| 96502 | Poisoning by methadone |
| 96509 | Poisoning by other opiates |
| E8500 | Accidental poisoning by heroin |
| E8501 | Accidental poisoning by methadone |
| E8502 | Accidental poisoning by other opiates and related narcotics |
| E9800 | Undetermined cause poisoning by opiates |
| ICD-10 | ICD-10 Description |
|---|---|
| F111 | Opioid abuse |
| F1110 | Opioid abuse uncomplicated |
| F1112 | Opioid abuse with intoxication |
| F11120 | Opioid abuse with intoxication uncomplicated |
| F11121 | Opioid abuse with intoxication delirium |
| F11122 | Opioid abuse w/intoxication w/perceptual disturb |
| F11129 | Opioid abuse with intoxication unspecified |
| F1114 | Opioid abuse with opioid-induced mood disorder |
| F1115 | Opioid abuse with opioid-induced psychotic disorder |
| F11150 | Opioid abuse w/induced psychosis d/o w/delusions |
| F11151 | Opioid abuse w/induced psychosis d/o w/hallucinations |
| F11159 | Opioid abuse w/opioid-induced psychosis d/o unspecified |
| F1118 | Opioid abuse with other opioid-induced disorder |
| F11181 | Opioid abuse w/opioid-induced sexual dysfunction |
| F11182 | Opioid abuse with opioid-induced sleep disorder |
| F11188 | Opioid abuse with other opioid-induced disorder |
| F1119 | Opioid abuse w/unspecified opioid-induced disorder |
| F112 | Opioid dependence |
| F1120 | Opioid dependence, uncomplicated |
| F1121 | Opioid dependence, in remission |
| F11220 | Opioid dependence with intoxication, uncomplicated |
| F11221 | Opioid dependence with intoxication delirium |
| F1122 | Opioid dependence with intoxication |
| F11222 | Opioid dependence with intoxication with perceptual disturbance |
| F11229 | Opioid dependence with intoxication, unspecified |
| F1123 | Opioid dependence with withdrawal |
| F1124 | Opioid dependence with opioid-induced mood disorder |
| F1125 | Opioid dependence with opioid-induced psychotic disorder |
| F11250 | Opioid dependence with opioid-induced psychotic disorder with delusions |
| F11251 | Opioid dependence with opioid-induced psychotic disorder with hallucinations |
| F11259 | Opioid dependence with opioid-induced psychotic disorder, unspecified |
| F1128 | Opioid dependence with other opioid-induced disorder |
| F11281 | Opioid dependence with opioid-induced sexual dysfunction |
| F11282 | Opioid dependence with opioid-induced sleep disorder |
| F11288 | Opioid dependence with other opioid-induced disorder |
| F1129 | Opioid dependence with unspecified opioid-induced disorder |
| F1190 | Opioid use, unspecified, uncomplicated |
| F11920 | Opioid use, unspecified with intoxication, uncomplicated |
| F11921 | Opioid use, unspecified with intoxication delirium |
| F11922 | Opioid use, unspecified with intoxication with perceptual disturbance |
| F11929 | Opioid use, unspecified with intoxication, unspecified |
| F1193 | Opioid use, unspecified with withdrawal |
| F1194 | Opioid use, unspecified with opioid-induced mood disorder |
| F11950 | Opioid use, unspecified with opioid-induced psychotic disorder with delusions |
| F11951 | Opioid use, unspecified with opioid-induced psychotic disorder with hallucinations |
| F11959 | Opioid use, unspecified with opioid-induced psychotic disorder, unspecified |
| F11981 | Opioid use, unspecified with opioid-induced sexual dysfunction |
| F11982 | Opioid use, unspecified with opioid-induced sleep disorder |
| F11988 | Opioid use, unspecified with other opioid-induced disorder |
| F1199 | Opioid use, unspecified with unspecified opioid-induced disorder |
| T400X1A | Poisoning by opium, accidental (unintentional), initial encounter |
| T400X2A | Poisoning by opium, intentional self-harm, initial encounter |
| T400X4A | Poisoning by opium, undetermined, initial encounter |
| T401X1A | Poisoning by heroin, accidental (unintentional), initial encounter |
| T401X2A | Poisoning by heroin, intentional self-harm, initial encounter |
| T401X4A | Poisoning by heroin, undetermined, initial encounter |
| T402X1A | Poisoning by other opioids, accidental (unintentional), initial encounter |
| T402X2A | Poisoning by other opioids, intentional self-harm, initial encounter |
| T402X4A | Poisoning by other opioids, undetermined, initial encounter |
| T403X1A | Poisoning by methadone, accidental (unintentional), initial encounter |
| T403X2A | Poisoning by methadone, intentional self-harm, initial encounter |
| T403X4A | Poisoning by methadone, undetermined, initial encounter |
APPENDIX B. NDC CODES IDENTIFYING MAT
| NDC | Product Name | Route of Admin | Master Form Code | Strength in MG | Generic Name |
|---|---|---|---|---|---|
| 00054-0188-13 | BUPRENORPHINE-NALOXONE | SL | TAB | 2-0.5 | Buprenorphine/Naloxone |
| 00054-0189-13 | BUPRENORPHINE-NALOXONE | SL | TAB | 8-2 | Buprenorphine/Naloxone |
| 00093-5720-56 | BUPRENORPHINE-NALOXONE | SL | TAB | 2-0.5 | Buprenorphine/Naloxone |
| 00093-5721-56 | BUPRENORPHINE-NALOXONE | SL | TAB | 8-2 | Buprenorphine/Naloxone |
| 00228-3154-03 | BUPRENORPHINE-NALOXONE | SL | TAB | 2-0.5 | Buprenorphine/Naloxone |
| 00228-3154-73 | BUPRENORPHINE-NALOXONE | SL | TAB | 2-0.5 | Buprenorphine/Naloxone |
| 00228-3155-03 | BUPRENORPHINE-NALOXONE | SL | TAB | 8-2 | Buprenorphine/Naloxone |
| 00228-3155-73 | BUPRENORPHINE-NALOXONE | SL | TAB | 8-2 | Buprenorphine/Naloxone |
| 00406-1923-03 | BUPRENORPHINE-NALOXONE | SL | TAB | 2-0.5 | Buprenorphine/Naloxone |
| 00406-1924-03 | BUPRENORPHINE-NALOXONE | SL | TAB | 8-2 | Buprenorphine/Naloxone |
| 00490-0051-00 | SUBOXONE | SL | TAB | 2-0.5 | Buprenorphine/Naloxone |
| 00490-0051-30 | SUBOXONE | SL | TAB | 2-0.5 | Buprenorphine/Naloxone |
| 00490-0051-60 | SUBOXONE | SL | TAB | 2-0.5 | Buprenorphine/Naloxone |
| 00490-0051-90 | SUBOXONE | SL | TAB | 2-0.5 | Buprenorphine/Naloxone |
| 12496-1202-01 | SUBOXONE | SL | FIL | 2-0.5 | Buprenorphine/Naloxone |
| 12496-1202-03 | SUBOXONE | SL | FIL | 2-0.5 | Buprenorphine/Naloxone |
| 12496-1204-01 | SUBOXONE | SL | FIL | 4-1 | Buprenorphine/Naloxone |
| 12496-1204-03 | SUBOXONE | SL | FIL | 4-1 | Buprenorphine/Naloxone |
| 12496-1208-01 | SUBOXONE | SL | FIL | 8-2 | Buprenorphine/Naloxone |
| 12496-1208-03 | SUBOXONE | SL | FIL | 8-2 | Buprenorphine/Naloxone |
| 12496-1212-01 | SUBOXONE | SL | FIL | 12-3 | Buprenorphine/Naloxone |
| 12496-1212-03 | SUBOXONE | SL | FIL | 12-3 | Buprenorphine/Naloxone |
| 12496-1278-02 | SUBUTEX | SL | TAB | 2 | Buprenorphine |
| 12496-1283-02 | SUBOXONE | SL | TAB | 2-0.5 | Buprenorphine/Naloxone |
| 12496-1306-02 | SUBOXONE | SL | TAB | 8-2 | Buprenorphine/Naloxone |
| 12496-1310-02 | SUBUTEX | SL | TAB | 8 | Buprenorphine |
| 16590-0666-05 | SUBOXONE | SL | TAB | 2-0.5 | Buprenorphine/Naloxone |
| 16590-0666-30 | SUBOXONE | SL | TAB | 2-0.5 | Buprenorphine/Naloxone |
| 16590-0667-05 | SUBOXONE | SL | TAB | 8-2 | Buprenorphine/Naloxone |
| 16590-0667-30 | SUBOXONE | SL | TAB | 8-2 | Buprenorphine/Naloxone |
| 16590-0667-90 | SUBOXONE | SL | TAB | 8-2 | Buprenorphine/Naloxone |
| 23490-9270-03 | SUBOXONE | SL | TAB | 8-2 | Buprenorphine/Naloxone |
| 23490-9270-06 | SUBOXONE | SL | TAB | 8-2 | Buprenorphine/Naloxone |
| 23490-9270-09 | SUBOXONE | SL | TAB | 8-2 | Buprenorphine/Naloxone |
| 35356-0004-07 | SUBOXONE | SL | TAB | 8-2 | Buprenorphine/Naloxone |
| 35356-0004-30 | SUBOXONE | SL | TAB | 8-2 | Buprenorphine/Naloxone |
| 42291-0174-30 | BUPRENORPHINE-NALOXONE | SL | TAB | 2-0.5 | Buprenorphine/Naloxone |
| 42291-0175-30 | BUPRENORPHINE-NALOXONE | SL | TAB | 8-2 | Buprenorphine/Naloxone |
| 43063-0184-07 | SUBOXONE | SL | TAB | 8-2 | Buprenorphine/Naloxone |
| 43063-0184-30 | SUBOXONE | SL | TAB | 8-2 | Buprenorphine/Naloxone |
| 49999-0395-07 | SUBOXONE | SL | TAB | 2-0.5 | Buprenorphine/Naloxone |
| 49999-0395-15 | SUBOXONE | SL | TAB | 2-0.5 | Buprenorphine/Naloxone |
| 49999-0395-30 | SUBOXONE | SL | TAB | 2-0.5 | Buprenorphine/Naloxone |
| 49999-0638-30 | SUBUTEX | SL | TAB | 2 | Buprenorphine |
| 49999-0639-30 | SUBUTEX | SL | TAB | 8 | Buprenorphine |
| 50383-0287-93 | BUPRENORPHINE-NALOXONE | SL | TAB | 8-2 | Buprenorphine/Naloxone |
| 50383-0294-93 | BUPRENORPHINE-NALOXONE | SL | TAB | 2-0.5 | Buprenorphine/Naloxone |
| 52959-0304-30 | SUBOXONE | SL | TAB | 8-2 | Buprenorphine/Naloxone |
| 52959-0749-30 | SUBOXONE | SL | TAB | 2-0.5 | Buprenorphine/Naloxone |
| 53217-0138-30 | BUPRENORPHINE-NALOXONE | SL | TAB | 8-2 | Buprenorphine/Naloxone |
| 54123-0114-30 | ZUBSOLV | SL | TAB | 11.4-2.9 | Buprenorphine/Naloxone |
| 54123-0914-30 | ZUBSOLV | SL | TAB | 1.4-0.36 | Buprenorphine/Naloxone |
| 54123-0929-30 | ZUBSOLV | SL | TAB | 2.9-0.71 | Buprenorphine/Naloxone |
| 54123-0957-30 | ZUBSOLV | SL | TAB | 5.7-1.4 | Buprenorphine/Naloxone |
| 54123-0986-30 | ZUBSOLV | SL | TAB | 8.6-2.1 | Buprenorphine/Naloxone |
| 54569-5496-00 | SUBOXONE | SL | TAB | 2-0.5 | Buprenorphine/Naloxone |
| 54569-5739-00 | SUBOXONE | SL | TAB | 8-2 | Buprenorphine/Naloxone |
| 54569-5739-01 | SUBOXONE | SL | TAB | 8-2 | Buprenorphine/Naloxone |
| 54569-5739-02 | SUBOXONE | SL | TAB | 8-2 | Buprenorphine/Naloxone |
| 54569-6399-00 | SUBOXONE | SL | FIL | 8-2 | Buprenorphine/Naloxone |
| 54569-6408-00 | BUPRENORPHINE-NALOXONE | SL | TAB | 8-2 | Buprenorphine/Naloxone |
| 54868-5707-00 | SUBOXONE | SL | TAB | 8-2 | Buprenorphine/Naloxone |
| 54868-5707-01 | SUBOXONE | SL | TAB | 8-2 | Buprenorphine/Naloxone |
| 54868-5707-02 | SUBOXONE | SL | TAB | 8-2 | Buprenorphine/Naloxone |
| 54868-5707-03 | SUBOXONE | SL | TAB | 8-2 | Buprenorphine/Naloxone |
| 54868-5707-04 | SUBOXONE | SL | TAB | 8-2 | Buprenorphine/Naloxone |
| 54868-5750-00 | SUBOXONE | SL | TAB | 2-0.5 | Buprenorphine/Naloxone |
| 55045-3784-03 | SUBOXONE | SL | TAB | 8-2 | Buprenorphine/Naloxone |
| 55700-0147-30 | SUBOXONE | SL | FIL | 8-2 | Buprenorphine/Naloxone |
| 55700-0184-30 | BUPRENORPHINE-NALOXONE | SL | TAB | 2-0.5 | Buprenorphine/Naloxone |
| 55887-0312-04 | SUBOXONE | SL | TAB | 8-2 | Buprenorphine/Naloxone |
| 55887-0312-15 | SUBOXONE | SL | TAB | 8-2 | Buprenorphine/Naloxone |
| 59385-0012-01 | BUNAVAIL | MM | FIL | 2.1-0.3 | Buprenorphine/Naloxone |
| 59385-0012-30 | BUNAVAIL | MM | FIL | 2.1-0.3 | Buprenorphine/Naloxone |
| 59385-0014-01 | BUNAVAIL | MM | FIL | 4.2-0.7 | Buprenorphine/Naloxone |
| 59385-0014-30 | BUNAVAIL | MM | FIL | 4.2-0.7 | Buprenorphine/Naloxone |
| 59385-0016-01 | BUNAVAIL | MM | FIL | 6.3-1 | Buprenorphine/Naloxone |
| 59385-0016-30 | BUNAVAIL | MM | FIL | 6.3-1 | Buprenorphine/Naloxone |
| 63629-4028-01 | SUBOXONE | SL | TAB | 2-0.5 | Buprenorphine/Naloxone |
| 63629-4034-01 | SUBOXONE | SL | TAB | 8-2 | Buprenorphine/Naloxone |
| 63629-4034-02 | SUBOXONE | SL | TAB | 8-2 | Buprenorphine/Naloxone |
| 63629-4034-03 | SUBOXONE | SL | TAB | 8-2 | Buprenorphine/Naloxone |
| 63629-4092-01 | SUBUTEX | SL | TAB | 8 | Buprenorphine |
| 63874-1084-03 | SUBOXONE | SL | TAB | 8-2 | Buprenorphine/Naloxone |
| 63874-1085-03 | SUBOXONE | SL | TAB | 2-0.5 | Buprenorphine/Naloxone |
| 63874-1173-03 | SUBUTEX | SL | TAB | 8 | Buprenorphine |
| 63874-1174-03 | SUBUTEX | SL | TAB | 2 | Buprenorphine |
| 65162-0415-03 | BUPRENORPHINE-NALOXONE | SL | TAB | 8-2 | Buprenorphine/Naloxone |
| 65162-0416-03 | BUPRENORPHINE-NALOXONE | SL | TAB | 2-0.5 | Buprenorphine/Naloxone |
| 66336-0015-30 | SUBOXONE | SL | TAB | 2-0.5 | Buprenorphine/Naloxone |
| 66336-0016-30 | SUBOXONE | SL | TAB | 8-2 | Buprenorphine/Naloxone |
| 68071-1380-03 | SUBOXONE | SL | TAB | 8-2 | Buprenorphine/Naloxone |
| 68071-1510-03 | SUBOXONE | SL | TAB | 2-0.5 | Buprenorphine/Naloxone |
| 68258-2999-03 | SUBOXONE | SL | TAB | 2-0.5 | Buprenorphine/Naloxone |
| 63459-0300-42 | VIVITROL | IM | GER | 380 | VIVITROL |
| 65757-0300-01 | VIVITROL | IM | GER | 380 | VIVITROL |
| FIL = buccal film; GER = gluteal extended release; IM = intramuscular; MAT = medication-assisted treatment; MM = mucous membrane; NDC = National Drug Code; SL = sublingual; TAB = tablet. | |||||
APPENDIX C. CPT, REVENUE, AND HCPCS SERVICE CODES
| Category | Code | Description of CPT or Revenue Code | Additional Codes |
|---|---|---|---|
| Residential | H0010 | Alcohol and/or drug services; subacute detoxification (residential addiction program inpatient) | DX |
| Residential | H0011 | Alcohol and/or drug services; acute detoxification (residential addiction program inpatient) | DX |
| Residential | H0017 | Behavioral health; residential (hospital residential treatment program), without room and board, per diem | DX |
| Residential | H0018 | Behavioral health; short-term residential (non-hospital residential treatment program), without room and board, per diem | DX |
| Residential | H0019 | Behavioral health; long-term residential (non-medical, non-acute care in a residential treatment program where stay is typically longer than 30 days), without room and board, per diem | DX |
| Residential | T2048 | Behavioral health; long-term care residential (non-acute care in a residential treatment program where stay is typically longer than 30 days), with room and board, per diem | DX |
| Residential | H0012 | Alcohol and/or drug services; subacute detoxification (residential addiction program outpatient) | DX |
| Residential | H0013 | Alcohol and/or drug services; acute detoxification (residential addiction program outpatient) | DX |
| Residential | 1001 (rev) | Residential treatment--psychiatric | DX |
| Residential | 1002 (rev) | Residential treatment--chemical dependency | DX |
| Residential | 90791 | Psychiatric diagnostic evaluation, initial diagnostic interview, excludes medical services | DX, POS |
| Residential | 90792 | Psychiatric diagnostic evaluation with medical services | DX, POS |
| Residential | 90801 | Diagnostic interview examination *code deleted in 2013 and replaced by 90791* | DX, POS |
| Residential | 90802 | Interactive diagnostic interview examination *code deleted in 2013 replaced by 90792* | DX, POS |
| Residential | 90816 | Individual psychotherapy, 20-30 min *code deleted in 2013* | DX, POS |
| Residential | 90817 | Individual psychotherapy with E/M, 20-30 min *code deleted in 2013* | DX, POS |
| Residential | 90818 | Individual psychotherapy, 45-50 min *code deleted in 2013* | DX, POS |
| Residential | 90819 | Individual psychotherapy with E/M, 45-50 min *code deleted in 2013* | DX, POS |
| Residential | 90821 | Individual psychotherapy, 75-80 min *code deleted in 2013* | DX, POS |
| Residential | 90822 | Individual psychotherapy with E/M, 75-80 min *code deleted in 2013* | DX, POS |
| Residential | 90823 | Interactive individual psychotherapy 20-30 min *code deleted in 2013* | DX, POS |
| Residential | 90824 | Interactive individual psychotherapy with E/M 20-30 min *code deleted in 2013* | DX, POS |
| Residential | 90826 | Interactive individual psychotherapy, 45-50 min *code deleted in 2013* | DX, POS |
| Residential | 90827 | Interactive individual psychotherapy with E/M 45-50 min *code deleted in 2013* | DX, POS |
| Residential | 90828 | Interactive individual psychotherapy, 75-80 min *code deleted in 2013* | DX, POS |
| Residential | 90829 | Interactive individual psychotherapy with E/M 75-80 min *code deleted in 2013* | DX, POS |
| Residential | 90832 | Psychotherapy, 30 min | DX, POS |
| Residential | 90833 | E/M plus psychotherapy add-on, 30 min | DX, POS |
| Residential | 90834 | Psychotherapy, 45 min | DX, POS |
| Residential | 90836 | E/M plus psychotherapy add-on, 45 min | DX, POS |
| Residential | 90837 | Psychotherapy, 60 min | DX, POS |
| Residential | 90839 | Psychotherapy for crisis | DX, POS |
| Residential | 90840 | Psychotherapy for crisis, add-on for each additional 30 min | DX, POS |
| Residential | 90845 | Psychoanalysis | DX, POS |
| Residential | 90847 | Family psychotherapy, conjoint psychotherapy with patient present | DX, POS |
| Residential | 90849 | Multiple-family group psychotherapy | DX, POS |
| Residential | 90853 | Group psychotherapy, more than of a multiple-family group | DX, POS |
| Residential | 90857 | Interactive group psychotherapy *code deleted in 2013* | DX, POS |
| Residential | 90862 | Pharmacologic management *code deleted in 2013* | DX, POS |
| Residential | 90867 | Therapeutic repetitive TMS | DX, POS |
| Residential | 90868 | Subsequent TMS Delivery and Management | DX, POS |
| Residential | 90869 | Subsequent TMS Motor Threshold Re-Determination with Delivery and Management | DX, POS |
| Residential | 90870 | Electroconvulsive Therapy | DX, POS |
| Residential | 90875 | Individual Psychophysiological Therapy Incorporating Biofeedback Training by any Modality, 20-30 min | DX, POS |
| Residential | 90876 | Individual Psychophysiological Therapy Incorporating Biofeedback Training by any Modality, 45-50 min | DX, POS |
| Residential | 99221 | Initial hospital care, per day, for the evaluation and management of a patient, low severity | DX, POS |
| Residential | 99222 | Initial hospital care, per day, for the evaluation and management of a patient, moderate severity | DX, POS |
| Residential | 99223 | Initial hospital care, per day, for the evaluation and management of a patient, high severity | DX, POS |
| Residential | 99231 | Inpatient services, subsequent hospital care, low complexity | DX, POS |
| Residential | 99232 | Inpatient services, subsequent hospital care, moderate complexity | DX, POS |
| Residential | 99233 | Inpatient services, subsequent hospital care, unstable or high complexity | DX, POS |
| Residential | 99238 | Hospital discharge services, 30 min or less | DX, POS |
| Residential | 99239 | Hospital discharge services, more than 30 min | DX, POS |
| Residential | 99251 | Inpatient consultation, self-limited or minor, 20 min at bedside | DX, POS |
| Residential | 99252 | Inpatient consultation, low severity, 40 min at bedside | DX, POS |
| Residential | 99253 | Inpatient consultation, moderate severity, 55 min at bedside | DX, POS |
| Residential | 99254 | Inpatient consultation, moderate to high severity, 80 min at bedside | DX, POS |
| Residential | 99255 | Inpatient consultation, moderate to high severity, 110 min at bedside | DX, POS |
| IOP or Partial Hosp. | G0410 | Group psychotherapy other than of a multiple-family group, in a partial hospitalization setting, approximately 45-50 min | DX |
| IOP or Partial Hosp. | G0411 | Interactive group psychotherapy, in a partial hospitalization setting, approximately 45-50 min | DX |
| IOP or Partial Hosp. | H0015 | Alcohol and/or drug services; intensive outpatient (treatment program that operates at least 3 hours/day and at least 3 days/week and is based on an individualized treatment plan), including assessment, counseling; crisis intervention, and activity therapies or education | DX |
| IOP or Partial Hosp. | H0035 | Mental health partial hospitalization, treatment, less than 24 hours | DX |
| IOP or Partial Hosp. | H2001 | Rehabilitation program, per 1/2 day | DX |
| IOP or Partial Hosp. | H2012 | Behavioral health day treatment, per hour | DX |
| IOP or Partial Hosp. | S0201 | Partial hospitalization services, less than 24 hours, per diem | DX |
| IOP or Partial Hosp. | S9480 | Intensive outpatient psychiatric services, per diem | DX |
| IOP or Partial Hosp. | S9484 | Crisis intervention mental health services, per hour | DX |
| IOP or Partial Hosp. | S9485 | Crisis intervention mental health services, per diem | DX |
| IOP or Partial Hosp. | 0905 (rev) | Intensive outpatient services--psychiatric | DX |
| IOP or Partial Hosp. | 0906 (rev) | Chemical dependency | DX |
| IOP or Partial Hosp. | 0907 (rev) | Community behavioral health program--day treatment | DX |
| IOP or Partial Hosp. | 0912 (rev) | Partial hospitalization-less intensive | DX |
| IOP or Partial Hosp. | 0913 (rev) | Partial hospitalization-intensive | DX |
| IOP or Partial Hosp. | h0009 | Alc/drug services--acute detox (hosp inpt) | DX, POS |
| IOP or Partial Hosp. | g0378 | Hospital observation service, per hour | DX, POS |
| IOP or Partial Hosp. | 90791 | Psychiatric diagnostic evaluation, initial diagnostic interview, excludes medical services | DX, POS |
| IOP or Partial Hosp. | 90792 | Psychiatric diagnostic evaluation with medical services | DX, POS |
| IOP or Partial Hosp. | 90801 | Diagnostic interview examination *code deleted in 2013 and replaced by 90791* | DX, POS |
| IOP or Partial Hosp. | 90802 | Interactive diagnostic interview examination *code deleted in 2013 replaced by 90792* | DX, POS |
| IOP or Partial Hosp. | 90816 | Individual psychotherapy, 20-30 min *code deleted in 2013* | DX, POS |
| IOP or Partial Hosp. | 90817 | Individual psychotherapy with E/M, 20-30 min *code deleted in 2013* | DX, POS |
| IOP or Partial Hosp. | 90818 | Individual psychotherapy, 45-50 min *code deleted in 2013* | DX, POS |
| IOP or Partial Hosp. | 90819 | Individual psychotherapy with E/M, 45-50 min *code deleted in 2013* | DX, POS |
| IOP or Partial Hosp. | 90821 | Individual psychotherapy, 75-80 min *code deleted in 2013* | DX, POS |
| IOP or Partial Hosp. | 90822 | Individual psychotherapy with E/M, 75-80 min *code deleted in 2013* | DX, POS |
| IOP or Partial Hosp. | 90823 | Interactive individual psychotherapy 20-30 min *code deleted in 2013* | DX, POS |
| IOP or Partial Hosp. | 90824 | Interactive individual psychotherapy with E/M 20-30 min *code deleted in 2013* | DX, POS |
| IOP or Partial Hosp. | 90826 | Interactive individual psychotherapy, 45-50 min *code deleted in 2013* | DX, POS |
| IOP or Partial Hosp. | 90827 | Interactive individual psychotherapy with E/M 45-50 min *code deleted in 2013* | DX, POS |
| IOP or Partial Hosp. | 90828 | Interactive individual psychotherapy, 75-80 min *code deleted in 2013* | DX, POS |
| IOP or Partial Hosp. | 90829 | Interactive individual psychotherapy with E/M 75-80 min *code deleted in 2013* | DX, POS |
| IOP or Partial Hosp. | 90832 | Psychotherapy, 30 min | DX, POS |
| IOP or Partial Hosp. | 90833 | E/M plus psychotherapy add-on, 30 min | DX, POS |
| IOP or Partial Hosp. | 90834 | Psychotherapy, 45 min | DX, POS |
| IOP or Partial Hosp. | 90836 | E/M plus psychotherapy add-on, 45 min | DX, POS |
| IOP or Partial Hosp. | 90837 | Psychotherapy, 60 min | DX, POS |
| IOP or Partial Hosp. | 90839 | Psychotherapy for crisis | DX, POS |
| IOP or Partial Hosp. | 90840 | Psychotherapy for crisis, add-on for each additional 30 min | DX, POS |
| IOP or Partial Hosp. | 90845 | Psychoanalysis | DX, POS |
| IOP or Partial Hosp. | 90847 | Family psychotherapy, conjoint psychotherapy with patient present | DX, POS |
| IOP or Partial Hosp. | 90849 | Multiple-family group psychotherapy | DX, POS |
| IOP or Partial Hosp. | 90853 | Group psychotherapy, more than of a multiple-family group | DX, POS |
| IOP or Partial Hosp. | 90855 | psych eval hosp records dx purposes | DX, POS |
| IOP or Partial Hosp. | 90857 | Interactive group psychotherapy *code deleted in 2013* | DX, POS |
| IOP or Partial Hosp. | 90862 | Pharmacologic management *code deleted in 2013* | DX, POS |
| IOP or Partial Hosp. | 90867 | Therapeutic repetitive TMS | DX, POS |
| IOP or Partial Hosp. | 90868 | Subsequent TMS Delivery and Management | DX, POS |
| IOP or Partial Hosp. | 90869 | Subsequent TMS Motor Threshold Re-Determination with Delivery and Management | DX, POS |
| IOP or Partial Hosp. | 90870 | Electroconvulsive Therapy | DX, POS |
| IOP or Partial Hosp. | 90875 | Individual Psychophysiological Therapy Incorporating Biofeedback Training by any Modality, 20-30 min | DX, POS |
| IOP or Partial Hosp. | 90876 | Individual Psychophysiological Therapy Incorporating Biofeedback Training by any Modality, 45-50 min | DX, POS |
| IOP or Partial Hosp. | 99221 | Initial hospital care, per day, for the evaluation and management of a patient, low severity | DX, POS |
| IOP or Partial Hosp. | 99222 | Initial hospital care, per day, for the evaluation and management of a patient, moderate severity | DX, POS |
| IOP or Partial Hosp. | 99223 | Initial hospital care, per day, for the evaluation and management of a patient, high severity | DX, POS |
| IOP or Partial Hosp. | 99224 | Subsequent observation care/day 15 min | DX, POS |
| IOP or Partial Hosp. | 99225 | Subsequent observation care/day 25 min | DX, POS |
| IOP or Partial Hosp. | 99226 | Subsequent observation care/day 35 min | DX, POS |
| IOP or Partial Hosp. | 99231 | Inpatient services, subsequent hospital care, low complexity | DX, POS |
| IOP or Partial Hosp. | 99232 | Inpatient services, subsequent hospital care, moderate complexity | DX, POS |
| IOP or Partial Hosp. | 99233 | Inpatient services, subsequent hospital care, unstable or high complexity | DX, POS |
| IOP or Partial Hosp. | 99234 | Observation/inpatient hospital care 40 min | DX, POS |
| IOP or Partial Hosp. | 99235 | Observation/inpatient hospital care 50 min | DX, POS |
| IOP or Partial Hosp. | 99238 | Hospital discharge services, 30 min or less | DX, POS |
| IOP or Partial Hosp. | 99239 | Hospital discharge services, more than 30 min | DX, POS |
| IOP or Partial Hosp. | 99251 | Inpatient consultation, self-limited or minor, 20 min at bedside | DX, POS |
| IOP or Partial Hosp. | 99252 | Inpatient consultation, low severity, 40 min at bedside | DX, POS |
| IOP or Partial Hosp. | 99253 | Inpatient consultation, moderate severity, 55 min at bedside | DX, POS |
| IOP or Partial Hosp. | 99254 | Inpatient consultation, moderate to high severity, 80 min at bedside | DX, POS |
| IOP or Partial Hosp. | 99255 | Inpatient consultation, moderate to high severity, 110 min at bedside | DX, POS |
| ED Visits | 0450 (rev) | ER-General | DX |
| ED Visits | 0451 (rev) | EMTALA emergency medical screening services | DX |
| ED Visits | 0452 (rev) | ER beyond EMTALA screening | DX |
| ED Visits | 0456 (rev) | Urgent Care | DX |
| ED Visits | 0459 (rev) | Other | DX |
| ED Visits | 0981 (rev) | Professional fees-ER | DX |
| ED Visits | 99281 | ED Services, self-limited or minor | DX |
| ED Visits | 99282 | ED Services, low or moderate severity | DX |
| ED Visits | 99283 | ED Services, moderate severity | DX |
| ED Visits | 99284 | ED Services, high severity | DX |
| ED Visits | 99285 | ED Services, high severity and pose immediate and significant threat to life or physiological function | DX |
| Outpatient Visit | 98960 | Education and training for patient self-management by a qualified, non-physician health care professional using a standardized curriculum, face-to-face with the patient; individual patient | DX |
| Outpatient Visit | 98961 | Education and training for patient self-management by a qualified, non-physician health care professional using a standardized curriculum, face-to-face with the patient; 2-4 patients | DX |
| Outpatient Visit | 98962 | Education and training for patient self-management by a qualified, non-physician health care professional using a standardized curriculum, face-to-face with the patient; 5-8 patients | DX |
| Outpatient Visit | 99078 | Physician educational services rendered to patients in a group setting | DX |
| Outpatient Visit | 99201 | Office or Other outpatient services, new patient, self-limited or minor, 10 min | DX |
| Outpatient Visit | 99202 | Office or Other outpatient services, new patient, low to moderate severity, 20 min | DX |
| Outpatient Visit | 99203 | Office or Other outpatient services, new patient, moderate severity, 30 min | DX |
| Outpatient Visit | 99204 | Office or Other outpatient services, moderate to high severity, 45 min | DX |
| Outpatient Visit | 99205 | Office or Other outpatient services, moderate to high severity, 60 min | DX |
| Outpatient Visit | 99211 | This code is used for a service that may not require the presence of a physician. Presenting problems are minimal, and 5 min is the typical time that would be spent performing or supervising these services. | DX |
| Outpatient Visit | 99212 | Established patient, self-limited or minor, 10 mins | DX |
| Outpatient Visit | 99213 | Established patient, low to moderate severity, 15 mins | DX |
| Outpatient Visit | 99214 | Established patient, moderate to high severity, 25 min | DX |
| Outpatient Visit | 99215 | Established patient, moderate to high severity, 40 mins | DX |
| Outpatient Visit | 99217 | This code is used to report all services provided on discharge from "observation status" if the discharge occurs after the initial date of "observation status." | DX |
| Outpatient Visit | 99218 | Initial observation care, low severity | DX |
| Outpatient Visit | 99219 | Initial observation care, moderate severity | DX |
| Outpatient Visit | 99220 | Initial observation care, high severity | DX |
| Outpatient Visit | 99241 | Office or other outpatient consultations, self-limited or minor, 15 min | DX |
| Outpatient Visit | 99242 | Office or other outpatient consultation, low severity, 30 min | DX |
| Outpatient Visit | 99243 | Office or other outpatient consultation, moderate severity, 40 min | DX |
| Outpatient Visit | 99244 | Office or other outpatient consultation, moderate to high severity, 60 min | DX |
| Outpatient Visit | 99245 | Office or other outpatient consultation, moderate to high severity, 80 min | DX |
| Outpatient Visit | 99341 | Home services, new patient, low severity, 20 min | DX |
| Outpatient Visit | 99342 | Home services, new patient, moderate severity 30 min | DX |
| Outpatient Visit | 99343 | Home services, new patient, moderate to high severity, 45 min | DX |
| Outpatient Visit | 99344 | Home services, new patient, high severity, 60 min | DX |
| Outpatient Visit | 99345 | Home services, new patient, patient unstable or developed significant new problem, 75 min | DX |
| Outpatient Visit | 99347 | Home services, established patient, low severity, 20 min | DX |
| Outpatient Visit | 99348 | Home services, established patient, low to moderate severity 25 min | DX |
| Outpatient Visit | 99349 | Home services, established patient, moderate to high severity, 40 min | DX |
| Outpatient Visit | 99350 | Home services, established patient, moderate to high severity, patient may be unstable, 60 min | DX |
| Outpatient Visit | 99384 | Initial evaluation of new patient, 12-17 years | DX |
| Outpatient Visit | 99385 | Initial evaluation of new patient, 18-39 years | DX |
| Outpatient Visit | 99386 | Initial evaluation of new patient, 40-64 years | DX |
| Outpatient Visit | 99387 | Initial evaluation of new patient, 65 and over | DX |
| Outpatient Visit | 99394 | Initial evaluation of established patient, 12-17 years | DX |
| Outpatient Visit | 99395 | Initial evaluation of established patient, 18-39 years | DX |
| Outpatient Visit | 99396 | Initial evaluation of established patient, 40-64 years | DX |
| Outpatient Visit | 99397 | Initial evaluation of established patient, 65 and over | DX |
| Outpatient Visit | 99401 | Preventive medicine counseling and/or risk factor reduction intervention(s) provided to an individual (separate procedure); approximately 15 min | DX |
| Outpatient Visit | 99402 | Preventive medicine counseling and/or risk factor reduction intervention(s) provided to an individual (separate procedure); approximately 30 min | DX |
| Outpatient Visit | 99403 | Preventive medicine counseling and/or risk factor reduction intervention(s) provided to an individual (separate procedure); approximately 45 min | DX |
| Outpatient Visit | 99404 | Preventive medicine counseling and/or risk factor reduction intervention(s) provided to an individual (separate procedure); approximately 60 min | DX |
| Outpatient Visit | 99408 | Counseling risk factor reduction and behavior change, 15-30 min, includes the administration of an alcohol and/or substance abuse screening tool and brief intervention | DX |
| Outpatient Visit | 99409 | Counseling risk factor reduction and behavior change, 30 min or more | DX |
| Outpatient Visit | 99411 | Group counseling services, preventative medicine, 30 min | DX |
| Outpatient Visit | 99412 | Group counseling services, preventative medicine, 60 min | DX |
| Outpatient Visit | 99510 | Home visit for individual, family, or marriage counseling | DX |
| Outpatient Visit | 99605 | Medication therapy initial, 15 min new patient | DX |
| Outpatient Visit | 99606 | Medication therapy initial, 15 min established pt | DX |
| Outpatient Visit | G0155 | Services of clinical social worker in home health or hospice settings, each 15 min | DX |
| Outpatient Visit | G0176 | Activity therapy, such as music, dance, art or play therapies not for recreation, related to the care and treatment of patient's disabling mental health problems, per session (45 min or more) | DX |
| Outpatient Visit | G0177 | Training and educational services related to the care and treatment of patient's disabling mental health problems per session (45 min or more) | DX |
| Outpatient Visit | G0396 | Alcohol and/or substance (other than tobacco) abuse structured assessment (e.g., audit, dast), and brief intervention 15-30 min | DX |
| Outpatient Visit | G0397 | Alcohol and/or substance (other than tobacco) abuse structured assessment (e.g., audit, dast), and intervention, greater than 30 min | DX |
| Outpatient Visit | G0409 | Social work and psychological services, directly relating to and/or furthering the patient's rehabilitation goals, each 15 min, face-to-face; individual (services provided by a corf-qualified social worker or psychologist in a corf) | DX |
| Outpatient Visit | G0443 | Brief face-to-face behavioral counseling for alcohol misuse, 15 min | DX |
| Outpatient Visit | G0463 | Hospital outpatient clinic visit for assessment and management of a patient | DX |
| Outpatient Visit | H0001 | Alcohol and/or drug assessment | DX |
| Outpatient Visit | H0002 | Behavioral health screening to determine eligibility for admission to treatment program | DX |
| Outpatient Visit | H0004 | Behavioral health counseling and therapy, per 15 min | DX |
| Outpatient Visit | H0005 | Alcohol and/or drug services; group counseling by a clinician | DX |
| Outpatient Visit | H0007 | Alcohol and/or drug services; crisis intervention (outpatient) | DX |
| Outpatient Visit | H0014 | Alc/drug ambulatory detox | DX |
| Outpatient Visit | H0016 | Alcohol and/or drug services; medical/somatic (medical intervention in ambulatory setting) | DX |
| Outpatient Visit | H0022 | Alcohol and/or drug intervention service (planned facilitation) | DX |
| Outpatient Visit | H0031 | Mental health assessment, by non-physician | DX |
| Outpatient Visit | H0034 | Medication training and support, per 15 min | DX |
| Outpatient Visit | H0036 | Community psychiatric supportive treatment, face-to-face, per 15 min | DX |
| Outpatient Visit | H0037 | Community psychiatric supportive treatment program, per diem | DX |
| Outpatient Visit | H0039 | Assertive community treatment, face-to-face, per 15 min | DX |
| Outpatient Visit | H0040 | Assertive community treatment program, per diem | DX |
| Outpatient Visit | H2000 | Comprehensive multidisciplinary evaluation | DX |
| Outpatient Visit | H2010 | Comprehensive medication services, per 15 min | DX |
| Outpatient Visit | H2011 | Crisis intervention service, per 15 min | DX |
| Outpatient Visit | H2013 | Psychiatric health facility service, per diem | DX |
| Outpatient Visit | H2014 | Skills training and development, per 15 min | DX |
| Outpatient Visit | H2015 | Comprehensive community support services, per 15 min | DX |
| Outpatient Visit | H2016 | Comprehensive community support services, per diem | DX |
| Outpatient Visit | H2017 | Psychosocial rehabilitation services, per 15 min | DX |
| Outpatient Visit | H2018 | Psychosocial rehabilitation services, per diem | DX |
| Outpatient Visit | H2019 | Therapeutic behavioral services, per 15 min | DX |
| Outpatient Visit | H2020 | Therapeutic behavioral services, per diem | DX |
| Outpatient Visit | H2035 | Alcohol and/or other drug treatment program, per hour | DX |
| Outpatient Visit | H2036 | Alcohol and/or other drug treatment program, per diem | DX |
| Outpatient Visit | H0046 | Mental health services not otherwise specified | DX |
| Outpatient Visit | H0047 | Alc/drug abuse svc not otherwise specified | DX |
| Outpatient Visit | H0050 | Alc/drug brief intervention, per 15 min | DX |
| Outpatient Visit | M0064 | Brief office visit for the sole purpose of monitoring or changing drug prescriptions used in the treatment of mental psychoneurotic and personality disorders | DX |
| Outpatient Visit | S9475 | Ambulatory setting substance abuse tx/detox | DX |
| Outpatient Visit | T1006 | Alcohol and/or substance abuse services, family/couple counseling | DX |
| Outpatient Visit | T1012 | Alcohol and/or substance abuse services, skills development | DX |
| Outpatient Visit | T1015 | Clinic visit/encounter, all-inclusive | DX |
| Outpatient Visit | 0510 (rev) | General clinic visit | DX |
| Outpatient Visit | 0513 (rev) | Psychiatric clinic | DX |
| Outpatient Visit | 0515 (rev) | Pediatric clinic | DX |
| Outpatient Visit | 0516 (rev) | Urgent care clinic | DX |
| Outpatient Visit | 0517 (rev) | Family practice clinic | DX |
| Outpatient Visit | 0519 (rev) | Other clinic | DX |
| Outpatient Visit | 0520 (rev) | Freestanding clinic, general | DX |
| Outpatient Visit | 0521 (rev) | Clinic visit by member to RHC/FQHC | DX |
| Outpatient Visit | 0522 (rev) | Home visit by RHC/FQHC practitioner | DX |
| Outpatient Visit | 0523 (rev) | Family practice clinic | DX |
| Outpatient Visit | 0526 (rev) | Urgent care clinic | DX |
| Outpatient Visit | 0527 (rev) | Visiting nurse services to member's home in a home health shortage area | DX |
| Outpatient Visit | 0528 (rev) | Visit by RHC/FQHC practitioner to other non-RHC/FQHC site (e.g., scene of accident) | DX |
| Outpatient Visit | 0529 (rev) | Other Freestanding clinic | DX |
| Outpatient Visit | 0900 (rev) | BH Treatment/services, general | DX |
| Outpatient Visit | 0902 (rev) | Milieu therapy | DX |
| Outpatient Visit | 0903 (rev) | Play therapy | DX |
| Outpatient Visit | 0904 (rev) | Activity therapy | DX |
| Outpatient Visit | 0911 (rev) | Rehabilitation | DX |
| Outpatient Visit | 0914 (rev) | Individual therapy | DX |
| Outpatient Visit | 0915 (rev) | Group therapy | DX |
| Outpatient Visit | 0916 (rev) | Family therapy | DX |
| Outpatient Visit | 0917 (rev) | Biofeedback | DX |
| Outpatient Visit | 0919 (rev) | BH treatments | DX |
| Outpatient Visit | 0944 (rev) | Drug rehabilitation | DX |
| Outpatient Visit | 0945 (rev) | Alcohol rehabilitation | DX |
| Outpatient Visit | 0982 (rev) | Outpatient services, fees | DX |
| Outpatient Visit | 0983 (rev) | Clinic, fees | DX |
| Outpatient Visit | 90791 | Psychiatric diagnostic evaluation, initial diagnostic interview, excludes medical services | DX, POS |
| Outpatient Visit | 90792 | Psychiatric diagnostic evaluation with medical services | DX, POS |
| Outpatient Visit | 90801 | Diagnostic Interview Examination | DX, POS |
| Outpatient Visit | 90802 | Interactive diagnostic interview examination | DX, POS |
| Outpatient Visit | 90862 | Pharmacologic management *code deleted in 2013* | DX, POS |
| Outpatient Visit | 90867 | Therapeutic repetitive TMS | DX, POS |
| Outpatient Visit | 90868 | Subsequent TMS Delivery and Management | DX, POS |
| Outpatient Visit | 90869 | Subsequent TMS Motor Threshold Re-Determination with Delivery and Management | DX, POS |
| Outpatient Visit | 90870 | Electroconvulsive Therapy | DX, POS |
| Outpatient Codes: Psychotherapy Codes | 90785 | Psychotherapy complex interactive, add-on for "difficult" patient | DX, POS |
| Outpatient Codes: Psychotherapy Codes | 90804 | Individual psychotherapy, insight-oriented, behavior modifying and/or supportive, in an office or outpatient facility, 20-30 min | DX, POS |
| Outpatient Codes: Psychotherapy Codes | 90805 | Individual psychotherapy, insight-oriented, behavior modifying and/or supportive, in an office or outpatient facility, with medical evaluation and management | DX, POS |
| Outpatient Codes: Psychotherapy Codes | 90806 | Individual therapy, 45-50 min | DX, POS |
| Outpatient Codes: Psychotherapy Codes | 90807 | Individual therapy with med management | DX, POS |
| Outpatient Codes: Psychotherapy Codes | 90808 | Individual therapy, 75-80 min | DX, POS |
| Outpatient Codes: Psychotherapy Codes | 90809 | Individual therapy with med management | DX, POS |
| Outpatient Codes: Psychotherapy Codes | 90810 | Interactive therapy 20-30 min | DX, POS |
| Outpatient Codes: Psychotherapy Codes | 90811 | Interactive therapy, med management | DX, POS |
| Outpatient Codes: Psychotherapy Codes | 90812 | Interactive therapy, 45-50 min | DX, POS |
| Outpatient Codes: Psychotherapy Codes | 90813 | Interactive therapy, med management | DX, POS |
| Outpatient Codes: Psychotherapy Codes | 90814 | Interactive therapy, 75-80 min | DX, POS |
| Outpatient Codes: Psychotherapy Codes | 90815 | Interactive therapy, med management | DX, POS |
| Outpatient Codes: Psychotherapy Codes | 90857 | Interactive group psychotherapy *code deleted in 2013* | DX, POS |
| Outpatient Codes: Psychotherapy Codes | 90832 | Psychotherapy, 30 min | DX, POS |
| Outpatient Codes: Psychotherapy Codes | 90833 | E/M plus psychotherapy add-on, 30 min | DX, POS |
| Outpatient Codes: Psychotherapy Codes | 90834 | Psychotherapy, 45 min | DX, POS |
| Outpatient Codes: Psychotherapy Codes | 90836 | E/M plus psychotherapy add-on, 45 min | DX, POS |
| Outpatient Codes: Psychotherapy Codes | 90837 | Psychotherapy, 60 min | DX, POS |
| Outpatient Codes: Psychotherapy Codes | 90838 | Individual Psychotherapy, 60 min with patient and/or family member when performed with an evaluation and management service | DX, POS |
| Outpatient Codes: Psychotherapy Codes | 90853 | Group psychotherapy, more than of a multiple-family group | DX, POS |
| Outpatient Codes: Psychotherapy Codes | 90839 | Psychotherapy for crisis | DX, POS |
| Outpatient Codes: Psychotherapy Codes | 90840 | Psychotherapy for crisis, add-on for each additional 30 min | DX, POS |
| Outpatient Codes: Psychotherapy Codes | 90844 | Psychotherapy 45-50 min | DX, POS |
| Outpatient Codes: Psychotherapy Codes | 90845 | Psychoanalysis | DX, POS |
| Outpatient Codes: Psychotherapy Codes | 90847 | Family psychotherapy, conjoint psychotherapy with patient present | DX, POS |
| Outpatient Codes: Psychotherapy Codes | 90849 | Multiple-family group psychotherapy | DX, POS |
| Outpatient Codes: Psychotherapy Codes | 90863 | Pharm management w/ psych add-on for prescribing psychologist in certain states | DX, POS |
| Outpatient Codes: Psychotherapy Codes | 90875 | Individual psychophysiological therapy incorporating biofeedback training by any modality, 20-30 min | DX, POS |
| Outpatient Codes: Psychotherapy Codes | 90876 | Individual psychophysiological therapy incorporating biofeedback training by any modality, 45-50 min | DX, POS |
| Outpatient Codes: Psychotherapy Codes | 99355 | Individual psychophysiological therapy incorporating biofeedback training by any modality, 45-50 min | DX, POS |
| Outpatient Codes: Psychotherapy Codes | 90823 | Interactive individual psychotherapy 20-30 min *code deleted in 2013* | DX, POS |
| Outpatient Codes: Psychotherapy Codes | 90824 | Interactive individual psychotherapy with E/M 20-30 min *code deleted in 2013* | DX, POS |
| Outpatient Codes: Psychotherapy Codes | 90825 | Interactive individual psychotherapy, 45-50 min *code deleted in 2013* | DX, POS |
| Outpatient Codes: Psychotherapy Codes | 90826 | Interactive individual psychotherapy with E/M 45-50 min *code deleted in 2013* | DX, POS |
| Outpatient Codes: Psychotherapy Codes | 90827 | Interactive individual psychotherapy, 75-80 min *code deleted in 2013* | DX, POS |
| Outpatient Codes: Psychotherapy Codes | 90828 | Interactive individual psychotherapy with E/M 75-80 min *code deleted in 2013* | DX, POS |
| Outpatient Codes: Psychotherapy Codes | 90829 | Interactive individual psychotherapy with E/M 75-80 min *code deleted in 2013* | DX, POS |
| Outpatient Codes: Psychotherapy Codes | 90839 | Psychotherapy for crisis | DX, POS |
| Outpatient Codes: Psychotherapy Codes | 90840 | Psychotherapy for crisis, add-on for each additional 30 min | DX, POS |
| Outpatient: Peer Support | H0038 | Self-help/peer services, per 15 min | DX, POS |
| Outpatient: Bupr service admin. | J0571 | Buprenorphine/naloxone, oral, less than or equal to 3mg buprenorphine (Buprenorphine oral 1mg) | none |
| Outpatient: Bupr service admin. | J0572 | Buprenorphine/naloxone, oral, less than or equal to 3mg buprenorphine (Bupren/nal up to 3mg bupreno) | none |
| Outpatient: Bupr service admin. | J0573 | Buprenorphine/naloxone, oral, greater than 3mg, but less than or equal to 3.1-6mg (Bupren/nal 3.1-6mg bupren) | none |
| Outpatient: Bupr service admin. | J0574 | Buprenorphine/naloxone, oral, greater than 6mg, but less than or equal to 10mg buprenorphine (Bupren/nal 6.1-10mg bupre) | none |
| Outpatient: Bupr service admin. | J0575 | Buprenorphine/naloxone, oral, greater than 10mg buprenorphine (Bupren/nal over 10mg bupreno) | none |
| Outpatient: Methadone | H0020 | Alcohol and/or drug services; methadone administration and/or service (provision by a licensed program) | none |
| Outpatient: Methadone | S0109 | Methadone, oral, 5mg | none |
| Outpatient: Methadone | J1230 | Methadone, injection, up to 10mg | none |
| Outpatient: Naltrexone | J2315 | Vivitrol, injection, 1mg | none |
| Outpatient: Naloxone | J2310 | Naloxone Hydrochloride, injection, per 1mg | none |
| Outpatient: case management | H0006 | Alcohol/and or drug services case management | DX, POS |
| Outpatient: case management | T1007 | Treatment plan dev and/or mod for alcohol/sa | DX, POS |
| Outpatient: case management | T1017 | Targeted case management, each 15 min | DX, POS |
| Outpatient: case management | T2023 | Targeted case management, per month | DX, POS |
| Outpatient: case management | T1016 | Case management, each 15 min | DX, POS |
| IOP or Partial Hosp. | H0008 | Alcohol and/or drug services; subacute detoxification (hospital inpatient) | DX, POS |
| IOP or Partial Hosp. | H0009 | Alc/drug services--acute detox (hosp inpt) | DX, POS |
| Residential | H0010 | Alcohol and/or drug services; subacute detoxification (residential addiction program inpatient) | DX |
| Residential | H0011 | Alcohol and/or drug services; acute detoxification (residential addiction program inpatient) | DX |
| Residential | H0012 | Alcohol and/or drug services; subacute detoxification (residential addiction program outpatient) | DX |
| Residential | H0013 | Alcohol and/or drug services; acute detoxification (residential addiction program outpatient) | DX |
| Outpatient Visit | H0014 | Alc/drug ambulatory detox | DX |
| Outpatient Visit | S9475 | Ambulatory setting substance abuse tx/detox | DX |
APPENDIX D. SAMPLE ATTRITION TABLE
| Variable | 2006-2007 | 2014-2015 |
|---|---|---|
| Individuals in Truven Health MarketScan® CCAE Database | 41,849,679 | 54,215,535 |
| General Restrictions | ||
| I. Restrict to self-insured employers with plans that submitted prescription drug claims (enrollees) | 17,365,707 | 25,205,277 |
| Number of plans that meet restriction I | 7,758 | 10,036 |
| II. Restrict to enrollees with prescription drug data (enrollees) | 17,348,720 | 25,205,277 |
| Number of plans that meet restriction I and II | 7,751 | 10,036 |
| III. Restrict to individuals enrolled for at least 10 out of 12 months (enrollees) | 13,649,697 | 20,015,302 |
| IV. Restrict to age 12-64 years (enrollees) FINAL SAMPLE | 11,307,960 | 16,802,208 |
NOTES
-
Rudd RA, Seth P, David F, et al. Increases in drug and opioid-involved overdose deaths--United States, 2010-2015. Morbidity and Mortality Weekly Report Recommendations and Reports. 2016; 65(50-51): 1445-1452. https://www.cdc.gov/mmwr/volumes/65/wr/mm655051e1.htm.
-
Substance Abuse and Mental Health Services Administration. Behavioral Health Spending and Use Accounts, 1986-2014. HHS Publication No. SMA-16-4975. Rockville, MD: Substance Abuse and Mental Health Services Administration; 2016.
-
Reif S, Creedon TB, Horgan CM, et al. Commercial health plan coverage of selected treatments for opioid use disorders from 2003 to 2014. Journal of Psychoactive Drugs. 2017; 49(2): 102-110.
-
Substance Abuse and Mental Health Services Administration. Treatment for Substance Use Disorders. 2016. https://www.samhsa.gov/treatment/substance-use-disorders.
-
U.S. Department of Health and Human Services, Office of the Surgeon General. Early intervention, treatment, and management of substance use disorders. In: Facing Addiction in America: The Surgeon General's Report on Alcohol, Drugs, and Health. Washington, DC: U.S. Department of Health and Human Services; 2016: 6-1-6-71. https://addiction.surgeongeneral.gov/.
-
National Committee for Quality Assurance. Initiation and Engagement of Alcohol and Other Drug Dependence Treatment. Available from http://www.ncqa.org/report-cards/health-plans/state-of-health-care-quality/2016-table-of-contents/alcoholtreatment.
-
Dufour R, Joshi AV, Pasquale MK, et al. The prevalence of diagnosed opioid abuse in commercial and Medicare managed care populations. Pain Practice. 2014; 14(3): E106-E115.
-
Mark TL, Yee T, Levit KR, et al. Insurance financing increased for mental health conditions but not for substance use disorders, 1986-2014. Health Affairs (Millwood). 2016; 35(6): 958-965.
-
Mark TL, Yee T, Levit KR, et al. Insurance financing increased for mental health conditions but not for substance use disorders, 1986-2014. Health Affairs (Millwood). 2016; 35(6): 958-965.
-
Centers for Disease Control and Prevention. Prescription Opioid Overdose Data. 2017. https://www.cdc.gov/drugoverdose/data/overdose.html.
-
Rudd RA, Seth P, David F, et al. Increases in drug and opioid-involved overdose deaths--United States, 2010-2015. Morbidity and Mortality Weekly Report Recommendations and Reports. 2016; 65(50-51): 1445-1452. https://www.cdc.gov/mmwr/volumes/65/wr/mm655051e1.htm.
-
Authors' analysis of NSDUH data.
-
Center for Consumer Information and Insurance Oversight. The Mental Health Parity and Addiction Equity Act Fact Sheet. 2013. https://cciio.cms.gov/programs/protections/mhpaea/mhpaea_factsheet.html.
-
National Conference of State Legislatures. Drug Overdose Immunity and Good Samaritan Laws. 2017. http://www.ncsl.org/research/civil-and-criminal-justice/drug-overdose-immunity-good-samaritan-laws.aspx.
-
Busch SH, Epstein AJ, Harhay MO, et al. The effects of federal parity on substance use disorder treatment. American Journal of Managed Care. 2014; 20(1): 76-82.
-
Medicaid and Children's Health Insurance Programs; Mental Health Parity and Addiction Equity Act of 2008; the Application of Mental Health Parity Requirements to Coverage Offered by Medicaid Managed Care Organizations, the Children's Health Insurance Program (CHIP), and Alternative Benefit Plans. Federal Register. 2016; 81:18389. To be codified at 42 CFR §438, §440, §456, §457.
-
Tai B, Volkow ND. Treatment for substance use disorder: Opportunities and challenges under the Affordable Care Act. Social Work in Public Health. 2013; 28(3-4): 165-174.
-
Cummings JR, Wen H, Ko M, et al. Race/ethnicity and geographic access to Medicaid substance use disorder treatment facilities in the United States. JAMA Psychiatry. 2014; 71(2): 190-196.
-
Saloner B, Lê Cook B. An ACA provision increased treatment for young adults with possible mental illnesses relative to comparison group. Health Affairs (Millwood). 2014; 33(8): 1425-1434.
-
Rudd RA, Seth P, David F, et al. Increases in drug and opioid-involved overdose deaths--United States, 2010-2015. Morbidity and Mortality Weekly Report Recommendations and Reports. 2016; 65(50-51): 1445-1452. https://www.cdc.gov/mmwr/volumes/65/wr/mm655051e1.htm.
-
Substance Abuse and Mental Health Services Administration. Behavioral Health Spending and Use Accounts, 1986-2014. HHS Publication No. SMA-16-4975. Rockville, MD: Substance Abuse and Mental Health Services Administration; 2016.
-
Reif S, Creedon TB, Horgan CM, et al. Commercial health plan coverage of selected treatments for opioid use disorders from 2003 to 2014. Journal of Psychoactive Drugs. 2017; 49(2): 102-110.
-
Andrews CM, D'Aunno TA, Pollack HA, et al. Adoption of evidence-based clinical innovations: The case of buprenorphine use by opioid treatment programs. Medical Care Research and Review. 2014; 71(1): 43-60.
-
Fair Health. (2016). The Impact of the Opioid Crisis on the Healthcare System: A Study of Privately Billed Services. New York, NY: FAIR Health.
-
U.S. Department of Health and Human Services, Office of the Surgeon General. Early intervention, treatment, and management of substance use disorders. In: Facing Addiction in America: The Surgeon General's Report on Alcohol, Drugs, and Health. Washington, DC: U.S. Department of Health and Human Services; 2016: 6-1-6-71. https://addiction.surgeongeneral.gov/.
-
American Society of Addiction Medicine. The ASAM National Practice Guideline for the Use of Medications in the Treatment of Addiction Involving Opioid Use. Chevy Chase, MD: American Society of Addiction Medicine; 2015. https://www.asam.org/docs/default-source/practice-support/guidelines-and-consensus-docs/asam-national-practice-guideline-supplement.pdf.
-
American Society of Addiction Medicine. The ASAM National Practice Guideline for the Use of Medications in the Treatment of Addiction Involving Opioid Use. Chevy Chase, MD: American Society of Addiction Medicine; 2015: 6. https://www.asam.org/docs/default-source/practice-support/guidelines-and-consensus-docs/asam-national-practice-guideline-supplement.pdf.
-
Fullerton CA, Kim M, Thomas CP, et al. Medication-assisted treatment with methadone: assessing the evidence. Psychiatric Services. 2014; 65(2): 146-157.
-
Thomas CP, Fullerton CA, Kim M, et al. Medication-assisted treatment with buprenorphine: assessing the evidence. Psychiatric Services. 2014; 65: 158-170.
-
Mattick R, Breen, C, Kimber, J, et al. Methadone maintenance therapy versus no opioid replacement therapy for opioid dependence. Cochrane Database of Systematic Reviews. CD002209; 2009.
-
Minozzi S, Amato L, Vecchi S, et al. Oral naltrexone maintenance treatment for opioid dependence. Cochrane Database of Systematic Reviews. CD001333; 2011.
-
Krupitsky E, Nunes EV, Ling W, et al. Injectable extended-release naltrexone for opioid dependence: A double-blind, placebo-controlled, multicentre randomised trial. Lancet. 2011; 377: 1506-1513.
-
Substance Abuse and Mental Health Services Administration. Medication-Assisted Treatment of Opioid Use Disorder Pocket Guide. SMA 16-4892PG. Rockville, MD: U.S. Department of Health and Human Services; 2016. https://store.samhsa.gov/product/Medication-Assisted-Treatment-of-Opioid-Use-Disorder-Pocket-Guide/SMA16-4892PG.
-
Reichert J, Gleicher L, Salisbury-Afshar E. An Overview of Medication-Assisted Treatment for Opioid Use Disorders for Criminal Justice-Involved Individuals. Illinois Criminal Justice Information Authority. 2017. http://www.icjia.state.il.us/articles/an-overview-of-medication-assisted-treatment-for-opioid-use-disorders-for-criminal-justice-involved-individuals.
-
Ibid.
-
Noysk B, Anglin MD, Brissette S, et al. A call for evidence-based medical treatment of opioid dependence in the United States and Canada. Health Affairs (Millwood). 2013; 32(8): 1462-1469.
-
Substance Abuse and Mental Health Services Administration. (2015). Legislation, Regulations, and Guidelines. Updated September 28, 2015. https://www.samhsa.gov/medication-assisted-treatment/legislation-regulations-guidelines.
-
Medication assisted treatment for opioid use disorders. Federal Register. 2016; 81: 44711. To be codified at 42 CFR §8. https://www.federalregister.gov/documents/2016/07/08/2016-16120/medication-assisted-treatment-for-opioid-use-disorders.
-
Jones CM, Campopiano M, Baldwin G, et al. National and state treatment need and capacity for opioid agonist medication-assisted treatment. American Journal of Public Health. 2015; 105(8): e55-e61.
-
Substance Abuse and Mental Health Services Administration. TIP 43: Medication-Assisted Treatment for Opioid Addiction in Opioid Treatment Programs. 2012. https://store.samhsa.gov/product/TIP-43-Medication-Assisted-Treatment-f….
-
Brooks AC, Comer SD, Sullivan MA, et al. Long-acting injectable versus oral naltrexone maintenance therapy with psychosocial intervention for heroin dependence: A quasi-experiment. Journal of Clinical Psychiatry. 2010; 71(10): 1371-1378.
-
Lee JD, Friedmann PD, Kinlock TW, et al. Extended-release naltrexone to prevent opioid relapse in criminal justice offenders. New England Journal of Medicine. 2016; 374(13): 1232-1242.
-
Harris AHS, Bowe T, Del Re AC, et al. Extended release naltrexone for alcohol use disorders: Quasi-experimental effects on mortality and subsequent detoxification episodes. Alcoholism: Clinical and Experimental Research. 2015; 39(1): 79-83.
-
Lee J, Kresina TF, Campopiano M, et al. Use of pharmacotherapies in the treatment of alcohol use disorders and opioid dependence in primary care. BioMed Research International. 2015; 2015: 137020.
-
Alanis-Hirsch K, Cross R, Ford JH, et al. Extended-release naltrexone: A qualitative analysis of barriers to routine use. Journal of Substance Abuse Treatment. 2016; 62: 68-73.
-
Lee JD, Friedmann PD, Kinlock TW, et al. Extended-release naltrexone to prevent opioid relapse in criminal justice offenders. New England Journal of Medicine. 2016; 374(13): 1232-1242.
-
NYU Langone Medical Center. Opioid Relapse Rates Fall With Long-Term Use of Medication for Adults Involved in Criminal Justice System. Press release. March 30, 2016. https://nyulangone.org/press-releases/opioid-relapse-rates-fall-with-long-term-use-of-medication-for-adults-involved-in-criminal-justice-system.
-
Dufour R, Joshi AV, Pasquale MK, et al. The prevalence of diagnosed opioid abuse in commercial and Medicare managed care populations. Pain Practice. 2014; 14(3): E106-E115.
-
National Committee for Quality Assurance. Initiation and Engagement of Alcohol and Other Drug Dependence Treatment. Available from http://www.ncqa.org/report-cards/health-plans/state-of-health-care-quality/2016-table-of-contents/alcoholtreatment.
-
Weiss RD, Potter JS, Fiellin DA, et al. Adjunctive counseling during brief and extended buprenorphine-naloxone treatment for prescription opioid dependence: A 2-phase randomized controlled trial. Archives of General Psychiatry. 2011; 68(12): 1238-1246.
-
National Committee for Quality Assurance. Initiation and Engagement of Alcohol and Other Drug Dependence Treatment. Available from http://www.ncqa.org/report-cards/health-plans/state-of-health-care-quality/2016-table-of-contents/alcoholtreatment.
-
HCUP CCS. Healthcare Cost and Utilization Project (HCUP). March 2017. Rockville, MD: Agency for Healthcare Research and Quality. Available from http://www.hcup-us.ahrq.gov/toolssoftware/ccs/ccs.jsp.
-
National Committee for Quality Assurance. Initiation and Engagement of Alcohol and Other Drug Dependence Treatment. Available from http://www.ncqa.org/report-cards/health-plans/state-of-health-care-quality/2016-table-of-contents/alcoholtreatment.
-
Weiss RD, Potter JS, Fiellin DA, et al. Adjunctive counseling during brief and extended buprenorphine-naloxone treatment for prescription opioid dependence: A 2-phase randomized controlled trial. Archives of General Psychiatry. 2011; 68(12): 1238-1246.
-
Dufour R, Joshi AV, Pasquale MK, et al. The prevalence of diagnosed opioid abuse in commercial and Medicare managed care populations. Pain Practice. 2014; 14(3): E106-E115.
-
Reif S, Creedon TB, Horgan CM, et al. Commercial health plan coverage of selected treatments for opioid use disorders from 2003 to 2014. Journal of Psychoactive Drugs. 2017; 49(2): 102-110.
-
Horgan CM, Reif S, Hodgkin D, et al. Availability of addiction medications in private health plans. Journal of Substance Abuse Treatment. 2016; 34: 147-156.
-
Reif S, Horgan CM, Hodgkin D, et al. Access to addiction pharmacotherapy in private health plans. Journal of Substance Abuse Treatment. 2016; 66: 23-29.
-
Substance Abuse and Mental Health Services Administration. Behavioral Health Trends in the United States: Results From the 2014 National Survey on Drug Use and Health. HHS Pub No. (SMA) 15-4927, NSDUH Series H-50. Rockville, MD: Substance Abuse and Mental Health Services Administration; 2015. https://www.samhsa.gov/data/sites/default/files/NSDUH-FRR1-2014/NSDUH-FRR1-2014.pdf.
-
Kampman K, Jarvis M. American Society of Addiction Medicine (ASAM) national practice guideline for the use of medication in the treatment of addiction involving opioid use. Journal of Addiction Medicine. 2015; 9(5): 358-367.
-
Mark TL, Yee T, Levit KR, et al. Insurance financing increased for mental health conditions but not for substance use disorders, 1986-2014. Health Affairs (Millwood). 2016; 35(6): 958-965.
-
Reif S, Horgan CM, Hodgkin D, et al. Access to addiction pharmacotherapy in private health plans. Journal of Substance Abuse Treatment. 2016; 66: 23-29.
-
See http://www.mdmag.com/medical-news/ama-to-insurers-drop-prior-approval-for-opioid-treatment.
-
See http://www.paproviders.org/governor-wolf-removing-pre-authorization-for-mat/.
-
Stein BD, Gordan AJ, Dick AW, et al. Supply of buprenorphine waivered physicians: the influence of state policies. Journal of Substance Abuse Treatment. 2015; 48: 104-111.
-
Jones CM, Campopiano M, Baldwin G, et al. National and state treatment need and capacity for opioid agonist medication-assisted treatment. American Journal of Public Health. 2015; 105(8): e55-e61.
-
U.S. Department of Health and Human Services Office on Women's Health. Final Report: Opioid Use, Misuse, and Overdose in Women. July 13, 2017.
-
U.S. Department of Health and Human Services Office on Women's Health. Final Report: Opioid Use, Misuse, and Overdose in Women. July 13, 2017.
-
Mark TL, Yee T, Levit KR, et al. Insurance financing increased for mental health conditions but not for substance use disorders, 1986-2014. Health Affairs (Millwood). 2016; 35(6): 958-965.
-
American Society of Addiction Medicine. The 21st Century Cure Act--Highlights for ASAM Members. 2016a. https://www.asam.org/resources/publications/magazine/read/article/2016/12/07/the-21st-century-cures-act---highlights-for-asam-members.
-
Substance Abuse and Mental Health Services Administration. Apply to Increase Patient Limits. 2017. https://www.samhsa.gov/medication-assisted-treatment/buprenorphine-waiver-management/increase-patient-limits.
-
American Society of Addiction Medicine. Summary of the Comprehensive Addiction and Recovery Act. 2016b. https://www.asam.org/advocacy/issues/opioids/summary-of-the-comprehensive-addiction-and-recovery-act.
Use of Medication-Assisted Treatment for Opioid Use Disorders in Employer-Sponsored Health Insurance
This report was prepared under contract #HHSP233201600023I between the U.S. Department of Health and Human Services (HHS), Office of Disability, Aging and Long-Term Care Policy (DALTCP) and Truven Health Analytics. For additional information about this subject, you can visit the DALTCP home page at http://aspe.hhs.gov/office-disability-aging-and-long-term-care-policy-daltcp or contact the ASPE Project Officers, Laurel Fuller and D.E.B. Potter, at HHS/ASPE/DALTCP, Room 424E, H.H. Humphrey Building, 200 Independence Avenue, S.W., Washington, D.C. 20201; Laurel.Fuller@hhs.gov.
Reports Available
Use of Medication-Assisted Treatment for Opioid Use Disorders in Employer-Sponsored Health Insurance: Final Report
- HTML: https://aspe.hhs.gov/basic-report/use-medication-assisted-treatment-opioid-use-disorders-employer-sponsored-health-insurance-final-report
- PDF: https://aspe.hhs.gov/pdf-report/use-medication-assisted-treatment-opioid-use-disorders-employer-sponsored-health-insurance-final-report
Use of Medication-Assisted Treatment for Opioid Use Disorders in Employer-Sponsored Health Insurance: Out-of-Pocket Costs