
Winnie Chi, PhD, Emily Graf, BA, Landon Hughes, BA, Jean Hastie, MPH, Galina Khatutsky, MS, Sari B. Shuman, MPH, MSW, E. Andrew Jessup, and Sarita Karon, PhD
RTI International
Helen Lamont, PhD
U.S. Department of Health and Human Services
January 2019
Printer Friendly Version in PDF Format (54 PDF pages)
ABSTRACT
ASPE has an interest in understanding the national profile of older adults with dementia and their caregivers. This chartbook uses nationally representative data from the National Health and Aging Trends Study (NHATS) and the National Study on Caregiving (NSOC) to describe older adults living in community settings with dementia, the type and amount of care they received, the characteristics of their informal caregivers, and the impact of caregiving on their informal caregivers. Older adults living in community settings were defined as individuals who were aged 65 or older living outside of nursing homes. For the purposes of this chartbook, only individuals who met the criteria for the NHATS dementia classification of "probable dementia" were considered to have dementia. This was a conservative definition, because individuals with mild cognitive impairment or those with early stages of dementia (i.e., individuals with possible dementia) are likely to be classified as not having dementia. Thus, the estimates for the dementia population presented in this chartbook were primarily based on the population of community-dwelling older adults who had been diagnosed with Alzheimer's disease or dementia, or with middle or late-stage dementia.
DISCLAIMER: The opinions and views expressed in this report are those of the authors. They do not necessarily reflect the views of the Department of Health and Human Services, the contractor or any other funding organization.
TABLE OF CONTENTS
CHAPTER 1. POPULATION AND SOCIO-DEMOGRAPHIC CHARACTERISTICS OF OLDER ADULTS
CHAPTER 2. HEALTH STATUS OF OLDER ADULTS WITH DEMENTIA
CHAPTER 3. CARE RECEIVED BY OLDER ADULTS WITH DEMENTIA
CHAPTER 4. POPULATION AND SOCIO-DEMOGRAPHIC CHARACTERISTICS OF INFORMAL CAREGIVERS OF OLDER ADULTS WITH DEMENTIA
CHAPTER 5. HEALTH STATUS OF INFORMAL CAREGIVERS OF OLDER ADULTS WITH DEMENTIA
CHAPTER 6. INFORMAL CAREGIVER ASSISTANCE TO OLDER ADULTS WITH DEMENTIA
LIST OF FIGURES
- FIGURE 1-1: Population Size by Dementia Status
- FIGURE 1-2: Age-specific Dementia Prevalence
- FIGURE 1-3: Dementia Prevalence by Gender and Age
- FIGURE 1-4: Dementia Prevalence by Race/Ethnicity and Age
- FIGURE 1-5: Dementia Prevalence by Marital Status and Age
- FIGURE 1-6: Dementia Prevalence by Educational Attainment and Age
- FIGURE 1-7: Income Distribution among Older Adults with and without Dementia
- FIGURE 1-8: Selected Asset Type Ownership by Dementia Status
- FIGURE 1-9: Distribution of Living Arrangements among Older Adults with and without Dementia
- FIGURE 2-1: Distribution of Chronic Conditions among Older Adults with and without Dementia
- FIGURE 2-2: Prevalence of Depressive Symptoms, by Dementia Status
- FIGURE 2-3: Prevalence of Limitations in Self-Care, Mobility, and Household Activities, by Dementia Status and Age
- FIGURE 2-4: Distribution of Impairment Severity among Older Adults with and without Dementia
- FIGURE 3-1: Distribution of Assistance Received among Older Adults with and without Dementia
- FIGURE 3-2: Amount of Care Received by Older Adults, by Dementia Status
- FIGURE 3-3: Size of OIder Adults' Care Network by Dementia Status
- FIGURE 4-1: Informal Caregiver Population Size by Older Adults' Dementia Status
- FIGURE 4-2: Informal Caregivers' Gender by Older Adults' Dementia Status
- FIGURE 4-3: Distribution of Informal Caregivers' Age among Older Adults with and without Dementia
- FIGURE 4-4: Distribution of Informal Caregivers' Relationship to Older Adults with and without Dementia
- FIGURE 5-1: Distribution of Self-Rated Health Status of Informal Caregivers, by Older Adults' Dementia Status
- FIGURE 5-2: Prevalence of Depressive Symptoms among Informal Caregivers, by Older Adults' Dementia Status
- FIGURE 6-1: Monthly Amount of Informal Care Provided by Informal Caregivers, by Older Adults' Dementia Status
- FIGURE 6-2: Monthly Amount of Informal Care Provided by Informal Caregivers, by Older Adults' Dementia Status
- FIGURE 6-3: Impact of Informal Caregiving on Informal Caregivers, by Older Adults' Dementia Status
- FIGURE 6-4: Difficulties Experienced by Informal Caregivers, by Older Adults' Dementia Status
- FIGURE 6-5: Supportive Environment for Informal Caregivers, by Older Adults' Dementia Status
- FIGURE 6-6: Work Productivity Loss Experienced by Informal Caregivers, by Older Adults' Dementia Status
ACKNOWLEDGMENT
We thank Ellen A. Kramarow, PhD, Judy Goldberg Dey, PhD, and staff of the DALTCP within ASPE for their prior work on the dementia chartbook using 2011 NHATS data.
EXECUTIVE SUMMARY
In 2015, there were approximately 4.0 million adults aged 65 and older in the United States living with dementia. Of these, 3.4 million lived in community settings, defined as living outside of nursing homes. An estimated 5.7 million people provided informal care for older adults living in community settings with dementia. Dementia is a syndrome defined by a group of symptoms related to cognitive impairments that are severe enough to interfere with individuals' daily activities (Centers for Disease Control and Prevention [CDC], 2015). Individuals with dementia often rely on others, such as informal caregivers, for their daily care. Informal caregivers are family and non-relatives who provide unpaid care to older adults.
Using nationally representative data from the 2015 National Health and Aging Trends Study (NHATS) and the National Study on Caregiving (NSOC), this chartbook describes the national profile of older adults living in community settings with dementia and their informal caregivers, with respect to socio-demographic characteristics, the type and amount of care received or provided, and the impact of informal caregiving.
Dementia was more prevalent among community-dwelling older adults who:
- were over age 80;
- had lower educational attainment;
- were of racial/ethnic groups other than non-Hispanic White; and
- were not married and not living with partners.
Compared to community-dwelling older adults without dementia, community-dwelling older adults with dementia were more likely to:
- have annual incomes below 200% of the 2015 federal poverty level (FPL);
- live alone;
- have three or more chronic conditions;
- experience depressive symptoms;
- have limitations in any self-care, mobility, and household activities; and
- have more severe impairment in self-care, mobility, and household activities.
Nearly all (95%) community-dwelling older adults with dementia received some sort of assistance, and more than one-half (63%) received unpaid help exclusively. Among community-dwelling older adults who received care, older adults with dementia received more than twice as many total hours of paid and unpaid care per month as those without dementia.
Community-dwelling older adults with dementia often have more than one informal caregiver. As a result, informal caregivers of older adults with dementia had different profiles overall compared to informal caregivers of community-dwelling older adults without dementia. Additionally, informal caregivers of community-dwelling older adults with dementia experienced a more negative impact from caregiving than informal caregivers of community-dwelling older adults without dementia.
Compared to informal caregivers of community-dwelling older adults without dementia, informal caregivers of communitydwelling older adults with dementia were more likely to be:
- younger than age 65;
- female; and
- the children of those they provided care for.
Spouses provided the most hours of care per month to community-dwelling older adults with dementia. Most informal caregivers assisted in household activities and health care system interactions. Informal caregivers assisting older adults with dementia experienced twice as much work productivity loss compared to informal caregivers assisting older adults without dementia.
INTRODUCTION
Introduction Dementia affects the health and well-being of the United States (US) population, especially among older adults. Dementia is a syndrome defined by a group of symptoms related to cognitive impairments that are severe enough to interfere with individuals' daily activities (CDC, 2015). Dementia predominantly occurs among older adults given that increasing age is a risk factor of dementia, although some individuals experience early onset of symptoms at a younger age (National Institutes of Health [NIH], 2013 & NIH, 2015). Alzheimer's disease is the most common cause of dementia and accounts for an estimated 60-80% of dementia cases (NIH, 2013). Other related dementia types include frontotemporal, Lewy body, mixed and vascular dementia. Diagnosing and distinguishing different types of dementia can be difficult, but the impact is often the same: progressive decline in memory, thought processes, and functioning that eventually leads to full dependence on others for assistance.
As the US population ages, the population with dementia is expected to grow. The growth of the dementia population places an increasing burden on the health care system as well as on individuals with dementia and their families. Individuals with dementia often rely on others, primarily family and friends, for their daily care and are likely to become heavy users of medical care and long-term services and supports. Recent research has estimated the costs of care for dementia were between $159 billion and $215 billion (Hurd et al., 2013). In addition to financial impacts, dementia can lead to emotional and physical stress for individuals with dementia and their families.
The Office of the Assistant Secretary for Planning and Evaluation (ASPE) in the US Department of Health and Human Services (HHS) has an interest in understanding the national profile of older adults with dementia and their caregivers. This chartbook uses nationally representative data from the National Health and Aging Trends Study (NHATS) and the National Study on Caregiving (NSOC) to describe older adults living in community settings with dementia, the type and amount of care they received, the characteristics of their informal caregivers, and the impact of caregiving on their informal caregivers. Older adults living in community settings were defined as individuals who were aged 65 and older living outside of nursing homes. For the purposes of this chartbook, only individuals who met the criteria for the NHATS dementia classification (Kasper et al., 2013) of probable dementia were considered to have dementia. This was a conservative definition, because individuals with mild cognitive impairment or those with early stages of dementia (i.e., individuals with possible dementia) are likely to be classified as not having dementia. Thus, the estimates for the dementia population presented in this chartbook were primarily based on the population of community-dwelling older adults who had been diagnosed with Alzheimer's disease or dementia, or with middle- or late-stage dementia.
METHODOLOGY
The analyses in this chartbook used data from the 2015 NHATS and the NSOC. NHATS was a longitudinal US population-based survey of older adults' health and functioning trajectories. Begun in 2011 with a sample representative of the Medicare population ages 65 and older who were interviewed in-person annually, the sample was replenished in 2015 to adjust for sample aging and loss to follow-up. The NSOC was a companion survey of the caregivers of NHATS sample persons receiving help with self-care, mobility or household activities. All caregivers (up to 5 per NHATS sample person) were included and interviewed by phone about various aspects of the caregiving experience. NSOC was conducted in both 2011 and 2015.
The study sample for the analyses was a national representative sample of Medicare populations who were ages 65 and older. To restore the sample to the original size by age and race/ethnicity groups, the 2015 NHATS introduced a new sample. Similar to the original 2011 NHATS cohort, this new sample used the same stratified three-stage sample design, and oversampled people who were ages 90 and older, and Black, non-Hispanic people. NHATS used individual counties or groups of counties as primary sampling units (PSUs), ZIP codes or ZIP code fragments within sampled PSUs as secondary sampling units (SSUs), and then selected a sample of beneficiaries within sampled SSUs who were ages 65 and older. In 2015, 8,334 sampled Medicare beneficiaries were interviewed, which yielded a weighted response rate of 76.3%. In the 2015 NHATS sample, 2,417 survey respondents were selected for the NSOC in 2015, and they had 5,212 eligible caregivers in total. Among eligible caregivers for the 2015 NSOC, contact information was obtained for 67.2% (3,501). Among those 3,501 caregivers, Community-Dwelling Older Adults with Dementia and Their Caregivers: Key Indicators from the National Health and Aging Trends Study Methodology 12 63.0% participated in NSOC, yielding a sample of 2,204 caregivers. The NHATS and NSOC questionnaires, and a detailed description of NHATS and NSOC sampling design, data collection, and procedures, are provided on the NHATS website (https://www.nhats.org/scripts/default.htm).
All estimates in this chartbook, except those shown in Figure 1-1, refer to older adults living in community settings, which were defined as living outside of nursing homes. In 2015, information from the NHATS sample person interviews was available for a small number of nursing home residents (e.g., those who were from the original 2011 cohort) but not all, so dementia status and other key indicators were not available for all nursing home residents. In addition, nursing home residents were not eligible for NSOC.
Dementia was defined in these analyses as probable dementia based on the NHATS dementia classification (Kasper et al., 2013). Older adults who did not fall into the probable dementia category were considered to have no dementia. The NHATS dementia classification draws information from: (1) self-reported doctor diagnosis of Alzheimer's disease or dementia; (2) a score on the AD8 Dementia Screening Interview by proxy respondents (Galvin et al., 2005); and (3) a cognition battery on older adults' memory, orientation, and executive function. The suggested NHATS classification by Kasper et al. includes no dementia, possible dementia, and probable dementia. Older adults who reported a diagnosis of dementia either by self or by proxy, older adults whose proxy respondents reported a score of 2 or higher in the AD8 interview, and older adults with impairment in at least two domains in the cognition battery were considered to have probable dementia. The classification used in NHATS was assessed for sensitivity and specificity in a sample of normal and diagnosed individuals and found to have reasonable sensitivity (65.7%) and good specificity (87.2%) for detecting a diagnosis of dementia (Langa et al., 2005; Kasper et al., 2013).
The analyses in this chartbook were cross-sectional descriptive analyses. To obtain national estimates, weighted estimates were further standardized to the Medicare population at the time the sample was drawn (Freeman et al., 2016). All the analyses were conducted in SAS® with appropriate survey procedures. Cases with missing data were excluded from the analyses on a variable-by-variable basis. Because estimates were rounded, individual weighted estimates may not sum to totals and percentages may not sum to 100%.
These analyses had some limitations. Given that cognitive functioning information was largely unavailable for older adults living in nursing homes in NHATS, nursing home residents were excluded from analyses. Although the nursing home population was 13 Community-Dwelling Older Adults with Dementia and Their Caregivers: Key Indicators from the National Health and Aging Trends Study Methodology a small component of the population ages 65 and older, an estimated 63% of the 1.2 million people living in nursing homes had moderate to severe dementia, based on a 2013 report from the Centers for Medicare & Medicaid Services (CMS, 2013). Nursing home residents also tended to have a greater level of disability compared to people living in community settings. The estimates presented in this chartbook were based on a healthier and less disabled population compared to the total population of older adults with Alzheimer's disease or dementia. Nonetheless, most people with disability or with dementia were not in nursing homes. In addition, like any survey data analyses, the results were subject to constraints of how survey questions were structured and how survey participants interpreted the questions.
1. POPULATION AND SOCIO-DEMOGRAPHIC CHARACTERISTICS OF OLDER ADULTS WITH DEMENTIA
This chapter presents estimates on population size and socio-demographic characteristics of older adults with dementia living in community settings. Older adults living in community settings were defined as people who are age 65 and older living outside of nursing homes.
-
In 2015, 4.0 million older adults had dementia in the United States, and 3.4 million of this population lived in community settings, which accounts for 8% of the communitydwelling older adult population in the United States.
-
More than half (63%) of older adults with dementia were 80 years old and older. The age group of 80-84 had the largest population with dementia.
-
The prevalence of dementia among older adults increased with age, from 2% among adults aged 65-69 to 33% among adults aged 90 and older.
-
Despite the similar prevalence across genders for those aged 75 and older, there were more women aged 75 and older living with dementia (1.6 million) than men (1.1 million).
-
In terms of race/ethnicity, older adults who were non-Hispanic White had lowest prevalence of dementia than other races or ethnicities.
-
On average, older adults who were married or living with partners had lower prevalence of dementia compared to older adults who were never married, separated, divorced, or widowed.
-
Dementia was more prevalent among older adults with lower educational attainment (18% for those who did not graduate high school vs. 4% for college graduates).
-
More than one-half (57%) of older adults with dementia had annual incomes below 200% of the 2015 FPL.
-
Across all asset types examined, older adults with dementia were less likely to hold assets compared to those without dementia.
-
Approximately one-third of older adults with dementia were living alone, followed closely by those living with others only (30%) and those living with a spouse or partner only (27%). Among older adults with dementia living alone, one-half of them were living in supportive care settings.
| FIGURE 1-1. Population Size by Dementia Status |
|---|
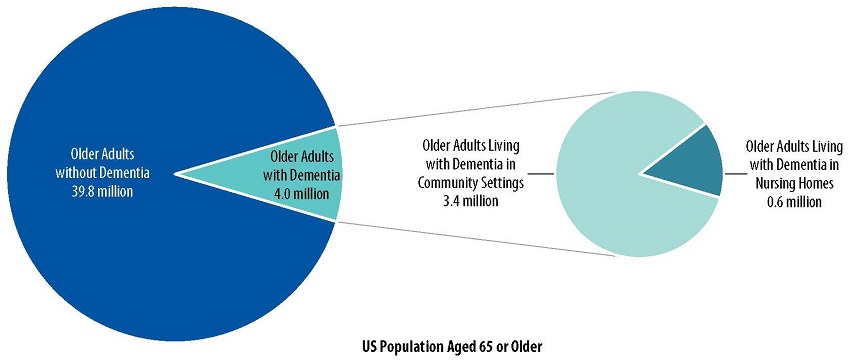 |
| NOTE: The NHATS did not measure dementia directly in nursing home residents. We made a conservative estimate that 50% of nursing home residents had dementia and 50% of them did not have dementia (Centers for Medicare & Medicaid Services [CMS], 2013). For the purposes of this chartbook, only individuals who met the criteria for the NHATS dementia classification (Kasper et al., 2013) of probable dementia were considered to have dementia. This was a conservative definition, because individuals with mild cognitive impairment or those with early stages of dementia (i.e., individuals with possible dementia) are likely to be classified as not having dementia. SOURCE: Analyses of 2015 NHATS data conducted by RTI International, 2017. |
Figure 1-1 presents the number of older adults with and without dementia in the United States in 2015.
-
An estimated 4.0 million older adults had dementia, compared to 39.8 million older adults who did not have dementia.
-
Of the estimated 4.0 million older adults with dementia, 3.4 million lived in community settings.
| FIGURE 1-2. Age-specific Dementia Prevalence |
|---|
![Bar Chart: Age 65-69 (2 [272,000]), Age 70-74 (4 [422,000]), Age 75-79 (8 [575,000]), Age 80-84 (15 [773,000]), Age 85-89 (21 [716,000]), Age 90+ (33 [626,000]).](/sites/default/files/private/images-reports-basic/260376/DemChartbook-fig1-2.jpg) |
| NOTE: For the purposes of this chartbook, only individuals who met the criteria for the NHATS dementia classification (Kasper et al., 2013) of probable dementia were considered to have dementia. This was a conservative definition, because individuals with mild cognitive impairment or those with early stages of dementia (i.e., individuals with possible dementia) are likely to be classified as not having dementia. The estimates presented in the chart were based on older adults living in community settings. Older adults living in nursing homes were excluded. SOURCE: Analyses of 2015 NHATS data conducted by RTI International, 2017. |
Figure 1-2 presents dementia prevalence and population size by age among older adults living in community settings in 2015.
-
The prevalence of dementia among older adults increased with age, from 2% among older adults aged 65-69 to 33% among older adults aged 90 and older.
-
More than half (63%) of older adults with dementia were 80 years old and older.
-
Approximately 773,000 older adults aged 80-84 had dementia. This age group had the largest population with dementia, followed by approximately 716,000 older adults aged 85-89 who had dementia.
| FIGURE 1-3. Dementia Prevalence by Gender and Age |
|---|
![Bar Chart: All--Men 8.2 [1,501,000], Women 8.2 [1,883,000]. Age 65-74--Men 3.9 [446,000], Women 2.0 [248,000]. Age 75-84--Men 10.4 [584,000], Women 10.7 [764,000]. Age 85+--Men 25.2 [472,000], Women 25.6 [871,000].](/sites/default/files/private/images-reports-basic/260376/DemChartbook-fig1-3.jpg) |
| NOTE: For the purposes of this chartbook, only individuals who met the criteria for the NHATS dementia classification (Kasper et al., 2013) of probable dementia were considered to have dementia. This was a conservative definition, because individuals with mild cognitive impairment or those with early stages of dementia (i.e., individuals with possible dementia) are likely to be classified as not having dementia. The estimates presented in the chart were based on older adults living in community settings. Older adults living in nursing homes were excluded. SOURCE: Analyses of 2015 NHATS data conducted by RTI International, 2017. |
Figure 1-3 presents dementia prevalence by gender and age among older adults living in community settings in 2015.
-
Across gender and age groups, approximately 8% of older adults had dementia.
-
Despite the similar prevalence across genders for those aged 75 and older, there were more women aged 75 and older living with dementia (1.6 million) than men (1.1 million).
| FIGURE 1-4. Dementia Prevalence by Race/Ethnicity and Age |
|---|
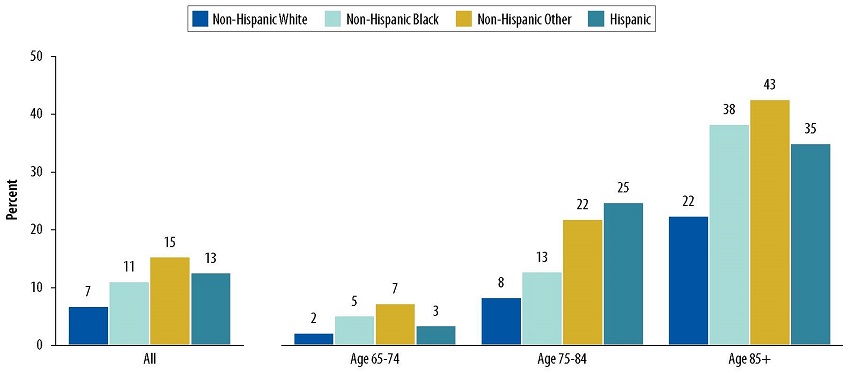 |
| NOTE: Non-Hispanic Other race/ethnicity included non-Hispanic American Indian, non-Hispanic Asian, non-Hispanic Native Hawaiian/Pacific Islander, and non-Hispanic Other Specified Race. For the purposes of this chartbook, only individuals who met the criteria for the NHATS dementia classification (Kasper et al., 2013) of probable dementia were considered to have dementia. This was a conservative definition, because individuals with mild cognitive impairment or those with early stages of dementia (i.e., individuals with possible dementia) are likely to be classified as not having dementia. The estimates presented in the chart were based on older adults living in community settings. Older adults living in nursing homes were excluded. SOURCE: Analyses of 2015 NHATS data conducted by RTI International, 2017. |
Figure 1-4 presents dementia prevalence by age and race/ethnicity among older adults living in community settings in 2015.
-
Non-Hispanic White older adults had the lowest dementia prevalence compared to other race/ethnicity groups across all ages.
| FIGURE 1-5. Dementia Prevalence by Marital Status and Age |
|---|
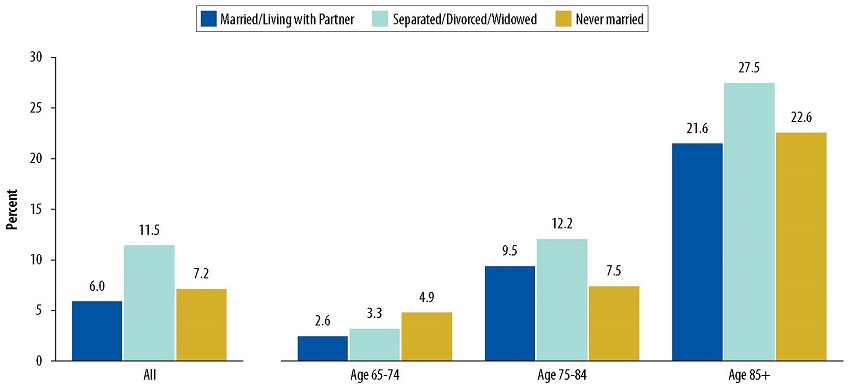 |
| NOTE: For the purposes of this chartbook, only individuals who met the criteria for the NHATS dementia classification (Kasper et al., 2013) of probable dementia were considered to have dementia. This was a conservative definition, because individuals with mild cognitive impairment or those with early stages of dementia (i.e., individuals with possible dementia) are likely to be classified as not having dementia. The estimates presented in the chart were based on older adults living in community settings. Older adults living in nursing homes were excluded. SOURCE: Analyses of 2015 NHATS data conducted by RTI International, 2017. |
Figure 1-5 presents dementia prevalence by marital status and age among older adults living in community settings in 2015.
-
On average, the prevalence of dementia was lower among older adults who were married or living with partners than among older adults who were never married, separated, divorced, or widowed.
-
Older adults who were separated, divorced, or widowed had the higher prevalence of dementia prevalence compared to those who were married, living with partners, or never married among older adults aged 75 and older.
| FIGURE 1-6. Dementia Prevalence by Educational Attainment and Age |
|---|
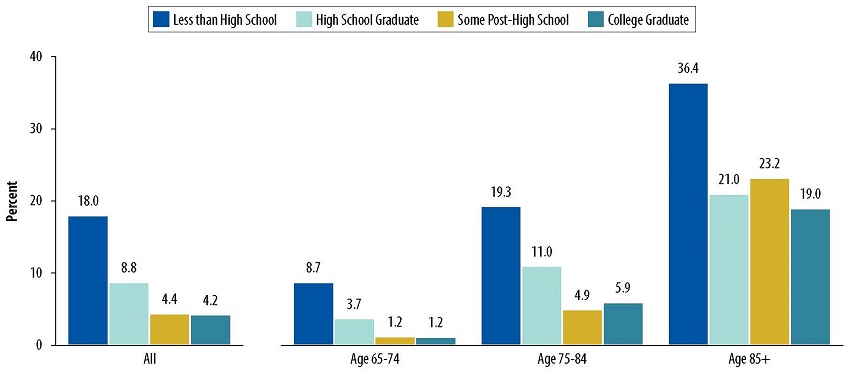 |
| NOTE: For the purposes of this chartbook, only individuals who met the criteria for the NHATS dementia classification (Kasper et al., 2013) of probable dementia were considered to have dementia. This was a conservative definition, because individuals with mild cognitive impairment or those with early stages of dementia (i.e., individuals with possible dementia) are likely to be classified as not having dementia. The estimates presented in the chart were based on older adults living in community settings. Older adults living in nursing homes were excluded. SOURCE: Analyses of 2015 NHATS data conducted by RTI International, 2017. |
Figure 1-6 displays dementia prevalence by various levels of educational attainment and age among older adults living in community settings in 2015.
-
Dementia was more prevalent among older adults with lower educational attainment (18% for those who did not graduate high school vs. 4% for college graduates).
-
The relative difference in dementia prevalence between older adults without a high school diploma and older adults with a college diploma reduced in older age groups. Older adults aged 65-74 without a high school diploma were seven times more likely to have dementia than those with a college diploma; older adults aged 85 and over without a high school diploma were approximately two times more likely to have dementia than those with a college diploma.
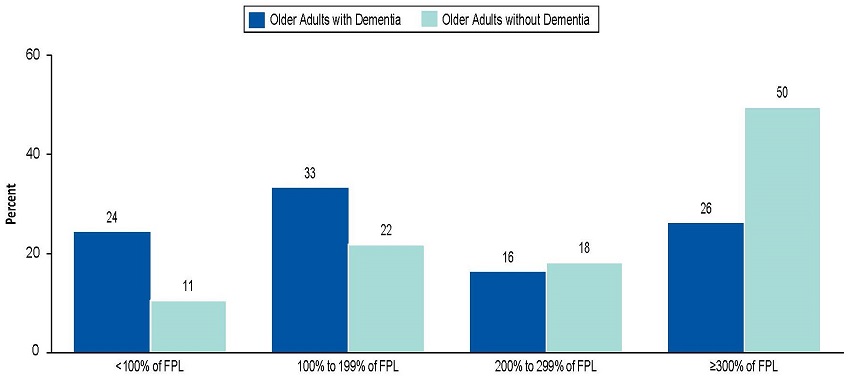
| FIGURE 1-7. Income Distribution among Older Adults with and without Dementia |
|---|
 |
| NOTE: The FPL was based on the 2015 poverty guidelines for the 48 contiguous states and the District of Columbia (https://aspe.hhs.gov/2015-poverty-guidelines). The percentages may not add up to exactly 100 due to rounding. For the purposes of this chartbook, only individuals who met the criteria for the NHATS dementia classification (Kasper et al., 2013) of probable dementia were considered to have dementia. This was a conservative definition, because individuals with mild cognitive impairment or those with early stages of dementia (i.e., individuals with possible dementia) are likely to be classified as not having dementia. The estimates presented in the chart were based on older adults living in community settings. Older adults living in nursing homes were excluded. SOURCE: Analyses of 2015 NHATS data conducted by RTI International, 2017. |
Figure 1-7 presents income distribution, categorized as a percent of the 2015 federal poverty level (FPL), among older adults living in community settings with and without dementia in 2015.
-
More than one-half (57%) of older adults with dementia had annual incomes below 200% of the FPL.
-
Conversely, one-half (50%) of older adults without dementia had annual incomes greater than or equal to 300% of the FPL.
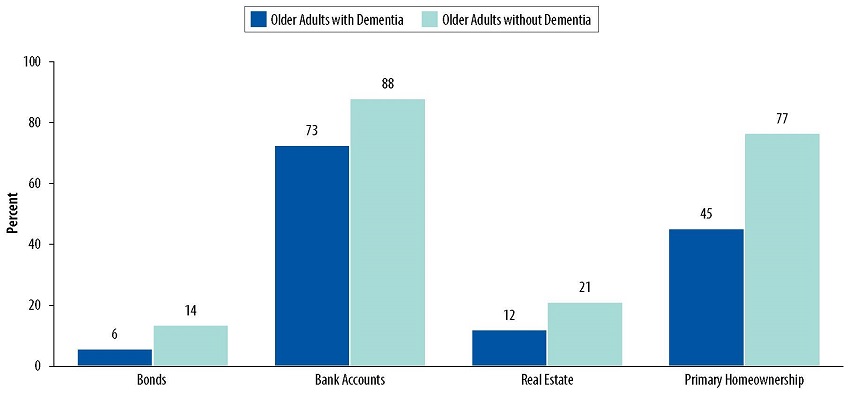
| FIGURE 1-8. Selected Asset Type Ownership by Dementia Status |
|---|
 |
| NOTE: For the purposes of this chartbook, only individuals who met the criteria for the NHATS dementia classification (Kasper et al., 2013) of probable dementia were considered to have dementia. This was a conservative definition, because individuals with mild cognitive impairment or those with early stages of dementia (i.e., individuals with possible dementia) are likely to be classified as not having dementia. The estimates presented in the chart were based on older adults living in community settings. Older adults living in nursing homes were excluded. Real Estate includes a business, farm, or other real estate besides a primary residence. Bank Accounts includes checking and savings accounts, or Certificates of Deposit. SOURCE: Analyses of 2015 NHATS data conducted by RTI International, 2017. |
Figure 1-8 presents types of assets held by older adults living in community settings with and without dementia in 2015.
-
For both groups, most older adults held bank accounts (73% vs. 88% for older adults with dementia and those without dementia, respectively).
-
Across all asset types examined, older adults with dementia were less likely to hold assets compared to those without dementia.
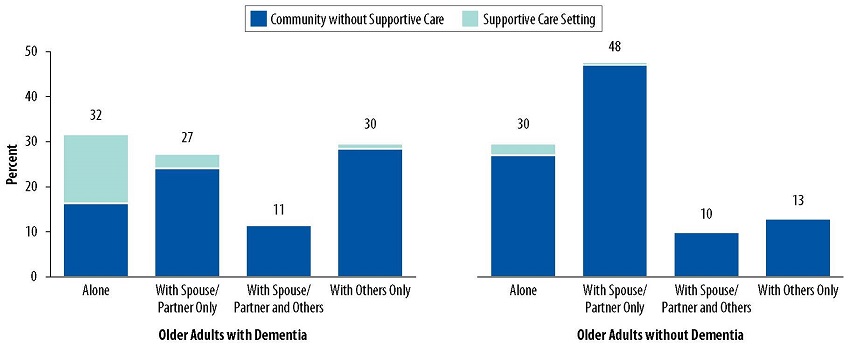
| FIGURE 1-9. Distribution of Living Arrangements among Older Adults with and without Dementia |
|---|
 |
| NOTE: Supportive care settings in NHATS were defined as housing in the community that offers services such as help with medications, self-care or meals. These settings included board and care homes, assisted living facilities, and continuing care retirement communities. Older adults who lived alone in supportive care settings may be living in a stand-alone apartment or single family home within continuing care retirement communities. Due to rounding, the percentages may not add up to exactly 100. For the purposes of this chartbook, only individuals who met the criteria for the NHATS dementia classification (Kasper et al., 2013) of probable dementia were considered to have dementia. This was a conservative definition, because individuals with mild cognitive impairment or those with early stages of dementia (i.e., individuals with possible dementia) are likely to be classified as not having dementia. The estimates presented in the chart were based on older adults living in community settings. Older adults living in nursing homes were excluded. SOURCE: Analyses of 2015 NHATS data conducted by RTI International, 2017. |
Figure 1-9 presents living arrangement of older adults living in community settings with and without dementia, as well as the proportion of them living in supportive care settings in 2015.
-
Approximately one-third of older adults with dementia were living alone, followed closely by those living with others (30%) and those living with a spouse/partner only (27%).
-
Comparatively, approximately one-half (48%) of older adults without dementia were living with a spouse or partner only, and 30% of older adults without dementia were living alone.
-
Among older adults with dementia living alone, one-half (49%) of them were in supportive care settings; whereas 9% of older adults without dementia living alone were in supportive care settings.
2. HEALTH STATUS OF OLDER ADULTS WITH DEMENTIA
This chapter provides estimates on chronic conditions, depressive symptoms, limitations in self-care, mobility, and household activities, and severity of impairment among community-dwelling older adults with and without dementia.
-
Approximately six in ten (59%) older adults with dementia had three or more chronic conditions.
-
Approximately one in four (24%) older adults with dementia reported having depressive symptoms.
-
Most (88%) older adults with dementia had limitations in at least one self-care, mobility, or household activity.
-
A majority (64%) of older adults with dementia needed assistance with two or more self-care or mobility activities.
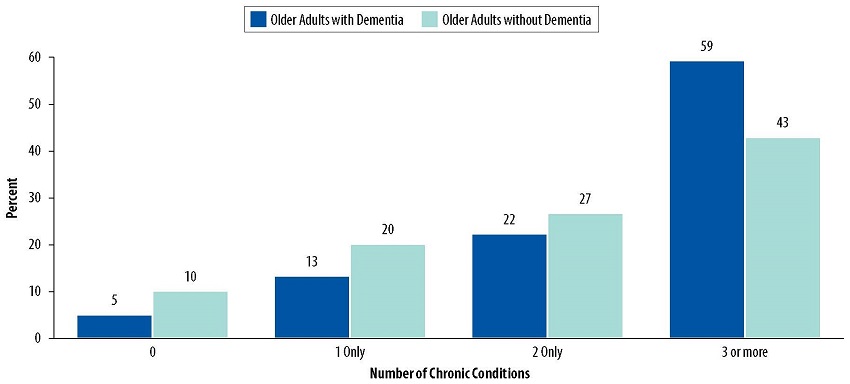
| FIGURE 2-1. Distribution of Chronic Conditions among Older Adults with and without Dementia |
|---|
 |
| NOTE: Dementia was not included in the list of chronic conditions examined. The chronic conditions examined included heart attack, heart disease including angina or congestive heart failure, hypertension, arthritis including osteoarthritis and rheumatoid arthritis, osteoporosis, diabetes, lung disease, stroke, and cancer. For the purposes of this chartbook, only individuals who met the criteria for the NHATS dementia classification (Kasper et al., 2013) of probable dementia were considered to have dementia. This was a conservative definition, because individuals with mild cognitive impairment or those with early stages of dementia (i.e., individuals with possible dementia) are likely to be classified as not having dementia. The estimates presented in the chart were based on older adults living in community settings. Older adults living in nursing homes were excluded. SOURCE: Analyses of 2015 NHATS data conducted by RTI International, 2017. |
Figure 2-1 presents the number of chronic conditions among older adults living in community settings with and without dementia in 2015.
-
A higher proportion of older adults with dementia had at least one chronic condition, compared to older adults without dementia.
-
The majority of older adults with dementia (59%) had three or more chronic conditions, whereas more than one-half (57%) of older adults without dementia had two or fewer chronic conditions.
| FIGURE 2-2. Prevalence of Depressive Symptoms, by Dementia Status |
|---|
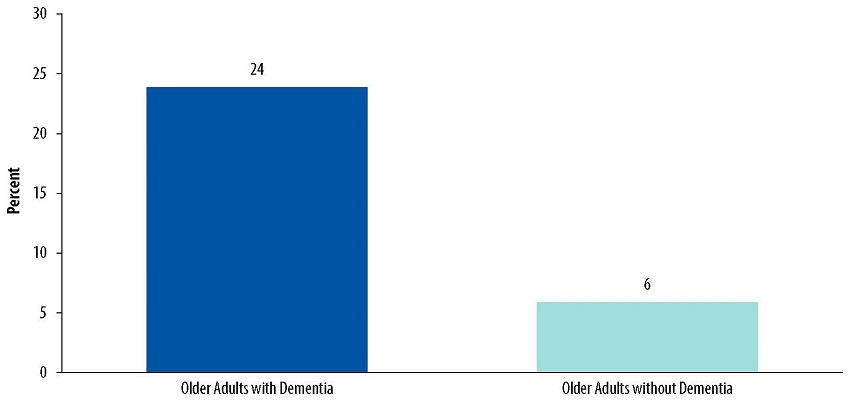 |
| NOTE: Depressive symptoms were measured by the Patient Health Questionnaire for Depression and Anxiety (PHQ-4). Older adults who had others respond to NHATS on their behalf were excluded from these analyses because PHQ-4 questions were not asked to proxy respondents. As a result, 57% of older adults with dementia and 99% of older adults without dementia in the 2015 NHATS sample were included in these analyses. Therefore, the estimate on dementia population shown in this chart was based on a population with less severe dementia. For the purposes of this chartbook, only individuals who met the criteria for the NHATS dementia classification (Kasper et al., 2013) of probable dementia were considered to have dementia. This was a conservative definition, because individuals with mild cognitive impairment or those with early stages of dementia (i.e., individuals with possible dementia) are likely to be classified as not having dementia. The estimates presented in the chart were based on older adults living in community settings. Older adults living in nursing homes were excluded. SOURCE: Analyses of 2015 NHATS data conducted by RTI International, 2017. |
Figure 2-2 presents the proportion of older adults living in community settings with and without dementia in 2015 who reported having depressive symptoms.
-
Approximately one in four of older adults with dementia reported having depressive symptoms, whereas only 6% of older adults without dementia reported having depressive symptoms.
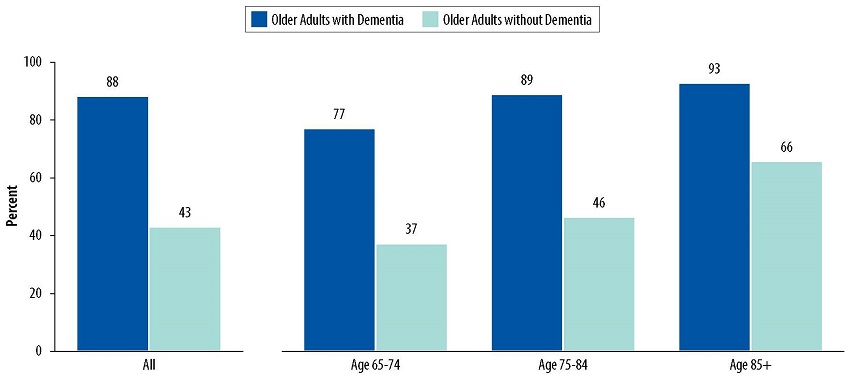
| FIGURE 2-3. Prevalence of Limitations in Self-Care, Mobility, and Household Activities, by Dementia Status and Age |
|---|
 |
| NOTE: For the purposes of this chartbook, only individuals who met the criteria for the NHATS dementia classification (Kasper et al., 2013) of probable dementia were considered to have dementia. This was a conservative definition, because individuals with mild cognitive impairment or those with early stages of dementia (i.e., individuals with possible dementia) are likely to be classified as not having dementia. The estimates presented in the chart were based on older adults living in community settings. Older adults living in nursing homes were excluded. SOURCE: Analyses of 2015 NHATS data conducted by RTI International, 2017. |
Figure 2-3 presents the proportion of older adults living in community settings in 2015 who had limitations in at least one self-care, mobility, or household activity, by dementia status and age.
-
Overall, the majority (88%) of older adults with dementia had limitations in at least one self-care, mobility, or household activity, while less than one-half (43%) of older adults without dementia had limitations.
-
As their age increased, older adults with and without dementia reflected similar trends of increasing prevalence of limitations in any self-care, mobility, or household activity. However, older adults with dementia had consistently higher prevalence of limitations compared to those without dementia across all ages.
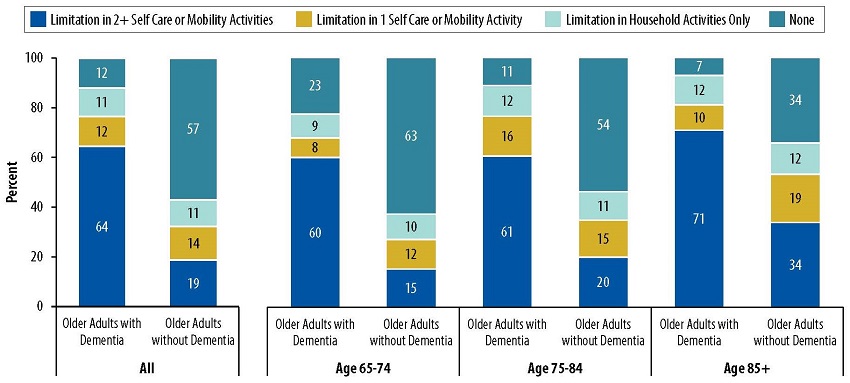
| FIGURE 2-4. Distribution of Impairment Severity among Older Adults with and without Dementia |
|---|
 |
| NOTE: The percentages may not add up to exactly 100 due to rounding. For the purposes of this chartbook, only individuals who met the criteria for the NHATS dementia classification (Kasper et al., 2013) of probable dementia were considered to have dementia. This was a conservative definition, because individuals with mild cognitive impairment or those with early stages of dementia (i.e., individuals with possible dementia) are likely to be classified as not having dementia. The estimates presented in the chart were based on older adults living in community settings. Older adults living in nursing homes were excluded. SOURCE: Analyses of 2015 NHATS data conducted by RTI International, 2017. |
Figure 2-4 presents the distribution of impairment severity by age among older adults living in community settings with and without dementia in 2015.
-
Overall, a majority (64%) of older adults with dementia needed assistance with two or more self-care or mobility activities.
3. CARE RECEIVED BY OLDER ADULTS WITH DEMENTIA
This chapter presents estimates on both paid and unpaid care received in the previous month by community-dwelling older adults with and without dementia, as measured by the amount of care received and the size of the care network.
-
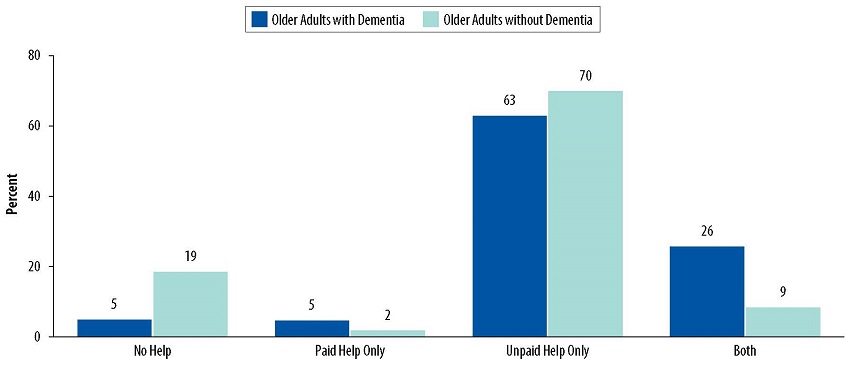
Nearly all (95%) older adults with dementia received some sort of assistance. More than half (63%) of them relied on unpaid help exclusively, followed by a combination of paid and unpaid assistance (26%), and paid assistance exclusively (5%).
-
Among community-dwelling older adults who received care, older adults with dementia received more than twice as many total hours of paid and unpaid care per month as those without dementia.
-
Most (70%) older adults with dementia received assistance from two or more caregivers.
| FIGURE 3-1. Distribution of Assistance Received among Older Adults with and without Dementia |
|---|
 |
| NOTE: Assistance received by older adults included assistance with self-care, mobility, household activities, transportation, health care system interaction, and health/medical care. For the purposes of this chartbook, only individuals who met the criteria for the NHATS dementia classification (Kasper et al., 2013) of probable dementia were considered to have dementia. This was a conservative definition, because individuals with mild cognitive impairment or those with early stages of dementia (i.e., individuals with possible dementia) are likely to be classified as not having dementia. The estimates presented in the chart were based on older adults living in community settings. Older adults living in nursing homes were excluded. SOURCE: Analyses of 2015 NHATS data conducted by RTI International, 2017. |
Figure 3-1 presents the distribution of types of assistance received by older adults among older adults living in community settings with and without dementia in 2015.
-
A higher proportion of older adults with dementia received some sort of assistance (95%) than older adults without dementia (81%).
-
Overall, regardless of dementia status, most older adults relied on unpaid help exclusively (63% vs. 70% for older adults with and without dementia, respectively).
-
Older adults with dementia more often relied on either paid assistance exclusively (5%) or a combination of paid and unpaid assistance (26%), compared to older adults without dementia (2% and 9%, respectively).
| FIGURE 3-2. Amount of Care Received by Older Adults, by Dementia Status |
|---|
 |
| NOTE: For the purposes of this chartbook, only individuals who met the criteria for the NHATS dementia classification (Kasper et al., 2013) of probable dementia were considered to have dementia. This was a conservative definition, because individuals with mild cognitive impairment or those with early stages of dementia (i.e., individuals with possible dementia) are likely to be classified as not having dementia. The estimates presented in the chart were based on older adults living in community settings. Older adults living in nursing homes were excluded. Only adults receiving more than one hour of care in the previous month were included in these analyses. SOURCE: Analyses of 2015 NHATS data conducted by RTI International, 2017. |
Figure 3-2 presents average hours of paid and unpaid assistance per month among community-dwelling older adults with and without dementia who received care in 2015.
-
Among community-dwelling older adults who received care, older adults with dementia received more than twice as many total hours of paid and unpaid care per month as those without dementia.
-
Older adults with dementia received approximately three times as many hours of paid assistance per month compared to those without dementia (146 hours vs. 47 hours, respectively).
-
Older adults with dementia received approximately twice as many hours of unpaid assistance per month compared to those without dementia (127 hours vs. 58 hours, respectively).
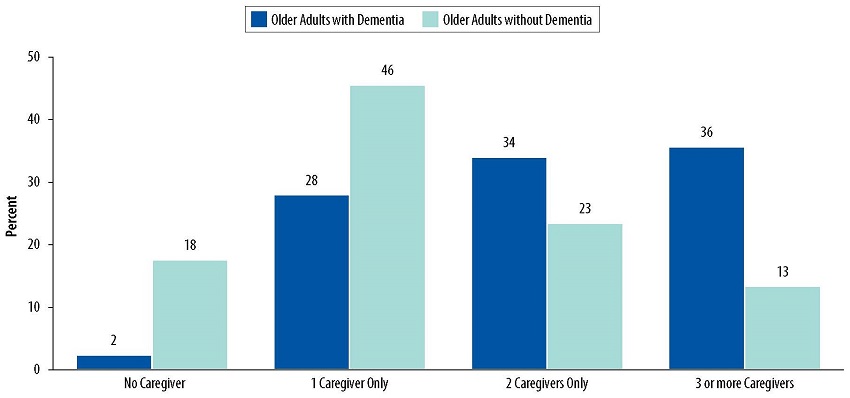
| FIGURE 3-3. Size of OIder Adults' Care Network by Dementia Status |
|---|
 |
| NOTE: For the purposes of this chartbook, only individuals who met the criteria for the NHATS dementia classification (Kasper et al., 2013) of probable dementia were considered to have dementia. This was a conservative definition, because individuals with mild cognitive impairment or those with early stages of dementia (i.e., individuals with possible dementia) are likely to be classified as not having dementia. The estimates presented in the chart were based on older adults living in community settings. Older adults living in nursing homes were excluded. SOURCE: Analyses of 2015 NHATS data conducted by RTI International, 2017. |
Figure 3-3 presents the number of caregivers providing assistance to older adults living in community settings with and without dementia in 2015.
-
Most (70%) older adults with dementia received assistance from two or more caregivers.
-
36% of older adults with dementia received assistance from three or more caregivers, compared to 13% of those without dementia.
-
28% of older adults with dementia received assistance from just one caregiver, compared to 46% of those without dementia.
4. POPULATION AND SOCIO-DEMOGRAPHIC CHARACTERISTICS OF INFORMAL CAREGIVERS OF OLDER ADULTS WITH DEMENTIA
This chapter focuses on informal caregivers who cared for community-dwelling older adults with dementia, and provides estimates on population size and sociodemographic characteristics.
-
An estimated 21.6 million informal caregivers provided care to older adults living in community settings.
-
Although approximately 8% of older adults living in community settings had dementia, 27% of all informal caregivers provided care to them, which accounts for an estimated 5.7 million informal caregivers.
-
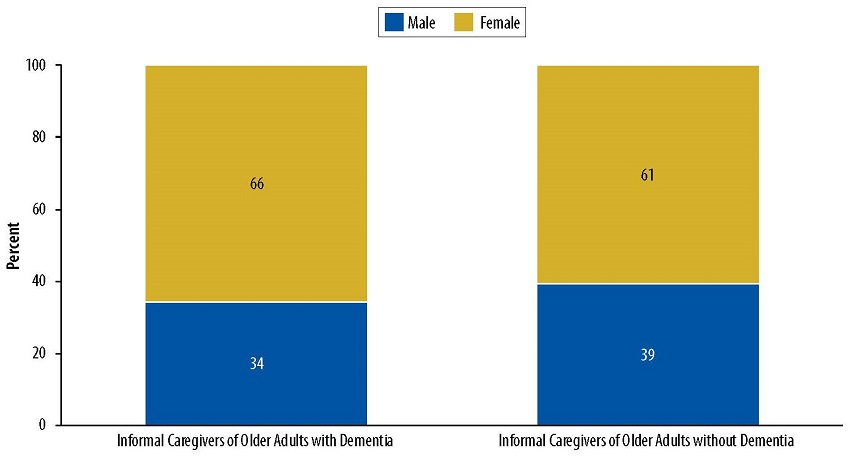
Two-thirds of informal caregivers of older adults with dementia were female.
-
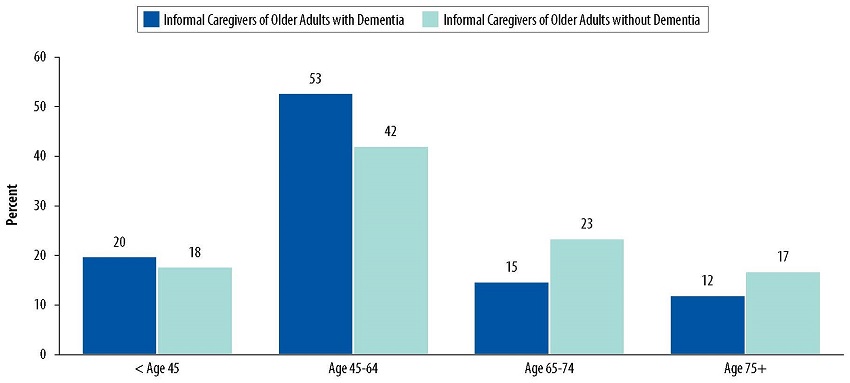
The majority (73%) of informal caregivers of older adults with dementia were younger than age 65.
-
One in two informal caregivers (55%) of older adults with dementia were the children of those they provided care for. In particular, 34% were the daughters and 21% were the sons of those they provided cared for.
| FIGURE 4-1. Informal Caregiver Population Size by Older Adults' Dementia Status |
|---|
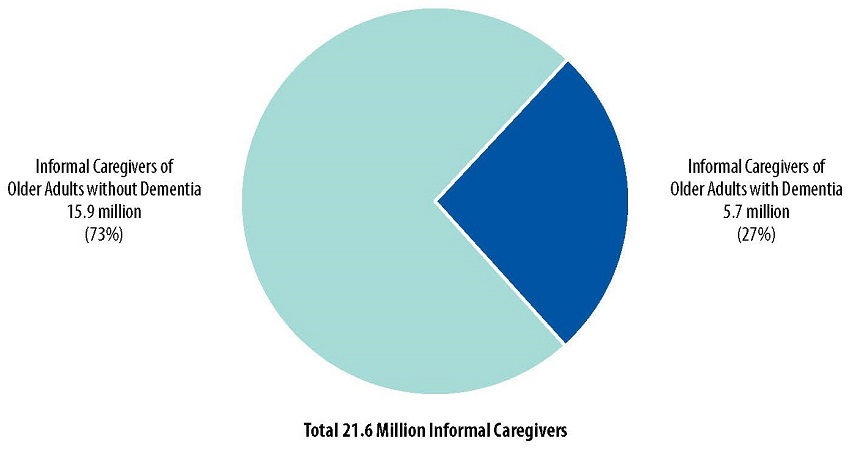 |
| NOTE: For the purposes of this chartbook, only individuals who met the criteria for the NHATS dementia classification (Kasper et al., 2013) of probable dementia were considered to have dementia. This was a conservative definition, because individuals with mild cognitive impairment or those with early stages of dementia (i.e., individuals with possible dementia) are likely to be classified as not having dementia. The estimates presented in the chart were based on older adults living in community settings. Older adults living in nursing homes were excluded. SOURCE: Analyses of 2015 NHATS and NSOC data conducted by RTI International, 2017. |
Figure 4-1 presents the number of informal caregivers for older adults living in community settings with and without dementia in 2015.
-
An estimated 21.6 million informal caregivers provided care to older adults living in community settings.
-
Although approximately 8% of older adults living in community settings had dementia, 27% of all informal caregivers provided care to them, which accounts for an estimated 5.7 million informal caregivers.
-
On average, every older adult with dementia had 1.7 informal caregivers who provided assistance, compared to 0.4 informal caregivers for every older adult without dementia.
| FIGURE 4-2. Informal Caregivers' Gender by Older Adults' Dementia Status |
|---|
 |
| NOTE: For the purposes of this chartbook, only individuals who met the criteria for the NHATS dementia classification (Kasper et al., 2013) of probable dementia were considered to have dementia. This was a conservative definition, because individuals with mild cognitive impairment or those with early stages of dementia (i.e., individuals with possible dementia) are likely to be classified as not having dementia. The estimates presented in the chart were based on older adults living in community settings. Older adults living in nursing homes were excluded. SOURCE: Analyses of 2015 NHATS and NSOC data conducted by RTI International, 2017. |
Figure 4-2 displays gender of informal caregivers who provided care to older adults living in community settings with and without dementia in 2015.
-
Over 60% of informal caregivers of older adults were women.
-
Informal caregivers of older adults with dementia were slightly more likely be women compared to informal caregivers of older adults without dementia (66% vs. 61%, respectively).
| FIGURE 4-3. Distribution of Informal Caregivers' Age among Older Adults with and without Dementia |
|---|
 |
| NOTE: The percentages may not add up to exactly 100 due to rounding. For the purposes of this chartbook, only individuals who met the criteria for the NHATS dementia classification (Kasper et al., 2013) of probable dementia were considered to have dementia. This was a conservative definition, because individuals with mild cognitive impairment or those with early stages of dementia (i.e., individuals with possible dementia) are likely to be classified as not having dementia. The estimates presented in the chart were based on older adults living in community settings. Older adults living in nursing homes were excluded. SOURCE: Analyses of 2015 NHATS and NSOC data conducted by RTI International, 2017. |
Figure 4-3 displays age of informal caregivers who provided care to older adults living in community settings with and without dementia in 2015.
-
The majority of informal caregivers of older adults were 45 years old and older.
-
Informal caregivers of older adults with dementia were more likely to be younger than age 65 compared to informal caregivers of older adults without dementia (73% vs. 60%, respectively).
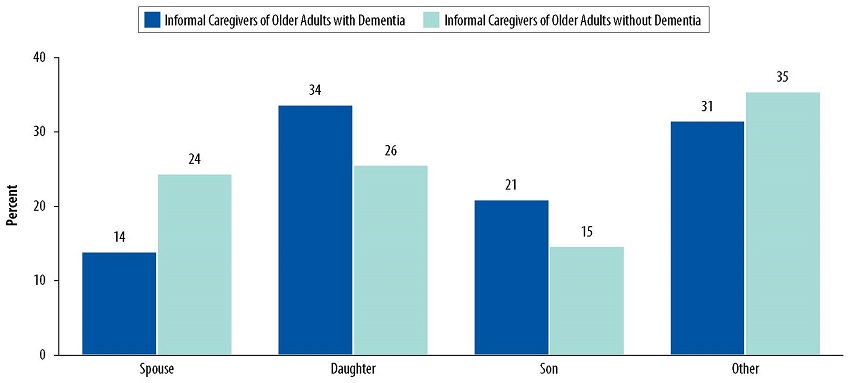
| FIGURE 4-4. Distribution of Informal Caregivers' Relationship to Older Adults with and without Dementia |
|---|
 |
| NOTE: The percentages may not add up to exactly 100 due to rounding. For the purposes of this chartbook, only individuals who met the criteria for the NHATS dementia classification (Kasper et al., 2013) of probable dementia were considered to have dementia. This was a conservative definition, because individuals with mild cognitive impairment or those with early stages of dementia (i.e., individuals with possible dementia) are likely to be classified as not having dementia. The estimates presented in the chart were based on older adults living in community settings. Older adults living in nursing homes were excluded. SOURCE: Analyses of 2015 NHATS and NSOC data conducted by RTI International, 2017. |
Figure 4-4 displays the relationship of informal caregivers to the older adults in their care, among older adults living in community settings with and without dementia in 2015.
-
Approximately one in two informal caregivers (55%) of older adults with dementia were the children of those they provided care for. In particular, 34% were the daughters and 21% were the sons of those they provided cared for.
-
Only two in five informal caregivers (41%) of older adults without dementia were the children of those they provided care for.
-
A higher proportion of informal caregivers of older adults without dementia were their spouse, compared to informal caregivers of those with dementia (24% vs. 14%, respectively).
5. HEALTH STATUS OF INFORMAL CAREGIVERS OF OLDER ADULTS WITH DEMENTIA
This chapter describes self-rated health and self-reported depressive symptoms by informal caregivers who cared for community-dwelling older adults with and without dementia.
-
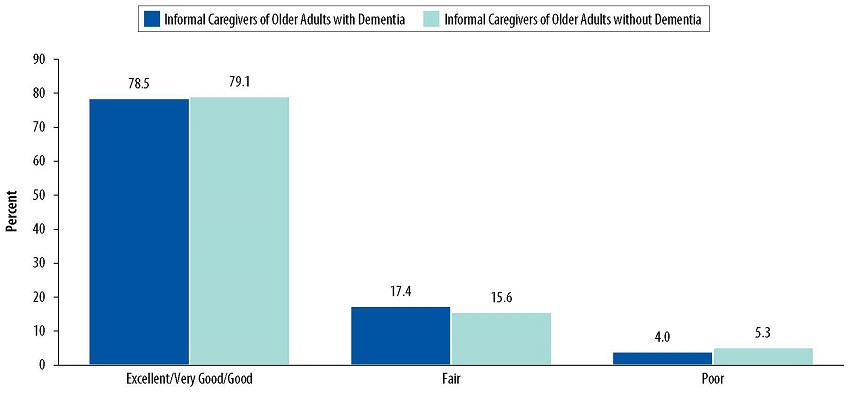
Approximately four in five (79%) informal caregivers of older adults with dementia self-rated their health status as excellent, very good, or good.
-
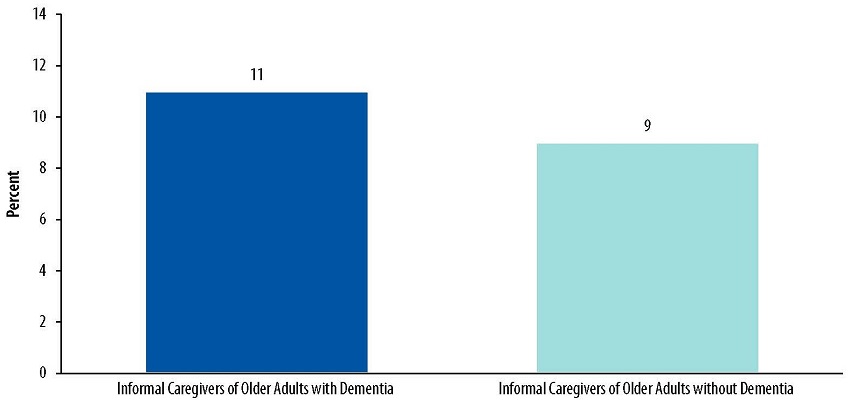
Approximately 11% of informal caregivers of older adults with dementia reported having depressive symptoms.
| FIGURE 5-1. Distribution of Self-Rated Health Status of Informal Caregivers, by Older Adults' Dementia Status |
|---|
 |
| NOTE: For the purposes of this chartbook, only individuals who met the criteria for the NHATS dementia classification (Kasper et al., 2013) of probable dementia were considered to have dementia. This was a conservative definition, because individuals with mild cognitive impairment or those with early stages of dementia (i.e., individuals with possible dementia) are likely to be classified as not having dementia. The estimates presented in the chart were based on older adults living in community settings. Older adults living in nursing homes were excluded. SOURCE: Analyses of 2015 NHATS and NSOC data conducted by RTI International, 2017. |
Figure 5-1 displays self-rated health in categories of informal caregivers who provided care to older adults living in community settings with and without dementia in 2015.
-
There was no substantial difference in the proportion of informal caregivers reported in all categories of self-rated health status between caregivers assisting older adults with dementia and those assisting older adults without dementia.
-
Approximately four in five informal caregivers self-rated their health status as excellent, very good, or good in both groups.
| FIGURE 5-2. Prevalence of Depressive Symptoms among Informal Caregivers, by Older Adults' Dementia Status |
|---|
 |
| NOTE: Depressive symptoms were measured by the Patient Health Questionnaire for Depression and Anxiety (PHQ-4). PHQ-4 measures the presence of depressive symptoms and is not necessarily indicative of medical diagnosis for depression or severity of depression. For the purposes of this chartbook, only individuals who met the criteria for the NHATS dementia classification (Kasper et al., 2013) of probable dementia were considered to have dementia. This was a conservative definition, because individuals with mild cognitive impairment or those with early stages of dementia (i.e., individuals with possible dementia) are likely to be classified as not having dementia. The estimates presented in the chart were based on older adults living in community settings. Older adults living in nursing homes were excluded. SOURCE: Analyses of 2015 NHATS and NSOC data conducted by RTI International, 2017. |
Figure 5-2 displays the proportion of informal caregivers providing care to older adults living in community settings with and without dementia in 2015 who reported depressive symptoms.
-
Approximately 11% of informal caregivers of older adults with dementia reported depressive symptoms, compared to 9% of their counterparts assisting older adults without dementia.
6. INFORMAL CAREGIVER ASSISTANCE TO OLDER ADULTS WITH DEMENTIA
This chapter provides estimates on the amount and types of care provided by informal caregivers and the impact of caregiving on informal caregivers.
-
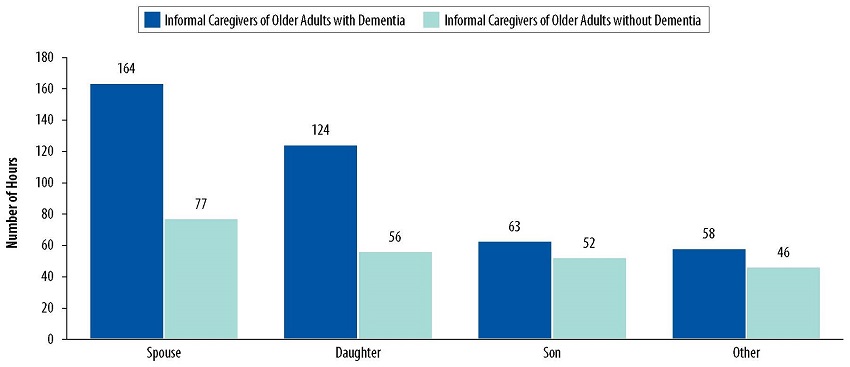
Informal caregivers who were the daughters and spouses of older adults with dementia provided twice as many monthly hours of care than informal caregivers who were the daughters and spouses of older adults without dementia.
-
While more daughters provided care to older adults with dementia than spouses (34% vs. 14%, respectively), on average, spouses provided more hours of care per month than daughters (164 vs. 124 hours, respectively).
-
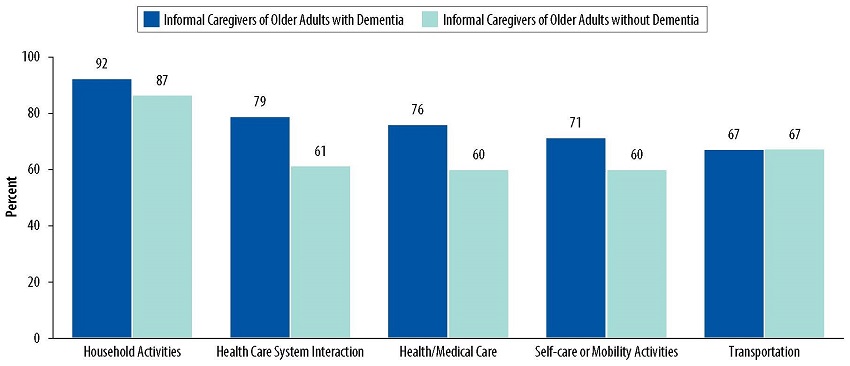
Nearly all (92%) informal caregivers of older adults with dementia assisted in household activities and approximately four in five (79%) informal caregivers of older adults with dementia assisted in health care system interactions.
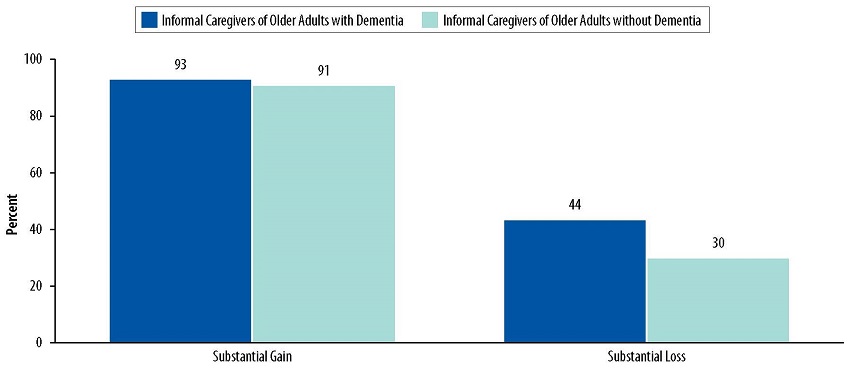
-
Over 90% of caregivers of older adults with dementia reported substantial gains (i.e., positive aspects of caregiving), and 44% of them reported substantial losses (i.e., negative aspects of caregiving).
-
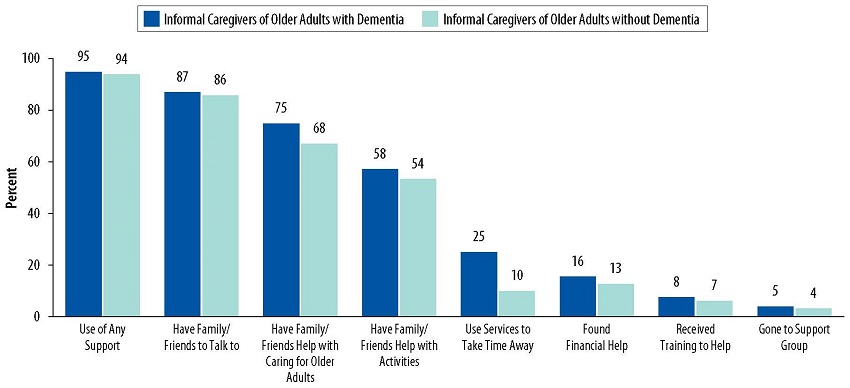
Nearly all (95%) informal caregivers of older adults with dementia received some support themselves. The three most commonly reported types of support were support from family and friends, such as having family or friends to talk to; having family or friends help with caring for older adults; and having family or friends help with activities.
-
Overall, informal caregivers assisting older adults with dementia experienced twice as much work productivity loss compared to informal caregivers assisting older adults without dementia (approximately 4.2% vs. 2.3%, respectively).
-
Among informal caregivers assisting older adults with dementia, daughters had the greatest work productivity loss (8%).
| FIGURE 6-1. Monthly Amount of Informal Care Provided by Informal Caregivers, by Older Adults' Dementia Status |
|---|
 |
| NOTE: For the purposes of this chartbook, only individuals who met the criteria for the NHATS dementia classification (Kasper et al., 2013) of probable dementia were considered to have dementia. This was a conservative definition, because individuals with mild cognitive impairment or those with early stages of dementia (i.e., individuals with possible dementia) are likely to be classified as not having dementia. The estimates presented in the chart were based on older adults living in community settings. Older adults living in nursing homes were excluded. SOURCE: Analyses of 2015 NHATS and NSOC data conducted by RTI International, 2017. |
Figure 6-1 displays informal caregivers' monthly average hours of care provided to older adults living in community settings with and without dementia in 2015, by relationship between the informal caregiver(s) and the older adults in their care.
-
Overall, informal caregivers of older adults with dementia provided more care than informal caregivers of older adults without dementia, across all relationships.
-
Informal caregivers who were daughters and spouses of older adults with dementia provided twice as many monthly hours of care than informal caregivers who were daughters and spouses of older adults without dementia.
-
While more daughters provided care to older adults with dementia than spouses (34% vs. 14%, respectively), on average, spouses provided more hours of care per month than daughters (164 vs. 124 hours, respectively).
| FIGURE 6-2. Types of Assistance Provided by Informal Caregivers, by Older Adults' Dementia Status |
|---|
 |
| NOTE: For the purposes of this chartbook, only individuals who met the criteria for the NHATS dementia classification (Kasper et al., 2013) of probable dementia were considered to have dementia. This was a conservative definition, because individuals with mild cognitive impairment or those with early stages of dementia (i.e., individuals with possible dementia) are likely to be classified as not having dementia. The estimates presented in the chart were based on older adults living in community settings. Older adults living in nursing homes were excluded. SOURCE: Analyses of 2015 NHATS and NSOC data conducted by RTI International, 2017. |
Figure 6-2 displays the proportion of caregivers of older adults living in community settings with and without dementia in 2015 who were engaged in particular types of assistance, by older adults' dementia status.
-
In all categories except transportation services, a higher proportion of informal caregivers of older adults with dementia provided care than informal caregivers of older adults without dementia.
-
Nearly all (92%) informal caregivers of older adults with dementia assisted in household activities, slightly higher than informal caregivers of older adults without dementia (87%).
-
Approximate four of every five (79%) informal caregivers of older adults with dementia assisted in interacting with the health care system, compared to three of every five (61%) informal caregivers of older adults without dementia.
| FIGURE 6-3. Impact of Informal Caregiving on Informal Caregivers, by Older Adults' Dementia Status |
|---|
 |
| NOTE: For the purposes of this chartbook, only individuals who met the criteria for the NHATS dementia classification (Kasper et al., 2013) of probable dementia were considered to have dementia. This was a conservative definition, because individuals with mild cognitive impairment or those with early stages of dementia (i.e., individuals with possible dementia) are likely to be classified as not having dementia. The estimates presented in the chart were based on older adults living in community settings. Older adults living in nursing homes were excluded. SOURCE: Analyses of 2015 NHATS and NSOC data conducted by RTI International, 2017. |
Figure 6-3 displays the proportion of informal caregivers providing care to older adults living in community settings with and without dementia in 2015 who reported substantial gains or losses from providing informal caregiving. Substantial gains included reporting feeling more confident about their abilities, learning to deal with difficult situations, feeling closer to care recipient, or satisfaction with the care. Substantial losses included reporting being exhausted when they went to bed, having more things than they could handle, not having time for themselves, or changes to the recipients needs just when they settled into a routine.
-
Among both informal caregivers of older adults with and without dementia, over 90% reported substantial gains.
-
A higher proportion of informal caregivers of older adults with dementia reported substantial losses (44%) compared to informal caregivers of older adults without dementia (30%).
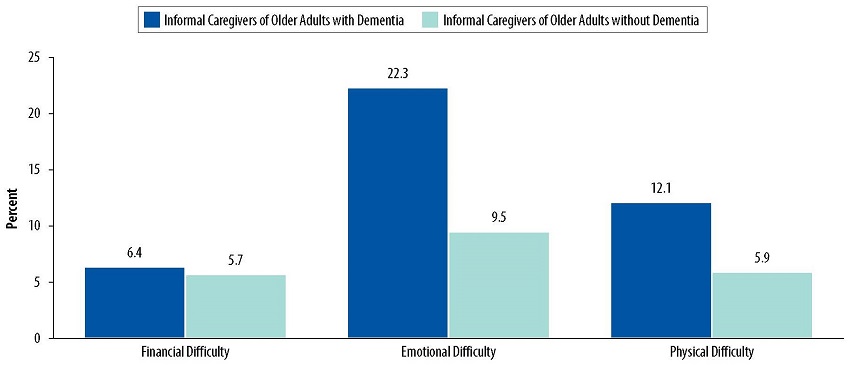
| FIGURE 6-4. Difficulties Experienced by Informal Caregivers, by Older Adults' Dementia Status |
|---|
 |
| NOTE: For the purposes of this chartbook, only individuals who met the criteria for the NHATS dementia classification (Kasper et al., 2013) of probable dementia were considered to have dementia. This was a conservative definition, because individuals with mild cognitive impairment or those with early stages of dementia (i.e., individuals with possible dementia) are likely to be classified as not having dementia. The estimates presented in the chart were based on older adults living in community settings. Older adults living in nursing homes were excluded. SOURCE: Analyses of 2015 NHATS and NSOC data conducted by RTI International, 2017. |
Figure 6-4 displays the proportion of informal caregivers to older adults living in community settings with and without dementia in 2015 who reported financial, emotional, or physical difficulties from providing informal caregiving.
-
Approximately 22.3% of informal caregivers of older adults with dementia reported emotional difficulty, compared to 9.5% of informal caregivers of older adults without dementia.
-
The proportion of informal caregivers reporting physical difficulty was twice as high for those assisting adults with dementia (12.1%) than informal caregivers of older adults without dementia (5.9%).
-
There was no substantial difference between informal caregivers of adults with or without dementia reporting financial difficulty (6.4% and 5.7%, respectively).
| FIGURE 6-5. Supportive Environment for Informal Caregivers, by Older Adults' Dementia Status |
|---|
 |
| NOTE: For the purposes of this chartbook, only individuals who met the criteria for the NHATS dementia classification (Kasper et al., 2013) of probable dementia were considered to have dementia. This was a conservative definition, because individuals with mild cognitive impairment or those with early stages of dementia (i.e., individuals with possible dementia) are likely to be classified as not having dementia. The estimates presented in the chart were based on older adults living in community settings. Older adults living in nursing homes were excluded. SOURCE: Analyses of 2015 NHATS and NSOC data conducted by RTI International, 2017. |
Figure 6-5 displays the proportion of informal caregivers of older adults living in community settings with and without dementia in 2015 who reported receiving different types of support for informal caregiving.
-
Nearly all informal caregivers received some support (95% for with dementia and 94% for without dementia).
-
The three most commonly reported types of support were from family and friends for both informal caregivers of older adults with and without dementia. These were having family/friends to talk to (87% for with dementia vs. 86% for without dementia); having family/friends help with caring older adults (75% for with dementia, vs. 68% for without dementia); and having family/friends help with activities (58% for with dementia, vs. 54% for without dementia).
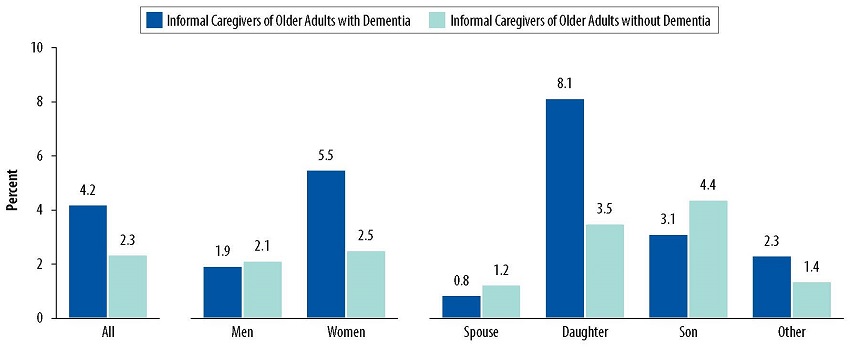
| FIGURE 6-6. Work Productivity Loss Experienced by Informal Caregivers, by Older Adults' Dementia Status |
|---|
 |
| NOTE: The measure of work productivity loss incorporated absenteeism, defined as missed hours of work because of caregiving in relation to typical hours worked, and presenteeism, defined as effect of caregiving on productivity when at work. Work productivity loss was measured as a percentage equal to [absenteeism + (% of time worked x presenteeism)] x 100. It was calculated using instructions and SAS codes provided in Wolff (2016). For the purposes of this chartbook, only individuals who met the criteria for the NHATS dementia classification (Kasper et al., 2013) of probable dementia were considered to have dementia. This was a conservative definition, because individuals with mild cognitive impairment or those with early stages of dementia (i.e., individuals with possible dementia) are likely to be classified as not having dementia. The estimates presented in the chart were based on older adults living in community settings. Older adults living in nursing homes were excluded. SOURCE: Analyses of 2015 NHATS and NSOC data conducted by RTI International, 2017. |
Figure 6-6 displays work productivity loss from providing informal caregiving among informal caregivers of older adults living in community settings with and without dementia in 2015.
-
Overall, informal caregivers assisting older adults with dementia experienced twice as much work productivity loss compared to informal caregivers assisting older adults without dementia (4.2% vs. 2.3%, respectively).
-
Women informal caregivers assisting older adults with dementia experienced more work productivity loss than women informal caregivers assisting older adults without dementia (5.5% vs. 2.5%, respectively).
-
Among informal caregivers assisting older adults with dementia, daughters had the greatest work productivity loss (8.1%). In comparison, among informal caregivers of older adults without dementia, sons had the greatest work productivity loss (4.4%).
Definitions
Dementia: Older adults who were considered as having probable dementia based on the NHATS dementia classification. According to the NHATS dementia classification, older adults with probable dementia met at least one of the following criteria: (1) had a diagnosis of dementia or Alzheimer's disease; (2) met the AD8 criteria (administered to proxy) if there was no diagnosis reported; or (3) had scores 1.5 SD below the mean of self-respondents in at least two of the domains of orientation, memory, or executive functioning.
Depressive symptoms: Depressive symptoms were measured by the Patient Health Questionnaire for Depression and Anxiety (PHQ-4). Response sets used for assessing the level of depressive symptoms were "nearly every day" (3), "more than half the days" (2), "several days" (1), or "not at all" (0). A sum score of 6 or higher across the four items was considered indicative of depressive symptoms (Lowe et al., 2010).
Difficulties with caregiving: Caregivers were asked whether they have difficulty with financial, emotional, or physical caregiving tasks. If they responded yes, they were asked to rate the level of difficulty on a scale of 1 (a little difficult) to 5 (very difficult). Scores of 4 to 5 were indicative of substantial difficulty.
Educational attainment: Older adults were asked about the highest degree or level of school completed.
Health/medical care (Figure 6-2): Help given to older adults such as assistance with diet, exercise, tooth care, foot care, skin wound care, tracking medications, giving injections, managing medical tasks such as ostomy care, IV therapy assistance, or blood tests.
Health system interactions (Figure 6-2): Help given to older adults such as assistance with appointments and communications with health care and insurance providers.
Hours of care provided: Caregivers were asked about the number of days per week or month and the number of hours per day spent helping older adults in the last month in the NHATS sample. For caregivers who provided care on a regular schedule, hours of care were calculated using the following formula: hours of care = 4 x number of days provided care per week x number of hours per day of help provided. For caregivers who provided care on a varied schedule, hours of care were calculated as the product of number of days provided care in last month and number of hours per day of help provided. These calculated hours of care were verified by caregivers during the survey. If the calculated hours of care were not verified by caregivers, then hours of care were estimated using the hours of care that were self-reported by caregivers.
Hours of care received: Older adults were asked about the number of days per week or month and the number of hours per day of help provided in the last month for each helper identified as providing assistance with mobility, transportation, household activities, self-care activities, and medical care activities. Hours of care were summed over all helpers and additionally were broken down by paid and unpaid helpers. Hours of care were imputed for those with missing values. We used the NHATS round 5 derived hours of care variable, which was computed based on the methodology listed in Freedman et al. (2014).
Household activities: Household activities corresponded to a subset of instrumental activities of daily living and included laundry, preparing hot meals, shopping for personal items, paying bills/banking, and handling medications.
Informal caregiver: A family member or unpaid non-relative who helped an older adult in the NHATS sample with mobility, self-care, household, transportation, or medical care activities. Information was obtained on up to five informal caregivers per older adult in the NSOC.
Limitations in self-care, mobility, and household activities: Limitation was defined as having difficulty performing such activities by themselves or receiving help from others in performing such activities. For household activities, the help provided had to be for health or functioning reasons.
Mobility activities: Mobility activities were a subset of activities of daily living and included getting out of bed, getting around inside one's home or building, and leaving one's home or building.
No dementia: Older adults who did not fall into the probable dementia category were considered to have no dementia.
Number of chronic conditions: Older adults were asked to self-report a list of chronic conditions and results were summed across the conditions. The chronic conditions examined included heart attack, heart disease including angina or congestive heart failure, hypertension, arthritis including osteoarthritis and rheumatoid arthritis, osteoporosis, diabetes, lung disease, stroke, and cancer. Dementia was not included in the list.
Possible dementia: According to the NHATS dementia classification, older adults with possible dementia did not report a dementia or Alzheimer's disease diagnosis or did not meet the AD8 criteria but had a score of 1.5 SD below the mean of self-respondents in one domain of orientation, memory, or executive functioning.
Probable dementia: According to the NHATS dementia classification, older adults with probable dementia met at least one of the following criteria: (1) had a diagnosis of dementia or Alzheimer's disease; (2) met the AD8 criteria (administered to proxy) if there was no diagnosis reported; or (3) had scores 1.5 SD below the mean of self-respondents in at least two of the domains of orientation, memory, or executive functioning.
Self-care activities: Self-care activities included in this analyses were a subset of activities of daily living (ADLs) and included bathing, dressing, eating, and toileting.
Substantial gains/losses from caregiving (Figure 6-3): Caregivers were asked a series of four questions about positive and negative aspects of caregiving. The gains or losses were considered substantial if caregivers reported that at least one statement about positive and negative aspects describes their situation very much, respectively.
The questions on gains from caregiving asked whether the following statements described the caregivers' positive helping experiences:
- More confident about your abilities
- Taught you to deal with difficult situations
- Brought you closer to care recipient
- Gives you satisfaction that recipient is well cared for
The questions on losses from caregiving asked whether the following statements described the caregivers' negative helping experiences:
- Exhausted when you go to bed at night
- Have more things to do than you can handle
- Don't have time for yourself
- When you get a routine going, recipient's needs change
Supportive care settings: NHATS defined supportive care settings as facilities including family care homes, group homes, board and care homes, personal care homes, assisted living, the assisted living section of a multilevel place, independent living, or an independent part of a multi-level place and enriched housing (housing with services).
Transportation services (Figure 6-2): Help given to older adults such as driving older adults to places or taking public transportation (the bus, subway, train, or light rail) with older adults.
Work productivity loss: In NSOC, caregivers' work productivity loss was measured by a modified Work Productivity and Activity Impairment (WPAI) questionnaire to quantitatively assess caregiving-related work productivity loss and activity impairment. The measure of work productivity loss incorporated absenteeism, defined as missed hours of work because of caregiving in relation to typical hours worked, and presenteeism, defined as effect of caregiving on productivity when at work. Work productivity loss was measured as a percentage equal to [absenteeism + (% of time worked x presenteeism)] x 100. We calculated work productivity loss using instructions and SAS codes provided in Wolff (2016).
REFERENCES
Centers for Disease Control and Prevention. (March 2015). Alzheimer's Disease. Retrieved from https://www.cdc.gov/aging/aginginfo/alzheimers.htm
Centers for Medicare & Medicaid Services. (2013). Nursing Home Data Compendium 2013 Edition. Retrieved from https://www.cms.gov/Medicare/Provider-Enrollment-and-Certification/CertificationandComplianc/downloads/nursinghomedatacompendium_508.pdf
US Department of Health and Human Services, Office of the Assistant Secretary for Planning and Evaluation. (September 3, 2015). 2015 Poverty guidelines. Retrieved from https://aspe.hhs.gov/2015-poverty-guidelines
Freedman, V. A., Spillman, B. C., & Kasper, J. (2014). Hours of care in rounds 1 and 2 of the National Health and Aging Trends Study. NHATS Technical Paper #7. Baltimore: Johns Hopkins University School of Public Health. Retrieved from http://www.nhats.org
Freedman, V.A., & Spillman, B. C. (2016). Making National Estimates with the National Health and Aging Trends Study. NHATS Technical Paper #17. Johns Hopkins University School of Public Health. Retrieved from http://www.nhats.org
Galvin, J. E., Roe, C. M., Powlishta, K. K., Coats, M. A., Muich, S. J., Grant, E., et al. (2005). The AD8: A brief informant interview to detect dementia. Neurology, 65(4):559-564
Hurd, M. D., Martorell, P., Delavande, A., Mullen, K. J., & Langa, K. M. (2013). Monetary costs of dementia in the United States. New England Journal of Medicine, 368; 1326-34. DOI: 10.1056/NEJMsa1204629.
Kasper, J. D., Freedman, V. A., & Spillman, B. (2013). Classification of persons by Dementia status in the National Health and Aging Trends Study. Technical Paper #5. Baltimore: Johns Hopkins University School of Public Health. Retrieved from http://www.nhats.org
Langa, K. M., Plassman, B. L., Wallace, R. B., Herzog, A. R., Heeringa, S.G., Ofstedal, M.B., et al. (2005). The Aging, Demographics, and Memory Study: Study design and methods. Neuroepidemiology, 25(4):181-191.
Lowe, B., Wahl, I., Rose, M., Spitzer, C., Glaesmer, H., Wingenfeld, K., et al. (2010). A 4-item measure of depression and anxiety: Validation and standardization of the patient health questionnaire-4 (PHQ-4) in the general population. Journal of Affective Disorders, 122(1):86-95.
National Institutes of Health (September 2013). The Dementias: Hope Through Research. Retrieved from https://www.nia.nih.gov/alzheimers/publication/dementias/introduction
National Institutes of Health (2015). Alzheimer's Disease Genetics Fact Sheet. Retrieved from https://www.nia.nih.gov/health/alzheimers-disease-genetics-fact-sheet
Wolff, J, (2016). Calculating work productivity loss in the national study of caregiving. NHATS Technical Paper #13. Baltimore: Johns Hopkins University School of Public Health. Retrieved from http://www.nhats.org
Analyses of Disability, Aging and Long-Term Care Policy and Data
This report was prepared under contract #HHSP233201600021I between the U.S. Department of Health and Human Services (HHS), Office of Disability, Aging and Long-Term Care Policy (DALTCP) and RTI International. For additional information about this subject, you can visit the DALTCP home page at http://aspe.hhs.gov/office-disability-aging-and-long-term-care-policy-daltcp or contact the ASPE Project Officer, Helen Lamont, at HHS/ASPE/DALTCP, Room 424E, H.H. Humphrey Building, 200 Independence Avenue, SW, Washington, DC 20201. Her e-mail address is: Helen.Lamont@hhs.gov.
Reports Available
A Profile of Older Adults with Dementia and their Caregivers Issue Brief
- HTML Version: https://aspe.hhs.gov/basic-report/profile-older-adults-dementia-and-their-caregivers-issue-brief
- PDF Version: https://aspe.hhs.gov/pdf-report/profile-older-adults-dementia-and-their-caregivers-issue-brief
Community-Dwelling Older Adults with Dementia and Their Caregivers: Key Indicators from the National Health and Aging Trends Study
- HTML Version: https://aspe.hhs.gov/basic-report/community-dwelling-older-adults-dementia-and-their-caregivers-key-indicators-national-health-and-aging-trends-study
- PDF Version: https://aspe.hhs.gov/pdf-report/community-dwelling-older-adults-dementia-and-their-caregivers-key-indicators-national-health-and-aging-trends-study