
U.S. Department of Health and Human Services
Final Report on the "Own Your Future" Consumer Survey
Long Term Care Group, Inc.
LifePlans, Inc.
November 30, 2006
PDF Version (43 PDF pages)
This report was prepared under contract #HHS-100-03-0009 between the U.S. Department of Health and Human Services (HHS), Office of Disability, Aging and Long-Term Care Policy (DALTCP) and Market Strategies. For additional information about this subject, you can visit the DALTCP home page at http://aspe.hhs.gov/_/office_specific/daltcp.cfm or contact the ASPE Project Officer, Hunter McKay, at HHS/ASPE/DALTCP, Room 424E, H.H. Humphrey Building, 200 Independence Avenue, S.W., Washington, D.C. 20201. His e-mail address is: Hunter.McKay@hhs.gov.
This survey was conducted in conjunction with Phase I of the Pilot Long-Term Care Awareness Campaign. The opinions and views expressed in this report are those of the authors. They do not necessarily reflect the views of the Department of Health and Human Services, the contractor or any other funding organization.
TABLE OF CONTENTS
- I. OVERVIEW
- A. Introduction
- B. About the Campaign
- C. Campaign Results
- D. Survey Methodology
- E. Research Questions
- II. FINDINGS: COMPARING KIT RESPONDERS AND NON-RESPONDERS
- A. Demographic Differences
- B. Long-Term Care Experiences
- C. Attitudes about Planning and the Need for Long-Term Care
- D. Paying for Long-Term Care
- E. Exposure to Long-Term Care Information
- F. Long-Term Care Planning Actions
- G. Multivariate Analysis
- LIST OF FIGURES
- FIGURE 1: Percentage of Target Population Requesting Kit by State
- FIGURE 2: Long-Term Care Experience by Responder Status
- FIGURE 3: Attitudes toward Planning by Responder Status
- FIGURE 4: Exposure to Campaign Elements
- FIGURE 5: Planning Actions Taken by Responder Status
- FIGURE 6: Bought Long-Term Care Insurance After Campaign, Total and by State
- FIGURE 7: Planning Actions Taken by Recall of Governors Letter
- FIGURE 8: Planning Actions Taken by Exposure to Television Ad
- FIGURE 9: Planning Actions Taken by Exposure to Radio Ad
- FIGURE 10: Planning Actions Taken by Whether or Not Read Kit
- FIGURE 11: Planning Actions Taken by Whether or Not Used CD
- LIST OF TABLES
- TABLE 1: Demographics
- TABLE 2: Respondents Long-Term Care Experience
- TABLE 3: Attitude About Planning for Long-Term Care
- TABLE 4: Respondents Knowledge of Who Pays for Long-Term Care
- TABLE 5: Exposure to Long-Term Care Information
- TABLE 6: Campaign Exposure
- TABLE 7: Respondents Awareness to Long-Term Care Planning Steps
- TABLE 8: Respondents Action of Long-Term Care Planning Steps
- TABLE 9: Logistic Regression Model for Understanding the Probability of Ordering a Kit
- TABLE 10: Awareness of Planning Options: Percent Change Pre vs. Post-Survey
- TABLE 11: Considered Planning Options: Percent Change Pre vs. Post-Survey
- TABLE 12: Taken Planning Step: Percent Change Pre vs. Post-Survey
I. OVERVIEW
A. Introduction
This report summarizes key findings of a research initiative to survey consumers about their long-term care knowledge, attitudes and behavior both prior to and after a comprehensive consumer education campaign conducted in five states.
The Long-Term Care Awareness Campaign, called Own Your Future, is the first large scale effort of its kind to attempt to increase public awareness of the need to plan for future long-term care needs. Evaluation activities were conducted to identify the impact that the communication strategies in the various campaign states had on consumer knowledge, attitudes and awareness of long-term care planning options, as well as on consumers willingness to consider or take specific planning steps.
The consumer survey was conducted both prior to and following implementation of the Awareness Campaign. The pre-campaign survey instrument was designed to measure baseline levels of knowledge, awareness, attitudes and behavior about long-term care planning. Selected respondents included 4,500 individuals between the ages of 50 and 70 in the five campaign states of Arkansas, Idaho, Nevada, New Jersey and Virginia. Subsequent to the pre-campaign survey, these 4,500 individuals, along with approximately two million additional consumers in these states, were exposed to a broad-based awareness campaign (see campaign summary below).
The pre-campaign survey, which was conducted in November and December 2004, gathered baseline data regarding consumers:
- understanding of long-term care issues and concepts;
- personal experiences with long-term care and caregiving;
- financial planning options such as reverse mortgages and long-term care insurance; and
- lifestyle choices, such as home modification and relocation.
The campaign activities varied by state, and were designed to increase consumer awareness and knowledge of long-term care options, and the need for advance lifestyle and financial planning to effectively meet long-term care needs as people age.
B. About the Campaign
Before presenting survey findings, we briefly summarize the Campaign Components and interventions which were the subject of this analysis.
Campaign Summary
The U.S. Department of Health and Human Services (HHS) designed and implemented the Phase I Long-Term Care Pilot Awareness Campaign, Own Your Future, to promote increased awareness about the importance of planning ahead for future long-term care needs. Specifically, in January 2005, the Office of the Assistant Secretary for Planning and Evaluation, the Administration on Aging (AoA) and the Centers for Medicare and Medicaid Services, working closely with the National Governors Association, launched the Own Your Future Pilot Long-Term Care Awareness Campaign in five states: Arkansas, Idaho, Nevada, New Jersey and Virginia.
Many people today do not think about their future long-term care needs and therefore fail to plan appropriately. If individuals and families are more aware of their potential need for long-term care, they are more likely to take steps to prepare for the future. From a public policy perspective, increased planning for long-term care is likely to increase private financing, which may in turn reduce the burden on public financing sources.
Campaign Materials and Activities
The Campaign used materials that were developed, tested and approved by the HHS as part of an earlier project. These included:
- Letter from the Governor with a brochure offering a Long-Term Care Planning Kit.
- Television and Radio spot featuring a woman who is thinking about her elderly fathers long-term care needs when she realizes that she should begin to plan ahead for herself as well.
- Follow-up postcard reminding consumers to order the Kit.
- The Long-Term Care Planning Kit, which featured:
- A 28-page brochure describing what is and what is not covered by public programs related to long-term care. The brochure also describes several ways to plan ahead, addressing legal issues, assessing services and private financing options for long-term care.
- An audio CD with interviews of persons engaged in different types of planning activities such as obtaining a reverse mortgage, making home modifications, or buying long-term care insurance.
The core components of the Campaign were the direct mail initiative and a media initiative. The direct mail component included a letter from the Governor of each state to every household with a member between the ages of 50 and 70. The letter included the tri-fold brochure described above as well as a toll free number through which the Long-Term Care Planning Kit could be requested. Over 2.1 million letters were sent to households across the five pilot states. Follow-up postcards to remind those in the target group of the availability of the Planning Kit were also used in all of the campaign states.
The second component of the campaign was a series of paid media spots and Public Service Announcements to further publicize the toll free number for ordering the Planning Kit. Paid media included television and radio spots selected to maximize exposure in the target audience of 50-70 year-olds. Due both to both budget constraints and a desire to test various approaches, the media used varied across the five pilot states. In three of the states, the Governors filmed an introduction to the media spot, expanding it to a 60-second spot. In those states, the media buy included a mix of both 30 and 60-secoond spots.
The overall objective of the media campaign was to achieve market delivery of 175 general television rating points per week in all markets and 50 direct response radio rating points per week in Idaho and New Jersey for a sustained period of eight weeks. The result is 1,400 total target rating points in television and 400 total radio target rating points in Idaho and New Jersey over the eight weeks. The table below shows the mix of communications used in each campaign state.
| State | Direct Mail Quantity | Governors Press Event | Media | Type of Media Spot | Percent of Population in Media Market | Follow-up Postcard |
| Arkansas | 298,367 | Yes | TV only | 30-second spots only. | 76% | Yes |
| Idaho | 125,717 | Yes | Radio and TV | Mix of 30 and 60-second TV spots. 30-second radio spots. | 75% | Yes |
| Nevada | 229,186 | Yes | TV only | Mix of 30 and 60-second spots. | 92% | Yes |
| New Jersey | 821,797 | No | Radio only | 30-second radio only. | Not estimated for radio | Yes |
| Virginia | 630,488 | Yes | TV only* | Mix of 30 and 60-second spots. | 66% | Yes |
| TOTAL | 2,105,555 | |||||
| * Used in selective media markets only. Not used in Northern Virginia. | ||||||
C. Campaign Results
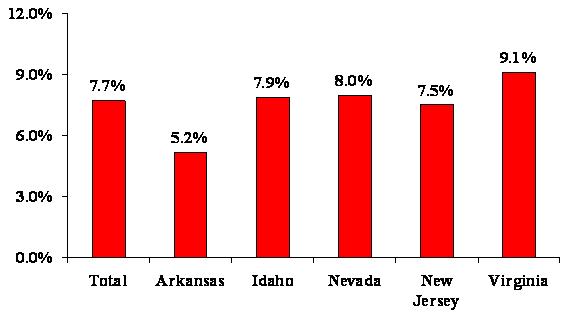
Over all the campaign states, the response rate was 7.7%. This means that 7.7% of the individual households that received the Governors letters requested the Planning Kit. Duplicate Kit orders were removed in calculating these response rates. The total number of Kits distributed represents a larger number because it includes both duplicate requests as well as requests from individuals not receiving the Governors letters (e.g., agents, government officials, residents of other states, and the like.)
While response rates were highest in Virginia (9.1%), in all states, the response rate met or exceeded our baseline estimate of 5% which is considered an appropriate response rate for a social marketing campaign. These response rates are also significantly higher than comparable private sector direct mail campaigns on this topic (which might see responses of 0.1%-2.0%).
| FIGURE 1: Percentage of Target Population Requesting Kit by State |
 |
An initial analysis was completed of the campaign based solely on response rates and demographic data that was appended to the direct mail file for a sample (10%) of both respondents and non-respondents. Those results can be found in the Final Report for Phase I which is posted at http://www.aoa.gov/ownyourfuture. The materials used in the Phase I campaign can also be viewed on that website.
D. Survey Methodology
Specifically, the survey sample for the pre-campaign baseline survey included 4,500 respondents across the five pilot states.
| State | Sample Size |
| Arkansas | 500 |
| Idaho | 500 |
| New Jersey | 1,500 |
| Nevada | 500 |
| Virginia | 1,500 |
| TOTAL | 4,500 |
As Phase I concluded in these five states, a post-campaign interview was conducted with as many of the same group of 4,500 respondents as were willing to participate, in order to measure the impact of the campaign in terms of any changes in their long-term care knowledge, attitudes and planning behaviors. The survey explored changes in key attitudes or planning activities as well as exposure to and opinions of the campaign activities. The post-campaign survey also included a replacement sample of individuals who requested the Long-Term Care Planning Kit but who were not included in the baseline interview. Including these Kit respondents better enabled us to evaluate differences between Kit responders and non-responders to the initial campaign message -- which was a simple call to action to order the Long-Term Care Planning Kit. Thus, the survey design enables us to both examine changes over time among the same population as well as differences between Kit responders and non-responders.
The post-campaign survey included the same questions asked in the pre-campaign survey, with the addition of a special series of questions designed to evaluate the impact of specific communication and media strategies used in campaign states. The post-campaign questions were designed to learn more about the usefulness of specific media messages and channels to specific segments of the target populations.
Fielding for the post-campaign survey began on October 27, 2005 and was completed on December 20, 2005. Individuals were surveyed about their recall and reaction to the Own Your Future Campaign roughly 5-7 months after completion of the campaign. While our ability to measure recall of specific campaign elements could have been enhanced by fielding the survey sooner after the campaign concluded, it was felt that a greater interval was needed in order to detect meaningful behavioral changes as a result of the campaign.
Therefore, the final sample analyzed in this report includes 2,904 individuals who participated in both the pre and post-campaign survey (called the follow-up sample), as well as 1,600 individuals in the campaign states who participated only in the post-campaign survey and were identified by our records to have requested the Planning Kit (Kit responders). Specifically, approximately 65% of the individuals who participated in the baseline pre-campaign survey also participated in the follow-up post-campaign survey. These figures vary only slightly by campaign state. Therefore, the remaining 35% of the survey sample consisted of the replacement sample drawn randomly from Kit responders. Across the entire sample participating in the post-campaign survey, approximately 41% of the sample received the Planning Kit. We specifically over-sampled responders for the replacement sample in order to have a sufficient number of responders and non-responders on which to analyze differences. The number and distribution of survey participants, by state and by status is shown below and on the following page.
Fieldwork was conducted by Market Strategies, Inc., in conjunction with LifePlans, Inc., and Long Term Care Group, Inc. The 18-minute computer-assisted telephone survey generated the following performance statistics.
The refusal rate (people contacted who refused to participate in the survey) was lower for the follow-up sample (19%) than for the new replacement sample (31%). This is likely due to the fact that the pre-survey sample group already felt some investment in the survey, having completed the pre-campaign survey, and also may represent an eager to comply population. Given the salience of the campaign to the replacement sample (since they had all requested the Planning Kit), we would have expected a better acceptance rate to participate in the survey, but that was not the case. Similarly, the follow-up survey sample had a higher rate of completion of the survey -- 92% -- compared with a cooperation or completion rate once the survey began of 75% among the replacement sample. Across both groups, the completion rate for the survey was approximately 85%.
The average interview length was slightly shorter for the follow-up survey sample compared with the replacement sample (16.5 vs. 17.9 minutes). This finding makes sense given that the follow-up sample had more familiarity with the survey questions, the vast majority of which were asked in both the pre and post-survey. Also, the replacement sample had a slightly longer questionnaire since it included questions about the Kit which individuals in the follow-up survey who did not request the Kit (about 90% of them) were not asked.
| Variable | Follow-up Sample | Replacement Sample |
| Refusal rate | 18.7% | 31.4% |
| Completion rate | 92.5% | 75.1% |
| Average Interview Length | 16.5 minutes | 17.9 minutes |
| Number of Respondents | 2,904 | 1,600 |
Post-Campaign Telephone Survey Reporting
| State | Arkansas | Idaho | Nevada | New Jersey | Virginia | Total |
| Original Sample Size (Pre-Survey) | 500 | 500 | 500 | 1,500 | 1,500 | 4,500 |
| Follow-up Interviews Completed | 333 | 334 | 332 | 929 | 976 | 2,904 |
| Replacement Sample Interviews Completed | 169 | 167 | 169 | 571 | 524 | 1,600 |
| Total Interviews Completed (Post Survey) | 502 | 501 | 501 | 1,500 | 501 | 4,504 |
| % of completes doing both pre and post survey | 67% | 67% | 66% | 62% | 65% | 65% |
| % of completes receiving Kit* | 36% | 39% | 42% | 43% | 41% | 41% |
Summarized below are the characteristics of the total sample with respect to key demographics.
| Characteristic | Value or Percent |
| Average Age | 61 years olds |
| % Female | 69% |
| % Married | 66% |
| % with College Degree or Higher | 38% |
| % Retired | 34% |
| % with Income > $30,000 | 67% |
| % with Assets > $30,000 | 61% |
E. Research Questions
The research questions addressed were as follows. Would people, as a result of the Campaign:
- Respond to the offer to order the Planning Kit?
- Gain a better appreciation for the value of planning for long-term care needs?
- Gain additional knowledge about long-term care planning options?
- Undertake concrete and specific planning actions?
Specific research questions around which our analysis was designed include the following:
- Did the campaign result in people ordering Kits? This issue has been answered in Section I, Campaign Results, with an overall response rate of 7.7% of the target market ordering the Planning Kit.
- Did views charge regarding the value of planning?
- Did we increase knowledge of planning options?
- Did the campaign have any impact on planning behavior?
- Which elements of the campaign were associated with planning behavior?
Addition research questions in each of these areas include the following:
Campaign Exposure
- Can people recall information about the campaign?
- Which campaign activities do people remember hearing, viewing or receiving?
- What did people think about the campaign components?
- Which components had the most impact?
Long-Term Care Planning Actions
- What planning actions did people take?
- How does this differ by attitudinal and demographic characteristics?
- Was the planning associated with campaign exposure?
Responders vs. Non-Responders
- What seems to motivate someone to order a Kit or take a specific planning action?
- Are there any significant differences across the pilot states?
- Does the Kit itself seem to lead to additional actions?
Pre and Post-Campaign
- Did people exposed to the campaign components show any change in the post-campaign attitudes and behavior?
- Does awareness of the campaign seem to be related to pre and post-campaign differences in attitudes and behavior?
II. FINDINGS: COMPARING KIT RESPONDERS AND NON-RESPONDERS
A. Demographic Differences
Table 1 summarizes the demographic differences between individuals who requested the Long-Term Care Planning Kit (Responders) and those who did not (non-responders). Statistically significant differences are noted in the table.
The average age of responders is significantly higher than that of non-responders, although the average age for both when rounded is just at 61 years old. Also, in general, responders are more likely to:
- Be between the ages of 65 to 69.
- Have an educational level of college graduate or beyond.
- Be retired.
- Cite their health as poor.
- Either have assets under $10,000 or to have assets of $125,000 or greater.
- Have household assets over $30,000.
- Have an individual retirement account (IRA), 401K or annuity.
Responders are less likely to be:
- Between the ages of 55 to 59.
- Married.
- Female.
- Have adult children living nearby.
- Cite their health as good.
These findings suggest individuals with more education who are slightly older and who have already retired are more likely to express interest in ordering the Planning Kit. Planning for long-term care may be more salient for them at this point in their lives, perhaps because they have newly retired and are thinking more broadly about planning for long-term care in the context of overall retirement planning. Not being married and not having adult children nearby can also make concerns with planning ahead for long-term care needs more salient, as this may mean that informal supports are less readily available.
Income did not appear to differ significantly across the responder vs. the non-responder groups. This suggests that individuals along the financial spectrum, with respect to income and assets, found some relevance in the campaign. This finding is consistent with the broad range of topics addressed in the Planning Kit, with an emphasis not only on financial planning approaches, but also on lifestyle and household options like home modification, a reverse mortgage or moving in with family or friends, which might hold more appeal for individuals with more limited means. One goal of the campaign, to speak with some relevance to all segments of the target market and to present viable planning options for a wide variety of personal scenarios, would appear then to have been met.
Individuals with financial vehicles indicative of being a planner (e.g., having a 401K, annuity or IRA) are also more likely to be interested in planning for long-term care; this finding is consistent with other research on the topic.
| TABLE 1: Demographics | ||
| Demographics | Responder's Status | |
| Ordered Planning Kit | Did Not Order Kit | |
| n=1849 | n=2653 | |
| AGE OF RESPONDENTS | ||
| 50-54 | 18% | 19% |
| 55-59 | 25% | 28%** |
| 60-64 | 22% | 22% |
| 65-59 | 24%** | 21% |
| 70+ | 11% | 10% |
| Mean Age of Respondents | 61** | 61 |
| FEMALE | 64% | 72%*** |
| MARRIED | 61% | 70%*** |
| EDUCATION LEVEL OF RESPONDENTS | ||
| Less than high school | 5% | 9%** |
| Graduated high school | 22% | 27%** |
| Some college/technical school | 30% | 30% |
| Graduated college | 20% | 19% |
| Post graduate education | 23%*** | 16% |
| College or higher degree | 43%*** | 35% |
| EMPLOYMENT STATUS | ||
| Employed | 43% | 46%* |
| Retired | 38%*** | 32% |
| Other (homemaker, student, etc.) | 19% | 22%** |
| RETIREMENT STATUS | ||
| Completely retired | 77% | 74% |
| Retired but working for pay | 13% | 13% |
| Other (homemaker, babysitter, etc.) | 10% | 13%** |
| HEALTH STATUS OF RESPONDENTS | ||
| Excellent | 33% | 31% |
| Good | 42% | 46%** |
| Fair | 17% | 17% |
| Poor | 8%** | 7% |
| CHILDREN LIVING WITHIN 25 MILES | 54% | 61%*** |
| HOMEOWNERSHIP | 89% | 87% |
| HOUSEHOLD INCOME | ||
| Less than $10,000 | 8% | 9% |
| $10,000 - $20,000 ($19,999) | 12% | 11% |
| $20,000 - $30,000 ($29,999) | 14% | 14% |
| $30,000 - $50,000 ($49,999) | 23% | 21% |
| $50,000 - $75,000 ($74,999) | 19% | 19% |
| $75,000 - $100,000 ($99,999) | 11% | 12% |
| $100,000 or more | 14% | 14% |
| Household Income More Than $30,000 | 68% | 66% |
| HOUSEHOLD ASSETS | ||
| Less than $10,000 | 22% | 25%** |
| $10,000 - $20,000 ($19,999) | 9% | 10% |
| $20,000 - $30,000 ($29,999) | 7% | 9% |
| $30,000 - $50,000 ($49,999) | 7% | 9% |
| $50,000 - $75,000 ($74,999) | 7% | 8% |
| $75,000 - $100,000 ($99,999) | 7% | 6% |
| $100,000 - $125,000 ($124,999) | 4% | 5% |
| $125,000 or more | 36%*** | 29% |
| Household Assets More Than $30,000 | 65%*** | 58% |
| Have an IRA, 401-K, or an Annuity | 67%** | 63% |
| Differences are statistically significant at either the 0.1 level (*), 0.05 level (**), or 0.001 level (***). | ||
B. Long-Term Care Experiences
We also compared the long-term care experiences of responders and non-responders. While in the past this variable has been an important factor in explaining interest in long-term care insurance, it has become a less important factor in that regard as the population as a whole has gained more exposure to long-term care issues. In studies of buyers and non-buyers of long-term care insurance, for example, having some personal experience with long-term care used to be a significant variable in differentiating buyers from non-buyers. In more recent analyses, it still plays an important role in terms of the type and amount of coverage someone buys, but is less likely to play a role in ones decision about whether or not to buy coverage.
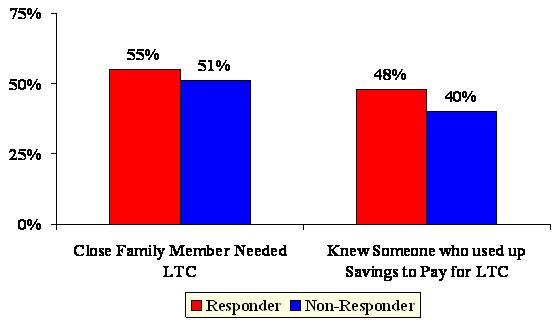
The findings from this study are consistent with prior research in that individuals who had a close family member who needed long-term care or who knew someone who used up savings paying for care were more likely to order the Kit than those who did not share those same experiences.
| TABLE 2: Respondent's Long-Term Care Experience | ||
| Long-Term Care Experience | Responder's Status | |
| Ordered Planning Kit | Did Not Order Kit | |
| n=1849 | n=2653 | |
| Arranged for or provided help with long-term care | 39% | 38% |
| Close family member needed long-term care | 55%** | 51% |
| Know someone who used most of their savings to pay for long-term care | 48%*** | 40% |
| *p0.1; **p0.05; ***p 0.001. | ||
| FIGURE 2: Long-Term Care Experience by Responder Status |
 |
C. Attitudes about Planning and the Need for Long-Term Care
We asked survey participants about the importance of planning ahead for long-term care needs and the challenges of doing so. A series of questions focused on how strongly the individual agreed with various statements about the value of planning and the obstacles to being able to plan ahead for long-term care needs.
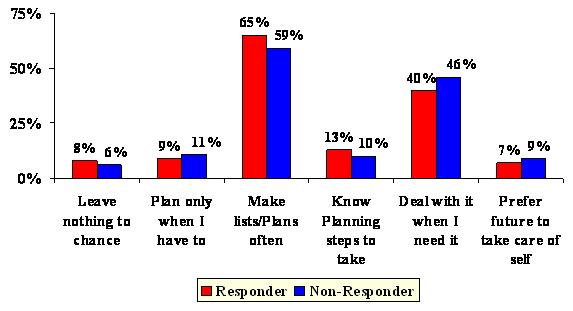
Responders who ordered the Planning Kit were more likely to perceive the value of planning ahead and to express a certain degree of confidence about their ability to do advance planning. With respect to general planning styles, those ordering the Planning Kit were significantly more likely to say:
- I leave nothing to chance.
- I make lists most of the time.
- There are planning steps I can take now that will help me in the future.
They were also more likely to strongly disagree with the statement:
- I dont know what planning steps to take for long-term care.
In contrast, the survey respondents who did not order the Planning Kit had responses which indicate that they are less planning-oriented in general and less focused on planning specific to long-term care. They were more likely to say:
- I plan only when I have to.
- I make lists hardly ever or never.
- I will deal with long-term care when I get to it.
There are also significant differences between these two groups when we look at their opinions of the value of planning ahead. Those who ordered the Planning Kit were more likely to say that:
- Planning gives me more control over care choices.
- Planning enables me to better protect my income and my family.
- Planning ahead will help me be able to stay at home if I need care.
In contrast, survey respondents who did not order the Planning Kit disagreed that planning ahead would help them have more control over the care and services they could receive, although they did agree, but not strongly, that planning ahead could help them receive care at home.
With respect to the perceived risk of needing long-term care, those who ordered the Planning Kit were more likely to say that they feel it is very likely they will need long-term care someday. They are also less likely to see relying on family care as a feasible option. At the same time, they are more worried about the financial impact that their long-term care need might have on their loved loves.
In contrast, those that did not order the Planning Kit were more likely to say that they would rely on care from family or friends, expressed less concern about the impact of their long-term care needs on family finances and in general see themselves at lower risk of needing long-term care.
Thus the combination of traits associated with the probability of ordering the Planning Kit include:
- A belief in the value of planning.
- A belief in the benefits of planning ahead.
- A belief that long-term care may someday be needed.
- Concern about the burden on their family if they needed long-term care.
- Concern about how or whether they will get the help they need if they need long-term care.
- An unwillingness or inability to rely on family or friends to provide care.
| FIGURE 3: Attitudes toward Planning by Responder Status |
 |
One possible explanation for the findings observed above is that the invitation to order materials to learn about how to plan ahead for long-term care resonated more to those already concerned about these issues and those with a general belief in the value and importance of planning. This is consistent with other research which shows that people who take certain planning actions, like buying long-term care insurance, are significantly more likely to believe strongly in the importance of planning and to see themselves at risk for someday possibly needing long-term care.
It seems then, that the campaign message overall, as measured by whether or not someone ordered a Planning Kit, did not seem to effectively reach what we would describe as non-planners. At least, at this point in their lives, they are non-planners. However it is possible, because the non-responders are younger, that the campaign message may become more salient to them as they come closer to retirement or pre-retirement age, as they have fewer competing daily living demands by virtue of possibly still being in their prime parenting/working years, or as they have more personal exposure to long-term care issues.
One critical question, however, is whether these individuals ordered the Planning Kit because of the salience of these planning issues for them in their lives, or if having received and read the Planning Kit helped to foster some of these planning attitudes among this population. This question is examined in more detail in Part III of the analysis.
| TABLE 3: Attitude About Planning for Long-Term Care | ||
| Attitude and Awareness of Long-Term Care | Responder's Status | |
| Ordered Planning Kit | Did Not Order Kit | |
| n=1849 | n=2653 | |
| General Planning Style | ||
| I leave nothing to chance | 8%** | 6% |
| I plan ahead as much as I can | 77% | 75% |
| I plan only when I have to | 9% | 11%** |
| I let the future take care of itself | 7% | 9%** |
| How Often Would You Make Plans or Lists | ||
| Most of the time | 65%*** | 59% |
| Some of the time | 30% | 32% |
| Hardly ever | 4% | 7%*** |
| Never | 2% | 2%* |
| I Can Take Planning Steps Now to Help with These Future Long-Term Care Needs | ||
| Strongly agree | 19%** | 16% |
| Agree | 69% | 71% |
| Disagree | 10% | 12% |
| Strongly disagree | 1% | 1% |
| I Am Confident that I Could Get the Help I Need if I Need Long-Term Care | ||
| Strongly agree | 15% | 14% |
| Agree | 65% | 69%** |
| Disagree | 17%** | 15% |
| Strongly disagree | 3% | 2% |
| I do not Know What Steps to Take | ||
| Strongly agree | 3% | 4% |
| Agree | 25% | 26% |
| Disagree | 59% | 60% |
| Strongly disagree | 13%** | 10% |
| Planning Means I am More Likely to Have Control Over the Type of Care I Receive | ||
| Strongly agree | 25%*** | 21% |
| Agree | 67% | 69% |
| Disagree | 7% | 9%** |
| Strongly disagree | 1% | 1% |
| By Planning, I can Better Protect my Family's Income and Savings | ||
| Strongly agree | 23%** | 19% |
| Agree | 67% | 70%* |
| Disagree | 9% | 10% |
| Strongly disagree | 1% | 1% |
| Planning for a Time Now will Help me Stay in My Home | ||
| Strongly agree | 21%*** | 17% |
| Agree | 69% | 72%** |
| Disagree | 10% | 10% |
| Strongly disagree | 1% | 1% |
| I Worry that the Cost of Care Would Burden My Family | ||
| Strongly agree | 21%*** | 17% |
| Agree | 46% | 50%** |
| Disagree | 28% | 30% |
| Strongly disagree | 4%** | 3% |
| I Feel Confident that Family or Friends Would Take Care of Me | ||
| Strongly agree | 13% | 15% |
| Agree | 54% | 60%*** |
| Disagree | 27%*** | 22% |
| Strongly disagree | 5%*** | 3% |
| I Will Deal with It when I Get to It | ||
| Strongly agree | 7% | 6% |
| Agree | 40% | 46%*** |
| Disagree | 43% | 41% |
| Strongly disagree | 10%** | 8% |
| How Likely do You Think it is that You Might Need this Type of Care | ||
| Very likely | 26%*** | 21% |
| Somewhat likely | 50% | 48% |
| Not very likely | 18% | 23%*** |
| Not at all likely | 6% | 8%** |
| *p0.1; **p0.05; ***p 0.001. | ||
D. Paying for Long-Term Care
We found differences between Kit responders and non-responders in terms of their knowledge and perception of who would pay for long-term care if they needed it on an extended care basis (for more than six months). Those who did not order the Kit were more likely to say that Medicare and/or Medicaid would pay some of the costs, while those who did order the Kit were more likely to see Medicare and Medicaid as paying none of those costs.
In contrast, those who ordered the Kit were more likely to feel that they would be responsible for paying on their own out of income or savings for long-term care, while those who did not order the Kit were more likely to say that their own financial resources would not pay for any of their care. Finally, individuals who ordered the Kit were more likely to say that children would not be involved in paying for their care, while non-responders were more likely to say that they would rely on children to pay for their care.
This analysis does not tell us whether respondents held these viewpoints before they ordered the Planning Kit, or whether those who ordered the Kit had a better understanding of who pays as a result of having received it. Based on other research, however, we do see that those who have more accurate knowledge about the costs of long-term care and that public programs offer a limited solution for them, do tend to take specific planning actions (e.g., like buying long-term care insurance) so ordering the Planning Kit may have been an expression of knowing that they had a need to plan.
| TABLE 4: Respondents Knowledge of Who Pays for Long-Term Care | ||
| Who Pays for Long-Term Care? | Responder's Status | |
| Ordered Planning Kit | Did Not Order Kit | |
| n=1849 | n=2653 | |
| Medicaid | ||
| All of the costs | 11% | 11% |
| Most of the costs | 12% | 13% |
| Some of the costs | 42% | 47%** |
| None of the costs | 34%*** | 29% |
| Medicare | ||
| All of the costs | 4% | 4% |
| Most of the costs | 12% | 13% |
| Some of the costs | 65% | 68%** |
| None of the costs | 19%*** | 15% |
| A Private Health Insurance or Retirement Health Plan | ||
| All of the costs | 5% | 6% |
| Most of the costs | 20% | 20% |
| Some of the costs | 52% | 50% |
| None of the costs | 23% | 24% |
| Your Own Income, Savings, or the Sale of Other Assets | ||
| All of the costs | 10%** | 8% |
| Most of the costs | 18% | 19% |
| Some of the costs | 58% | 56% |
| None of the costs | 14% | 17%** |
| Children or Relatives | ||
| All of the costs | 2% | 2% |
| Most of the costs | 3% | 5%** |
| Some of the costs | 40% | 44%** |
| None of the costs | 55%*** | 49% |
| *p0.1; **p0.05; ***p 0.001. | ||
E. Exposure to Long-Term Care Information
We asked respondents whether they had heard, seen or read anything about long-term care within the past several months and whether they took any action as a result of this. This was an unaided recall of information, not specific to the campaign, and thus may include that or any other information they may have heard, read or seen. As shown in Table 5, individuals who ordered the Kit were more likely to say they had been exposed to long-term care during the past few months. When asked where they had read, seen or heard this information, those who ordered the Kit were more likely to mention direct mail, a magazine, or the Internet. Curiously, they were less likely than non-responders to mention television as where they heard about long-term care recently, despite the fact that, in most of the states, there was a media campaign.
When asked if they took any action as a result of the information they read, heard or saw, those who ordered the Kit were significantly more likely to say that they had taken some action. They may be referring to having ordered the Kit as the action they have taken as a result, or they may also be thinking of some of the other planning actions they said they have taken.
| TABLE 5: Exposure to Long-Term Care Information | ||
| Exposure to Long-Term Care Information | Responder's Status | |
| Ordered Planning Kit | Did Not Order Kit | |
| n=1849 | n=2653 | |
| Have Been Exposed to Long-Term Care During the Past Several Months | 80%*** | 75% |
| Where did You Hear/See/Read this Information | ||
| TV | 55% | 64%*** |
| Radio | 14% | 12% |
| Newspaper | 28% | 28% |
| Magazine | 27%** | 24% |
| Billboard | 3% | 2% |
| Direct mail | 71%*** | 62% |
| Internet | 10%** | 7% |
| Did You Take Any Action | 22%*** | 12% |
| *p0.1; **p0.05; ***p 0.001. | ||
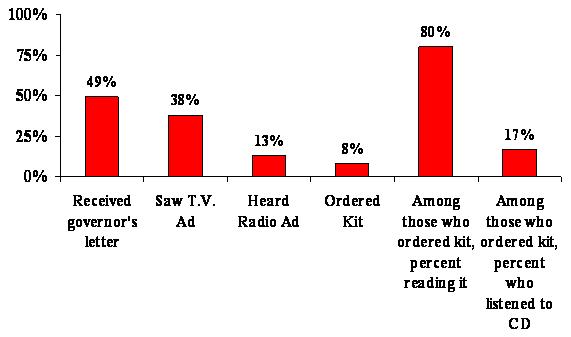
In terms of exposure to the campaign activities, specifically, just under half of the respondents recalled receiving the Governors letter, even though the sample was drawn exclusively from households that were sent the Governors letter. In some cases, of course, it is possible that the one member of the household who was in our survey sample was not the same household member that opened or discarded the Governors letter when it arrived. So this variable is not entirely a measure of recall on receiving the letter. Also the lag time between receipt of the Governors letter and the survey may reduce the number of respondents who recall receiving it. Those who ordered the Kit were twice as likely to recall receiving the Governors letter so salience of the long-term care topic is also likely a factor here. Certainly, it makes sense that someone who took action as a result of the Governors letter (i.e., ordering the Kit) would be more likely to recall having receiving that letter.
Fewer than 40% of the sample said they saw a television ad and about 13% heard a radio ad. While we do not have good numbers on the market share exposed to radio, we do know that just about 45% of the target population was exposed to the television spots, so it seems as if the audience had a level of recall for television consistent with the level of exposure.
As stated previously, about 8% of the sample ordered the Planning Kit. Of these, a high percent -- 80% -- indicated that they had read the Kit. In contrast, however, only 17% of those receiving the Kit listened to the Success Stories CD included in it. We were not able to ask follow-up questions to learn more about why people did not listen to the CD -- whether the reasons were technical or reflected a lack of interest in the CD material.
| FIGURE 4: Exposure to Campaign Elements |
 |
When asked specifically about their recall of various components of the awareness campaign, there were differences between the recall abilities of those who ordered the Planning Kit and those who did not do so. Specifically, individuals who ordered the Planning Kit were significantly more likely to recall receiving the Governors letter. They were also more likely to say that they say the campaigns television ad. Those who ordered the Planning Kit were also more likely to recall having heard the radio ad.
| TABLE 6: Campaign Exposure | ||
| Campaign Exposure | Responders Status | |
| Ordered Planning Kit | Did Not Order Kit | |
| n=1849 | n=2653 | |
| RECEIVED THE GOVERNOR'S LETTER | 69%*** | 34% |
| How informative was the letter | ||
| Very informative | 30% | 26% |
| Somewhat informative | 54% | 56% |
| Not very informative | 12% | 11% |
| Not at all informative | 4% | 8%** |
| SEE A TV AD ABOUT LONG-TERM CARE | 42%** | 36% |
| How informative was the TV ad | ||
| Very informative | 31% | 28% |
| Somewhat informative | 52% | 57%* |
| Not very informative | 13% | 11% |
| Not at all informative | 4% | 4% |
| HEAR A RADIO AD ABOUT LONG-TERM CARE | 14%* | 12% |
| How informative was the radio ad | ||
| Very informative | 28% | 23% |
| Somewhat informative | 55% | 61% |
| Not very informative | 12% | 11% |
| Not at all informative | 6% | 4% |
| DID YOU DO ANY OF THE FOLLOWING | ||
| Talk to an agent about long-term care insurance | 22%*** | 17% |
| Look into more about a reverse mortgage | 7%** | 6% |
| Review the existing insurance coverage | 22%** | 19% |
| Buy a long-term care policy after Jan 1st, 2005 | 44%*** | 21% |
| *p0.1; **p0.05; ***p 0.001. | ||
F. Long-Term Care Planning Actions
We asked respondents if they had ever heard of a variety of planning steps that some people may take in preparation for understanding and dealing with their future long-term care needs. Individuals who ordered the Kit were more aware of purchasing long-term care insurance and learning about long-term care on the Internet as an option, while those that did not order the Kit were more likely to be aware of moving closer to family as a planning option. Otherwise, there were no statistically significant differences between these two groups in terms of their awareness of the existence of these various planning steps. These differences seem reasonable given the other differences between the groups in terms of their demographic and attitude profiles described above. Also, someone who read about long-term care on the Internet or who might have already been aware of long-term care insurance could have greater curiosity on the subject and, as a result, want to receive the Planning Kit.
Next we asked respondents if they had either considered or taken any of the planning steps of which they said they were aware. If a respondent said they had never heard of a planning step, they were not asked if they had considered or taken it. The planning steps that individuals who ordered the Planning Kit were more likely to have considered include:
- Buying long-term care insurance.
- Consulting with a financial planner.
- Consulting with an insurance agent.
- Moving closer to family or friends.
- Reading information on the Internet about long-term care.
- Planning to move to a new residence better suited to their needs.
| TABLE 7: Respondent's Awareness of Long-Term Care Planning Steps | ||
| Awareness of Long-Term Care Planning Steps | Responder's Status | |
| Ordered Planning Kit | Did Not Order Kit | |
| n=1849 | n=2653 | |
| Rearranging financial resource to qualify for Medicaid | 72% | 74% |
| Purchasing long-term care insurance | 92%** | 90% |
| Consulting with a financial planner | 84% | 83% |
| Consulting with an insurance agent | 81% | 80% |
| Moving closer to family members or friends | 89% | 92%*** |
| Reading long-term care information on the Internet or in brochures | 74%** | 72% |
| Making minor changes to their homes | 95% | 95% |
| Planning to move to a new residence | 92% | 93% |
| Talking to family or friends | 79% | 80% |
| *p0.1; **p0.05; ***p 0.001. | ||
The groups did not differ in terms of their consideration of talking to family or friends about these and other long-term care issues. Overall, those who ordered the Kit were more likely to have taken some planning action, compared with those who did not order the Kit. Respondents who did not order the Kit were significantly more likely to have neither considered nor taken any of the planning steps except for moving closer to family or friends.
A more focused (and thus easier to answer) question about planning activity asked respondents whether they had done any of the following:
- Talked to an agent or financial planner about long-term care.
- Looked into a reverse mortgage.
- Reviewed their existing insurance coverage to see if long-term care was provided for.
- Bought long-term care insurance after the campaign.
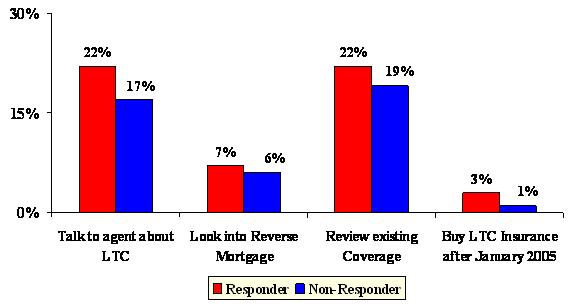
With respect to planning steps that were taken, individuals who ordered the Planning Kit were more likely to have taken the following actions:
- Purchase long-term care insurance (after the campaign).
- Consult with a financial planner or an insurance agent.
- Look into a reverse mortgage.
- Review this existing coverage.
| FIGURE 5: Planning Actions Taken by Responder Status |
 |
| FIGURE 6: Bought Long-Term Care Insurance After Campaign, Total and by State |
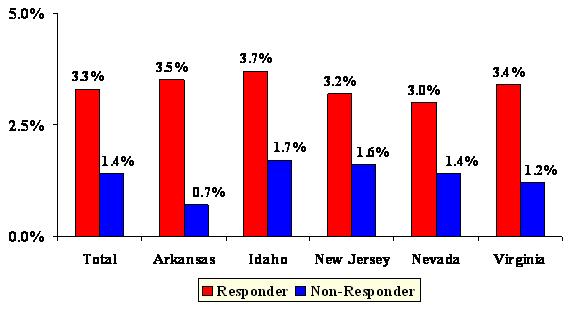 |
We also looked more closely at respondents who said they bought long-term care insurance after the campaign, by state. In New Jersey, Arkansas and Virginia, the differences are statistically significant. The likely reason that these differences are not statistically significant in Idaho and Nevada, but are significant in Arkansas (which had a similar sample size to the other two smaller states) is that the differences observed in Arkansas are larger than the differences in Idaho and Nevada. A larger difference is important for the smaller sample size among these three states. It is possible that, with a larger sample in these two states, we may have observed a statistically significant difference there as well.
Again, we do not know whether these differences between those who received the Kit and those who did not choose to order it were evident before the campaign or whether having received the Kit helped to increase awareness and action along these lines. This issue is explored further in Part II of this report which looks at findings of the pre and post-campaign survey populations.
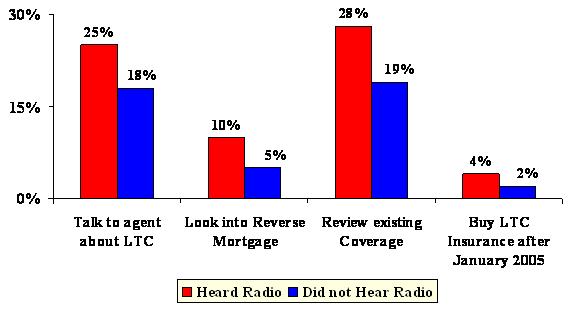
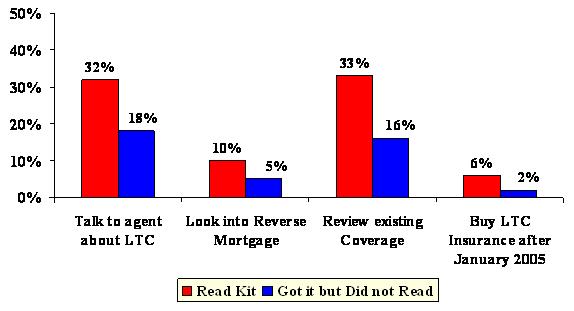
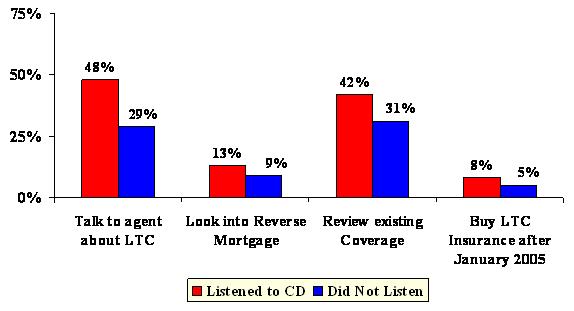
Individuals who recalled the campaign communications and those who read the Planning Kit and/or listened to the CD were more likely to take one of the planning actions listed above. For example, individuals who recalled getting the Governors letter were more likely to review their existing insurance coverage to see if it covered long-term care (26% vs. 16%), to talk to an agent or financial planner about long-term care (25% vs. 14%), to look into a reverse mortgage (8% vs. 5%), or to buy long-term care insurance after the campaign (3% vs. 2%).
While individuals who ordered the Kit may have already had a planning orientation and thus been more likely to engage in planning activities after receiving the Kit, the fact that, among all who received the Kit, there are important differences in planning actions taken based on whether or not the recipient read the Kit and/or listened to the CD, provides some evidence that the Planning Kit in and of itself is influential in moving planner types to taking action.
The tables below summarize these findings.
| FIGURE 7: Planning Actions Taken by Recall of Governors Letter |
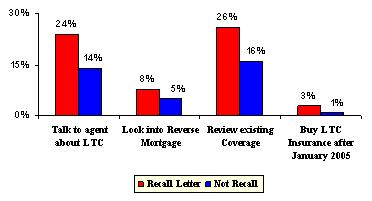 |
| FIGURE 8: Planning Actions Taken by Exposure to Television Ad |
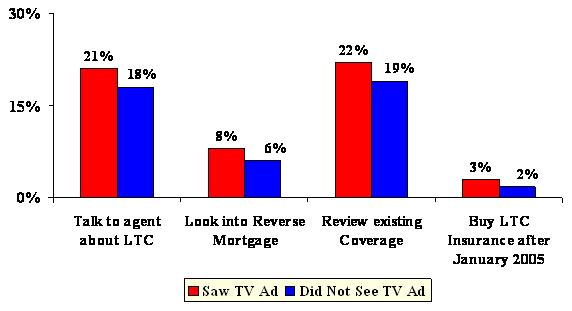 |
| FIGURE 9: Planning Actions Taken by Exposure to Radio Ad |
 |
| FIGURE 10: Planning Actions Taken by Whether of Not Read Kit |
 |
| FIGURE 11: Planning Actions Taken by Whether or Not Used CD |
 |
| TABLE 8: Respondent's Action of Long-Term Care Planning Steps | ||
| Long-Term Care Steps Taken or Considering Taking | Responder's Status | |
| Ordered Planning Kit | Did Not Order Kit | |
| n=1849 | n=2653 | |
| Rearranging Financial Resource to Qualify for Medicaid | ||
| Taken this step | 7% | 6% |
| Considered taking this step | 23% | 21% |
| Neither taken nor considered this step | 71% | 74%* |
| Purchasing Long-Term Care Insurance | ||
| Taken this step | 21% | 20% |
| Considered taking this step | 46%*** | 33% |
| Neither taken nor considered this step | 34% | 47%*** |
| Consulting with a Financial Planner | ||
| Taken this step | 30% | 28% |
| Considered taking this step | 28%** | 24% |
| Neither taken nor considered this step | 42% | 49%*** |
| Consulting with an Insurance Agent | ||
| Taken this step | 28%** | 25% |
| Considered taking this step | 28%** | 24% |
| Neither taken nor considered this step | 44% | 51%*** |
| Moving Closer to Family Members or Friends | ||
| Taken this step | 17% | 18% |
| Considered taking this step | 26%** | 23% |
| Neither taken nor considered this step | 57% | 59% |
| Reading Long-Term Care Information on the Internet or in Brochures | ||
| Taken this step | 37%*** | 28% |
| Considered taking this step | 37%*** | 28% |
| Neither taken nor considered this step | 27% | 44%*** |
| Making Minor Changes to Their Homes | ||
| Taken this step | 27%** | 23% |
| Considered taking this step | 27% | 27% |
| Neither taken nor considered this step | 46% | 51%** |
| Planning to Move to a New Residence | ||
| Taken this step | 3% | 2% |
| Considered taking this step | 31%*** | 25% |
| Neither taken nor considered this step | 66% | 73%*** |
| Talking to Family or Friends | ||
| Taken this step | 25% | 24% |
| Considered taking this step | 28% | 26% |
| Neither taken nor considered this step | 47% | 50% |
| *p0.1; **p0.05; ***p 0.001. | ||
G. Multivariate Analysis
Finally, we looked at factors related to the probability of ordering a Planning Kit based on a multivariate regression analysis. This approach says, holding all else constant, what variables are significant in explaining differences between those who ordered the Planning Kit and those who did not? This is important because many variables that may prove to be significant on a bi-variate basis, may only be significant because they are proxies for or correlate with other variables -- for example, the males in the survey are also more likely to be married; individuals with higher incomes have a greater likelihood of also having greater asset levels and both are associated with higher levels of education.
Table 9 shows all of the variables tested in the equation. Variables that emerged as significant in the multivariate analysis include:
- A variable constructed to measure ones attitude toward planning.
- A variable constructed to measure the level of campaign exposure.
- A belief in someday needing long-term care.
- Age.
- Being female.
- Being married.
- Having a college degree or higher.
- Having taken some action as a result of something they read, heard or saw about long-term care in the media.
- Being a New Jersey resident.
| TABLE 9: Logistic Regression Model for Understanding the Probability of Ordering a Kit (Results of Multivariate Analysis) | ||
| Variable | Coefficient | Exp(B) |
| Being a New Jersey resident | 0.40*** | 1.492 |
| Level of campaign exposure | 0.74*** | 2.105 |
| Attitude scale toward planning | 0.05*** | 1.052 |
| Think they may need long-term care | 0.27** | 1.308 |
| Knowing someone that used most of their savings or assets to pay for long-term care | 0.133 | 1.142 |
| Age | 0.02*** | 1.021 |
| Being female | -0.46*** | 0.632 |
| Being married | -0.43*** | 0.648 |
| College degree or higher | 0.25*** | 1.280 |
| Owning a home | 0.123 | 1.131 |
| Having an income greater than $30K | 0.113 | 1.119 |
| Having assets greater than $30K | 0.149 | 1.160 |
| Took action as a result of something they read, heard or saw in media | 0.51*** | 1.667 |
| *p0.1; **p0.05; ***p 0.001. | ||
The coefficient indicates the direction of the relationship (negative or positive), while the Exp (B), known as the odds ratio, can be used to interpret the magnitude of the effect of each variable on the probability of ordering a Kit. For example, an odds ratio of 1.492 for Being a New Jersey Resident means that New Jersey residents were roughly 1.5 times more likely to order the Planning Kit, all else being equal. Similarly, an odds ratio of 0.632 for Being Female means that, all else equal, females are only 0.63 times as likely to order the Kit as males.
Focusing first on demographics, these results include both some expected and some unexpected relationships. For example, consistent with our findings, other research has shown that higher education correlates with being a planner and being more likely to take planning actions in general, and specifically to be involved in planning for both retirement and long-term care needs (those with a college degree or higher are roughly 1.3 times more likely to have ordered a Kit).
Other research, however, suggests that long-term care is a more salient issue for females -- they are more likely to have caregiving experience, raising their awareness of the value of planning, and are also more likely to be single at the time that they might need long-term care, thus raising the importance for them of planning. Yet these results show that, all else held constant, females are less likely to have ordered the Planning Kit. One possible explanation may be that females do not feel they need the Planning Kit because they may have already done some long-term care planning. Indeed, other research does suggest that a greater portion of females buy long-term care insurance, given the salience of this issue for them. We also see strong differences in qualitative (focus group) research on long-term care, where females tend to be better informed and have a greater acceptance of the importance of long-term care planning.
Similarly, married people were also less likely to order the Planning Kit. This may be because they are more likely to have other resources for planning available to them, such as a personal financial planner or insurance agent. Or it may reflect the fact that they feel they are best served by talking with each other about these issues, rather than ordering a guide on the subject. Additionally, it is possible that married couples believe that they may have each other (and more likely to have adult children) on whom they can rely should the need for long-term care arise. Also, like females, some evidence suggests a greater participation in long-term care insurance and similar planning activities among married couples (for a variety of reasons), so our data may well reflect the fact that married couples are further along in planning and, therefore, did not feel the need to request the Planning Kit.
Consistent with other studies, people who see themselves at risk for long-term care and who believe in the value of planning, as measured by the attitude scale toward planning, are more likely to engage in planning activities, in this case, ordering the Planning Kit. The attitude scale was based on responses to the following questions (with one point given for each answer that indicated a planning orientation):
- I can take steps now to plan for a time when I may no longer be able to take care of myself.
- If I became ill or unable to take care of myself, I am confident that I could get the help I need.
- When it comes to planning I do not know what steps to take.
- If I prepare now I am more likely to have control over the type of care I receive.
- If I make arrangements now I can better protect my familys income and savings.
- Planning will help me stay in my home.
- I worry that the cost of care would burden my family.
- I feel confident that family or friends would care for me.
- I will deal with it when I get to it.
- How likely do you think it is that you may ever need care?
An important research question is whether the exposure to campaign elements in general, and the media specifically, increased the likelihood that someone would order a Planning Kit. Indeed, the analysis suggests that those with a higher score on a composite variable for level of campaign exposure were much more likely to order the Kit (two times more likely). This variable was derived based on the following elements:
- Recalled receiving the Governors letter.
- Recalled seeing the television ad.
- Recalled hearing the radio ad.
Respondents could receive a score from zero to three, based on the number of yes answers they had on these items.
Our findings here are consistent with other research which shows that the number of touches or exposures to a message that an individual receives is positively related to their taking whatever action is directed in that message. Individuals with a higher score on the campaign exposure variable reported that they received more communications urging them to order the Planning Kit -- including mail, television and/or radio. This does not, however, tell us which type of media exposure was most important: television, radio, follow-up postcard, or initial Governors letter? It merely tells us that the more exposure to the message, the better.
The variable Took Action as a Result of Media refers to the general survey question for those that indicated that they had seen, heard or read something recently about long-term care, and asked whether they took any action as a result. The question was very general and may not be capturing actions taken as a result of exposure to our campaign messages. The media in this case could refer to other outside messages about long-term care to which the population was exposed. This finding makes sense, given the statement above, that multiple touches are more likely to provoke someone to take action. Survey respondents who said they took action as a result of some media exposure, by definition, include individuals who may have had additional touches beyond those provided by the campaign.
Finally, it is more puzzling to explain why being a New Jersey resident, holding all else constant, had a favorable impact on the probability of ordering the Planning Kit. Other variables not captured by or influenced by the campaign may be at work here including the following:
- More urban/densely populated than other campaign states. Helps promote word of mouth awareness of the campaign.
- Impact of multiple touches from spillover from the New York State media campaign and Federal Long-Term Care Insurance Program marketing.
- More active insurance market.
- More industry activity designed around the campaign.
- Nature of the Medicaid program in the state.
- Cost of care and occupancy rates for nursing homes in the state.
- Perhaps New Jersey has fewer extended families living there, such that people would be concerned about not having informal supports available to them for long-term care support.
Some of these variables may be unique to New Jersey compared to the other Phase I states, but Virginia is likely to be similar to New Jersey in some respects, in terms of having an active insurance market, especially exposure to messages from the Federal Long-Term Care Insurance Program campaign and a more similar urban/density mix. Some of the other states (e.g., Idaho, Nevada and Arkansas) are likely to have fewer extended families and perhaps fewer long-term care resources -- which should theoretically increase interest in learning more about how to plan for long-term care needs, but it did not appear to do so.
Another possibility is that a letter from the Governor of New Jersey provoked greater interest there because the Governor was very much in the news for reasons unrelated to long-term care at the time just prior to the campaign. While the campaign letter was sent from the Acting Governor who took over for him, the media exposure over the Governors departure may have raised interest in a letter from the Governors office. Indeed, even though New Jersey residents had fewer touches by virtue of not having any television as part of our campaign, their overall response rates in terms of Kit requests is fairly similar to the states that did have television, either alone or in combination with radio. This suggests that perhaps other factors were acting to stimulate interest.
III. FINDINGS: COMPARING PRE-CAMPAIGN AND POST-CAMPAIGN RESPONSES
This section summarizes findings exclusively from the follow-up sample -- those nearly 3,000 individuals who participated in both the pre-campaign and post-campaign survey. The pre-campaign survey was conducted in late fall 2004. The awareness campaign was conducted from January to May 2005. The post-campaign survey was conducted about one year after that in the fall of 2005.
This section of the analysis focuses on the sequence of survey questions that asked about several specific planning options and whether or not the respondent was aware of any or all of these options. For each option, if they indicated that they were aware of it, they were subsequently asked if they had ever considered the option. If they had considered it, then they were asked if they had taken the action.
Responses on these questions were then compared for the segment of the sample that participated in both the pre and post-survey interviews. We further divided the analysis by those who received the Kit and those who did not to see whether or not receiving the Kit had an impact on raising awareness of these planning options.
Awareness of planning options, in every case, increased between the pre-survey and post-survey interviews. This holds true both for those who received the Kit and for those who did not. Moreover, the percent increase in awareness of a planning option is not significantly different between those who received the Kit and those who did not receive it. One possible explanation for this is that, during the campaign, increased attention in the market area was focused on the issue of planning for long-term care; in fact, the largest percent increase observed in comparing the pre and post-survey results (21%) is in response to the question, In the past few months, have you seen, heard or read anything about long-term care? This question is not specific to the campaign, but could well indicate that residents of these states were receiving planning messages in the media and from direct mail initiatives sponsored by insurers seeking sales lift from the campaign.
When asked if they had taken any actions as a result of what they saw, read or heard, individuals receiving the Planning Kit had a statistically significant increase in the percent of respondents who said YES in post-campaign survey compared with the pre-campaign survey. Specifically, the increase was 20% for Kit receivers and only 11% for those who did not receive the Kit. So while the general media and other communications about long-term care going on during the campaign may have raised awareness of options in all respondents, receiving the Kit seems to have promoted individuals to take some type of action as a result.
| TABLE 10: Awareness of Planning Options: Percent Change Pre vs. Post-Survey | ||
| Aware of Planning Option | Received Planning Kit | Did Not Receive Kit |
| Rearranging finances to qualify for Medicaid | 15% | 16% |
| Buying long-term care insurance | 8% | 8% |
| Talking to financial planner | 13% | 12% |
| Talking to agent to learn if you are adequately insured for long-term care | 13% | 14% |
| Move closer to family or friends for help | 6% | 7% |
| Read information or complete checklists on how to plan | 20% | 19% |
| Make minor home modifications | 4% | 5% |
| Move to assisted living facility or CCRC for additional help | 5% | 5% |
| Talk to family or friends about long-term care | 15% | 15% |
| See, read or hear anything about long-term care | 21% | 21% |
| Did you take any action as a result of what you read, saw or heard? | 20%** | 11% |
| *p0.1; **p0.05; ***p 0.001. | ||
Responders were asked both in the pre and post-campaign survey whether they had considered taking any of the actions of which they had heard. For this question, there were statistically significant differences between those that received the Planning Kit and those who had not, with respect to the following planning options:
- Consult with an agent.
- Move closer to family.
- Read or make checklists on how to plan.
- Talk with family or friends about long-term care.
Specifically, individuals who received the Planning Kit showed a significant increase in their likelihood to consider consulting an insurance agent after the campaign than did those not receiving the Kit (8% vs. 4% change). They also showed a significant increase in their likelihood, after the campaign, to consider moving closer to family or friends if they needed care (14% vs. 9% change). In the post-campaign survey, those who received the Kit were less likely to consider reading information or making checklists on how to plan, perhaps because they had already read meaningful information in the Kit and felt more ready to plan, compared with those who had not received the Kit (-4% vs. 1% change).
Individuals who received the Kit did not show any change after the campaign in their consideration of talking with family or friends about long-term care planning. Those who did not receive the Kit were more inclined to do so (0% vs. 5% change). Again, those who received the Kit may have felt less need to consult with others since they had information from the Kit to give them a focus for planning activities.
| TABLE 11: Considered Planning Options: Percent Change Pre vs. Post-Survey | ||
| Consider Planning Option | Received Planning Kit | Did Not Receive Kit |
| Rearranging finances to qualify for Medicaid | 17% | 12% |
| Buying long-term care insurance | 10% | 10% |
| Talking to financial planner | 2% | 3% |
| Talking to agent to learn if you are adequately insured for long-term care** | 8% | 4% |
| Move closer to family or friends for help* | 14% | 9% |
| Read information or complete checklists on how to plan*** | -4% | 1% |
| Make minor home modifications | 9% | 8% |
| Move to assisted living facility or CCRC for additional help | 11% | 15% |
| Talk to family or friends about long-term care* | 0% | 5% |
| *p0.1; **p0.05; ***p 0.001. | ||
Finally, with respect to changes in whether people had actually taken any of these steps, as measured by this sequence of questions, there were no significant differences between those who received the Kit and those who did not. Both groups showed some increase in terms of whether they said they had taken any of these steps. This could, in part, also reflect the influence of other long-term care messages being delivered at the time of the campaign. Another important factor to consider is that this sequence of questions was rather tedious. This question represented the third time an individual who have been asked about a specific planning action. Some respondents may have learned that if they said NO to the prior question (e.g., have you considered this option), then they would not be asked the follow-up question (e.g., have you taken this option?).
| TABLE 12: Taken Planning Step: Percent Change Pre vs. Post-Survey | ||
| Taken the Planning Step | Received Planning Kit | Did Not Receive Kit |
| Rearranging finances to qualify for Medicaid | 3% | 5% |
| Buying long-term care insurance | 6% | 7% |
| Talking to financial planner | 16% | 15% |
| Talking to agent to learn if you are adequately insured for long-term care | 11% | 14% |
| Move closer to family or friends for help | 8% | 11% |
| Read information or complete checklists on how to plan | 24% | 20% |
| Make minor home modifications | 11% | 10% |
| Move to assisted living facility or CCRC for additional help | 4% | 2% |
| Talk to family or friends about long-term care | 22% | 18% |
| *p0.1; **p0.05; ***p 0.001. | ||
Indeed, there are some inconsistencies in the responses in the pre and post-survey which suggest that this question sequence may not have worked very effectively. For example, some people said YES to the question Have you heard of this option? in the pre-survey, but said NO in the post-survey. Certainly, it does not make much sense that someone would have heard of long-term care insurance in the pre-survey but not have heard of it in the post-survey. It is possible, however, that they learned that there would be fewer follow-up questions if they said NO than if they said YES.
Additionally, we do observe some inconsistencies in the data overall in that, when asked directly about whether certain actions were taken (e.g., talk to an agent or financial planner, consider a reverse mortgage, review existing coverage, or buy long-term care insurance), we do see statistically significant differences between those who received the Kit and those who did not. Since this question was not asked in the pre-survey, we are not able to compare respondents pre and post-campaign answer to this question.
IV. CONCLUSION AND SUMMARY
Key findings and conclusions based on the Consumer Survey from Phase I of Own Your Future Awareness Campaign include the following:
Did Consumers Order and Read the Planning Kit?
The campaign was successful in terms of generating requests for the Long-Term Care Planning Kit. The response rate to the direct mail and media campaign was about 8% across these states. This response rate compares favorably to the generally 5% seen in social marketing campaigns and far exceeds the typical response rates for industry-based direct mail campaigns.
While the vast majority of those receiving the Planning Kit say they read it (80%), only a small portion (17%) said they listened to the Success Stories CD in the Kit.
Who Ordered the Planning Kit?
Individuals from all demographic segments within the target market found relevance in the campaign. Consistent with other research, attitudes are more important than demographics in explaining differences between individuals who ordered the Kit and those who did not do so. Still, some demographic differences were observed. Individuals who ordered the Planning Kit better fit the profile associated with a planner in terms of a having a higher educational level and having other financial products typical of planners such as an IRA, 401K, or annuity.
Salience of the long-term care issue seems to also be an important factor in whether or not someone ordered the Planning Kit. Individuals who are closer to the time when they might need long-term care (e.g., retirees; those age 65-69 as compared to those ages 55-59) are indeed more likely to request the Planning Kit.
However, some individuals associated in other research with being more focused on planning behaviors for long-term care (e.g., buying long-term care insurance) were actually less likely to order the Kit, all else equal. Specifically, females and married couples were less likely to request the Planning Kit. This may in part reflect the fact that they are already further along in their planning activities or have or planned to seek out other venues for getting information on their long-term care options.
What Roles do Long-Term Care Experience or Knowledge Play?
Long-term care experience is an important factor influencing whether or not someone requests a Planning Kit. This is consistent with other research which finds, as this study did, that individuals who had a close family member who needed long-term care or who knew someone who used up their savings paying for care were more likely to order the Kit than those who did not share those same experience. This is one reason that personal stories and testimonials to tell the facts about long-term care and the value of planning are an important way to motivate interest in this topic among those that do not yet have this personal experience of their own.
The campaign resonated most effectively with planners -- people who possess the following combination of traits: a belief in the value and benefits of planning; a belief that they may someday need long-term care; concern about being a burden on their family for care; and concern about how they will get help if they need it.
We found significant differences between Kit responders and non-responders in terms of their knowledge and perception of who pays for long-term care. Individuals who ordered the Planning Kit were more likely to see long-term care as an area of personal financial responsibility, while those who believed Medicare or Medicaid would pay were less inclined to order the Planning Kit. This analysis, however, does not tell us whether these viewpoints were held before they ordered the Kit, or whether receiving the Kit helped to accurately inform these individuals about the risks and costs associated with future long-term care needs.
Did Receiving the Kit Have an Impact on Planning Actions?
Both groups (those receiving Planning Kit and those who did not) have been exposed to a great deal of long-term care information in the media and mail over the duration of the campaign. However, those receiving the Planning Kit were nearly twice as likely to take any action as a result of what they saw, read, or heard. Specifically, individuals who received the Planning Kit were nearly twice as likely to buy long-term care insurance after the campaign as those who did not receive the Kit. They were also more likely to take other planning actions, including evaluating their existing insurance coverage to see if it covered long-term care, to consult with a financial planner or agent, or to look into a reverse mortgage.
Multivariate Analysis
Several variables emerged as significant in a multivariate analysis explaining factors important in motivating someone to order the Planning Kit. Specifically, a variable was constructed to measure ones attitude toward planning. As mentioned above, individuals with a planning orientation are more likely to have an interest in learning more about how they can plan ahead for their long-term care needs.
A variable was also constructed to measure the level of campaign exposure. Consistent with other research, multiple exposures to the key messages was found to be important and to increase the likelihood that someone will request the Planning Kit. These multiple touches could be in the form of the initial Governors letter, a media spot, or a follow-up postcard.
The analysis also showed that people who believe that they may someday need long-term care are, naturally, more interested in learning more about how they can protect themselves from the risks and costs of that event.
Surprisingly, age, being female and being married are all negatively related to the probability of ordering a Planning Kit. Younger individuals likely have competing needs (e.g., school age children) and may not have begun other important planning like general retirement. Perhaps they are likely to see long-term care as something they can put off until the event seems closer. Other research finds that females and married individuals are actually more likely to engage in a variety of long-term care planning activities, most notably, buying long-term care insurance. In our survey, they may have been less likely to order the Planning Kit because they had already begun or were about to begin other planning activities on their own.
Consistent with other research, individuals who having a college degree or higher are more likely to take steps to plan ahead for their long-term care needs. In our survey, they were more likely to have ordered the Planning Kit.
Finally, a more difficult finding to explain is the importance of Being a New Jersey resident on the probability of ordering the Planning Kit, holding all else equal. The report provides a variety of possible explanations, most notably that this may be standing in for a variable we were unable to measure (e.g., the amount of private insurance industry activity in a state) or might have been influenced by a heightened curiosity among New Jersey residents, given the controversy around the Governors office at the time of the campaign.
The comparison of responses for the pre-campaign and post-campaign survey tells us something about changes in awareness, attitudes and behaviors during the timeframe of the campaign.
Looking across time, awareness of planning options, in every case, increased between the pre-survey and post-survey interviews. However, the percent increase in awareness of a planning option was not found to be significantly different between those who received the Planning Kit and those who did not. One possible explanation is that, during the campaign, increased attention in the market area was focused on the issue of long-term care planning, so it is possible that awareness grew as a result of the campaign and related activities rather than specifically as a result of the Planning Kit.
However, when we look at planning actions under consideration, individuals who received the Planning Kit were more likely to report an increase in the likelihood that they would consider taking some kind of planning action as a result, when compared with those who did not receive the Planning Kit. These actions included: consulting with an agent or financial planner, moving closer to family or friends or talking to family or friends about long-term care issues.