
U.S. Department of Health and Human Services
An Exploratory Study of Certified Nursing Assistants Intent to Leave
Marie R. Squillace, Ph.D., Anita Bercovitz, Ph.D., Emily Rosenoff, M.P.A., and Robin Remsburg, Ph.D.
September 22, 2008
PDF Version: http://aspe.hhs.gov/daltcp/reports/2008/intent.pdf (29 PDF pages)
This This report was prepared for the U.S. Department of Health and Human Services (HHS), Office of Disability, Aging and Long-Term Care Policy (DALTCP). For additional information about this subject, you can visit the DALTCP home page at http://aspe.hhs.gov/_/office_specific/daltcp.cfm or contact the ASPE Project Officer, Marie Squillace, at HHS/ASPE/DALTCP, Room 424E, H.H. Humphrey Building, 200 Independence Avenue, S.W., Washington, D.C. 20201. Her e-mail addresses is: Marie.Squillace@hhs.gov.
The opinions and views expressed in this report are those of the authors. They do not necessarily reflect the views of the Department of Health and Human Services.
TABLE OF CONTENTS
- METHODS
- VARIABLES
- ANALYSIS
- DISCUSSION
- WHO ARE THE LEAVERS AND STAYERS?
- WHY CONTINUE TO WORK?
- REASONS FOR INTENT TO LEAVE
- LIST OF EXHIBITS
- EXHIBIT 1: Select Nursing Assistant Characteristics by Intent to Leave
- EXHIBIT 2: Nursing Assistant Job Satisfaction by Intent to Leave
- EXHIBIT 3: Nursing Assistant Job Search Activity, Commitment to Facility and Field by Intent to Leave
- EXHIBIT 4: Reasons Nursing Assistants Continue to Work
- EXHIBIT 5: Reasons Nursing Assistants Dislike Their Jobs
ABSTRACT
High nursing assistant (NA) turnover is disruptive to quality of care and is costly. Findings from the first national probability survey of NAs in nursing homes document the magnitude of potential turnover. In 2004, 45% of NAs reported they were very or somewhat likely to leave their job in the next year, 24% were actively looking for another job, and 18% were extremely or somewhat dissatisfied with their job. Intent to leave was associated with job satisfaction, demographics, job experience, commitment to the field, and commitment to the job. This exploratory study underscores the importance of supervision, pay and benefits, and the work environment, suggesting that strategies for stabilizing the NA workforce address these issues.
INTRODUCTION
The nursing home industry has been plagued for decades by considerable difficulty in recruiting and retaining adequate numbers of nursing assistants (NAs), workers who provide the majority of hands-on personal care to nursing home residents (Stone & Wiener, 2001). Turnover among NAs is 13-18% higher than the overall labor force and 20% higher than other service workers (GAO, 2001). Providers estimate a national annual turnover rate over 70% and nearly 52,000 vacant certified NA positions, with variation ranging from 40-100% (Decker, et al., 2003; Castle, 2006). High turnover in nursing homes suggests that recruiting and retaining NAs is a constant and major effort. Nursing facilities often resort to the use of contract workers and mandatory overtime, strategies that can exacerbate poor working conditions, turnover and vacancy rates (Golden, 2005).
For the industry, the consequences of inadequate staffing and gaps in staffing are substantial, increasing costs to the provider and the payer in excess of $4 billion annually, reducing worker morale and safety, and undermining the continuity of patient care and care quality (GAO, 2001; Seavey, 2004; CMS, 2004). The industry must also contend with an undeniable shift in aging demographics where the pool of individuals in the general workforce relative to the aged population will continually decrease over the next 50 years (HHS, 2003). Nursing homes are also charged with recruiting staff to jobs that entail hard work, little career mobility, and modest pay and finding ways to create a more rewarding and satisfying work environment (GAO, 2001; HHS, 2003).
To date, few studies have examined NA intent to leave in nursing homes as a means of identifying important aspects of their jobs. In 2007, Castle and colleagues (2007) reviewed this literature in detail and observed that many prior studies were limited by small sample sizes, poor performing job satisfaction instruments; methods involving the use of aggregate registered nurse, licensed practical nurse, and certified nurse aide (CNA) data, and generalizability.
At a time when recruiting and retaining paraprofessional workers has become a high priority issue for states (Harmuth & Dyson, 2005), a first national probability survey of NAs working in nursing homes was conducted by the U.S. Department of Health and Human Services (HHS) to provide a framework for future evidence-based policy, practice and applied research initiatives to address the long-term care workforce shortage. In this exploratory paper we examine data from this new survey to identify the magnitude of potential worker turnover among certified NAs employed in the United States, using intent to leave as the measure of potential turnover. We present descriptive associations of intent to leave with demographics, job experience, job satisfaction, job search, and commitment to the field and commitment to the specific job. To provide additional insight on NAs motivations and concerns we present self-reported reasons why NAs continue to work in their current job, and problems with their jobs or reasons NAs dislike their jobs.
METHODS
Data Source. In 2004, the Office of the Assistant Secretary for Planning and Evaluation sponsored the first National Nursing Assistant Survey (NNAS). The NNAS was conducted as a supplement to the 2004 National Nursing Home Survey (NNHS), a probability survey conducted periodically by the National Center for Health Statistics, Centers for Disease Control and Prevention. The NNHS includes all facilities that had at least three beds and were either certified by Medicare or Medicaid, or were licensed as a nursing home by the state.
The NNHS multi-stage probability sample involves the selection of facilities at the first stage, stratified by bed size and metropolitan area status, and a systematic random sample of residents within these nursing homes at the second stage. A random sub-sample (790) of the 1,500 nursing homes selected to participate in the NNHS were selected to participate in the NNAS. During onsite data collection for the NNHS, a systematic random sample of NAs was selected. The selection of NAs was stratified by tenure at the sampled nursing facility (1 year or >1 year). NAs were eligible to participate if they: (1) provided assistance with activities of daily living; (2) were paid to provide those services; (3) were certified (or in the process of certification) to provide Medicare/Medicaid reimbursable services; (4) worked at least 16 hours per week; and (5) were employees of the nursing home and not contract employees. For the NNAS, data were collected through telephone interviews with the NAs during non-work time between September 2004 and January 2005.
Among the 769 nursing homes eligible and selected to participate in the NNAS (out of 790 sampled), 21% did not participate in any aspect of the NHHS, 3% elected not to participate in the NNAS, and 76% participated in the NNAS. Among the 4,542 NAs sampled, 4,274 were eligible to participate and 3,017 completed an interview, resulting in a 71% NA response rate. The sample of 3,017 NAs, when weighted, represents 702,500 NAs. Details on the sampling, estimation process and computation of weights are available elsewhere (Squillace, et al., 2006).
VARIABLES
NA responses to the question, How likely is it that you will leave this job in the next year? (very likely, somewhat likely, not at all likely) were used as the measure of intent to leave. Intent to leave has been found to correlate with actual turnover (Harris, James & Boonthanom, 2005) and has been shown to be a strong predictor of voluntary turnover (Tett & Meyer, 1993). Less than 1% of NAs had missing information on this variable and were excluded from the analyses.
In this study, we examine demographic variables, including age (25; 25-34; 35-44 and >45), race (Black; White; other), marital status (married or living with a partner; widowed, divorced or separated; never married), education (12 years; GED or high school graduate; one or more years of college or trade school), family income ($20,000; $20,000-$30,000; $30,000-$40,000; >$40,000), citizenship (United States citizen or not) and primary language spoken (English or other). A measure of whether the NA cared for another family member1 (yes; no) was included as this may have an impact on their ability to take another job.
Job-related characteristics were examined through tenure as a CNA and at the sampled facility, and the number of jobs in the past five years (1; 2-4; 5 or more). Tenure as a CNA was measured as total time worked as a NA (1 year; 1-2 years; 2-5 years; 6-10 years; 11 or more years), and tenure at the facility was measured with a time worked at the facility (1 year; >1 year). We also examined hourly wage; and current receipt of either Temporary Assistance to Needy Families (TANF), Women Infants and Childrens Program (WIC), or Food Stamps.
To look at job satisfaction we report overall job satisfaction and satisfaction with specific aspects of their current job: workplace morale, doing challenging work, benefits, salary and learning new skills (extremely or somewhat dissatisfied, somewhat satisfied and extremely satisfied). We also explored the relationship between intent to leave and job search;2 organizational commitment as measured by whether they would take their current job again;3 and whether they would recommend family or friends work as an NA at this facility;4 and commitment to the field as measured by whether they would become an NA again,5 whether their next job would be as a NA or as something else, and whether they would recommend becoming an NA.6
To provide additional insight on NAs motivations and concerns we present self-reported reasons why NAs continue to work in their current job, and problems with their jobs or reasons the NAs dislike their jobs. In addition, for NAs who reported they were somewhat or very likely to leave their job in the next year, we present self-reported reasons they would leave.
Although facility and market factors influence nursing homes turnover rates (Castle & Engberg, 2005), there is weak evidence for the role of facility and market characteristics in predicting intent to leave or actual turnover within one year (Castle, et al., 2007), therefore, we do not include these factors in our analysis.
ANALYSIS
Cochran-Mantel-Hantzel chi-square statistics were used to analyze the relationship between intent to leave and other categorical variables. A t-test was used to compare mean hourly wage. Unless otherwise noted, if an association is mentioned it is statistically significant. Three sets of pair-wise comparisons were made for each independent variable: very likely to leave compared to somewhat likely to leave; very likely to leave compared to not likely to leave; and somewhat likely to leave compared to not likely to leave. Bonferroni adjustment was made to account for the multiple comparisons, and an adjusted p-value of 0.0167 was used as the significance level.
STUDY FINDINGS
In 2004, 18% of NAs reported they were very likely to leave their job in the next year; 27% reported they were somewhat likely to leave and 55% reported not at all likely to leave.
DEMOGRAPHICS AND WORK EXPERIENCE
Exhibit 1 summarizes the worker characteristics and job history by intent to leave. Overall 40% of NAs are under 35 years of age. The majority are White (53%); 51% are married or living with a partner; 63% had a GED or are high school graduates; 24% had one or more years of college; 36% have an annual family income of less than $20,000; and 40% are caring for a family member or child. Approximately 9% are not United States citizens and 11% speak a language other than English as their primary language. Seventy-three percent had two or more jobs in the past five years; and 72% of NAs have worked one or more years at the sampled nursing facility. Thirty-five percent had worked as an NA for 11 or more years, whereas 26% have worked for 2-5 years and 11% have worked as an NA for one year or less.
NAs who were either very or somewhat likely to leave were different from NAs who were not likely to leave on age, marital status, education, citizenship and primary language. A greater proportion of NAs who were somewhat or very likely to leave were under age 35; had one or more years of college; were not married; were non-citizens, and had a language other than English as their primary language. The only significant difference in income was among those somewhat likely to leave and those not likely to leave with a greater proportion of those somewhat likely to leave earning less than $20,000 per year.
Intent to leave was also associated with the number of jobs worked in the previous five years, total time worked as an NA and the length of time worked at the sampled facility. More NAs who were either somewhat or very likely to leave worked more than one job in the past five years, worked fewer than 11 years as an NA and worked less than one year at the sampled facility.
Nineteen percent of NAs who were very likely to leave were currently receiving public benefits,7 compared to 20% of those somewhat likely to leave, and 15% of those not likely to leave (not shown). The proportion receiving public benefits was significantly higher for those somewhat likely compared to those not likely to leave, but other comparisons were not significant (not shown). The average hourly rate for NAs very likely to leave was $9.77 (median $9.50); significantly lower than for those somewhat likely to leave (mean $9.95, median $9.91) and those not intending to leave (mean $10.76, median $10.40) (not shown).
JOB SATISFACTION
Eighteen percent of all NAs were extremely or somewhat dissatisfied with their job, while 51% were somewhat satisfied and 31% were extremely satisfied with their job (Exhibit 2). However, there were significant differences in job satisfaction among all groups by intent to leave. While 8% of NAs who were not likely to leave their job were dissatisfied, 24% of those somewhat likely to leave and 41% of those very likely to leave were dissatisfied. Of the NAs who were extremely satisfied with their job, 20% were very or somewhat likely to leave and 80% were not likely to leave; whereas among NAs that were dissatisfied with their job, 77% were very or somewhat likely to leave and 23% were not likely to leave. Similar differences were seen for satisfaction with workplace morale and opportunity to learn new skills. Greater proportions of NAs very or somewhat likely to leave were dissatisfied with their satisfaction with salary, benefits and doing challenging work.
JOB SEARCH ACTIVITY AND COMMITMENT TO FACILITY AND FIELD
There were significant differences by intent to leave comparing all three groups in job search activity, commitment to the facility and commitment to the field (Exhibit 3). About 24% of NAs reported they were currently looking for a different job. An additional 4% said they were not looking, but thinking about it, and 72% were not looking for another job. However, while 7% of NAs who were not likely to leave their job were looking for another job, 55% of NAs very likely to leave and 39% of NAs somewhat likely to leave were looking for another job (Exhibit 3). Among NAs looking for another job, 40% were very likely to leave and 16% were not likely to leave; whereas among NAs not job searching 11% were very likely to leave and 67% were not likely to leave.
Both measures of NAs commitment to their facility were also associated with intent to leave. Seventeen percent of all NAs reported they would definitely or probably not take their current job again. However, only 6% of NAs who were not likely to leave would not take their job again, compared to 43% of NAs very likely to leave. Of those NAs who would definitely not take their job again, 45% were very likely to leave and 20% were not likely to leave; whereas among NAs who would definitely take their job again, 9% were very likely to leave and 75% were not likely to leave. Similar patterns of responses were seen whether the NAs would recommend family or friends work as a NA at the facility.
Intent to leave was associated with two measures of commitment to the field, while not associated with another measure. When asked if they would become an NA again, only 11% of all NAs indicated they would not become a NA again, 23% of NAs very likely to leave would not become an NA again, compared to 7% of NAs not likely to leave. Virtually identical responses were seen when asked whether they would advise family or friends to become an NA. However, there were no differences by intent to leave in the proportion of NAs who reported their next job would be as an NA. While roughly half of NAs reported their next job would be as an NA while half reported it would be something else.
REASONS NURSING ASSISTANTS STAY ON THE JOB
Exhibit 4 depicts the reasons NAs continue to work at their current job. Virtually all NAs report they continued to work at their current job because they like caring for others (99%) or feel good about the work that they do (97%). Almost two-thirds of all NAs continue to work because of the work location (69%), flexible schedule or hours (69%), or because they liked their co-workers (77%). Over half of NAs report their supervisor (62%), opportunities for career advancement (52%), pay (50%), or opportunities for overtime (51%) as reasons for staying on the job. Thirty-six percent of NAs reported they continued to work because of the benefits. Several other reasons were specified, however, none of these responses were reported frequently enough to make reliable estimates, and thus are not presented.
The subset of NAs who intended to leave and those that did not intend to leave differed in reasons for continuing to work at their current job. Compared to NAs intending to leave their jobs, more NAs not intending to leave report feeling good about the work, liking co-workers, flexible schedule or hours, their supervisor, career advancement, opportunities for overtime, pay, and benefits as reasons they continue to work (not shown).
REASONS NURSING ASSISTANTS DISLIKE THEIR JOBS
Exhibit 5 depicts the problems that cause NAs to dislike their job. Among all NAs, the most frequently reported problems that cause NAs to dislike their job are co-workers (30%), workload (26%), and supervisors (23%). More NAs who intended to leave reported complaints about their job than NAs who did not intend to leave. NAs who intended to leave and those that did not intend to leave differed in the problems that make them dislike their job. A greater proportion of NAs who intended to leave their job cited lack of respect, poor pay or benefits, or problems with supervisor or nurses as problems that cause them to dislike their job (not shown). Although many other reasons were reported as problems that make them dislike their job (e.g., nature of the job, new rules or procedures, schedule, health or personal issues, equipment or supplies, behavior problems of residents), none were reported frequently enough to make reliable estimates or to compare across groups and thus are not presented.
REASONS NURSING ASSISTANTS LEAVE THEIR JOBS
NAs who indicated that they intended to leave were asked the reasons why they would leave their job. The most frequently reported reasons for why they would leave include poor pay, finding a new or better job, working conditions, having too many residents to care for, and poor benefits. Slightly over one-third of NAs that were very or somewhat likely to leave cited poor pay, just under 30% cited finding a new or better job, and at least 10% of both groups cited working conditions, having too many residents to care for and poor benefits (not shown). Among NAs somewhat likely versus those very likely to leave there were no differences among reasons given for leaving, except more NAs who were very likely to leave cited problems with supervisors as a reason why they would leave (not shown).
DISCUSSION
Our findings documenting the magnitude of potential NA turnover are consistent with findings of high annual worker turnover in nursing homes observed over the past several decades (Decker, et al., 2003; Castle, 2006; Castle & Engberg, 2005). Almost half of NAs reported they were either somewhat or very likely to leave their job in the next year, and about one of four NAs were currently looking for a different job. As the NNAS is a cross-sectional study, it is not possible to determine whether NAs who said they intended to leave, or were looking for another job actually left. However, studies confirm that intent to leave is closely correlated with actual turnover (Castle, et al., 2007; Irvine & Evans, 1995). Thus, it is reasonable to infer that a substantial proportion of those who report they intend to leave will, in fact, do so (Castle, Degenholtz & Rosen, 2006).
The high demand for NAs nationally is unlikely to abate. The NNAS estimates that over 700,000 NAs held jobs in nursing homes in 2004, a number that is expected to increase by 22% across settings between 2004-20148 (BLS, 2007). Beyond predictions of job growth, our findings support a potential loss within the current workforce at a critical time when additional NAs are needed to meet current and future demand.
This studys findings on commitment to the field are conflicting. While two measures of commitment to being a NA are associated with intent to leave: whether the NA would take their current job again and whether they would recommend being a NA as a job; there were no differences by intent to leave in the proportion of NAs who reported whether their next job would be a NA. Further research should examine these variables to clarify their association with intent to leave.
Although the association between job satisfaction and turnover is well-established in other health care settings (Irvine & Evans, 1995), we are just beginning to learn about this relationship in a nursing home setting. Findings from a recent study confirm the relationship between intent to leave, job satisfaction and actual turnover of nurse aides and emphasize that workload, training, and rewards (e.g., wages) are strongly associated with worker intent to leave and turnover (Castle, et al., 2007). Consistent with this and other studies (Castle, Degenholtz & Rosen, 2006; Tett & Meyer, 1993), the present study demonstrates the association between intent to leave and job satisfaction, both overall and specific aspects of the job. Thus, monitoring and finding ways to improve job satisfaction could play a crucial role in retention initiatives (Parsons, et al., 2003). Facilities should regularly assess satisfaction of their employees (taking a periodic pulse/satisfaction check), and actively work toward improving areas of worker dissatisfaction to help retain their employees. Differences in satisfaction with workplace morale and in learning new skills between NAs who were somewhat and very likely to leave suggest that facilities should also monitor satisfaction with aspects of the job. The WIN A STEP UP program, for example, is an ongoing workforce development intervention aimed at improving the working situation of NAs that has shown improvements in job satisfaction and workplace morale (Morgan & Konrad, 2008).
WHO ARE THE LEAVERS AND STAYERS?
The need to understand factors contributing to vacancy rates and high turnover is paramount to improving retention of NAs. Our exploratory findings support other studies that have identified characteristics of NAs who are likely to stay or leave or who are looking for another position (Caudill & Patrick, 1991a; Castle, et al., 2007). NAs who reported they intended to leave were more likely to be younger, widowed, divorced or separated, have a higher education, be a non-United States citizen, speak a language other than English as their primary language, and have lower tenure both in the current position and during their career. Identifying the reasons for turnover among these workers could facilitate the development of retention strategies that could be tailored specifically for at-risk groups. In contrast, NAs not at all likely to leave were age 45 and over, married or living with partner, have a 12th grade education or less, were United States citizens, and speak English as a primary language.
WHY CONTINUE TO WORK?
Reasons NAs continue to work in their current job and reasons they are likely to leave provide insight on areas where nursing homes might focus their efforts to retain workers. The overwhelming majority of NAs reported that they stayed on the job because they felt good about the work they did or they enjoyed caring for others. Thus, strategies that promote the value of their work and capitalize on co-worker relationships may improve NAs retention. Some studies indicate that allowing NAs to develop meaningful relationships with residents through consistent work assignments, and employing the use of buddies or mentors, can improve satisfaction and retention of NAs (Parsons, et al., 2003; Hegeman & Munro, 2003).
REASONS FOR INTENT TO LEAVE
Identifying reasons NAs dislike their job, or choose to leave after entering the industry could play a vital role in determining strategies to improve workforce adequacy and stability (Caudill & Patrick, 1991b). Although our findings revealed numerous problems identified by all NAs, we focus discussion here on the main reasons for wanting to leave among the NAs intending to leave.
Work Environment/Conditions, Workload
Through leadership and human resource practices, administrators and nurse managers can control job design and the work environment of NAs. Lack of respect or appreciation plays an important role in workforce stability and has been confirmed in other studies (Bowers, Esmond & Jacobson, 2000). Problems with ones supervisor was also associated with intent to leave. Supervisors may reduce turnover by making workers feel more involved in decision-making through participation in interdisciplinary care plan meetings or self-managed work teams, and can improve satisfaction through professional growth initiatives and keeping employees better informed (Banaszak-Holl & Hines, 1996; Waxman, Carner & Berkenstock, 1984; Yeatts & Seward, 2000). Consistent assignments to residents and improving positive interactions among staff and residents may improve worker retention as well (Margaret Blenkner Research Institute, 2006). Certain management practices used to empower NAs have also been shown to influence resident outcomes (Barry, Brannon & Mor, 2005; Pillemer, et al., 2008). Practical solutions are possible, but require commitment on the part of facility administration to create a satisfying work environment.
Pay and Benefits
Although roughly one out of every five NAs in the study identified pay or benefits as a problem, among NAs likely to leave about one out of every three NAs cited pay as a reason they would leave their job. Results from this exploratory study also indicate that the average hourly wage for NAs not at all likely to leave was less than $1 per hour higher than those who indicated that they were somewhat or very likely to leave. This may support higher wages as an incentive to continue working at the nursing home, thereby reducing turnover rates. Studies in nursing homes and other long-term care settings, such as home care, suggest that competitive wages do make a difference in building a high quality workforce and also point to the provision of benefits to reduce turnover and increase retention (Howes, 2008; Kash, et al., 2006; CMS, 2001; Seavey & Salter, 2006).
Although NA wages have increased over the past 20 years and in many states wages exceed the minimum wage (Harmuth & Dyson, 2005), maintaining a satisfactory life style on nurse aide wages is difficult. In this study, one in five NAs somewhat or very likely to leave were receiving either TANF, WIC or Food Stamps which reinforces the difficulties NAs may have in supporting themselves on their wages alone.
States have attempted to improve wages through a variety of strategies, including reforming reimbursement rate-setting methods, implementing wage pass-through legislation or rate enhancements linked to provider performance, seeking improved reimbursement methods through litigation, implementing collective bargaining strategies or living wage ordinances and minimum wage increases, and implementing various health insurance initiatives (Seavey & Salter, 2006).
Of these strategies, wage pass-through legislation that allows for Medicaid or other public payment rate increases to be earmarked to raise wages for long-term care staff has been widely implemented, with over 40% of long-term care wage pass-through programs for workers in nursing homes (Seavey & Salter, 2006). Yet findings across the few evaluations completed to date (that lack a comparison group) do not support the efficacy of these programs or a particular approach (IFAS, 2002; Harris-Kojetin, et al., 2004). There is little evidence as to whether wage pass-through programs affect recruitment and retention. The wage increases are often small and enforcement and accountability mechanisms for pass-throughs are often lacking (Seavey & Salter, 2006). Further evaluation of these programs and development of other strategies that increase income or reduce expenses may be useful in maintaining and/or building the nursing home workforce.
IMPLICATIONS
Policymakers have long recognized that staffing is essential to quality. The Omnibus Budget Reconciliation Act of 1987 set a precedent for policymakers to improve quality through improved staffing. To ensure quality of care, policymakers need to address the issues that affect workforce stabilization. Our results show that pay and benefits, the work environment and supervision are important aspects of direct care work. The issue of good supervision becomes especially important as the acuity of patients increases in nursing homes and increased pressures are placed on NAs requiring new skills, more training, better care coordination, and more support from their supervisors.
Although compensation is central to the recruitment and retention of workers, there is no single solution to the pay and benefits issue as nursing homes remain strongly dependent on public reimbursement. Pay-for-performance is a reimbursement strategy that is growing in importance in the health sector. More payers and purchasers are using performance-based incentives to reimburse acute and primary care providers, but less attention has been focused on how best to reward long-term care providers for attaining better quality outcomes. A growing body of evidence linking staffing to quality outcomes (Castle & Engberg, 2006) suggests that workforce measures may be a viable option for linking payment to quality and for improving staff retention. Under the auspices of the Better Jobs Better Care Research and Demonstration Program, the North Carolina voluntary state licensure program creates incentives that may lead to workforce improvement (IFAS, 2006). An evaluation of such incentive program, however, is needed to identify which staffing measures and program features may work best to improve quality.
STUDY LIMITATIONS
Our results cannot be generalized to all NAs working in United States nursing homes. Contract workers, part-time workers (those working less than 16 hours per week at the facility), non-certified workers, workers who only provide assistance with instrumental activities of daily living, workers who did not speak English or Spanish, and workers in facilities excluded from the NNHS (those with fewer than three beds and not certified by Medicare or Medicaid or have a state license to operate as a nursing home) were not included in the survey; therefore results may not be applicable to these workers. The groups excluded from the NNAS are likely to have different experiences and work preferences, and in turn, may differ in their workplace satisfaction, problems experienced, reasons for continuing to work on the job and intention to leave their job.
In addition, the NNAS collected a limited amount of data on workers who terminated employment (N=120, both voluntary and involuntary) between the time they were sampled and participated in the survey, therefore these NAs are not included in the analyses. The lack of information on this group coupled with the small number prevent definitive conclusions to be drawn about these workers as either a separate group or by using direct comparisons with those workers still employed at the sampled homes. Finally, analyses in this exploratory study are limited to bi-variate associations which may be correlated and may confound the associations. Further research is needed to disentangle possible correlations among variables and assess their independent contributions.
CONCLUSION
The major advance of the NNAS over other studies of intent to leave is its use of a nationally representative sample of CNAs within a nationally representative sample of nursing homes. All previous studies have been of local or regional samples that were not representative of the country as a whole. As states move forward with efforts to reform their long-term care systems, it is critical that the existing workforce be expanded, supported, and trained for the responsibilities they will need to undertake in an ever growing long-term care system in order to continue providing high care quality. This exploratory study underscores the importance of supervision, pay and benefits, and the work environment, suggesting that strategies for stabilizing the NA workforce address these issues.
BIBLIOGRAPHY
Banaszak-Holl, J. & Hines, M.A. (1996). Factors associated with nursing home staff turnover. The Gerontologist, 36(4):512-7.
Barry, T.T., Brannon, D. & Mor, V. (2005). Nurse aide empowerment strategies and staff stability: Effects on nursing home resident outcomes. The Gerontologist, 45(3):309-17.
BLS (2007). 2004-2014 Employment Projections: Table 3d. The 10 Occupations with the Largest Job Growth, 2004-2014. Available from: http://stats.bls.gov/news.release/ecopro.t06.htm.
Bowers, B.J., Esmond, S. & Jacobson, N. (2000). The relationship between staffing and quality in long-term care facilities: Exploring the views of nurse aides. J Nurs Care Qual, 14(4):55-64.
Castle, N.G. (2006). Measuring staff turnover in nursing homes. The Gerontologist, 46(2):210-9.
Castle, N.G., Degenholtz, H. & Rosen, J. (2006). Determinants of staff job satisfaction of caregivers in two nursing homes in Pennsylvania. BMC Health Serv Res, (6):60.
Castle, N.G. & Engberg, J. (2005). Staff turnover and quality of care in nursing homes. Medical Care, 43(6):616-26.
Castle, N.G. & Engberg, J. (2006). Organizational characteristics associated with staff turnover in nursing homes. The Gerontologist, 46(1):62-73.
Castle, N.G., Engberg, J., Anderson, R. & Men, A. (2007). Job satisfaction of nurse aides in nursing homes: Intent to leave and turnover. The Gerontologist, 47(2):193-204.
Caudill, M.E. & Patrick, M. (1991a). Turnover among nursing assistants: Why they leave and why they stay. Journal of Long Term Care Administration, 19(4):29-32.
Caudill, M.E. & Patrick, M. (1991b). Costing nurse turnover in nursing homes. Nurse Manage, 22(11):61-2, 64.
CMS (2002). Appropriateness of Minimum Staffing Ratios in Nursing Homes. Baltimore, MD: Centers for Medicare and Medicaid Services, U.S. Department of Health and Human Services.
CMS (2004). Appropriateness of Minimum Staffing Ratios in Nursing Homes. Baltimore, MD: Centers for Medicare and Medicaid Services, U.S. Department of Health and Human Services.
Decker, F., Dollard, K. & Kraditor, K. (2003). Results of the 2002 AHCA Survey of Nursing Staff Vacancy and Turnover in Nursing Homes. Washington, DC: American Health Care Association.
GAO (2001). Nursing Workforce: Recruitment and Retention of Nurses and Nurse Aides is a Growing Concern. Washington, DC: U.S. Government Accountability Office, GAO-01-750T.
Golden, I. (2005). Mandatory overtime work in the United States: Who, where and what? Labor Studies Journal, Spring:1-26.
Harmuth, S. & Dyson, S. (2005). Results of the 2005 National Survey of State Initiatives on the Long-term Care Direct-Care Workforce. National Clearinghouse on the Direct Care Workforce, Direct Care Workers Association of North Carolina.
Harris, K.J., James, M. & Boonthanom, R. (2005). Perceptions of organizational politics and cooperation as moderators of the relationship between job strains and intent to turnover. Journal of Managerial Issues, XVII:26-42.
Harris-Kojetin, L., Lipson, D., Fielding, J., Kiefer, K. & Stone R.L. (2004). Recent Findings on Frontline Long-Term Care Workers: A Research Synthesis 1999-2003. Washington, DC: Office of the Assistant Secretary for Planning and Evaluation, U.S. Department of Health and Human Services. Available from: http://aspe.hhs.gov/daltcp/reports/insight.htm.
Hegeman, C. & Munro, H. (2003). The Effect of Peer Mentors on Nursing Home Aides: 4th Interim Report July 1, 2002-January 31, 2003. New York, NY: Foundations for Long Term Care, Inc.
HHS & DOL (2003). The Future Supply of Long-Term Care Workers in Relation to the Aging Baby Boom Generation: Report to Congress. Washington, DC: Office of the Assistant Secretary for Planning and Evaluation, U.S. Department of Health and Human Services. Available from: http://aspe.hhs.gov/daltcp/reports/ltcwork.htm.
Howes, C. (2008). Love, money, or flexibility: What motivates people to work in consumer-directed home care? The Gerontologist, 48(1):46-59.
IFAS (2002). State Wage Pass-Through Legislation: An Analysis. Washington, DC: Office of the Assistant Secretary for Planning and Evaluation, U.S. Department of Health and Human Services. Available from: http://aspe.hhs.gov/daltcp/reports/wagepass.htm.
IFAS (2006). NC Grantee Creates First Program to Reward High Quality Workforce. Washington, DC: Institute for the Future of Aging Services.
Irvine, D.M. & Evans, M.G. (1995). Job satisfaction and turnover among nurses: Integrating research findings across studies. Nurs Res, 44(4):246-53.
Kash, B. (2006). Effect of staff turnover on staffing: A closer look at registered nurses, licensed vocational nurses, and certified nursing assistants. The Gerontologist, 46(5):609-19.
Morgan, J.C. & Konrad, T. (2008). A mixed method evaluation of a workforce development intervention for nursing assistants in nursing homes: The case of WIN A STEP UP. The Gerontologist, 48(1):71-9.
Parsons, S.K., Simmons, W.P., Penn, K. & Furlough, M. (2003). Determinants of satisfaction and turnover among nursing assistants. The results of a statewide survey. J Gerontol Nurs, 29(3):51-8.
Pillemer, K., Meador, R., Henderson, C., Robinson, J., Hegeman, C., Graham, E., & Schultz, L. (2008). A facility specialist model for improving retention of nursing home staff: Results from a randomized, controlled study. The Gerontologist, 48(1):80-9.
Seavey, D. (2004). The Cost of Frontline Turnover in Long-Term Care. Washington, DC: Institute for the Future of Aging Services, American Association of Homes and Services for the Aging.
Seavey, D. & Salter, V. (2006). Paying for Quality Care: State and Local Strategies for Improving Wages and Benefits for Personal Care Assistants. Washington, DC: AARP Public Policy Institute.
Squillace, M.R., Remsburg, R.E., Bercovitz, A., Rosenoff, E. & Branden, L. (2006). An Introduction to the National Nursing Assistant Survey. Washington, DC: Office of the Assistant Secretary for Planning and Evaluation, U.S. Department of Health and Human Services. Available from: http://aspe.hhs.gov/daltcp/reports/2006/NNASintro.htm.
Stone, R.I. & Wiener, J.M. (2001). Who Will Care for Us? Addressing the Long-Term Care Workforce Crisis. Washington, DC: Office of the Assistant Secretary for Planning and Evaluation, U.S. Department of Health and Human Services. Available from: http://aspe.hhs.gov/daltcp/reports/ltcwf.htm.
Tett, R. & Meyer, J. (1993). Job satisfaction, organizational commitment, turnover intention, and turnover: Path analysis based on meta-analytic findings. Personnel Psychology, 46(2):259-93.
Waxman, H.M., Carner, E.A. & Berkenstock, G. (1984). Job turnover and job satisfaction among nursing home aides. The Gerontologist, 24(5):503-9.
Yeatts, D.E. & Seward, R.R. (2000). Reducing turnover and improving health care in nursing homes: The potential effects of self-managed work teams. The Gerontologist, 40(3):358-63.
| EXHIBIT 1: Select Nursing Assistant Characteristics by Intent to Leave(National Nursing Home Survey 2004-2005) | ||||||||
| Nursing Assistant Characteristic | Total | Very Likely to Leave | Somewhat Likely to Leave | Not At All Likely to Leave | ||||
| (#) | (%) | (#) | (%) | (#) | (%) | (#) | (%) | |
| TOTAL | 673,600 | 100.0 | 119,500 | 100.0 | 184,900 | 100.0 | 369,200 | 100.0 |
| AGE (b,c) | ||||||||
| 25 | 114,800 | 17.0 | 29,100 | 24.4 | 39,800 | 21.5 | 45,900 | 12.4 |
| 25-34 | 158,100 | 23.5 | 32,800 | 27.5 | 51,000 | 27.6 | 74,200 | 20.1 |
| 35-44 | 164,500 | 24.4 | 23,500 | 19.7 | 45,700 | 24.7 | 95,300 | 25.8 |
| 45 and over | 236,200 | 35.1 | 34,100 | 28.5 | 48,400 | 26.2 | 153,700 | 41.6 |
| RACE | ||||||||
| White | 359,800 | 53.4 | 58,700 | 49.1 | 91,600 | 49.6 | 209,500 | 56.7 |
| Black | 261,100 | 38.8 | 48,900 | 40.9 | 78,800 | 42.6 | 133,400 | 36.1 |
| Other (1) | 52,800 | 7.8 | 11,900* | 10.0* | 14,500* | 7.8* | 26,400 | 7.1 |
| MARITAL STATUS (b,c) | ||||||||
| Married/living with partner | 343,500 | 51.2 | 51,900 | 43.5 | 89,500 | 48.7 | 202,200 | 55.0 |
| Widowed/divorced/separated | 150,000 | 22.4 | 34,000 | 28.5 | 32,400 | 17.6 | 83,600 | 22.8 |
| Never married | 177,100 | 26.4 | 33,400 | 28.0 | 62,000 | 33.7 | 81,800 | 22.3 |
| CARES FOR FAMILY MEMBER OR CHILD NEEDS CARE | ||||||||
| Yes | 263,600 | 40.3 | 51,100 | 44.0 | 75,500 | 42.4 | 137,100 | 38.0 |
| No | 391,200 | 59.7 | 65,000 | 56.0 | 102,500 | 57.6 | 223,700 | 62.0 |
| EDUCATION (b,c) | ||||||||
| 12 years | 87,000 | 13.0 | 9,300* | 7.9* | 22,700 | 12.4 | 55,000 | 15.0 |
| GED or high school graduate | 418,200 | 62.6 | 69,300 | 58.8 | 110,500 | 60.2 | 238,400 | 64.9 |
| 1 or more years of college | 163,200 | 24.4 | 39,200 | 33.3 | 50,300 | 27.4 | 73,700 | 20.1 |
| FAMILY INCOME (2)(c) | ||||||||
| $20,000 | 244,200 | 36.3 | 46,400 | 38.8 | 79,100 | 42.8 | 118,700 | 32.1 |
| $20,000 to $30,000 | 182,800 | 27.1 | 30,900 | 25.8 | 47,600 | 25.7 | 104,400 | 28.3 |
| $30,000 to $40,000 | 157,700 | 23.4 | 29,100 | 24.4 | 34,900 | 18.9 | 93,600 | 25.4 |
| $40,000 or more | 65,000 | 9.6 | 9,300* | 7.8* | 16,200 | 8.8 | 39,400 | 10.7 |
| CITIZENSHIP (b,c) | ||||||||
| Citizen of U.S. | 611,900 | 91.1 | 105,000 | 87.8 | 162,200 | 88.2 | 344,800 | 93.7 |
| Not U.S. citizen | 59,500 | 8.9 | 14,600* | 12.2* | 21,700 | 11.8 | 23,200 | 6.3 |
| PRIMARY LANGUAGE (b,c) | ||||||||
| English primary language | 598,000 | 89.1 | 102,400 | 85.7 | 158,500 | 86.6 | 337,100 | 91.5 |
| Other language is primary language | 72,900 | 10.9 | 17,100 | 14.3 | 24,600 | 13.4 | 31,200 | 8.5 |
| CHARACTERISTICS OF CURRENT JOB | ||||||||
| NUMBER OF JOBS WORKED IN PAST 5 YEARS (b,c) | ||||||||
| 1 | 180,800 | 26.8 | 19,900 | 16.7 | 33,800 | 18.3 | 127,000 | 34.4 |
| 2 to 4 | 395,900 | 58.8 | 77,100 | 64.5 | 113,600 | 61.5 | 205,100 | 55.6 |
| 5 or more | 96,800 | 14.4 | 22,500 | 18.8 | 37,300 | 20.2 | 37,100 | 10.0 |
| TOTAL TIME WORKED AS AN NA (b,c) | ||||||||
| 1 year | 75,100 | 11.2 | 17,700 | 14.8 | 23,400 | 12.7 | 33,900 | 9.2 |
| 1 year to 2 years | 54,200 | 8.1 | 15,000 | 12.6 | 19,300 | 10.5 | 19,900 | 5.4 |
| 2 to 5 years | 176,900 | 26.3 | 34,600 | 29.0 | 57,400 | 31.1 | 84,900 | 23.1 |
| 6 to 10 years | 127,900 | 19.0 | 23,500 | 19.7 | 35,100 | 19.0 | 69,300 | 18.8 |
| 11 years or more | 238,000 | 35.4 | 28,600 | 23.9 | 49,500 | 26.8 | 160,000 | 43.5 |
| TIME WORKED AT SAMPLED FACILITY (b,c) | ||||||||
| 1 year | 186,000 | 28.1 | 42,100 | 35.9 | 61,400 | 33.9 | 82,500 | 22.8 |
| 1 or more years | 474,800 | 71.9 | 75,100 | 64.1 | 119,600 | 66.1 | 280,000 | 77.2 |
NOTES: Numbers may not add to totals because of rounding. Percentages are based on unrounded numbers and exclude unknowns and missing items. * Figure does not meet standard of reliability or precision because the sample size is less than 30. If shown with an estimate, the estimate should not be assumed reliable because the sample size is between 30 and 59, or the sample size is greater than 59, but has a relative standard error of 30% or more.
| ||||||||
| EXHIBIT 2: Nursing Assistant Job Satisfaction by Intent to Leave(National Nursing Home Survey: United States 2004-2005) | ||||||||
| Job Satisfaction | Total | Very Likely to Leave | Somewhat Likely to Leave | Not Likely to Leave | ||||
| (#) | (%) | (#) | (%) | (#) | (%) | (#) | (%) | |
| INTENT TO LEAVE | 673,600 | 100.0 | 119,500 | 17.7 | 184,900 | 27.4 | 369,200 | 54.8 |
| OVERALL JOB SATISFACTION (a) | ||||||||
| Extremely or somewhat dissatisfied | 121,600 | 18.1 | 49,000 | 41.0 | 44,500 | 24.1 | 28,100 | 7.6 |
| Somewhat satisfied | 345,800 | 51.4 | 54,400 | 45.5 | 114,000 | 61.8 | 177,300 | 48.1 |
| Extremely satisfied | 205,600 | 30.6 | 16,100 | 13.5 | 25,900 | 14.1 | 163,500 | 44.3 |
| SATISFACTION WITH ASPECTS OF CURRENT JOB | ||||||||
| WORKPLACE MORALE (a) | ||||||||
| Extremely or somewhat dissatisfied | 136,800 | 20.5 | 42,200 | 35.5 | 41,300 | 22.6 | 53,300 | 14.5 |
| Somewhat satisfied | 350,700 | 52.5 | 58,000 | 48.7 | 108,300 | 59.2 | 184,400 | 50.3 |
| Extremely satisfied | 181,000 | 27.1 | 18,800 | 15.8 | 33,300 | 18.2 | 128,900 | 35.2 |
| DOING CHALLENGING WORK (b,c) | ||||||||
| Extremely or somewhat dissatisfied | 39,700 | 5.9 | 15,500 | 13.0 | 14,400* | 7.9* | 9,700* | 2.7* |
| Somewhat satisfied | 331,800 | 49.7 | 63,600 | 53.3 | 106,500 | 58.5 | 161,700 | 44.1 |
| Extremely satisfied | 296,700 | 44.4 | 40,300 | 33.7 | 61,100 | 33.6 | 195,300 | 53.2 |
| BENEFITS (b,c) | ||||||||
| Extremely or somewhat dissatisfied | 228,100 | 34.6 | 60,100 | 52.1 | 77,900 | 42.8 | 90,200 | 24.9 |
| Somewhat satisfied | 276,200 | 41.9 | 34,600 | 30.0 | 80,700 | 44.4 | 160,900 | 44.4 |
| Extremely satisfied | 155,400 | 23.6 | 20,700 | 17.9 | 23,300 | 12.8 | 111,400 | 30.7 |
| SALARY (b,c) | ||||||||
| Extremely or somewhat dissatisfied | 266,100 | 39.6 | 67,700 | 56.7 | 89,900 | 48.9 | 108,400 | 29.4 |
| Somewhat satisfied | 281,600 | 41.9 | 39,200 | 32.8 | 75,600 | 41.1 | 166,700 | 45.2 |
| Extremely satisfied | 124,900 | 18.6 | 12,500* | 10.4* | 18,500 | 10.0 | 93,900 | 25.4 |
| LEARNING NEW SKILLS (a) | ||||||||
| Extremely or somewhat dissatisfied | 81,500 | 12.1 | 26,100 | 22.1 | 24,900 | 13.5 | 30,500 | 8.3 |
| Somewhat satisfied | 292,300 | 43.5 | 56,100 | 47.5 | 94,900 | 51.4 | 141,400 | 38.3 |
| Extremely satisfied | 298,000 | 44.4 | 35,800 | 30.3 | 64,900 | 35.1 | 197,400 | 53.5 |
NOTES: Numbers may not add to totals because of rounding. Percentages are based on unrounded numbers and exclude unknowns and missing items. * Figure does not meet standard of reliability or precision because the sample size is less than 30. If shown with an estimate, the estimate should not be assumed reliable because the sample size is between 30 and 59, or the sample size is greater than 59, but has a relative standard error of 30% or more.
| ||||||||
| EXHIBIT 3: Nursing Assistant Job Search Activity, Commitment to Facility and Field by Intent to Leave(National Nursing Home Survey 2004-2005) | ||||||||
| Commitment to Facility and Field | Total | Very Likely to Leave | Somewhat Likely to Leave | Not Likely to Leave | ||||
| (#) | (%) | (#) | (%) | (#) | (%) | (#) | (%) | |
| INTENT TO LEAVE | 673,600 | 100.0 | 119,500 | 17.7 | 184,900 | 27.4 | 369,200 | 54.8 |
| JOB SEARCH (a) | ||||||||
| Looking for a different job | 162,500 | 24.2 | 64,700 | 54.7 | 71,500 | 38.8 | 26,300 | 7.1 |
| Not looking or thinking about looking for a different job | 509,300 | 75.8 | 53,700 | 45.3 | 112,900 | 61.2 | 342,700 | 92.9 |
| WOULD TAKE CURRENT JOB AGAIN (a) | ||||||||
| Definitely not or probably not take job again | 112,400 | 16.8 | 51,100 | 42.9 | 39,400 | 21.5 | 21,900 | 5.9 |
| Probably take job again | 260,200 | 38.8 | 40,500 | 34.1 | 96,200 | 52.4 | 123,400 | 33.5 |
| Definitely take job again | 298,300 | 44.5 | 27,400 | 23.0 | 48,000 | 26.1 | 222,900 | 60.5 |
| WOULD YOU RECOMMEND FAMILY OR FRIENDS WORK AS AN NA AT THIS FACILITY (a) | ||||||||
| Definitely or probably not recommend | 109,200 | 16.3 | 42,600 | 35.8 | 38,000 | 20.7 | 28,600 | 7.8 |
| Probably recommend | 262,900 | 39.2 | 46,200 | 38.8 | 90,300 | 49.1 | 126,500 | 34.3 |
| Definitely recommend | 299,000 | 44.6 | 30,200 | 25.4 | 55,600 | 30.2 | 213,300 | 57.9 |
| WOULD YOU BECOME A NURSING ASSISTANT AGAIN (a) | ||||||||
| Definitely or probably not become one | 70,600 | 10.5 | 27,000 | 22.6 | 19,700 | 10.8 | 23,900 | 6.5 |
| Probably become one | 184,000 | 27.5 | 30,400 | 25.5 | 63,300 | 34.6 | 90,300 | 24.6 |
| Definitely become one | 414,600 | 62.0 | 61,900 | 51.9 | 99,900 | 54.6 | 252,800 | 68.9 |
| WOULD YOU RECOMMEND FAMILY OR FRIENDS BECOME AN NA (b,c) | ||||||||
| Definitely or probably not recommend | 68,800 | 10.3 | 18,800 | 15.9 | 21,200 | 11.6 | 28,800 | 7.8 |
| Probably recommend | 236,200 | 35.4 | 43,300 | 36.7 | 73,100 | 40.1 | 119,800 | 32.6 |
| Definitely recommend | 362,500 | 54.3 | 55,800 | 47.3 | 88,300 | 48.3 | 218,400 | 59.5 |
| WILL YOUR NEXT JOB BE AS AN NA OR SOMETHING ELSE | ||||||||
| Something else | 305,500 | 47.4 | 59,600 | 52.6 | 81,500 | 46.5 | 164,300 | 46.2 |
| Nursing Assistant | 338,800 | 52.6 | 53,600 | 47.4 | 93,800 | 53.5 | 191,400 | 53.8 |
NOTES: Numbers may not add to totals because of rounding. Percentages are based on unrounded numbers and exclude unknowns and missing items. * Figure does not meet standard of reliability or precision because the sample size is less than 30. If shown with an estimate, the estimate should not be assumed reliable because the sample size is between 30 and 59, or the sample size is greater than 59, but has a relative standard error of 30% or more.
| ||||||||
| EXHIBIT 4: Reasons Nursing Assistants Continue to Work(United States 2004-2005) |
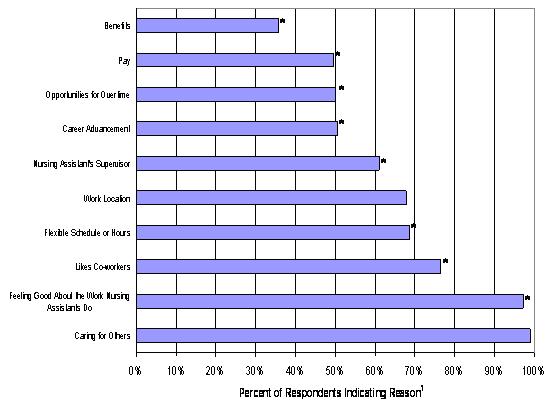 |
SOURCE: U.S. Department of Health and Human Services, Office of the Assistant Secretary for Planning and Evaluation and the National Center for Health Statistics, National Nursing Assistant Survey, 2004-2005. * Significantly (p0.025) more NAs who indicated that they were not likely to leave selected response compared to NAs who said they were very or somewhat likely to leave.
|
| EXHIBIT 5: Reasons Nursing Assistants Dislike Their Jobs(United States 2004-2005) |
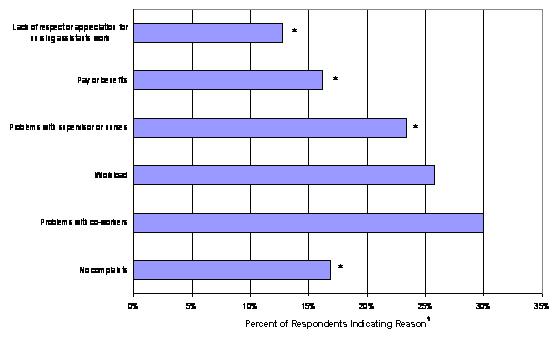 |
SOURCE: U.S. Department of Health and Human Services, Office of the Assistant Secretary for Planning and Evaluation and the National Center for Health Statistics, National Nursing Assistant Survey, 2004-2005. * Significantly (p0.025) more NAs who indicated that they were very or somewhat likely to leave selected response compared to NAs who said they were not likely to leave, except for No Complaints where the direction was reversed.
|
NOTES
-
This variable was defined by whether NAs responded that either they were currently taking care of a family member, relative or friend who has a disability or health problem, or whether they had children who lived with them who required child care while they were at work.
-
The question was Are you currently looking for a different job either as a nursing assistant or doing something else? Response categories were yes; no; no but thinking about it. Overall, 3.8% of NAs responded no, but thinking about it. This category was too small to analyze separately by likelihood of leaving. Thus, response categories no and no, but thinking about it were combined and compared to NAs responding yes.
-
Categorized as Definitely or probably not take the job again/Probably take the job again/Definitely take the job again.
-
Categorized as Definitely or probably not recommend/Probably recommend/Definitely recommend.
-
Categorized as Definitely or probably not become one/Probably become one/Definitely become one.
-
Categorized as Definitely or probably recommend/Probably recommend/Definitely recommend.
-
Defined as any of the following: TANF, WIC, or Food Stamps.
-
Includes nursing aides, orderlies and attendants Bureau of Labor Statistics (BLS) occupation code 31-1012.
To obtain a printed copy of this report, send the full report title and your mailing information to:
U.S. Department of Health and Human ServicesOffice of Disability, Aging and Long-Term Care PolicyRoom 424E, H.H. Humphrey Building200 Independence Avenue, S.W.Washington, D.C. 20201FAX: 202-401-7733Email: webmaster.DALTCP@hhs.gov
RETURN TO:
Office of Disability, Aging and Long-Term Care Policy (DALTCP) Home [http://aspe.hhs.gov/_/office_specific/daltcp.cfm]Assistant Secretary for Planning and Evaluation (ASPE) Home [http://aspe.hhs.gov]U.S. Department of Health and Human Services Home [http://www.hhs.gov]