
Evaluation Planning and Tools for Front of Package Nutrition LabelingFinal Report
September 2012
By Andrea S. Anater Kelly Wohlgenant Sheryl Cates James Hersey Mary K. Muth, Dan Zaccaro, Chen Zhen RTI International
Prepared for: Kathleen Koehler Office of Science and Data Policy Office of the Assistant Secretary for Planning and Evaluation (ASPE) Department of Health and Human Services
Abstract
Front-of-package (FOP) nutrition labeling systems are tools that can help consumers choose healthy diets consistent with the Dietary Guidelines for Americans. It is expected that consumers’ use of nutrition information when making food purchasing decisions will improve their dietary choices and result in their reduced risk of obesity and chronic diseases. FDA would like to monitor and evaluate existing and future FOP symbols to assess the extent of their adoption by manufacturers and retailers; the number and types of products on which symbols appear; whether consumers notice, understand, and use FOP symbols; and potential product reformulation resulting from inclusion of FOP symbols on products. RTI International used these goals as the basis for developing evaluation questions and study options that can guide FDA’s policy planning efforts.
Disclaimer
This report was prepared by RTI International, under contract to the Assistant Secretary for Planning and Evaluation. The findings and conclusions of this report are those of the authors and do not necessarily represent the views of ASPE or HHS.
This report is available on the internet at:http://aspe.hhs.gov/sp/reports/2012/FrontOfPackageNutritionLabelingFinal...
Printer friendly version in PDF format (117 pages)[Free PDF reader Exit disclaimer]
Contents
- Executive Summary
- 1. Background and Purpose
- 2. Evaluation Plan Development
- 3. Consumer Design and Analysis Plan
- 4. Manufacturer and Retailer Design and Analysis Plan
- 5. Core Plan for Proposed Evaluation of FOP Nutrition Labeling
- Endnotes
- References
- Appendix
- Figures
- Tables
- 1-1. Broad Comparison of FOP and Shelf-Label Types
- 3-1. Consumer Evaluation Questions and Corresponding Shorthand Notations
- 3-2. Study Designs Considered for Consumer Evaluation Questions
- 3-3. Comparison of Methods Proposed to Answer Consumer Evaluation Questions
- 3-4. Methods by Consumer Evaluation Questions
- 3-5. Power under Varying Assumptions
- 4-1. Manufacturer and Retailer Evaluation Questions and Corresponding Shorthand Notations
- 4-2. Comparison of Methods and Data Sources Proposed to Answer Manufacturer and Retailer Evaluation Questions
- 4-3. Methods by Manufacturer and Retailer Questions
EXECUTIVE SUMMARY
Front-of-package (FOP) nutrition labeling systems—summary or selected information about the nutritional content of foods that appears on the front of food packages—are a tool that can help consumers choose healthy diets consistent with the Dietary Guidelines for Americans (DGAs). Although some FOP symbols are nutrient specific and display key nutrients from the Nutrition Facts Panel (NFP), others are summary systems that use an algorithm to provide an overall nutritional score. The Food and Drug Administration (FDA) and other nutrition and public health officials are concerned that multiple FOP nutrition symbols in the marketplace might confuse consumers. In 2009, FDA declared FOP nutrition labeling a top priority and pledged to establish science-based standards and voluntary guidelines for FOP nutrition labeling.
ES.1 Recent FOP Nutrition Labeling System Initiatives
More recently, an Institute of Medicine (IOM) study released in 2011 recommended a simplified FOP symbol, modeled on the Energy Star symbol that appears on many appliances. The symbol would appear on the fronts of packages and show the number of calories per serving and zero to three stars or checkmarks to indicate the food’s healthiness. Also in 2011, the industry trade associations Grocery Manufacturers Association (GMA) and Food Marketing Institute (FMI) collaboratively launched a nutrient-based FOP nutrition labeling system with both absolute amounts and a percentage daily value (%DV), named Facts Up Front (previously Nutrition Keys). The Facts Up Front design is intended to bring key information from the NFP to the front of the package to provide consumers with easier access to nutrition information when making food purchasing decisions. In 2012, Walmart initiated an FOP system, named Great For You, for its private-label products with the expectation that branded product manufacturers would also adopt the system. The Great For You symbol will be present on foods that meet two-step criteria. Step 1 encourages fruits, vegetables, whole grains, low-fat dairy, nuts/seeds, and lean meats, and Step 2 limits total fat, trans fat, saturated fat, sodium, and added sugars. In addition to these FOP symbols, other FOP symbols and shelf-labeling systems, such as NuVal and Guiding Stars, are in the marketplace.
ES.2 FDA’s Goals for FOP Systems and Evaluation Planning
FDA is interested in increasing consumers’ use of accurate nutrition information, grounded in the DGAs, when making food purchasing decisions, particularly among consumers who are not currently using nutrition information to guide their decisions. FDA wants to ensure that the FOP symbol is designed to enable consumers with a wide range of literacy, educational levels, age, and other characteristics to compare the relative healthiness of products within and across food categories. In the long term, it is expected that consumers’ use of nutrition information when making food purchasing decisions will improve their dietary choices and result in their reduced risk of obesity and chronic diseases. FDA would like to monitor and evaluate existing and future FOP symbols to assess the extent of their adoption by manufacturers and retailers; the number and types of products on which symbols appear; whether consumers notice, understand, and use FOP symbols; and potential product reformulation resulting from inclusion of FOP symbols on products. RTI International used these goals as the basis for developing evaluation questions and study options that can guide FDA’s policy planning efforts.
ES.3 Evaluation Questions and Development of Evaluation Options
Following the Centers for Disease Control and Prevention’s (CDC’s) Evaluation Framework, a set of evaluation questions was developed and prioritized based on an FOP labeling program logic model and with input from the Office of the Assistant Secretary for Planning and Evaluation (ASPE), FDA, and the RTI evaluation team. The prioritized evaluation questions that investigate the effects of the FOP symbol on consumers are the following:
- Do consumers notice the FOP symbol?
- 1a. Do consumers notice manufacturers’ and retailers’ FOP symbol education efforts?
- Can consumers understand the healthiness of products using the FOP symbol?
- Do consumers use the FOP symbol when purchasing products?
- Is consumer understanding of the FOP symbol affected by coexisting FOP or shelf- labeling symbols?
The prioritized evaluation questions that investigate the effects of the FOP symbol on manufacturers and retailers are the following:
- How many (or what proportion of) products and product categories have the FOP symbol and how does it vary across products and product categories?
- 1a. How many (or what proportion of) branded and private-label products have adopted the FOP symbol?
- How are manufacturers and retailers monitoring implementation of and compliance with the FOP symbol?
- How has the FOP symbol affected product sales volumes?
- Since the introduction of the FOP symbol, have product sales volumes of reformulated products changed?
- What types of products have been reformulated since introduction of the FOP symbol?
- How many (or what proportion of) products have been reformulated since introduction of the FOP symbol?
- What types of nutrients have been affected by the FOP symbol’s reformulation and to what extent?
Using an evaluation planning matrix as a guide, the RTI evaluation team developed an evaluation plan that provides options for addressing each evaluation question, including potential data sources and methods, and the strengths and limitations of each approach. In developing the evaluation plan, RTI assumed the primary focus would be to assess the population impact, across population groups, of a widely distributed and currently existing FOP symbol. Furthermore, RTI considered
- whether data would be collected using a nationally representative, probability-based sample or other method to represent the diversity of consumers’ backgrounds;
- whether data would be collected using an experimental or nonexperimental approach;
- resources required for the evaluation, taking into account possible efficiencies from addressing multiple questions with similar approaches; and
- time required to address a question using a particular method, considering the timing of availability of data sources.
ES.4 Options for Evaluation
RTI presents the evaluation options as a phased approach because some evaluation questions become relevant only if evaluation studies to address certain other questions show positive effects or if sufficient time has passed for changes to have occurred in the marketplace. In addition, given resource constraints, FDA may wish to partition the evaluation over multiple years. Prior to beginning the evaluation, the FOP symbol must be defined, sufficient penetration determined, reformulation criteria defined, and if the evaluation plan is to include analysis of sales data based on an assessment of the product’s healthiness, criteria for what constitutes healthy determined. Lastly, it is critical that baseline data are collected as early as possible in the process. Across all three evaluation phases, the evaluation question “How are manufacturers and retailers monitoring implementation of and compliance with the FOP symbol?” can be addressed periodically, as part of FDA’s ongoing outreach efforts with industry.
In addition to the evaluation options presented, FDA could undertake two relatively low-cost activities that would build off its existing surveys:
- Images of food products in the recurring Food Label and Package Survey (FLAPS) could be coded and analyzed for the presence and types of FOP symbols.
- Questions regarding consumer notice and use of FOP labels could be added to the recurring Health and Diet Survey (HDS).
However, because of the infrequency of these surveys and somewhat limited sample sizes, both of these methods may not be sufficient to address all of FDA’s evaluation needs.
ES.4.1 Phase 1 of the Evaluation Plan: Manufacturer and Retailer Adoption and Consumer Notice of the FOP Symbol
The first phase of the evaluation would consider the extent of manufacturer and retailer adoption of the FOP symbol and whether consumers are noticing FOP symbols. These questions are grouped first for the following reasons:
- The FOP symbol will need to have been adopted by manufacturers and retailers for a sufficient number of products so that consumers with varying purchasing habits would have an opportunity to have noticed it on products.
- Whether consumers notice the FOP symbol or the associated education campaign should be addressed prior to the other consumer questions because the response to this question will serve as the exposure screen for the remaining questions.
The first set of evaluation questions to be addressed in Phase 1 and possible approaches are as follows:
- Questions:
- How many (or what proportion of) products and product categories have the FOP symbol and how does it vary across products and product categories? (manufacturer-retailer Q1)
- How many (or what proportion of) branded and private-label products have adopted the FOP symbol? (manufacturer-retailer Q1a)
- How many (or what proportion of) products and product categories have the FOP symbol and how does it vary across products and product categories? (manufacturer-retailer Q1)
- Approaches:
- Primary approach: Analyze proprietary Universal Product Code (UPC)-level food and nutrition label databases such as Gladson or Mintel, which include images of product packages that can be used to code products for the existence of FOP symbols, including both branded and private-label products.
- Alternative approach: Conduct a store survey of food labels to determine the proportions of products with the FOP symbol, which would provide more current data than the primary approach.
The second set of evaluation questions to be addressed in Phase 1 and possible approaches are as follows:
- Questions:
- Do consumers notice the FOP symbol? (consumer Q1)
- Do consumers notice the manufacturer’s and retailer’s FOP symbol education efforts? (consumer Q1a)
- Do consumers notice the FOP symbol? (consumer Q1)
- Approaches:
- Primary approach: Conduct a nationally representative probability-based Web survey that asks questions about whether consumers recall seeing the FOP symbol or the education campaign, possibly supplemented with an eye-tracking study with a smaller sample of consumers to determine whether consumers visually notice the FOP symbol on product packages.
- Alternative approach: Conduct the Web survey using a nonprobability-based Web panel if this approach is considered to have sufficient generalizability to the U.S. population, with or without a complementary eye-tracking study.
ES.4.2 Phase 2 of the Evaluation Plan: Consumer Use and Understanding of the FOP Symbol and the Effect of the FOP Symbol on Product Sales
The second set of questions would evaluate consumer use and understanding of the FOP symbol, including when there are coexisting FOP or shelf-labeling systems, and the effect of the FOP symbol on product sales. These questions should be addressed after the questions in Phase 1 to ensure that a sufficient number (or proportion) of products display the FOP symbol and that consumers are noticing the symbols to ensure that underreporting of the effect does not occur. The first set of evaluation questions to be addressed in Phase 2 and possible approaches are as follows:
- Questions:
- Can consumers understand the healthiness of products using the FOP symbol? (consumer Q1)
- Do consumers use the FOP symbol when purchasing products? (consumer Q3)
- Is consumer understanding of the FOP symbol affected by coexisting FOP or shelf-labeling systems? (consumer Q4)
- Approaches:
- Primary Approach: Conduct an experimental study using a nationally representative probability-based Web survey with an embedded simulated shopping study in a virtual grocery store, which would include multiple conditions with product images and associated questions to test understanding and use, with or without varying the conditions for coexisting FOP symbols.
- Alternative Approach: Conduct the Web survey with an embedded simulated shopping study using a nonprobability-based Web panel, if this approach is considered to have sufficient generalizability to the U.S. population.
A critical objective of an FOP nutrition labeling system is that it assists consumers in making healthy dietary choices. The question and possible approaches to address this objective are as follows:
- Question:
- How has the FOP symbol affected product sales volumes? (manufacturer-retailer Q3)
- Approaches:
- Primary approach: Append sales volume information from scanner data to the UPC-level food and nutrition label database that was coded for the existence of the FOP symbol in Phase 1 and conduct analyses to determine if sales volumes are higher for healthier products with the FOP symbol relative to those that are less healthy, as indicated by the symbol or coded based on criteria determining whether products are healthy or less healthy.
- Alternative approach: Expand the sales volume data over multiple years to analyze whether sales volumes increased for healthier products and decreased for less healthy products after introduction of the FOP symbol.
Note that the evaluation of how the FOP symbol has affected product sales volumes (manufacturer-retail Q3) can be used to validate the results of the evaluation of whether consumers are using the FOP symbol when purchasing products (consumer Q3) because the respective methods are two different ways to assess the outcome.
ES.4.3 Phase 3 of the Evaluation Plan: Effect of the FOP Symbol on Product Reformulation and Sales of Reformulated Products
The third phase would evaluate whether and which types of products with the FOP symbol have been reformulated, which nutrients were affected, and the effects on products sales. These questions are grouped and included in the final phase because product reformulation tends to occur over an extended period; thus, evaluating the effects on reformulation would need to occur later than the other studies.
The first set of evaluation questions to be addressed in Phase 3 and possible approach are as follows:
- Questions:
- What types of products have been reformulated since introduction of the FOP symbol? (manufacturer-retailer Q5)
- How many (or what proportion of) products have been reformulated since introduction of the FOP symbol? (manufacturer-retailer Q6)
- What types of nutrients have been affected by the FOP symbol’s reformulation and to what extent? (manufacturer-retailer Q7)
- Approach:
- Using multiple years of a food and nutrition label database, identify which products with the FOP symbol have been reformulated and which nutrients have changed as a result of the reformulation; then, calculate the proportions of products that have been reformulated and the frequencies of the nutrients that have been affected.
Then, the remaining question and possible approach are as follows:
- Question:
- Since the introduction of the FOP symbol, have product sales volumes of reformulated products changed? (manufacturer-retailer Q4)
- Approach:
- Append multiple years of sales volume information from scanner data to the UPC- level food and nutrition label database that was coded for whether products were reformulated to be healthier and conduct analyses to determine if sales volumes increased for products with the FOP symbol that were reformulated to be healthier.
Together, implementation of evaluation studies in this phased approach would provide FDA with the information needed to assess the effects of current FOP nutrition labeling systems on consumers and food manufacturers and retailers. The results would help guide FDA in its future policy decisions regarding FOP labeling.
[Go to Contents]
1. BACKGROUND AND PURPOSE
1.1 Context of the Nutrition Labeling Environment
1.1.1 Introduction
The U.S. Department of Health and Human Services (HHS), with support from the White House, has set obesity and chronic disease prevention as priorities for national nutrition policy. Front-of-package (FOP) nutrition labeling is a tool that can help consumers choose healthy diets consistent with the Dietary Guidelines for Americans (DGAs). The Federal Food, Drug, and Cosmetic Act requires labels to be truthful and not misleading, and the Food and Drug Administration (FDA) regulates health claims and nutrient content claims for foods.
Manufacturers and retailers have been using diverse FOP nutrition symbols1 on food products in the U.S. marketplace (Hersey, Wohlgenant, Kosa, Arsenault, & Muth, 2011). Some FOP symbols are nutrient specific and display key nutrients from the Nutrition Facts Panel (NFP). These may bear a resemblance to nutrient content or health claims, as defined in the Nutrition Labeling and Education Act of 1990 (Institute of Medicine [IOM], 2011).
Other FOP symbols are summary systems that use an algorithm to provide an overall nutritional score (FDA, 2012). Some summary systems provide symbols that are either present or absent, meaning that the symbols are present only on foods that meet a program’s specified nutritional criteria such as Walmart’s Great For You symbol and absent if the food does not meet the criteria. Other summary systems are graded systems assigning foods an overall nutritional score (such as the NuVal system) or a graphic symbol to indicate a food’s rating (such as Guiding Stars).
FDA and consumer advocates are concerned that multiple FOP nutrition symbols in the marketplace may be confusing to consumers. In 2009, FDA declared FOP labeling a top priority and pledged to establish science-based standards and voluntary guidelines for FOP nutrition labels. Additionally, First Lady Michelle Obama has challenged the food industry to work with FDA to develop a consistent, easy-to-understand FOP food symbol that would help people make healthier decisions in the grocery store (The White House, 2010).
1.1.2 IOM Recommendations
At the request of Congress, FDA, and the Centers for Disease Control and Prevention (CDC), an IOM committee was commissioned in 2009 to weigh approaches and advise on standardized FOP guidance. The task was split into two phases: 1) Phase 1: analysis of current nutrition rating systems and the scientific research that underlies them and 2) Phase 2: outline of the benefits of a single, simple food guidance system on the fronts of packages that best promotes health and will be useful to consumers. Based on its Phase 2 research, “the committee concluded that for a government-sponsored FOP system to help achieve population health benefits, its goal cannot be to only inform consumers about detailed nutrition content, but more importantly to encourage healthier choices and purchase behaviors” (IOM, 2011). Thus, the committee recommended “a move away from systems that mostly provide nutrition information without clear guidance about its healthiness, and toward one that encourages healthier food choices through simplicity, visual clarity, and the ability to convey meaning without written information.” The committee called for a simplified symbol, modeled on the Energy Star symbol that appears on many appliances. The symbol would go on the fronts of packages, show the number of calories per servings, and contain zero to three stars or checkmarks to indicate how healthy a food is. The number of stars or checks would be based only on three types of nutrients that many people eat too much of and were most closely associated with an increased risk of chronic illnesses: saturated and trans fats, sodium, and added sugars. Products would earn one point for each category in which they did not exceed designated thresholds. The report recommended that FDA develop, test, and implement a single, standard FOP symbol system to appear on all food and beverage products, in place of other systems already in use (Wartella, Lichtenstein, Yaktine, & Nathan, 2011).
1.1.3 Manufacturers’ and Retailers’ Responses
In response to growing interest in standardized FOP labeling, manufacturers and retailers have begun releasing new, more standardized FOP symbols. Two recently launched FOP symbols in the marketplace are 1) Facts Up Front, jointly developed by the Grocery Manufacturers Association (GMA) and Food Marketing Institute (FMI), and 2) Walmart’s Great For You FOP symbol.
1.1.4 GMA and FMI’s Labeling System
The Facts Up Front system (originally called Nutrition Keys) was announced in January 2011 in response to international and domestic calls for more effective nutrition disclosure on the front of food product packages.
Facts Up Front is intended to provide a single, standardized FOP system for all manufacturers and retailers to use on most products. The GMA and FMI boards of directors adopted a joint resolution in support of the initiative. According to the Facts Up Front Web site, “GMA and FMI member companies—representing approximately 80% of retail food and beverage products—have adopted the Facts Up Front program” (GMA and FMI, n.d.).
Although the Facts Up Front labels are expected to be adopted by many food companies, existing FOP symbols may still appear on food packages or supermarket shelf tags. Therefore, multiple systems might be used for the same food product; for example, the Facts Up Front label may be on products in food stores where NuVal shelf tags are present.
In addition, other nutrition information, such as health claims, is likely to remain on the fronts of food packages.
The Facts Up Front design is intended to bring key information from the NFP to the front of the package to provide consumers with easier access to nutrition information when making food purchasing decisions, while not telling them what to eat. The Facts Up Front label provides information on the amounts of calories, saturated fat, sodium, and sugars in a serving of the food or beverage and the %DV2 of saturated fat and sodium. In addition, manufacturers may include amounts and %DV of two of eight nutrients to encourage—potassium, fiber, protein, vitamin A, vitamin C, vitamin D, calcium, and iron. Small food packages may include only the amount of calories per serving. During the Facts Up Front development process, GMA and FMI reported engaging their membership and expert advisors, reviewing the literature, and testing versions of the Facts Up Front label (such as listing various numbers of nutrients vs. no Facts Up Front label).
GMA and FMI developed a style guide specifying rules for use of the Facts Up Front label. Broadly, all products exhibiting an NFP are eligible for Facts Up Front, except for those foods intended for children less than 4 years of age.3 GMA and FMI are providing online training to their members on appropriate use of Facts Up Front and a support hotline. In response to a written request from GMA and FMI, in December 2011, FDA agreed to exercise enforcement discretion on a limited set of FDA requirements based on FDA’s understanding from GMA and FMI that 1) all four icons (calories, saturated fat, sodium, and sugar) will be on all eligible products, rather than selectively on some products; 2) after a phase-in period, the Facts Up Front label will be implemented broadly; and 3) nutrition information will be provided on the fronts of packages in a consistent format so that consumers can make healthy choices.
During an interview with RTI International, GMA and FMI interviewees explained that the use of the Facts Up Front labeling on products is at the manufacturer’s discretion and implementation by manufacturers is expected to largely coincide with the timing of any label redesigns. Accordingly, there is no fixed schedule for rolling out new labeling; rollouts are not expected to occur by product type or by manufacturer. Although Facts Up Front is a voluntary labeling program, GMA and FMI reported that they intend to monitor compliance and conformity to the style guide using audit surveillance. Although the level of surveillance will be resource dependent, GMA and FMI reported that they expect that manufacturers and retailers will feel peer pressure to comply.
A $50 million education campaign is planned to accompany the Facts Up Front labeling initiative. The campaign has a goal of achieving 30% awareness of the Facts Up Front labels in the primary target population: women between the ages of 25 and 49 with school-aged children. Nutrition education will be integrated into the awareness campaign. It is expected that the campaign will roll out in 2012 and include multiple media modes, including in-store education, television, and print materials. Roughly half of resources will be devoted to the media portion of the campaign.
GMA and FMI’s Facts Up Front evaluation efforts will focus on consumer awareness among the target audience. A consumer survey evaluation of the education campaign will begin once it is determined that a sufficient presence of Facts Up Front exists in the marketplace; follow-up surveys will be administered 1 year after baseline. Currently, GMA and FMI have no plans to monitor the possible effects of Facts Up Front on product sales or on the reformulation of food products. At the time of this report, the Facts Up Front symbol has appeared on a limited number of products, particularly within the ready-to-eat cereal category, and variants of the symbol have appeared on some private-label products.
1.1.5 Walmart’s Labeling System
Walmart pledged to reformulate its store-brand products to make them healthier and to promote the healthiness of products with an easy-to-understand label. The company announced an initiative to reformulate their private-label lines by 2015 to reduce sodium by 25%, eliminate industrially produced trans fats, and reduce added sugar by 10%; they are encouraging their suppliers to take similar actions. A newly released FOP symbol will help consumers identify healthier products (Walmart, 2011).
To inform the development of their FOP symbol, Walmart conducted a consumer survey. Based on the results, they reported consumers want solutions for making healthier choices and desire an interpretative FOP label that indicates the better food choice. Walmart tested a variety of existing interpretative programs electronically with customers and determined that most were fairly complicated and did not permit a straightforward interpretation. Thus, Walmart developed an FOP symbol with clear standards to determine which foods meet the criteria for the label.
All store food products will be eligible for the program, except for those food products exempt from FDA nutrition labeling by regulation. The new symbol will first appear in 2012 on Walmart’s Great Value and Marketside branded food items, as well as on signs around fresh fruits and vegetable displays. Additionally, in a recent press conference to unveil the new symbol, Walmart executives said that the symbol’s nutrition criteria are transparent and that the Great For You symbol will be available, without licensing fees, to all food manufacturers.
The Great For You criteria were informed by guidance from the 2010 DGAs, FDA, the U.S. Department of Agriculture (USDA), and IOM and use a two-step process (Walmart, 2012). Step 1 of the criteria encourages fruits, vegetables, whole grains, low-fat dairy, nuts/seeds, and lean meats (Walmart, 2012). Step 2 of the criteria limits total fat, trans fat, saturated fat, sodium, and added sugars (Walmart, 2012). Walmart’s Great For You label is interpretive and satisfies several IOM committee recommendations (IOM, 2011). However, it is not ordinal (having multiple levels or ratings), as suggested by IOM; instead, it is a single symbol that will be present on foods that meet the nutrition criteria or absent on foods that do not meet the criteria or participate in the program. Based on RTI’s conversation with Walmart, Walmart stated that they expect that about 20 to 25% of foods will qualify for the Great For You symbol. At a recent nutrition conference, a Walmart staff member reported that of 4,000 items in 120 categories assessed using the criteria, in total 32% received the symbol; all fruits, vegetables, and lean meats qualified; and around 22% of nonsingle items qualified (Thomas, 2012). Products qualifying for the Great For You symbol can be found on Walmart’s Web site http://www.walmartstores.com/nutrition/pdf/Walmart-GreatForYou-Product-List.pdf.
The Great For You symbol is intended to be complementary to the GMA and FMI Facts Up Front label, if a manufacturer chooses to include both systems. At the time of RTI’s call with Walmart, the symbol had not yet been released but has subsequently been publicly announced. As of the report writing, signage in the produce section displays the symbol. At the end of summer 2012, it is expected to begin to appear on packages on a rolling basis over the course of about 1 year. Walmart intends to assess consumer use of the Great For You FOP symbol based on product sales.
Table 1-1 presents a broad comparison of types of FOP symbols, including the Facts Up Front and Great For You FOP symbols and the IOM recommendations.
Table 1-1 presents a broad comparison of types of FOP symbols, including the Facts Up Front and Great For You FOP symbols and the IOM recommendations.
| Label | Type of Label | FOP or Shelf Tag | Description | Exampleb |
|---|---|---|---|---|
| aAll FOP symbols included in this table, except the IOM-recommended symbol, currently exist in the marketplace. bRTI received permission from all organizations to display their symbols in this report. cGrocery Manufacturers Association and Food Marketing Institute. (2012). Facts Up Front. Retrieved from http://factsupfront.org/aboutTheIcons.html dWalmart. (2012). Making food healthier and healthier more affordable. Retrieved from http://walmartstores.com/nutrition/greatforyou.aspx eInstitute of Medicine. (2011). Front-of-package nutrition rating systems and symbols: Promoting healthier choices. Washington, DC: The National Academies Press. Retrieved from http://www.iom.edu/Reports/2011/Front-of-Package-Nutrition-Rating-Systems-and-Symbols-Promoting-Healthier-Choices.aspx fGuiding Stars Licensing Company. (2012). Our algorithm. Retrieved from http://guidingstars.com/what-is-guiding-stars/how-it-works/our-algorithm/ g NuVal, LLC. (2012a). How it works. Retrieved from http://www.nuval.com/How hNuVal, LLC. (2012b). ONQI: The science behind the scores. Retrieved from http://www.nuval.com/science | ||||
| Facts Up Frontc | Nutrient- specific symbol | FOP | Displays “nutrients to limit,” including calories, saturated fat, sodium, and sugar per serving and up to two “positive” nutrients, including potassium, fiber, protein, vitamin A, vitamin C, vitamin D, calcium, and/or iron if the product contains more than 10% of the daily value for the nutrient and meets FDA requirements for “good source” nutrient content claim. For products with limited space on the food package, only calories are required to be displayed on the package. |  |
| Great For Youd | Present or absent symbol | FOP | Displayed on products that meet Walmart’s nutritional criteria. These criteria include the following: Step 1. Product must meet A or B:
Step 2: Foods that pass B in Step 1 must also meet the following requirements per labeled serving: 1) total fat: less than 35% of total calories; 2) trans-fat: 0 grams labeled and no “partially hydrogenated” fats or oils; 3) saturated fat: less than 10% of total calories; 4) sodium: single food item less than or equal to 380 mg; and 5) added sugars: no more than 25% of total calories. |  See previous example |
| IOM’s recommendatione | Ordinal or multiple-level summary symbol | FOP | Displays calories and a ranking of zero to three points for nutrients to limit, including saturated fats, trans fats, sodium, and added sugars. | 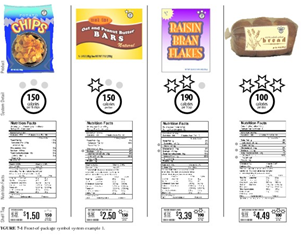 |
| Guiding Starsf | Ordinal or multiple-level summary | Usually shelf tag but sometimes FOP | Indicates the nutritional value of participating products on shelf tags or FOP with one to three stars; the higher the rating, the more nutritious the product. The algorithm takes into account nutrients to limit, including trans fatty acid, saturated fat, cholesterol, added sugars, and added sodium and nutrients to encourage including dietary fiber, vitamins/minerals, and whole grain. |  |
| NuValg,h | Ordinal or multiple-level summary | Shelf tag symbol | Indicates with a score of 1 to 100 the nutritional value of participating products; the higher the rating, the more nutritious the product. The score is derived from an algorithm called the Overall Nutritional Quality Index that quantifies the presence of more than 30 nutrients and incorporates measures for the quality of protein, fat, and carbohydrates, as well as calories and omega-3s. Values are based on IOM’s Dietary Reference Intakes and the DGAs. Although this algorithm is not publicly available, NuVal describes the science behind their scoring process on their Web site at http://www.nuval.com/science. |  |
1.2 FDA Goals for FOP Symbols
Based on discussions with FDA staff, RTI understands that FDA is interested in increasing consumers’ use of accurate nutrition information, grounded in the DGAs, when making food purchase decisions, particularly among consumers who currently do not use nutrition information to guide their decisions. To this end, FDA wants to ensure that the FOP symbol is designed to enable consumers with a wide range of literacy, educational levels, age, and other characteristics to compare the relative healthiness of products within and across food categories. In the long term, it is expected that consumers’ use of nutrition information when making food purchasing decisions will improve their dietary choices and result in their reduced risk of obesity and chronic diseases.
FDA would like to monitor and evaluate existing and future FOP symbols to assess the extent of their adoption by manufacturers and retailers; the number and types of products on which symbols appear; whether consumers notice, understand, and use FOP symbols; and potential product reformulation resulting from inclusion of FOP symbols on products.
1.2.1 Evaluation Plan Objectives
FDA would like to identify tools and methods for evaluating FOP symbols that either currently exist or may be developed. In September 2011, HHS/Office of the Assistant Secretary for Planning and Evaluation (ASPE) contracted with RTI to provide support for planning an evaluation of FOP nutrition labeling initiatives that is aligned with the research goals of FDA on FOP nutrition labeling. Based on discussions with key stakeholders at ASPE and FDA, RTI determined that FDA is interested in examining the effect of FOP symbols on two primary groups: 1) consumers and 2) food manufacturers and retailers.
2. EVALUATION PLAN DEVELOPMENT
To support FDA’s interest in an FOP nutrition labeling system and meet the needs of FDA staff and key stakeholders, RTI followed CDC’s (1999) “Framework for Program Evaluation in Public Health” to develop an evaluation plan that suggests evaluation options. Because GMA and FMI’s FOP labeling system, Facts Up Front, is likely to be a primary FOP symbol in the marketplace, at least for the immediate future, RTI selected evaluation options with it in mind; secondarily RTI considered Walmart’s Great For You symbol. Given the diversity of FOP symbols that exist, it was essential to work through methodological and analysis decisions using currently existing marketplace examples, such as Facts Up Front and Great For You. That said, the proposed plan is intended to be applicable to both other existing FOP symbols and those developed in the future, including an FDA-developed symbol.4
[Go to Contents]
2.1 Stakeholder Participation
In keeping with the principles of CDC’s Evaluation Framework (CDC, 1999), stakeholders have been actively engaged in the full FOP evaluation planning process. Throughout the process, the ASPE, FDA (Office of Foods and Center for Food Safety and Applied Nutrition), and RTI evaluation team convened regularly through conference call meetings to define and describe the program, develop consensus on the primary purpose of the evaluation, and discuss the evaluation design and planned methods. As part of the plan development process, the ASPE, FDA, and RTI evaluation team also discussed key issues surrounding stakeholder engagement; conducted interviews with stakeholders; and reviewed findings from the interviews, including feedback on the program and evaluation logic models, selection of evaluation questions, and potential data collection and analysis issues. As needed, more in-depth conversations were held with smaller groups of stakeholders, such as calls with FDA staff focused on data sources and their availability. Based on FDA’s suggestion to interview stakeholders involved in launching FOP symbols, RTI interviewed representatives from 1) Walmart and 2) GMA, FMI, and FoodMinds, LLC (GMA and FMI’s FOP evaluator). Input from these manufacturers and retailer representatives concentrated on improving RTI’s understanding of their specific FOP symbols and their intended methods for evaluating them.
2.2 Program Logic Model Development
To identify and summarize relationships across major program components of FOP labeling and the expected relationship between the activities and the program’s goals, RTI developed a program logic model displayed in Figure 2-1. The model depicts inputs, activities, outputs, outcomes, and impacts comprising an FOP labeling program. Separate inputs, activities, and outputs for food manufacturers and retailers and FDA result in shared outcomes and an expected program impact. Inputs at both the food manufacturers’ and retailers’ level and FDA include an array of resources from staff, partnerships, and funding that supports implementation of an FOP labeling initiative. For food manufacturers and retailers, the activities portion of the model reflects the precursor actions, such as capacity, planning, education, and partnership maintenance that contribute to the development of the manufacturers’ and retailers’ implementation efforts, displayed in the outputs portion of the model.
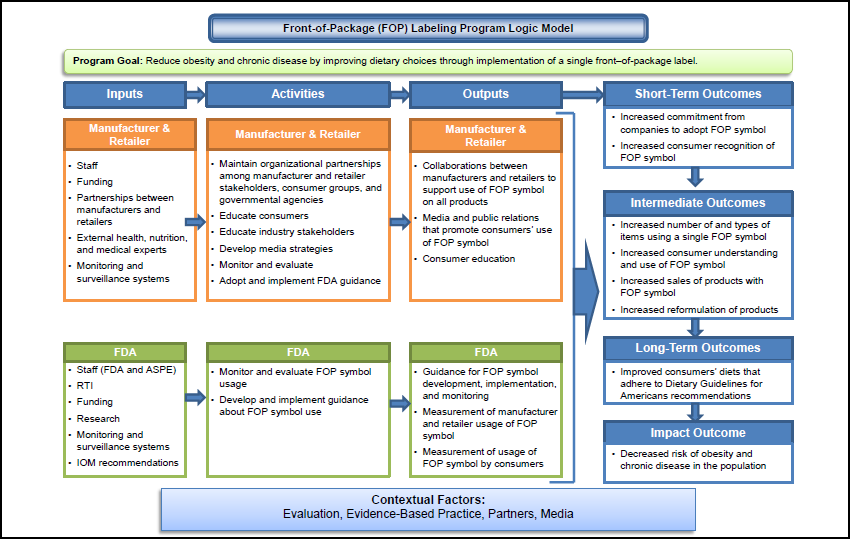 |
FDA activities are expected to include those related to monitoring and evaluating the initiative and potentially developing guidance documents. In the short term, the outputs are hypothesized to lead to the adoption of a standardized FOP symbol and increased consumer recognition of the FOP symbol. In the long term, with increased adoption of a standardized FOP symbol across product types and through accompanying education activities, it is expected that changes in consumers’ understanding and use of the FOP symbol will result, in turn triggering product reformulation and improved consumer diets. At the population level then, a reduction in obesity and chronic disease should occur.
[Go to Contents]
2.3 Evaluation Logic Model Development
Drawing on the program logic model, the RTI evaluation team created an evaluation logic model. The evaluation logic model (see Figure 2-2) graphically summarizes resources, key activities, and intended outcomes and highlights main evaluation questions of interest to the stakeholders and activities performed to answer those questions.
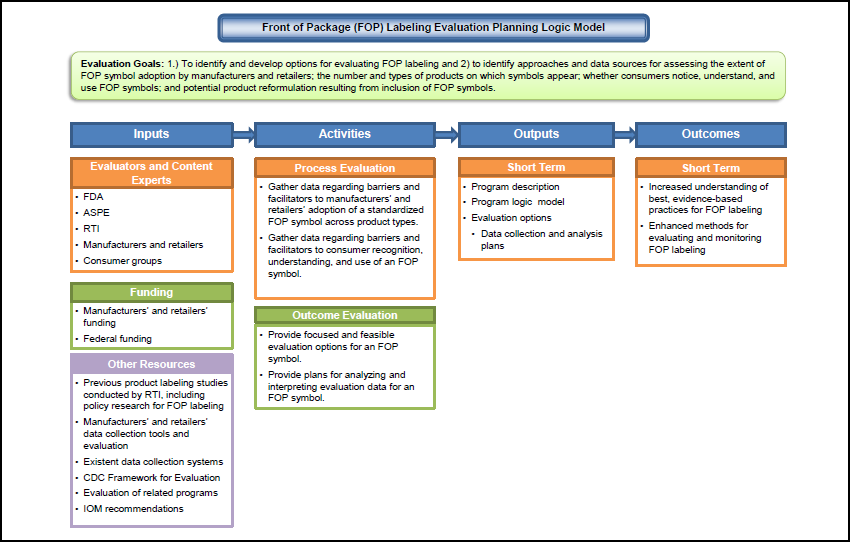 |
The evaluation logic model defines the purpose of the evaluation as identifying and developing options for evaluating a manufacturer- and/or retailer-developed FOP labeling initiative to identify approaches and data sources for assessing the extent of FOP symbol adoption by manufacturers and retailers; the number and types of products on which symbols appear; whether consumers notice, understand, and use the FOP symbols; and potential product reformulation resulting from inclusion of FOP symbols.
2.4 Evaluation Plan Focus
To focus the evaluation plan, RTI contextualized its thinking using Facts Up Front, the most broadly distributed FOP symbol in the marketplace. The proposed plan can be applied to evaluations of other current and future FOP symbols. However, specific questions and options for addressing them must be assessed, and if necessary modified, to ensure that they are appropriate for evaluating the symbol.
Front of Package (FOP) Labeling Evaluation Planning Logic Model - placeholder
To begin developing an evaluation plan, through meetings between ASPE, FDA, and RTI, ASPE and FDA identified three topic areas of greatest interest; they are roughly ordered by timeline:
- Topic 1. Manufacturer and Retailer Use: Is the FOP symbol being used on products in the marketplace?
- Topic 2. Consumer Response: Do consumers notice, understand, and use the FOP symbol?
- Topic 3. Reformulation: Since introduction of the FOP symbol, are manufacturers reformulating foods to improve nutrition?
Because many embedded questions can be asked within the three topic areas, the team prioritized key questions within each topic area through an RTI-led “voting activity.” RTI compiled a list of questions in a Microsoft Excel document and asked the FDA and ASPE evaluation team members to independently rate each question according to its importance for inclusion in the overall evaluation plan. To permit the team to contextualize their thinking, questions used Facts Up Front as an example. The rating scale was 1 = essential, 2 = important, and 3 = optional. Space was included for ASPE and FDA to include additional questions of interest and comments to explain rating choice. Six team members voted. The RTI team tallied the votes, summarized the comments, and presented the results to the ASPE and FDA evaluation team for discussion and consideration. Following discussions with the team, all questions receiving at least four of six possible essential votes were included. The team then worked together to modify question wording, as needed to ensure questions gather the intended information. All questions included in the voting activity are displayed in Appendix A.
Eleven primary evaluation questions and two secondary questions were selected as the focus of the evaluation plan. Although the team acknowledged the need to focus its thinking on a concrete FOP symbol existing in the marketplace, following the team’s voting on questions focused on the Facts Up Front initiative, questions were reframed to relay the broad goal of this evaluation plan as presenting options for evaluating any current or future FOP symbol. The primary and secondary evaluation questions were operationalized into two categories: 1) consumer and 2) manufacturer and retailer.
The four primary evaluation questions and one secondary question that investigate the effects of the FOP symbol on consumers (Topic 2) are the following:
- Do consumers notice the FOP symbol?
- 1a. Do consumers notice manufacturers’ and retailers’ FOP symbol education efforts?
- Can consumers understand the healthiness of products using the FOP symbol?
- Do consumers use the FOP symbol when purchasing products?
- Is consumer understanding of the FOP symbol affected by coexisting FOP or shelf- labeling symbols?
The seven primary evaluation questions that investigate the efforts and effects of the FOP symbol on manufacturers and retailers (Topics 1 and 3) are the following:
- 1. How many (or what proportion of) products and product categories have the FOP symbol and how does it vary across products and product categories?
- 1a. How many (or what proportion of) branded and private-label products have adopted the FOP symbol?
- How are manufacturers and retailers monitoring implementation of and compliance with the FOP symbol?
- How has the FOP symbol affected product sales volumes?
- Since the introduction of the FOP symbol, have product sales volumes of reformulated products changed?
- What types of products have been reformulated since introduction of the FOP symbol?
- How many (or what proportion of) products have been reformulated since introduction of the FOP symbol?
- What types of nutrients have been affected by the FOP symbol’s reformulation and to what extent?
As the questions suggest, the evaluation plan is intended to focus largely on capturing activities through intermediate outcomes.
[Go to Contents]
2.5 Evaluation Planning Matrix Development
Following ASPE and FDA agreement on the overarching questions and evaluation questions, RTI developed an evaluation planning matrix (EPM) to facilitate the development of the evaluation plan, ensure a focus on stakeholder questions of interest, and match feasible evaluation methods with questions. The EPM was populated with information drawn from RTI’s experience conducting research to inform food policy; stakeholder interviews, particularly with FDA; government and proprietary Web sites; and discussions with vendors who sell proprietary data. For each evaluation question, the EPM specified possible data sources and methods for addressing it and examples of applications of each method to answer the question.
2.5.1 Data Sources Identified But Not Used
In addition to those data sources selected for the evaluation plan, others were considered for inclusion. Appendix A shows those data sources reviewed but not included in the evaluation plan and notes reasons for their exclusion.
[Go to Contents]
2.6 Evaluation Options
The purpose of the current design and analysis plan is to provide evaluation options for FDA’s FOP nutrition labeling efforts. These options are not intended to be comprehensive or to provide step-by-step detailed methodological and analysis plans. Instead, they present feasible and methodologically sound options for responding to evaluators’ questions of interest and offer information to guide selection of options, given the evaluator’s goal. The plan is divided into two sections. The first focuses on questions addressing consumer understanding and use of FOP symbols (Topic 2); the second discusses evaluation options for manufacturer- and retailer-related questions (Topics 1 and 3). Each of the two sections opens with a description of selected methods or data sources presented throughout the respective section to address its set of evaluation questions and then summarizes accepted strengths and limitations of the method. Evaluation options for each question and particularly relevant strengths and limitations of employing each option to address the questions are then listed. As relevant, alternative options are noted. In the consumer section, an overall assessment of proposed options follows each evaluation question, whereas in the manufacturer and retailer section, given the use of similar methods for addressing multiple questions, a single overall assessment is provided for the full set of questions. The final section of this report, entitled Core Plan for Proposed Evaluation of FOP Nutrition Labeling, offers an ordered approach for using RTI’s suggested methods to address the consumer and manufacturer/retailer evaluation questions.
2.6.1 Criteria for Evaluation Options
Jointly, the FDA, ASPE, and RTI team established assessment criteria for selecting and prioritizing proposed evaluation methods and data sources. In reviewing evaluation options, the team considered answers to the following questions:
- Can [EVALUATION OPTION] assess the impact of a widely distributed and currently existing FOP symbol across population subgroups?
- Has [EVALUATION OPTION] been shown to be a best practice for addressing questions in a nationally representative, probability-based sample, particularly among diverse population subgroups?
- What are the resources required for assessment using [EVALUATION OPTION], taking into account efficiencies that can be employed to address multiple questions (such as building off of data collected from another question)?
- Using [EVALUATION OPTION] will data be experimentally or nonexperimentally collected? What conclusions can then be drawn?
- What is the time required to sufficiently address a question using [EVALUATION OPTION], including the timing necessary to collect and analyze the data?
[Go to Contents]
3. CONSUMER DESIGN AND ANALYSIS PLAN
This section provides evaluation options for the consumer-related questions. From this point forward, consumer-related questions are referred to by their shorthand notation as indicated in Table 3-1.
| Consumer (C) Question | Shorthand Notation |
| 1. Do consumers notice the FOP symbol? | Q1: Notice |
| 1a. Do consumers notice manufacturers’ and retailers’ FOP symbol education efforts? | Q1a: Education Notice |
| 2. Can consumers understand the healthiness of products using the FOP symbol? | Q2: Understand |
| 3. Do consumers use the FOP symbol when purchasing products? | Q3: Use |
| 4. Is consumer understanding of the FOP symbol affected by coexisting FOP or shelf-labeling schemes? | Q4: Understanding Affected by Coexisting |
3.1 Basic Study Designs
Table 3-2 illustrates evaluation sampling approaches and design types considered for addressing the consumer questions. Broadly speaking, study samples can be either probability based and yield data from representative groups of the target population or nonprobability based. Moreover, studies can be designed to be either experimental or nonexperimental. In experimental designs, variables of interest are under the control of the evaluators, and confounding variables can be controlled through randomization and/or stratification. Certain methods can be used in both experimental and nonexperimental designs and/or are conducive to probability-based sampling; others are less versatile in fitting certain designs or sampling strategies. An example of a probability-based, experimental study would be a simulated shopping study embedded in a probability-based Web survey. Both methods are described in Section 3.2.
| Sampling Type | Study Design: Experimental | Study Design: Nonexperimental |
| Probability based | Representative of target population, some factors under control of the evaluator | Representative of target population, putative factors that affect consumer choices not under control of the evaluator |
| Nonprobability based | Not representative of target population, some factors under control of evaluator | Not representative of target population, putative factors that affect consumer choices not under control of evaluator |
Studies seeking to address more in-depth research questions (rather than to evaluate the population impact of a program) tend to use experimental designs and smaller nonprobability-based sampling techniques. For example, given resource requirements, eye tracking typically is employed in experimental designs with nonprobability-based sampling. As compared with what are typically larger samples sizes used in probability-based nonexperimental studies, smaller nonprobability-based experimental studies can be more limited in their ability to detect differences between study groups and cost more per complete data record.
Although experimental studies commonly are not conducted on samples that are representative of the U.S. consumer population, these studies can yield important data on consumer behavior (such as correlation between self-report and actual observation).
[Go to Contents]
3.2 Description of Methods
Different methods can be employed to evaluate whether consumers notice, understand, and use FOP symbols when purchasing products. Neither a single method nor a single study can provide comprehensive answers to all of the evaluation questions. Based on the criteria outlined in Section 2.6 and discussions with the FDA, ASPE, and RTI team, RTI presents options for addressing the evaluation questions. RTI recognizes that the presented options for addressing questions are not exhaustive. Options included in the consumer section are phone, mail, and Web surveys; eye-tracking experiments; simulated shopping experiments; and shopping experiments conducted in a grocery store. Table 3-3 provides a general overview of each method and facilitates comparison among methods by summarizing the description of the method, the type of sampling, estimated relative cost of using the method, typical availability of results from the method, and question(s) the method can be used to address. A more detailed description of each method is provided below, with a discussion of each method’s accepted strengths and limitations.
| Option Number | Potential Method | Description | Sampling | Estimated Relative Costc | Availability of Results | Evaluation Questions Addressed |
| a Alternative methods are not displayed in the table.b Described designs and related information are based on criteria described in Section 2.6.c Estimated relative cost based on resources needed to complete a single case and assuming more resource-intensive options are used with a smaller number of participants. | ||||||
| Option 01 | New Survey: Phone | A survey is administered to a respondent by an interviewer over the phone | Most use random digit dialing (RDD) during the sampling process; can be probability-based sample of telephone numbers and include cell phone–only households | Medium: Major expenses include questionnaire development, training and compensating interviewers, compensating respondents, and data entry | Five months excluding Office of Management and Budget (OMB) approval | Q1: Notice, Q1a: Education Notice, Q3: Use |
| Option 02 | New Survey: Mail | A paper questionnaire is mailed to a respondent who then self-administers the questionnaire | Can be probability-based sample of households | Low:Major expenses include developing the questionnaire, printing and mailing questionnaires to households, compensating respondents, and entering data | Six months excluding OMB approval | Q1: Notice, Q1a: Education Notice, Q2: Understand, Q3: Use, Q4: Understanding Affected by Coexisting |
| Option 03 | New Survey: Web. Knowledge Net-work’s (KN’s) KnowledgePanel | A panelist is invited to participate in a survey and self-administers the questionnaire online | Probability-based sample of individuals or households | Medium: Major expenses include developing the questionnaire, programming and pretesting the survey, and using consumer panel | Four months excluding OMB approval | Q1: Notice, Q1a: Education Notice, Q2: Understand, Q3: Use, Q4: Understanding Affected by Coexisting |
| Option 04 | Add Questions to Ongoing Survey: Phone FDA’s Health and Diet Survey (HDS) | RDD telephone survey of adults aged 18+ in the 50 states and the District of Columbia | Probability-based, single-stage sample of telephone numbers | Low: FDA conducts survey periodically so many expenses associated with a phone survey are already covered | Survey conducted every 3–5 years with a 1-year time lag to receive data set. Next survey expected to go in field early 2013, would need to develop questions in late 2012 | Q1: Notice, Q1a: Education Notice, Q3: Use |
| Option 05 | Add Questions to Ongoing Survey: MailNPD‘s Health Track | Mail survey that is a follow-up to a 14-day food diary; this information is collected from 2,000 households per year | Nonprobability-based sample that is balanced based on key U.S. Census statistics | Medium: More expensive than other types of mail surveys because linked to dietary intake data | Four months excluding OMB approval | Q1: Notice, Q1a: Education Notice, Q3: Use |
| Option 06 | Add Questions to Ongoing Survey: Web NPD’s Dieting Monitor | Web survey conducted biweekly with 1,000 adults | Nonprobability based | Medium | Four months excluding OMB approval | Q1: Notice, Q1a: Education Notice |
| Option 07 | Add Questions to Ongoing Survey: Web Omnibus KN’s QuickView | KN/QuickView surveys 1,000 adults | Probability based | Low: Omnibuses are generally lower cost than custom surveys | Four months excluding OMB approval | Q1: Notice, Q1a: Education Notice, Q2: Understand, Q3: Use, Q4: Understanding Affected by Coexisting |
| Option 08 | Eye-Tracking Study | Experiment where participants’ eye movements are examined | Typically conducted with a small nonrepresentative sample | Medium | Nine months excluding OMB approval | Q1: Notice, Q3: Use, Q4: Understanding Affected by Coexisting |
| Option 09 | Simulated Shopping Study: Web | Experiment that is embedded in a Web survey and examines consumer behavior by simulating a shopping experience | Experiments embedded in a Web survey can be done with a probability-based sample, but laboratory experiments are typically conducted with a small nonrepresentative sample | Medium/high | Nine months excluding OMB approval | Q1: Notice, Q3: Use, Q4: Understanding Affected by Coexisting |
| Option 10 | Simulated Shopping Study: Laboratory—Virtual Grocery Store | Experiment that examines consumer behavior by simulating a shopping experience; experiment can be embedded in a Web survey or conducted in a laboratory | Experiments embedded in a Web survey can be done with a probability-based sample, but laboratory experiments are typically conducted with a small nonrepresentative sample | Medium/high | Nine months excluding OMB approval | Q1: Notice, Q1a: Education Notice, Q2: Understand, Q3: Use, Q4: Understanding Affected by Coexisting |
| Option 11 | Simulated Shopping Study: Laboratory—Mock Grocery Store | Experiment that examines consumer behavior by simulating a shopping experience; experiment can be embedded in a Web survey or conducted in a laboratory | Experiments embedded in a Web survey can be done with a probability-based sample, but laboratory experiments are typically conducted with a small nonrepresentative sample | Medium/high | Nine months excluding OMB approval | Q1: Notice, Q1a: Education Notice, Q2: Understand, Q3: Use, Q4: Understanding Affected by Coexisting |
| Option 12 | In-Store Shopping Study | Experiment that examines consumers’ shopping behavior in a grocery store | Typically conducted with a small nonrepresentative sample | High | Six to 9 months excluding OMB approval | Q1: Notice, Q1a: Education Notice , Q3: Use, Q4: Understanding Affected by Coexisting |
3.2.1 New Survey
Overview
A survey systematically collects data from a sample drawn from a large population. Surveys can assess behaviors or attitudes. Behavioral survey questions inquire about events that are verifiable, such as number of years of education or number of visits to a supermarket. Attitudinal survey questions inquire about beliefs or opinions and are considered unverifiable (Bradburn & Sudman, 1988). Broadly speaking, surveys can be administered in person, by an interviewer over the phone or mailed or e-mailed to respondents who then complete the survey on paper or online.
To answer the consumer-related evaluation questions, a new phone, mail, or Web survey can be developed and administered by a survey research firm. Drawing on standard social and survey research texts (Groves, Fowler, Couper, Lepkowski, & Tourangeau, 2009; Schonlau, Fricker, & Elliott, 2002; Groves, Kalton, Rao, Schwarz, & Skinner, 2004; Schutt, 2004), RTI describes the selected survey methods and associated strengths and limitations of each.
Generally speaking, among types of surveys, a Web survey offers a faster turnaround time than a phone survey, which in turn has a quicker turnaround time than a mail survey.
Limitations that apply to all survey options, both new and ongoing, described in this report are as follows:
Limitations
- Evaluators are limited in their control of confounding variables at the design stage of survey development and therefore must control for important variables at the analysis stage through examination of covariance and/or appropriate weighting of observations.
- Survey nonresponse can pose a risk of biased results, if the answers of respondents differ from the potential answers of those who did not answer.
- Social desirability can affect respondents’ answers. Social desirability bias is the tendency of respondents to answer questions in a manner that they expect will be viewed favorably by others. Among survey types, mail and web surveys tend to be affected least by social desirability bias. Social desirability bias affects in-person surveys to the greatest degree because of the closer relative social distance between the interviewer and the respondent.
Option 01: New Phone Survey
Description
A new phone survey is an interviewer-administered phone survey. Commonly households are selected using random digit dialing (RDD). RDD is a method for selecting people for involvement in telephone statistical surveys by generating telephone numbers at random. RDD has the advantage that it includes unlisted numbers that would be missed if the numbers were selected from a phone book. In populations where there is a high telephone- ownership rate, it can be a cost efficient way to get complete coverage of a geographic area (American Association for Public Opinion Research, 2011). To address concerns about coverage error due to the increased number of “wireless-only households” (currently estimated to be 31% for adults and 36% for children [Bloomberg & Luke, 2011]), address- based sampling or a cell phone RDD survey (alone or in combination with an RDD survey) can be used.
Strengths
- It is feasible to have a large sample size or probability-based sample.
- This method typically results in higher response rates than self-administered surveys.
- Visual, audio, or audiovisual materials can be used if they are mailed or e-mailed to respondents before the interview.
Limitations
Coverage error can result in selection bias if care is not taken to ensure representativeness of the RDD sample (for example, underrepresentation of certain population groups). Certain sample frames used in RDD do not include wireless-only households and households that are not covered by any kind of telephone service (Link,
2010).
Decreasing response rates in surveys in general can be exacerbated because people with caller identification can screen their calls, people may not answer the phone, or people may refuse to take the survey because they automatically say “no” to requests over the phone.
Advanced mailing or e-mailing of visual, audio, or audiovisual materials can introduce awareness bias.
Many distractions can exist in the household when completing the survey. This and the faster pace of the interview compared with face-to-face surveys can potentially increase measurement error.
Option 02: New Mail Survey
Description
A mail survey is a questionnaire that is mailed to respondents who then complete a paper survey on their own without the assistance of an interviewer.
Strengths
- This method is typically less expensive than phone or Web surveys because there are no interviewer training or computer programming costs.
- It can include printed images, such as of the NFP or an FOP symbol, as part of the questionnaire.
- The sample can be large and probability based.
Limitations
- A primary concern with using a mail survey is the generally low response rate.
- Mail surveys can result in more incomplete responses than interviewer-administered or Web surveys.
- Mail surveys have more confounding variables at the design stage than phone or Web surveys.
- Nonresponse or incomplete response is more common with self-administered surveys, posing an increased risk of biased results.
Option 03: New Web Survey
Description
A Web survey is a type of electronic survey in which a respondent is asked to visit a hyperlink to complete a questionnaire online. Many research firms have opt-in or volunteer panels (for example, Research Now, Harris Interactive, and SSI), whose panelists are self- selected to take the survey and often receive cash or rewards for completing online surveys. Because these panels use convenience sampling and do not include non-Internet households, they are not considered to be representative of the U.S. population. However, Knowledge Network’s (KN) proprietary online research panel is selected using address- based sampling of households and includes cell phone–only households (KN, 2012c; KN, 2012d). Panelists participate in two to four surveys per month. KN claims that its panel referred to as KnowledgePanel is the only online panel that is a statistically valid representation of the U.S. population (KN, 2012a). A 2009 study by Krosnick and colleagues compared results from KN’s probability-based online panel, a probability-based phone sample, and seven opt-in panels and found that probability-based approaches to research were consistently more representative of the U.S. adult population.
Given that the focus of this evaluation plan is on assessing the program impact of an FOP labeling initiative on the U.S. population as a whole and that to RTI’s knowledge KN’s KnowledgePanel is the only probability-based sample available, this panel is used as the example for a new Web survey throughout this document. However, if a probability-based sample is determined not to be necessary for the evaluation purpose, if resources do not permit its use, or if the size of a randomly selected panel is considered large enough to be representative, Web providers other than KN may be considered and used for options referencing a Web study.
The strengths and limitations of a Web survey using the KN probability-based panel as an example are provided below.
Strengths
- KN’s KnowledgePanel is a probability-based sample of the U.S. population (KN, 2012c).
- KN limits its KnowledgePanel panelists to two to four surveys each month (KN, 2012c), reducing potential bias caused from panelist fatigue.
- KN’s KnowledgePanel’s representativeness is comparable to high-quality RDD with cell phone sample supplementation (KN, 2012c).
- KN’s KnowledgePanel is more representative of the population because the sample is not limited to current Web users or computer owners (KN, 2012c).
- Web surveys typically have higher response rates than mail surveys.
- KN can display pictures, audio, or audiovisual materials as part of a Web survey that is administered to KN’s KnowledgePanel.
Limitations
- Attrition bias can arise if respondents drop out of the panel nonrandomly (that is, when attrition is correlated to a variable of interest).
- Panel conditioning can arise if responses in one wave are influenced by participation in the previous wave(s). The experience of the previous interview(s) may affect the answers of respondents in a next interview on the same topic, such that their answers differ systematically from the answers of individuals who are interviewed for the first time.
- Displaying audio or audiovisual materials may limit the sample to broadband (high- speed Internet) users and will add costs.
- Technical difficulties are always possible when using Web surveys. For example, the questionnaire format may not be displayed on all computers as intended.
3.2.2 Add Questions to Ongoing Survey
Overview
To answer the consumer-related evaluation questions, questions can be added to an ongoing existing proprietary or government survey. Similar to the new survey section, Section 3.2.1, RTI uses accepted traits of survey methods (Groves, Fowler, Couper, Lepkowski, & Tourangeau, 2009; Schonlau, Fricker, & Elliott, 2002; Groves, Kalton, Rao, Schwarz, & Skinner, 2004; Schutt, 2004) to enhance the list of strengths and limitations provided for each survey type. As described already, among types of surveys, a Web survey offers a faster turnaround time than a phone survey, which in turn is faster than a self- administered mail survey. Limitations of all survey types are survey nonresponse, social desirability bias, and evaluators’ inability to control for confounding variables at the design stage.
Option 04: Ongoing Phone Survey: FDA’s Health and Diet Survey (HDS)
Description
The FDA’s HDS is presented as the option for adding questions to an ongoing phone survey. The HDS is an RDD telephone survey of adults aged 18 or older in the 50 states and the District of Columbia. The survey tracks Americans’ knowledge, attitudes, and behaviors regarding nutrition and physical activity. The 2008 survey included questions about respondents noticing and using FOP symbols. Households were selected from a nationally representative single-stage sample of telephone numbers. FDA’s 2008 survey had 2,584 respondents (FDA, 2011). Please note that many of the same general strengths and limitations mentioned for new phone surveys also apply to ongoing phone surveys and are not repeated here.
Strengths
- The HDS uses a representative sample (FDA, 2011).
- The HDS is an ongoing survey, so it is less expensive to use than other survey methods.
Limitation
- The HDS survey is administered every 3 to 5 years (FDA, 2011). Therefore, because of limited opportunities to field questions, this survey may not be conducive to time- sensitive studies.
Option 05: Ongoing Mail Survey: NPD’s Health Track5
Description
The NPD Group, Inc.’s (formerly known as National Purchase Diary, Inc.), Health Track survey is presented as the option for adding questions to an ongoing mail survey. The NPD Group is a provider of proprietary consumer and retail information. Annually, approximately 2,000 households complete 14-day self-administered food diaries that track household members’ reported dietary intake. The Health Track survey is a follow-up survey that is mailed to panelists and inquires about their dietary restrictions, vitamin supplement usage, height and weight measurements, exercise, and self-rating of health. The sample frame considers U.S. Census demographic and geographic characteristics. Please note that many of the same general strengths and limitations mentioned for new mail surveys also apply to ongoing mail surveys and are not repeated here.
Strengths
- Health Track survey data can be matched with households’ reported dietary intake.6
- Using an ongoing survey, such as Health Track, can be less expensive than developing a new mail survey. Moreover, as with most mail surveys, typically, it is less expensive than phone or Web surveys to administer because there are no interviewer training or computer programming costs.
Limitations
- Although the Health Track sample frame considers U.S. Census statistics, it is not a probability-based sample.
- The Health Track survey cannot include audio or audiovisual materials, such as educational television ads about using an FOP symbol.
Option 06: Ongoing Web Survey: NPD’s Dieting Monitor7
Description
The NPD Group Dieting Monitor survey is presented as the option for adding questions to an ongoing Web survey. The Dieting Monitor survey is conducted biweekly with approximately 1,000 adults aged 18 or older. Survey questions inquire about panelists’ nutrition label-reading behavior, diet awareness, and level of physical activity. Please note that some of the same general strengths and limitations mentioned for new Web surveys also apply to ongoing Web surveys and are not repeated here.
Strengths
- The Dieting Monitor survey is conducted biweekly, so it has a fast turnaround.
- Graphics can be included as part of the Dieting Monitor survey.
Limitations
Questions that can be added to this survey must be determined by NPD to be relevant to the survey and/or interesting to their panelists, and they cannot overlap with topics already included. The number of questions that can be added is limited.
Dieting Monitor does not use a probability-based sample.
Attrition bias can arise if respondents drop out of the panel nonrandomly (that is, when attrition is correlated to a variable of interest).
Panel conditioning can arise if responses in one wave are influenced by participation in the previous wave(s). The experience of the previous interview(s) may affect the answers of respondents in a next interview on the same topic, such that their answers differ systematically from the answers of individuals who are interviewed for the first time.
Option 07: Ongoing Web Omnibus Survey8
Description
Many research firms have ongoing omnibus surveys. An omnibus survey is a survey in which different parties share survey fielding costs. Because survey questions are supplied by different parties, they may not always relate to one another. KN’s QuickView is the only omnibus survey conducted online that uses a probability-based sample of U.S. households (KN, 2012b). Households are selected from an RDD frame (KN, 2012b). The survey is conducted weekly with 1,000 adults (KN, 2012b).
As described for Option 03: New Web Survey, to support the evaluation criteria defined in Section 2.6 and given that KN is the only omnibus survey RTI is aware of that uses a probability-based sample, KN’s QuickView is used as the example for a Web omnibus survey. However, as with Option 03: New Web Survey, if a probability-based sample is determined not to be necessary for the evaluation purpose, if resources do not permit its use, or if the size of a randomly selected panel is considered large enough to be representative, Web providers other than KN may be considered and used for options referencing a Web omnibus study.
Please note that some of the same general strengths and limitations mentioned for new
Web surveys also apply to ongoing omnibus Web surveys and are not repeated here.
Strengths
- Using an Omnibus Web survey can be cost-effective if the desired information is limited to a small number of new items.
- KN’s QuickView is conducted weekly so it has a fast turnaround (KN, 2012b).
- KN’s QuickView is administered to a probability-based panel (KN, 2012b).
- Graphics and some audio or audiovisual materials can be included in KN’s QuickView (KN, 2012b).
- KN’s QuickView, like many omnibus surveys, includes common demographic questions (KN, 2012b).
Limitations
- KN limits the number of questions that can be added to KN’s QuickView to 20. Surveys that are longer should be submitted as custom Web surveys (KN, 2012b).
- Although audio and audiovisual materials such as radio and television advertisements can be included, they are not normally used in an omnibus survey and would incur additional charges. Moreover, viewing these materials may be limited to the sample of broadband (high-speed Internet) users.8
3.2.3 Eye Tracking
Option 08: Eye Tracking
Description
Eye tracking is a technique used to determine where a person is looking while interacting with a visual display, such as a grocery shelf, pairs of similar products, or a single-product nutrition label. Participants wear an eye tracker, a recording device that resembles goggles, that measures their eye positions and eye movement. The eye-movement data are superimposed on the display image, revealing very clearly which features of the display captured the viewer’s attention, the order in which these features were seen, and the length of time they were viewed. With eye tracking, it is possible to measure precisely where individuals look for specific information about an item and how they compare different items. Eye-tracking data provide insight into consumers’ gaze patterns, offering information about what consumers pay attention to on food packages and how long they spend looking at different package features (Jones & Richardson, 2007). Eye-tracking data offer a means to describe and understand how visual processes inform consumer decision making (Rawson, Janes, & Jordan, 2008). The data can also help select the right locations of labels and other features as well as determine optimal size and color of labels and other features (Gofman, Moskowitz, Fybjork, Moskowitz, & Mets 2009), which are key determinants of what consumers really look at (Bialkova & van Trijp, 2010).
Strengths
- This method can study participants’ observed behavior rather than relying on self-report.
- Eye-tracking can be conducted in a retail or laboratory environment (evaluators command more control over purchase context in a laboratory environment than an actual shopping environment).
Limitations
- Given that participants must wear goggles, eye-tracking studies can create an unnatural shopping experience, resulting in unusual behavior by participants.
- Given the high resources necessary for eye tracking, this method typically uses a small sample size and it is unlikely that eye-tracking would be used with a probability-based sample.
- The research using this technology for assessing nutrition labeling remains in the early stages of development and assessment.
3.2.4 Simulated Shopping Studies9
Overview
A simulated shopping study is an experiment that attempts to reproduce consumers’ shopping behavior by presenting participants with product choices. In-store shopping studies, discussed in Section 3.2.5, are conducted in an actual grocery store (Option 12). Simulated shopping studies may be embedded in a Web survey (Option 09) or conducted in a behavioral laboratory or focus group facility using a virtual (Option 10) or a mock grocery store setting (Option 11). Going forward, the laboratory setting is considered to include both the behavior laboratory and focus group facility settings. Depending on the sophistication of both the proposed study design and the facilities, the evaluator will need to select the most appropriate setting. The purpose of this type of experiment is to allow evaluators to observe participants’ product selections and other aspects of their shopping behavior. In an attempt to observe behavior in a more realistic setting, some simulated shopping studies take place in virtual or “mock” grocery store environments and ask participants to select products they would prefer to purchase. To help understand participants’ choices, commonly following the experiment, participants complete a questionnaire or participate in a debriefing interview. Consumers’ product selections can be correlated or compared with their self-reported responses.
In general, simulated shopping studies embedded in a Web survey (Option 09) tend to be less expensive to conduct and have larger sample sizes than those performed in laboratories (Options 10 and 11) or actual grocery store settings (Option 12). Accordingly, it is more feasible to administer a simulated shopping study embedded in a Web survey to a probability-based sample than it would be to conduct a simulated laboratory-based or in- store shopping study with a probability-based sample.
In general, compared with in-store shopping studies, simulated shopping studies have several strengths and limitations:
Strengths
- Evaluators have more control over confounding factors when conducting simulated shopping studies compared with in-store shopping studies.
- Simulated shopping studies tend to have lower per-person costs than in-store shopping studies.
Limitations
- Limited validation studies have been conducted using simulated shopping study methods.
- Technical difficulties are possible with computer-administered simulated shopping studies (Options 09 and 10).
- Participants tend to behave less naturally during simulated shopping studies than in in- store shopping studies.
Option 09: Simulated Shopping Study: Web
Description
A simulated shopping study embedded in a Web survey can be conducted with an online consumer panel such as KN or Research Now. The level of sophistication of computer graphics presented can vary from two-dimensional images of product packages to three- dimensional virtual grocery store environments.
Strength
- Depending on the type of computer application used, this method can manipulate product labels and/or other aspects of the shopping environment.
Limitations
- This method is not as realistic as a mock laboratory or real grocery environment, increasing the likelihood that participants may not behave naturally.
- This method is not conducive to combining with eye tracking.
- For a simulated shopping study embedded in a Web survey, the sample may be limited to broadband (high-speed Internet) users.
- Shopping studies conducted with virtual store environments can be more expensive than other types of experimental Web surveys that do not employ this technology.
- Visual displays and programming of items such as product labeling tend not to appear as realistic as a mock or real grocery store setting; details are limited and the number of products is reduced because of the degree of detail and programming required to add products.
Option 10: Simulated Shopping Study: Laboratory—Virtual Grocery Store
Description
Participants in a controlled laboratory select from images of products in a virtual grocery store aisle displayed on a computer monitor. A laboratory-based simulated shopping study can be complemented with eye tracking. To further understand why participants selected products, evaluators can interview participants using structured or semistructured interview guides or conduct experimental auctions. During an experimental auction, a group of participants is asked to bid on real products differentiated by nutritional content, labeling content, or other product attributes. A number of auction mechanisms exist that can help evaluators elicit participants’ willingness to pay for the attribute of interest (Lusk & Shogren, 2007).
Strengths
- Evaluators can manipulate product packages and the grocery store environment.
- Observed behavior can be assessed.
Limitations
- This method is not as realistic as a study conducted using a mock setting, so participants may not behave as naturally.
- Given the resources necessary for performing this type of laboratory-based study, this method typically uses a small, nonprobability-based sample.
- Visual displays and programming of items such as product labeling tend not to appear as realistic as a mock setting; details are limited and the number of products reduced because of the degree of detail and programming required to add products.
Option 11: Simulated Shopping Study: Laboratory—Mock Grocery Store
Description
Two types of simulated shopping studies using mock products can be performed in a laboratory setting. Participants in a laboratory can be asked to select from tangible products in a mock grocery store environment, or participants can be shown two-dimensional images of products and asked to make product selections. This evaluation plan does not include an option for a study using two-dimensional pictures because the limited novel contribution offered by this method would not justify the resources needed.
As already mentioned, a laboratory-based simulated shopping study can be complemented with eye tracking, a debriefing interview, or an experimental auction.
Strengths
- Observed behavior can be assessed.
- This method conveys a grocery store environment better than methods with product images only or with a virtual grocery store environment. This should result in participants behaving as naturally as possible in a laboratory setting.
- Evaluators can manipulate product packages and the mock environment.
Limitations
- The laboratory-based setting is not as realistic as an actual grocery store, so participants may not behave as naturally.
- Given the resources necessary for performing this type of laboratory-based study, this method typically uses a small, nonprobability-based sample.
3.2.5 In-Store Shopping Study
Option 12: In-Store Shopping Study
Description
In a shopping study, consumer behavior is assessed in a real grocery store. Either after or during the observation, an evaluator conducts a brief interview with the participant to learn why he/she chose or is choosing a particular product to purchase. Some shopping studies inventory a consumer’s product selections or purchases. Consumers’ self-reported responses and/or evaluator observations can be correlated or compared with their selections and other choices.
Strengths
- This method uses a realistic shopping environment, improving the likelihood of participants behaving more naturally.
- Observed behavior can be assessed.
- Using this method enables evaluators to ask respondents about actual purchases.
Limitations
- Controlling for confounders such as health claims or package color is difficult in this type of environment.
- Participants tend to be pressed for time and can be reluctant to participate; data collection needs to be short and quick.
- Given the high amount of resources necessary for performing this type of study, this method typically uses a small, nonprobability-based sample size.
[Go to Contents]
3.3 Options for Studies that Address Each Evaluation Question
Table 3-4 crosswalks each consumer question to study methods and data sources that can be used to address it. The section below provides a question-by-question description listing study options for evaluating each question and associated strengths and limitations. On occasion, a brief description of alternative methods for addressing a question is provided. After all options are presented, based on the evaluation criteria outlined in Section 2.6, RTI suggests preferred methods for addressing each question.
| Question | Option 01: New Phone Survey | Option 02: New Mail Survey | Option 03: New Web Survey | Option 04: Ongoing Phone Survey | Option 05: Ongoing Mail Survey | Option 06: Ongoing Web Survey | Option 07: Ongoing Web Omnibus Survey | Option 08: Eye Tracking | Option 09: Simulated Shopping Study: Web | Options 10,11: Simulated Shopping Study: Laboratory | Option 12: In-Store Shopping Study | M&R Option 01 or Option 02: Scanner Data Combined with Option 03 or Option 04: Food Nutrient and Label Database |
| NA = Not applicable, M&R = manufacturer and retailera Alternative methods are not displayed in the table. | ||||||||||||
| Q1: Notice | X | X | X | X | X | X | X | X | X | X | X | NA |
| Q1a: Education Notice | X | X | X | X | X | X | X | NA | NA | X | X | NA |
| Q 2: Understand | NA | X | X | NA | NA | NA | X | NA | NA | X | NA | NA |
| Q3: Use | X | X | X | X | X | NA | X | X | X | X | X | X |
| Q4: Understanding Affected by Coexisting | NA | X | X | NA | NA | NA | X | X | X | X | X | NA |
3.3.1 Question 1. Do consumers notice the FOP symbol?
The evaluation question, Q1: Notice, can be interpreted for this evaluation plan in two ways: 1) recall and 2) cognitive perception.
- Recall. Notice can be interpreted as respondents’ recall of the FOP symbol. This can be assessed using a large or nationally representative sample of U.S. consumers.
- Cognitive perception. Notice can be interpreted as consumers’ cognitive sense of noticing the FOP symbol. An evaluation using this interpretation would explore the mental processes involved in noticing, including awareness, perception, reasoning, and judgment. Typically, this the evaluation would use an experimental design.
As described in the evaluation criteria in Section 2.6, this evaluation plan addresses the population impact of a widely distributed and currently existing FOP symbol across population subgroups. Therefore, this section interprets Q1: Notice as “recall”—whether consumers recall seeing the existing FOP symbol that is the focus of the evaluation.
Q1: Notice can be assessed using the following methods:
- Option 01: New Phone Survey
- Option 02: New Mail Survey
- Option 03: New Web Survey: KN’s KnowledgePanel
- Option 04: Add Questions to Ongoing Phone Survey: FDA’s HDS
- Option 05: Add Questions to Ongoing Mail Survey: NPD’s Health Track
- Option 06: Add Questions to Ongoing Web Survey: NPD’s Dieting Monitor
- Option 07: Add Questions to Ongoing Web Omnibus Survey: KN’s QuickView
- Option 08: Eye Tracking
- Option 09: Simulated Shopping Study: Web
- Option 10: Simulated Shopping Study: Laboratory—Virtual Grocery Store
- Option 11: Simulated Shopping Study: Laboratory—Mock Grocery Store
- Option 12: In-Store Shopping Study
These methods as they apply to Q1: Notice are described below. An assessment follows, offering RTI’s suggested approach for answering the question and reasons for the suggestion.
Broadly, the survey options for Q1: Notice (Options 01 through 07) share the limitation that surveys assessing “notice” rely on respondents’ ability to recall having seen the FOP symbol. Moreover, the primary outcome measure for all methods, except Option 08: Eye Tracking, would be dichotomous measurements (such as yes, noticed FOP symbol or no, did not notice FOP symbol) or the change in proportion of respondents who noticed the symbol between two periods of time.
Study Options
Description/Example of Application for Phone Surveys (Options 01 and 04)
To determine if consumers notice the FOP symbol being evaluated, an interviewer can administer a survey over the phone. The survey can ask respondents if they remember seeing or hearing about the FOP symbol. Secondarily, the survey can ask respondents to name the stores where they saw the FOP symbol and list the products they saw it on. To assist respondents with answering questions focused on recalling the FOP symbol, images of the symbol can be mailed to them in advance of the interview.
Questions can be added to an ongoing proprietary or government survey, such as FDA’s HDS (Option 04), or a new survey specifically addressing FOP-related questions (Option 01) can be developed and fielded. Overall strengths and limitations of both of these options are listed in Section 3.2 with additional information specific to addressing Q1: Notice provided at the top of this section.
Description/Example of Application for Mail Surveys (Options 02 and 05)
To determine if consumers notice the FOP label being evaluated, a consumer survey can be mailed to a respondent to self-administer. Unlike a phone survey, a mail survey can include images of the FOP symbol or products displaying it on the questionnaire. Questions with similar themes as those described for phone surveys (Options 01 and 04) can be asked, including whether respondents remember seeing or hearing about the FOP symbol, and if desired, names of stores where they saw the FOP symbol and specific products on which it was shown.
Depending on available resources and the evaluation’s purpose, questions can be added to NPD’s Health Track (Option 05), or a new mail survey can be developed and fielded (Option 02). Overall strengths and limitations of using a new mail survey and NPD’s Health Track ongoing mail survey (Options 02 and 05) are outlined in Section 3.2 with additional information specific to addressing Q1: Notice provided at the top of this section. A particular strength of using a mail survey to answer Q1: Notice is the following:
- This method can provide visual examples of the FOP symbol.
Description/Example of Application for Web Surveys Used Alone (Options 03, 06, and 07) or Combined with a Simulated Shopping Study (Options 03 and 07 Combined with Option 09)
Several types of new or ongoing Web surveys, varying in their levels of complexity, can be used to evaluate Q1: Notice. A new survey can be administered to an online panel of consumers (Option 03), or questions can be added to NPD’s Dieting Monitor (Option 06) or to an omnibus survey such as KN’s QuickView (Option 07). As with both the phone (Options 01 and 04) and mail survey modes (Options 02 and 05), respondents can be queried about whether they remember seeing or hearing about the FOP symbol and, if desired, whether they remember the names of stores where they saw the FOP symbol and the products on which they recall seeing it. To assist respondents with their recall, images of the FOP symbol can be displayed on a Web survey. Respondents access Web surveys using a survey link e-mailed to them or directly from a Web site.
If the evaluator is interested in working to explain causation of participants’ noticing the FOP label, an experimental design can be employed. A simulated shopping study embedded in a Web survey (Option 03 or 07 combined with Option 09) could connect participants’ noticing of the FOP symbol to their product selections. More detailed information about using this method is presented in the next section. Participants would be shown two- dimensional product images or presented with product images in a virtual grocery store environment and asked to select the product they would most like to purchase. Some products would display only the NFP and others would include the FOP symbol in addition to the NFP. Following selection of products, participants would complete a questionnaire asking if they noticed the FOP symbol on products, and if so, if noticing it affected their product selections in the simulated shopping.
Overall strengths and limitations of the options described above are outlined in Section 3.2, and additional information specific to addressing Q1: Notice is provided at the top of this section. A particular limitation of using a simulated shopping study (Options 03 and 07 combined with Option 09) to answer Q1: Notice is the following:
- The sample may be limited to broadband (high-speed Internet) users.
Description/Example of Application for Eye Tracking (Option 08)
To answer Q1: Notice, an eye-tracking experiment can be conducted in a grocery store or laboratory setting to examine whether consumers subconsciously notice the FOP symbol. Participants would be presented with a combination of products that include the FOP symbol and NFP. The amount of time participants focus on the FOP symbol and NFP is recorded and the times are compared. Results for this type of study can be calculated using a continuous or dichotomous measurement of time (for example, more or less time, compared with a relevant cut point such as the median time, spent focusing on the FOP symbol). Overall strengths and limitations of eye tracking (Option 08) are outlined in Section 3.2.
Description/Example of Application for Simulated and In-Store Shopping Studies (Options 09, 10, 11, and 12)
Q1: Notice can be answered by conducting a shopping study in either a simulated (Options 09, 10, and 11) or real grocery store environment (Option 12) where participants are asked to make product selections. Products would display only the NFP, and others would include the FOP symbol in addition to the NFP. Following selection of products, participants would be asked to complete a questionnaire asking if they noticed the FOP symbol on products and, if so, if noticing it affected their product selections.
As mentioned already in the Web survey description, a simulated shopping study can be embedded in a Web survey and administered to an online panel (Option 09). Alternatively, a simulated shopping study can be conducted in a laboratory where participants are asked to select products from a virtual grocery store (Option 10) or mock grocery store environment (Option 11). As Graham and Jeffery (2011) did in their study, an eye-tracking experiment (Option 08) can also be combined with a simulated shopping study conducted in a laboratory setting (Options 10 and 11) or real grocery store (Option 12) to record consumers’ actual behavior (such as eye tracker–measured viewing) rather than relying on self-report. Actual behavior can then be correlated with self-reported behavior.
Overall strengths and limitations of the options described above are outlined in Section 3.2.
Selected Alternative Methods
Selected alternative evaluation methods for assessing Q1: Notice are described below. If consumer evaluators are interested in formative types of research to inform the design of an FOP symbol, they can rate the decipherability of different FOP symbols according to definitive characteristics such as “size,” “color,” and shape to determine the likelihood that through perception, reasoning, or intuition, consumers will notice the FOP symbol.
If addressing secondary research-based questions is desired, responses to Q1: Notice can be treated as an exposure screen to determine subsequent questions to ask about topics such as perceived purpose, trust, credibility, and coverage of the FOP symbol.
Overall Assessment for Question 1: Do consumers notice the FOP symbol? Given the evaluation criteria outlined in Section 2.6, with a focus on evaluating the population impact of a national program, RTI suggests assessing Q1: Notice by using Option 03 or Option 07 to administer a probability-based Web survey.
- Option 03: New Web Survey: KN’s KnowledgePanel
- Option 07: Add Questions to Ongoing Web Omnibus Survey: KN’s QuickView.
Conducting a survey via the Web is preferable to other survey methods because, although both mail and Web surveys permit participants to look at the FOP symbol, Web surveys generally have faster turnaround times and higher response rates than mail surveys. Some studies also suggest that Web surveys tend to yield more accurate results than telephone interviewing because there is less social desirability bias and less random measurement error (Chang & Krosnik, 2009).
Because a consumer survey only gathers consumers’ self-reports as to whether they recalled seeing or hearing about the FOP symbol, it is important to supplement the Web survey with an option that examines observed behavior. To do this, RTI suggests performing an experimental shopping study (Option 10, 11, or 12) with eye tracking (Option 08) to observe the amount of time consumers spend focusing on the FOP symbol compared with the NFP.
- Option 10: Simulated Shopping Study: Laboratory-Virtual Grocery Store with Option 08: Eye Tracking
- Option 11: Simulated Shopping Study: Laboratory-Mock Grocery Store with Option 08: Eye Tracking
- Option 12: In-Store Shopping Study with Option 08: Eye Tracking
Given typical sample size limitations of these more resource-intensive methods, RTI does not suggest using these options exclusively for an evaluation intended to be generalizable to the U.S. population.
3.3.2 Question 1a. Do consumers notice manufacturers’ and retailers’ FOP symbol education efforts?
As discussed in Section 3.3.1 for Q1: Notice, the evaluation question Q1a: Education Notice can be interpreted for this evaluation plan in two ways: 1) recall and 2) cognitive perception. Given the evaluation criteria in Section 2.6—to address the population impact of a widely distributed and currently existing FOP symbol across population subgroups—this section interprets Q1a: Education Notice as “recall”—whether consumers recollect seeing the manufacturers’ and retailers’ FOP symbol education efforts (similar to Section 3.3.1 for
Q1: Notice). The methods proposed for Q1a: Education Notice are similar to those suggested for Q1: Notice.
Q1a: Education Notice can be assessed using the following methods:
- Option 01: New Phone Survey
- Option 02: New Mail Survey
- Option 03: New Web Survey: KN’s KnowledgePanel
- Option 04: Add Questions to Ongoing Phone Survey: FDA’s HDS
- Option 05: Add Questions to Ongoing Mail Survey: NPD’s Health Track
- Option 06: Add Questions to Ongoing Web Survey: NPD’s Dieting Monitor
- Option 07: Add Questions to Ongoing Web Omnibus Survey: KN’s QuickView
- Option 10: Simulated Shopping Study: Laboratory—Virtual Grocery Store
- Option 11: Simulated Shopping Study: Laboratory—Mock Grocery Store
- Option 12: In-Store Shopping Study
These methods as they apply to Q1a: Notice Education are described below. An assessment follows, offering RTI’s suggested approach for answering the question and reasons for the suggestion.
Broadly, as mentioned for Q1: Notice, the survey options for Q1a: Education Notice (Options 01 through 07) share the limitation that surveys to assess “notice” rely on respondents’ ability to recall having seen the education campaign. The primary outcome measure for all of the proposed methods would be dichotomous (such as yes, noticed educational campaign/materials or no, did not notice educational campaign/materials).
Study Options
Description/Example of Application for Phone Surveys (Options 01 and 04)
An interviewer can administer a survey over the phone to determine whether respondents report noticing manufacturers’ and retailers’ or another organization’s FOP symbol education efforts. Respondents may not remember the symbol or campaign by name; therefore, mailing or e-mailing pictures of the FOP symbol and printed or digital educational materials (if applicable) to participants in advance of the interview would be useful. Secondary questions about specific content of the education efforts can also be included in the survey.
A new phone survey (Option 01) can be developed, or questions can be added to an ongoing proprietary or government survey, such as FDA’s HDS (Option 04). Overall strengths and limitations of both of these options are noted in Section 3.2; a particularly relevant strength and limitation of using Option 04: Add Questions to Ongoing Phone Survey: FDA’s HDS to address Q1A: Education Notice are as follows:
Strength
- The HDS is an ongoing survey, so it can be less expensive to use than developing a new survey.
Limitation
- The survey is conducted every 3 to 5 years (FDA, 2011), making the ability to respond to Q1A: Education Notice in a timely fashion uncertain.
Description/Example of Application for Mail Surveys (Options 02 and 05)
A survey can be mailed to respondents to collect data on whether they report noticing manufacturers’ and retailers’ or another organization’s FOP symbol education efforts. Respondents may not remember the symbol or campaign by name, therefore, images of the FOP symbol and campaign materials can be included directly in the mail survey. Further, if the campaign includes audio or audiovisual materials, such as radio or TV ads, examples of these media materials can be included in the mailed survey package. Secondary questions about specific content of the education efforts can also be included in the survey.
To address Q1a: Education Notice, a new mail survey (Option 02) can be conducted or questions can be added to an ongoing proprietary survey, like NPD’s Health Track (Option 05). Overall strengths and limitations of both of these options are noted in Section 3.2; a particularly relevant strength of using Option 05: Add Questions to Ongoing Mail Survey: NPD’s Health Track to address Q1A: Education Notice is the following:
Strength
- Questionnaire data can be matched with households’ reported dietary intake.
Description/Example of Application for Web Surveys (Options 03, 06, and 07)
An ongoing or new Web survey can be used to address evaluation Q1a: Education Notice. A new survey can be administered to an online panel of consumers (Option 03), or questions can be added to an ongoing proprietary survey, such as NPD’s Dieting Monitor (Option 06) or an omnibus survey such as KN’s QuickView (Option 07). As with both the phone (Options 01 and 04) and mail survey modes (Options 02 and 05), respondents can be queried about whether they recall seeing manufacturers’ and retailers’ or another organization’s FOP symbol education efforts. To assist respondents with their recall of the FOP symbol and the educational campaign, pictures of the FOP symbol and printed, audio, or audiovisual educational materials such as TV or radio advertisements (if applicable) can be integrated into a Web survey. Secondary questions about the specific content of the education efforts can be included on any of the Web surveys. Respondents access Web surveys using a survey link e-mailed to them or directly from a Web site.
Overall strengths and limitations of these options are outlined in Section 3.2.
Description/Example of Application for Shopping Studies (Options 10, 11, and 12)
In order to examine whether participants cognitively notice signage or other in-store promotional materials associated with the manufacturers’ and retailers’ FOP symbol educational efforts, evaluators could conduct a simulated shopping study in a laboratory setting (Options 10 and 11) or an in-store shopping study in a grocery store (Option 12). Participants in a virtual, mock, or real grocery setting could be asked to select products for purchase. Two groups would be provided with products displaying the FOP symbol; however, the shopping environment for one of the two groups would include displays of campaign materials, such as educational signage. Following product selection, participants could either be debriefed by an interviewer or complete a short survey asking about influences on their choices.
Overall strengths and limitations of these options are outlined in Section 3.2. The following is a particularly important limitation to note when considering using any of the shopping study options to assess Q1a: Education Notice:
- If an educational campaign is intended to expose consumers to a diverse set of materials in a variety of settings and on multiple occasions (such as audio, audiovisual, brochures, billboards), the experiment may not capture average total exposure by participants.
Overall Assessment for Question 1a: Do consumers notice manufacturers’ and retailers’ FOP symbol education efforts?
Given the evaluation criteria outlined in Section 2.6, with a focus on evaluating the population impact of a national program, RTI suggests assessing Q1a: Education Notice by using Option 03 to administer a probability-based Web survey.
- Option 03: New Web Survey: KN’s KnowledgePanel
A Web survey, unlike phone or mail surveys, allows evaluators to readily present colorful images of the FOP symbol and examples of multimedia materials used in the campaign. The ongoing and omnibus Web survey options (Options 06 and 07) either cannot include audio and audiovisual examples (Option 06) or may restrict the sample to broadband users, if they are included (Option 07). Therefore, these options are not suggested for this type of study unless the campaign is limited to materials that can be displayed as images (such as printed educational materials or signs). Further, both the ongoing and omnibus survey options control the number of questions that can be included.
To control for respondents potentially overreporting their notice of the campaign, it is preferable to gather data both before and after the launch of the education campaign. However, the lack of details about the campaign’s content and timing, in advance of the launch, can pose a challenge for determining the most relevant variables to collect and the most appropriate time for data collection.
In considering timing of post-campaign data collection, 2 to 6 weeks after the campaign’s launch should allow consumers adequate time to have traveled to the supermarket in advance of being surveyed. Collecting data either too soon or too long after the launch can result in underreporting notice of the campaign. Collecting data too soon can increase the probability that consumers may miss the campaign’s peak; whereas allowing too much time to pass can negatively affect consumers’ recognition of the campaign.
If the campaign includes education materials displayed in the grocery store setting and an experimental design is desired, an experimental shopping study (Option 10, 11, or 12) that uses eye tracking (Option 08) can be used in addition to a new Web survey (Option 03). These experiments would allow evaluators to examine whether consumers looked at campaign materials while shopping, thus gathering data on consumers’ observed or cognitive sense of notice rather than relying on self-reported notice. The trade-off between studies conducted in real versus simulated grocery store environments is realism versus the ability to control/manipulate the environment. To provide further control over an experimental evaluation, comparing awareness of the educational campaign to awareness of a bogus campaign is useful. Depending on how the campaign is rolled out, it may be possible to compare awareness of the campaign in areas that had a high level vs. a lower level of campaign activity. However, as with all shopping studies, it is important to consider whether total campaign exposure may not be captured if much of the campaign’s distribution occurred outside of the store setting. Moreover, given typical sample size limitations of these more resource-intensive methods, RTI does not suggest using these options exclusively for an evaluation intended to be generalizable to the U.S. population.
If the educational campaign does not include audio or audiovisual materials, a new mail or phone survey may suffice. Or, if the educational campaign uses mainly radio advertisements, then a phone survey in addition to a Web survey would work well to evaluate the educational campaign.
3.3.3 Question 2. Can consumers understand the healthiness of products using the FOP symbol?
Q2: Understand can be assessed using the following methods:
- Option 02: New Mail Survey
- Option 03: New Web Survey: KN’s KnowledgePanel
- Option 07: Add Questions to Ongoing Web Omnibus Survey: KN’s QuickView
- Option 10: Simulated Shopping Study: Laboratory—Virtual Grocery Store
- Option 11: Simulated Shopping Study: Laboratory—Mock Grocery Store
These methods as they apply to Q2: Understand are described below. An assessment follows, offering RTI’s suggested approach for answering the question and reasons for the suggestion.
Before an experiment can be conducted to investigate Q2: Understand, the evaluator must define what qualifies a product as a “healthy” versus “less healthy” product. The definition can be determined using an existing or newly created scoring method to qualify products for a summary FOP symbol or some other specified criteria for a nutrient-specific symbol (such as fewest negative nutrients and calories, low calories).
The primary outcome measure for all of the proposed methods would be dichotomous (such as yes, understand information provided on symbol or understand symbol vs. no, do not understand information provided on symbol or do not understand symbol). Taking into account the nutritional quality of foods and presence of the FOP symbol, the proportion of participants who correctly selected the “healthy” products can be tabulated for each group and compared.
During the assessment of Q2: Understand, the evaluator may wish to explore potential implications of the health halo effect on consumers’ understanding of products’ healthiness. When judging nutritional aspects of foods, consumers tend to overgeneralize from one “healthy” nutrition claim (e.g., “low calorie”) by assuming that foods feature other healthy attributes as well (e.g., low in fat). Because FOP symbols may not be displayed on all products in the supermarket, it could be important to determine if consumers associate a health halo with the FOP symbol of interest. In other words, do consumers assume that the presence of the FOP symbol on a product indicates that it is a more healthy option than a product without the symbol? For example, this can occur with a nutrient-specific FOP symbol when one cereal manufacturer/producer elects to place the FOP symbol on a less healthy product and another cereal manufacturer/producer does not include the symbol, yet the latter’s nutritional profile is healthier than the former’s. Similar to the methods described above for evaluating understanding, the health halo effect can be examined using a series of tests. For each test, participants in both the control and experimental groups would be presented with products from a single category and asked to choose a product based on its healthfulness; products would vary in their nutritional content. For both groups, all products would display the NFP, while the experimental group would also be shown products with the FOP symbol in addition to the NFP. For each test, the evaluator would vary between healthy and less healthy those products displaying the FOP symbol. Following product selection, participants would be queried about reasons for their choices.
Study Options
Description/Examples of Application for Surveys (Options 02, 03, and 07)
An experimental new mail survey (Option 02) or new or ongoing Web survey (Option 03 or 07) can be conducted to determine if consumers better understand the healthiness of products using the FOP symbol. For this type of experiment, participants would be divided into two groups (that is, a control group and an experimental group). Both groups would participate in a series of tests during which they would be shown images of the front and back or side of packages. Although the products for both groups would be the same for the tests, the control group’s images would only display the NFP on the back or side of each product’s package, whereas the experimental group’s products would display the FOP symbol being evaluated and the NFP on the back or side of the package. For each separate test, products would be drawn from a single category but would vary by their nutritional content. Participants would be asked to select the more or less healthy product, based on predetermined criteria (for example, “Based on what you see on the labels, if you wanted to buy a healthy product for your family, which of these two products would you select?”). Secondary questions could also be asked to solicit support for the choice, such as “Why did you decide to choose the product?,” or to assess understanding of the content of the FOP symbol. Participants shown the FOP symbol can be asked a series of interpretation questions: for example, “How many calories does this product have?” or “What percentage of your daily value for sodium is included in this product?” Lastly, response times between groups can be assessed and compared to determine ease of accessing information on the symbol. Overall strengths and limitations of the options described above are outlined in Section 3.2.
Description/Examples of Application for Laboratory-Based Simulated Shopping Studies (Options 10 and 11)
To evaluate Q2: Understanding, evaluators can use laboratory-based simulated shopping studies in a virtual (Option 10) or mock (Option 11) grocery store setting. In both options, participants would be separated into two groups (such as control and experiment), shown sets of products from a single category, and asked to select the healthiest option, based on predetermined criteria. Similar evaluation methods would be used as those described for the survey options with the major difference being that the laboratory would provide a more realistic setting for participants and more realistic-appearing product packages than what could be displayed using a survey.
Further, using a simulated method, within the experimental group, the evaluator could randomly assign the FOP symbol to indicate either a more or less healthy selection. Participants could then be divided into two groups with one group exposed to a shopping aisle or category with less healthy products displaying the FOP symbol than those products without the FOP symbol and the other group exposed to the opposite classification scenario. Evaluators would record participants’ choices and inquire about reasons for their selections. Secondary questions can also be asked to solicit support for the choice or to assess the ability to interpret the FOP symbol; examples are provided in the previous survey options section (Options 02, 03, and 07). Lastly, as noted in survey options section (Options 02, 03, and 07), response times between groups can be assessed and compared to determine ease of accessing information on the symbol. Overall strengths and limitations of the options described above are outlined in Section 3.2. In general, a virtual simulation appears less realistic to participants than a mock grocery store environment, making participants less likely to behave naturally.
Selected Alternative Methods
Eye tracking (Option 08) can be used in combination with a shopping study conducted in a laboratory setting (Options 10 and 11) to observe which part of the FOP symbol or NFP participants frequently focused on during the tests. This observed information can be compared with participants’ self-reported responses about which labeling components were most helpful in choosing the healthier product.
To use a probability-based sample and provide participants with a more natural experimental setting than a survey provides, evaluators can embed a simulated shopping study in a Web survey (Option 09). Conducting a shopping study in a real grocery store setting (Option 12) has not been posed as an option because of the evaluator’s limited ability to control for confounding factors using this type of study.
Overall Assessment for Question 2: Can consumers understand the healthiness of products using the FOP symbol?
Based on the evaluation criteria outlined in Section 2.6, with a focus on evaluating the population impact of a national program, RTI suggests assessing Q2: Understand by using Option 03 or 07 to administer a probability-based Web survey.
- Option 03: New Web Survey: KN’s KnowledgePanel
- Option 07: Add Questions to Ongoing Web Omnibus Survey: KN’s QuickView
However, if resources are restricted, a nonprobability-based sample can be used with acknowledgment of its limitations. Q2: Understanding should be based on respondents’ ability to select healthy products using the FOP symbol compared with not using the symbol.
To assess consumers’ ability to understand in a more natural setting than a Web survey (Option 03 or 07), while still controlling for confounding factors, evaluators can supplement the data collected using the larger Web survey by conducting a relatively small simulated shopping study in a laboratory setting (Options 10 and 11). Furthermore, if the goal of the evaluation is focused on a research objective rather than assessing the program’s impact, a laboratory shopping study can be used exclusively.
3.3.4 Question 3. Do consumers use the FOP symbol when purchasing products?
Q3: Use can be assessed using the following methods:
- Option 01: New Phone Survey
- Option 02: New Mail Survey
- Option 03: New Web Survey: KN’s KnowledgePanel
- Option 04: Add Questions to Ongoing Phone Survey: FDA’s HDS
- Option 05: Add Questions to Ongoing Mail Survey: NPD’s Health Track
- Option 07: Add Questions to Ongoing Web Omnibus Survey: KN’s QuickView
- Option 08: Eye Tracking
- Option 09: Simulated Shopping Study: Web
- Option 10: Simulated Shopping Study: Laboratory—Virtual Grocery Store
- Option 11: Simulated Shopping Study: Laboratory—Mock Grocery Store
- Option 12: In-Store Shopping Study
- Manufacturer and Retailer (M&R) Option 02: Scanner Data on Food Sales: Nielsen Homescan Combined with M&R Option 03: Food Nutrient Label Database: Gladson’s Nutrition Database (see Section 4 for more information about M&R options)
These methods as they apply to Q3: Use are described below. An assessment follows, offering RTI’s suggested approach for answering the question and reasons for the suggestion.
The survey (Options 01 through 07), eye tracking (Option 08), simulated shopping study (Options 09 through 11), and in-store shopping study (Option 12) options will provide self- reported or observed information about whether consumers use the FOP symbol when making purchasing decisions and explain how they use it. In comparison, an analysis of secondary sales data (M&R Option 02 combined with M&R Option 03) will provide information about changes in sales of products sold with and without the FOP symbol.
The primary outcome for all of the possible options for addressing Q3: Use, except for M&R Option 2 combined with M&R Option 3, is dichotomous (such as used FOP symbol to make selection or did not use FOP symbol to make selection) or the change in proportion of respondents who report using the FOP symbol to inform product selection. Secondary questions can be posed as well, such as a scaled question asking respondents to rate the FOP symbol on the following traits: “helpful/not helpful,” “easy to use/hard to use,” “tries to inform/tries to sell,” “trust worthy/not trustworthy,” and “not too informative/very informative.”
Study Options
Description/Examples of Application for Surveys (Options 01, 02, 03, 04, 05, and 07)
To determine whether consumers use the FOP symbol when making product purchasing decisions, evaluators can conduct a new or ongoing experimental survey via the phone, mail, or Web. For all survey methods, respondents would view images of the front and back of two or more food packages within the same food category and select the products they want to purchase. Some products would display the FOP symbol and NFP, while others would include only the NFP. (Phone respondents would need to be mailed a set of product images before the interview.) Nutritional content would vary between products. After respondents select products, they would be asked a series of follow-up questions to discern if the presence of the FOP symbol or information contained on the symbol informed their product selections. For example, respondents can be asked, “Did you notice the FOP symbol (an image of the label is again shown)?” and “Did you find the FOP symbol to be helpful when you selected the different products?” Questions can focus on intentional selection of products appearing more healthy or avoidance of products appearing less healthy, based on information displayed on the FOP symbol (such as Facts Up Front) or presence or absence of the symbol (such as Great For You).
Additionally, a simulated shopping study can be embedded in a Web survey (Option 03 or 07 combined with Option 09) to address Q3: Use. More detailed information about this option is provided in the next section. Overall strengths and limitations of the options described above are outlined in Section 3.2. A unique and particularly relevant limitation and strength of survey methods that apply to addressing Q3: Use are noted by option below.
Option 01 and Option 04: New Phone Survey and Ongoing Phone Survey: FDA’s HDS
Limitation
- It may be difficult to use an experimental design because participants would need to receive images for the experiment before the interview, which can lead to logistical issues or awareness biases.
Option 05: Ongoing Mail Survey: NPD’s Health Track
Strength
- Survey data can be matched with households’ reported dietary intake, allowing secondary questions to be explored.
Description/Examples of Application for Laboratory Simulated Shopping Studies (Options 10 and 11), In-Store Shopping Study (Option 12) with or without Eye- Tracking (Option 08), and Simulated Shopping Study: Web (Option 09)
Q3: Use can also be addressed by conducting a simulated shopping study that is embedded in a Web survey (Option 09), conducting a simulated shopping study in a laboratory in a virtual or mock grocery store setting (Option 10 or 11), or conducting a shopping study in an actual grocery store (Option 12). Unlike the experimental surveys described earlier that are limited to displaying images of different products, experimental shopping studies enable participants to select products to purchase from a group of products arranged in a “shopping aisle.” Within an aisle, all products would be from a single category and would display the NFP. Evaluators would conduct multiple tests of different product categories/aisles. Additionally, select products would display the FOP symbol. Following product selection, respondents would be surveyed to learn if they noticed the FOP symbol and if it affected their product selections. Evaluators can ask similar questions as those listed in the survey section. Of course, within an actual grocery store setting, the environment for the experiment cannot be manipulated as easily as the environment in simulated studies (for example, all products within an aisle may not be from a single category and several FOP symbols and/or health claims may be displayed). Therefore, more confounders outside of the evaluator’s control can exist.
Secondarily, to collect observed information about whether participants review the FOP symbol compared with other parts of the package during product selection, and for how long they view the FOP symbol, an eye-tracking study can be added to the simulated laboratory or real shopping study.
Overall strengths and limitations of the options described above are outlined in Section 3.2. In general, a virtual simulation appears less realistic than a mock grocery store environment, which in turn is less realistic than an actual grocery store setting; participants tend to behave less naturally in less realistic experimental settings. Moreover, although eye tracking can capture important observed behavior, wearing the goggles can cause participants to behave unnaturally.
Description of Method/Example of Application of Scanner Data (M&R Options 01 and 02) combined with a Food Nutrient Label Database (M&R Options 03 and 04) (see Section 4 for more information about M&R options)
Evaluators can use changes in product sales to assess the impact of an FOP symbol on purchasing behavior, in addition to or in place of an evaluation that addresses more cognitive mediators on consumer behavior, as described in the options above. The evaluator would be presuming that sales changes are surrogates of the effects of consumer use of an FOP symbol. Predetermined criteria would be used to categorize products as more healthy or less healthy.
For binary FOP symbols, meaning they are either absent or present based on the product’s nutritional assessment against established criteria, such as Walmart’s Great For You symbol, evaluators would compare changes in sales of products with or without the symbol over time. Those products displaying the symbol are presumed to be more healthy than those without the symbol. Accordingly, an increase in sales of products within a category displaying the FOP symbol would imply that consumers were using the absence or presence of the FOP symbol to inform their food choices.
The effect on product sales of a nutrient-specific FOP symbol that is designed to be on all products and is not based on an algorithm would be more complex to evaluate. Unlike binary FOP symbols, where presence indicates more healthy, products displaying nutrient- specific FOP symbols must first be categorized as either healthy or less healthy. Possibilities for classifying products include criteria explored in an earlier phase of this project (Arsenault, Fulgoni, Hersey, & Muth, 2011) and other publically available FOP symbol and claim standards. When selecting criteria, evaluators should consider that algorithms may include only positive or negative nutrient values and calorie information or a combination of nutrient and calorie information. For example, Facts Up Front displays calories and three negative nutrients, with the optional inclusion of two additional positive nutrients. Thus, comparisons between FOP symbols can be challenging. Analysis of product sales data using nutrient-specific FOP symbols can be strengthened by sensitivity analyses that consider classification based on negative nutrients and the combination of negative and positive nutrients. Compared with the affirmative interpretation used for evaluating Q3: Sales for binary FOP symbols—an increase in sales of products displaying the symbol can be associated with an increase in sales of more healthy products—determining a positive response for nutrient-specific symbol types must take into account both increases in FOP symbol-labeled products meeting the more healthy criteria and decreases in FOP symbol- labeled products meeting the less healthy criteria. Figure 3-1 depicts hypothetical results of the effects of the nutrient-specific Facts Up Front symbol on sales of healthy versus less healthy products.
 |
Overall strengths and limitations of the options described above are outlined in Section 4. A unique and particularly relevant strength and limitation of using sales data to address Q3: Use are noted below.
Strength
- This approach can assess data from a large sample of the population across numerous product types.
Limitation
- Linking consumer use of the FOP symbol to increased purchases of more healthy products and decreased purchases of less healthy products can overlook consumer-level confounders that might be associated with changes in sales.
Once data sources are purchased, a delay in time to analyze can occur; therefore, this secondary method cannot yield as timely results as the consumer study options.
Selected Alternative Method
Alternatively, a simulated shopping study in a laboratory setting can be structured like an experimental auction. For this type of experiment, a group of participants is asked to place bids on real products differentiated by nutritional content, labeling content, or other product attributes. A number of auction mechanisms exist that could help evaluators elicit participants’ willingness to pay for the attribute of interest (Lusk & Shogren, 2007).
Overall Assessment Question 3: “Do consumers use the FOP symbol when purchasing products?”
Based on the evaluation criteria outlined in Section 2.6, with a focus on evaluating the population impact of a national program, RTI suggests assessing Q3: Use by using Option 03 or 07 combined with Option 09.
- Option 03: New Web Survey: KN’s KnowledgePanel with Option 09: Simulated Shopping Study: Web
- Option 07: Add Questions to Ongoing Web Omnibus Survey: KN’s QuickView with Option 09: Simulated Shopping Study: Web
Depending on the availability of resources, respondents can be shown two-dimensional images of product packages or participate in a shopping study in a virtual grocery store.
To validate findings from a consumer-focused evaluation of this question, a secondary analysis of sales data (M&R Option 02 combined with M&R Option 04) can be used. To connect the amount of time participants focus on the FOP symbol while making product selections and assess observed behavior, evaluators might also find it useful to combine a simulated shopping study conducted in a laboratory (Option 10 or 11) with an eye-tracking experiment (Option 08). Alternatively, a shopping study in either a mock or actual store (Option 11 or 12) can be used to evaluate Q3: Use. The advantage of shopping studies conducted in mock or actual grocery store environments is that participants are more likely to engage in their “natural” shopping behaviors when interacting with real products as opposed to product images. However, given typical sample size limitations of these more resource-intensive methods (such as simulated shopping studies with or without eye tracking), RTI does not suggest using these options exclusively for an evaluation intended to be generalizable to the U.S. population.
3.3.5 Question 4. Is consumer understanding of the FOP symbol affected by coexisting FOP or shelf-labeling schemes?
Q4: Understanding Affected by Coexisting can be assessed using the following methods:
- Option 02: New Mail Survey
- Option 03: New Web Survey
- Option 07: Add Questions to Ongoing Web Omnibus Survey: KN’s QuickView
- Option 08: Eye Tracking
- Option 09: Simulated Shopping Study: Web
- Option 10: Simulated Shopping Study: Laboratory—Virtual Grocery Store
- Option 11: Simulated Shopping Study: Laboratory—Mock Grocery Store
- Option 12: In-Store Shopping Study
Methods of applying these options to Q4: Understanding Affected by Coexisting are described below. An assessment follows, offering RTI’s suggested approach for answering the question and reasons for the suggestion.
Study Options
Description/Example of Application of Surveys (Options 02, 03, and 07), with a Simulated Shopping Study: Web(Option 09)
To determine if consumer understanding is affected by coexisting FOP labeling schemes, evaluators can conduct a new experimental mail (Option 02) or new or ongoing Web survey (Option 03 or 07) with or without a simulated shopping experiment (Option 09). For this type of experiment, participants are divided into multiple groups and shown different combinations of product packages that vary in their FOP and shelf-labeling schemes. For example, group exposures can vary as follows:
- Group A: Packages display only the NFP (control group).
- Group B: Packages display both the FOP symbol and NFP.
- Groups C, D, and … (Number of groups depends on overall sample size): Packages display the FOP symbol, NFP, and various combinations of other FOP or shelf-labeling schemes.
Following participants’ exposure to the product packages and, if relevant, additional shelf- labeling schemes, they would be asked questions to assess their understanding of the healthiness of a food product and how they made the determination (for example, reviewed the NFP, the FOP symbol, other symbol or shelf tag or a combination of nutrition information). Similar understanding and interpretation questions can be used as for the examples provided for Q2: Understand. For example, to assess the primary question of the effect of coexisting labels’ influence on understanding, evaluators can ask the following dichotomous question: “Based on what is displayed on the product’s label, and if relevant, shelf tag, if you wanted to buy a healthy product for your family, which product would you select?” (that is, understood symbol or did not understand symbol). Secondary interpretation questions can follow, including “How much sugar is in this product?” or “Which of two products is lowest in calories?”
To potentially improve the accuracy of participant responses, evaluators can embed a simulated shopping study employing a virtual shopping environment in a Web survey (Option 09). Using this method would provide participants with a more natural setting for reviewing product packages and shelf tags than a survey provides. Additional information about using this option is provided in the next section. As with Q2: Understanding, participant response time can be assessed using eye tracking (Option 08).
Overall strengths and limitations of the selected options are described in Section 3.2. Unique and particularly relevant strengths and limitations of applying these options to Q4: Understanding Affected by Coexisting are noted below. A limitation of all of the survey methods is the following:
- Surveys are not an ideal mode for assessing the effect of shelf-labeling schemes on consumer understanding because shelf labels may not appear very natural when presented outside of a grocery store setting and by themselves.
Options 03 and 07: New Web Survey: KN’s KnowledgePanel and Ongoing Web Omnibus Survey: KN’s QuickView
Strength
- A Web survey employing KN’s KnowledgePanel can embed a simulated shopping study in the survey that displays two-dimensional product images or a virtual grocery store.
Description/Example of Application for Shopping Studies (Options 09, 10, 11, and 12)
To determine if consumer understanding is affected by coexisting FOP labeling schemes, evaluators can conduct simulated shopping studies using virtual shopping aisles in simulated online grocery stores (Option 09) or laboratory settings (Option 10), mock shopping aisles in laboratory settings (Option 11), or real shopping aisles in actual stores (Option 12). Within the selected settings, participants would be asked to select the healthiest product from a group of products within a single food category (such as cereal). All products would display the NFP. Select products would also display the FOP symbol and/or other FOP/shelf nutrition labeling combinations.
If desired, the FOP symbols can be randomized to indicate either a more healthy or less healthy selection. Participants can then be divided into two groups with one group exposed to a shopping aisle or category with less healthy products displaying the FOP symbol than those products without the FOP symbol, and the other group exposed to the opposite classification scenario. As with the nonrandomized version, within both groups, all products would display the NFP, and select products would also include additional or alternative FOP label and shelf-labeling combinations.
In both the randomized and nonrandomized designs, following product selection, participants would be asked a series of questions to assess if the FOP symbol informed their product selections and whether coexisting labels affected their decisions. To begin, participants would be asked whether they noticed the FOP symbol and/or other FOP/shelf- labeling schemes. If participants did notice the symbol or labels, they would be asked whether one or more of these schemes contributed to their product selection. The primary outcome for this question is dichotomous (such as yes, understood symbol or no, did not understand symbol). Additional interpretation questions, similar to those described for the survey options, can be asked.
To determine if participants reviewed the FOP symbol being evaluated (vs. other FOP or shelf labels, including competing claims) during product selection and for how long, eye tracking (Option 08) can be added to a simulated (Options 10 and 11) or in-store shopping study (Option 12).
Overall strengths and limitations of the selected options are described in Section 3.2. As already noted, in general, a virtual simulation appears less realistic than a mock grocery store environment, which in turn is less realistic than an actual grocery store setting; participants tend to behave less naturally in less realistic experimental settings. Moreover, although eye tracking can capture important observed behavior, wearing the goggles can cause participants to behave unnaturally.
A particular limitation of using an in-store shopping study to address Q4: Understanding Affected by Coexisting is the following:
- It is difficult to ensure all product combination types of interest are included in actual store aisles.
Overall Assessment Question 4: Is consumer understanding of the FOP symbol affected by coexisting FOP or shelf-labeling schemes?
RTI suggests evaluating Q4: Understanding Affected by Coexisting by conducting a new experimentally based Web survey (Option 03) embedded with a simulated shopping study (Option 09) with a probability-based panel of consumers. Given that coexisting shelf- labeling schemes tend to be challenging to realistically display on a survey, a Web survey (Option 03) without the simulated experience is not suggested. Considering the evaluation criteria outlined in Section 2.6 and the resources necessary to conduct laboratory-based simulated shopping studies (Options 10 and 11) and in-store shopping studies with large sample size (Option 12), these methods are not proposed as primary evaluation options.
[Go to Contents]
3.4 Sample Size Considerations
When planning a study reporting differences among groups or describing some variable in a single group, sample size should be considered because it allows the evaluator to control for the risk of reporting a false-negative finding (Type II error) or to estimate the precision his or her experiment will yield. In practice, sample size used in a study is determined based on the expense of data collection and the need to have sufficient statistical power. Larger sample sizes generally lead to increased precision when estimating unknown parameters. If the evaluator relies on an existing data set for the evaluation (such as Option 04: FDA’s HDS or Option 05: NPD’s Health Track), the evaluator will need to be familiar with the sample design used for the data collection and its associated strengths and limitations for making population inferences and, if desired, detecting differences between groups. At the time of planning a new study (such as Option 02: New Mail Survey or Option 03: New Web Survey), the evaluator should establish 1) a justifiable level of statistical significance, 2) the chances of detecting a difference of given magnitude between the groups compared (that is, the power), and 3) the targeted difference (that is, effect size).
Sample size considerations for all of the primary consumer questions can use similar criteria, because their individual evaluations can be summarized with dichotomous variables outcomes (yes/no in response to whether consumers noticed the FOP symbol, whether consumers understood the healthiness of the product based on the FOP symbol, etc.).
As described in the introduction, FDA wants to ensure that the FOP symbol is designed to enable consumers with a wide range of literacy, educational levels, age, and other characteristics to compare the relative healthiness of products within and across food categories. Based on FDA’s interest, the evaluator may consider dividing the population into distinct, independent strata to allow inferences about specific subgroups to be made that may not be possible in a more generalized random sample. If the evaluator decides to use stratified sampling, they should consider the following potential limitations:
- Identifying strata and implementing such an approach can increase the cost and complexity of sample selection, as well as lead to increased complexity of calculating population estimates.
- When examining multiple criteria, stratifying variables may be related to some criteria, but not others, further complicating the design and potentially reducing the benefits of using the strata.
- In some cases (such as designs with a large number of strata or those with a specified minimum sample size per group), stratified sampling can potentially require a larger sample than other methods.
In many situations, the sample fraction may be varied by stratum, and data will have to be weighted to appropriately represent the population. Sample weighting can result in increased variance estimates, lessened power, and reduced effective sample size, which should be anticipated when selecting the overall sample size.
Assuming that primary consumer evaluation questions will be summarized using binary outcomes, power computations can be computed for a two-group comparison using Fisher’s exact test or a similar probability distribution (such as a chi-square, χ2, distribution). Table 3-5 displays power estimates at the 0.05 level of significance (two sided) for a range of sample sizes per group and assumed proportions of respondents who give a yes response in each group. Conventional practice is to determine the sample size that gives 80% power at the 0.05 level of significance (two sided). If the criterion is 0.05, the probability of a false positive, that is, obtaining the observed effect when the null hypothesis is true, would be less than 0.05. If the power is 80%, the probability of a false negative, failing to observe an effect when the null hypothesis is false, would be 20%. For example, as shown in the highlighted row in Table 3-5, in a sample of 400 respondents, two groups of equal size (200 per group—low socioeconomic status [SES] vs. high) have a proportion of affirmative responses (such as notice FOP symbol) in one group = 0.30 (for example, low SES who noticed FOP symbol) and in the other group affirmative responses = 0.44 (for example, high SES who noticed FOP symbol). As shown in the highlighted row in the table, in this example one would expect an 80% chance of observing an effect and rejecting the null hypothesis when the null is false. (The table assumes a 0.05 level of significance, two sided.)
Table 3-5. Power under Varying Assumptions
| Proportion | Power | |||
| A | B | 100/Group | 200/Group | 300/Group |
| 0.10 | 0.25 | 76 | 97 | 99 |
| 0.10 | 0.26 | 80 | 98 | 99 |
| 0.10 | 0.29 | 91 | 99 | 99 |
| 0.20 | 0.38 | 76 | 97 | 99 |
| 0.20 | 0.39 | 80 | 98 | 99 |
| 0.20 | 0.42 | 90 | 99 | 99 |
| 0.30 | 0.44 | 48 | 80 | 93 |
| 0.30 | 0.45 | 54 | 85 | 96 |
| 0.30 | 0.47 | 65 | 92 | 98 |
| 0.40 | 0.52 | 37 | 63 | 82 |
| 0.40 | 0.54 | 46 | 77 | 92 |
[Go to Contents]
3.5 Consumer Studies Analysis Plan
Analyses of the consumer question data should begin with basic descriptive statistics to summarize the data set. Binary endpoints (all yes/no questions) and categorical participant/respondent characteristics can be reported with frequencies and percentages. Continuous endpoints (such as time spent focused on FOP symbol) can be summarized with means, standard deviations, and percentiles (25th percentile, median, 75th percentile).
The main analysis strategy to address the primary evaluation questions for each type of study design can be contingency tables and logistic regression models with consumer responses as the outcome (for example, did participant/respondent notice the FOP symbol); characteristics of consumers can then act as predictors or explanatory factors (such as age, gender, SES status, geographic location). To adjust for potential effects of confounding, additional covariates should be included in logistic models, and interaction effects of combinations of characteristics (for example, age group x SES status interaction) considered. If desired, subgroup analyses can be performed to address questions separately by relevant subgroups (such as separate analyses by gender, SES, education).
When the outcome measures are not binary (such as categorical, count, and continuous), alternative analysis methods can be used. Examples of methods for examining nonbinary outcomes are provided. Analysis of covariance (ANCOVA) models can be used to explore explanatory factors that may be related to continuous measures of time spent focusing on the FOP symbol compared with other parts of the label. Further, time values can be dichotomized based on relevant cut points. For example, overall time can be divided between time spent focused 1) predominantly on the FOP symbol, 2) predominantly on the NFP, or 3) equally between the FOP symbol and the NFP, or overall time spent reviewing different parts of the label and answering interpretation questions can be dichotomized.
Count data (such as proportion of eligible products with the FOP symbol vs. proportion without the symbol) can be addressed using either linear regression or ANCOVA; choice of method would depend on data distributions. Outcomes reported on an ordinal scale (such as strongly agree, agree, disagree, strongly disagree the FOP symbol is helpful to understanding if a product is healthy for my family) can be converted to binary outcomes (agree/strongly agree vs. all other responses) or analyzed using a polytomous response model, a measurement model intended to measure a trait using response items that are scored or successive integers, with ordinal outcomes and global odds ratios as the parameter of interest.
Further, exploratory analyses can be performed to address questions beyond the primary evaluation questions. For example, to assess whether self-reported behaviors are in agreement with experimental results, categorical outcomes can be correlated using Kappa statistics for binary variables or more generally for variables with categorical structure (that is, three or more response levels). Additionally, subgroup analyses can be conducted to address evaluation questions by subgroups of interest.
Missing data reduce the representativeness of the sample and therefore can distort inferences about the population. Even with methods employed at the design stage to minimize missing data prior to data collection, missing data commonly pose an analysis problem, particularly with survey data. Missing data can occur as a result of item nonresponse, inconsistent data, or loss of data. Main methods of addressing missing data include 1) imputation (that is, values for missing items are imputed based on other nonmissing values) and 2) sensitivity analysis (different scenarios are considered in which the missing values assume ranges of values to determine the impact of the missing data on results). Alternatively, depending on the volume of missing data and importance of the variables commonly missing, records with missing items can be excluded; however, excluding records can bias the results.
[Go to Contents]
4. MANUFACTURER AND RETAILER DESIGN AND ANALYSIS PLAN
This section provides evaluation options for the manufacturer and retailer evaluation questions. From this point forward, we refer to manufacturer- and retailer-related questions by their shorthand notation provided in Table 4-1.
| Manufacturer and Retailer (M&R) Question | Shorthand Notation |
| 1. How many (or what proportion of) products and product categories have the FOP symbol and how does it vary across products and product categories? | Q1: Proportion Products |
| 1a. How many (or what proportion of) branded and private-label products have adopted the FOP symbol? | Q1a: Proportion Branded vs. Private-Label Products |
| 2. How are manufacturers and retailers monitoring implementation of and compliance with the FOP symbol? | Q2: Implementation and Compliance |
| 3. How has the FOP symbol affected product sales volumes? | Q3: Product Sales |
| 4. Since the introduction of the FOP symbol, have product sales volumes of reformulated products changed? | Q4: Product Sales Reformulated |
| 5. What types of products have been reformulated since introduction of the FOP symbol? | Q5: Types of Products Reformulated |
| 6. How many (or what proportion of) products have been reformulated since introduction of the FOP symbol? | Q6: Proportion Products Reformulated |
| 7. What types of nutrients have been affected by the FOP symbol’s reformulation and to what extent? | Q7: Nutrients Affected |
4.1 Basic Study Designs
As with the consumer section, broadly speaking, study samples can be either probability based and yield data from representative groups of the target population or nonprobability based. Typically, resource and feasibility considerations drive the choices of sampling strategies. However, as shown in the following sections, efficiencies can be built into study designs to conserve and maximize resources. For example, several manufacturer and retailer evaluation questions can be addressed using a store survey. For this example, considering the overall evaluation plan’s focus on conducting population-level evaluation, RTI suggests using a probability-based sample of stores. To conserve resources, the evaluator could divide the population of stores into subgroups (such as by location, size, or sales) and then randomly select the sample proportionally from the different strata. Further, the sample of products could be stratified by type, limiting the number of overall products that would need to be reviewed in each store. Moreover, studies can be designed to be either experimental or nonexperimental. In this section, the majority of the options using secondary data sets rely on probability-based samples and nonexperimental designs. For those options using primary data collection, probability-based samples with experimental designs are proposed. See Section 3.1 for more information about experimental and nonexperimental designs.
[Go to Contents]
4.2 Description of Methods
Similar to the consumer evaluation section, different data sources and methods can be employed to evaluate the effect of the FOP symbol on product sales and reformulation. A single method or data set cannot provide comprehensive answers to all of the evaluation questions. In comparison to the consumer section that largely relies on primary data collection designs, this manufacturer and retailer section focuses mainly on secondary data analysis. Based on the evaluation criteria outlined in Section 2.6 and discussions with the full FDA, ASPE, and RTI team, RTI presents options for addressing the manufacturer and retailer evaluation questions. RTI recognizes that the presented options for addressing questions are not exhaustive. Options discussed in the manufacturer and retailer section are analyzing secondary data obtained from scanner data on food sales, food nutrient label databases, or FDA’s FLAPS and collecting primary data from store surveys of food labels, manufacturer and retailer surveys, or stakeholder interviews. Table 4-2 provides a brief description of each data source or method, information on the frequency of data collection, estimated relative cost compared with other data sources or methods described, availability of results if the data source or method is used, and the evaluation questions that can be addressed by that method. A more detailed description of each method or data source is provided below, with a discussion of the accepted strengths and limitations of the method or data source. Many of the data sources described in the following sections are proprietary data sets. The descriptions included are based on RTI’s review of publicly available information, such as vendors’ websites; conversations or e-mail exchanges with sales representatives; and RTI’s experience working with the data sets.
| Option Number | Potential Data Source | Description | Coverage | Frequency Collected | Estimated Relative Cost | Availability of Results | Evaluation Questions Addressed |
| a Alternative methods are not displayed in the table.b Assuming the database has already been purchased; it is RTI’s understanding that FDA has already purchased Gladson, Mintel, and ScanTrack data. | |||||||
| Option 01 | Scanner Data on Food SalesNielsen’s ScanTrack Datab | Product, category, or market using retailer scanner-based sales and causal information gathered weekly from retail outlets | POS technology for retail measurement services captures sales and price data from virtually every major retail chain | Continual basis | Medium/highb | FDA has access to weekly ScanTrack data sets for years 2004–2010 and they expect to purchase 2011. FDA also has annual (as opposed to weekly) store scanner data before 2004 | Q3: Product Sales; Q4: Product Sales Reformulated; Q5: Types of Products Reformulated; Q6: Proportion Products Reformulated; Q7: Nutrients Affected (in combination with Nielsen data) (in combination with label database) |
| Option 02 | Scanner Data on Food SalesNielsen’s Homescan Data | Consumer panel tracks sales longitudinally on an all-outlet basis | Sample is the largest longitudinal panel in the U.S. representing all-outlet purchases, including both Spanish- and English-speaking Hispanics (60,644 households in the static 2010 sample) | Continual basis | Medium/high | Once purchased, about 6 to 8 months to analyze | Q3: Product Sales; Q4: Product Sales Reformulated; Q5: Types of Products Reformulated; Q6: Proportion Products Reformulated; Q7: Nutrients Affected (in combination with Nielsen data) |
| Option 03 | Food, Nutrient Label DatabasesGladson’s Nutrition Database | Includes products since 2000, and provides food and beverage product images and coded nutritional data for products displaying the NFP | Is limited to Gladson’s clients’ products but covers 90% of all major product categories and includes 200,000 packaged food products; database includes branded and private-label products | Updated weekly, processing more than 10,000 products a month | Lowb | FDA has access to current data set and plans to receive annual updates | Q1: Proportion Products, Q1a: Proportion Branded vs. Private-Label Products, Q3: Product Sales; Q4: Product Sales Reformulated; Q5: Types of Products Reformulated; Q6: Proportion Products Reformulated; Q7: Nutrients Affected (in combination with Nielsen data) |
| Option 04 | Food Nutrient Label DatabasesMintel’s Global New Products Database | Tracks food and beverage product introductions since 1996 | Includes all major retailers’ products. As an example of coverage, the database shows that there were 106,228 products launched in the food and beverage categories in the U.S. from November 2006 to November 2011; database includes branded and private-label products | Updated monthly, processing more than 20,000 products a month | Lowb | FDA has access to current data set and plans to receive annual updates | Q1: Proportion Products, Q1a: Proportion Branded vs. Private-Label Products, Q3: Product Sales; Q4: Product Sales Reformulated; Q5: Types of Products Reformulated; Q6: Proportion Products Reformulated; Q7: Nutrients Affected (in combination with Nielsen data) |
| Option 05 | FDA’s Food Label and Package Survey (FLAPS) | Survey to collect labeling information, including images of product packages from foods in the U.S. The 2006–2007 FLAPS database consists of 1,227 products | Representative sample of food products from retail packaged food supply | Every 3–5 years | Low | Next survey is expected to be fielded in 2015 | Q1: Proportion Products, Q1a: Proportion Branded vs. Private-Label Products |
| Option 06 | Store Survey of Food Labels | Data collectors visit supermarkets to code food products for presence of FOP symbol or collect other information on food packages | Representative sample of U.S. regions, grocery stores within regions, and packaged food products within selected stores | NA | High | Several months to a year | Q1: Proportion Products, Q1a: Proportion Branded vs. Private-Label Products |
| Option 07 | Food Manufact-urer/ Retailer Perception and Practice Survey | Conduct survey with food manufacturers to determine types/proportions of products that have been reformulated pre/post receipt of the FOP symbol and what nutrients have been affected | Dependent on FOP symbol to be evaluated; if Facts Up Front, all manufacturers who are members of GMA or FMI | NA | High | 1 year excluding OMB approval | Q1: Proportion Products; Q1a: Proportion Branded vs. Private-Label Products; Q3: Product Sales; Q4: Product Sales Reformulated; Q5: Types of Products Reformulated; Q6: Proportion Products Reformulated; Q7: Nutrients Affected (in combination with Nielsen data) |
| Option 08 | Stakeholder Interviews | Interview manufacturer and retailer stakeholders | Participation is voluntary, but small number of stakeholders so likely gets full participation | NA | Low | 3 months excluding OMB approval; if fewer than 9 interviews, OMB not required | Q2: Implementation and Compliance |
4.2.1 Scanner Data on Food Sales
Overview
There are two types of scanner data: 1) point-of-sale (POS) or store scanner data and 2) household-based scanner data. Both store and household-based scanner data contain UPC-level quantity and dollar sales and selected product attributes such as container and package sizes; brief UPC description; and claims related to calorie, sugar, and sodium content. Although both store and household-based scanner data collect similar information, strengths and limitations are associated with using store or household-based scanner data depending on the research and policy questions at hand. An overview of POS and household-based scanner data is provided below and associated strengths and limitations noted for each.
Option 01: Nielsen’s ScanTrack Data
Description
Nielsen’s ScanTrack data are POS scanner data (that is, dollar and quantity sales data) collected weekly from tens of thousands of supermarkets, drug stores, and mass merchandisers across the country that participate in Nielsen’s retail scanning program (Nielsen, 2012); most major supermarket chains participate in the ScanTrack program. Nielsen aggregates store-level data and projects results onto 50 Nielsen markets to account for sales at nonparticipant stores. Nielsen markets are located in major population centers and consist of contiguous counties in one or more states. Purchasers of Nielsen’s ScanTrack data typically receive market-level sales data at the UPC level in quarterly or monthly periods.
Strengths
- ScanTrack includes sales data from most major retail chains including supermarkets with greater than or equal to $2 million in annual sales, drug stores, and mass merchandisers.
- ScanTrack data include fewer recording errors than household-based scanner data.
- Beginning in 2011, ScanTrack contains data from Walmart, which has the largest volume of food sales of any retailer in the country.
- FDA purchases access to ScanTrack data for other purposes, which will minimize the cost of an FOP evaluation given continued funding of other projects.
- ScanTrack data contain manufacturer and retailer promotional information, which can be used to identify effects of FOP symbols on sales.
Limitations
- Although store scanner data are useful for tracking market-level sales, these data do not contain shoppers’ demographic information. Hence, ScanTrack data are less useful for investigating evaluation questions focused on potential heterogeneous responses of consumers across demographic groups to food environment changes, such as the inclusion of the FOP symbol on product packages.
- Until recently Walmart did not participate in ScanTrack, making it impossible to use store scanner data to track sales at the world’s largest retailer. Although Walmart announced it would begin participating in ScanTrack in 2011, it remains to be seen how the newly available Walmart data will be incorporated into Nielsen’s scanner data.
- The retail scanner data Nielsen sells to its clients are usually at the market level 10, where a market is typically larger than a Metropolitan Statistical Area in size. To prevent disclosure of retailer identity, Nielsen aggregates private-label brands into composite records for all private-label products of a given type and size. Therefore, unless special arrangements are in place, these aggregated store scanner data cannot be used to examine private-label product sales by individual supermarket chains.
Option 02: Nielsen’s Homescan Data11
Description
Nielsen’s Homescan data are household-based scanner data that come from a sample of households that scan UPCs of all purchased products after each shopping trip. Homescan consists of a nationally representative panel of over 100,000 households recruited through the Internet or direct mail. This panel includes both Spanish- and English-speaking Hispanics and is the largest longitudinal panel in the United States representing all-outlet purchases (Nielsen, 2012). For a period of at least 1 year, on a weekly basis, participating households use a handheld scanner device to record and submit information on grocery purchases made at retail outlets. Households that report data for at least 10 of 12 months during the year make up the static panel. In 2010, about 60,000 households were included in the static panel. Nielsen provides survey weights for projecting purchase data from the static panel to national totals. Purchasers of Nielsen’s Homescan data can expect to receive annually updated household sociodemographic information, including income, household size, education, race, age, residence type, employment, geographic location, and transaction data, including quantity purchased, price paid, the UPC, container size, multipack, brand, Nielsen product module, and other select product attributes.
Strengths
- Homescan contains detailed information about the sociodemographics of participating households and their grocery store transactions at all shopping outlets, including mass merchandisers, drug stores, and convenience stores.
- Homescan is the largest, most detailed, and comprehensive longitudinal data set on consumer purchase history of packaged foods; in 2010, over 60,000 households reported purchases for at least 10 months of the year.
- Purchases in household scanner data are recorded by individual transaction, and retailer identity is not masked.
Homescan contains Walmart data.
Limitations
- Because of its self-reported nature, Homescan data have been found to contain nonnegligible measurement errors in both quantities and prices (Zhen, Taylor, Muth, & Leibtag, 2009; Einav, Leibtag, & Nevo, 2010). These measurement errors can bias estimates of consumers’ price sensitivity. However, various econometric procedures are available to reduce measurement error bias in analyses using Homescan data (see, for example, Einav, Leibtag, & Nevo, 2010; Zhen, Finkelstein, Nonnemaker, Karns, & Todd, 2012). Although some studies have explored the statistical nature of Homescan, more research needs to be conducted to fully understand the Homescan design.
- In addition to misreporting of food purchases, Muth, Siegel, & Zhen (2007) identified several potential sampling biases in Homescan, including self-selection of households into the panel, nonresponse, and attrition. In interpreting study results based on Homescan data, evaluators should consider these potential data imperfections.
- FDA has not purchased access to Homescan data for other purposes, so funds would be required to use Homescan for this evaluation plan.
- If the number of purchases that display the FOP symbol being evaluated is low, analysis issues may result.
- Data contain little manufacturer or retailer promotional information; promotional information can be used to identify effects of FOP symbols on sales.
4.2.2 Food Nutrient Label Databases
Description
Although scanner data contain some UPC-level descriptive variables on labeling claims and nutrition content, the variable list is incomplete in terms of characterizing the full nutrition and labeling aspects of the products as they are presented to shoppers. In particular, scanner data do not collect nutrient data from the NFP on product packaging. Using only scanner data, then, makes it difficult to determine if a product has undergone reformulation. To address the absence of nutritional information in scanner data, commercially available label databases can supplement these data sources. Gladson and Mintel are prominent suppliers of food nutrient and label databases that contain nutrient data at the UPC level, collected from the NFP, images of product packaging, and variables related to labeling claims. Moreover, according to company representatives at both firms, because the label databases are continuously updated, reformulation changes may be captured incidentally (Gladson, 2012; Mintel, 2012). On average, Gladson reports processing over 10,000 products a month and Mintel more than 20,000 (includes global products).
In terms of limitations, it needs to be recognized that food nutrient data and UPCs in the label databases are not coded without errors. If evaluators plan to match label databases with scanner data, based on RTI’s experience working with this type of UPC-level nutrient data and knowledge of other researchers’ challenges, RTI suggests devoting substantial resources to additional cleaning of the label databases and quality assurance.
Option 03: Gladson’s Nutrition Database
Strengths
- Gladson’s Nutrition Database contains over 200,000 consumer packaged food and beverage products primarily sold in the United States.
- This database contains products tracked since 2000.
- It includes product package images, NFP information, and ingredient list information.
- Although reformulation is not specifically indicated in the database, according to Gladson staff, each product as it comes in, regardless of whether it is already in the database, is reviewed for changes in image, UPC, or content. As needed, the database is modified.
- This database contains private-label products.
- FDA purchases access to Gladson’s Nutrition Database for other purposes, which will minimize the cost of an FOP evaluation given continued funding of other projects.
- This database contains more U.S. food and beverage products than Mintel’s Global New Products Database.
- The database includes photographs of each product’s package, facilitating coding of the presence or absence of FOP symbols or specific types of FOP symbols.
Limitations
- Although some information on the front of a product’s package such as health claims is captured in the database, products are not coded for specific types of FOP symbols or the presence or absence of FOP symbols.
- Products in the database are limited to Gladson’s clients’ products.
- The date the product is introduced to the market is not entered in the database.
- The database contains only packaged food products with UPCs.
Option 04: Mintel’s Global New Products Database
Strengths
- Mintel’s Global New Products Database contains over 100,000 newly introduced food and beverage products sold in the United States.
- This database contains new products tracked since 1996.
- It includes product package images, NFP information, and ingredient list information.
- This database contains private-label products.
- Although reformulation is not specifically indicated, the database does include some variables associated with product reformulation.
- FDA purchases access to Mintel’s Global New Products Database data for other purposes, which will minimize the cost of an FOP evaluation given continued funding of other projects.
- The database includes photographs of each product’s package, facilitating coding of the presence or absence of FOP symbols or specific types of FOP symbols.
Limitations
- This database covers fewer U.S. products than Gladson’s Nutrition Database.
- It is challenging for evaluators to determine eligibility criteria for product inclusion in the database.
- Although some information on the front of a product’s package such as health claims is captured in the database, products are not coded for specific types of FOP symbols or the presence or absence of FOP symbols.
- The date the product is introduced to the market is not entered in the database.
- Reformulation is tracked only if the package notes that the product has changed, for example, if the packaging reads “now lower sodium” or “now better tasting.”
- This database contains only packaged food products with UPCs.
4.2.3 FDA’s Food Label and Package Survey (FLAPS)
Option 05: FDA’s FLAPS
Description
As stated on FDA’s Web site, FDA’s FLAPS is the largest representative study of processed, packaged food labels in the United States (FDA, 2011). The 2006 to 2007 FLAPS database consists of 1,227 products. For the most recent survey, products were selected through a multistage sampling plan to select a representative sample of food products from the retail packaged food supply. The sampling frame used was ACNielsen Strategic Planner market database of U.S. food stores. Only foods regulated by FDA, including private-label brands, were included in the sampling frame. The products were then stratified in the sampling frame into 57 FDA-determined product groups, and the number of sampled products in each product group was set proportional to the sales dollars of each of the product groups. The products were selected using a stratified two-stage design with selection probabilities proportional to nationally estimated sales dollars. The first stage of sampling was at the brand level within each product group; at the second stage of sampling, one item was selected within each brand selected in the first stage with probability proportional to item sales dollars.
Strengths
- FLAPS is a representative sample of processed packaged food products (FDA, 2011).
- Packaged foods are stratified into FDA-determined product groups, which could facilitate assessment of FOP labels by product group.
- Products are selected for inclusion based on sales data.
- As part of the survey, images of product packages are collected and archived, facilitating coding of the presence or absence of an FOP symbol or the specific type of FOP symbol displayed on the package.
- Private-label brands are included in the sampling frame (FDA, 2011).
- Because it is an FDA system, FDA has access to FLAPS product images.
Limitations
- The survey takes place every 3 to 5 years (FDA, 2011).
- Product images are not coded for specific FOP symbols or the presence or absence of FOP symbols.
- Product images are not coded to indicate whether they are branded or private-label products.
4.2.4 Store Survey of Food Labels
Option 06: Store Survey of Food Labels
Description
A store survey can be used to collect current data on products in the marketplace. A probability-based or nonprobability-based sample scheme can be used. To select a probability-based sample, a process similar to the one used by FLAPS can be followed. For example, a representative sample of U.S. regions and supermarkets within regions can be selected. Then, following a multistage sampling plan, products or categories of products can be selected to represent a sample of food products from the retail packaged food supply. Based on evaluators’ priorities (for example, sales data or nutritional criteria), specific product categories for evaluation can be selected. Data collectors would visit selected stores and record information on selected products.
Strengths
- Evaluators can obtain information on real-time brand penetration of the FOP symbol that is not available using label databases (Options 03 and 04) or FLAPs (Option 05). This is particularly important given that FOP symbols (such as Great For You and Facts Up
- Front) will appear in the marketplace, on different product categories, over an extended period of time.
- A store survey can include random-weight items, including fresh produce.
- A store survey can capture the presence of shelf labeling, which would support an analysis of a dual labeling system.
- A store survey can be conducted with a nationally representative sample of U.S. regions, grocery stores within regions, and packaged food products within selected stores.
- Unlike when using secondary data sources, data collection can be designed to meet the specific objectives of the evaluation.
Limitation
- Compared with using existent data sources, fielding a store survey would require a large amount of resources.
4.2.5 Food Manufacturer/Retailer Perception and Practice Survey
Option 07: Food Manufacturer/Retailer Perception and Practice Survey
Description
A manufacturer and retailer survey is a questionnaire that is typically mailed to food manufacturers and/or retailers to learn about their perceptions and practices regarding the food industry (such as placing FOP symbols on packages, reformulating products). A probability-based or nonprobability-based sample of manufacturers and/or retailers can be selected. If desired, the sample can be stratified by branded or private products, total sales, sales of select products, number of product types, consumer reach, and location, for example.
Strengths
- This type of study can be conducted with a nationally representative sample of manufacturers and/or retailers.
- A manufacturer and retailer survey requires less analysis work than using detailed product data (essentially it places the analysis burden on the manufacturers and retailers).
Limitations
- To ensure an adequate response rate, this study could take at least a year to conduct, excluding OMB approval. Prior to fielding the survey, evaluators would need to implement multiple procedures, such as posting information about it on a food manufacturer association Web site, holding a Webinar/phone conference to answer questions about it, and sending prenotification letters to key personnel within the organization to identify target respondents. Once the survey is sent to key respondents, follow-up letters and calls may be needed.
- This survey would include self-reported practices rather than specific product-level data.
- Responses may be biased because of respondents’ role in the program.
- Typically, using this method would be relatively resource intensive compared with performing secondary data analysis.
- Manufacturer and retailer surveys can have low response rates.
4.2.6 Stakeholder Interviews
Option 08: Stakeholder Interviews
Description
Stakeholder interviews involve conducting intensive individual interviews with key staff within an organization. Similar to manufacturer and retailer surveys, they are used to gather self-reported information on perceptions and practices. For example, participants can be asked about their experience and expectations related to the FOP symbol program, the thoughts they have concerning participating in the program, processes, outcomes, and any changes they perceive for their company resulting from involvement in the program. However, unlike manufacturer and retailer surveys, stakeholder interviews tend to be used to gather more detailed information and can be particularly useful for contextualizing outcome data. Typically, stakeholder interviews use nonprobability-based sampling designs. Following data collection, interviews can be transcribed and qualitatively analyzed based on themes identified across respondents.
Strengths
- The study can be conducted quickly (3 months excluding OMB approval).
- If the study is limited to nine or fewer interviews, OMB approval is not required.
- Conducting these interviews can be a relatively low-resource option.
- These interviews could be used to enhance findings obtained from analyzing secondary data sources, such as label databases.
Limitations
- Stakeholder interview data would rely on self-report.
- Responses may be biased because of respondents’ roles in the program.
- Conducting the interviews can be time intensive considering the time it takes to conduct the interviews, transcribe them, and perform qualitative analysis.
- Most likely the results will not be generalizable because of small sample sizes and nonrandom sampling methods.
[Go to Contents]
4.3 Options for Studies that Address Each Evaluation Question
Table 4-3 crosswalks each manufacturer and retailer question to study methods and data sources that can be used to address it. The section below provides a description of study options for evaluating manufacturer and retailer questions and associated strengths and limitations. Because similar methods and/or data sources are used to address many of these questions, unlike in the consumer section, we have clustered the questions. Moreover, because we provide fewer options for addressing several of these questions, to minimize repetition, RTI’s preferred methods for addressing the question are presented as a group following presentation of all options.
| Question | Options 01, 02: Scanner Data on Food Sales | Options 03, 04: Label Databases | Option 05: FLAPS | Option 06: Store Survey of Food Labels | Option 07: Manufacture/Retailer Survey | Option 08: Stakeholder Interviews |
| NA = Not applicablea Alternative methods are not displayed in the table. | ||||||
| 1. Q1: Proportion Products | NA | X | X | X | X | NA |
| 1a. Q1a: Proportion Branded vs. Private-Label Products | NA | X | X | X | X | NA |
| 2. Q2: Implementation and Compliance | NA | NA | NA | NA | NA | X |
| 3. Q3: Product Sales | X | X | NA | NA | X | NA |
| 4. Q4: Product Sales Reformulated | X | X | NA | NA | X | NA |
| 5. Q5: Types of Products Reformulated | X | X | NA | NA | X | NA |
| 6. Q6: Proportion Products Reformulated | X | X | NA | NA | X | NA |
| 7. Q7: Nutrients Affected | X | X | NA | NA | X | NA |
4.3.1 Question 1. How many (or what proportion of) products and product categories have the FOP symbol and how does it vary across products and product categories? Question 1a: How many (or what proportion of) branded and private-label products have adopted the FOP symbol?
Q1: Proportion Products and Q1a: Proportion Branded vs. Private-Label Products can be assessed using the following methods:
- Option 03: Food Nutrient Label Database: Gladson’s Nutrition Database
- Option 04: Food Nutrient Label Database: Mintel’s Global New Products Database
- Option 05: FLAPS
- Option 06: Store Survey of Food Labels
- Option 07: Food Manufacturer/Retailer Perception and Practice Survey
These methods, as they apply to Q1: Proportion Products and Q1a: Proportion Branded vs. Private-Label Products, are described below.
Study Options
Description/Example of Application for Food Nutrient Label Databases (Options 03 and 04)
Prior to beginning analysis using label databases, it is necessary to define product categories according to the evaluation questions of interests. To address Q1: Proportion Products and Q1a: Proportion Branded vs. Private-Label Products, categories can be defined using the Homescan data labels. Homescan labels products using three levels of aggregation: brand module, product module, and product group. Alternatively, products can be categorized by food groups based on their nutrition content and recommended intake in the USDA DGAs. For example, as part of their quarterly food-at-home price database, the USDA Economic Research Service developed a SAS program that assigns each UPC in Homescan to one of 52 food groups (Todd, Mancino, Leibtag, & Tripodo, 2010).
Next, products would then be coded for presence of the FOP symbol, using predetermined criteria. (Suggestions for determining criteria are provided in Section 5.) Given the sheer volume of products, having individuals review every product image for the FOP symbol and then manually code the content of the label into variables would require substantial resources. Considering resource limitations, the evaluator can choose to focus the analysis on select product categories or employ technology to virtually scan product labels for the presence of the FOP symbol. Recognition systems use image-processing tools to manipulate, process, and analyze algorithms, including image segmentation, feature detection, and classification in two-dimensional image space. Based on past experience, RTI expects a recognition system can provide better than 85% accuracy in identifying the FOP symbol according to predetermined criteria. Moreover, a recognition system can compare the output generated by various image segmentation algorithms to assess variations in the use of FOP symbols. When relying on the recognition system, to ensure quality and benchmark the technology’s accuracy level, RTI suggests manually checking a subset of virtually coded product images.
Lastly, following product categorization and coding of products for the FOP symbol, the adoption rate of the FOP symbol can be calculated as the ratio of the number of UPCs with FOP symbols to the total number of active UPCs. An active UPC is defined as one that has positive sales within a specific time frame (such as the past year). Because some product categories may have high product turnover rates, it is important to only use active UPCs in the calculation. Whether a UPC is active or not can be determined by examining sales data collected in Nielsen Homescan. The adoption ratio of the FOP symbol can be stratified by product category, branded vs. private label, and time to examine the adoption rates at different levels of aggregation.
In addition to simple proportions based on UPC counts, Homescan data (Option 02) on product sales could be used to calculate sales-weighted proportion of branded and private- label products that have adopted the FOP symbol. Depending on the need, either dollar sales or unit sales could be used as weights. Sales dollars reflect the combination of prices and quantities (or units) and do not necessarily correlate highly with units sold. Therefore, the evaluator should consider whether penetration is more meaningfully measured by the number of UPCs that carry a symbol or sales volume (dollar or unit) of products with a symbol. Fisher’s exact test can be used to test the statistical significance of changes in adoption rates over time, across category and brand. Overall strengths and limitations of the options described above are outlined in Section 4.2. Unique and/or particularly relevant strengths for addressing Q1: Proportion Products and Q1a: Proportion Branded vs. Private- Label Products using label databases are as follows:
Strengths
- Using Gladson’s or Mintel’s label database is likely to cost less than conducting a store survey of food labels (Option 06).
- Both Gladson’s and Mintel’s label databases include a large number of products.
Description/Example of Application for FLAPS (Option 05)
To address Q1: Proportion Products and Q1a: Proportion Branded vs. Private-Label Products, evaluators using FLAPS data would follow a similar process as described for label databases (Options 03 and 04). Prior to analysis, the evaluator would need to define the product categories. The evaluator can choose to use the FLAPS product categories or develop original criteria. Next, images of product packages collected for FLAPS would need to be coded for the presence of the FOP symbol, using predetermined criteria and according to product type (branded vs. private label). (Suggestions for determining criteria are provided in Section 5.) As suggested in the label database section above (Options 03 and 04), the evaluator can focus the analysis on select product categories or employ technology to virtually scan product labels for the presence of the FOP symbol. However, given that FLAPS includes only around 1,200 products, coding all images manually should not be as challenging as it would be using the label databases (Options 03 and 04). Lastly, following product categorization and coding of products for the FOP symbol, the adoption rate of the FOP symbol can be calculated as the ratio of the number of UPCs with FOP symbols to the total number of active UPCs. The adoption ratio of the FOP symbol can be stratified by product category, branded vs. private label, and time to examine the adoption rates at different levels of aggregation.
Overall strengths and limitations of the options described above are outlined in Section 4.2. Particularly relevant limitations for addressing Q1: Proportion Products and Q1a: Proportion Branded vs. Private-Label Products using label databases are as follows:
Limitations
- Considering the infrequency of administration of FLAPS, collecting timely information about presence of the FOP symbol on packages would be challenging. However, if the timing of FLAPS corresponds to the evaluation timeline, it should be considered given that it would require fewer resources than coding product images in a label database (Options 3 or 4) or conducting a store survey of food labels (Option 06).
Compared with the label databases (Options 03 and 04), the FLAPS data contain fewer product images.
Description/Example of Application for Store Survey of Food Labels (Option 06)
To address penetration of the FOP symbol across product categories and by branded and private-label products, evaluators can conduct a store survey of food labels. After product categories are chosen, data collectors would visit selected supermarkets to collect information about the presence or absence of the FOP symbol on a census of products within the selected categories. This can be repeated to monitor changes in penetration of the FOP symbol on products, product categories, and types of products over time. Once data are collected, the adoption rate of the FOP symbol among all products and by private vs. branded products would be calculated using the methods described for label databases (Options 03 and 04) and FLAPS (Option 05).
Overall strengths and limitations of using a store survey of food labels to address Q1: Proportion Products and Q1a: Proportion Branded vs. Private-Label Products are outlined in Section 4.2. A unique and particularly relevant strength and a limitation of using this method are noted below.
Strength
- Evaluators can obtain information on real-time brand penetration that is not available using label databases (Options 03 and 04) or FLAPS (Option 05). This becomes a particularly relevant issue if the FOP symbol will be rolled out on products over time.
Limitation
- This method can require more resources than using existing label databases (Options 03 and 04) or FLAPS (Option 05), particularly if a representative sample is desired (such as needing a set of private-label chains, geographically diverse locations).
Description/Example of Application for Food Manufacturer/Retailer Perception and Practice Survey (Option 07)
To address Q1: Proportion Products and Q1a: Proportion Branded vs. Private-Label Products, evaluators can administer a manufacturer and retailer survey to either a nonprobability-based or probability-based sample of manufacturers and retailers. Questions would focus on the number of products produced by the manufacturer or retailer that currently include the FOP symbol, categories of products with the symbol, and, if the manufacturer or retailer produces both branded and private-label products, the number of each with the FOP symbol. Follow-up surveys can be distributed to track the proportion of change in the presence of symbols between time periods.
Overall strengths and limitations of using a food manufacturer/retailer perception and practice survey to address Q1: Proportion Products and Q1a: Proportion Branded vs. Private-Label Products are outlined in Section 4.2. A unique and particularly relevant strength and limitations using this method are noted below.
Strength
- As indicated in Table 4-3, this instrument can be used to collect information for all of the manufacturer and retailer evaluation questions.
Limitations
- Given the time necessary to administer this type of survey and receive responses, information collected may not be as current as what would be collected using alternative methods, such as a store survey (Option 06).
- This method relies on self-reported information, which can be biased because of respondents’ role in the program.
Selected Alternative Method
Sales-weighted data could be used to determine proportion of products with the FOP symbol. Nielsen Homescan data (Option 02) on product sales could be used to calculate the sales-weighted proportion of branded and private-label products that have adopted the FOP symbol. Depending on the evaluator’s interest, data could be weighted using either dollar sales or unit sales. Sales dollars reflect both prices and quantities (or units) and do not necessarily correlate highly with sales units. Therefore, the evaluator should consider whether penetration is more meaningful in terms of units of products that carry a symbol or the number that consumers see.
4.3.2 Question 2. How are manufacturers and retailers monitoring implementation of and compliance with the FOP symbol?
Q2: Implementation and Compliance can only be assessed by conducting stakeholder interviews (Option 08). This method as it applies to Q2: Implementation and Compliance is described below.
Study Options
Description/Example of Application for Stakeholder Interviews (Option 08)
Semistructured interviews can be conducted with food manufacturers and/or retailers to understand how manufacturers and retailers are internally working to monitor implementation of and compliance with the FOP symbol. Questioning can focus on means used by manufacturers and retailers to ensure adherence to the FOP symbol style guide and penetration of the FOP symbol across product categories and brands. To complement information collected during the interviews, food manufacturers,’ retailers’, and trade groups’ Web sites can be reviewed. Interviews can be repeated following a period of time to assess changes in policies and or practices.
Overall strengths and limitations of using stakeholder interviews to address Q2: Implementation and Compliance are outlined in Section 4.2.
4.3.3 Question 3. How has the FOP symbol affected product sales volumes?
- Q3: Product Sales can be assessed using the following methods:
- Option 01: Scanner Data on Food Sales: Nielsen’s ScanTrack Data
- Option 02: Scanner Data on Food Sales: Nielsen’s Homescan Data
- Option 03: Food Nutrient Label Database: Gladson’s Nutrition Database
- Option 04: Food Nutrient Label Database: Mintel’s Global New Products Database
- Option 07: Food Manufacturer/Retailer Perception and Practice Survey
These methods as they apply to Q3: Product Sales are described below.
Study Options
Description/Example of Application for Scanner Data on Food Sales (Option 01 or 02) Merged with a Food Nutrient Label Database (Option 03 or 04)
To answer Q3: Product Sales, scanner data (Option 01 or 02) can be merged with a label database (Option 03 or 04) by UPC. Because it is likely that food manufacturers or retailers will gradually adopt the FOP symbol (for example, both Facts Up Front and Great For You will be rolled out over many months), it can be useful to obtain scanner data from multiple years and, if possible, historical monthly updates of the label database for the same time period. Following data procurement, label database data would be directly matched by UPC and time period with purchase transactions from the scanner data. Additionally, heuristic matches based on product attribute variables present in both the scanner and label database data sets can be performed to minimize the number of unmatched products located in the scanner data. Defining heuristic matches would involve an iterative process involving text searches and multiple imputations based on the degree of near matches. Following the merging of the data sets, as described in the earlier section, predetermined criteria would have to be used to define the FOP symbol. Accordingly, the data would need to be coded for the presence of the symbol being evaluated. Recognition software could be used to code label images for the presence of the FOP symbol and convert nutritional information contained on nutrient-specific FOP symbols, such as Facts Up Front, into machine-encoded text that could be analyzed.
Using the merged data sets would allow the evaluator to explore dynamics of the FOP symbol adoption rates, such as when the symbol was placed on a product package. This information not only informs the understanding of this question, but also of other manufacturer and retailer questions related to adoption and reformulation. The date variable in both label databases (Options 03 and 04) indicates the date on which the product information was updated in the database, not the date when the new package was launched by the food manufacturer. The specific process each label database vendor uses to identify a packaging change that triggers an update of label database is likely proprietary, although both Gladson and Mintel claim most major changes in packaging are captured in a timely fashion. The evaluator can treat either the earliest date a UPC appears in the scanner data or the date of the label database update, whichever is earlier, as a proxy for the true FOP symbol launch date. On the manufacturer side, dating products can be further complicated by variations in practices between manufacturers. For example, food manufacturers may reuse UPCs of discontinued products on new products or may not change UPC codes following reformulation or introduction of the FOP symbol.
Following the merging of the data sets, coding of the FOP symbol, and determining a standard measure of true FOP launch date on the package, evaluators can use statistical models of consumer purchase behavior to determine the short- and long-term effects of the presence of the FOP symbol on product sales. Candidate statistical models that can be applied to examine differences in sales volumes before and after the addition of the symbol include difference-in-difference regressions and the more sophisticated discrete choice or flexible consumer demand models. To quantify the impact of an FOP symbol on sales, an indicator variable (0 = before FOP symbol, 1 = after FOP symbol) can be placed in the regression model as a covariate. Including household demographics information and prices as covariates in models can help control for demographic effects and changes in relative prices.
Healthiness of products can be considered when evaluating Q3: Product Sales. As discussed in Section 3.3.4, for CQ 3: Use, evaluators would be presuming that changes in sales are surrogates of the effects of consumers’ use of an FOP symbol. Predetermined criteria would be used to categorize products as more healthy or less healthy.
For binary FOP symbols that are only present if the product is determined to be healthy based on established nutritional criteria, such as the Great For You symbol, changes in sales of products with or without the symbol over time would be compared. An increase in sales of products within a category displaying the FOP symbol would imply that consumers were using the FOP symbol to inform their food choices.
Evaluating the effect on product sales of a nutrient-specific FOP symbol that is designed to be on all products and is not based on an algorithm would be more complex to evaluate. Unlike binary FOP symbols, products displaying nutrient-specific FOP symbols must first be categorized as either healthy or less healthy. See Section 3.3.4 for more information about criteria that can be used. Determining a change in sales based on consumer use of a nutrient-specific symbol would need to take into account both increases in FOP symbol- labeled products meeting the more healthy criteria and decreases in FOP symbol-labeled products meeting the less healthy criteria.
Both Mintel and Gladson databases can be combined with Homescan or ScanTrack data. However, given that Mintel’s database only includes new product introductions, it is smaller than the Gladson database. Overall strengths and limitations of using a merged data set of scanner data on food sales (Option 01 or 02) and a food nutrient label database (Option 03 or 04) are outlined in Section 4.2. Broadly, strengths of using a merged data set are the following:
- A merged data set can be used to address not only Q3: Product Sales, but also multiple other evaluation questions, including reformulation-focused questions, as discussed in Section 4.3.4.
- FDA purchases access to both Gladson’s and Mintel’s label databases for other purposes, which will minimize the cost of an FOP evaluation given continued funding of the other projects.
A limitation of using a merged data set is the following:
- Products are not coded for the presence of specific FOP symbols.
Description/Example of Application for Food Manufacturer/Retailer Perception and Practice Survey (Option 07)
To answer evaluation questions addressing changes in product sales pre- and post- placement of the FOP symbol on packages, evaluators can use a manufacturer and/or retailer survey. First, manufacturers and/or retailers would be asked whether they are including FOP symbols on product packages and, if so, which system(s) they are currently using. Manufacturers and/or retailers would then be asked to report on their sales for select products (with or without defined FOP symbols, including the FOP symbol being evaluated) for defined time periods pre- and post-introduction of the FOP symbol(s). Follow-up surveys can be distributed to track changes in sales over time.
Overall strengths and limitations of this option are outlined in Section 4.2. Unique and particularly relevant limitations of using a food manufacturer/retailer perception and practice survey to address Q3: Product Sales are the following:
- This method provides self-reported practices and can be biased given the roles of the respondents in the FOP symbol program.
- Obtaining generalizable information using this method can be challenging given typically low response rates.
4.3.4 Questions Addressing Reformulation (Questions 4 through 7)
Q4: Product Sales Reformulated, Q5: Types of Products Reformulated, Q6: Proportion Products Reformulated, and Q7: Nutrients Affected can be assessed using the following methods:
- Option 01: Scanner Data on Food Sales: Nielsen’s ScanTrack Data
- Option 02: Scanner Data on Food Sales: Nielsen’s Homescan Data
- Option 03: Food Nutrient Label Database: Gladson’s Nutrition Database
- Option 04: Food Nutrient Label Database: Mintel’s Global New Products Database
- Option 07: Food Manufacturer/Retailer and Perception and Practice Survey
Methods for using these options to address Q4 through Q7 are described below.
Study Options
Description/Example of Application for Scanner Data on Food Sales (Option 01 or 02) Merged with a Food Nutrient Label Database (Option 03 or 04)
All four of the reformulation questions can be addressed by analyzing a scanner data set (Option 01 or 02) merged with a label database (Option 03 or 04). Merging these data sets is described in Section 4.3.3.
Prior to evaluating the reformulation questions using a merged data set, criteria will need to be established for determining when a product is considered reformulated. Standards can be based on specific nutrients of interest or more broadly defined, such as any change to the nutritional content of a product. Alternatively, evaluators may want to consider using criteria that acknowledge brand extensions. Brand extensions can be used by manufacturers to “reformulate” existing products, while maintaining the “original brands” (for example, calcium-fortified orange juice). Using the established reformulation criteria, nutrient thresholds should then be set to determine whether products qualify as reformulated based on changes to their nutritional compositions. Both the Gladson and Mintel databases contain data on key nutrients. Brand extensions can be examined using Mintel data.
After all product reformulation events are identified, difference-in-difference models and consumer demand models can be used to quantify changes in sales. To test the sensitivity of results it would be important to experiment with alternative nutrient thresholds.
To evaluate the types of products that have been reformulated since introduction of the FOP symbol, products would need to be coded for the presence of the FOP symbol and, if desired, categorized based on evaluator-established criteria. Processes for coding and categorizing have been discussed in earlier sections.
The rate of product reformulation in each product category would be calculated as the proportion of active UPCs that adopt the FOP symbol and undergo reformulation; statistical significance can be tested using Fisher’s exact test. Because of varying rates of FOP symbol adoption across product categories, these statistics would indicate the extent to which a category has been reformulated since introduction of the FOP symbol. Using this method, if manufacturers or retailers do not display the symbol on their packages, reformulation associated with the FOP symbol would be underestimated.
To measure the extent to which the nutritional composition has been affected by FOP labeling and reformulation, the proportion of UPCs containing a nutrient that have added the FOP symbol and gone through reformulation can be calculated. Alternatively, the average magnitude of the change in nutrient level per UPC can be used to gauge the extent of the impact. Thirdly, because Homescan is intended to be a nationally representative sample and contains sample weights for projection to national totals, the average change in nutrient level can be weighted by dollar and volume sales to determine impact.
Overall strengths and limitations of the options described above are noted in Section 4.2. Particularly relevant limitations of using a label database merged with scanner data to address Q4 through Q7 are as follows:
- Gladson does not track product reformulations. Mintel indicates reformulation if the package notes that the product has changed, for example, if the packaging reads “now lower sodium” or “now better tasting.” Accordingly, evaluators would need to establish product reformulation criteria and/or check that the criteria apply across products.
- The merged data set does not indicate the date of product reformulation. Evaluators would need to establish criteria for determining date of product reformulation.
- Merged data sets do not indicate date of product introduction. The evaluator would need to establish criteria for dating products’ market introduction.
Description/Example of Application for Manufacturer/Retailer Perception and Practice Survey (Option 07)
To address evaluation questions focused on reformulation, pre- and post-placement of the FOP symbol, evaluators can use a manufacturer/retailer perception and practice survey. Survey questions would ask manufacturers and/or retailers to report on whether they are planning to reformulate products (if so, when) or have already reformulated products as a result of the introduction of the FOP symbol. For example, if reformulation related to introduction of the Facts Up Front symbol were being evaluated, questions on the survey can ask about current or anticipated changes related to products’ calorie, sodium, added sugars, and saturated fat content for periods pre- and post-introduction of the FOP symbol. The survey can also inquire about current and anticipated changes in reformulated product sales for periods pre- and post-introduction of the FOP symbol. Finally, it may be of interest to include questions about whether the introduction of the FOP symbol led to the development of new products; for example, is Walmart creating new products in order to achieve the Great For You symbol. Follow-up surveys can be distributed to record changes in reformulation over time.
Overall strengths and limitations of this option are outlined in Section 4.2. As already noted above for Q3: Product Sales, particularly relevant limitations of using a food manufacturer/retailer perception and practice survey to address Q4 through Q7 are that the method relies on self-reported practices, and obtaining generalizable information can be challenging.
[Go to Contents]
4.4 Overall Manufacturer and Retailer Assessment
Based on the evaluation criteria outlined in Section 2.6, RTI presents suggestions for addressing the manufacturer and retailer questions.
Q1: Proportion Products and Q1a: Proportion Branded vs. Private-Label Products. RTI suggests assessing Q1: Proportion Products and Q1a: Proportion Branded vs. Private-Label Products by either using an existing food and nutrient label database (Option 03) or conducing a new store survey of food labels (Option 06).
- Option 03: Food Nutrient Label Database: Gladson’s Nutrition Database
- Option 06: Store Survey of Food Labels
If a single label database will be used for the evaluation, RTI suggests using the larger Gladson database. Using a label database would be more cost-effective than conducting a store survey, especially if the database is coded for the presence of the specific FOP symbol to answer this question, and then used to address six additional evaluation questions. However, the additional resources necessary for conducting a store survey can be justified if current marketplace information is wanted, which may be particularly important for answering Q1: Proportion Products and Q1a: Proportion Branded vs. Private-Label Products.
Moreover, a store survey of food labels can take account of random-weight food items in addition to packaged foods. Including random-weight items may be important for comprehensively capturing adoption of an FOP symbol and changes in sales resulting from its adoption. For example, as of the writing of this report, Walmart had rolled out the Great For You symbol on produce signage only.
Q2: Implementation and Compliance. RTI suggests assessing Q2: Implementation and Compliance by conducting stakeholder interviews (Option 08).
- Option 08: Stakeholder Interviews
To supplement the interviews, a Web review can be used to assess publicly released information about manufacturers’ or retailers’ current or anticipated plans for monitoring implementation of the FOP symbol and compliance with terms for the symbol’s usage.
Q3: Product Sales. RTI suggests learning how product sales have been affected by the presence of the FOP symbol, Q3: Product Sales by merging a label database (Option 03) that has been coded for the presence of the FOP symbol with scanner data (Option 02).
- Option 03: Food Nutrient Label Database: Gladson’s Nutrition Database merged with Option 02: Scanner Data on Food Sales: Nielsen’s Homescan Data
If a label database (Option 03) was used to answer Q1: Proportion Products and Q1a: Proportion Branded vs. Private-Label Products, the database should already be coded for FOP presence. Differences in product sales volumes between comparable products and/or categories with and without the FOP symbol can be analyzed while controlling for other product characteristics that might affect product sales. RTI suggests using Homescan scanner data rather than ScanTrack data because although the market-level data compiled from ScanTrack store-level data since 2011 include Walmart sales, it is unclear whether Nielsen will release Walmart-specific sales data. Moreover, while ScanTrack market-level data contain private-label sales, the data are aggregated across different private-label brands. For example, orange juice made for different retailers is aggregated into one control brand orange juice.
Q4 through Q7: Reformulation Questions. To address Q4 through Q7: Reformulation Questions, RTI suggests further appending the data set prepared to address earlier manufacturer and retailer evaluation questions, (Option 03) merged with scanner data (Option 02), with variables indicating product reformulation status (product reformulated vs. not reformulated) and changes in nutrient levels.
- Option 03: Food Nutrient Label Database: Gladson’s Nutrition Database merged with Option 02: Scanner Data on Food Sales: Nielsen’s Homescan Data
Resources can be conserved by focusing data preparation and analysis on caloric content and/or select nutrients (such as fat, sugar, sodium), categories that include products with high levels of calories or nutrients associated with chronic disease, or categories that are perceived to have the greatest likelihood of being reformulated.
[Go to Contents]
4.5 Sample Size Considerations
Sample size considerations for evaluating manufacturer and retailer questions are similar to those described for the consumer questions. If evaluators rely on an existing data set for the evaluation (such as Option 05: FLAPS), the evaluator will need to be familiar with the sample design used for the data collection and the associated strengths and limitations of the design for making population inferences and, if desired, detecting differences between groups. At the time of planning a new study (such as Option 07: Manufacturer and Retailer Survey), evaluators should establish 1) a justifiable level of statistical significance, 2) the chances of detecting a difference of given magnitude between the groups compared (that is, the power), and 3) the targeted difference (that is, effect size). See Section 3.4 for a more detailed discussion of sampling considerations and examples of power estimates.
[Go to Contents]
4.6 Manufacturer and Retailer Analysis Plan
Analysis techniques that can be used to evaluate manufacturer and retailer questions using scanner data (Options 01 and 02) or scanner data merged with label databases (Options 03 and 04) are described in Sections 4.3 and 4.4 when these options are presented as a way to address evaluation questions. To analyze data collected from other options, similar strategies as those described in the consumer section can be employed, beginning with >basic descriptive statistics to summarize the data set. Binary endpoints (all yes/no questions) and categorical characteristics can be reported with frequencies and percentages and numerical endpoints (for example, dollar sales of Facts Up Front vs. the NFP) summarized with means, standard deviations, and percentiles (25th percentile, median, 75th percentile).
As with the consumer section, assuming that the individual evaluations of the primary questions can be summarized with binary outcomes, the main analysis strategy can be contingency tables and logistic regression models (for example, does the product have the FOP symbol); characteristics of the product or product category can then behave as predictors or explanatory factors (for example, regular pasta vs. whole grain pasta). See Section 3.5 for additional information about analyzing data with binary outcomes.
For nonbinary outcomes, evaluators can use alternative methods. For example, ANCOVA models can be used to compare continuous sales data and changes in sales between products with the FOP symbol and products without the symbol. Alternatively, sales or change in sales values can be analyzed using a dichotomized outcome assigned based on relevant cut points. Count data (such as proportion of products with the FOP symbol reformulated vs. proportion of products with the symbol unchanged) can be evaluated using linear regression and ANCOVA models, as appropriate to the data distribution. See Section 3.5 for additional examples as well as information about how to approach missing data.
[Go to Contents]
5. CORE PLAN FOR PROPOSED EVALUATION OF FOP NUTRITION LABELING
Considering the examination of options for addressing the evaluation questions described in Sections 3 and 4 and the evaluation criteria outlined in Section 2.6, RTI prepared a core evaluation plan for ASPE and FDA. Given that the evaluation questions build on one another, the core plan is presented as a three-phased approach. In other words, certain evaluation questions become relevant only if results of earlier evaluation studies show positive effects or if sufficient time has passed for changes in adoption or usage of FOP symbols and product reformulation to have occurred. In addition to appropriately ordering the questions, when possible, questions that use similar methods and/or data sources are grouped within a phase to maximize analysis efficiencies. Moreover, the organization of the manufacturer and retailer questions allows the evaluator in Phases 2 and 3 to build on analysis work performed in earlier phases.
Throughout the evaluation period, as data are collected, ongoing assessments should be conducted to review the plan’s direction and determine if it continues to be relevant for achieving FDA’s goals, is progressing toward answering the questions of interest, and is operating as effectively and efficiently as possible. Lessons learning during earlier evaluation activities should inform future evaluation implementation. It is expected then that ongoing assessments could influence the scope of the evaluation plan, decisions about progressing through the evaluation phases (that is, repeating collection of certain measures over time), and choice of questions within phases. For example, as described in Section 5.1, prior to beginning evaluation, the level of penetration of the FOP symbol in the marketplace needs to be evaluated to determine if it is of a sufficient level for evaluation. Depending on the outcome of this assessment, this evaluation activity may need to be repeated one or more times even before evaluation begins. Over the course of the evaluation period, the evaluator may want to again collect this measure to consider effects related to changes in penetration rates. For example, consumers may report higher rates of noticing the FOP symbol as penetration rates increase.
FDA can use the phased approach to partition the evaluation over multiple years. See Figure 5-1 for a summary of all evaluation questions sorted by phase.
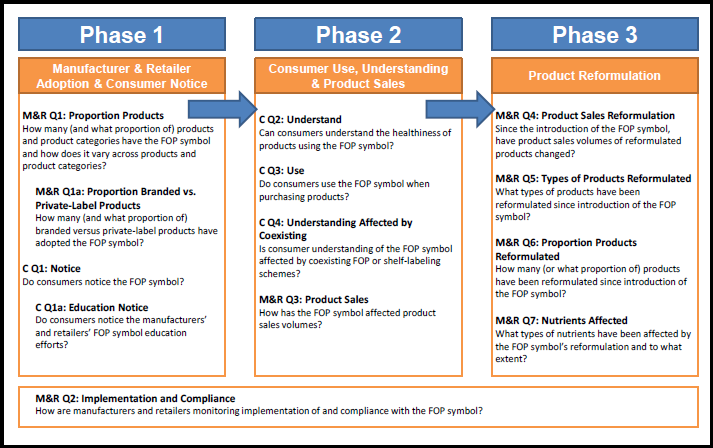 |
[Go to Contents]
5.1 Pre-evaluation Activities
Prior to starting an FOP symbol evaluation, evaluators need to make several decisions. To begin, defining the FOP symbol to be evaluated is essential. Evaluators must determine criteria for indicating what is counted as the symbol being evaluated and what is not included. This is particularly important for FOP symbols such as Facts Up Front, for which there are similar-appearing FOP symbols in the marketplace. Depending on the purpose of the evaluation, evaluators may choose to classify the FOP symbol according to how the developer of the symbol defines it in the symbol’s style guide. For example, this may be the method of choice for addressing questions related to compliance. Alternatively, evaluators may define the FOP symbol according to what consumers perceive it to be. For example, if a consumer reports the Facts Up Front symbol influenced her purchasing decision, yet the symbol does not formally adhere to the Facts Up Front style guide, it would still be included. Defining the symbol based on consumer perception can be very useful in addressing consumer-related questions, given that consumers may not be able to distinguish between similar-looking symbols. In comparison, defining whether FOP symbols like Great For You are either present or absent tends to be fairly straightforward.
Secondly, evaluators should define the amount of eligible product packages needing to display the FOP symbol prior to commencing the evaluation. Determining sufficient penetration is necessary to prevent underreporting of the FOP’s effect because the respondents had inadequate time and exposure opportunities. GMA and FMI are using a 30% penetration criterion to determine when to launch their education campaign, meaning that they intend to launch the campaign when they determine that 30% of eligible products include the FOP symbol.
Thirdly, if the evaluation plan will include analysis of sales data based on an assessment of the product’s healthiness, determining criteria for defining healthy and unhealthy in advance is essential. Suggestions for defining healthy and unhealthy are included in Section 3.3.4. To address the Phase 3 reformulation questions, evaluators will also need to outline criteria for determining when a product is considered reformulated. Section 4.3.4 offers ways for doing this.
Regardless of the evaluation plan selected and, if desired, prior to initiation of formal data collection, FDA should consider undertaking two low-cost tasks. The first task is to code and analyze the FLAPS data already collected to determine whether FOP symbols are currently used in the marketplace and what types are used. This task would be of minimal cost and can be done on all FLAPS going forward. Secondly, given the minimal resources necessary, FDA should consider adding FOP symbol-related questions to the HDS survey.
Lastly, it is critical that baseline data are collected as early as possible in the process to ensure sufficient time passes for post-FOP symbol comparison.
[Go to Contents]
5.2 Activities for All Phases
Under a phased approach, one of the first evaluation questions to be addressed is “How are manufacturers and retailers monitoring implementation of and compliance with the FOP symbol?” (Q2: Implementation and Compliance). This question should be periodically addressed and thus would be relevant under each phase; therefore, it is not repeated under each phase description. RTI suggests using stakeholder interviews to evaluate this question, which can be performed at relatively low cost and potentially incorporated as part of FDA’s ongoing outreach efforts with manufacturers and retailers.
[Go to Contents]
5.3 Phase 1: Manufacturer and Retailer Adoption and Consumer Notice
The first phase of the evaluation would consider the extent of manufacturer and retailer adoption of the FOP symbol and whether consumers are noticing the FOP symbol. The specific evaluation questions to be addressed during this phase are as follows:
- M&R Q1: Proportion Products. How many (or what proportion of) products and product categories have the FOP symbol and how does it vary across products and product categories?
- M&R Q1a: Proportion Branded vs. Private-Label Products. How many (or what proportion of) branded and private-label products have adopted the FOP symbol?
- C Q1: Notice. Do consumers notice the FOP symbol?
- C Q1a: Education Notice. Do consumers notice the manufacturers’ and retailers’ FOP symbol education efforts?
Before consumers of diverse profiles and shopping habits can notice the FOP symbol, manufacturers and retailers will need to adopt the symbol and display it on what has been predetermined to be a satisfactory number (or proportion) of products and product types. Allowing sufficient time to pass can be particularly important when the rollout of labeled products is not evenly distributed across product categories. This is expected to be the case with both the Facts Up Front and Great For You symbols. M&R Q1: Proportion Products should be evaluated first to ensure that the adoption rate of the FOP symbol is sufficient across a broad variety of products and categories. If the results of M&R Q1: Proportion Products indicate that there is sufficient penetration in the marketplace, C Q1: Notice can then be evaluated. C Q1: Notice should be addressed in Phase 1 because the response to this question will serve as the exposure screen for the remaining primary consumer evaluation questions.
M&R Q1: Proportion Products and M&R Q1a: Proportion Branded vs. Private-Label Products. As discussed in Section 4.4, these questions should be addressed by coding and analyzing product package images from a proprietary UPC-level label database (such as Gladson, Mintel, Option 3 or 4) for the presence of the FOP symbol. Given the larger size of Gladson’s database (Option 3), RTI suggests using it. The two questions are grouped because the data source and methodology used to address them are the same, and the only additional cost of addressing M&R Q1a while addressing M&R Q1 is to include private-label products in the coding and analysis. The resources required to conduct this study are generally low to medium depending on whether FDA has already purchased a label database and the number of products and categories included in the analysis.
C Q1: Notice and C Q1a: Education Notice. As discussed in Section 3, a nationally representative Web survey with a probability-based Web panel (Option 3) is the preferred option that is suitable to evaluate both of these questions. Similar to the Phase 1 manufacturer and retailer questions, these questions are grouped because the additional costs of adding questions to a Web survey about consumers’ notice of manufacturers’ and retailers’ education efforts are relatively low. The resources required to conduct this study are relatively low but may be higher depending on how much audio and audiovisual information is presented in the survey and whether the survey is conducted as a one-time survey or includes baseline and follow-up surveys.
Summary of Core Evaluation Plan for Phase 1
Questions
- M&R Q1: Proportion Products. How many (or what proportion of) products and product categories have the FOP symbol and how does it vary across products and product categories?
- M&R Q1a: Proportion Branded vs. Private-Label Products. How many (or what proportion of) branded and private-label products have adopted the FOP symbol?
Option
- Option 03: Food Nutrient Label Databases: Gladson’s Nutrition Database
Questions
- C Q1: Notice. Do consumers notice the FOP symbol?
- C Q1a: Education Notice. Do consumers notice the manufacturers’ and retailers’ FOP symbol education efforts?
Option
- Option 03: New Web Survey: KN’s KnowledgePanel
5.4 Phase 2: Consumer Use, Understanding, and Product Sales
If the evaluation studies under Phase 1 demonstrate that a sufficient number (or proportion) of products display the FOP symbol and that consumers are noticing the symbols, then evaluation questions under Phase 2 should be initiated to understand further whether consumers are using and understanding the labels. Consumer use and understanding can be determined by using consumer studies and measuring changes in product sales. The specific evaluation questions and methodologies to be addressed during this phase are as follows:
- C Q2: Understand. Can consumers understand the healthiness of products using the FOP symbol?
- C Q3: Use. Do consumers use the FOP symbol when purchasing products?
- C Q4: Understanding Affected by Coexisting. Is consumer understanding of the FOP symbol affected by coexisting FOP or shelf-labeling systems?
- M&R Q3: Product Sales. How has the FOP symbol affected product sales volumes?
In contrast to Phase 1 in which the manufacturer and retailer questions should be evaluated prior to the consumer questions, the ordering of the manufacturer and retailer versus consumer studies is not as critical in Phase 2. However, if resources are limited, consumer understanding (C Q2: Understand and C Q4: Understanding Affected by Coexisting) can be addressed prior to considering consumer use. Then, an evaluation of M&R Q3: Product Sales can be used to validate the results of the evaluation of C Q3: Use or vice versa.
C Q2: Understand, C Q3: Use, and C Q4: Understanding Affected by Coexisting. As discussed in Section 3, RTI suggests addressing these questions by conducting a new experimentally based Web survey (Option 3), embedded with a simulated shopping study
(Option 9), with a probability-based panel of consumers. These questions can be logically grouped because an experimental study using a simulated shopping study can include multiple conditions with product images and associated questions to test understanding and use, with or without varying the conditions for coexisting FOP symbols. The level of resources required to conduct this study would be in the medium range because of the number of items that would be needed to address the three evaluation questions and total participants required.
M&R Q3: Product Sales. As discussed in Section 4, Q3: Product Sales should be addressed using proprietary UPC-level label databases (such as Gladson, Mintel) matched to Nielsen Homescan data. Specifically, the coded label database used in Phase 1 (Option 3) can be appended to include sales volume information from the Homescan data (Option 2). Homescan (household-based scanner data) should be used instead of ScanTrack (store- based scanner data) to capture private-label products. Differences in product sales volumes for comparable products with and without the FOP symbol can be analyzed while controlling for other product characteristics that affect product sales. Alternatively, given adequate resources to prepare baseline and follow-up data sets, changes in product sales volumes can be analyzed for products and categories before and after including the FOP symbol. The level of resources required for this study would be on the medium to high side depending on whether it was structured to conduct an analysis at a single point in time or to evaluate changes over time. Total study costs are influenced by the costs of acquiring one or more years of the proprietary data sets and the labor costs associated with coding and appending data sets. However, the data prepared for Phase 2, particularly if baseline and follow-up data sets are created, can be further expanded to address Phase 3 evaluation questions.
Summary of Core Evaluation Plan for Phase 2
Questions
- C Q2: Understand. Can consumers understand the healthiness of products using the FOP symbol?
- C Q3: Use. Do consumers use the FOP symbol when purchasing products?
- C Q4: Understanding Affected by Coexisting. Is consumer understanding of the FOP symbol affected by coexisting FOP or shelf-labeling systems?
Option
- Option 03: New Web Survey: KN’s KnowledgePanel Combined with Option 09: Simulated Shopping Study: Web
Question
- M&R Q3: Product Sales. How has the FOP symbol affected product sales volumes?
Option
- Option 02: Scanner Data on Food Sales: Nielsen’s Homescan Data Combined with Option 03: Food Nutrient Label Databases: Gladson’s Nutrition Database
5.5 Phase 3: Product Reformulation
In the final phase of the evaluation, the following manufacturer and retailer questions on product reformulation can be addressed:
- M&R Q4: Product Sales Reformulation. Since the introduction of the FOP symbol, have product sales volumes of reformulated products changed?
- M&R Q5: Types of Products Reformulated. What types of products have been reformulated since introduction of the FOP symbol?
- M&R Q6: Proportion Products Reformulated. How many (or what proportion of) products have been reformulated since introduction of the FOP symbol?
- M&R Q7: Nutrients Affected. What types of nutrients have been affected by the FOP symbol’s reformulation and to what extent?
Although product reformulation is an important desired outcome of FOP labeling, RTI assumes that evaluating the effects of the FOP symbol on product reformulation would need to occur at a later time period than the other studies. Therefore, RTI placed all related questions in the final phase. If resources are limited, M&R Q5: Types of Products Reformulated, M&R Q6: Proportion Products Reformulated, and M&R Q7: Nutrients Affected can be addressed first to determine whether reformulation has occurred and for which products and nutrients. Then, the more complex analysis examining the effects of reformulation on product sales for M&R Q4: Product Sales Reformulation can be performed.
M&R Q3, M&R Q4, M&R Q5, and M&R Q6 on product reformulation. As discussed in Section 4, RTI suggests evaluating these questions by analyzing Nielsen Homescan data (Option 2) matched to a proprietary UPC-level label databases (such as Gladson, Mintel, Option 3 or 4). Both the Gladson and Mintel databases contain data on key nutrients. Brand extensions can be examined using Mintel data. As described in Phase 2, the data set(s) prepared to address M&R Q3: Product Sales can be further appended with information regarding whether each product was reformulated and, if the FOP symbol is nutrient specific like Facts Up Front, changes in nutrient levels reflected on the symbol. Because FDA would need to purchase multiple years of proprietary data sets to conduct the analysis and the analysis would be relatively labor intensive, the resources required to conduct these studies would be relatively high. However, to conserve resources, the data preparation and analysis can focus on selected product categories that are major contributors to the American diet or may have a greater likelihood of being reformulated (such as salty snacks or ready-to-eat breakfast cereals).
Summary of Core Evaluation Plan for Phase 3
Questions
- M&R Q4: Product Sales Reformulation. Since the introduction of the FOP symbol, have product sales volumes of reformulated products changed?
- M&R Q5: Types of Products Reformulated. What types of products have been reformulated since introduction of the FOP symbol?
- M&R Q6: Proportion Products Reformulated. How many (or what proportion of) products have been reformulated since introduction of the FOP symbol?
- M&R Q7: Nutrients Affected. What types of nutrients have been affected by the FOP symbol’s reformulation and to what extent?
Options
- Option 02: Scanner Data on Food Sales: Nielsen’s Homescan Data Combined with Option 03: Food Nutrient Label Databases: Gladson’s Nutrition Database or Option 4: Mintel’s Global New Products Database
[Go to Contents]
Endnotes
[1] Throughout this report “FOP symbols” refers to labels put on packages and on shelf tags. Although shelf tags are not literally placed on the fronts of packages, they serve the same purpose.
[2] Percentage of daily value is a percentage of the recommended intake per day that is contained in a serving of the food.
[3] Products with a Supplement Facts panel are not eligible for the Facts Up Front program.
[4] Options presented in this evaluation plan would require modification customized to the type of symbol being evaluated.
[5] Information collected from discussions with leadership of Public Sector and Government at the NPD Group.
[6] See Footnote 5.
[7] See Footnote 5.
[8] This information was collected from conversations with leadership at KN.
[9] From Burke, Harlam, Kahn, and Lodish (1992).
[10] In some cases, store-specific data can be purchased under special arrangements with Nielsen.
[11] Recently, Homescan’s name formally changed to “National Consumer Panel” as a result of the merger of Nielsen Homescan and Symphony IRI’s household panel. However, because it remains commonly referred to as Homescan, throughout the report it is referred to as Homescan.
[Go to Contents]
References
American Association for Public Opinion Research. (2011). Standard definitions: Final dispositions of case codes and outcome rates for surveys. Deerfield, IL: Author. Retrieved from http://www.aapor.org/AM/Template.cfm?Section=Standard_Definitions2&Template=
/CM/ContentDisplay.cfm&ContentID=3156
Arsenault, J. E., Fulgoni, V., Hersey, J. C., & Muth, M. K. (2011). Policy research for front of package nutrition labeling: Developing and testing a summary system algorithm. Research Triangle Park, NC: RTI International.
Bialkova, S., & van Trijp, H. (2010). What determines consumer attention to nutrition labels? Food Quality and Preference, 21(8), 1042–1051. doi:10.1016/j.foodqual.2010.07.001
Blumberg, S. J., Luke, J. V., Ganesh, N., Davern, M. E., Boudreaux, M.S., & Soderberg, K., et al. (2011). Wireless substitution: State-level estimates from the National Health Interview Survey, January 2007–June 2010. National health statistics reports; no 39. Hyattsville, MD: National Center for Health Statistics.
Bradburn, N. M., & Sudman, S. (1988). Polls and surveys. San Francisco: Jossey-Bass, Inc.
Publishers.
Burke, R. R. Harlam, B. A., Kahn, B. E., & Lodish, L. M. (1992). Validation study: Comparing dynamic consumer choice in real and computer-simulated environments. Journal of Consumer Research, 19(1), 71–82.
Centers for Disease Control and Prevention (CDC). (1999). Framework for program evaluation in public health. MMWR, 48(No. RR-11).
Chang, L. & Krosnik, J. A. (2009). National surveys via RDD telephone interviewing versus the Internet: Comparing sample representativeness and response quality. Public Opinion Quarterly, 73(4), 641–687.
Einav, L., Leibtag, E., & Nevo, A. (2010). Recording discrepancies in Nielsen Homescan data: Are they present and do they matter? Quantitative Marketing and Economics,
8, 207–239.
Gladson. (2012). Gladson statements from calls and e-mails with Gladson company representatives as well as publicly available information from their websites.
Gofman, A., Moskowitz, H. R., Fyrbjork, J., Moskowitz, D., & Mets, T. (2009). Extending rule developing experimentation to perception of food packages with eye tracking. The Open Food Science Journal, 3: 66–78.
Graham, D.J., & Jeffery, R. W. (2011). Location, location, location: Eye tracking evidence that consumers preferentially view prominently positioned nutrition information. Journal of the American Dietetic Association, 111(11), 1704–1711.
Grocery Manufacturers Association and Food Marketing Institute. (2011). Facts Up Front frequently asked questions. Retrieved from http://factsupfront.org/pdf/FUF_FAQ.pdf
Grocery Manufacturers Association and Food Marketing Institute. (2012). Facts Up Front.
Retrieved from http://factsupfront.org/aboutTheIcons.html
Groves, R. M., Fowler, F. J. Jr., Couper, M. P., Lepkowski, J. M., Singer, E., & Tourangeau, R. (2009). Survey methodology. 2nd Edition: Hoboken, NJ: John Wiley & Sons.
Groves, R., Kalton, G., Rao, J. N. K., Schwarz, N., & Skinner, C. (Eds.). (2004). Survey errors and survey costs. Wiley Series in Survey Methodology. Hoboken, NJ: John Wiley & Sons, Inc.
Guiding Stars Licensing Company. (2012). Our algorithm. Retrieved from http://guidingstars.com/what-is-guiding-stars/how-it-works/our-algorithm/
Hersey, J. C., Wohlgenant, K. C., Kosa, K., Arsenault, J. A., & Muth, M. K. (2011). Policy research for front of package nutrition labeling: Environmental scan and literature review. Report to ASPE (Contract No. HHSP23320095651WC). Research Triangle Park, NC: RTI International. Retrieved from http://aspe.hhs.gov/sp/reports/2011/FOPNutritionLabelingLitRev/index.shtml
Institute of Medicine. (2011). Front-of-package nutrition rating systems and symbols: Promoting healthier choices. Washington, DC: The National Academies Press. Retrieved from http://www.iom.edu/Reports/2011/Front-of-Package-Nutrition- Rating-Systems-and-Symbols-Promoting-Healthier-Choices.aspx
Jones, G., & Richardson, M. (2007). An objective examination of consumer perception of nutrition information based on healthiness ratings and eye movements. Public Health Nutrition, 10(3), 238–244. doi:10.1017/S1368980007258513
Knowledge Networks. (2012a). The KN Experience. Retrieved from http://www.knowledgenetworks.com/knexperience/index.html
Knowledge Networks. (2012b). KN’s QuickView. Retrieved from http://www.knowledgenetworks.com/ganp/knquick-specs.html
Knowledge Networks. (2012c). KnowledgePanel. Retrieved from http://www.knowledgenetworks.com/knpanel/index.html
Knowledge Networks. (2012d). Mobis. Retrieved from http://www.knowledgenetworks.com/mobis/index.html
Link, M. (2010). Address based sampling: What do we know so far? Retrieved from http://www.amstat.org/sections/srms/AddressBasedSampling11-29-2010.pdf
Lusk, J.L. & Shogren, J. (2007). Experimental auctions: Methods and applications in economic and marketing research. Cambridge, UK: Cambridge University Press.
Mintel. (2012). Mintel statements from calls and e-mails with Mintel company representatives as well as publicly available information from their websites.
Muth, M. K., Siegel, P. H., & Zhen, C. (2007). ERS data quality study design. Final report to the U.S. Department of Agriculture, Economic Research Service. Research Triangle Park, NC: RTI International.
Nielsen. (2012). Consumer panel and retail measurement. Retrieved from:
http://www.nielsen.com/us/en/measurement/retail-measurement.html
NuVal, LLC. (2012a). How it works. Retrieved from http://www.nuval.com/How
NuVal, LLC. (2012b). ONQI: The science behind the scores. Retrieved from http://www.nuval.com/science
Rawson, D., Janes, I., & Jordan, K. (2008, May). Pilot study to investigate the potential of eye tracking as a technique for FSA food labelling behaviour research. Prepared for the Food Standards Agency. Retrieved from http://www.food.gov.uk/multimedia/pdfs/eyetracking.pdf
Schutt, R. K. (2004). Investigating the social world: The process and practice of research.
4th edition. Thousand Oaks, CA: Sage Publications, Inc.
The White House. (2010). Remarks by the First Lady at a Grocery Manufacturers Association conference. Retrieved from http://www.whitehouse.gov/the-press-office/remarks- first-lady-a-grocery-manufacturers-association-conference
Thomas, A., Walmart staff member. (2012, July). Bee Marks Communication Symposium: Spread the Word-Recognizing Overlapping Goals and Existing Resources to Amplify Your Message. Presentation at Society of Nutrition Education and Behavior Annual Meeting, Washington, DC.
Todd, J. E., Mancino, L., Leibtag, E., & Tripodo, C. (2010). Methodology behind the quarterly food-at-home price database. Technical Bulletin Number 1926. Washington, DC: USDA Economic Research Service.
U.S. Food and Drug Administration. (2011, October). Food Label and Package Survey 2006–
2007. Retrieved from http://www.fda.gov/Food/LabelingNutrition/ReportsResearch/ucm275404.htm
U.S. Food and Drug Administration. (2012). New front-of-package labeling initiative.
Retrieved from http://www.fda.gov/food/labelingnutrition/ucm202726.htm
Walmart. (2011, January 20). Walmart launches major initiative to make food healthier and healthier food more affordable. Retrieved from http://walmartstores.com/pressroom/news/10514.aspx
Walmart. (2012). Making food healthier and healthier more affordable. Retrieved from http://walmartstores.com/nutrition/greatforyou.aspx
Wartella, E. A., Lichtenstein, A. H., Yaktine, A., & Nathan, R. (Eds.). (2011). Front-of- package nutrition rating systems and symbols: Promoting healthier choices. Prepared by Committee on Examination of Front-of-Package Nutrition Rating Systems and Symbols (Phase II). Washington, DC: The National Academies Press.
Zhen, C., Finkelstein, E.A., Nonnemaker, J., Karns, S., & Todd, J. E. (2012). Predicting the effects of sugar-sweetened beverage taxes on food and beverage demand in a large demand system. Working paper. Research Triangle Park, NC: RTI International.
Zhen, C., Taylor, J. L. Muth, M. K., & Leibtag, E. (2009). Understanding differences in self- reported expenditures between household scanner data and diary survey data: A comparison of Homescan and Consumer Expenditure Survey. Review of Agricultural Economics, 31, 470–492.
[Go to Contents]
Appendix
RTI engaged the ASPE and FDA evaluation team members in a voting activity to prioritize evaluation questions. All questions considered are shown below.
| Number | Main Evaluation Questions | Evaluation Questions |
| 1 | Manufacturer and Retailer Question #1: Is the manufacturer- and retailer-sponsored Facts Up Front label being used on products in the marketplace? | What were the necessary resources to develop Facts Up Front labeling (i.e., funding, partnerships, expertise)? |
| 2 | Manufacturer and Retailer Question #1: Is the manufacturer- and retailer-sponsored Facts Up Front label being used on products in the marketplace? | Who are the manufacturers’ and retailers’ stakeholders and what are their roles in developing and implementing the Facts Up Front label? |
| 3 | Manufacturer and Retailer Question #1: Is the manufacturer- and retailer-sponsored Facts Up Front label being used on products in the marketplace? | How are manufacturers and retailers educating manufacturer and retailer stakeholders about the Facts Up Front label? |
| 4 | Manufacturer and Retailer Question #1: Is the manufacturer- and retailer-sponsored Facts Up Front label being used on products in the marketplace? | How are manufacturers and retailers monitoring implementation of the Facts Up Front label? |
| 5 | Manufacturer and Retailer Question #1: Is the manufacturer- and retailer-sponsored Facts Up Front label being used on products in the marketplace? | How do manufacturers and retailers maintain organizational partnerships among manufacturer and retailer stakeholders, consumer groups, and government agencies, with regard to Facts Up Front labeling? |
| 6 | Manufacturer and Retailer Question #1: Is the manufacturer- and retailer-sponsored Facts Up Front label being used on products in the marketplace? | What types of media strategies are supporting the Facts Up Front labeling initiative? |
| 7 | Manufacturer and Retailer Question #1: Is the manufacturer- and retailer-sponsored Facts Up Front label being used on products in the marketplace? | If FDA releases guidance on FOP labeling to manufacturers and retailers, how might they use it? |
| 8 | Manufacturer and Retailer Question #1: Is the manufacturer and retailer-sponsored Facts Up Front label being used on products in the marketplace? | How many (or what proportion of) products have the Facts Up Front label and how does it vary across product categories? |
| 9 | Manufacturer and Retailer Question #1: Is the manufacturer- and retailer-sponsored Facts Up Front label being used on products in the marketplace? | How has the Facts Up Front label affected product prices? |
| 10 | Manufacturer and Retailer Question #1: Is the manufacturer- and retailer-sponsored Facts Up Front label being used on products in the marketplace? | How has the Facts Up Front label affected product sales volumes? |
| 11 | Manufacturer and Retailer Question #1: Is the manufacturer- and retailer-sponsored Facts Up Front label being used on products in the marketplace? | New Question: How has the Facts Up Front label affected retailer provision of nutrition information in stores and pricing? |
| 12 | Manufacturer and Retailer Question #1: Is the manufacturer- and retailer-sponsored Facts Up Front label being used on products in the marketplace? | New Question: How much have private labels and store brands adopted the Facts Up Front label? |
| 13 | Consumer Question #1: Do consumers notice, understand, and use the Facts Up Front label? | How are manufacturers and retailers educating consumers about the Facts Up Front label? |
| 14 | Consumer Question #1: Do consumers notice, understand, and use the Facts Up Front label? | Are consumers aware of manufacturers’ and retailers’ education efforts about the Facts Up Front label? |
| 15 | Consumer Question #1: Do consumers notice, understand, and use the Facts Up Front label? | Do consumers notice the Facts Up Front label? |
| 16 | Consumer Question #1: Do consumers notice, understand, and use the Facts Up Front label? | Do consumers understand the healthiness of products using the Facts Up Front label? |
| 17 | Consumer Question #1: Do consumers notice, understand, and use the Facts Up Front label? | Do consumers use the Facts Up Front label when purchasing products? |
| 18 | Consumer Question #1: Do consumers notice, understand, and use the Facts Up Front label? | Is consumer understanding of the Facts Up Front label affected by coexisting FOP or shelf-labeling schemes? |
| 19 | Consumer Question #1: Do consumers notice, understand, and use the Facts Up Front label? | Is the Facts Up Front label influencing consumer use of the Nutrition Facts Panel? |
| 20 | Consumer Question #1: Do consumers notice, understand, and use the Facts Up Front label? | If FDA releases guidance for consumers, how might they use it? |
| 21 | Consumer Question #1: Do consumers notice, understand, and use the Facts Up Front label? | Since release of the Facts Up Front label, have consumers’ diets improved? |
| 22 | Consumer Question #1: Do consumers notice, understand, and use the Facts Up Front label? | Since release of the Facts Up Front label, are consumers’ diets more closely aligned with the Dietary Guidelines for Americans? |
| 23 | Consumer Question #1: Do consumers notice, understand, and use the Facts Up Front label? | Since release of the Facts Up Front label, is there a population-level decrease in the risk of obesity and chronic disease? |
| 24 | Consumer Question #1: Do consumers notice, understand, and use the Facts Up Front label? | Is the frequency distribution of various kinds of claims different on products bearing Facts Up Front labels than previously? |
| 25 | Manufacturer and retailer Question #2: Since introduction of the Facts Up Front label, are manufacturers and retailers reformulating foods to improve nutrition? | What types of products have been reformulated since Facts Up Front labeling? |
| 26 | Manufacturer and Retailer Question #2: Since introduction of the Facts Up Front label, are manufacturers and retailers reformulating foods to improve nutrition? | How many (or what proportion of) products have been reformulated since Facts Up Front labeling? |
| 27 | Manufacturer and Retailer Question #2: Since introduction of the Facts Up Front label, are manufacturers and retailers reformulating foods to improve nutrition? | What types of nutrients have been affected by Facts Up Front reformulation? |
| 28 | Manufacturer and Retailer Question #2: Since introduction of the Facts Up Front label, are manufacturers and retailers reformulating foods to improve nutrition? | How much have the levels of nutrients changed by Facts Up Front reformulation? |
| 29 | Manufacturer and Retailer Question #2: Since introduction of the Facts Up Front label, are manufacturers and retailers reformulating foods to improve nutrition? | Since the introduction of the Facts Up Front label, has there been a change in product sales volumes of reformulated products? |
| 30 | Manufacturer and Retailer Question #2: Since introduction of the Facts Up Front label, are manufacturers and retailers reformulating foods to improve nutrition? | Since the introduction of the Facts Up Front label, has there been a change in pricing of reformulated products? |
| Data Source | Description | Frequency Collected | Sample Size | Eligibility Criteria/ Sampling Frame | Source | Reason Not Used |
| Information that would be provided by this service can be collected using fewer resources by visiting specific Web sites such as GMA/FMI’s Facts Up Front Web site. | ||||||
| CDC’s Behavioral Risk Factor Surveillance System (BRFSS) | BRFSS is the world’s largest, ongoing telephone health survey system, tracking health conditions and risk behaviors in the United States yearly since 1984. | Yearly | 4,000 respondents per state | To meet the BRFSS standard for the participating states’ sample designs, sample records must be justifiable as a probability sample of all households with telephones in the state. All participating areas met this criterion in 2010. Fifty-one projects used a disproportionate stratified sample (DSS) design. Guam, Puerto Rico, and the U.S. Virgin Islands used a simple random sample design. | http://www.cdc.gov/brfss/technical_infodata/surveydata/2010.htm | Logistical issues with having questions added and likely lag in obtaining data sets to analyze |
| CDC’s National Health and Nutrition Examination Survey (NHANES) Diet Behavior and Nutrition Questionnaire & Flexible Consumer Behavior Survey Module | NHANES is a program of studies designed to assess the health and nutritional status of adults and children in the United States. Data are collected via in-person and physical examinations. | Yearly | Examines about 5,000 persons each year | The sample for the survey is selected to represent the U.S. population of all ages. To produce reliable statistics, NHANES oversamples persons 60 or older, African Americans, and Hispanics. | http://www.cdc.gov/nchs/data/nhanes/nhanes_07_08/overviewbrochure_0708.pdf | Logistical issues with having questions added and likely lag in obtaining data sets to analyze |
| CDC’s National Health Interview Survey (NHIS) | The main objective of the NHIS is to monitor the health of the U.S. population by collecting and analyzing data on a broad range of health topics. Data are collected via in-person interviews. | Yearly | Sample for 2010 consisted of 34,329 households, which yielded 89,976 persons in 35,177 families | A representative sample of households across the country, using a multistage cluster sample design | http://www.cdc.gov/nchs/nhis/quest_data_related_1997_forward.htm#2010_NHIS | Logistical issues with having questions added and likely lag in obtaining data sets to analyze |
| Symphony IRI Group | Syndicated database includes POS sales and price information for the majority of the major U.S. grocery retailers. IRI also collects consumer purchase and attitudinal information. Panelists use bar-code scanners to scan actual purchases made from all-outlet types. Since panelists scan their purchases in-home, Walmart and nonscanning outlets are represented. | Collected on a continual basis | Active pool of 86,000 households with 5 years of rolling back data; 1-year static: 55,000 households | Consumer panel is a national sample of U.S. households. The households are from 4 census regions and 52 markets. | Information collected via discussions with IRI representatives | Duplicates Nielsen data, which RTI assumes that FDA has already purchased |
| Datamonitor’s Product Launch Analytics Database | Tracks all food and beverage products introduced to the market since 2007 and includes pictures of front and back of package and coded NFP/claims information | Database updated daily | Processing more than 30,000 products a month | All new product skus | Information collected via discussions with Datamonitor representatives | Not possible to download data set from database and changes in nutrient content are only tracked for new products |
| Store loyalty card data | Use data collected from store loyalty cards. Some retailers have loyalty programs for their customers. By signing up for the program, customers often provide demographic information in exchange for store discounts. Retailers link consumers’ demographic and purchase data that they then analyze and use to make marketing decisions. | Collected on a continual basis | Dependent on retailer(s) included | — | — | Would require negotiating individually with each store chain; most likely the data would not be nationally representative |
| Media monitoring | Use online analytics dashboard offered by Evoapp or Radion6 to scan news Web sites, blogs, Facebook posts, Twitter feeds, and other online content for a specified set of key words | Real-time content | — | — | Information collected via discussions with RTI staff who have experience conducting research using this method | Information that would be provided by this service can be collected using fewer resources by visiting specific Web sites such as GMA/FMI’s Facts Up Front Web site. |