
U.S. Department of Health and Human Services
200 Independence Ave., S.W.
Washington, D.C. 20201
Message from the Secretary
Program evaluation:
to study and assess projects, policies and programs and determine if they work. What is a program supposed to do? Is it having unintended or unforeseen consequences? Is it causing what is being measured or are other events or processes causing the outcome, or preventing the hoped-for outcome?
Michael Leavitt, Secretary
Department of Health and Human Services
2008
It is with pleasure that I offer this report to the Congress and the American People.
This report serves as one way that this wealth of information can be made available to a wider audience. The report is both a statutory requirement and a way of assisting our annual internal review of all that we have done to examine the programs we are entrusted with during our tenure. This report addresses provisions of Section 241 of the Public Health Service Act that require the Secretary of the Department of Health and Human Services annually to report evaluation findings from studies it has conducted to both the Health, Education, Labor and Pensions Committee of the Senate and to the Energy and Commerce Committee of the House.
The Department of Health and Human Services conducts and funds an enormous number of important evaluations, studies, and policy analyses regarding health and social service programs. This report examines merely the studies completed during the most recent fiscal year. There are many more still being conducted. With over 300 programs to keep tabs on, evaluation and performance measurement is something we take very seriously.
Benjamin Sasse
Assistant Secretary for Planning and Evaluation
Welcome,
This report was prepared by the Performance Improvement Reporting Staff of the Office of the Assistant Secretary for Planning and Evaluation.
The report summarizes 150 evaluations finished during the most recently completed fiscal year. We are pleased that this represents the most thorough reporting to date on the nature and findings of evaluations in the Department and hope that it will serve both professional policy experts as well as interested citizens who wish to know the nature of the work their government undertakes. As we continue to refine and strengthen this annual report, we welcome your feedback. For this purpose, we have included a one-page evaluation form at the end of the report that you are welcome to submit either by mail or email.
In addition, interested readers of this report may see the entire database of over 8,000 abstracts and summaries, many with links to the original reports, as well as to access the reports in this Performance Improvement series at: http://aspe.hhs.gov/pic/performance
"Introduction
What This Report Is About
This Performance Improvement series of reports takes its name from the primary goal of carrying out evaluations – to improve the performance of programs meant to serve the greatest needs of the community. Performance Improvement 2008, the latest of these reports, makes available the most recently completed evaluations of the Department of Health and Human Services (HHS), those completed between September 30, 2006 and October 1, 2007.
Managing a Big Department
HHS administers over 330 programs (see all the programs listed in the Catalog of Federal Domestic Assistance, www.cfda.gov). The HHS budget included $657 billion for fiscal year (FY) 2007, the period covered by this report. Of this amount, Congress directed more than $800 million for evaluation and related activities through the set-aside provision of the Public Health Service Act (Section 241) which allows the Secretary of HHS to use a portion of the amounts appropriated for programs authorized under the Act for the evaluation, directly, or by grants and contracts, of the implementation and effectiveness of these programs[1] . Additionally, Congress annually appropriates significant other funds for both directed and discretionary evaluations. Since these make up part of the essential evaluation activities of the Department, they too are reported here.
Why We Evaluate
Successful programs rely on effective evaluations. Thoughtful program evaluations can improve the delivery of public services and ensure that programs are efficient, targeted to their intended clients, and well managed. Important questions addressed by program evaluations include: what are the circumstances in which programs exist, who are the people that need services, and which program activities work best? The initial needs that give rise to programs, the knowledge base on which they are constructed, and the environment in which they operate, are not static. Actions by many individuals and demographic, economic, political, and social conditions are in flux. Legislators, policy makers, and managers must stay abreast of change. Congress and the Executive branch are responsible for the design, modification and implementation of laws and rules governing programs and both branches of government need the results of ongoing research, evaluation, and policy studies to effectively monitor and appropriately modify programs.
Funding Evaluations
Under the Public Health Service Act provision, annually about 2.4 percent of funds appropriated under the Act are used both to conduct evaluations and to fund other activities identified by Congress. The Public Health Service Act requires that the Secretary report annually, to the Senate Health, Labor and Pensions Committee and the House Energy and Commerce Committee, the findings of evaluations conducted under these provisions. As a courtesy to Congress, though not required by the Public Health Service Act, evaluations funded pursuant to other yearly administrative appropriations and statutory administrative authority are also included. This report, the 14th in this series, provides summaries of recently completed studies funded with both set-aside as well as other program evaluation funds.
Chapter I - Highlights of Findings from Completed Evaluations
This chapter presents highlights from the studies included in this report. These selections exemplify the breadth of evaluations completed by the Department of Health and Human Services during the past year. Some studies result in definitive results, others raise as many questions as they answer. Most are concerned with our need to better understand the public programs for which we are responsible. Wide availability of information strengthens agency and program operations, guides management, and drives policy advice. While the matters addressed by these studies may appear technical, they are also interesting and important. We have made every effort to communicate information about this body of work as clearly, concisely, and effectively as possible. We hope you will find subjects here worthy of research. Most importantly, this report reflects our accountability to the public for the programs we administer.
During Fiscal Year 2007, evaluations examined important management, operational, policy, and factual circumstances faced by programs. These evalutions employed a wide range of methods, including literature reviews, focus groups, surveys, microsimulation analyses, field visits, and case studies. Some were carried out by agency staff; most were completed with the assistance of contract support expertise; all reflect an intense, creative and collaborative effort. The studies reflect technical expertise and programmatic knowledge and experience regarding the importance of achieving effective and efficient programs that accomplish targeted objectives and that serve the public purposes for which they were established.
The studies presented here focused on process and output activites or program environments, but also program outcomes. Several, seeking efficient use of resources, were preliminary feasibility or evaluability studies (examinations of the practical means by which a program might be evaluated) rather than full-fledged (and more expensive) evaluations. These studies typically led to advice and recommendations regarding whether, and how best, to proceed with more in-depth studies. Studies examined how to communicate important health and human services information to both the professional and general public. Several surveys provided valuable information about the nature of social behaviors or the numbers of institutional clients that are public beneficiaries in order to provide more solid bases for advice to policy decision-makers.
The studies in Performance Improvement 2008 support the four important goals articulated in the Department of Health and Human Services´ Fiscal Year 2007-2012 Strategic Plan. The remainder of Chapter I provides highlights of interesting and significant evaluations and findings from the past year, organized under these four goals.
Goal 1 - Improve the Safety, Quality, Affordability and Accessibility of Health CARE Including Behavioral Health CARE and Long Term CARE
IMPROVE THE SAFETY, QUALITY, AFFORDABILITY AND ACCESSIBILITY OF HEALTH CARE INCLUDING BEHAVIORAL HEALTH CARE AND LONG TERM CARE
This Strategic Goal targets the need for people to be able to obtain and maintain affordable health care coverage, receive efficient high-quality health care services, and access appropriate information for informed choices.[2]
Broaden Health Insurance and Long-Term Care Coverage.
Researchers examining where individuals obtained their health care found that although non-group (individually purchased) insurance is less common than employer-provided insurance, increasing such coverage through tax credits is one potential approach to health care reform. Most non-elderly persons who have health insurance obtain it through their employment or through a family member´s employment, and the poor sometimes are covered through public programs. However, about 17 million persons under age 65 in 2006 had coverage through an individually purchased private policy.
Investigators compared individual health insurance with other private insurance obtained through employers. Various State and Federal Health Insurance Portability and Accountability Act regulations affect who purchases non-group policies and the premiums they pay. The most important regulation appeared to be "guaranteed renewability," whereby individual premiums may not be increased solely because changes occur in the individual´s health status.
An inquiry to determine whether States have reduced the number of uninsured low-income children found that nationally, the percentage of uninsured low-income children decreased between 2002 and 2005 although no State had a statistically significant change in its percentage of uninsured low-income children.
A striking finding in an exploration of the long-term care choices made by claimants who have private insurance, was the low level of nursing facility use. Although nearly half of all individuals chose to use residential care, most chose to enter assisted living rather than nursing facilities. Those who chose nursing homes were significantly more physically disabled than those who used home care or assisted living.
Increase Health Care Service Availability and Accessibility.
Staff examined the historical and projected trends in Medicaid enrollment and spending and concluded that increases in the number of people eligible for and receiving benefits in the Medicaid program will play a large part in determining future spending. The increases will be disproportionately larger for eligibility categories that have higher per capita spending: the aged, and disabled. The rate of increase in Medicaid spending will likely exceed the rate of increase in overall health care spending.
Examining what information resources individuals used when seeking nursing home care, researchers found that consumers did not generally avail themselves of the large quantities of quality information available to help them make a decision. They often did not have the time to access the information or were not aware the information existed. A study of the nursing home chain sector found that it was smaller and focused differently than it was ten years ago. Government financing remained vital, with corporate structure heavily influenced by factors such as litigation, State reimbursement, and geography.
Researchers in another project estimated that the 89,334 beneficiaries enrolled in a Preferred Provider Organization (PPO) demonstration cost the Medicare program more than for non-demonstration beneficiaries. The estimated additional cost of $41 million – $457 per enrollee – was 9.3 percent more than it would have been without the PPO demonstration.
In a review of the results of the Medicare Modernization Act, it appears that the availability of Medicare Advantage plans substantially improved, with lowered premiums and beneficiary cost sharing, and improved drug benefits. Access to Medicare private fee-for-service plans increased considerably in all parts of the country, including the rural areas.
Another study examined whether selected Medicare durable medical equipment, prosthetics, orthotics, and supply (DMEPOS) suppliers physically existed and conducted business at their listed addresses. The study found that of 169 DMEPOS suppliers, ten did not exist at their business address, yet billed Medicare almost $400,000 during the two months after researchers determined that the suppliers were absent. In total, 10 percent of the suppliers did not exist or were closed.
Improve Health Care Quality, Safety, Cost and Value.
Researchers asked how health care outcomes vary in different Medicare post acute settings for patients who suffered strokes. They found that patients who were sent to an inpatient rehabilitation facility and then to a skilled nursing facility had the same outcomes as patients who were sent directly to a skilled nursing facility but the cost was three times greater for those who first went to a rehabilitation facility. Patients using (clinic/hospital based) outpatient therapy received more therapy services and experienced better outcomes than patients receiving services only at home.
A study of how Medicare beneficiaries in long-term care facilities used prescription drugs compared to community residents treated at the same time found that beneficiaries in the community used 12 percent fewer prescription drugs.
An inquiry regarding the scope of the health care fraud problem and the value of using electronic health records to help reduce fraud determined that fraudulent claims are between 3 and 10 percent of total claim dollars, or approximately $60-$200 billion per year. Electronic health records are perceived as part of the solution to this problem. Research was also conducted to determine how widely electronic health records have been adopted in the United States. There was no evidence confirming the existence of a digital divide in health care practice; physicians treating fewer Medicaid patients used electronic health records more than doctors with a larger share of practice revenue from the insurance program. Work was performed to develop a standardized definition of electronic health record adoption and was applied to previous studies to establish a nationwide baseline rate of electronic health record adoption.
Investigators examined the impact of the Medicare Replacement Drug Demonstration on physicians and patient access to care and patient outcomes. Unexpectedly, the demonstration did not provide new access to drug therapy to most participants and Medicare spending increased over the 16-month program.
A survey of how patients and their caregivers view medical device recalls and safety information revealed that the term "recall" elicits many different emotions --- from anxiety, anger, and distrust; to more benign feelings of "cautious" and "need more information." Participants with implanted devices, other than implantable cardioverter-defibrillators (pacemakers), were the most upset by the recall discussion and the least likely to know the manufacturer of their device or be confident their doctor would contact them about a recall.
An inquiry into the current and future market for quality indicators found that 114 national entities used such indicators and that quality indicators produced by the Department of Health and Human Services fill a unique niche in the quality indicators´ market. There are no other sources of hospital care quality indicators that represent both a national standard and are also publicly available, transparent, and based on administrative data.
A review of how often Quality Improvement Organizations identify and respond to quality-of-care concerns found that these organizations recommended corrective actions in about 4,500 of the over 300,000 cases initially selected for review during the study period, i.e., 1.5 percent of cases reviewed.
Studies of several programs provided alerts that costs and services might require local or broader program management or policy intervention. An analysis of survey data in one area concluded that Medicare carriers (insurance agents) overstated co-payments for mental health services for beneficiaries with Alzheimer's disease and related disorders. In another study, it was found that 31 percent of Medicaid payments for pediatric dental services resulted in improper payments. A third exploration concluded that 64 percent of payments for surgical removal of dead or unhealthy tissue from wounds in 2004 did not meet Medicare program requirements, resulting in improper payments. In a fourth important alert to program staff and the public, a study found that States cited health deficiencies for almost half the hospices surveyed and for a quarter of hospices investigated for complaints; many related to patient care. Finally, unannounced visits to suppliers of Medicare durable medical equipment, prosthetics, orthotics, and supplies in one area found that almost a third of suppliers did not, as required, maintain a physical facility or were not open and staffed during unannounced site visits.
An examination of Medicaid payments and services made for evacuees of Hurricanes Katrina and Rita for outpatient and medical services and for prescription drugs found that a greater percentage of evacuees than non-evacuees received medical services and prescription drugs but that the average total payment evacuees received was less.
Recruit, Develop, and Retain a Competent Health Care Workforce.
Researchers explored practice profiling criteria that may allow health care organizations to identify efficient qualified physicians. The best practice profiling methodology, criteria used in contracting including financial profiling, and bonus arrangements for high quality physicians. The use of physician quality and economic profiling by payers and employers in evaluating physicians for staff appointment, reappointment or selective contracting has been suggested as an industry practice that would modernize Medicare payment practices.
Goal 2 - Prevent and Control Disease, Injury, Illness, and Disability Across the Lifespan, and Protect the Public From Infectious, Occupational, Environmental, and Terrorist Threats
PREVENT AND CONTROL DISEASE, INJURY, ILLNESS, AND DISABILITY ACROSS THE LIFESPAN, AND PROTECT THE PUBLIC FROM INFECTIOUS, OCCUPATIONAL, ENVIRONMENTAL, AND TERRORIST THREATS
Within HHS, multiple operating and staff divisions work together to develop and implement strategies to achieve the goal of preventing and controlling disease, injury, illness, and disability across the lifespan and of protecting the public from infectious occupational, environmental, and terrorist threats. [3]
Prevent the Spread of Infectious Diseases.
A query regarding the progress made toward achieving the health goals in Healthy People 2010 found that of the total 467 objectives, progress could be assessed for 281; of these, 59 percent met or moved toward the target, 14 percent demonstrated mixed progress, and 26 percent were unchanged from the baseline or moved away from the target.
Expert analysis of how Healthy People national disease prevention and health promotion objectives for 2020 should be developed resulted in several recommendations: reduce the number of topic areas and objectives; organize objectives by health risks/determinants, not disease; focus on the public health community as the target audience; and articulate a clear vision for the initiative.
Researchers carried out a random assignment study to determine whether minority substance abuse and HIV prevention initiatives reduced or delayed use and increased HIV/AIDS avoidance behavior. The program did reduce alcohol, tobacco, and other drug use. Fewer youth participants had sex after getting drunk or high and more participants took HIV/AIDS education classes.
Protect the Public Against Injuries and Environmental Threats.
Access to essential information can be key to ensuring the public against health threats. Several Web-based studies to improve both internal communications and with the public were carried out, including, for example, one to improve the Center for Devices and Radiological Health´s internet system, "CenterNet." As in other, similar studies, this one sought practical ways to improve its online menus making it easier for the public and professional public to access the available information and links.
Promote and Encourage Preventive Health Care, Including Mental Health, Lifelong Healthy Behaviors, and Recovery.
One study sought promising and innovative health education methods that targeted 8-13 year-olds and promoted healthy eating and physical activity. Findings confirmed intuitive assumptions, including: youth are more likely to adopt healthy behaviors they learn through activities they value and from those responsible for communicating effectively with youth (not to underestimate the importance of fun, as defined by kids).
Another inquiry examined the effectiveness, in reducing drug use among youth, of emphasizing prevention and developing program infrastructure. Programs with more than 100 youths in attendance per session showed larger positive effects on participants´ attitudes, beliefs, and knowledge. Programs with fewer than 100 youths in attendance appeared to result in more immediate behavioral change.
An investigation of the relationship between marriage and health scrutinized recent research, focusing on studies that used rigorous statistical methods to determine if marriage caused better health outcomes. Married people, in general, were healthier. Marriage improved certain mental health outcomes, reduced the use of some high-cost health services (such as nursing home care), and increased the likelihood of having health insurance coverage.
Prepare for and Respond to Natural and Manmade Disasters.
Researchers examined whether Government purchase-card purchases related to Hurricane Katrina complied with card use requirements. The researchers found that 85 percent of purchases complied with purchase card requirements. Cardholders had concerns regarding the legality and complexity of some purchases and over half of cardholders expressed the need for additional written guidance regarding emergency purchasing procedures.
Goal 3 - Promote the Economic and Social Well-being of Individuals, Families, and Communities
PROMOTE THE ECONOMIC AND SOCIAL WELL-BEING OF INDIVIDUALS, FAMILIES, AND COMMUNITIES
This Strategic Goal seeks to protect life, family, and human dignity by promoting the economic and social well-being of individuals, families, and communities; enhancing the safety and well-being of children, youth, and other vulnerable populations; and strengthening communities.[4]
Promote the Economic Independence and Social Well-being of Individuals and Families Across the Lifespan.
From a cross-State comparison of efforts to develop market-based, low cost health insurance products targeted to low income workers, there were several lessons learned: make enrollment goals realistic; pay attention to the whole insurance package; carefully consider the cost sharing requirements and consider implications for the State; market strategically; anticipate higher than expected premiums; understand the trade-offs between adding benefits and keeping program costs low; and know the target population.
A literature review examined education approaches that promoted healthy marriages among low-income stepfamily couples. The review found that stepfamily couples needed the same services as traditional marriages: communication and conflict management skills, effective anger and stress management skills, and friendship building skills; however, programs targeting stepfamilies should also include content tailored to their specific needs.
An investigation into how the Department can better help the poor become employed examined programs that targeted low-income individuals, including those earning low wages, and individuals who received cash assistance. Both populations were likely to encounter barriers to employment. Initiatives included those that: combined elements from multiple models and provided comprehensive services, involved new partnerships of public- and private-sector organizations, were financed with public funds, focused on employment-related skill-development, and involved the private sector.
A research literature review synthesized findings about how adolescent experiences and development affect attitudes and decisions about marriage. The study observed that programs and curricula targeting adolescent romantic relationships must be grounded in an accurate understanding of these relationships.
One random-control trial in California tested whether providing post-employment services and payments helped working individuals who recently left welfare keep their jobs, stay off welfare, and find jobs with better pay, hours, benefits, and career advancement opportunities. Individuals in the program worked more consistently than control group members and obtained substantial increases in total earnings primarily because more of them found higher paying jobs. The program did not affect public assistance received during its first year. Another study examined interim results of a Minnesota employment and retention program serving welfare recipients who had not found jobs through standard welfare-to-work services. The program had little effect on employment or earnings over the one and a half years of follow-up; an early increase in employment did not persist. A third related study, in Chicago, found that the program helped some unemployed people find jobs. The program modestly increased employment during the first two years of the study period, helping some participants move from informal jobs to somewhat higher paying jobs in the formal labor market.
A project synthesizing research and analyzing data on the composition of the welfare caseload and composition of those leaving welfare found that since welfare reform in 1996, the composition of both has remained stable.
A number of Federal programs use vouchers. Investigators summarized the reasons for using vouchers in service delivery, including how they were used in public programs, and identified design and implementation lessons learned from these voucher programs. Vouchers promoted competition and service delivery, enhanced client choice, and provided a mechanism for including faith-based and community organizations´ in-service provisions.
A query was pursued to determine why child support debt in nine States grew and whether it was collectable. Among other findings, it was learned that that most debtors had little reported income; 70 percent of total arrears overall were owed by parents earning $10,000 a year or less.
To examine child care after welfare reform, an extensive study examined the low income child care market in 25 communities in 17 States with a sub-study examining family child care in five neighborhoods. Family child care is different from center-based child care; it is typically provided in a private home, there are fewer children, and the caregiver is often related to the parent. The sub-study found that family child care providers often accommodated the varied work schedules of the mothers: most worked full-time, though their employment was unstable and they frequently did not work normal business hours.
Research to examine how dependent Americans are on social welfare programs found that there were 3 million fewer dependent individuals in 2004 compared to 1996. In 2004, 3.7 percent of the total population was dependent upon welfare benefits, in that they received more than half of their total family income from the Temporary Assistance for Needy Families, Food Stamp, or Supplemental Security Income programs. The 2004 rate was lower than the 5.2 percent rate measured in 1996.
One study sought to determine which poor single mothers both exit and stay out of poverty. Among all single mothers in 2001, thirty percent exited poverty by the end of that year; the most frequent reason was increased earnings from employment. Of mothers exiting poverty, 72 percent returned within two years. Older and more educated women were more likely to exit and stay out of poverty; they also experienced the largest earnings increases. Another inquiry found that single mothers headed most of the families with children receiving Community Services Block Grant (CSBG) funds. The study found that States used the block grant funds to change conditions that perpetuate poverty, especially emergency services, unemployment, inadequate housing, poor nutrition, and lack of educational opportunity.
An examination of whether the Child Care and Development Funds are serving rural children found that children in rural areas are receiving subsidies under the program; however, as shown in previous studies, rural children participated in center programs at lower rates than urban children. Another inquiry into how to measure outcome performance of state and local community services block agencies found several indices of assistance to low-income participants, including: over 100,000 organizations worked with CSBG programs to promote anti-poverty family and community outcomes; 101,000 households obtained $33.4 million in child support payments; and 44 million hours of volunteer services were contributed to CSBG programs.
Use of Social Services Block Grant (SSBG) Program funds was examined. States used the flexible funding to provide a wide range of critical services to vulnerable older adults, persons with disabilities, at-risk adolescents and young adults, and children and families. In 2005, almost 17 million individuals received services funded partially by the SSBG, 63 percent were children.
Research explored fertility patterns of married and unmarried men, a subject about which little has been known. Data available from 2002 suggest that for most men, fatherhood is restricted to marriage. Importantly, a man's marital status at the time his first child is born is strongly predictive of his marital status when his other children are born. This suggests that any effort to reduce men´s unwed parenthood should be concentrated on delaying first births until after marriage.
Protect the Safety and Foster the Well-being of Children and Youth.
Over the past 15 years, a number of programs have sought to improve their responses to families with children experiencing domestic violence. Findings from a study on this topic included: the child welfare system was severely strained; there were gaps in domestic violence policy and services for survivors; strategies to develop men's roles are needed; and support for children lag behind consideration of parents' needs.
Another new research area explored how child welfare agencies, which are considering privatizing foster care and adoption services, can determine whether their systems are prepared for such changes. Researchers found that reasons for undertaking privatization reform varied; a common theme was to improve child and family outcomes.
A randomized control study examined the long-term impacts on participants´ behavior of four abstinence education programs. Youth in the program group were no more likely than youth in the control group to have abstained from sex. Program and control group youth who reported having sex had similar numbers of sexual partners and had initiated sex at the same age. Contrary to concerns raised by critics of abstinence education, program group youth were no more likely to have engaged in unprotected sex than control group youth. The abstinence programs improved identification of sexually transmitted diseases but had no overall impact on knowledge of unprotected sex risks. Both program and control group youth had a good understanding of the risks of pregnancy but a less clear understanding of sexually transmitted diseases and their health consequences. Targeting youth solely at young ages may not be sufficient. The study found that friends' support for abstinence was a significant predictor of future sexual abstinence but that this support eroded during the teen years. It appears that promoting support for abstinence among peer networks into the high school years would be important.
A study to assess whether efforts to involve parents in their kids´ pregnancy prevention programs found mixed evidence for the effectiveness of this approach. Site visits clarified the difficulty of inducing parents to participate in such programs. Factors preventing parental participation include: timing and location logistics; psychosocial factors; relationship dynamics; and culture.
Encourage the Development of Strong, Healthy, and Supportive Communities.
Program staff analyzed service and expenditure data for the Low Income Home Energy Assistance Program (LIHEAP). Five million low income households received help with heating costs in FY 2004 compared to 4.8 million the previous year. These households represented 14 percent of all households with incomes under the eligibility cutoff. About 32 percent of the households receiving heating assistance had at least one member 60 years or older, down from 40 percent the previous year; about 32 percent also included at least one member with a disability, compared to 34 percent the previous year.
A survey of grassroots organizations receiving capacity building funds under the Compassion Capital Fund sampled 173 faith-based and community organizations (FBCOs). The organizations were receiving assistance in the form of training, technical assistance and financial assistance from intermediary organizations. Most FBCOs were particularly positive about the extent to which Fund support improved the level or quality of services and improved organizational capacity.
Address the Needs, Strengths, and Abilities of Vulnerable Populations.
Teacher practices were examined in a targeted training project intended to improve teaching for school readiness of at-risk, low-income children in child care in Dade County, Florida. The study looked at two kinds of training outcomes: teacher behavior, interactions with children, and aspects of the classroom environment that support children´s language and literacy development; and children´s language and pre-literacy skills. Researchers concluded that those teachers who received the targeted training and technical assistance were better able to improve young children´s development of language skills.
Another study sought to determine whether cultural competency training for doctors improved their services to and health outcomes achieved by minorities and new immigrants. This project tested curriculum modules that equipped physicians with cultural and linguistic competencies required to interact effectively with racial/ethnic minorities and new immigrants. The online modules enhanced participants' self-awareness, communication practices, and changes in the perception and use of medical interpreters.
Goal 4 - Advance Scientific and Biomedical Research and Development Related to Health and Human Services
ADVANCE SCIENTIFIC AND BIOMEDICAL RESEARCH AND DEVELOPMENT RELATED TO HEALTH AND HUMAN SERVICES
Basic science is the foundation for improved health and human services. However, once a basic discovery is made, the findings must be applied and translated into practices for health and human service improvement to result. This continuum from basic and applied research to practice is a significant emphasis of HHS´ scientific research and development enterprise. [5]
Strengthen the Pool of Qualified Health and Behavioral Science Researchers.
A study of the feasibility to evaluate health training and career development programs was conducted. The study resulted in a process-evaluation design for examining outputs from selected National Institute of Arthritis and Musculoskeletal and Skin Diseases research training and career development award programs. The advisory group for the study agreed that the proposed design and approach for developing the evaluation was feasible and recommended that it proceed.
Evaluators assessed implementation and outcomes of the Extramural Associates Research Development Award Program, established to provide grant support to minority and women educational institutions seeking to increase their involvement in biomedical and behavioral research and research training. Based on findings from the Web-based survey, interviews with extramural associates, and grantee file review, the program was being implemented as planned. Associates expressed satisfaction with the grant application process.
Increase Basic Scientific Knowledge to Improve Human Health and Human Development.
Researchers assessed the effectiveness of the Edward R. Roybal Centers Program for Translational Research on Aging. The assessment panel recommended that the program continue and recommended that future published requests for applications articulate more clearly the program´s focus, intent, and desired impact and how it would be measured.
A study explored whether an outcome evaluation of the In Vivo Cellular and Molecular Imaging Centers Program was warranted and feasible, and, if so, to recommend an outcome evaluation design. The program was found to be ripe for an outcome evaluation; its activities, outcomes and impacts are sufficiently varied and complex that in-depth analysis would be worthwhile. Researchers recommended that future outcome evaluations be quasi-experimental.
Conduct and Oversee Applied Research to Improve Health and Well-Being.
Cancer clinical trial participants were surveyed to determine whether they were concerned about possible financial conflicts of interest between researchers, medical centers, and drug companies whose drugs are being tested, as well as potential safeguards. Patients found these financial ties ethically acceptable. They preferred that an oversight system be in place to protect against conflicts of interest rather than to have the detailed financial disclosure statements of researchers or the institution provided to them personally.
Patients in several focus groups provided their views of the Food and Drug Administration´s Early Risk Information on Drug Products and overall usefulness of patient information handouts. Focus group members indicated they believed that many consumers stopped taking drugs, due to adverse events, before talking to their physicians. Participants considered physicians and pharmacists to be the most trustworthy sources. Some suggested that FDA safety news should be sent out through TV and newspapers.
Communicate and Transfer Research Results into Clinical, Public Health, and Human Service Practice.
An assessment was conducted of both customer satisfaction and the value of the American Customer Satisfaction Index, in the context of 60 different NIH Web sites. The Index has been used widely by the private sector and other government agencies. Two-thirds of the assessment teams indicated overall satisfaction with their use of the Index for site evaluation. The Index provided Web site teams with a convenient way to measure customer satisfaction. It allowed continuous qualitative data collection at a lower cost than such options as a one-time user survey.
Researchers identified the reasons that families do not return for essential follow-up for early hearing and intervention screening for their newborns. Although overall completion rates to follow-up and diagnosis were quite high among the women surveyed, a number of barriers to follow-up need to be addressed. These include the shortage of hearing specialists in rural areas and those trained to work with infants, inadequate private and Medicaid coverage, physician knowledge and attitudes about early hearing screening, too little information and communication with the family, and a lack of systematic health care system links from screening through intervention.
A study was conducted to determine how successful a Fire-Fighter Fatality Investigation and Prevention Program was in affecting safety knowledge, attitudes, and behavior. Key implications from the evaluation: small, volunteer departments have the greatest challenges to following safety guidelines; existing resources limit safety practices; gaps in knowledge and attitudes limit safety; firefighters and fire departments need information presented in additional formats; and increasing awareness would likely improve safety practices.
Pharmacists were asked to share their attitudes, beliefs, feelings, and experiences regarding drug product emerging risk communications from the Food and Drug Administration. The study concluded that it would be useful for pharmacists to have a single, credible source they could rely on for timely and accurate information about serious emerging drug risks.
A wide ranging series of studies provided a picture of the numbers of substance abuse and mental health episodes taking place nationally. One study found that the alcohol admission rate had declined by 28 percent and that the admission rate for methamphetamine/amphetamine use increased 127 percent between 1995 and 2005. Another study found that, in 2005, five substances accounted for 95 percent of all reported admissions: alcohol (39 percent), opiates and cocaine (31 percent), marijuana (16 percent), and stimulants (9 percent; primarily methamphetamine). In 2004-2005, it is estimated that use of illicit drugs ranged from a low of 5.9 percent in Iowa to a high of 12.2 percent in Alaska. Approximately 8 percent of full-time workers were illicit drug users. The highest rates illicit drug use was found among the food and hotel (17 percent) and construction (14 percent) industries. In 2006, marijuana use among youths aged 12 to 17 had decreased to 6.7 percent, underage drinking was 28.3 percent, and cigarette smoking had declined among young adults. In 2006, there were about 14,000 substance abuse treatment facilities treating approximately 1.1 million clients at any one time. With regard to mental illness, the percentage of 12-to-17-year-olds who had experienced a major depressive episode in the previous year decreased to 7.9 percent in 2006 from 8.8 percent in 2005.
Researchers assessed whether the Bench-to-Bedside Program sped the translation of promising laboratory discoveries into new medical treatments. Over two-thirds of responding project investigators indicated that collaboration between bench and clinical scientists was enhanced by the project and that it would not have been initiated without funds. Three-quarters of the project investigators said they achieved major milestones; 89 percent indicated that new collaborations between intramural and extramural investigators were established as a result of their project and 95 percent of the responding investigators indicated the partnership was critical to their success.
Chapter II - Program Evaluation at the Department of Health & Human Services
The Department of Health and Human Services (HHS) funds or conducts many evaluations; some required by statute, others considered essential by the President, and the Department, or an individual agency. Evaluation completes other core Federal management responsibilities: strategic planning, policy and budget development, and program operations (Figure 1).

As currently listed in the Catalog of Federal Domestic Assistance (www.cfda.gov), the Department is responsible for more than 330 programs. In FY 2007, the HHS budget included $657 billion for these programs. Of this amount, Congress directed more than $800 million for evaluation and related activities through the Public Health Service Act Set Aside provision [Section 241(a) of the Act]. Successful evaluation increases the likelihood of effective delivery of public services through these programs and insures that programs are efficient, targeted to their intended clients, and well managed. Additional funds, through general and directed authorities, are also available for research, demonstrations, and evaluations by agencies of HHS.
Role of Evaluation
Programs need to provide good results for the individuals served, spend tax dollars wisely, and achieve the goals intended by Congress and the President. This obligatory report to Congress on Performance Improvement continues the effort to provide a strategic and analytic presentation of evaluation studies. With the implementation of a unified Strategic Plan, as required by the Government Performance and Results Act of 1993, and as further expressed in the Performance Assessment Rating Tool (PART) carried out by the Office of Management and Budget, on behalf of the President, and further specified in the Presidents´ November 2007 Executive Order 13450, Improving Government Program Performance, the Department recognizes its responsibility to both evaluate programs and measure their performance. These assessment activities must be carried out, just as must the public programs they observe, so as to assure that funds are targeted to address the core goals and objectives of both the Congress and Executive branch. This report reflects the important role evaluations, and to a strengthened extent, performance measurement, have to test, weigh, measure and judge the success of management performance, program outputs, and social outcomes and to provide information that enables managers and policy makers to address where changes may be needed in existing programs and to provide information necessary for revising policies, regulations and statutory provisions defining the programs.
HHS evaluations directly support several efforts. Evaluations help government officials and members of the Congress make decisions related to programs, policies, budgets, and strategic planning. Evaluations enable managers to improve their program operations and performance. Evaluation results and methodological tools are useful to the larger health and human services community of state and local officials, researchers, advocates, and practitioners to improve the performance of their programs.
Three Ways to View Types of Evaluation
Classic Evaluation
The classic way to view types of program evaluation are the categories: process/implementation, experimental impact, non-experimental (or quasi-experimental), cost-benefit analysis, and other outcome studies. A cost-benefit analysis, examining the advantages and costs of one or more program designs, could be carried out before a program has been implemented. During the first several months, at least, of a program´s existence, before there are discernable outcomes to measure, a process or implementation evalution could be carried out to see if the program is being set up as intended. Fully experimental evaluations, or random-assignment studies, are sometimes considered the gold-standard of evaluation because they include both program and control groups so the results of the program can be compared to a group intended to be identical in every way except for the role of the program being tested. Finally, non-experimental or quasi-experimental studies seek to find natural circumstances that mimic to some extent what is created artificially by fully experimental studies so that comparisons can be drawn.
Performance measurement differs somewhat from and can fully complement evaluations. While performance measurement may use some of the same types of evaluative tools, the goal is more directed. While an evaluation will typically test a hypothesis, performance measurent must start with the goal of measuring observed performance against particular expectations or criteria for success.
Type by Use
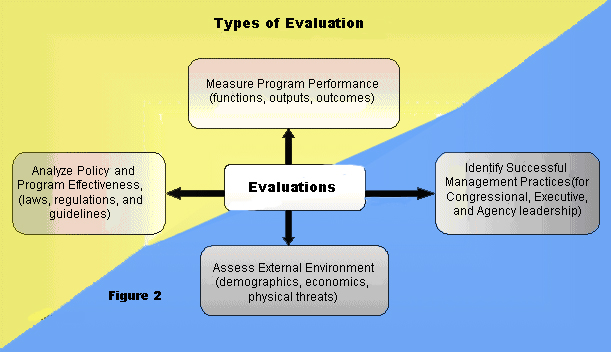
A second way of thinking about types of evaluations is to examine how the information is intended to be used. At their best, HHS evaluations assess performance (efficiency, effectiveness, and responsiveness) of programs or strategies through the analysis of information collected systematically and ethically; effective use of resulting information in strategic planning, program or policy decision-making and program improvement. Evaluations serve one or more of the following objectives (Figure 2):
Improve Performance Measurement –– Monitor annual progress in achieving departmental strategic and performance goals. As emphasized in the Performance Assessment Monitoring Tool, we invest evaluation funds to develop and improve performance measurement systems and improve the quality of the data that support those systems. Performance measurement is a high priority for HHS agencies. The emphasis during development, implementation, and refinement of programs is on results and specific measurements are required under the Government Performance and Results Act.
Strengthen Program Management and Development –– Address the need of program managers to obtain information or data that will help them effectively design and manage programs more efficiently and ensure successful results. Focus on developmental or operational aspects of program activities and provide understanding of services delivered and populations served.
Assess Environmental Factors –– Seek to understand the forces of change in the health and human services environment that influence the success of our programs. Such understanding allows us to adjust our strategies and continue to deliver effective health and human services.
Enhance Program Effectiveness and Support Policy Analysis –– Determine the impact of HHS programs on achieving intended goals and objectives and examine the impact of alternative policies on the future direction of HHS programs or services.
Basic and Applied Evaluation
A third way of thinking about evaluations––one that cuts across both the "classic" and the typology presentations of evaluation just described––uses terminology borrowed from the way we think about scientific research generally: as either basic or applied.
´Basic" evaluations focus on gathering essential factual data. While surveys may be part of broader evaluations, as stand alone undertakings, they may yet represent a basic level of evaluation. An example would be SAMHSA´s annual surveys to determine the number of individuals entering, leaving or remaining in mental health and substance abuse treatment centers. Characterizing such activities as basic evaluation is one way of avoiding the disagreements, among evaluators about how to regard these types of studies. Assessing environmental factors, discussed in the previous section, might be considered as a component of "basic" evaluation.
"Applied" evaluations, in this context, could also be called "program" evaluations for they include studies of how well programs function. Applied, or program, evaluations address the full range of issues previously discussed: improving performance measurement, enhancing program effectiveness, and strengthening program management. A full example of an applied evaluation is the national evaluation of the State Children´s Health Insurance Program that sought to determine what happened and discern the benefit contributed by the progam.
Evaluation Resources
Evaluation activities of HHS agencies and offices are supported with both general program funding and with a portion of the funds appropriated under the Public Health Service Act "set-aside" authority.
General Program Funding
Program managers, operating under either discretionary or directed authority may use program funds to support contracts to design and carry out evaluation studies and analyze evaluation data. In some cases, a program´s legislative authority calls for specially mandated evaluations, and program funds are used directly to support these studies. Agencies for which one or both examples of such funding applies include the Administration for Children and Families (ACF) and the Centers for Medicare and Medicaid Services (CMS).[6] Such funds for evaluation are also available for the Administration on Aging.[7]
Public Health Service Act Set-Aside Authority
The Public Health Service Act, Section 241 set-aside authority was originally established in 1970, when the Congress amended the Act to permit the HHS Secretary to use up to 1 percent of appropriated funds to evaluate authorized programs. Section 241 limited the base from which funds could be reserved for evaluations to programs authorized by the PHS Act. Excluded were funds appropriated for the Food and Drug Administration, the Indian Health Service, and certain other programs that were managed by PHS agencies but not authorized by the Act (e.g., HRSA´s
Maternal and Child Health Block Grant and CDC´s National Institute for Occupational Safety and Health).[8] In addition, the Secretaries of HHS have exercised their authority to exclude from funds tapped by the set-aside authority, the funds spent on CDC´s Prevention Block Grant, SAMHSA´s Substance Abuse Prevention and Treatment Block Grant, and SAMHSA´s Community Mental Health Services Block Grant.
The Revised Continuing Appropriations Resolution, 2007, authorized the Secretary to use up to 2.4 percent of the amounts appropriated for programs authorized by the Public Health Service Act for the evaluation of these programs. For Fiscal Year 2007, the year reflected in the studies here reported, agencies were budgeted a total of $830 million from the set-aside authority:
- Administration for Children and Families (ACF) -- $11 million
- Agency for Healthcare Research and Quality (AHRQ) -- $319 million
- Centers for Disease Control and Prevention (CDC) -- $267 million
- Health Resources and Services Administration (HRSA) -- $28 million
- National Institutes of Health (NIH) -- $24 million
Substance Abuse and Mental Health Services Administration (SAMHSA) -- $121 million
Three staff components in the Office of the Secretary received a total of $40 million:
- Office of the Assistant Secretary for Planning and Evaluation (ASPE)
- Office of Public Health and Science (OPHS)
- Office of the Assistant Secretary for Resources and Technology (ASRT)
In addition, the Office of the National Coordinator for Health Information Technology (ONC) received $19 million and the Office of the Assistant Secretary for Preparedness and Response (ASPR) received $3 million.
Substantial portions of the above funds are congressionally directed to pay for both general operating expenses and broad research activities.[9]
Most evaluation studies are started in one budget year, carried out in one or more subsequent years, and final reports, marking the completion of each study, may be delivered and available for the public in a third or subsequent year. Therefore, the studies completed in a particular year cannot be equated to the funds appropriated for the same year.
This Performance Improvement 2008 report includes studies funded both through the Public Health set-aside authority and with other appropriated funds.
Evaluation Management
Management of evaluations carried out by HHS agencies and offices involves: (1) planning and coordination, (2) project oversight, (3) quality assurance, and (4) dissemination of results (Figure 3). A description of each function follows.
Evaluation Planning and Coordination
The Government Performance and Results Act of 1993 (GPRA) requires that the Department establish a new five-year stategic plan every three years. The most recent was prepared last year for 2007-2012. This statute, PART, and the recent Executive Order, form an essential basis for evaluation planning . HHS agencies, ASPE, the Office of Inspector General (OIG), and several other offices, develop evaluation plans annually in concert with HHS program planning, legislative development, and budgeting cycles. Each agency or office evaluation plan generally states the evaluation priorities or projects under consideration for implementation. Typically, HHS evaluation priorities include: congressionally-mandated program evaluations, evaluations of Secretarial program or policy initiatives, assessments of new programs and ones that are candidates for reauthorization, and evaluations that support program performance management and accountability.
HHS evaluation planning activities are coordinated with three department-wide planning initiatives. First, HHS evaluation activities support the Department´s strategic planning and performance management activities in several ways. Completed evaluation studies are used in shaping specific HHS strategic goals and objectives. Evaluation findings provide important sources of information and evidence about the success of various HHS programs or policies. The HHS Strategic Plan highlights evaluations that document efficacy or effectiveness of strategic programs or policies and lists future evaluations that will benefit strategic planning. HHS agencies use findings from their evaluations to support GPRA annual performance reporting to Congress, program budget justifications, and the PART evaluation reporting obligations in theie budgets.
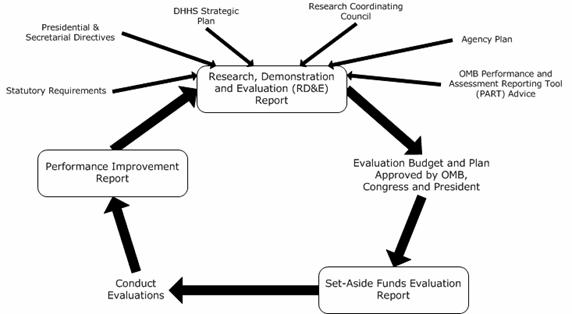
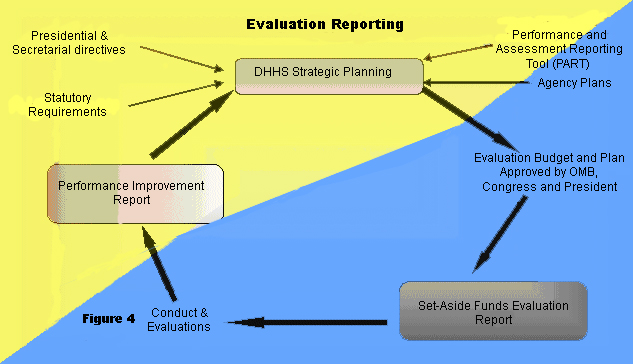
Second, Congress requests that HHS coordinate and report to Congress regarding all of its research, demonstration, and evaluation (RD&E) programs to ensure that the results of these projects address HHS program goals and objectives. HHS provides the Congress with a special annual research, demonstration, and evaluation budget plan that coincides with the preparation of the President´s fiscal year budget. The plan outlines planned spending on HHS agency research, demonstration, and evaluation priorities as related to the Department´s strategic goals and objectives (Figure 4).
Third, as mandated in statute, the Secretary reports to the Congress his plans for using PHS evaluation set-aside funds before implementing these plans.
Project Oversight
HHS agencies and staff ofices execute annual evaluation plans that involve developing evaluation contracts and disseminating and applying evaluation results. All agencies and their subunits (centers, institutes, and bureaus) coordinate with each other on research and evaluation project planning and release of final reports that relate to work of other HHS agencies.
The OIG performs independent evaluations through its Office of Evaluations and Inspections (OEI). OEI´s mission is to improve HHS programs by conducting inspections that provide timely, useful, and reliable information and advice to decision makers. Findings of deficiencies or vulnerabilities and recommendations for corrective action are usually disseminated through inspection reports issued by the Inspector General.
Quality Assurance and Improvement
Most evaluation projects are developed at the program or office level. A committee of agency- or office-level policy and planning staff members may conduct an initial quality review. Before a project is approved, a second committee reviews it for technical quality with expertise in evaluation methodology. Technical review committees generally follow a set of criteria for quality evaluation practice established by each agency. ASPE, for example, has a peer review committee that serves to improve the technical merits of ASPE proposals before final approval. Some HHS agencies have external evaluation review committees composed of evaluation experts from universities and research centers.
Since HHS began reporting to Congress in 1995 on completed evaluations through the Performance Improvement report series, the Department has focused attention on improving the quality of evaluation studies performed. In the past, Evaluation Review Panels, convened periodically, have contributed insights to HHS evaluation officers on the strengths and challenges of ensuring quality evaluation studies. HHS evaluation officers have had opportunities to discuss these strengths and challenges and identify steps to improve agency evaluation projects. A 2008 study being currently funded by ASPE is examining how findings from HHS-funded evaluations are used.
Dissemination of Evaluation Reports
Maintaining online electronic report libraries and distributing information on evaluation results is an important component of HHS evaluation management. The Department´s information and reports on major evaluations are available through the Web site of the HHS Policy Information Center (PIC), located at: http://aspe.hhs.gov/pic/performance (Appendix E contains additional information about how to access this information). ASPE´s PIC Web site offers users an opportunity to search – by key word, selected program, or policy topics – the departmental evaluation report database and electronic report library maintained by ASPE. The PIC contains over 8,500 completed and in-progress evaluation and policy research studies conducted by the Department of Health and Human Services, as well as some studies completed outside of it by others.
Project officers and other key agency staff directly submit evaluation information online. This means that, as regards the online database, there is no delay in making information avalible to evaluation peers in other parts of the Department, and to the public at large. Researchers may now search to see what studies have been funded and are currently underway that may be relevant to their own research or planning activities. New entries in the online database are intended to focus on effective and clear summaries answering the basic questions: what was the study, why was it conducted, and what was learned. Through the online database, several months before annual reports such as this one are due to the Congress, much of the information regarding the work of evaluation underway can be known both to Congressional and Executive branch staff and to the public as well, speeding the dissemination of important factual information regarding work of the Department. A positive result is reduced chance of duplication of effort and speedier application of policy implications of evaluation work carried out.
Additionally, the results of HHS evaluations are disseminated through targeted distribution of final reports, articles in referenced journals, and presentations at professional meetings and conferences. Although individual HHS agencies have primary responsibility for disseminating results, ASPE continues its Department-wide efforts to expand dissemination of evaluation results to the larger research and practice communities through email lists, e-newsletters, and publications.
The value of evaluations reside in their use. How were lessons learned applied? Were improvements made in the program? Have the findings informed the policy debates? The initial study that ASPE has undertaken begins the process of learning what means are effective for disseminating and encouraging use of evaluation findings and what are the barriers to increased use.
Chapter III - Summaries of Completed Evaluations - What Was Studied and the Key Finding
Evaluation is an essential means of achieving outstanding program performance. Without questions, there would be no need to study how well programs perform, what they accomplish, and what the circumstances are in which they operate. For each of the studies summarized below, the question that motivated each is identified. The summaries then provide a brief synopsis of the facts about the study, including, as specified in law, its key findings. These studies emerge as significiant signposts along the path of program review and improvement efforts. Evaluation implies critical judgement and reaching conclusions about merit and value. This year´s collection of completed studies include a wide range of significant findings that are potentially of broad interest.
Each study is listed under the strategic goal and objective it most clearly supports (see Appendix A for all the goals and objectives). Evaluation priorities respond to and are guided by Congressional oversight, Executive branch decision-making, program management needs and performance measurement systems such as Presidential Guidance (such as the recently signed Executive Order 13450, Improving government Program Performance), the Performance Assessment Reporting Tool (PART), and the Government Performance and Reports Act of 1993 (GPRA). Evaluation activities also respond to changing realities in the programs themselves and in the environments in which the programs operate as well as in response to advice and recommendations from earlier evaluations and evaluators.
To view the studies conducted or supported by specific agencies/offices, see the list in Appendix C. In addition to the studies presented in this report, there are, available online, earlier studies and initial entries for studies that are just beginning or are ongoing. These can be found at http://aspe.hhs.gov/pic/performance. Additional guidance on how to obtain more information about these and other studies is available in Appendix E.
Goal 1 - Health Care: Improve the safety, quality, affordability and accessibility of health care including behavioral health care and long term care.
Effective evaluation of health care and other human services programs is rapidly becoming more critical as more and more stakeholders demand dependable evidence of program success.
Objective 1.1: Broaden health insurance and long-term care coverage.
What Long-Term Care Choices Do Claimants Make Who Have Private Long Term Care Insurance?
Researchers examined insurance claimants´ functional status at the start of the claims process for those who notified their insurance company that they received or intended to receive paid services for claims they had filed, or would file, under their long-term care (LTC) policy. This study used longitudinal information collected from a sample of over 1,400 individuals with LTC insurance. These individuals comprised "an admissions cohort" of new LTC service users. This study focused on the findings from the baseline interviews with study participants who were interviewed in person by nurse assessors who also assessed their functional status. These nurses regularly do assessments for insurers for claims adjudication and are familiar with insurance eligibility requirements. Although the results of the nurses´ assessments performed at baseline for the study were not used (or allowed to be used) for claims adjudication, they enabled the researchers to judge independently whether claimants met functional eligibility requirements to trigger their policies.
The study compiled and analyzed data about initial functional status, insurance company claims denials/approval rates, and how and why approved claimants chose to purchase home care, assisted living, or nursing facility services.
A striking finding was the low level of nursing facility use. Although nearly half of all claimants chose to use residential care, most chose to enter assisted living rather than nursing facilities. Claimants who chose nursing homes were significantly more physically disabled than those who used home care or assisted living. Assisted living claimants had significantly fewer activities of daily living dependencies but significantly more cognitive impairments than claimants who used their insurance benefits to purchase home care services. About one-third of all private insurance claimants who received care at home directly hired/fired and supervised individual home care aides rather than contracting with an agency for such services.
Report Title: Service Use and Transitions: Decisions, Choices and Care Management among an Admissions Cohort of Privately Insured Disabled Elderly; http://aspe.hhs.gov/daltcp/reports/2006/admcohort.htm
Agency Sponsor: ASPE-ODALTCP, Office of Disability, Aging, and Long-Term Care Policy
Federal Contact: Pamela Doty, 202-690-6443
Performer: Lifeplans
PIC ID: 8642
What Changes Were Observed Among Private Long-Term Care Insurance Claimants?
This study analyzed data from a longitudinal information collected from a sample of 1,400 individuals with long-term care (LTC) insurance, who notified their insurance company that they were receiving or intended for receipt of paid services for which they would file or had filed a claim under their LTC policy. These individuals comprised "an admissions cohort" of new LTC service users. This admissions cohort was tracked over a period of 16 months. This study compiled selected findings of data collected from the first four follow-up telephone interviews completed after the initial in-person baseline assessment. These interviews were conducted at four-month intervals and examined key issues related to changes in disability status, the use of care management services, individual experience with the claims filing process, and transitions through the continuum of care.
Claimants experienced high mortality rates, 11 percent died within four months of initiating service; 18 percent died within one year. Over the course of one year, roughly one-quarter of the sample exited the LTC system. There were low (2.4 percent) claims denial rates and low rates of disagreement with the insurance company for denials or other claims decisions (6 percent).
Report Title: Following an Admissions Cohort: Care Management, Claim Experience and Transitions among an Admissions Cohort of Privately Insured Disabled Elders over a 16 Month Period; http://aspe.hhs.gov/daltcp/reports/2007/16moclm.htm
Agency Sponsor: ASPE-ODALTCP, Office of Disability, Aging, and Long-Term Care Policy
Federal Contact: Pamela Doty, 202-690-6443
Performer: Lifeplans
PIC ID: 8643
Who Had Individual Health Insurance and How Did It Compare With Other Private Coverage Obtained Through Employers?
Consumer health surveys were analyzed to better understand who has health insurance coverage and how key elements, such as health status and how premiums are paid, vary by type of insurance. Most non-elderly persons who have health insurance obtain it through their employer or through a family member´s employer, and the poor sometimes are covered through public programs. Approximately 17 million persons under age 65 in 2006 had coverage through an individually purchased private policy. Non-group (individually purchased) insurance is less common than employer-provided insurance. Increasing such coverage through tax credits is one means to increase health care coverage.
Risk pooling occurs in both group and non-group plans, even though initial premiums paid through group plans did not vary by a person´s health risk, while those in non-group plans typically did. Since non-group plans are primarily regulated by States, and many employers are exempt from State regulation through the Employee Retirement Income Security Act, various State and federal Health Insurance Portability and Accountability Act regulations affect who purchases non-group policies and the premiums they pay. The most important of these regulations appears to be "guaranteed renewability," whereby individual premiums may not be increased solely because changes occur in the individual´s health status. But premiums may be increased for all persons covered by the policy. This finding holds both for States with extensive regulations as well as for those with more limited regulations. Statistical analysis relating premiums paid to a person´s characteristics and health status, including the onset of new chronic conditions, indicated that premiums in non-group plans were not proportional to the expected expense that the person was likely to incur. This probably occurred because guaranteed renewability, over time, prevented the premiums of higher-risk individuals from rising.
The main failing of the non-group market was not how it treated high risks, but how it treated all risks. Since administrative expenses, including those due to underwriting, consumed at least 30 percent of premiums paid, non-group coverage could be more expensive than large group coverage for a given level of coverage. Non-group plans provided health insurance coverage to a significant portion of the non-elderly population. Subsidizing the purchase of such policies at the State (e.g., Massachusetts), or Federal level is one approach to reducing the number of uninsured. One obstacle is the high proportion of premium revenue consumed by administrative expenses.
Report Title: Risk Pooling and Regulation in Today's Individual Health Insurance Market; http://aspe.hhs.gov/daltcp/reports/2006/riskpool.htm
Agency Sponsor: ASPE-ODALTCP, Office of Disability, Aging, and Long-Term Care Policy
Federal Contact: John Drabek, 202-690-6443
Performer: MEDSTAT Group
PIC ID: 8645
How Risky is Individual Health Insurance? Where Do Individuals Obtain Health Insurance?
This study examined the extent to which persons moved from one insurance status to another over time, including being uninsured. Among those who had insurance, those with individual or small group insurance were more likely to become uninsured in the following year (17 percent and 13 percent respectively) than those with large group insurance (6 percent). Even those who had large group coverage had some risk of becoming uninsured (6 percent), perhaps because premiums became too high, or they become too ill to work and lost their coverage.
Non-group plans provide health insurance coverage to a significant portion of the non-elderly population. Subsidizing the purchase of such policies at the State (e.g., Massachusetts), or Federal level is one approach to reducing the number of uninsured. One obstacle is the high proportion of premium revenue consumed by administrative expenses. The study analyzed several consumer health surveys to better understand who has health insurance coverage, and how key elements, such as health status and premiums paid, vary by type of insurance.
Although non-group (individually purchased) insurance is less common than employer-provided insurance, increasing such coverage through tax credits is one potential approach to health care reform. Most non-elderly persons who have health insurance obtain it through their employment or through a family member´s employment, and the poor sometimes are covered through public programs. About 17 million persons under age 65 in 2006 had coverage through an individually purchased private policy.
Report Title: How Risky is Individual Health Insurance? http://aspe.hhs.gov/daltcp/reports/2007/howrisky.htm
Agency Sponsor: ASPE-ODALTCP, Office of Disability, Aging, and Long-Term Care Policy
Federal Contact: John Drabek, 202-690-6443
Performer: MEDSTAT Group
PIC ID: 8647
How Have States Sought to Save Money and Serve More People with Intellectual and Developmental Disabilities through "Supports" Waivers?
This study examined up-close what states were doing to expand supports waivers and their reasons for doing so. Increasingly, States are moving to scaled back "supports" waivers for people with intellectual and developmental disabilities and away from more "comprehensive" waivers as a way to control costs, increase the role of informal caregivers, enhance consumer direction, and leverage limited funding. Supports waivers are characterized by a relatively low dollar cap on the total amount of home and community-based services (HCBS) waivers that may be authorized on behalf of a beneficiary, flexibility in the selection of services within the dollar cap, and the expectation that unpaid family caregivers will provide significant support to waiver participants.
In 2006, there were 19 supports waivers operating in 17 States. These waivers were operating in tandem with comprehensive HCBS waivers for people with intellectual and developmental disabilities. Two additional States had applications pending. Of the 21 supports waivers, three targeted children, seven targeted adults and 11 targeted both children and adults. Funding limits ranged from $5,000 to $52,000 per year, most in the range of $13,000-$20,000. Supports waiver costs per participant were 30 percent of the comprehensive waiver costs. Fifteen of the 17 supports waiver States applied annual per participant caps. Total supports waiver enrollment increased by 66 percent between 2000 and 2006 and enrollment in comprehensive waivers grew by 31 percent. Enrollment in supports waivers accounted for 56 percent of total enrollment growth. By 2006, 26 percent of all waiver participants in these states were expected to be enrolled in supports waivers.
Emphasizing supports waivers slowed the growth of comprehensive waiver services and stabilized per participant costs of furnishing waiver services. The implementation of supports waivers permitted most of the States to offer more HCBS waivers, at least for people with intellectual and developmental disabilities, by de-emphasizing the delivery of costly residential services. Using supports waivers, States innovated and acted flexibly in their waiver programs, responding to changing consumer and family expectations.
Report Title: Gauging the Use of HCBS Support Waivers for People with Intellectual and Developmental Disabilities: Profiles of State Supports Waivers; http://aspe.hhs.gov/daltcp/reports/2006/gauging.htm
Agency Sponsor: ASPE-ODALTCP, Office of Disability, Aging, and Long-Term Care Policy
Federal Contact: Susan Polniaszek, 202-690-6443
Performer: Research Triangle Institute
PIC ID: 8655
What Impact Do HIV Outreach and Intervention Models Have?
An Outreach Initiative funded in September 2001 as part of the Special Projects of National Significance program had the following goals: 1) evaluate proactive strategies for bringing minority and underserved populations into health care in the early stages of HIV disease; 2) identify and evaluate models that transform sporadic users of health care into regular and continual users of health care; and 3) identify effective methods to support and retain clients in health care.
In Phase I, grantees evaluated their existing outreach programs and strategies to retain patients in care. Based on these evaluations, they developed new or enhanced currently existing interventions along with methods to evaluate their impact. In Phase II, the grantees evaluated these new or enhanced interventions. Ten demonstration sites (in California, District of Columbia, Florida, Massachusetts, Michigan, New York, Oregon, Rhode Island, and Washington) and a coordinating Evaluation Center were funded for both phases of the project.
A multi-site evaluation was designed and implemented by the coordinating Evaluation Center; it included client level data analysis, aggregate agency-level quality improvement analysis, and qualitative analysis. Key findings included: 1) receipt of the intervention (nine or more contacts over the first three months) was associated with retention in HIV care over one year; 2) outreach interventions were successful in reducing a number of barriers that limited access to HIV care, including lack of health insurance coverage, drug use, structural/practical barriers, unmet support service needs and health beliefs; 3) receipt of case management services was associated with engagement and retention in HIV care; and 4) retention in care was associated with improvements in undetectable viral load and quality of life.
Report Title: Multiple Site Reports; Final Reports and Additional Dissemination Products from the 11 Project Sites May be Obtained from Federal Contact
Agency Sponsor: HRSA, Health Resources and Services Administration, HIV/AIDS Bureau
Federal Contact: Adan Cajina, 301-443-3180
Performers: For over all multi-site evaluation, Boston Coordinating Evaluation Center; in addition, each site carried out a separate evaluation.
PIC ID: 8389
Objective 1.2: Increase health care service availability and accessibility.
Does Infant Adoption Awareness Training Improve the Ability of Trainees to Present All Courses of Action to Pregnant Women?
This cross-site evaluation assessed the process and impact of a pregnancy options counseling training program on health care workers' knowledge, attitudes and behaviors. As part of the Children's Health Act of 2000, Congress established the Infant Adoption Awareness Training Program, which authorized grants to adoption organizations for the purpose of training eligible health care personnel in providing adoption information and referrals to pregnant women on an equal basis with all other courses of action included in non-directive counseling to pregnant women. The program was implemented by the Administration for Children and Families.
The program improved training participants´ knowledge, attitudes, confidence and skills with regard to adoption and adoption counseling. Trainees´ adoption and adoption counseling knowledge, confidence, and skills were often significantly different from that of non-trained health care workers.
Report Title: Evaluation of the Infant Adoption Awareness Training Program; Report may be obtained from Federal Contact
Agency Sponsor: HRSA, Health Resources and Services Administration
Federal Contact: Willine Carr, 301-443-0730
Performer: Battelle Centers for Public Health Research and Evaluation
PIC ID: 8058
What Are the Historical and Projected Trends in Medicaid Enrollment and Spending?
Using existing data sources, staff compiled historical and projected trends for Medicaid program enrollment and financing. Medicaid provides health and long-term care services to low-income families, elderly and disabled individuals. It is the largest health insurance program in the United States. It spends approximately $300 billion annually providing services to approximately 60 million people. Given the projected spending growth rate for Medicaid over the next ten years, questions have been raised about the program's financial sustainability. Both Medicare and Social Security have annual Trustees' reports that provide policymakers and the public with a measure of those programs´ financial viability. Since Medicaid is paid out of general revenues and does not have a group of trustees to periodically report on its status, this study provided a more complete picture of the future of the program than previously available.
Enrollment growth (increases in the number of people eligible for and receiving benefits) in the Medicaid program will play a large part in determining future spending. The growth in enrollment will vary by eligibility category (children, adults, aged, and disabled). This uneven growth by eligibility category will affect spending trends. The increase in enrollment is estimated to be disproportionately larger for those categories of enrollees that have higher per capita spending: the aged and disabled. The rate of increase in Medicaid spending will likely exceed the rate of increase in overall health care spending.
Report Title: Historical and Projected Trends in Medicaid; http://aspe.hhs.gov/health/reports/06/trendsinmedicaid/report.pdf
Agency Sponsor: ASPE-OHP, Office of Health Policy
Federal Contact: Thomas Musco, 202-690-7272
Performer: ASPE Staff
PIC ID: 8482
What Information Resources Do Individuals Use When Seeking Nursing Home Care?
Researchers examined how consumers both gauged the value of nursing home information provided by Federal and State government and private organizations and how they chose appropriate nursing homes. Selecting a nursing home is a daunting task. Little data exists about how people make this important decision. Researchers searched the internet for information resources on nursing home selection and examined Web site accessibility and the quality of information provided. Researchers reviewed 29 Web sites: 13 national in scope and 16 State-specific. Focus groups were used to learn what factors influenced the nursing home selection decision.
Consumers did not generally avail themselves of the large quantities of quality information available to help them make a decision. They often did not have the time to access the information or were unaware that such information was available.
Report Title: Nursing Home Selection: How Do Consumers Choose? http://aspe.hhs.gov/daltcp/reports/2006/chooseI.htm
Agency Sponsor: ASPE-ODALTCP, Office of Disability, Aging, and Long-Term Care Policy
Federal Contact: Susan Polniaszek, 202-690-6443
Performer: Rand Corporation
PIC ID: 8528
Did Nursing Home Chains Divest, Withdraw from Markets, or Change Corporate Structure Due to Rising Liability Claims and Medicare Prospective Payments?
This study extended previous work that found that many nursing home chains have been reacting to environmental changes by divesting ownership of facilities in certain markets and pursuing other types of corporate restructuring. Large nursing home chains were reportedly choosing to divest, withdraw from a specific market, or change corporate structure in response to rising liability claims and introduction of a prospective payment system. Researchers reviewed literature on the topic, interviewed stakeholders, and analyzed corporate ownership using the On-Line Survey, Certification, and Reporting (OSCAR) data system. Because of the dominance of national chains among nursing homes, the study emphasized large chain activities in particular.
The national chain sector was found to be smaller and focused differently than it was ten years ago. Government financing remains vital, with corporate structure also heavily influenced by factors such as litigation, State reimbursement, and geography. The industry today maintains a moderately healthy capital structure. The industry's re-emergence and relatively better financial condition were attributed to more rational portfolios of nursing home ownership, improved access to capital, and improved Medicare reimbursement.
Report Title: Nursing Home Divestiture and Corporate Restructuring: Final Report. http://aspe.hhs.gov/daltcp/reports/2006/NHdivest.htm
Agency Sponsor: ASPE-ODALTCP, Office of Disability, Aging, and Long-Term Care Policy
Federal Contact: Susan Polniaszek, 202-690-6443
Performer: Harvard University, Harvard Medical School
PIC ID: 8530
How Has Beneficiary Enrollment in Preferred Provider Organizations Affected Medicare Expenditures?
This study estimated the Medicare Preferred Provider Organization (PPO) Demonstration´s first year impact on total Medicare expenditures. The demonstration had sought to increase the number and variety of health plan choices available to Medicare beneficiaries, offering 33 new Medicare Advantage PPO plans from 2003 through 2005. This study examined the impact of enhanced payment and risk-sharing arrangements between the CMS and the plans on the range of options and benefits available to beneficiaries. Researchers identified cost impact contributions of different types of payments, enrollees, and plans. They analyzed PPO enrollment selection bias.
The demonstration was modeled after commercial market PPO coverage. Although all plans were required to offer out-of-network benefits, fewer specific requirements were applied to the benefit design than for most other Medicare Advantage plans. Different cost sharing requirements in and out of network were intended to encourage cost-effective enrollee use of services but not discourage pursuit of appropriate care. The PPO demonstration included two changes to the standard payment system to entice plans to enter the demonstration. The first allowed PPO plans to be paid the higher of the Medicare Advantage base county payment rate, or 99 percent of the fee for service average expenditure. The second included a risk sharing option to protect plans against higher than expected medical costs.
Researchers estimated that Medicare paid more for the 89,334 beneficiaries enrolled in PPO Demonstration plans than it would have otherwise. The estimated additional cost, $41 million -- $457 per PPO enrollee – was 9.3 percent more than it would have been without the demonstration. Extra expenditures under the demonstration were the result of its design, enrolling beneficiary characteristics, and the Medicare program design.
Report Title: Medicare Preferred Provider Organization Demonstration: Cost Impact and Biased Selection in Year One (2003). http://www.cms.hhs.gov/reports/downloads/Kautter.pdf
Agency Sponsor: CMS-ORDI, Office of Research, Development, and Information
Federal Contact: Penny Mohr, 410-786-6502
Performer: Research Triangle Institute International
PIC ID: 8649
What Was the Effect of Improved Financing for Medicare Advantage Plans on Plan Offerings?
Researchers examined whether funding affected availability of Medicare Advantage plans available locally and premiums and benefits under such plans. The Medicare Modernization Act (MMA) revised the monthly capitation rates, paying more to MA plans. HHS was required to report to Congress on the impact of additional financing provided under MMA and other Acts. Congress intended these revisions to enhance beneficiary choice by increasing and stabilizing health care plan participation in the Medicare program. Since 1997, plan participation had declined from 346 risk plans to 155 plans in late 2003; enrollment in Medicare+Choice plans had fallen from 6.2 to 4.6 million beneficiaries. Plans already participating in the Medicare program for 2004 were permitted to use the additional funds provided by MMA to reduce premiums and cost sharing, improve benefits, and stabilize and enhance access to providers. The additional funding was short-term or temporary and had little effect on Medicare Advantage plan availability or benefits. Increasing plan availability, lowering premiums and increasing benefits did not occur until passage of the MMA, with its permanent restructuring of the program under the MA program.
Under the MMA, the availability of Medicare Advantage plans improved substantially, premiums and beneficiary cost sharing were lowered, and drug benefits improved. Access to Medicare private fee-for-service plans increased considerably in all parts of the country including the rural areas. Access to Medicare managed care plans -- health maintenance organizations and preferred provider organizations – still remained limited through 2005 in the rural setting. Inherent characteristics of rural areas such as less provider competition and discounting, as well as fewer enrollees over which to spread fixed costs, may have made these areas less attractive to managed care plans. It was expected that the addition in 2006 of regional preferred provider organizations in 37 States would improve access to managed care in rural areas.
Report Title: Impact of Increased Financial Incentives to Medicare Advantage Plans. Report may be obtained from Federal Contact
Agency Sponsor: CMS-ORDI, Office of Research, Development, and Information
Federal Contact: Melissa Montgomery, 410-786-7596
Performer: Research Triangle Institute International
PIC ID: 8685
How Prevalent In the Medicaid Population are Individuals With Special Health Needs; What Are These Needs; What Factors Determine Access to or Loss of Medicaid Eligibility?
Two studies examined the characteristics of working age adult Social Security Insurance recipients and the extent to which youth with chronic and disabling conditions lost Medicaid. SSI and SSDI programs provide cash benefits to people who are severely disabled. Applicants must show that their disabilities are total, will last at least 12 months or result in death, and prevent them from earning a living. But there are other groups with chronic and disabling conditions, and the Medicaid program serves numerous people with special health care needs who do not otherwise receive federal disability benefits.
Using Medicaid Analytic eXtract system data, researchers identified Medicaid beneficiaries with special health needs. For a sub-sample of enrollees identified as having a chronic or disabling condition, researchers obtained administrative records from the Social Security Insurance (SSI) and Social Security Disability Insurance (SSDI) programs to create a file of linked records that provided a rich source of data on the disabling conditions that qualified these people for federal disability benefits and chronic conditions for which they received treatment.
In the first study, researchers described the characteristics of working age adult SSI recipients and how age and other characteristics affected their ability to access Medicaid coverage before SSI benefits began or maintain Medicaid coverage after SSI benefits ended. A primary aim was to assess whether state implementation of the optional Medicaid eligibility categories for adults with disabilities enhanced access to benefits. Researchers also examined whether living in a state that required SSI applicants to apply separately for––rather than automatically enrolling them in––Medicaid upon award of SSI benefits, was related to the maintenance of Medicaid coverage after SSI benefits ended. A second study examined the extent to which youth with chronic and disabling conditions lost Medicaid coverage because of program age requirements. Specifically, the study tracked eligibility immediately after young adults reached their 18th, 19th, 20th, and 21st birthdays. Although youth with chronic and disabling conditions may be less vulnerable to aging out of Medicaid coverage compared to other enrollees of the same age, they still lose coverage at these birthdays (depending on State law) if they are not able to reestablish eligibility for Medicaid as adults or through categories for the disabled.
Researchers found that, in 2000, only 21 percent of children with chronic and disabling conditions were eligible for Medicaid on the basis of a disability; the other 79 percent were eligible because they met the criteria for low-income children. The most costly children were those designated as disabled ($1,116 per month enrolled) or in foster care ($774 per month enrolled), had a cerebrovascular condition ($2,220 per month enrolled), or had four or more conditions ($3,013 per month enrolled). Most Medicaid enrollees ages 21 through 64 with chronic and disabling conditions were eligible for Medicaid because they were designated as disabled, which means that most of these individuals met the disability criteria of the SSI and SSDI programs, but may or may not have met the financial criteria of the SSI program. The other 20 percent were eligible through other eligibility categories for adults.
Report Title: Medicaid Populations with Chronic and Disabling Conditions: A Compilation of Data on Their Characteristics, Health Conditions, Service Use, and Medicaid Payments. http://www.cms.hhs.gov/reports/downloads/Irvin.pdf
Agency Sponsor: CMS-ORDI, Office of Research, Development, and Information
Federal Contact: Bill Clark, 410-786-1484
Performer: Mathematica Policy Research, Inc.
PIC ID: 8695
Did Special Family Treatment Drug Courts Serve Better Than Traditional Court Handling of Child Welfare Cases?
This evaluation examined whether child welfare and treatment outcomes differed for families served through Family Treatment Drug Courts (FTDCs) compared to families who received traditional court handling of child welfare services. FTDCs are specialized courts designed to work with substance-abusing parents involved with the child welfare system. The evaluation explored not only whether drug courts work, but also how and for whom they work.
The study focused on four Family Treatment Drug Courts located in California, Nevada, and New York. These sites represented differing FTDC models: In one, all substance abusing parents were provided intensive recovery management services. Noncompliant clients were assigned to the Dependency Drug Court. Approximately 10 percent of all cases went to the Drug Court. In another, a more traditional, stand-alone drug court served primarily parents whose children had been removed from their care; and in the last, a stand-alone drug court that accepted parents with neglect allegations only. As a result, many children at this site using this model were not removed from their homes. The study collected data on 802 FTDCs and 1,167 comparison cases. Researchers focused on outcomes for mothers and their families (739 FTDC cases and 1,120 comparison cases).
FTDC parents had more positive treatment outcomes than similar parents who were not served by the FTDC. FTDC parents were more likely to have entered substance abuse treatment services, entered treatment more quickly after their initial court petition, spent more time in treatment and were more likely to complete at least one treatment episode. Child welfare outcomes improved. For example, FTDC children spent significantly less time in out-of-home care and were more likely to be reunified with their parents.
Report Title: Family Treatment Drug Court Evaluation: Final Report. http://www.npcresearch.com/Files/FTDC_Evaluation_Final_Report.pdf
Agency Sponsor: SAMHSA, Substance Abuse and Mental Health Services Administration
Federal Contact: Kenneth Robertson, 240-276-1621
Performer: Northwest Pacific Consortium
PIC ID: 8736
Do Users of the Center for Devices and Radiological Health and its Custom Information Technology Applications Need Training in These Systems?
This study assessed training needs for research users of the Center for Devices and Radiological Research and Food and Drug Administration custom information technology applications. The study examined what to prioritize, how to best address those priorities, and developed recommendations for an internal steering committee. The survey identified training needs in commercially off-the-shelf software and internally developed software systems. Staff collaborated on an online survey and interviews to collect training needs data. The combination of the survey instrument and key informant interviews with office directors or their delegates provided quantitative and qualitative data to identify gaps in staff skill levels. The survey response rate was 54 percent of the 1,060 Center for Devices and Radiological Health staff. The survey was conducted during March, 2007.
Recommendations made: offer an overview class for all major Center systems, develop a list of expert users who could be called on as potential trainers and/or subject matter experts, provide decision makers with a matrix describing major applications with a description of subcomponents, target audience, and capabilities. Long-term recommendations included: plan, implement, and evaluate a phased training approach; include training in the future budgets; and continue to evaluate need for specific training needs related to each system. The survey relied on self-assessed ratings of skill level for the various Information Technology systems. Validation of the survey results may be warranted if funds are available for a second round of data collection in the future.
Report Title: Information Technology Training Needs Assessment: Summary of Findings. Report may be obtained from Federal Contact
Agency Sponsor: FDA, Food and Drug Administration
Federal Contact: Simon Choi, 240-276-0966
Performer:
PIC ID: 8763
Are Users Satisfied With the Medicare's 1-800-MEDICARE Customer Service Telephone Line?
This 2007 study assessed callers' experience and satisfaction with Medicare telephone customer service and compared results with a similar study by the Office of Inspector General in 2004. Surveyors conducted interviews with a random sample of callers over a 1-week period. Callers were asked whether they were satisfied with the customer service they received, believed their questions were answered, and received all the information they needed. They were asked what their priorities were for customer service.
Seventy-one percent of callers completing calls in 2007 were satisfied overall with the customer service, compared to 84 percent in 2004. More callers in 2007 than in 2004 reported hanging up before receiving answers to their questions and had concerns about wait times. Similar to the 2004 baseline data, 44 percent of callers in the 2007 evaluation had difficulty accessing information they received.
Report Title: 1-800-MEDICARE: Caller Satisfaction and Experiences. http://oig.hhs.gov/oei/reports/oei-07-06-00530.pdf
Agency Sponsor: OS-OIG, Office of Inspector General
Federal Contact: Claire Barnard, 202-205-9523
Performer: Office of Inspector General
PIC ID: 8775
How Do States Promote Health Information Technology and Exchange?
This study assessed State Medicaid agencies' initiatives to promote health information technology (HIT) and health information exchange (HIE). In 2004, the President announced his plan to ensure that electronic health records would be available to most Americans by 2014. Secretary Leavitt stated that he envisioned that Medicare and Medicaid would be viewed as leaders in the collaborative development and use of HIT. This study surveyed all State Medicaid directors and conducted structured telephone interviews with State Medicaid directors who reported that they had current or planned HIT and HIE initiatives. Researchers reviewed documentation of State initiatives and interviewed officials from the Centers for Medicare & Medicaid Services who were involved in this area or in the implementation of Medicaid Information Technology Architecture MITA), a system design developed help States modernize their Medicaid information systems.
Twelve State Medicaid agencies had implemented a total of 16 HIT initiatives. Twenty-five State Medicaid agencies were planning and developing Statewide HIE networks. Thirteen State Medicaid agencies included the Medicaid Information Technology Architecture as part of their planning. Researchers recommended that the Centers for Medicare and Medicaid Services continue to promote the use, by states, of the Medicaid Information Technology Architecture and that the agency collaborate with other Federal agencies in developing privacy and security policies.
Report Title: State Medicaid Agencies' Initiatives on Health Information Technology and Health Information Exchange. http://oig.hhs.gov/oei/reports/oei-02-06-00270.pdf
Agency Sponsor: OS-OIG, Office of Inspector General
Federal Contact: Claire Barnard, 202-205-9523
Performer: Office of Inspector General
PIC ID: 8778
What Impact Do Interventions Using Information Technology Have on Delivery and Quality of Primary Care for Underserved People Living with HIV?
Researchers at six grantee sites (in California, Louisiana, Maryland, New York, and North Carolina), evaluated the impact of information technology (IT) interventions to improve delivery and quality of care for underserved people living with HIV. Each site had a different IT intervention and associated evaluation methodology to address one or more of the initiative´s three areas of emphasis: 1) optimizing the delivery of health care; 2) optimizing outcomes and quality of health care; and 3) assessing the cost-effectiveness of the interventions. Examples of evaluation methodologies included randomized clinical trial and assessment of process and outcome measures.
Key findings included: 1) goals for health information technology use should be transparent and concrete; 2) a sufficient planning and transition period for health IT implementation should be developed that involves all stakeholders in both planning and implementation stages; and 3) capacity building to improve organizational adoption of health information technology should focus on overall administrative and professional infrastructure.
Report Title: Multiple Site Reports. Final Reports and Additional Dissemination Products from the 6 Project Sites May be Obtained from Federal Contact
Agency Sponsor: HRSA, Health Resources and Services Administration, HIV/AIDS Bureau
Federal Contact: Cajina, Adan, 301-443-3180
Performers: See reports; each site carried out a separate evaluation.
PIC ID: 8388
What Services Does Medicare Include Under Part B For Nursing Home Residents Who Do Not First Receive Hospital Services Under Part A?
This study examined Medicare Part B services and allowed payments for nursing home residents not in a Medicare Part A covered stay during calendar year 2002. Researchers compiled data on Medicare Part B services for nursing home residents, linking information from several databases. Researchers developed descriptive information by service and by resident on the population of nursing home residents with Part B claims.
Medicare allowed $5.3 billion for Part B services provided to nursing home residents. Payments varied by State for each of the ten categories. The ten categories included minor procedures, nursing home visit, ambulance, lab test, specialist, enteral nutrition, dialysis, durable medical equipment, standard imaging, and hospital visit. This analysis found variation in State median payments per resident among the top 10 categories of service. Variation across States may reflect differences in populations or differences in care provided, or may be an indication of inappropriate services. As a baseline review, this analysis did not determine whether variation was due to differences in care provided or due to inappropriate billing practices. Making such a determination would require further, more in-depth review.
Report Title: Medicare Part B Services for Nursing Home Residents: 2002. http://oig.hhs.gov/oei/reports/oei-05-06-00240.pdf
Agency Sponsor: OS-OIG, Office of Inspector General
Federal Contact: Claire Barnard, 202-205-9523
Performer: Office of Inspector General
PIC ID: 8779
Did the New Medicare Provider Enrollment Data System Fail to Improve Application Processing of, and System Access for, Providers?
Researchers from the Office of Inspector General assessed early program timeliness of Medicare provider enrollment application processing and system access in the Provider Enrollment, Chain and Ownership System (PECOS). PECOS is the primary location of enrollment records for Medicare providers, such as physicians, hospitals, and laboratories. It serves as the frontline defense preventing fraudulent providers from participating in Medicare and was expected to greatly reduce the time needed to process provider enrollment applications. Researchers collected records from contractors of all provider enrollment applications exceeding established timeframes for July 2005. Researchers aggregated this data, selected stratified random samples of applications, and contacted the contractor that owned each application to determine the reason it was delayed. Researchers conducted structured interviews with all contractors regarding their experiences with PECOS, factors that commonly delayed processing of applications, PECOS training and guidance received, their understanding of application processing procedures, and their oversight by the Centers for Medicare and Medicaid Services (CMS). Researchers also conducted structured interviews with provider enrollment and PECOS access staff in each CMS regional and central offices.
Early implementation of the new system had mixed results. Over half of all contractors reported difficulty accessing PECOS. Due to a misinterpretation of agency guidance, the majority of Part A applications´ contractors reported exceeding timeframes as of July, 2005, had not exceeded timeframes. Part B applications contractors reported as exceeding timeframes, were primarily the result of one contractor's backlog and providers' failure to respond to requests for information.
Report Title: Provider Enrollment, Chain and Ownership System: Early Implementation Challenges. http://oig.hhs.gov/oei/reports/oei-07-05-00100.pdf
Agency Sponsor: OS-OIG, Office of Inspector General
Federal Contact: Claire Barnard, 202-205-9523
Performer: Office of Inspector General
PIC ID: 8785
Do Selected Suppliers of Durable Medical Equipment, Prosthetics, Orthotics and Supply Suppliers Physically Exist?
This study examined whether selected Medicare durable medical equipment, prosthetics, orthotics, and supply (DMEPOS) suppliers physically existed and conducted business at their listed addresses. Researchers conducted out-of-cycle site visits of 169 suppliers in 2005, to determine if they met the Medicare requirements of maintaining a physical facility and were open to conduct business. Researchers chose these requirements because they directly impact the ease of beneficiary access to DMEPOS services. Researchers determined compliance with these Medicare requirements through physical site observations and attempts to gain access to the facilities.
Of 169 DMEPOS suppliers, ten did not exist at their business address, yet they billed Medicare almost $393,000 in the two months after researchers had determined that they were absent. Of 169 DMEPOS suppliers, six were closed during posted business hours at the time of the OIG´s site visits.
Report Title: Medical Equipment Suppliers: Compliance with Medicare Enrollment Requirements.Report may be obtained from Federal Contact
Agency Sponsor: OS-OIG, Office of Inspector General
Federal Contact: Claire Barnard, 202-205-9523
Performer: Office of Inspector General
PIC ID: 8786
Have States Reduced the Number of Uninsured Low-Income Children?
This study assessed States' progress in reducing the number of uninsured low-income children and States' progress meeting State Children's Health Insurance Program performance goals. The Balanced Budget Refinement Act of 1999 requires that every three years the Office of Inspector General evaluate whether States are enrolling Medicaid eligible children in their State Children's Health Insurance Programs and assess States' progress in reducing the number of uninsured low-income children, including their progress meeting State plan strategic objectives and performance goals. This study addressed the second mandate. The first is addressed in a separate study. Researchers analyzed the percentage change between 2002 and 2005 in the number of uninsured low-income children out of the total population of low-income children. Researchers analyzed all performance goals listed in States' 2006 Annual Reports and compared progress to 2005.
Nationally, the percentage of uninsured low-income children decreased between 2002 and 2005, although no State had a statistically significant change in the percentage of uninsured low-income children. In 2006, 37 States met or made progress in meeting at least half of their performance goals.
Report Title: Assessing States' Progress in Meeting State Children´s Health Insurance Program Goals. http://oig.hhs.gov/oei/reports/oei-05-07-00330.pdf
Agency Sponsor: OS-OIG, Office of Inspector General
Federal Contact: Claire Barnard, 202-205-9523
Performer: Office of Inspector General
PIC ID: 8791
Objective 1.3: Improve health care quality, safety, cost, and value.
Do Patients Who Are Depressed or Who Suffer At-Risk-Drinking Fare Better in Integrated Primary Care Settings or in Specialty Care?
The multi-site study compared the effectiveness of service delivery models that treat older adults with mental health or substance abuse problems. The study identified differences in clinical and cost outcomes between treatment models providing consumers with specialty mental health and substance abuse services within the primary care settings (integrated model) and models referring consumers outside the primary care setting (referral model). This four-year randomized controlled trial included 3,000 patients with problems who were assigned to one of the two models of care. The study found that participants were more open to receiving care within primary care than in specialty clinics. For depression, both the integrated primary care and specialty referral care groups saw significant improvements in rates of remission and symptom reduction. However, for the subgroup with major depression, referral to specialty care was better at lessening the severity of symptoms. For at risk drinking, both the primary care and the specialty care improved client health conditions by reducing the number of drinks per week and decreasing binge drinking. The initiative included the active collaboration of all three SAMHSA centers, with the Center for Mental Health Services (CMHS) as the lead, the Health Resource Services Administration's Bureau of Primary Care, the Department of Veterans Affairs, and the Centers for Medicaid and Medicare Services.
Report Title: Outcome Findings for Mental Health and At-Risk Drinking from the Primary Care Research in Substance Use and Mental Health for the Elderly Multisite Study (PRISM-E) http://158.74.242.66/pic/login/dataentry/link_page7722.html
Agency Sponsor: SAMHSA, Substance Abuse and Mental Health Services Administration
Federal Contact: Marian Scheinholtz, 240-276-1911
Performer: Center for Mental Health Services, (SAMHSA), HHS
PIC ID: 7722
What Impact Has the Buprenorphine Waiver Had?
This three-year study gathered information to assess alternative service effectiveness; researchers analyzed the treatment provided through the 'buprenorphine waiver,' its impact on access to treatment, and potential adverse public health consequences. The evaluation gathered information needed to determine whether to continue waivers. The Drug Addiction Treatment Act of 2000 (DATA) enabled office-based administration of certain medications for opiate addiction such as buprenorphine, which was approved by the Food and Drug Administration in October, 2002. DATA allows physicians with certain qualifications to obtain waivers from special registration requirements usually associated with prescribing or dispensing such drugs. DATA also states that at some point HHS and the Attorney General may discontinue the waiver program. This effort was developed in coordination with the Office of National Drug Control Policy, the National Institute on Drug Abuse, the Food and Drug Administration, Department of Veterans Affairs, the Drug Enforcement Agency, and others.
Buprenorphine treatment provided under the waiver program demonstrated its effectiveness in clinical practice settings. Little evidence has emerged of negative public health consequences attributable to the waiver program. Serious adverse reactions and diversion were rarely reported by patients or by treating physicians. The number of geographic areas where medication-assisted treatment is available increased. The demonstration has shown the potential to increase significantly the availability of effective treatment for opioid-dependent persons. The evaluation indicated that continued dissemination of buprenorphine and efforts to increase access to this treatment option appear desirable.
Report Title: The SAMHSA Evaluation of the Impact of the DATA Waiver Program: Summary Report. http://www.buprenorphine.samhsa.gov/FOR_FINAL_summaryreport_colorized.pdf Agency Sponsor: SAMHSA, Substance Abuse and Mental Health Services Administration
Federal Contact: Arlene Stanton, 240-276-2718
Performer: Westat, Inc.
PIC ID: 7887
What Are Available Heart Disease and Stroke Prevention Policies?
The study collected and analyzed health care organizations´ heart disease and stroke prevention policies. The Centers for Disease Control and Prevention (CDC) funded programs in 32 States and the District of Columbia to promote cardiovascular health and prevent morbidity and mortality due to heart disease and stroke. To provide expertise and support to States in developing and evaluating policies, researchers for this two-year project convened an expert panel to offer guidance on project tasks. Project activities included completing a literature review, conducting interviews and focus groups, developing an evaluation framework for policies, and collecting and analyzing data on policies.
Researchers developed an annotated bibliography of State heart disease and stroke prevention policy and activity sources, a centralized database for State policies, a guide to the fundamentals of heart disease and stroke prevention policymaking, and a handbook on how to evaluate these policies. These products enable States to easily find relevant policy information and determine whether the policies are applicable and replicable in their locations. The online resources can be updated with new policies added and existing policies revised. By also offering a tool for policy assessment, the handbook supports State programs in their policy development, implementation, and evaluation decisions. The evidence-based methods highlight "what to do" and "what not to do" for State grantees and other stakeholders that wish to develop and evaluate heart disease and stroke prevention policies.
Report Title: Heart Disease and Stroke Prevention Policy Project. http://www.cdc.gov/dhdsp/dhdspleg/
Agency Sponsor: CDC, Centers for Disease Control
Federal Contact: Julie Zajac, 404-498-4381
Performer: Mathematica Policy Research, Inc.
PIC ID: 8300
How Evaluate the Business Case for Using Health Information Technology in Long-Term Care Settings?
This study considered how to evaluate the business case for the use of health information technology in post-acute and long-term care settings. Effective application of health information technology is increasingly viewed as a way to promote quality and cost-effective care. Accelerating the adoption of this technology requires an understanding of its costs and benefits and knowledge of who incurs these costs and benefits. Policy makers, payers, providers, and others need this information. This study included a review of the literature and discussions with technical experts. The study developed three alternative evaluation designs that could be used to assess the business case for health information technology in post-acute and long-term care settings.
The study identified: (1) some health information technology uses that are particularly relevant in nursing home and home health settings; (2) categories into which various types of health information technology costs could be placed; (3) types of benefits and costs that may result from using health information technology; (4) factors to consider in determining who incurs these costs and benefits; and (5) alternative designs for assessing the business case for health information technology in post-acute and long-term care settings, and the strengths and limitations of the various designs. The contractor recommended that a smaller retrospective study be conducted that would include 10-20 nursing homes or home health settings. This approach could make needed qualitative and quantitative information about health information technology costs and benefits available quickly and keep study costs low.
Report Title: Evaluation Design of the Business Case of Health Information Technology in Long-Term Care: Project Summary. http://aspe.hhs.gov/daltcp/reports/2006/BCfinal.htm
Agency Sponsor: ASPE-ODALTCP, Office of Disability, Aging, and Long-Term Care Policy
Federal Contact: Jennie Harvell, 202-690-6443
Performer: Booz Allen Hamilton
PIC ID: 8331
Can Health IT Standards Overcome Known Terminology and Messaging Challenges to Standardize Assessment Information Collected and Exchanged on Behalf of Nursing Home Residents?
The project revealed both the potential benefits and the challenges of leveraging health information technology (IT) standards when preparing and exchanging complex survey data such as the Minimum Data Set (MDS), version 2. HHS requires the collection and electronic transmission of information regarding health and functional status of Americans through a variety of federally-required assessment instruments. This collection includes the nursing home MDS used to create payment rates, quality measures and quality indicators for Medicare and Medicaid nursing facilities.
This project identified and applied recognized health IT standards to the nursing home MDS. The applied health IT standards were those that would support both the standardized exchange of the assessment data through the use of a widely used messaging standard, and would allow assessment data to be re-used in standardized electronic health records through the use of accepted content standards. Applied standards were analyzed by persons with expertise with the MDS using a software tool that was refined for this project. The identified standards provided a solution for addressing key vocabulary challenges related to clinical assessment instruments including the need to accommodate the complexity and idiosyncrasies of patient assessment instruments and bridging known gaps in existing standards.
Report Title: Making MDS v.3.0 Compliant with CHI Standards: Project Summary, http://aspe.hhs.gov/daltcp/reports/2006/MDS-HIT.htm
Agency Sponsor: ASPE-ODALTCP, Office of Disability, Aging, and Long-Term Care Policy
Federal Contact: Jennie Harvell, 202-690-6443
Performer: Apelon
PIC ID: 8337
How Do Health Care Outcomes Vary in Different Medicare Post Acute Settings for Patients Who Have Had Strokes?
This study compared the cost and outcomes of post acute care services after hospitalization for a stroke. After hospitalization, over a third of Medicare beneficiaries use post acute care services, including skilled nursing facilities, inpatient rehabilitation, long-term care hospital, home health care services or outpatient services. We know little about the effectiveness of these settings. Researchers identified the functional status of the person before the stroke, at the beginning of post acute care services, and 90 days after the start of those services. Most patients experienced multiple post acute care settings which added to the overall costs to Medicare.
Patients who were admitted to an inpatient rehabilitation facility and then went a skilled nursing facility had the same outcomes as patients who went directly to a skilled nursing facility––but cost three times as much. Patients using (clinic/hospital based) outpatient therapy received more therapy services and had better outcomes than patients receiving services at home. While home health service had higher total costs and Medicare costs, out-of-pocket costs to beneficiaries were substantially higher for patients using outpatient therapy than home health. This study provided essential information to help reform the post acute care system.
Report Title: A Study of Stroke Post-Acute Care and Outcomes: Final Report, http://aspe.hhs.gov/daltcp/reports/2006/strokePAC.htm
Agency Sponsor: ASPE-ODALTCP, Office of Disability, Aging, and Long-Term Care Policy
Federal Contact: Susan Polniaszek, 202-690-6443
Performer: University of Colorado
PIC ID: 8531
How Do Medicare Beneficiaries Use of Medications in Long-Term Care Facilities Compare to Community Residents' Use Before the Addition of Medicare Drug Coverage?
This study prepared nationally-representative estimates of drug spending in long-term care facilities, compared drug use and spending for beneficiaries in long term care facilities versus beneficiaries in the community, and examined medication use and spending by short-stay skilled nursing home facility residents who transition into long term care facilities. Little attention had been given to how Medicare Part D for prescription drugs would affect nearly 2.7 million Medicare beneficiaries residing in nursing homes and other long-term care facilities and what the prescription drug utilization patterns were for these people. Researchers used the 1998-2001 Medicare Current Beneficiary Survey Cost and Use Files for this project.
There was a difference in drug utilization and cost between beneficiaries residing in long-term care facilities and those living in the community. Beneficiaries eligible for Medicare due to disability use a different mix of therapeutic classes of drugs than beneficiaries over age 65. Thus, review of formulary guidance in Medicare Part D should consider intra-population differences among Medicare beneficiaries.
Report Title: Prescription Drug Spending by Medicare Beneficiaries in Institutional and Residential Settings, 1998-2001, http://aspe.hhs.gov/daltcp/reports/2007/pdspend.htm
Agency Sponsor: ASPE-ODALTCP, Office of Disability, Aging, and Long-Term Care Policy
Federal Contact: Susan Polniaszek, 202-690-6443
Performer: University of Maryland, Baltimore
PIC ID: 8549
What Was National Drug Spending for Residents of Long-Term Care Facilities, 1998-2001?
Researchers estimated the utilization pattern and expenditures for drug spending in long term care facilities by Medicare eligibility status and coverage source, as well as by type of facility. This was done using the 1998-2001 Medicare Current Beneficiary Survey Cost and Use Files.
The top 10 therapeutic categories accounted for approximately three-quarters of all spending for prescription drugs in long-term care facilities. Psychotherapeutic agents were the most commonly prescribed class of drugs and the most expensive. Other classes of high utilization drugs included gastrointestinal agents, autonomic agents, cardiovascular drugs and central nervous system drugs. The average annual growth in prescription drug spending across all long-term care facilities was almost 12 percent for each of the three years.
Report Title: National Estimates of Prescription Drug Utilization and Expenditures in Long-Term Care Facilities, http://aspe.hhs.gov/daltcp/reports/2006/pdnatest.htm
Agency Sponsor: ASPE-ODALTCP, Office of Disability, Aging, and Long-Term Care Policy
Federal Contact: Susan Polniaszek, 202-690-6443
Performer: University of Maryland, Baltimore
PIC ID: 8549.1
How Did Medicare Beneficiaries in Long-Term Care Facilities Use Drugs Compared to Community Residents Treated at the Same Time?
Researchers examined the drug use differences for Medicare beneficiaries depending on place of residence – in the community or in a long-term care facility. Differences existed in socio-demographic and drug utilization and costs by Medicare beneficiaries residing in long-term care facilities and those living in the community. Health status difference between people living in long-term care facilities and those living in the community resulted in differences the utilization and the cost of prescription drugs.
On average the disabled population in the community spent 12 percent more than a disabled person living in a facility, $2,444 for prescription drugs, compared to $2,775.
Report Title: A National Comparison of Prescription Drug Expenditures by Medicare Beneficiaries Living in the Community and Long-Term Care Facility Settings, http://aspe.hhs.gov/daltcp/reports/2007/pdnatcom.htm
Agency Sponsor: ASPE-ODALTCP, Office of Disability, Aging, and Long-Term Care Policy
Federal Contact: Susan Polniaszek, 202-690-6443
Performer: University of Maryland, Baltimore
PIC ID: 8549.2
Does Payment Source Predict Skilled Nursing Facility and Nursing Home Resident Use of or Expenditures for Drugs?
Using the 2001 Medicare Current Beneficiary Survey and Medicare Part A skilled nursing facility claims, researchers compared use and spending for prescription and over the counter drugs during qualifying skilled nursing facility stays and for the longer term nursing home stays. Researchers compared drug utilization patterns between beneficiaries with a Medicare Part A qualifying stay in a skilled nursing facility and those with a non-qualifying nursing home stay.
Drug utilization rates were similar across the residential situations. Beneficiaries received 9.2 unique medications per person-month. Average prescription drugs costs were slightly higher for beneficiaries in a skilled nursing facility.
Report Title: Drug Use and Spending for Medicare Beneficiaries During Part A Qualifying Skilled Nursing Facility Stays and Non-Qualifying Long-Term Care Facility Stays, http://aspe.hhs.gov/daltcp/reports/2007/druguse.htm
Agency Sponsor: ASPE-ODALTCP, Office of Disability, Aging, and Long-Term Care Policy
Federal Contact: Susan Polniaszek, 202-690-6443
Performer: University of Maryland, Baltimore
PIC ID: 8549.3
Can Increases in Physician Payments Be Made Systematically, Reasonably, and Conflict Free?
This study assessed effects various changes would have on the Sustainable Growth Rate (SGR) system, the process used to updated Medicare physician payment amounts. A spreadsheet model of the sustainable growth rate process was developed to examine changes in conversion factors and program spending in response to changes in the process, including changes to the formula and in the formation and composition of target spending, or allowed spending, under the SGR process. The spreadsheet model was used to study effects of two fundamental types of revisions to the process. Researchers first studied effects of changes in various attributes of the SGR formula. Attributes of interest included: the Medicare Economic Index, effects of not adjusting the index for economy-wide changes in productivity; the design of the Update Adjustment Factor , which translates the SGR into a multiplier for calculating a new base payment amount for physician services, effects of changing the UAF floor, and the severity of penalties on over-spending in the previous year and cumulated over time. Researchers then studied the effects of several changes in the definition of target spending. Finally, the effects of increases in the sustainable growth rate were examined.
Actual spending by the Medicare program for physician services will likely continue to exceed target spending. An increase in the size of targets, for example, to reflect a strengthening of preferences for more health care spending by program beneficiaries over time, should reduce the size of future payment update reductions, as actual spending would more closely track target spending.
Report Title: Short-Term Fixes to the Sustainable Growth Rate Process, http://aspe.hhs.gov/health/reports/08/sgr/sgr.html
Agency Sponsor: ASPE-OHP, Office of Health Policy
Federal Contact: Lynn Nonnemaker, 202-690-7807
Performer: National Opinion Research Center (NORC)
PIC ID: 8575
What is the Scope of the Health Care Fraud Problem that Using Electronic Health Records Can Help Reduce?
This study sought to enhance data quality in and develop anti-fraud requirements for electronic health records (EHRs). A panel of experts in the private and public sectors developed recommendations validated through public comment. Health care fraud has been a significant and growing concern for the country and fighting health care fraud is a priority for the Federal government and the private sector. The health care sector and the Federal Government continue to embrace interoperability and electronic health records to reduce medical errors and improve cost-effective delivery of care.
In 2005, the United States spent $2 trillion or 16 percent of its Gross Domestic Product, on health care. The National Healthcare Anti-fraud Association, a not-for-profit organization that has health care anti-fraud experts from both the public and private sectors noted that, although fraudulent claims were a small percentage of overall claims, they accounted for between 3 percent and 10 percent of total claim dollars, or a range of $60 to $200 billion dollars. Recommendations included the following:
- Require a standardized audit log that supports both security risk and anti-fraud management;
- Demonstrate the ability to generate and embed a document ID tracking number for patient chart outputs or exports, unique for each instance when a patient chart output or document is printed, electronically communicated, or otherwise exported from the electronic health record; and
- Require a traceable and auditable path from a claim payment or a transmission of a pay for performance payment to the clinical documentation supporting the claim.
Report Title: Enhancing Data Quality in Electronic Health Records,
Agency Sponsor: OS-ONC, Office of the National Coordinator for Health Information Technology
Federal Contact: Kathleen Fyffe, 202-205-0670
Performer: RTI International
PIC ID: 8579
How Widely Have Electronic Health Records Been Adopted?
The study estimated the extent of electronic health record (EHR) adoption in the United States. Leading health information technology experts examined studies and surveys of EHR adoption among physicians and hospitals. They also examined predictors of whether a provider would adopt use of EHRs; the gaps in adoption; how much adoption depended on location, practice size, specialty, or kinds of patients treated; and how the U.S. can collect more precise and timely data on adoption. Highlights included:
Developing of a standardized definition of adoption based on core functionalities. The team applied this definition to existing surveys to establish a baseline rate of 10 percent for adoption in the physician offices in the United States in 2006. The team also developed a national survey that was administered in 2007 that would allow calculation of future adoption rates.
Establishing approach to measure hospital adoption. There were not enough high-quality, reliable surveys of hospital use of EHRs. The team worked with experts to develop a set of questions which have been adopted by the American Hospital Association as part of their annual survey and will allow the government to measure future hospital adoption rates.
No existence of a digital divide. There remains considerable uncertainty about the existence and size of gaps in use of electronic health records among physicians who care for vulnerable populations. More needs to be done in tracking the adoption and use of EHRs among providers, understanding the unique barriers to adoption, and identifying policies to close these gaps.
Adoption depends on many factors: financial incentives and barriers, laws and regulations, the state of technology and organizational influences such as practice size, hospital or payer mix, and degree of health care system integration.
Report Title: Health Information Technology in the United States: The Information Base for Progress, http://www.rwjf.org/files/publications/other/EHRReport0609.pdf
Agency Sponsor: OS-ONC, Office of the National Coordinator for Health Information Technology
Federal Contact: Kathleen Fyffe, 202-205-0670
Performer: George Washington University with Harvard University and the Robert Wood Johnson Foundation
PIC ID: 8580
How Can State-Level Health Information Exchanges Advance Interoperability?
This project synthesized field research and provided recommendations for strengthening and expanding health information exchange (HIE), capitalizing on the important contributions of state-level initiatives. Nearly all states have these initiatives which are public-private collaborations that support interoperable health information exchange to reach state-wide goals for quality and cost-effective healthcare. State-level health information exchange organizations have demonstrated that they can effectively engage State governments and provide a mechanism to forge new collaborations for data sharing across regions and among organizations that have traditionally used data for competitive purposes. As a nationwide health information network is established, state-level initiatives are uniquely positioned to play ongoing roles, particularly in fostering state-wide collaboration, multi-stakeholder governance and multi-state coordination.
The project developed a framework for analyzing state-level HIE organizational access, use and control policies. The project provided recommendations on how to advance consistent polices among HIEs to enable data exchange between jurisdictions. The study found that State-level HIEs served as an important way to achieve state policy objectives, such as equitable health information access for underserved populations, and the implementation of intra-state health information exchange.
Study recommendations included the need for State governments to formally recognize state-level entities and empower them so that these entities can fully accomplish their unique roles. State-level HIEs contribute importantly toward improving the nation´s health care quality, value, and transparency.
Report Title: State-Level Health Information Exchange: Roles in Ensuring Governance and Advancing Interoperability, http://www.staterhio.org
Agency Sponsor: OS-ONC, Office of the National Coordinator for Health Information Technology
Federal Contact: Kathleen Fyffe, 202-205-0670
Performer: American Health Information Management Association´s Foundation of Research and Education (AHIMA/FORE)
PIC ID: 8593
Did Various Chronic Disease Treatment Programs Perform Cost Effectively, Improve Quality, and Satisfy Patients and Providers?
This biennial evaluation of the Medicare Coordinated Care Demonstration sought to determine whether 15 demonstration programs of care coordination for chronically ill fee-for-service beneficiaries improved health outcomes and reduced Medicare costs for targeted groups of beneficiaries. The evaluation addressed several questions: was the demonstration cost effective; was quality of health care services improved; and were beneficiaries and health care providers satisfied with the care rendered?
Over the course of the first 25 months, the programs individually and collectively did not demonstrate changes in either savings or costs. However, because of the relatively small sample sizes and substantial chance of variation in costs from year-to-year, it is possible that the some programs be cost neutral. Although patients in the demonstration programs reported receiving education about their condition and treatment regimen, no statistically significant differences between treatment and control groups were found. Physicians and patients were highly satisfied with the demonstration programs. Overall, 67 percent of physicians believed that demonstration program interventions improved quality of patient care, and 80 percent reported that they would recommend the program to colleagues. Patients across all programs reported appreciation of the increased attention and coordination of services by the registered nurse care managers.
Since improvement in chronic disease care takes time to translate into better health outcomes and lower costs, 25 months is likely too short a span to see the maximum impact of such programs on costs and outcomes, and longer follow-up is needed. In 2005, it was decided to continue 11 of the 15 programs until 2008 in order to attain sufficient follow up data, on a greater number of enrollees, to make an informed assessment of the outcomes of the program.
Report Title: Second Report to Congress on the Evaluation of the Medicare Coordinated Care Demonstration, http://www.cms.hhs.gov/reports/downloads/Brown.pdf
Agency Sponsor: CMS-ORDI, Office of Research, Development, and Information
Federal Contact: Magee, Carol, 410-786-6611
Performer: Mathematica Policy Research; Washington, DC
PIC ID: 8687
How Can Diagnostic-Related Service Classifications Be Used in the Inpatient Prospective Payment System?
This study sought ways to improve Medicare payment accuracy and equity. The study evaluated alternative systems that might be used under the prospective payment system to classify discharges. This was done to support assessment of potential refinements in severity-adjusted diagnosis-related groups (DRG).
The study analyses focused on: 1) how well each classification system explained variation in resource usage; 2) whether the groupings had validity and stability; and 3) were the groupings manageable, administratively feasible and understandable? The study evaluated alternative severity-adjusted diagnosis-related grouping systems and evaluated alternative methods for determining diagnosis-related group relative weights and assessed the payment implications of the alternative methodologies.
Each severity-adjusted DRG system evaluated improved the explanatory power of the DRGs compared to the Centers for Medicare and Medicaid Services´ DRGs without severity adjustments. However, there was a trade-off between improved explanatory power and other evaluation criteria, such as validity, reliability, complexity, and potential for coding increase. No single system outperformed all others on all criteria.
Report Title: Evaluation of Severity Adjusted DRG Systems, http://www.cms.hhs.gov/Reports/Reports/itemdetail.asp?itemID=CMS1197292Agency Sponsor: CMS-ORDI, Office of Research, Development, and Information
Federal Contact: Philip Cotterill, 410-786-6598
Performer: Rand Corporation
PIC ID: 8588
How Can Medical Inpatient Cost Estimates Be Improved?
Researchers examined how to improve Medicare inpatient hospital discharge cost estimates in order to construct better diagnostic-related group relative weights. These weights largely determine how much Medicare pays for hospital stays under the inpatient hospital prospective payment system. The study sought to improve how well charges were adjusted to costs and reduce "charge compression" (hospitals´ tendency to mark up high cost items less than low cost items).
The analyses confirmed that charge compression and other aggregation-related problems may bias the new cost-based diagnostic-related group weights, and that refinements to the cost-to-charge ratios can reduce that bias. A number of options could improve the accuracy and precision of the cost-to-charge ratios derived from the Medicare cost report, and also reduce the need for statistically-based adjustments.
The options can be divided according to whether they can be implemented over short, medium or long-term time frames. Short-term measures include tighter editing of cost reports from providers with extreme cost-to-charge ratios and revisions of cost report instructions to improve the matching of costs and charges. Longer-term changes could include revisions to the charge groupings in the Medical Provider Analysis and Review (MedPAR) file data (a data base of all Medicare beneficiaries who use inpatient services) and the addition of new cost centers on the Medicare cost report that would permit the calculation of more accurate cost-to-charge ratios.
Report Title: A Study of Charge Compression in Calculating DRG Relative Weights, http://www.cms.hhs.gov/reports/downloads/dalton.pdf
Agency Sponsor: CMS-ORDI, Office of Research, Development, and Information
Federal Contact: Philip Cotterill, 410-786-6598
Performer: RTI International
PIC ID: 8589
What Can Health Plans Do to Reduce Healthcare Disparities among Racial and Ethnic Minority Enrollees with Diabetes?
The evaluation examined the impact of the National Health Plan Collaborative. The National Health Plan Collaborative is a group of 11 national and regional health plans, the Center for Health Care Strategies, RAND, and two sponsors (the Robert Wood Johnson Foundation and the Agency for Healthcare Research and Quality). The objective of the program was to help the health plans in the collaborative reduce disparities in diabetes care between minorities and whites, improve the plans´ abilities to measure disparities, test and measure disparity reduction interventions, and communicate outcomes within the Collaborative and to other health plans. As part of the evaluation, members of the Collaborative were asked to perform assessments themselves, other organizations in the Collaborative, and their relationships to one another.
The evaluation found that the Collaborative enhanced plans´ efforts to pursue disparity reduction work. Activities included sharing best practices for collecting race and ethnicity from health plan enrollees. For example, one plan hosted a Web-based seminar to demonstrate how the plan used a web-based approach to collect race/ethnicity data. External experts in race and ethnicity data collection had videoconferences with the Collaborative members, and employer groups discussed how they could partner with health plans to better address disparities in health care. The plans had differing views regarding the validity of collecting race/ethnicity/language data directly versus using indirect methods, such as geocoding or surname analysis. Some plans developed and tested pilot interventions dealing with patients, providers, or the community to reduce disparities, and shared results with the Collaborative. Health plans, support organizations and sponsors viewed positively the communication of outcomes outside the Collaborative. The Collaborative expects to release a toolkit of interventions and other information to help reduce healthcare disparities by September 2008.
Report Title: Evaluation of a Learning Collaborative's Process and Effectiveness to Reduce Health Care Disparities among Minority Populations. Report may be obtained from Federal Contact
Agency Sponsor: AHRQ, Agency for Healthcare Research and Quality
Federal Contact: Cynthia Palmer, 301-427-1441
Performer: Mathematica Policy Research, Inc.
PIC ID: 8591
Does the Pharmaceutical Outcomes Portfolio, Including the Centers for Education and Research on Therapeutics, Achieve Its Goals?
This study examined whether the work of the Centers for Education and Research on Therapeutics, the Coordinating Center and its grantees, influenced achievement of the Pharmaceutical Outcomes Portfolio goals and contributed to the sponsoring agency´s mission. These goals and mission included enhancing patient, provider, and policy maker understanding of the safety of drugs, biologic products, and medical devices. The study included social network analysis, site visits and telephone discussions with stakeholders and grantees, document review, case studies, and appreciative inquiry.
The study confirmed that the Pharmaceutical Outcomes Portfolio goals provided a good fit with the mission of the Agency for Healthcare Research and Quality to improve the quality, safety, efficiency, and effectiveness of healthcare for all Americans. The Portfolio contributed to progress toward those goals. The program contributed to patients´, providers´, and policy makers understanding of the safety of drugs, biological products, and medical devices. These contributions were achieved through research and education programs that focused on understanding and communicating objective information about the risks and benefits of therapeutic agents used in treatment.
Report Title: Evaluation of AHRQ's Pharmaceutical Outcomes Portfolio. Report may be obtained from Federal Contact
Agency Sponsor: AHRQ, Agency for Healthcare Research and Quality
Federal Contact: Scott Smith, 301-427-1511
Performer: Abt Associates Inc
PIC ID: 8594
How Build a Nationwide Health Information Network?
This study examined the success of four contracts designed to develop prototype architectures for a Nationwide Health Information Network (NHIN), a "network of networks," for electronic exchange of health information. An interoperable health information technology depends on progress toward architectures that securely connect consumers, providers and others who have or use health-related data services and that protect health information confidentiality.
The NHIN will use shared architecture (services, standards and requirements), processes and procedures to interconnect health information exchanges and the users they support. Each of the four contractors was asked to interconnect three communities to demonstrate its prototype architecture. The contracts each:
- Operated the NHIN as a network of networks without a central database or services;
- Assured critical common standards, particularly in the way that component exchanges interact with each other;
- Achieved synergies and important capabilities by supporting consumers and health care providers on the same infrastructure;
- Implemented consumer controls to manage how a consumer´s information is shared on the network; and
- Benefited from an evolutionary approach that does not dictate wholesale replacement or modification of existing healthcare information systems.
Features of the synthesis of approaches of the four prototypes included core services related to data, consumer preferences, identity management for providers and consumers, and security and system management.
Report Title: Summary of the NHIN Prototype Architecture Contracts: A Report for the Office of the National Coordinator for Health IT; http://www.hhs.gov/healthit/healthnetwork/resources/summary_report_on_nhin_Prototype_architectures.pdfAgency Sponsor: OS-ONC, Office of the National Coordinator for Health Information Technology
Federal Contact: Kathleen Fyffe, 202-205-0670
Performer: Gartner
PIC ID: 8595
What Are the Care Pathways for Individuals Hospitalized with Congestive Heart Failure and Individuals Entering Nursing Homes?
This longitudinal study examined patterns of long term care of elderly beneficiaries with likely long-term care needs; the progress of groups of beneficiaries with similar health/functional status who remained in the community or who moved from the community to institutional settings; and the progress of those already within institutional settings. The study assessed the progress of beneficiaries with similar medical conditions, functional status, and long-term care needs through the health-care delivery system. It examined how insurance coverage, types of services used, processes leading to institutionalization, and costs of care, influenced the care provided.
The project obtained and constructed analytic files for two population cohorts for longitudinal analysis. The first consisted of elderly experiencing their first hospitalization for congestive heart failure (CHF) and used several years´ worth of Medicare enrollment data, all available Medicare Parts A and B claims data, nursing home patient assessment records, and area-level files. The second, using Medicare and Medicaid data consisted of elderly Medicare beneficiaries newly admitted to a nursing home in Minnesota and New Jersey (from either the community or continuing on after a Medicare-covered skilled stay).
For the CHF cohort, survival rates showed greater decline over time for older persons and persons with multiple co-morbidities. Older persons and persons with multiple co-morbidities had a shorter time to CHF re-hospitalization. Persons with multiple co-morbidities had higher total Medicare spending. Time to nursing home entry was shorter for older CHF patients. For the nursing home entrant cohort, about 43 percent survived after 36 months in each state. Fifty percent of the cohort members entered Medicaid within 36 months. Hospitalization rates and Medicare Part A spending were substantially higher in New Jersey than in Minnesota. High levels of co-morbidities increased mortality risk and hospitalization risk. Persons with lower cognitive status were more likely to enroll in Medicaid and have higher Medicaid expenditures.
Report Title: Examining Long-Term Care Episodes and Case History for Medicare Beneficiaries, http://158.74.242.66/pic/login/dataentry/link_page8605.html
Agency Sponsor: CMS-ORDI, Office of Research, Development, and Information
Federal Contact: William J. (Bill) Buczko, 410-786-6593
Performer: Urban Institute
PIC ID: 8605
How Appropriate Are Medicare Drug Coverage Risk-Adjustments for the Disabled and Low-Income Subsidy-Eligible Persons?
This project continued research on drug risk adjustment originally designed to supplement Federal Employee Health Benefit Program (FEHBP) data used to develop the initial drug risk adjusters. Drug risk-adjustment is the process by which payments to drug insurance plans are adjusted to take into account the higher costs of individuals who have expensive medical conditions which require greater use of pharmaceuticals in order to neutralize incentives for drug plans to enroll only healthy individuals with low drug utilization in order to maximize profits.
There were known deficiencies in the FEHBP data. For example, the data set was not nationally representative, it had few Medicaid, disabled or low-income representatives and it reflected a relatively well insured population prior to age 65. Researchers matched Medicare and Medicaid data for dually eligible individuals for the same year the FEHBP data was available and looked at the utilization patterns for the low-income, institutionalized, and disabled. These patterns were used by Medicare actuaries to develop risk adjustment weights for low income and disabled populations.
Further efforts were made to merge the Medicaid data with the FEHBP data so that the drug prices in each database were on the same scale and so that direct calculations of the relative drug costs for each population subgroup could be made. The initial study of the geographic variation of drug utilization and price patterns by State was expanded to look at the drug regions established by HHS and other factors such as urban-rural areas of States. The study examined what could be learned from drug utilization data to improve a prospective diagnostic-based drug risk adjustment model. (For example, if only people with diabetics used insulin, how much could the risk adjustment model be improved if information on insulin use was available, but diabetes was not coded in the diagnostic data?)
The study yielded some important patterns which were unexpected, e.g., drug use was higher per capita in areas with fewer physicians. The data were not strong enough to warrant a policy change in the absence of Part D data. Finally, the prior use study concluded that additional data could improve the prospective risk adjustment model. Care would have to be taken that prior-use was not substituted for diagnostic data––a fine line that might be difficult to maintain.
Report Title: Continuation of Drug Risk Adjustment, http://aspe.hhs.gov/health/reports/06/drugcontinuation/index.htm
Agency Sponsor: ASPE-OHP, Office of Health Policy
Federal Contact: George Greenberg, 202-690-7794
Performer: National Opinion Research Center (NORC)
PIC ID: 8623
To What Extent do Medicaid State Plans and Home and Community-Based Services Waivers Cover Assistive Technology and Home Modification Services?
This study examined the nature and scope of home modification and assistive technology services which States make available to Medicaid-eligible adults. The study provides Federal and State policymakers with basic information for planning and policy development. It provides stakeholders and consumers with valuable information about how these two services are covered by Medicaid State plans or through home and community-based services (HCBS) waivers.
Almost every HCBS waiver lists assistive technology and home modification as a covered service. Medicaid State plans limited what they included under these categories. Considerable variation exists in how States define and refer to the two services. Most waivers, and some State plans, offer service coordination or case management to recipients in order to facilitate access to these key services, and both types of Medicaid services used health professionals (such as therapists) to assess recipient needs. The majority of State plans require physician orders for both services; while only half of the waiver programs listed that as a requirement. Almost all Medicaid State plans use "medical necessity" criteria when determining coverage for assistive technology and home modification services, and half of the HCBS waivers studied used these criteria. Almost all Medicaid State plans and waivers studied required prior authorization of some sort for these services. State HCBS waiver programs used multiple mechanisms to limit or restrict waiver expenditures, whereas Medicaid State plans had few limits (but less extensive coverage for these services).
Report Title: Compendium of Home Modification and Assistive Technology Policy and Practice Across the States: Final Report, http://aspe.hhs.gov/daltcp/reports/2006/HM-ATI.htm
Agency Sponsor: ASPE-ODALTCP, Office of Disability, Aging, and Long-Term Care Policy
Federal Contact: Gavin Kennedy, 202-690-6443
Performer: Abt Associates Inc.
PIC ID: 8654
What Are the Costs and Benefits of Biologic Therapies for Treating Rheumatoid Arthritis?
Under this study, the costs and health benefits to Medicare beneficiaries of four biologics used to treat rheumatoid arthritis were analyzed. The Medicare Replacement Drug Demonstration expanded coverage of selected biologic drugs, including those used for rheumatoid arthritis patients. The study included a cost-utility analysis of a decision model. Data sources included meta-analysis of randomized controlled trials and data from the National Data Bank for Rheumatic Diseases, a large longitudinal outcomes data source. The target population was Medicare beneficiaries with rheumatoid arthritis for whom a previous biologic drug had not failed. The Medicare interventions tested were: etanercept , adalimumab , anakinra and infliximab. Outcomes measured included costs, quality adjusted life years, and incremental cost effectiveness ratios.
Anakinra was the least effective and least costly strategy. Etanercept, adalimumab and infliximab were similar in terms of effectiveness but infliximab was more costly. At a threshold cost effectiveness ratio of $50,000 per quality-adjusted life year, the probability that infliximab would be cost effective relative to the other biologics is less than 1 percent. The findings were robust to a range of sensitivity analyses. Only if the dose of infliximab remained constant over time would this likely be a cost effective strategy. The analysis also considered whether it was cost effective to move to another biologic after failed response with one biologic (sequential use). Etanercept or adalimumab were cost effective compared to infliximab whereas anakinra was a less effective alternative.
Report Title: The Cost Effectiveness of Etanercept, Adalimumab, and Anakinra in Comparison to Infliximab in the Treatment of Patients with Rheumatoid Arthritis in the Medicare Program, http://www.cms.hhs.gov/DemoProjectsEvalRpts/downloads/MMA641_Rheumatoid_Arthritis.pdfAgency Sponsor: CMS-ORDI, Office of Research, Development, and Information
Federal Contact: Penny Mohr, 410-786-6502
Performer: Sheffield University School of Health and Related Research
PIC ID: 8656
What is the Cost-effectiveness of Disease-Modifying Therapies for Treating Multiple Sclerosis?
Researchers developed a mathematical model to estimate the cost-effectiveness of interferon beta and glatiramer acetate compared to the best supportive care in the management of multiple sclerosis in the United States. Interferon beta and glatiramer acetate have demonstrated clinical efficacy in the treatment of relapsing-remitting and secondary progressive multiple sclerosis. With healthcare resources scarce, the value these therapies represent should be considered. Natural history data were drawn from a large longitudinal cohort study. Researchers synthesized the evidence on clinical effectiveness for these therapies using Bayesian techniques. Quality of life evidence was drawn from a study of patients with multiple sclerosis in Nova Scotia. Resource use and cost data were drawn from the Sonya Slifka database and associated literature.
When based upon placebo-controlled evidence only, the cost-effectiveness of interferon beta and glatiramer acetate was expected to be $104,000-$332,000 per quality-adjusted life year gained. When evidence from the head-to-head trials was incorporated into the analysis, the cost-effectiveness was expected to be less favorable. When patients were assumed to stop therapy upon disease progression the cost-effectiveness of disease-modifying therapy was notably improved. In conclusion: evidence surrounding the effectiveness and cost-effectiveness of interferon beta and glatiramer acetate was subject to considerable uncertainty. Further research is required to examine the long-term effectiveness of these therapies.
Report Title: A Cost Effectiveness Model of Disease Modifying Therapies for the Treatment of Multiple Sclerosis, http://www.cms.hhs.gov/DemoProjectsEvalRpts/downloads/MMA641_Multiple_Sclerosis.pdfAgency Sponsor: CMS-ORDI, Office of Research, Development, and Information
Federal Contact: Penny Mohr, 410-786-6502
Performer: Sheffield University School of Health and Related Research
PIC ID: 8657
How Does the Medicare Replacement Drug Demonstration Affect Patient Access to Care, Health Outcomes, and Medicare Cost-Effectiveness?
The study examined the impact of the Medicare Replacement Drug Demonstration on patient access to care and patient outcomes, and analyzed its impact on Medicare spending, detailing cost savings to Medicare due to reduced physicians´ services and hospital outpatient department services for administration of replaced drugs. Over 42,000 Medicare beneficiaries enrolled in the Demonstration.
The demonstration served a financially-vulnerable population and improved drug insurance coverage and reduced financial burden for a majority of participants. About 40 percent of participants qualified for Federal subsidies under the program with limited cost-sharing obligations. Unexpectedly, the demonstration did not provide new access to drug therapy to most participants. An estimated 62 to 76 percent of demonstration participants had been using medications covered under the demonstration prior to enrollment. Perceived improvements in health or symptoms were sometimes marked for beneficiaries who had been prior users of Part B replaceable drugs or who had been using some other non-demonstration covered drug to treat their condition prior to enrollment. The clinical reviews conducted for this evaluation found that the demonstration provided coverage for many life-extending or quality-enhancing advances in treatment relative to those covered under Part B. For the majority of early enrollees who had previously been using drugs covered under the Demonstration, the demonstration´s probable impact on health outcomes was modest. For the minority of participants who substituted Medicare replacement drugs for Part B drugs, the demonstration offered several economical alternatives for treatment, as intended. Medicare spending increased over the 16-month program. Savings due to reduced physicians´ services and hospital outpatient department services for administration of replaceable drugs were small since few demonstration participants would have been Part B drug users in absence of the demonstration.
Report Title: Report to Congress: Evaluation of the Medicare Replacement Drug Demonstration, http://www.cms.hhs.gov/DemoProjectsEvalRpts/downloads/MMA641_RTC.pdfAgency Sponsor: CMS-ORDI, Office of Research, Development, and Information
Federal Contact: Penny Mohr, 410-786-6502
Performer: Penny Mohr
PIC ID: 8658
Do Early Implementation Costs and Quality Meet Expectations in the Medicare Health Support Program?
This study reviewed the scope of the Voluntary Chronic Care Improvement Programs under Traditional Fee-for-service Medicare, their design and early implementation experience, as well as preliminary cost and quality findings through the first six months of operation.
These programs have been implemented under the name Medicare Health Support. Eight organizations initiated care management programs in different regions, 2005-2006. In each region, approximately 30,000 Medicare beneficiaries with heart failure or diabetes were identified as eligible; 20,000 were offered the intervention and 10,000 served as a comparison population. The population selected was frail, with multiple co-morbidities and high utilization of health care services. The organizations varied in how they engaged beneficiaries and met their needs. Participation rates in the first six month period ranged from 65 percent to 92 percent. Participating beneficiaries tended to be a healthier subset of the intervention group.
Within the first six months of operations the programs made only modest progress toward achieving targets for savings to the Medicare program, far less than their management fees. It was too early to assess the programs´ impact on clinical quality or beneficiary satisfaction. A report containing additional findings will be available in 2008.
Report Title: Evaluation of Phase I of Medicare Health Support (Formerly Voluntary Chronic Care Improvement) Pilot Program Under Traditional Fee-for-Service Medicare: Report to Congress, http://www.cms.hhs.gov/Reports/Downloads/McCall.pdf
Agency Sponsor: CMS-ORDI, Office of Research, Development, and Information
Federal Contact: Mary Kapp, 410-786-0360
Performer: RTI International
PIC ID: 8662
How Do Patients and their Caregivers Regard Medical Device Recalls and Safety Information?
This qualitative focus group study with patients and caregivers of patients who used medical devices explored their perceptions and opinions about medical device recalls and safety information. The research explored: reactions to and perceptions of the term "recall" as it relates to medical devices; reactions to and perceptions of alternative signal words; personal real-world experiences with medical device recalls; and perceptions of the ideal recall communication process. Six focus groups met and included patients and caregivers of patients who had implantable cardioverter defibrillators (ICDs) and pacemakers, implanted devices other than ICDs and pacemakers, and non-implanted devices.
A key finding included the group´s reaction to the term "recall." The term elicited many different emotions --- from anxiety, anger, and distrust; to the more benign feelings of "cautious" and "need more information." The term conveyed to patients the need to call their doctor or manufacturer to find out how they were affected. Most equated recall with "replace." Emotional reaction to the word "recall" varied by device type. Participants with ICDs and pacemakers were relatively composed on the subject of recalls, because they are well informed about their device and well monitored by their physicians. Non-implant participants felt that consequences of a recall would not be as severe and that they could just stop using their devices. Those with devices that were more critical wanted to know what they should do. Participants with implanted devices other than ICDs/pacemakers were the most upset by the recall discussion. They were the least likely to know the manufacturers of their devices, and they were not uniformly confident their doctor would contact them about a recall. Another key finding from the study included reaction to alternative signal words. The terms "recall," "urgent product danger," "urgent product warning" and "urgent public safety warning" all indicated the need to call the doctor or manufacturer immediately. Other terms such as "safety alert" and "safety advisory" indicated a less urgent message. Most participants said that ideally, device recall information should be distributed through multiple channels: manufacturer, doctor, and media. Participants most wanted information about the severity and potential health risks, device model numbers, symptoms, next steps, contact information, and potential costs.
Report Title: Findings from Six Focus Groups on Medical Device Safety Communications, Report may be obtained from Federal Contact
Agency Sponsor: FDA, Food and Drug Administration
Federal Contact: Paula Silberberg, 240-276-3234
Performer: House Market Research/Edge Research
PIC ID: 8697
Does the Partnerships for Quality Program Improve the Rate of Research Translation and Quality?
This evaluation identified what Partnerships for Quality grantees sought to do, to what extent they succeeded, whether the partnerships contributed to grantee success accelerating the translation of research and evidence-based guidelines into practice, and how the funding agency´s infrastructure and program components contributed to this success. The Partnerships for Quality program aims to accelerate the translation of research findings into practice on a broad scale through partnerships led by organizations positioned to reach end users. The evaluation, largely qualitative in nature, involved document reviews, interviews, and observations of Council of Partners meetings. Researchers identified key participants and their linkages, and each participant´s critical questions. The framework included relevant tasks, decisions, and communications that each program component had to execute for the Partnerships to achieve their goals. The Partnerships for Quality provided grants to apply evidence-based practices to improve quality of health care and the health care system's readiness to address bioterrorism preparedness.
The Partnerships appeared to make a difference in health care by improving quality of care processes and outcomes for many. Additionally, quality of security and safety in some of the targeted health care organizations was also improved. Success depended on effective partnerships and working relationships among the lead grantee organizations, key collaborators and target organizations/providers. Participants who contributed to the success of grantee efforts were sponsoring agency leaders, program director, and grant management staff. Partnerships for Quality grantees did not have the scale of impact originally expected by program developers, or anticipated in the program announcement. Expectations were somewhat unrealistic, given the nature of the grants funded and the scale of the projects' goals. However, many grantees attained substantial accomplishments and generated lessons highly relevant to translating research into practice.
Report Title: Evaluation of AHRQ's Partnerships for Quality Program, Report may be obtained from Federal Contact
Agency Sponsor: AHRQ, Agency for Healthcare Research and Quality
Federal Contact: Charlotte Mullican, 301-427-1495
Performer: Mathematica Policy Research, Inc.
PIC ID: 8807
What Current and Future Market Exists for Quality Indicators?
The study examined the market for Agency for Healthcare Research and Quality (AHRQ) quality indicators and quality measurement tools developed by other organizations, reviewed the ways quality indicators are used by various organizations, and assessed the demand for these indicators. The study conducted interviews with individuals who use quality indicators to understand how and why the AHRQ indicators were used, what improvements users wanted, and why some organizations chose not to use them.
The study found that:
- The AHRQ quality indicator programs filled a unique niche in the quality indicators´ market since there were no other sources of hospital care quality indicators that represented both a national standard and were also publicly available, transparent, and based on administrative data;
- The range of different uses for quality indicators included public reporting, quality improvement/benchmarking, pay-for-performance, and research; and
- 114 national entities used quality indicators, and a limited review of international uses identified the Organization for Economic Cooperation and Development's Health Care Quality Indicators Project, as having conducted preliminary discussions that indicated an interest in using quality indicators internationally.
Future activities should explore ways to discourage non-transparent alterations to the quality indicator specifications in proprietary measurement tools, and indicators should receive continued support. They have an important and unique position in quality management. Users of quality indicators indicated the need for improvements in the current product line, additions of new product lines, and improved support for quality indicator products.
Report Title: Evaluation of the Use of AHRQ and Other Quality Indicators. Report may be obtained from Federal Contact
Agency Sponsor: AHRQ, Agency for Healthcare Research and Quality
Federal Contact: Mamatha Pancholi, 301-427-1470
Performer: Rand Corporation
PIC ID: 8743
Does AHRQ Contribute to Child Health Policies, Clinical Practice, and Outcomes by Developing and Disseminating Knowledge?
This study assessed the extent to which the Agency for Healthcare Research and Quality: contributed and disseminated or translated new knowledge; improved clinical practice and health care outcomes; influenced health care policies with its children's healthcare activities; provided support for children's health activities; and involved children's health care stakeholders or created partnerships to fund and disseminate key child health activities.
Researchers developed a database of child health activities; identified publications derived from and the funding associated with these activities; sorted activities into categories and coded the resulting publications according to potential impact, determining the number of times the publications had been cited, and recording the impact factor of the journal in which the publication had appeared; and identified case studies and interviewed individuals and stakeholders associated with these studies.
AHRQ contributed a substantial body of new knowledge as a result of its funding for children's health research (extramural and intramural) and has disseminated this new knowledge effectively in the peer review literature. Bibliometric analysis, case studies, and key stakeholder interviews suggest that AHRQ´s child health care activities, along with other child health stakeholders, have played an important role in improving clinical practice and health care outcomes and in influencing specific health care policies. Interviews and case studies showed that although individual Agency staff performed heroically in assuring continued support for child health activities, there was a lack of authority or resources devoted to children's health that has limited Agency support for children's health research. AHRQ has pursued numerous connections with others, but primarily through participation on committees and task forces. AHRQ had mixed success involving children's health care stakeholders and/or creating partnerships to fund and disseminate key child health activities.
Report Title: Evaluation of AHRQ's Children's Health Activities. Report may be obtained from Federal Contact
Agency Sponsor: AHRQ, Agency for Healthcare Research and Quality
Federal Contact: Francis Chesley, 301-427-1449
Performer: Rand Corporation
PIC ID: 8745
What Progress Has Been Made Collecting, Classifying, and Analyzing Safety Data Across NIH-Sponsored Clinical Trials?
Researchers examined current safety data collection standards and processes, including classification and analysis across several investigational sponsored clinical trials. They developed strategies for harmonizing data collection and reporting to facilitate data sharing and evaluation across NIH-sponsored studies. The evaluation focused on issues underlying the cross-trial analysis of cerebro- and cardio-vascular risks associated with celecoxib use in six clinical studies. The working group for this collaborative effort involved National Cancer Institute, Brigham and Women´s Hospital´s Clinical Endpoint Committee, Statistics Collaborative, Inc, and CCS Associates.
Researchers developed two Manuals of Operations which defined the scope of the project and provided details pertaining to the processes for data standardization and harmonization as well as document collection, database development, event adjudication, data analysis, and data distribution. Plans were collected and reviewed for all six studies.
All of the plans met FDA and/or NIH requirements though none included provisions for real-time access to data for safety or other analyses. With advances in technology and accessibility to secure and web-based electronic data management systems containing investigational safety data, such objectives may be achieved.
Report Title: Evaluation of the Process for Collection, Classification, and Analysis of Safety Data Across NIH-sponsored Clinical Trials (CTSA). Report may be obtained from Federal Contact
Agency Sponsor: NIH, National Institutes of Health
Federal Contact: Ernest Hawk, MD, 301-496-8537
Performer: CCS Associates
PIC ID: 8748
What Causes Obesity Among American Indians/Alaska Natives; How to Prevent It?
The purpose of this study was to provide information to help understand the high rates of obesity among American Indians and Alaska Natives, the nature of preventive interventions, and activities pertaining to obesity undertaken by Federal agencies. This was a review of research findings on the prevalence, determinants and consequences of obesity, and the nature and outcomes of clinical and community-based interventions.
Among the findings were that the prevalence of overweight and obesity in American Indian/Alaska Native preschoolers, school-aged children and adults was higher than rates for the total U.S. population. However, there were both regional and tribal variations in prevalence. Determinants included nutrition and diet, physical activity as well as socioeconomic, genetic, and psychosocial factors. Reviews of school and community-based interventions found no significant changes in youth overweight/obesity, but did find changes in knowledge, attitudes or behaviors. Suggestions for future research included studies that identify at-risk groups that can be targeted for early intervention, family processes and behaviors contributing to obesity, and nutrition and physical activity patterns among American Indian/Alaska Native children.
Report Title: Obesity and American Indians/Alaska Natives, http://aspe.hhs.gov/hsp/07/AI-AN-obesity/
Agency Sponsor: ASPE-OHSP, Office of Human Services Policy
Federal Contact: Peggy Halpern, 202-260-0285
Performer: Staff of Office of the Assistant Secretary for Planning and Evaluation
PIC ID: 8759
How Identify End Stage Renal Disease Facilities Needing Quality Improvement?
Researchers assessed the availability of data that End Stage Renal Disease (ESRD) Networks can use to identify quality improvement needs of end stage renal disease care facilities. Researchers limited the scope of their study to data available to Networks, because Networks are, legislatively and contractually, the primary entities responsible to oversee quality improvement. Patients with ESRD rely on dialysis treatment to compensate for kidney failure. To help monitor and improve quality of care, CMS oversees ESRD facilities through contracts with State survey and certification agencies and ESRD Networks.
Researchers analyzed information from three sources: data that measured the quality of care provided by ESRD facilities available to all Networks, documentation regarding how Networks use quality of care data to identify facilities with quality improvement needs, and structured interviews with all Networks and CMS staff responsible for the oversight of quality improvement in ESRD facilities. Researchers considered whether Networks could use the data to identify quality improvement needs for specific facilities, whether comprehensive quality data was provided, and whether the information was current.
The study concluded that each source of data has limitations. CMS began to provide a streamlined source of data that could assist Networks to identify facilities with quality improvement needs.
Report Title: Availability of Quality of Care Data in the Medicare End Stage Renal Disease Program, http://oig.hhs.gov/oei/reports/oei-05-05-00300.pdf
Agency Sponsor: OS-OIG, Office of Inspector General
Federal Contact: Claire Barnard, 202-205-9523
Performer: Office of Inspector General
PIC ID: 8770
Do Medicare Carriers Correctly Calculate Copayments for Mental Health Services Rendered to Those With Alzheimer's Disease?
This study determined the extent to which Medicare carriers: consistently calculated beneficiary copayments for mental health services and correctly calculated copayments for mental health services rendered to beneficiaries diagnosed with Alzheimer's disease or related disorders. Researchers surveyed (by mail, telephone, and e-mail) the carriers and analyzed a one-percent sample of claims for the Medicare National Claims History for services rendered from 2001 through 2004. Researchers reviewed all relevant statutes, regulations, and Federal guidance.
In some areas beneficiary copayments for the same mental health service were more than double what they were in other areas. Carriers´ payment policies were inconsistent; they did not uniformly apply the outpatient mental health treatment limitation. Carriers overstated copayments for beneficiaries with Alzheimer's disease and related disorders by approximately $27 million during the 4-year period analyzed.
Report Title: Carrier Determination of Copayments for Medicare Mental Health Services, http://oig.hhs.gov/oei/reports/oei-09-04-00221.pdf
Agency Sponsor: OS-OIG, Office of Inspector General
Federal Contact: Claire Barnard, 202-205-9523
Performer: Office of Inspector General
PIC ID: 8771
Do States Meet Federal Fraud and Abuse Prevention Requirements for State Children's Health Insurance Programs?
The study assessed the extent to which six States that had a State Children's Health Insurance Program (SCHIP): established methods and procedures that met Federal fraud and abuse prevention, detection, and investigation requirements; assessed these States' oversight of SCHIP contractors; and assessed oversight by CMS of States regarding these functions. Federal and State governments jointly fund SCHIPs to provide health care assistance to low-income children who do not qualify for Medicaid. States must establish safeguards against fraud and abuse. Little is known about the arrangements they have made to do so.
The States met requirements for prevention and detection of fraud and abuse by assigning responsibility to SCHIP contractors that had established such procedures. One of the States had not met Federal requirements for investigating suspected SCHIP fraud and abuse cases and referring cases to law enforcement. Although oversight mechanisms in the States addressed Federal requirements, they did not always enable States to know how well health plans were performing safeguard activities. CMS relied primarily on States for oversight of SCHIP fraud and abuse safeguards, although it has completed some onsite reviews of States.
Report Title: Fraud and Abuse Safeguards in Separate State Children's Health Insurance Programs, http://oig.hhs.gov/oei/reports/oei-06-04-00380.pdf
Agency Sponsor: OS-OIG, Office of Inspector General
Federal Contact: Claire Barnard, 202-205-9523
Performer: Office of Inspector General
PIC ID: 8774
At What Rates do Quality Improvement Organizations Identify and Respond to Quality-of-Care Concerns?
This study determined how extensively Quality Improvement Organizations (QIOs) identified quality-of-care concerns through medical record reviews and what interventions they took in response to confirmed concerns. QIOs comprise medical professionals working with health care providers on quality improvement initiatives and reviewing medical records to ensure that care meets professional standards. QIOs review medical records for quality, payment, utilization, or non-coverage concerns. Researchers analyzed QIO-reported case review data for all cases that QIOs selected for review between 2003 and 2006. Researchers reviewed documentation and interviewed staff from three QIOs.
QIOs recommended corrective actions in about 4,500 of the over 300,000 cases initially selected for review during the study period. QIOs reviewed for quality of care about 11 percent of the cases, confirmed a quality concern in about 19 percent of these reviewed cases, and recommended corrective actions in 72 percent of the cases with a confirmed quality concern. This amounted to 1.5 percent of the cases reviewed.
Report Title: Quality Concerns Identified Through Quality Improvement Organization Medical Record Reviews, http://oig.hhs.gov/oei/reports/oei-01-06-00170.pdf
Agency Sponsor: OS-OIG, Office of Inspector General
Federal Contact: Claire Barnard, 202-205-9523
Performer: Office of Inspector General
PIC ID: 8776
Were Medicaid Payments for Pediatric Dental Services Appropriate?
This study assessed the appropriateness of Medicaid payments for pediatric dental services during the calendar year 2003 in five States. Improper Medicaid payments for dental services have been identified periodically by State Medicaid Fraud Control Units (MFCUs). In 2004, a MFCU investigation determined that dentists were reimbursed $4.5 million for unnecessary dental services. In 1967, Congress established the Early and Periodic Screening, Diagnostic, and Treatment (EPSDT) program under Medicaid to ensure that children and youth received routine and preventive health care services. To meet the EPSDT requirements, States must provide routine services to children and youth, even if these services are not available to other needy populations in the State's Medicaid program. In this study, researchers examined a stratified random sample of Medicaid pediatric dental services to determine whether the services met requirements for proper documentation, billing, and medical necessity.
Thirty-one percent of Medicaid pediatric dental services in the five States resulted in improper payments. Documentation errors accounted for the largest amount of improper payments in all five States.
Report Title: Improper Payments for Medicaid Pediatric Dental Services, http://oig.hhs.gov/oei/reports/oei-04-04-00210.pdf
Agency Sponsor: OS-OIG, Office of Inspector General
Federal Contact: Claire Barnard, 202-205-9523
Performer: Office of Inspector General
PIC ID: 8777
Are Payments for Surgical Removal of Dead or Unhealthy Tissue From Wounds Correct?
This study determined the extent to which Medicare Part B surgical debridement services in 2004 met Medicare program requirements. Surgical debridement is the removal of dead or unhealthy tissue from a wound using a sharp instrument such as a curette or scalpel. The purpose of surgical debridement is to promote wound healing by removing sources of infection and other impediments. Medicare Part B payments for surgical debridement services have increased in recent years. Between 2001 and 2005, Medicare-allowed payments grew 44 percent from $140 million to $202 million. Researchers conducted a medical record review of 368 surgical debridement services from the Centers for Medicare & Medicaid Services' (CMS) National Claims History file that had service dates in 2004. Physicians with experience in wound care and certified professional coders reviewed the records to determine whether they met Medicare program requirements. Researchers interviewed staff from the 17 carriers that processed Part B claims in 2004. Researchers also reviewed the carriers' local coverage determinations that provided additional guidance about surgical debridement services.
Sixty-four percent of surgical debridement services in 2004 did not meet Medicare program requirements, resulting in approximately $64 million in improper payments. Most carriers had local coverage determinations and edits in place but conducted limited medical review of surgical debridement services.
Report Title: Medicare Payments for Surgical Debridement Services in 2004, http://oig.hhs.gov/oei/reports/oei-02-05-00390.pdf
Agency Sponsor: OS-OIG, Office of Inspector General
Federal Contact: Claire Barnard, 202-205-9523
Performer: Office of Inspector General
PIC ID: 8780
How Often Do States Survey and Certify Medicare Hospices; What Rate of Health Deficiencies Are Seen?
For Medicare hospices certified by State agencies, this study assessed whether the State-performed certification surveys were timely, what the surveys were, and the extent of the oversight by CMS of the Medicare hospice program. The study findings were based primarily on analysis of data from the CMS Online Survey Certification and Reporting system. Researchers analyzed these data for 2,537 hospices certified by State agencies and that were Medicare providers as of July 5, 2005. Researchers interviewed staff at CMS headquarters and regional offices, State agencies, and professional organizations knowledgeable about hospice issues. Medicare Part A covers hospice care provided to terminally ill patients. Organizations that provide hospice care must be certified by State agencies as meeting minimum participation standards prescribed by CMS. For fiscal year 2005, CMS scheduled hospice certification surveys for every 6 years, but for fiscal year 2006, CMS changed the frequency to every 8 years on average. Using the results of certification surveys and complaint investigations, CMS has the authority to apply only one enforcement remedy: termination of poorly performing hospices from Medicare.
Eighty-six percent of hospices were certified within 6 years, as required, while 14 percent averaged 3 years past due. Health deficiencies were cited for 46 percent of hospices surveyed and for 26 percent of hospices investigated for complaints; many deficiencies related to patient care. CMS and State agencies rarely used methods other than certification surveys and complaint investigations to monitor or enforce hospice performance.
Report Title: Medicare Hospices: Certification and Centers for Medicare & Medicaid Services Oversight, http://oig.hhs.gov/oei/reports/oei-06-05-00260.pdf
Agency Sponsor: OS-OIG, Office of Inspector General
Federal Contact: Claire Barnard, 202-205-9523
Performer: Office of Inspector General
PIC ID: 8781
How Many Referrals of Suspected Fraud Do Medicare Fraud Control Units Receive and from Whom?
This study determined the sources and number of suspected fraud referrals that Medicaid Fraud Control Units (MFCUs) reported receiving and the number of these that they accepted for investigation.
Within most States, two agencies share primary responsibility for protecting the integrity of the Medicaid program. The State Medicaid agency is responsible for ensuring proper payment, recovering misspent funds, identifying suspected Medicaid fraud, conducting a preliminary review to determine the extent of potential fraud, and making referrals to its MFCU. The MFCU is responsible for reviewing the referrals it receives from the State Medicaid agency and other sources to determine if they merit criminal or civil investigation. The HHS Office of Inspector General requested that MFCUs provide data on the number of suspected fraud referrals received and the number accepted for investigation from the State Medicaid agencies and from other sources for the period July 2002 through June 2005.
Medicaid Fraud Control Units reported receiving a total of 13,733 suspected fraud referrals over the 3-year period, of which 29 percent came from State Medicaid agencies. Total State Medicaid agency contributions to MFCU-accepted referrals remained constant over the 3-year period, but individual State contributions fluctuated widely.
Report Title: Suspected Medicaid Fraud Referrals, http://oig.hhs.gov/oei/reports/oei-07-04-00181.pdf
Agency Sponsor: OS-OIG, Office of Inspector General
Federal Contact: Claire Barnard, 202-205-9523
Performer: Office of Inspector General
PIC ID: 8782
How Do States Apply Medicaid Standards to Durable Medical Equipment Providers?
This study identified standards used by States to enroll durable medical equipment (DME) providers in the Medicaid program. The study determined the extent to which providers met the standards, and the extent to which States reenrolled Medicaid DME providers. Each State sets its own standards for the enrollment of Medicaid DME providers. States may verify whether providers meet standards at initial enrollment, and may also review providers after enrollment, to determine whether providers continue to adhere to State standards. Unlike Medicaid, Medicare has provider enrollment standards that are uniform across all States (except licensure requirements that vary from State to State). Researchers collected data from 14 States and the District of Columbia using email and telephone surveys. They also examined States' provider enrollment applications and written documentation about State standards to conduct a selective review of State-reported information. Data collection was completed during September and October 2005.
States reviewed employed a variety of standards for DME provider enrollment. Most were not routinely verifying whether providers met all standards. Four routinely reenrolled DME providers; two reported recent initiatives to reenroll providers.
Report Title: Medicaid Provider Enrollment Standards: Medical Equipment Providers, http://oig.hhs.gov/oei/reports/oei-04-05-00180.pdf
Agency Sponsor: OS-OIG, Office of Inspector General
Federal Contact: Claire Barnard, 202-205-9523
Performer: Office of Inspector General
PIC ID: 8783
Do Durable Medical Equipment Suppliers Comply with Medicare Supplier Standards?
Researchers conducted unannounced visits to suppliers of Medicare durable medical equipment, prosthetics, orthotics, and supplies (DMEPOS) in three South Florida counties to determine their compliance with selected Medicare supplier standards. CMS reported that payments for DMEPOS reached $10 billion in fiscal year 2005. DMEPOS are covered under Medicare Part B and include items such as hospital beds, wheelchairs, respirators, walkers, and artificial limbs. DMEPOS suppliers must enroll in the Medicare program to sell or rent medical equipment and supplies to Medicare beneficiaries and to submit claims for Medicare reimbursement.
At the time of the review, DMEPOS suppliers had to comply with 21 Medicare DMEPOS supplier standards to enroll in the Medicare program. Researchers focused on three supplier standards that could be verified quickly through direct observation and desk review. Suppliers must maintain a physical facility, be accessible (open and staffed) during business hours, have a visible sign, have hours of operation posted, and maintain a primary business telephone listed under the name of the business. Researchers conducted unannounced site visits in late 2006 to determine whether 1,581 DMEPOS suppliers in the three counties were in compliance with these 5 requirements.
Thirty-one percent of suppliers in three South Florida counties did not maintain a physical facility or were not open and staffed during unannounced site visits. Another 14 percent were open and staffed but did not meet at least one of three additional requirements for the standards researchers reviewed.
Report Title: South Florida Suppliers' Compliance With Medicare Standards: Results From Unannounced Visits, http://oig.hhs.gov/oei/reports/oei-03-07-00150.pdf
Agency Sponsor: OIG, Office of Inspector General
Federal Contact: Tanaz Dutia, 215-861-4567
Performer: Office of Inspector General
PIC ID: 8790
How Much Did Medicaid Pay for Medical Services and Prescription Drugs to Evacuees from Hurricanes Rita and Katrina?
This study examined Medicaid payments and services made for evacuees of Hurricanes Katrina and Rita for outpatient and medical services and for prescription drugs. It compared average Medicaid payments per evacuee to those per non-evacuee for medical services and prescription drugs. This provided an initial, aggregate-level analysis of medical services and prescription drugs for eight States in the first two quarters of fiscal year 2006. The Medicaid Management Information System and the Medicaid Statistical Information System were the primary Medicaid data sources used in this study.
For eight States, Medicaid paid $716 million for medical services and prescription drugs under hurricane-related demonstration projects. A greater percentage of evacuees than non-evacuees received medical services and prescription drugs but average total payment per evacuee was less.
Report Title: Medicaid Payments and Services Related to Hurricanes Katrina and Rita, http://oig.hhs.gov/oei/reports/oei-05-06-00140.pdf
Agency Sponsor: OS-OIG, Office of Inspector General
Federal Contact: Claire Barnard, 202-205-9523
Performer: Office of Inspector General
PIC ID: 8787
Where Were the Highest Fraudulent Claims for Infusion Therapy?
In three South Florida counties, this study identified claims patterns associated with HIV/AIDS infusion therapy––therapy that involved medicines and fluids given through a catheter into a person´s bloodstream––that might have indicated fraudulent or abusive activity. Researchers assessed the effectiveness of past and current efforts to control inappropriate payments to infusion therapy providers. In June 2003, the program safeguard contractor alerted the Centers for Medicare and Medicaid Services (CMS) that providers in Miami-Dade, Broward, and Palm Beach counties were billing aberrantly for infusion therapy services for beneficiaries with HIV/AIDS. Related investigations found that many of the services billed by these providers were not medically necessary or feasible. In May 2004, CMS issued a National Medicare Fraud Alert describing the "infusion therapy scam." By 2005, the three counties accounted for 72 percent of submitted charges for beneficiaries with HIV/AIDS nationwide, though only 8 percent of such beneficiaries lived there. Most of these charges were for drugs used in infusion therapy. Researchers used Medicare Part B National Claims History data from 2006 to analyze beneficiary and provider claims patterns in South Florida. Researchers interviewed staff from CMS and its contractors and reviewed documents related to infusion fraud to assess the efforts to control aberrant billing.
In the last half of 2006, three South Florida counties accounted for half the total amount of infusion therapy provided and 79 percent of the amount for drugs billed nationally for Medicare beneficiaries with HIV/AIDS. Other metropolitan areas exhibited patterns of billing similar to South Florida but to a lesser extent. CMS has had limited success in controlling the aberrant billing practices of South Florida infusion therapy providers. Researchers recommended mandatory site visits to high risk jurisdictions, more time for payment contractors to review payment requests from these areas, and enhanced fraud- and abuse-fighting efforts.
Report Title: Aberrant Billing in South Florida for Beneficiaries with HIV/AIDS, http://oig.hhs.gov/oei/reports/oei-09-07-00030.pdf
Agency Sponsor: OS-OIG, Office of Inspector General
Federal Contact: Claire Barnard, 202-205-9523
Performer: Office of Inspector General
PIC ID: 8788
Do Average Sales Prices for Specific Prescription Drugs Exceed Average Manufacturer Prices?
This study examined whether the average sales prices (ASP) for individual Medicare Part B prescription drugs exceeded the average manufacturer prices (AMP) by at least five percent during the third quarter of 2006 and determined the impact of lowering reimbursement amounts for drugs that exceeded the five-percent threshold. Since January 2005, Medicare Part B has been paying for most covered drugs using a reimbursement methodology based on average sales prices. The Social Security Act defines an average sales price as a manufacturer's sales of a drug to all purchasers in the United States, divided by the total number of units of the drug sold by the manufacturer. The Act mandates that the Inspector General compare the two prices. The law states that if the Inspector General finds that the ASP for a drug exceeds the AMP by five percent, the Department of Health and Human Services may disregard the average sales price when setting the reimbursement rate the government will pay for the drug. Researchers obtained the Centers for Medicare and Medicaid Services´ (CMS') ASP data, which were used to establish volume-weighted ASPs and reimbursement amounts for the first quarter of 2007. Researchers also obtained CMS's AMP data and used it to calculate volume-weighted AMPs using the same method that CMS uses to calculate volume-weighted ASPs. Ultimately, researchers compared volume-weighted ASPs to volume-weighted AMPs for 326 Healthcare Common Procedure Coding System (HCPCS) codes and identified codes for which ASPs exceeded AMPs by at least five percent.
Six percent of a sample (39 of 326) of the HCPCS codes reviewed had volume-weighted average sales prices for individual Medicare Part B prescription drugs that exceeded the volume-weighted average manufacture prices by at least five percent.
Report Title: Comparison of Third-Quarter 2006 Average Sales Prices to Average Manufacturer Prices: Impact on Medicare Reimbursement for First Quarter 2007, http://oig.hhs.gov/oei/reports/oei-03-07-00140.pdf
Agency Sponsor: OS-OIG, Office of Inspector General
Federal Contact: Claire Barnard, 202-205-9523
Performer: Office of Inspector General
PIC ID: 8789
How do Medical Device Companies View the Food and Drug Administration's Pre-Market Review Process?
The purpose of the 2007 FDA Center for Devices and Radiological Health Premarket Industry Perception Survey was to obtain industry feedback on the premarket review process to help determine how customers perceive the medical device review process, identify areas that are working well, and to identify areas that may need improvement. A random sample of industry contacts was selected from final Premarket application decisions for the twelve month period April, 2006 through March, 2007. There were 354 responses received: 224 for the Office of Device Evaluation (ODE) and 130 for the Office of In Vitro Diagnostics (OIVD).
When comparing the survey results from 2006 with survey results from 2007, some of the respondent perceptions remain unchanged. Approximately 90 percent of survey respondents agreed that ODE and OIVD reviewed and processed Premarket submissions in a timely manner in both years. Ninety percent of respondents agreed that OIVD´s staff exhibited an appropriate level of scientific expertise in reviewing the submissions. The number of survey respondents who agreed that ODE´s staff exhibited an appropriate level of scientific expertise in reviewing the submissions increased from 80 percent in 2006 to 87 percent in 2007. The perception that the Center for Devices and Radiological Health Premarket review meetings were productive and met respondents´ needs improved significantly. Satisfaction with ODE staff increased, from 30 to 49 percent. Satisfaction with OIVD increased from 42 to 56 percent. One broad implication was that new and updated guidance documents are needed (they lag advancements in technology). Other broad implications regarding the Centers for Devices and Radiological Health are that it: be less burdensome, treat the medical device industry fairly, courteously, and professionally, address review inconsistencies between branches and reviewers, and provide quicker feedback to resolve issues submissions.
Report Title: 2007 Premarket Industry Perception Survey, Office of Device Evaluation (ODE and Office of Invitro Diagnostics (OIVD). Report may be obtained from Federal Contact
Agency Sponsor: FDA, Food and Drug Administration
Federal Contact: Bonnie Markovitz, 240-276-8924
Performer: Office of Device Evaluation and Office of Invitro Diagnostics
PIC ID: 8762
Objective 1.4: Recruit, develop, and retain a competent health care workforce.
What Practice Profiling Criteria Best Identify Efficient Qualified Physicians?
This project identified fee-for-service payer and managed care plan arrangements with efficient, high quality physicians and physician-group practices; best practice profiling methodologies; criteria used in selective contracting, including financial profiling; barriers to selective contracting; and bonus arrangements for high quality physicians.
Researchers estimated Medicare (Part B) physician expenditures and simulated possible program savings or losses from alternative selective contracting policies based on best industry practices. The use of physician quality and economic profiling by payers and employers in evaluating physicians for staff appointment, reappointment or selective contracting has been suggested as an industry practice that would modernize Medicare payment practices. The use of bonus payments to efficient and high quality physicians to keep Medicare program costs down and quality of service up has been cited as another industry practice appropriate for modernization of Medicare. Quantitative analyses were performed pertaining to physician profiling for echocardiograms, magnetic resonance imaging, and computed tomography (CT) scans.
The hope was that these descriptive and qualitative analyses would lead to recommendations for best practice profiling criteria to identify efficient and qualified physicians and group-practices. It was determined, however, that more detailed case-mix adjustment and accepted clinical guidelines for ordering tests would be needed to identify over- or under- referral of imaging tests.
Report Title: Environmental Scan for Selective Contracting Practices with Efficient (Qualified) Physicians and Physician Group Practices. Report may be obtained from Federal Contact
Agency Sponsor: CMS-ORDI, Office of Research, Development, and Information
Federal Contact: Jesse Levy, 410-786-6600
Performer: RTI International
PIC ID: 8601
Goal 2 - Prevent and control disease, injury, illness and disability across the lifespan, and protect the public from infectious, occupational, environmental and terrorist threats.
Objective 2.1: Prevent the spread of infectious diseases.
What Progress Has Been Made toward Healthy People 2010 Goals and Objectives?
This study evaluated midcourse achievement toward national health goals in Healthy People 2010.
Founded on data that enable progress and trends to be tracked, Healthy People 2010 provides ten-year evidence-based objectives for improving the health of Americans. There are 955 objectives and sub-objectives. Baseline values were established for each objective and sub-objective with data at the beginning of the decade, and specific targets were set to be achieved by 2010. Progress was assessed for objectives and sub-objectives with tracking data (with baseline and more recent data) as of January 2005.
Of the total 467 objectives, progress could be assessed for 281 objectives; for others data were unavailable. Of the 281 that could be assessed, 29 (10 percent) met the target, 138 (49 percent) moved toward the target, 40 (14 percent) demonstrated mixed progress (with some sub-objectives moving both toward and away from the target), 17 (6 percent) were unchanged from the baseline, and 57 (20 percent) moved away from the target.
Report Title: Healthy People 2010 Midcourse Review, http://www.healthypeople.gov
Agency Sponsor: OPHS, Office of Public Health and Science
Federal Contact: Emmeline Ochiai, 240-453-8259
Performer:
PIC ID: 8468
How Should Healthy People National Disease Prevention and Health Promotion Objectives for 2020 be Developed?
This study assessed the process for developing Healthy People 2010 disease prevention and health promotion objectives and recommendations. Healthy People 2010 is the third generation of objectives for the Nation; it comprises a comprehensive set of ten-year objectives, based on science. This population-based approach to disease prevention and health promotion reflects the link between individual and community health. Experts analyzed current processes for developing national objectives and recommended how to frame and manage future objectives. The public provided comments on the recommendations. Examined were how current national objectives fit with other goal-setting and objective-measurement efforts and how to improve the fit.
For Healthy People 2020, researchers recommended changes: reduce the number of topic areas and objectives; organize objectives by health risks/determinants, not disease; focus on the public health community as the target audience; and articulate a clear vision for each initiative. Information and recommendation from the study supports discussions of the Federal Interagency Workgroup and the Secretary's Advisory Committee on National Health Promotion and Disease Prevention Objectives for 2020.
Report Title: Assessment of the Healthy People Objective-setting Framework and Process. Report may be obtained from Federal Contact
Agency Sponsor: OPHS, Office of Public Health and Science
Federal Contact: Carter Blakey, 240-453-8254
Performer: National Opinion Research Center (NORC) at the University of Chicago
PIC ID: 8805
How Thorough is Influenza and Pneumoccocal Vaccination Coverage?
This study evaluated the accuracy of data on vaccination rates and quantified the degree of under-estimation of influenza and pneumoccocal vaccination coverage levels for each Indian Health Services (IHS) Area. This allows the IHS and Area offices to more accurately measure influenza and pneumoccocal coverage. This in turn allows IHS to better identify possible barriers to immunization with influenza and pneumoccocal and develop strategies to improve coverage. Immunization is one of the most cost-effective public health measures, and results in dramatic reductions of morbidity and mortality associated with vaccine-preventable diseases. Because of this, increasing both influenza coverage and pneumoccocal coverage among adults age 65 years and older is a goal of Healthy People 2010. IHS researchers: (1) selected a random sample of patients from each Area, 65 or older who had at least one clinic visit between July, 2003 and June, 2004; reviewed available data to determine how many patients received influenza vaccination; and conducted chart reviews on patients with no recorded influenza and/or pneumoccocal vaccination to determine if influenza and pneumoccocal vaccination was documented in the chart.
Researchers found that there were data in charts that were missing from the Resource and Patient Management System data base. Researchers recommended that providers should be trained to properly enter information into the data base. Pneumoccocal vaccine coverage varied considerably facility from 67 to 92 percent. The IHS could increase vaccination rates by offering vaccines during every visit during the flu season.
Report Title: An Evaluation of Influenza and Pneumoccocal Vaccination coverage in Adults. Report may be obtained from Federal Contact
Agency Sponsor: IHS, Indian Health Service
Federal Contact: Lucie Vogel, 301-443-1133
Performer: Indian Health Service
PIC ID: 8094
Does Minority Substance Abuse and HIV Prevention Reduce or Delay Drug Use and Increase HIV/AIDS Avoidance Behavior?
The Minority AIDS evidence-based prevention program, evaluation examined: (1) extent of Strategic Prevention Framework (SPF) adoption and implementation, (2) effectiveness of the program in changing behavior related to HIV/AIDS; and (3) success of the program in preventing, delaying and/or reducing the use of alcohol, tobacco, and other drugs (ATOD).
Minority AIDS was implemented in FY 2000; three cohorts of grants have been funded. The Cohort 3 study provided innovative, community-based drug prevention, planning and intervention services to minority populations at risk for substance abuse and HIV/AIDS.
Cohorts 3 reduced ATOD use and increased HIV/AIDS and risky sexual behavior prevention education. Fewer youth participants had sex after getting drunk or high and more participants took HIV/AIDS education classes. The number of adults smoking cigarettes or drinking alcohol decreased and there was a significant decrease in unprotected risky sexual practices.
Report Title: The Minority AIDS Initiative (MAI) Cohort 3 Program Evaluation. Report may be obtained from Federal Contact
Agency Sponsor: SAMHSA, Substance Abuse and Mental Health Services Administration
Federal Contact: Pamela Roddy, 240-276-2422
Performer: HSRI
PIC ID: 7883.1
Objective 2.2: Protect the public against injuries and environmental threats.
How Can Information Sharing with FDA's Center for Devices and Radiological Health Be Improved?
This project sought to improve the Center for Devices and Radiological Health´s internet system, "CenterNet." The project collected data through audience research, discussions with project staff, interviews with employees, a staff-wide survey, and focus group sessions. Researchers developed wireframes (a basic visual guide that suggested the layout and placement of fundamental design elements in the interface design) to serve as a blueprint for revamped information architecture for CenterNet. The wireframes captured recommendations for a new navigational structure, revised content, introduced a common page layout, and incorporated new features and user tools. The project validated the recommendations with a series of user tests. Many of the recommendations from this study will be incorporated into a new FDA-wide Intranet.
Report Title: User Testing and Redesign Implementation Recommendations
Agency Sponsor: FDA, Food and Drug Administration. Report may be obtained from Federal Contact
Federal Contact: Laurel Mendelson, 240-276-3252
Performer: Forum One Communications
PIC ID: 8686
Objective 2.3: Promote and encourage preventive health care, including mental health, lifelong healthy behaviors, and recovery.
What Health Education Methods Encourage Youth to Adopt Healthy Nutritional and Physical Activity Behaviors?
The study sought promising and innovative health education methods that targeted 8-13 year-olds and promoted healthy eating and physical activity. Compelled by the growing epidemic of overweight and obesity among today's youth, this study focused on the relationship between health education and youth. Health messages increasingly compete for youths' time. In order to be effective, messages need to be dynamic and reflect the ever-changing "kid" environment. Researchers reviewed programs that used interdisciplinary health education curriculum, interactive video or computer games, youth-developed messaging, or popular media programming. Next, researchers convened a workshop, "Health Education @home @school @play @com: Easy and Fun Innovations," to connect professionals from different sectors and disciplines. Health, media, and technology experts, who do not routinely come together, discussed methods for enhancing development of appealing and fun messages, integrating media and technology into innovative programs, and overcoming environmental and structural barriers for disseminating programs. Lastly, researchers conducted student focus groups.
Youth were more likely to adopt healthy behaviors they learned through activities they valued. In conclusion: collaboration across sectors, roles, and functions is essential; never underestimate the importance of fun (as defined by kids); understand and engage youth (the "consumers"); integrate tools and technologies that have appeal and refresh them; increase funding to support enhancements of effective programs; and use pre-designed general programming for easier use. The findings from this report and youth feedback were used to expand a program featured in the workshop. It proved relevant to other school and community-based nutrition physical activity programs targeting youth.
Report Title: Health Education @home@school@play@com: Easy and Fun Innovations, http://odphp.osophs.dhhs.gov
Agency Sponsor: OPHS, Office of Public Health and Science
Federal Contact: Sarah Linde-Feucht, M.D., 240-453-8256
Performer: Abt Associates Inc; Bethesda, MD
PIC ID: 8804
What Interventions Best Prevent or Reduce Ecstasy, Methamphetamine, and other Club Drugs Use Among Youths?
The study examined effectiveness of two interventions for reducing drug use: one emphasizing prevention and the other infrastructure development. In response to problems associated with Ecstasy and other Club Drugs, Congress passed the Ecstasy Anti-Proliferation Act of FY 2000 authorizing funding for programs to prevent the use of Ecstasy and other Club Drugs by testing new prevention interventions targeting youth or by expanding or developing infrastructure. There were 14 intervention grants and 13 infrastructure development grants. Researchers collected data to determine how effective the interventions were in preventing, reducing or delaying use of these drugs and how effective the infrastructure development projects were in supporting these goals.
On the whole, programs using Design 1 (more than 100 youth per session) showed larger effects on participants´ attitudes, beliefs, and knowledge in a direction predictive of lower substance use in the future, while Design 2 programs (with less than 100 youth) were more successful in reducing levels of substance use in the present. It is possible that Design 1 programs focused on the cognitive aspects of substance use while Design 2 programs emphasized behavioral change.
Report Title: Ecstasy and Other Club Drugs Prevention Initiative. Report may be obtained from Federal Contact
Agency Sponsor: SAMHSA, Substance Abuse and Mental Health Services Administration
Federal Contact: Daniel Bailey, 240-276-2439
Performer: Westat, Inc. MayaTech
PIC ID: 7885
Does Marital Status Influence Health?
This investigation of the relationship between marriage and health consisted of scrutinizing recent research, focusing on studies that used rigorous statistical methods to examine whether marriage is a cause of better health outcomes.
A focus on recent evidence revealed that marriage had positive effects on certain health-related outcomes. Married people were generally healthier than unmarried people, as measured by numerous health outcomes. These studies found, for example, that marriage improved certain mental health outcomes, reduced the use of some high-cost health services (such as nursing home care), and increased the likelihood of having health insurance coverage. An emerging literature suggested that growing up with married parents was associated with better health as an adult. Marriage had mixed effects on health behaviors leading to healthier outcomes in some cases (reduced heavy drinking) and less healthy outcomes in others (weight gain). For other key health outcomes – in particular measures of specific physical health conditions-the effects of marriage remained largely unaddressed by rigorous research.
Report Title: The Effects of Marriage on Health: A Synthesis of Recent Research Evidence, http://aspe.hhs.gov/hsp/07/marriageonhealth/index.htm
Agency Sponsor: ASPE-OHSP, Office of Human Services Policy
Federal Contact: Jennifer Burnszynski, 202-690-8651
Performer: Mathematica Policy Research
PIC ID: 8542
Objective 2.4: Prepare for and respond to natural and manmade disasters.
What Characterizes Better Mental Health Responses to Survivors of Catastrophic Disasters Such as the Gulf Coast Hurricanes Katrina, Wilma, and Rita?
A cross-site evaluation of the Crisis Counseling Assistance and Training Program was conducted to document the reach, quality and "pathways to excellence" across the various programs between November 2005 and February 2007. The program was funded by the Federal Emergency Management Agency and implemented with the support of the Substance Abuse and Mental Health Services Administration. Twenty-two crisis counseling programs in 17 States participated in the evaluation. During this time period crisis counselors documented 1.3 million encounters with individual counseling accounting for 56 percent, group counseling 12 percent, and public education activities 32 percent. In the Participant Survey 4,500 respondents completed the Counseling Outcomes and Experiences Scale.
Overall lower rates of post disaster distress were strongly related to four service delivery characteristics: more intensive services (longer sessions or repeated visits), participants being seen in their own homes, referrals for necessary psychological services, and less stressed providers. Future implications include the need to improve the overall quality of counselor training, increase counselor capacity to recognize and respond to more serious levels of participant distress, and improve counselor skills in eliciting participant stories and experiences.
Report Title: Cross-site Evaluation of the Crisis Counseling Program: 2005 Hurricanes Katrina/Rita/Wilma. Report may be obtained from Federal Contact
Agency Sponsor: SAMHSA, Substance Abuse and Mental Health Services Administration
Federal Contact: Nikki Bellamy, 240-276-2418
Performer: National Center for Post-Traumatic Stress Disorder
PIC ID: 8730
How Well Did the Commissioned Corps Respond to Citizens' Needs After Hurricanes Katrina and Rita?
This study evaluated the U.S. Public Health Service Commissioned Corps' (the Corps) response to Hurricanes Katrina and Rita and identified whether and how the Corps could improve its response to public health emergencies. The Corps, one of seven U.S. uniformed services, is made up entirely of officers commissioned on the basis of their health related training. Agencies within and outside the Department of Health and Human Services employ Corps officers to provide health care and related services in health professional shortage areas. In August and September 2005, respectively, Hurricanes Katrina and Rita struck the Gulf Coast. In response to health care and public health needs in the affected areas, the Corps carried out the largest deployment in its 207-year history. More than 2,100 officers worked with State, local, and private agencies in response to the hurricanes.
For this evaluation researchers: (1) surveyed a stratified random sample of 350 Corps officers; (2) analyzed Corps administrative databases; (3) interviewed and collected documentation from Corps field commanders, Corps management components, and the Office of the Assistant Secretary for Preparedness and Response; (4) interviewed State health officials; and (5) interviewed agencies that employ Corps officers.
The Commissioned Corps officers deployed in response to Hurricanes Katrina and Rita provided valuable services, but the Corps could improve its response to public health emergencies. Researchers recommended that the Corps: be better trained, that there be a system to quickly contact officers for deployment, that deployment-related travel be streamlined, that deployments be staggered to assure continuity, and that that all deployable officers have Federal Government travel credit cards.
Report Title: The Commissioned Corps' Response to Hurricanes Katrina and Rita, http://oig.hhs.gov/oei/reports/oei-09-06-00030.pdf
Agency Sponsor: OS-OIG, Office of Inspector General
Federal Contact: Claire Barnard, 202-205-9523
Performer: Office of Inspector General
PIC ID: 8773
Were Government Purchase Card Uses After Hurricane Katrina Appropriate?
This study examined whether Government purchase card purchases related to Hurricane Katrina complied with card use requirements and identified lessons regarding how the Government purchase card program could be better administered during future emergencies. The purchase card program was designed to save the Government money by avoiding costly paperwork and to expedite the process of making purchases. The U.S. Bank handles the program for the Department of Health and Human Services (HHS). According to U.S. Bank data, during 2005, HHS cardholders used Government purchase cards for 851,511 purchases, totaling approximately $458 million. Of these, HHS officials identified 1,139 items totaling $2,109,173 related to Hurricane Katrina for the period of August 28 through December 14, 2005. For a stratified sample of 243 of these Hurricane Katrina purchases, researchers assessed whether the purchases complied with selected requirements for the use of the card. Researchers interviewed 62 cardholders who made these 243 purchases to gather relevant documentation.
Fifteen percent of purchases did not comply with selected purchase card requirements. Cardholders had concerns regarding the legality and complexity of some purchases and over half of cardholders expressed the need for additional written guidance regarding emergency purchasing procedures. Hurricane Katrina purchase data also contained inaccuracies.
Report Title: Emergency Response to Hurricane Katrina: Use of the Government Purchase Card, http://oig.hhs.gov/oei/reports/oei-07-06-00150.pdf
Agency Sponsor: OS-OIG, Office of Inspector General
Federal Contact: Claire Barnard, 202-205-9523
Performer: Office of Inspector General
PIC ID: 8784
Goal 3 - Human Services: Promote the economic and social well-being of individuals and families and communities.
Experimentation is not a sure thing. Impacts are often modest rather than dramatic, you will learn things that surprise and disappoint you, many things won´t work, and progress requires a long-term-commitment to learn from and build on your experience. But one must begin with the conviction that evidence matters – that knowing what doesn´t work and what does are both key to improving the lot of the poor and the return on government investment.
–– Gordon Berlin, President of MDRC
Objective 3.1: Promote the economic independence and social well-being of individuals and families across the lifespan.
State Child Health Insurance: How Successful?
This study summarized and analyzed evaluations of both State and external activities related to the State Children´s Health Insurance Program (SCHIP). Established in 1997, SCHIP provides medical coverage for children under age 19 who are not eligible for Medicaid and with family incomes below 200 percent of the Federal poverty level or 50 percentage points above the current State Medicaid limit. States are required to examine and track the impact of SCHIP in reducing the numbers of low-income uninsured children. The study analyzed the effect of SCHIP on enrollment expenditures, use of services in Medicaid and State health programs, stand-alone and Medicaid expansion programs, and effectiveness of outreach activities and quality of care.
States embraced the flexibility that SCHIP offered, and enrollment grew rapidly in the early years due to the state´s multifaceted and evolving outreach efforts. States outreach and enrollment initiatives had a "spillover effect" on traditional Medicaid enrollment (more individuals sought or were moved into traditional Medicaid), although the precise magnitude of the effect was unknown. In most states, over 75 percent of children enrolled in SCHIP remain so, similar to the experience in the individual market and traditional Medicaid. SCHIP contributed to improvements in children´s health insurance coverage, including substantial reductions in both the number and rate of uninsured children. Access to care for children enrolled in SCHIP varied by state. Access to care improved for children enrolled in SCHIP, although some gaps remained.
Report Title: "National Evaluation of the State Children´s Health Insurance Program: A Decade of Expanding Coverage and Improving Access." http://www.cms.hhs.gov/Reports/Reports/list.asp?listpage=12Agency Sponsor: CMS-ORDI, Office of Research, Development, and Information
Federal Contact: Susan Radke, 410-786-4450
Performer: Mathematica Policy Research, Inc.
PIC ID: 7380
Did Community Consensus-Building Projects to Encourage Exemplary Evidence-Based Mental Health Services Implement Successfully?
Phase I of the study evaluated consensus building processes, grantee reporting, and barriers to consensus building. Phase II examined process variables such as practice implementation, barriers to implementation, and commitments for the maintenance of exemplary practices. The Community Action Grant Program encouraged adoption and implementation of evidence-based and exemplary practices. The grants supported mental health services for adults with serious mental illness and children with severe emotional disturbance.
All 17 Phase I grantees achieved consensus among their stakeholders, adopting an exemplary practice. Grantees generally included the use of consensus building models, identified and recruited key community stakeholders; involved service recipients; understood the practice to be implemented; communicated effectively across stakeholders, and had flexible and enthusiastic agency staff. In Phase II, all 30 grantees successfully implemented practices. Most practices emphasized cross-system collaboration. The continued involvement of key stakeholders, often organized into committees, advisories, or work groups was critical to successful implementation. Implementation typically required a little over 14 months, and involved training stakeholders and providers, producing training materials, practice evaluation forms and instruments, websites, communication plans, billing forms and protocols, and referral and resource guides.
Report Title: Evaluation of Community Action Grant Program Phase I – Round 1 Grantees; Evaluation of the Community Action Grant Program Phase II – Rounds 1, 2, and 3. Report may be obtained from Federal Contact
Agency Sponsor: SAMHSA, Substance Abuse and Mental Health Services Administration
Federal Contact: David Morrissette, 240-276-1912
Performer: Human Interaction Research Institute
PIC ID: 7716.1
What Features Make Targeted Insurance Programs Successful With the Poor?
This study examined the efforts in six States to develop market-based, low cost health insurance products targeted to low income workers. In addition to providing detailed case studies, the study compared the different approaches used in four broad areas: program design; program financing; methods to keep the program affordable; and program administration. Issues such as the uses of data, decisions about design of insurance products (including trade-off between costs and scope of benefits), administration of the proposed programs, sources of financing, the negotiations and agreements with safety net providers, and the extent of sign-up for low cost benefit packages were included.
Lessons learned from this cross-State comparison included: make realistic enrollment goals, pay attention to the whole package; carefully consider the employer/employee cost sharing requirements; consider implications for the State; marketing is critical; Individual means-testing is a barrier; anticipate higher than expected premiums; appreciate tension between adding benefits and keeping program costs low; consider the impact of limited or no premium subsidies; and know the target population.
Report Title: Efforts to Expand Coverage to the Uninsured: Program Design Challenges and Tradeoffs in Six States, http://www.hrsa.gov/stateinsurance/default.htm
Agency Sponsor: HRSA, Health Resources and Services Administration
Federal Contact: Jessica Townsend, 301-443-0371
Performer: Academy Health
PIC ID: 8386
What Education Promotes Healthy Marriages Among Low-Income Stepfamily Couples?
This study developed a conceptual framework for healthy marriage education intervention with married stepfamily couples. Research indicated that children raised in stepfamilies do not fare as well as children raised by their married biological parents. The study reviewed research literature on stepfamily prevalence, characteristics, dynamics, marital stability/quality, and outcomes for children. Researchers conducted telephone interviews and site visits with program operators to obtain practitioner perspectives about working with stepfamilies.
Research literature suggested that stepfamily couples would benefit from the same "core elements" that emerge from research on healthy marriage generally including communication skills, conflict management skills, effective anger and stress management, emotion regulation, and friendship building skills. The research has found that adults in stepfamilies often fail to recognize characteristics that make couple and family functioning within stepfamilies different. Marriage education programs for stepfamilies should include elements not generally found in most marriage education curricula. These components should focus on the effects of stepparent-stepchild relationships on the quality and stability of the marital relationship, co-parenting skills and other methods for dealing with former spouses and extended family. The conceptual framework for an intervention model identifies program service content that is derived from and supported by both the research and practitioner fields, antecedent conditions that may need to be addressed directly within programs or through referrals, and intermediate and longer-term outcome goals. Intermediate goals include improving basic marital skills, understanding unique stepfamily characteristics, and developing more effective stepparent-stepchild and parent-child relationships. Longer term goals include seeking increased marital stability and improved adult and child well-being.
Report Title: Meeting the Needs of Married, Low-income Stepfamily Couples in Marriage Education Services, http://www.acf.hhs.gov/programs/opre/strengthen/sup_stepfamilies/reports/meeting_needs/meeting_needs_title.html
Agency Sponsor: ACF-OPRE, Office of Planning, Research and Evaluation
Federal Contact: Nancye Campbell, 202-401-5760
Performer: Abt Associates Inc.
PIC ID: 8471
How Best Use National Survey Data to Study Family Formation?
The Administration for Children and Families (ACF) hosted a meeting of both marriage and family experts and National Longitudinal Survey of Youth1997 cohort (NLSY97) data experts. The experts discussed major marriage and family research questions, the NLSY97 data that could support such questions, NLSY97 data limits, and ways to overcome the limitations. The meeting focused on: pathways to cohabitation and marriage; relationship between family formation/marital status and employment; marriage outcomes; and child well-being in different family structures.
NLSY97 includes detailed questions on: (1) cohabiting and marital partners that allow tracking relationship stability and transitions, demographic variables on the other biological parent of the respondent´s child; (2) variables related to expectations of marriage; and (3) marital histories of the youths´ parents to capture intergenerational influences. The NLSY97 includes: detailed employment data; histories and job search efforts; related variables such as education, training, aptitude scores and welfare receipt; and event history structures that allow researchers to assess timing of transitions. The NLSY97 includes extensive measures related to marriage outcomes including relationship quality between the youths´ parents (or parent figure) as reported by the youth and by responding parent including supportiveness, degree of conflict and conflict resolution. Finally, youth well-being is measured across multiple domains including educational attainment, employment, physical health, risk-taking behaviors, and emotional well-being.
Recommendations included: creating a targeted users´ guide designed for marriage and family researchers; creating an on-line table generator of family variables and covariates; constructing variables of relevance to marriage and family researchers; developing definitional statements for each variable identifying the universe of eligible respondents; creating an on-line message board to enable researchers to post findings or discuss methodology; and promoting additional analyses through providing small dissertation grants or similar funding opportunities.
Report Title: Bridging the Data Gap for Marriage and Family Research: Potential Opportunities Within the NLSY97, http://www.acf.hhs.gov/programs/opre/strengthen/nlsy97/index.html
Agency Sponsor: ACF-OPRE, Office of Planning, Research and Evaluation
Federal Contact: Nancye Campbell, 202-401-5760
Performer: National Opinion Research Center (NORC)
PIC ID: 8472
How Can We Help the Poor Become Employed?
This study examined programs that target low-income individuals, including those who are employed but at low wages, and individuals who receive cash assistance under the Temporary Assistance for Needy Families (TANF) program who are likely to encounter greater barriers to employment. The Innovative Employment Strategies project provided information on innovative strategies for promoting stable employment and wage growth among low-income populations. The key question was which approaches and programs may potentially improve the employment prospects of low-income individuals. Program innovation has outpaced research efforts to identify effective employment strategies, resulting in a range of new approaches and programs that are potentially effective but have not been formally evaluated. With increased pressure placed on the States by the 2005 Deficit Reduction Act to increase the number of TANF recipients entering and sustaining employment, it was important to look at new efforts, and provide this information to States.
Innovative approaches were those that: (1) addressed at least one of the causes of low earnings among low-wage workers; (2) provided an untested intervention grounded in research to date; (3) addressed the specific interests of Federal or State policymakers or program operators; or (4) had the potential to be adopted in other States and localities. They also had other features: strong program design and services; relatively mature programs that had been operating for long periods of time; been operating on at least a moderate scale; or evidence of positive results or outcomes, particularly economic. The study looked at programs in four areas: service-focused employment preparation, employment-based experience, skill development, and income and work supports.
Innovative initiatives combined elements from multiple models and were relatively comprehensive in the range of the services they provided, involved partnerships of public- and private-sector organizations who had not collaborated in the past, were financed through a number of public funding streams, focused on making skill-development programs more accessible to low-income workers and more tailored to employer needs, included strong involvement from the private sector, included case management services, and reflected policies and procedures that originated at the State level.
Report Title: Innovative Employment Approaches and Programs for Low-Income Families, http://www.acf.hhs.gov/programs/opre/welfare_employ/inno_employ/reports/innovative/innovative_title.htmlAgency Sponsor: ACF-OPRE, Office of Planning, Research and Evaluation
Federal Contact: Timothy Baker, 202-260-6165
Performer: Urban Institute
PIC ID: 8473
What Does Past Research Say Regarding How Children's Experiences and Biology Affect Their Attitudes and Decisions about Marriage?
This study synthesized research findings about trends, behaviors and attitudes with regard to relationship development among youth and young adults. The study focused on low-income groups, and the implications of their attitudes and behaviors for family formation decisions later in life. The study examined research findings, theory, and evidence from evaluations and operational experience from programs designed to increase the knowledge and skills of youth and young adults, particularly low-income youth/young adults, regarding healthy relationships. If programs and curricula targeting adolescent romantic relationships are to be effective, they must be grounded in an accurate understanding of how these relationships function and the role that they play in the development of healthy adult marriages.
Analyses of the literature led the authors to recommend a comprehensive theoretical model that included all parts of the lifespan, focused on adolescent attitudes and behaviors as mediators, and took socio-economic status and associated covariates (e.g. neighborhood, educational opportunities) into account, both as antecedent conditions and as influences in adulthood. Promising directions for the next generation of research on adolescent romantic relationships include: 1) exploiting nationally representative data sets to expand descriptions of low-income adolescents; 2) addressing diversity across cultures, ethnicities, and sexual orientations; 3) continuing longitudinal studies that examine the consequences of adolescent experiences for adult outcomes; 4) conducting analyses that test genetic and economic explanations for links between adolescence and adulthood; 5) describing processes within adolescent relationships, like conflict resolution and social support.
Report Title: Adolescent Romantic Relationships as Precursors of Healthy Adult Marriages: A Review of Theory, Research, and Programs, http://www.acf.dhhs.gov/programs/opre/strengthen/marr_precursors/reports/adolescent_relationships/adolescent_title.htmlAgency Sponsor: ACF-OPRE, Office of Planning, Research and Evaluation
Federal Contact: Nancye Campbell, 202-401-5760
Performer: Rand Corporation
PIC ID: 8503
How Did Eight Selected Sites Change their Sanction Policies and Procedures in Response to More Stringent Deficit Reduction Act of 2005 Work Participation Rate Requirements?
Researchers examined how sanction policies and procedures changed at eight sites in seven states in anticipation of and in response to regulations issued by the Administration for Children and Families implementing the Deficit Reduction Act of 2005. The Act and conforming regulations have the effect of making it significantly harder for states to meet federal work participation rate requirements. The contractor visited the sites, interviewed staff, examined cases and reviewed sanction policies. The contractor analyzed administrative data to explore whether a relationship existed between changes in sanction policies and procedures on the one hand, and work participation rates, on the other.
Researchers found that: (a) some States introduced more stringent sanction policies either by shifting from a partial to a full-family sanction (a full-family sanction means that the entire cash payment is withheld), or by shifting from introducing the full-family sanction gradually to introducing it immediately (by these measures no state became less stringent); (b) case managers devoted a significant amount of time verifying participation data which limited time they had to provide personal support to clients; (c) in general, sites with partial sanction policies focused more intensively on reducing sanction rates than did sites with full-family sanctions; (d) in one State, the work participation rate increased following a shift from a partial to a full-family sanction, (e) in another State, the work participation rate increased, following intake policy changes, which had the effect of dramatically reducing the percentage of applicant cases that were approved; and, (f) in a third location, efforts to work more intensively with clients to seek remedies for non-compliance with work participation requirements were successful in resolving many of these cases of non-compliance, but did not increase the work participation rates.
Report Title: Using Work-Oriented Sanctions to Increase TANF Program Participation, http://www.acf.hhs.gov/programs/opre/welfare_employ/sanction_pol/reports/sanction_pol/sanction_pol_title.htmlAgency Sponsor: ACF-OPRE, Office of Planning, Research and Evaluation
Federal Contact: Leonard Sternbach, 415-437-7671
Performer: Mathematica Policy Research, Inc.
PIC ID: 8510
Do Post-Employment Services Help Working Poor?
The study tested whether providing post-employment services and supportive service payments helped working individuals who recently left the Temporary Assistance for Needy Families (TANF) program keep their jobs, stay off TANF, and find jobs with better pay, hours, benefits, and career advancement opportunities. The study assessed the implementation and two-year impacts of the Post-Assistance Self-Sufficiency (PASS) program in Riverside County, California. PASS included: case management; counseling and mentoring; reemployment activities; life skills workshops; referrals to education and training slots; arranging supportive service payments; and referrals to social service programs as requested by clients. TANF participants were randomly assigned to either PASS program group or to a control group who received regular TANF services.
Over the two-year follow-up period, PASS group members worked more consistently than control group members. The PASS program produced substantial increases in total earnings. PASS produced increases in employment and earnings primarily by increasing the proportion of sample members who found a subsequent job and there is no evidence that the program affected public assistance receipt during its first year. Substantial earnings impacts translated into increases in total income.
Report Title: The Employment Retention and Advancement Project: Results from the Post-Assistance Self-Sufficiency (PASS) Program in Riverside, CA, http://www.acf.hhs.gov/programs/opre/welfare_employ/employ_retention/reports/riverside_pass/river_title.htmlAgency Sponsor: ACF-OPRE, Office of Planning, Research and Evaluation
Federal Contact: Timothy Baker, 202-260-6165
Performer: MDRC
PIC ID: 8512
Do Minnesota Employment Retention and Advancement Program Participants Hold Jobs Longer or Advance in Those Jobs?
This study examined interim results for the Minnesota Employment Retention and Advancement Tier 2 program, which built on the State's Temporary Assistance for Needy Families (TANF) Tier 1 program which served welfare recipients who had not found jobs through standard welfare-to-work services. The program sought to test whether providing enhanced services to a hard-to-employ population would result in increased employment and retention. In addition to those services provided in the Tier 1 program, Tier 2 provided: (1) smaller caseloads for program staff to facilitate more attention to the unique circumstances of individuals and their families; (2) a more in-depth assessment of new cases, covering a wide range of issues facing clients and their families; and (3) a greater emphasis on assigning and referring individuals to a broader range of services, including supported employment positions and more specialized services, such as those available from programs that help people with mental health or substance-related problems. The evaluation used a random assignment design to assess the effectiveness of the Tier 2 program compared to the Tier 1 program.
The program had little effect on employment or earnings over the one and a half years of follow-up. An early increase in employment did not persist. The Tier 2 program led to a modest increase in employment for those with recent work experience, although the effects faded after the first year. The Tier 2 program had no added effect on public assistance receipt over the follow-up period as a whole. Many families left welfare on their own over time.
Report Title: The Employment Retention and Advancement Project: Results from Minnesota's Tier 2 Program, http://www.acf.hhs.gov/programs/opre/welfare_employ/employ_retention/reports/minnesota_tier2/mn_tier2_title.htmlAgency Sponsor: ACF-OPRE, Office of Planning, Research and Evaluation
Federal Contact: Timothy Baker, 202-260-6165
Performer: MDRC
PIC ID: 8518
Do Chicago Employment Retention and Advancement Program Welfare Recipients Hold Jobs Longer or Advance in Those Jobs?
This study examined interim results for the Chicago site in the national Employment Retention and Advancement (ERA) project. Serving low-wage welfare recipients who were already working, the Chicago program tested the effectiveness of an approach to advance individuals into better jobs. The services in Chicago were tailored to individual participants after conducting an assessment and developing an individualized advancement plan. The program´s most commonly helped participants moved fairly quickly to new jobs that paid more. The service provider was well suited to implement this approach because it had strong relationships with many local employers. The program paid for many of the costs, for things such as uniforms and training that participants incurred when starting new jobs. In some cases, ERA staff coached participants to ask for a raise or more hours in their current job or contacted the participant´s employer directly to discuss advancement opportunities. A randomly assigned group of eligible participants was assigned to a control group that did not receive ERA services.
The program helped some people, who were not working, find jobs. ERA modestly increased employment during the first two years of the study period; this effect was somewhat larger the second year. It appears that ERA helped some participants move from informal jobs to somewhat higher-paying jobs in the formal labor market.
Report Title: The Employment Retention and Advancement Project: Results from the Chicago ERA Site, http://www.acf.hhs.gov/programs/opre/welfare_employ/employ_retention/reports/chicago_era/chicago_era_title.htmlAgency Sponsor: ACF-OPRE, Office of Planning, Research and Evaluation
Federal Contact: Timothy Baker, 202-260-6165
Performer: MDRC
PIC ID: 8520
Has the Population of Families Receiving Welfare, and Those That Have Left Welfare, Become More Disadvantaged Since Welfare Reform?
The project synthesized research and analyzed data on the composition of the Temporary Assistance for Needy Families (TANF) welfare caseload and the composition of those leaving welfare.
The study found that, in spite of large reductions in the caseload since the passage of TANF legislation, both the composition of the welfare caseload and the composition of those leaving welfare remained fairly stable by most measures. The caseload grew slightly older during the first years of welfare reform (1997-2001). There has been little increase in barriers to employment among both welfare recipients and welfare leavers, although there was an increase in health-related barriers among both groups during the first years of welfare reform. Work participation increased among female welfare recipients during the first years of welfare reform, but decreased during the later years (1999-2005). While employment decreased among those leaving welfare, employment was still higher for those that left welfare than those that remained on welfare.
Report Title: TANF Caseload Composition and Leavers Synthesis Report, http://www.acf.hhs.gov/programs/opre/welfare_employ/tanf_caseload/index.htmlAgency Sponsor: ACF-OPRE, Office of Planning, Research and Evaluation
Federal Contact: Seth Chamberlain, 202-260-2242
Performer: Urban Institute
PIC ID: 8521
Why and How Use Vouchers in Federal Assistance Programs?
This study represented a first step toward better understanding the role of indirect funding mechanisms, such as vouchers, in advancing two important policy goals: increasing client choice of social service provider and expanding the array of available providers to include faith-based and community organizations.
Research found that voucher use varied greatly between Temporary Assistance for Needy Families (TANF) and the Child Care Development Fund (CCDF), the two programs studied. Some TANF programs integrated client-choice concepts into their contract-based service delivery system by offering clients a choice from among a set of contracted providers. However, the use of vouchers alone did not maximize client choice; program policies and procedures also influenced the level of choice. And while program officials recognized and appreciated the role of faith-based and community organizations in providing child care and services to the low-income, they do not seem to consider vouchers as a specific means of expanding the role of faith-based and community organizations in the service delivery network.
Report Title: Using Vouchers to Deliver Social Services: Considerations Based on the CCDF and TANF Program Experiences, http://aspe.hhs.gov/hsp/07/vouchers/experiences/
Agency Sponsor: ASPE-OHSP, Office of Human Services Policy
Federal Contact: Alana Landey, 202-401-6636
Performer: Mathematica Policy Research, Inc.
PIC ID: 8529
Why Does Child Support Debt Grow; Is It Collectable?
Child support debt in nine States was studied. In FY 2005, the Child Support Enforcement program collected about $22 billion, but over $105 billion remained on State child support accounts as uncollected support (arrears) from prior years. To learn more about who owes this debt, why it has grown so rapidly, and how collectable it is, State administrative data from nine large States were matched to Federal wage and unemployment insurance (UI) data.
Most debtors had little reported income; 70 percent of total arrears were owed by parents earning $10,000 a year or less. Support orders for low-income non-custodial parents were relatively high compared to income. On average, those with incomes of $10,000 a year or less were ordered to pay 83 percent of their income to child support, compared to 11 percent of income for those earning $40,000 a year or more. Most obligors paid about 10 percent of their income in child support, regardless of order amount. Without changes in State policies and procedures, child support debt is estimated to grow by 59 percent over the next ten years. Not surprisingly, States that charge interest on child support debt have experienced greater rates of debt growth.
Report Title: Assessing Child Support Arrears in Nine Large States and the Nation, http://aspe.hhs.gov/hsp/07/assessing-CS-debt/index.htm
Agency Sponsor: ASPE-OHSP, Office of Human Services Policy
Federal Contact: Jennifer Burnszynski, 202-690-8651
Performer: The Urban Institute
PIC ID: 8532
What Does the Low-Income Child Care Market Look Like After Welfare Reform; What Characterizes Family Child Care?
This project studied the low income child care market in 25 communities in 17 States with a sub-study examining family child care in 5 neighborhoods. A survey was conducted of 2,500 low-income families to determine how they made child care decisions and to study the relationship between child care subsidies and their choices.
Family child care is different from center-based child care. It is typically provided in a private home, there are fewer children, and the caregiver is often related to the parent. For the sub-study, 650 parents and their family child care providers were interviewed and observations made of the child-caregiver interactions in the providers' homes. Parents using child care subsidies were interviewed in larger numbers relative to other groups in order to obtain more statistically robust results.
The sub-study found that family child care providers often accommodated the varied work schedules of the mothers (most of whom worked full-time, though their employment was unstable and they frequently did not work normal business hours). Parents believed they had alternative child care options available. Parents´ most frequent reasons for choosing their current child care arrangements were (a) the provider's home was safe, (b) the provider's arrangement worked well logistically with the parent's schedule and location, and (c) the parent had a trusting relationship with the provider. Family child care homes were indeed safe for children, and providers showed affection for and supervision of children, though learning activities comprised less than 10 percent of children's time in the home. On average, providers charged $83.17 per week of care, or $60.03 if the child was a relative. Families receiving child care subsidies spent less than half as much for out-of-pocket than parents of children not receiving subsidies.
Report Title: National Study of Child Care for Low-Income Families: Care in the Home: A Description of Family Child Care and the Families and Children Who Use It, Wave 1 Report, http://www.acf.hhs.gov/programs/opre/cc/nsc_low_income/index.html
Agency Sponsor: ACF-OPRE, Office of Planning, Research and Evaluation
Federal Contact: Seth Chamberlain, 202-260-2242
Performer: Abt Associates Inc.
PIC ID: 8547.1
What Characterizes Early Head Start Programs?
This Survey of Early Head Start Programs collected quantitative data on all programs and qualitative information during 17 site visits. Rapid expansion of the Early Head Start program during the past decade has increased the need for descriptive information on the program. The survey included a comprehensive set of questions on program management and services in order to answer several questions: What are the characteristics of the programs and what services do they provide and to whom? How are programs managed and staffed? Do key program subgroups differ in their characteristics and how? Researchers obtained a response rate of nearly 90 percent; a remarkable result.
Early Head Start programs are equally likely to be located in urban or rural areas. Forty-two percent are in areas of increasing cultural diversity. About one-third of Early Head Start programs are small, serving 50 or fewer children and pregnant women; nearly three-quarters serve 100 or fewer. A few programs are large, with enrollment in the hundreds. Sixty-two percent of Early Head Start children enter the program between birth and age 2. Fairly high levels of family risk factors are prevalent across Early Head Start programs, in part because programs prioritize the families with greatest needs for enrollment. Across the universe of Early Head Start children, 20 percent of all Early Head Start children have been referred for evaluation of a suspected disability, and many are receiving services (76 percent). Communication disorders and developmental delays are the most common types of developmental concerns among Early Head Start children.
Most programs used a multiple service delivery model, providing both home- and center-based services. Only a few offered both types of services to all their families (combination approach). Among programs providing center-based services though their own centers, nearly half offered home visits twice a year, and the remainder did so more frequently. Notably, among programs that provided services through partners, 64 percent offered home visits more than twice a year. Ninety-five percent of programs had directors and managers with BAs or advanced degrees. In 47 percent of programs, at least half the home visitors had a BA. Few programs (13 percent) reported that all primary caregivers had an AA or higher; for 32 percent, the figure is at least half. Turnover rates among primary caregivers and home visitors were higher-between 20 and 24 percent, on average.
Report Title: Findings from the Survey of Early Head Start Programs: Communities, Programs, and Families, http://www.acf.hhs.gov/programs/opre/ehs/survey_ehs/index.html#reportsAgency Sponsor: ACF-OPRE, Office of Planning, Research and Evaluation
Federal Contact: Rachel Cohen, 202-205-8810
Performer: Mathematica Policy Research, Inc.
PIC ID: 8576
How Dependent Are Americans On Social Welfare Programs?
This analysis of indicators of welfare dependence for the tenth annual report to Congress examined the extent to which Americans were dependent on social welfare programs. The analysis identified welfare dependence indicators through 2004, reflecting changes that had taken place since enactment of major welfare reform legislation in 1996, the Personal Responsibility and Work Opportunity Reconciliation Act. The analysis used a variety of data sources, including the Current Population Survey and the Survey of Income and Program Participation. Current Population Survey data were analyzed using the Transfer Income Model (TRIM3) microsimulation model, which simulates the major governmental tax, transfer, and health programs that affect the U.S. population and helps to correct for under-reporting of benefit receipt.
Overall, three million fewer Americans were dependent on welfare in 2004 compared to 1996. Indicators from the data sources showed a substantial decline in the percentage of individuals dependent upon welfare since 1996, concurrent with the more widely reported declines in the percentage of individuals receiving welfare benefits. In 2004, 3.7 percent of the total population was dependent upon welfare benefits, in that they received more than half of their total family income from the Temporary Assistance for Needy Families, Food Stamp, and/or Supplemental Security Income programs. While slightly higher than the 3.6 percent dependency rate measured in 2003, the 2004 rate was lower than the 5.2 percent rate measured in 1996.
Report Title: Indicators of Welfare Dependence Annual Report to Congress 2007, http://aspe.hhs.gov/hsp/Indicators07/
Agency Sponsor: ASPE-OHSP, Office of Human Services Policy
Federal Contact: Susan Hauan, 202-690-8698
Performer: Staff of the Office of the Assistant Secretary for Planning and Evaluation
PIC ID: 8581
Which Poor Single Mothers Exit and Remain Out of Poverty?
This secondary data analysis examined the extent to which single mothers are able to exit and remain out of poverty, and the factors most strongly associated with their continued economic progress. The population of single mothers includes those who have never received welfare but may be at greater risk of needing public assistance. The study used the 2001 Survey of Income and Program Participation to examine the income and employment experiences of a nationally representative sample of single mothers who exited poverty.
Among all single mothers in 2001, thirty percent exited poverty by the end of 2001. The most common event associated with poverty exits was an increase in employment or earnings. Seventy-two percent of single mothers who exited poverty returned to poverty within two years. The single mothers who exited poverty and stayed out of poverty tended to be older and had somewhat more education. They also experienced the largest earnings increases over the follow-up period, and tended to have higher-paying jobs with more benefits.
Report Title: Economic Patterns of Single Mothers Following Their Poverty Exits, http://aspe.hhs.gov/hsp/07/PovertyExits/index.htm
Agency Sponsor: ASPE-OHSP, Office of Human Services Policy
Federal Contact: Laura Chadwick, 202-690-7772
Performer: Mathematica Policy Research, Inc.
PIC ID: 8586
How Do Community Services Block Grant Projects Reduce Poverty, Revitalize Low-Income Communities and Empower Family and Individual Self-Sufficiency?
The use of Community Services Block Grant (CSBG) funds was evaluated as mandated by law. The evaluation examined how 50 States, the District of Columbia, Puerto Rico and CSBG eligible entities used funds they received under the program. In 2004, nearly $643 million CSBG block grant funds were used by States and local CSBG eligible entities to provide assistance to low-income eligible individuals and households. States reported that $100 million was used for emergency services, $93 million for self-sufficiency programs that offered a planned continuum of services to assist families in becoming more financially independent, $66 million for education programs, $60 million for employment programs, $50 million for CSBG-coordinated housing programs, $48 million to support nutrition programs, $28 million for income management programs, and $24 million for health programs. An additional $94 million was spent on linkage initiatives that mobilized additional resources and improved community coordination in response to poverty.
Approximately 15 million individuals were assisted in fiscal year 2004. These individuals were often members of the same households. More than half of the program participant families included children younger than 18 years old. Just over one third of these families had both parents present. Single mothers headed most of the families with children receiving CSBG-funded assistance. Single fathers headed about five percent of families receiving assistance. These findings show how States used CSBG funds to change conditions that perpetuate poverty, especially emergency services, unemployment, inadequate housing, poor nutrition, and lack of educational opportunity.
Report Title: Community Services Block Grant Program Report to Congress Fiscal Year 2004. Report may be obtained from Federal Contact
Agency Sponsor: ACF-OCS, Office of Community Services
Federal Contact: Anita Wright, 202-690-5660
Performer: National Association for State Community Services Programs
PIC ID: 8590
Are Child Care and Development Funds Serving Rural Children?
This project examined the extent to which subsidies from the Child Care and Development Fund (CCDF) served families in urban and rural areas of the country in FY 2004. The project used county identification codes from administrative records to identify the urban or rural geography of the counties in which recipients resided. While some counties consisted almost entirely of either urban or rural areas, many contained a blend of city and countryside land masses and were not easily defined with a two-category identification system. To address this challenge, the researcher used the Isserman Urban-Rural Density classification system and placed each child into one of four types of counties based on the blend of urban and rural areas inside their borders.
Overall, the analyst found that the distribution of CCDF caseloads approximately matched the distribution of children in all income groups residing in those areas. For example, about 61 percent of the CCDF caseload resided in urban or partially urban counties, which was about the same percentage of the nation's under-ten child population that lived in those counties. The study also compared the characteristics of subsidy recipients in urban and rural areas of the country and found that urban and rural caseloads had many similarities. Families in both urban and rural areas predominately used the program to attend work, versus training activities, and their children were in subsidized care for over 30 hours per week. The study confirmed previous findings that rural CCDF children participated in center programs at lower rates than urban CCDF children.
Report Title: Child Care Subsidies In Urban And Rural Counties, http://aspe.hhs.gov/hsp/07/cc-subsidies/index.htm
Agency Sponsor: ASPE-OHSP, Office of Human Services Policy
Federal Contact: Kendall Swenson, 202-690-6888
Performer: Staff of the Office of the Assistant Secretary for Planning and Evaluation
PIC ID: 8592
How Does Outcome Performance of State and Local Community Services Block Grant Agencies Impact the Lives of Low-income Americans?
States´ success promoting individual and community economic advancement was evaluated as required by statute. This study examined Fiscal Year 2004 program outcome information from all 50 States, the District of Columbia and Puerto Rico. The study examined the impact of CSBG programs and activities on families and communities using 12 National Performance Indicators (NPI) which covered such areas as: employment; assets; community improvement, revitalization, and quality of life; community empowerment; partnerships; independent living; emergency assistance; and child and family development. The use of the NPI enabled State and local eligible entities receiving CSBG funds to report program outcomes reflecting the anti-poverty work performed in more than 1,000 communities.
As a result of CSBG assistance low-income participants were assisted:
- 3,313,789 participants obtained food assistance,
- 378,120 existing housing units were improved or preserved through construction weatherization, or rehabilitation,
- 156,366 households participated in tax credits,
- 126,821 participants obtained health care services,
- 105,072 organizations worked to promote anti-poverty outcomes,
- 103,088 participants obtained child care for pre-school children or dependents,
- 103,057 unemployed people obtained a job,
- 101,206 households obtained $33,434,237 in child support payments,
- 72,810 people with jobs obtained a salary increase,
- 56,283 people obtained pre-employment skills with certificates or diplomas,
- 44,101 households opened savings plans,
- 30,776 people completed Adult Basic Education or GED coursework and received certificates or diplomas, and
- 5,645 people were helped to purchase their own homes.
Contributing to this effort were 44,058,304 hours of volunteer services to CSBG programs.
Report Title: Performance Measurement Report Fiscal Year 2004. Report may be obtained from Federal Contact
Agency Sponsor: ACF-OCS, Office of Community Services
Federal Contact: Anita Wright, 202-690-5660
Performer: National Association for State Community Services Programs
PIC ID: 8596
Are Social Services Block Grant Program Funds Used by States and Territories to Provide Services to Adults and Children?
Use of Social Services Block Grant (SSBG) Program funds were examined by this study. States use the flexible funding to provide a wide range of critical services to vulnerable older adults, persons with disabilities, at-risk adolescents and young adults, and children and families. Programs most frequently supported by SSBG include child care, child welfare, services for persons with disabilities, home-based services, and protective services for adults. Each year, States must submit data on SSBG expenditures and recipients for services. The SSBG appropriation for 2005 was $1.7 billion. Funds are allocated under the SSBG in proportion to each State's population.
In 2005, almost 17 million individuals received services funded partially by the SSBG. Sixty-three percent of these recipients were children. The largest number of recipients received child day care services. The service categories receiving the highest proportion of SSBG funds were child foster care services, child protective services, special services for individuals with disabilities and child day care services. For the five service categories receiving the largest amounts of funds from 2001 to 2005, expenditures increased for child care, foster care services, and special services for persons with disabilities, and decreased for child protective services and home-based services.
Report Title: Social Services Block Grant Program Annual Report, 2005, http://www.acf.hhs.gov/programs/ocs/ssbg/annrpt/2005/index.html
Agency Sponsor: ACF-OCS, Office of Community Services
Federal Contact: Marsha Werner, 202-401-5281
Performer: Walter R. McDonald & Associates, Inc.
PIC ID: 8599
What Are the Fertility Patterns of Married and Unmarried Men?
This research explored fertility patterns of men. Much has been written about women´s fertility patterns but little comparable information is known about men.
Data available from the National Survey of Family Growth, 2002 suggest that for most men, fatherhood is restricted to marriage. A significant fraction of men, however, have complex fertility patterns including un-married births, and mixtures of marital and cohabiting births. A man's pattern of births is related to a wide range of social and economic circumstances. Importantly, a man's status at the time his first child is born is strongly predictive of his marital status when his other children are born. To the extent that marital births are associated with better outcomes for children and adults, this research suggests that any efforts to reduce men´s unwed births should be concentrated on delaying first births until after marriage.
Report Title: Marital and Unmarried Births to Men: Complex Patterns of Fatherhood, Evidence from the National Survey of Family Growth, 2002, http://aspe.hhs.gov/hsp/07/births-to-men/rb.htm
Agency Sponsor: ASPE-OHSP, Office of Human Services Policy
Federal Contact: Linda Mellgren, 202-690-6806
Performer: Steven Nock, University of Virginia
PIC ID: 8764
How Could Using Administrative Data Improve State Child Support Agencies' Performance?
This study examined how some of the information available to the Office of Child Support Enforcement and the States' child support programs (Title IV-D of the Social Security Act) through the Federal Parent Locator Service can be used to enhance enforcement efforts. This study explored the potential income sources of non-custodial parents with arrearages who have no reported income in the Unemployment Insurance (UI) Quarterly Wage data system. Researchers analyzed how arrearages for individual obligors changed over time, and how those changes were related to type and amount of income.
Among the findings were that while about twenty percent of debtors without wages were incarcerated, disabled or retired, many debtors with no wages in the UI wage data system might have been available for employment; some individuals with no reported wages in one year had other wage or wage-like income in a subsequent year; and debtors appeared to reduce their arrearages over time. Because wages may vary from year to year, States should continue to pursue collections from debtors with no indicated wages in any one year. By helping Federal and State policy makers and managers understand obligor income streams and debt patterns, it is hoped that this study will contribute to the development of additional data-driven solutions for enhancing child support collections. Researchers summarized information available from Federal Child Support Enforcement administrative data sources and described how that data could be used to answer program management questions.
Report Title: Enhancing Child Support Enforcement Efforts Through Improved Use of Information on Debtor Income, http://aspe.hhs.gov/hsp/07/CSE-enhancement/debtor/index.htm
Agency Sponsor: ASPE-OHSP, Office of Human Services Policy
Federal Contact: Linda Mellgren, 202-690-6806
Performer: The Lewin Group
PIC ID: 8768
How Do State Data Warehouses Support Child Support Performance?
This case study gathered information about State child support enforcement office experiences with data warehouses. The study examined how data warehouses were used to help manage program operations, assess program effectiveness and efficiency, and inform policy development. The information was collected through telephone discussions and site visits with staff in nine States.
The study found that States used their data warehouses for a variety of purposes, some focusing on Federal reporting, others on specified child support activities (e.g., locate). Some used the data warehouse to manage their programs (e.g., identifying underperforming offices, overstaffed functions), while others used it to assess new policies. While all States were subject to appropriate security and privacy protections, State child support programs granted different levels of access to their data warehouses. For example, in some instances, partner agencies could access limited data while in others, access was highly restricted. Finally, the State respondents had unique perspectives on best practices and advice for other child support programs interested in building data warehouses. This study will help States that want to develop data warehouse capacity to assess what data warehouse functionalities would best meet their needs for better information.
Report Title: Enhancing Child Support Enforcement Efforts: Summary of Data Warehouse Efforts in Nine States, http://aspe.hhs.gov/hsp/07/CSE-enhancement/data/index.htm
Agency Sponsor: ASPE-OHSP, Office of Human Services Policy
Federal Contact: Linda Mellgren, 202-690-6806
Performer: The Lewin Group and SRA International
PIC ID: 8769
Objective 3.2: Protect the safety and foster the well-being of children and youth.
How May Domestic Violence and Child Welfare Programs Best Serve Families in Which Children are Endangered by Domestic Violence?
Process and outcome evaluations were conducted of several federally funded demonstrations intended to improve service provision to families with children experiencing domestic violence. The group of demonstration sites operated from 2000-2007 and were known as the Greenbook Initiative, named after a publication that launched the effort. The demonstration initiative was sponsored jointly by the Department of Justice and the Department of Health and Human Services, with many public and private partners at the federal, state and local levels. The evaluations focused on systems level changes within communities to document both what changes took place and, importantly, how those changes occurred. Findings were based on based on interviews, document reviews, and research focused on the sites and related initiatives.
Among the findings: (1) the child welfare system was severely strained, limiting its ability to shift focus; (2) there were gaps in domestic violence policy and services for survivors; (3) strategies were undeveloped in addressing men's roles; and (4) services and support for children lagged behind consideration of parents' needs. Approaches that sites favored to improve service delivery included: (a) collaborative learning and practice as a prelude to new policy; (b) greater participation of survivor mothers and children; (c) greater investment in community; (d) strategies to address race, culture, and gender; (e) therapeutic and other services for mothers and children; (f) greater accountability for men who batter; and (g) broad, meaningful engagement of men as allies in protecting children.
Report Title: Steps Toward Safety: Improving Systemic and Community Responses for Families Experiencing Domestic Violence, http://www.thegreenbook.info/new_tools.htm
Agency Sponsor: ASPE-OHSP, Office of Human Services Policy
Federal Contact: Jerry, Silverman, 202-690-5654
Performer: Family Violence Prevention Fund
PIC ID: 8185.4
How Can Domestic Violence Treatment and Prevention Providers More Effectively Help Battered Mothers in the Child Welfare System?
The complex issues of mission, confidentiality, and service delivery methods that arise, when differing programs collaborate on behalf of their clients, were studied in the context of a longstanding collaborative effort known as the Greenbook Initiative. The initiative brought together public and private partners at the Federal, State, and local levels to help domestic violence and child welfare agencies and family courts work together more effectively to help families experiencing domestic violence. From 2000 to 2007, the U.S. Departments of Health and Human Services and Justice funded six demonstration sites across the country to improve services through collaborative programming. Process and outcome evaluations were conducted to capture lessons learned through these demonstrations. The evaluations focused on systems level changes within communities to document both what changes took place and, importantly, how those changes occurred. Study findings emphasized the roles of domestic violence service providers in addressing domestic violence and child protection jointly, and identified critical activities that enhance effectiveness.
Researchers developed descriptions of strategies, including: (1) creating safe spaces for mothers to talk; (2) defining the roles and the actions particular players can take; (3) developing relations with child welfare caseworkers; (4) knowing local laws, policies and procedures governing intervention with families; and (5) increasing the accessibility of program.
Report Title: Advocacy Matters: Helping Mothers and Their Children Involved with the Child Protection System, http://www.endabuse.org/programs/children/files/Advocacy.pdf
Agency Sponsor: ASPE-OHSP, Office of Human Services Policy
Federal Contact: Jerry, Silverman, 202-690-5654
Performer: Family Violence Prevention Fund
PIC ID: 8185.2
How May Communities Better Assess Their Family Domestic Violence and Child Maltreatment Services?
A community self assessment tool was developed based on lessons learned by demonstration projects that brought together public and private partners to help domestic violence and child welfare agencies and family courts work together more effectively to help families experiencing domestic violence. The evaluation focused on systems level changes within communities to document both what changes took place and, importantly, how those changes occurred.
An assessment tool was designed for communities that wished to further address co-occurring domestic violence and child maltreatment issues with the families they served. It provided a framework by which communities could perform a self-assessment of their strengths and challenges. It also suggested sources of assistance for communities that wanted to improve services in these areas through interagency collaboration. Areas identified by the evaluation as critical to collaborative progress were covered by the tool and included: systems interactions; practices, policies and protocols; resources; emerging issues; and community strengths and challenges.
Report Title: A Community Self-Assessment Tool: For Agencies Addressing the Co-Occurrence of Domestic Violence and Child Maltreatment,
Agency Sponsor: ASPE-OHSP, Office of Human Services Policy
Federal Contact: Jerry, Silverman, 202-690-5654
Performer: Family Violence Prevention Fund
PIC ID: 8185.3
Under What Circumstances Should a State or Community Consider Privatizing its Child Welfare Services?
This research provided information to State and local child welfare administrators considering privatizing foster care or adoption services. The analysis encouraged agency administrators and legislators to ask critical questions and make important choices prior to transitioning services to the private sector. Information was gathered from: telephone discussions with State child welfare administrators from 44 States and the District of Columbia; regional forums with public and private agency staff and community stakeholders that have privatized at least one component of the child welfare system; literature reviews; and follow up interviews and correspondence with public and private agency providers and key stakeholders from several States.
Researchers found that reasons for undertaking privatization reform were varied. A common theme was improving outcomes for children and families. To achieve these results, privatization efforts must be based on careful up-front assessment of current issues facing the child welfare system, thinking through where improvement is most desired, and scrutinizing the capacity of private providers to deliver expected results. Most experienced observers advised a thoughtful and inclusive planning process that includes a focus on contract design and infrastructure needs of the private provider community. Public agencies must also assess their own ability to take on new monitoring functions and oversee new or expanded contracts. Sites embarking on this assessment must be prepared to do this work in a politicized context.
Report Title: Assessing Site Readiness: Considerations about Transitioning to a Privatized Child Welfare System, http://aspe.hhs.gov/hsp/07/CWPI/
Agency Sponsor: ASPE-OHSP, Office of Human Services Policy
Federal Contact: Laura Radel, 202-690-5938
Performer: Planning and Learning Technologies, Inc.
PIC ID: 8509
How Effective Are Four Abstinence Education Programs?
This study examined the long-term impacts on participants´ behavior of four abstinence programs. The analysis used survey data collected four to six years after study enrollment from more than 2,000 teens. Study participants were randomly assigned to either a program group eligible to participate in an abstinence education program or to a control group that received only the usual services available in the absence of the abstinence education program.
Youth in the program group were no more likely than youth in the control group to have abstained from sex. Program and control group youth who reported having sex had similar numbers of sexual partners and had initiated sex at the same age. Contrary to concerns raised by critics of abstinence education, program group youth were no more likely to have engaged in unprotected sex than control group youth. The abstinence programs improved identification of sexually transmitted diseases (STDs) but had no overall impact on knowledge of unprotected sex risks. Both program and control group youth had a good understanding of the risks of pregnancy but a less clear understanding of STDs and their health consequences.
One implication of the study is that targeting youth solely at young ages (elementary and middle school) may not be sufficient. The study found that friends' support for abstinence was a significant predictor of future sexual abstinence, yet peer support for abstinence eroded sharply during the teen years. These findings suggest that promoting support for abstinence among peer networks into the high school years should be an important feature of future abstinence programs.
Report Title: Impacts of Four Title V, Section 510 Abstinence Education Programs, http://aspe.hhs.gov/hsp/abstinence07/report.pdf
Agency Sponsor: ASPE-OHSP, Office of Human Services Policy
Federal Contact: Lisa Trivits, 202-205-5750
Performer: Mathematica Policy Research, Inc.
PIC ID: 8626
How Effective is a Supplemental Life Skills Education Component Aimed at Increasing Sexual Abstinence?
This study examined the long-term effects of one of three main components of the Heritage Keepers® school-based abstinence education program: the Life Skills Education component. This component was a voluntary, character-based program designed to enhance a mandatory core abstinence education component of the Heritage Keepers® Program which served middle and high school youth in Edgefield, South Carolina. All youth participating in Life Skills Education had also participated in a core Abstinence Education Component and may have participated in a Community Education Component. Therefore, the study investigated the incremental impact of the Life Skills Education Component on youth already exposed to the other components of the Heritage Keepers® Program. The study did not examine the impact of the full Heritage Keepers® Program. The study was based on a final follow-up survey conducted with 604 youth, 18 to 55 months after they began participating in the study, in three separate cohorts.
The Life Skills Education Component had little or no impact on sexual abstinence or activity. Youth in the Life Skills abstinence education group and control abstinence education group reported similar rates of sexual abstinence, numbers of sexual partners, and ages at first sex. Youth in the Life Skills abstinence education group were also no more likely than their counterparts in the control abstinence education group to have engaged in unprotected sex (sex without a condom). The Life Skills Education Component did affect certain potential mediators of teen sex, most notably expectations to abstain and views supportive of abstinence. The component also had some impact on knowledge of the risks associated with teen sex. These impacts were driven almost entirely by youth in the 2003 middle school cohort––the youngest cohort at the time of the final follow-up survey and the cohort that had most recently enrolled in the component. Youth in this cohort averaged less than 14 years of age by the time of the final follow-up survey and were, therefore, excluded from the analyses of impacts on behavior.
Report Title: Impact of the Heritage Keepers® Life Skills Education Component, http://aspe.hhs.gov/hsp/abstinence07/HK/report.pdf
Agency Sponsor: ASPE-OHSP, Office of Human Services Policy
Federal Contact: Lisa Trivits, 202-205-5750
Performer: Mathematica Policy Research, Inc.
PIC ID: 8627
Do Efforts to Involve Parents in Their Kids' Pregnancy Prevention Programs Work?
The study assessed the effectiveness of parental involvement strategies to influence adolescent behavior in programs funded by the Office of Population Affairs; these included Title X (Population Research and Voluntary Family Planning) and XX (Adolescent Family Life Demonstration) programs of the Public Health Service Act. The assessment consisted of a literature review and site visits to five Title X family planning projects, five Title XX adolescent pregnancy prevention projects, and five Title XX pregnant and parenting adolescents care projects. The site visits collected qualitative data on parental involvement strategies used, barriers encountered and lessons learned. The literature assessment examined reproductive health programs with parental involvement components, and focused on those with the best available systematic evidence on the impact on adolescents' reproductive health attitudes and behaviors.
There was mixed evidence for effectiveness of parent involvement programs. A number of limitations to the best available studies were noted, suggesting the need for more evaluation effort in this area. The site visits made clear the difficulty of inducing parents to participate in such programs. Barriers to parental participation were pronounced. Obstacles included: logistics, psychosocial factors, relationship dynamics, and culture.
Report Title: An Assessment of Parent Involvement Strategies in Programs Serving Adolescents, http://opa.osophs.dhhs.gov/pubs/parent_involvement_finalreport_9-11-07_psg.pdf
Agency Sponsor: OPHS-OPA, Office of Population Affairs
Federal Contact: Susan Dunnell, 240-453-2845
Performer: RTI International
PIC ID: 8659
Objective 3.3: Encourage the development of strong, healthy, and supportive communities.
How Many and Who Receives What Kind of Energy Assistance under the Low Income Home Energy Assistance Program?
Program staff analyzed service and expenditure data for the Low Income Home Energy Assistance Program (LIHEAP). The block grant program assists low income households, particularly those with the lowest incomes that pay a high proportion of household income for home energy, primarily in meeting their immediate home energy needs. LIHEAP assistance was provided in FY 2004 through block grants to the 50 States, the District of Columbia, Indian Tribes and Tribal Organizations, and U.S. Insular Areas.
Five million low income households received help with heating costs in FY 2004 compared to 4.8 million the previous year. These households represented 14 percent of all households with incomes under the Federal LIHEAP income eligibility cutoff. Households that received heating assistance were among the poorer households (median household poverty level of 80 percent) within the LIHEAP income eligible population (median household poverty level of 124 percent).
About 32 percent of the eligible households receiving heating assistance had at least one member 60 years or older, compared to 40 percent in the previous year. Similarly about 32 percent of eligible households receiving heating assistance included at least one member with a disability, compared to 34 percent the previous year. About 22 percent of households included at least one child 5 years or younger, compared to 19 percent of all eligible low income households that had at least one child 5 years or younger the previous year. Households receiving cooling assistance had the highest concentration of elderly members (35 percent) and the highest concentration of disabled members (40 percent) compared to other types of LIHEAP assistance. Households receiving winter/year-round crisis assistance had the highest concentration of young children (30 percent).
Report Title: LIHEAP Report to Congress for Fiscal Year 2004. Report May Be Obtained from Federal Contact
Agency Sponsor: ACF-OCS, Office of Community Services
Federal Contact: Leon Litow, 202-401-5304
Performer: Office of Community Services, ACF
PIC ID: 8578
Do Faith-Based and Community Organizations Receiving Capacity Building Compassion Capital Funds Expand Capacity?
A survey was conducted February and March 2006, three and one-half years after grassroots organizations received capacity building funds under the Compassion Capital Fund. To obtain information about the experiences of organizations assisted during the first years of the program, this study surveyed a sample of 173 faith-based and community organizations (FBCOs). The organizations received capacity building assistance in the form of training, technical assistance, and financial assistance from intermediary organizations.
FBCOs were particularly positive about the extent to which Compassion Capital Fund support contributed to improved level or quality of services and improved organizational capacity. Ninety percent of FBCOs reported that the Compassion Capital Fund services contributed "to a great extent" or "somewhat" to improvements in these developmental areas. Eighty-eight percent reported that the assistance made a positive difference in improving their participants´ outcomes. Over three-quarters (79 percent) of the organizations indicated that the assistance helped improve their financial stability.
Report Title: Findings from a Retrospective Survey of Faith Based and Community Organizations: An Assessment of the Compassion Capital Fund, http://www.acf.hhs.gov/programs/ccf/surveys/retrospective/retrospective_page1.html
Agency Sponsor: ACF-OPRE, Office of Planning, Research and Evaluation
Federal Contact: Nancye Campbell, 202-401-5760
Performer: Abt Associates Inc
PIC ID: 8624
How Have Communities Been Made Aware of and How Did They Decide to Implement the Protocol for Assessing Community Excellence in Environmental Health?
The study examined how communities learned about and decided whether to use a Protocol for Assessing Community Excellence in Environmental Health. The Protocol was designed to engage the community in environmental health planning and assessment activities.
Adoption decision influences included: organizational capacity, health services offered, existing partnerships, and the presence of an in-house "champion." Prior experience with other strategic assessment protocols did not predict whether agencies would decide to implement the Protocol. The majority of implementers were large county health departments with a relatively large number of staff, as well as higher numbers of staff focused on environmental health issues. Non-implementers tended to be agencies which served a smaller population and had fewer employees. Implementers had a lower percentage of their operating budget coming from local general funds or fee-for-service arrangements and more from State or Federal funds. Implementers more frequently reported that their agencies provided a wider range of environmental health services, were more likely to agree that they had adequate staff and money available, and that they had community partners who could contribute resources. Implementers were also more likely than the non-implementing group to agree that the Protocol was supported by their agency´s leadership and fit with the agency´s priorities and business style.
Report Title: Process Evaluation of the Protocol for Assessing Community Excellence in Environmental Health (PACE EH), http://www.cdc.gov/nceh/ehs/CEHA/Docs/PACE_EH_Final_Report_Process_Evaluation.pdf
Agency Sponsor: CDC, Centers for Disease Control
Federal Contact: Julie Zajac, 404-498-4381
Performer: Battelle Memorial Institute
PIC ID: 8708
Objective 3.4: Address the needs, strengths, and abilities of vulnerable populations.
What Native American Health and Well-being Data are Missing; How Can They Be Obtained?
Researchers for the "Data on Health and Well-being of American Indians, Alaska Natives, and Other Native Americans" project, identified gaps in data on health and well-being of American Indians, Alaska Natives, and Native Americans (AI/AN/NA). Researchers identified strategies for improving data availability and quality and some current initiatives underway within HHS and other Federal agencies that are intended to improve these data. Findings were drawn from a review of the literature, analysis of detailed profiles of 67 data sources included in another project deliverable ("Data Catalog on AI/AN//NA Health and Well-being"), and interviews with data experts.
There were some data available on health and well-being of the combined AI/AN –population and the combined Native Hawaiian (NH)/Pacific Islander (PI) population for all of the health and well-being policy areas that were the focus of this study. There are fewer data available, however, when the data sets examined were restricted to those that had sample sizes of at least 200. Data to examine measures of health and well-being for the separate AI, AN, NH and PI groups were less available than for the AI/AN combined and NH/PI combined groups. A substantial number of initiatives either underway or planned will help fill these gaps, but cannot fill them completely. Coordination and sharing of results to improve databases across Federal agencies and States could help further reduce data gaps.
Report Title: Gaps and Strategies for Improving AI/AN/NA Data, http://aspe.hhs.gov/hsp/07/AI-AN-NA-data-gaps/index.htm
Agency Sponsor: ASPE-OHSP, Office of Human Services Policy
Federal Contact: Alana Landey, 202-401-6636; Peggy Halpern 202-260-0285
Performer: Westat, Inc.
PIC ID: 8527
Will Targeted Training Improve Teaching Practices For School Readiness of At-Risk, Low-Income Children?
The study looked at two kinds of teacher training outcomes: teacher behavior, interactions with children, and aspects of the classroom environment that support children´s language and literacy development; and children´s language and pre-literacy skills. Teacher behavior was measured through direct observation; children´s development was measured by their performance on a standardized assessment. Project Upgrade was a two-year experimental test of the effectiveness of three different language and literacy interventions implemented in child care centers in Miami-Dade County, Florida, that served children from low-income families. One hundred and sixty-two centers were randomly assigned to one of three research-based curricula or to a control group that continued with its existing program. The curricula, while grounded in a common set of research findings, differed in intensity, pedagogic strategies and use of technology. In each center, one classroom that served four-year-old children was selected for the study.
Teachers who received targeted training and technical assistance were able to improve young children´s development of language skills. The interventions led to changes in teachers´ behaviors and interactions with children, including substantial increases in the time spent on language and literacy activities. The impact was generally stronger for teachers whose primary language was Spanish than for their English-speaking counterparts. Two of the three interventions affected language and literacy development more greatly for children in classrooms with Spanish-speaking teachers. The two interventions that affected children´s language and literacy skills brought children close to or above national norms on three of the four language and literacy skills measured, representing between four and nine months of developmental growth.
Report Title: Findings from Project Upgrade in Miami Dade County, http://www.acf.hhs.gov/programs/opre/cc/upgrade_miami_dade/reports/upgrade_miami_dade/miami_title.html
Agency Sponsor: ACF-OPRE, Office of Planning, Research and Evaluation
Federal Contact: Ivelisse Martinez-Beck, 202-690-7885
Performer: Abt Associates Inc.
PIC ID: 8585
Does Cultural Competency Training for Doctors Improve Their Services to and Health Outcomes Achieved by Racial/Ethnic Minorities and New Immigrant Patients?
This project tested cultural competency curriculum modules (CCCMs) developed and launched in 2004 (see PIC #7713). The modules equipped physicians with cultural and linguistic competencies required to interact effectively with racial/ethnic minorities and new immigrants. The modules comprised an interactive online curriculum (at www.thinkculturalhealth.org) available at no cost to the public and accredited for continuing education units for physicians, nurses, and pharmacists. A 2-year evaluation, using a mixed study design employing both quantitative and qualitative methods, was conducted to assess the impact of the modules on physicians' knowledge, attitudes, and skills in providing culturally competent care to a diverse patient base.
Overall, the modules enhanced participants' self-awareness of their own cultural competency, their communication practices with their patients, and changes in the perception and use of medical interpreters. However, there was limited evidence that the program resulted in behavioral change which led to improved minority health and reduced health disparities. Further research is needed to determine the correlation between increasing cultural competency for medical practitioners and improved health outcomes. Providers need tools, such as the cultural competency curriculum modules, to effectively treat minority and new immigrant populations as they continue to increase as the Nation becomes more diverse.
Report Title: Evaluation of Cultural Competency Training Programs for Physicians, http://www.thinkculturalhealth.org/cccm/papers/Evaluation%20Report%20final.pdf
Agency Sponsor: OPHS-OMH, Office of Minority Health
Federal Contact: Guadalupe Pacheco, 240 453-2882
Performer: Science Applications International Corporation (SAIC)
PIC ID: 8625
How Develop Marriage and Family Life Support Services for Prisoners and Their Partners?
This project identified factors to consider when designing and implementing strategies to improve marriages and family life of those incarcerated or returning from a period of incarceration. Invited to a symposium were experts with research and practice knowledge about incarceration and re-entry, marriage strengthening family processes and domestic violence. The symposium discussion focused on increasing understanding among the criminal justice and marriage education disciplines about how these issues are viewed by each discipline, identifying practice needs in order to improve marriage outcomes for these couples, and reviewing research for improved understanding of the efficacy of various interventions for this population.
Researchers summarized the wide-ranging discussion. The environment in prisons and jails makes them difficult places in which to enhance and maintain healthy relationships with partners and children. Psychological and health concerns pose significant hurdles for reuniting families. Domestic violence is a critical issue; including domestic violence protocols in marriage education and relationship strengthening programs for this population was suggested. Specific areas where research on marriage and incarceration and evaluation of effective practices are needed were discussed and summarized.
Report Title: Research and Practice Symposium on Marriage and Incarceration, http://aspe.hhs.gov/hsp/07/marr-incar/index.htm
Agency Sponsor: ASPE-OHSP, Office of Human Services Policy
Federal Contact: Linda Mellgren, 202-690-6806
Performer: Health Systems Research, Inc
PIC ID: 8767
Goal 4 - Scientific Research and Development: Advance scientific and biomedical research and development related to health and human services.
Everything that can be counted does not necessarily count; everything that counts cannot necessarily be counted. – Albert Einstein
Objective 4.1: Strengthen the pool of qualified health and behavioral science researchers.
Is it Feasible to Evaluate Training and Career Development Programs?
This feasibility study designed an evaluation to examine outputs from select National Institute of Arthritis and Musculoskeletal and Skin Diseases research training and career development award programs. The study included a meeting of a Working Group to assess the feasibility of the evaluation and to provide advice on the proposed design of a process evaluation of four funding mechanisms: post-doctoral Institutional Research Training Grants, Individual Postdoctoral Fellowships, Mentored Research Scientist Award, and Mentored Clinical Scientist Development Award.
The Working Group agreed that the proposed design and approach for developing the process evaluation was feasible and recommended that the Institute develop the larger evaluation.
Report Title: Training Grant and Career Award Program Evaluation Working Group Feasibility Report, . Report may be obtained from Federal Contact
Agency Sponsor: NIH, National Institutes of Health
Federal Contact: Wilma Peterman, MS, 301-496-0803
Performer: McManis & Monsalve
PIC ID: 8458
What Direction Should the Extramural Associates Research Development Award Program Pursue?
Evaluators assessed implementation and outcomes of the Extramural Associate (EA) Program. The Extramural Associates Research Development Award Program had been established to provide grant support to minority and women educational institutions seeking to increase their involvement in biomedical and behavioral research and research training.
Based on findings from the Web-based survey, interviews with EAs, and the grantee file review, the Program was being implemented as planned. Extramural Associates expressed satisfaction with the grant application process. Less than one-third learned about the program from workshops or communication with the program office and EA program mailings. EAs reported positive experiences and success with implementing activities that addressed many of the goals and objectives. EAs reported supporting pilot research projects, supporting grant writing at their institution, supporting attendance at outside workshops, and supporting administrative assistants in completing a grant application. EAs reported that their institutions, on average, achieved 13 of 18 common EA program goals and many of which could be viewed as intermediate or long-term goals. Qualitative data from site visits and interviews suggested that the barriers to achieving these goals were related to administrative turnover, heavy teaching workloads, and the institution´s primary mission, which focused more on teaching.
Report Title: Report on the Extramural Associates Research Development Award: Program Evaluation. Report may be obtained from Federal Contact
Agency Sponsor: NIH, National Institutes of Health, National Institute of Child Health and Human Development (NICHD)
Federal Contact: Paul Johnson, Ph.D., 301-402-3213
Performer: National Institutes of Health, (NIH), HHS
PIC ID: 7627
Should an Outcome Evaluation of the Small Animal Imaging Resource Program Be Conducted?
This feasibility study developed an evaluation design and identified methods for evaluating the effectiveness of Small Animal Imaging Research Programs (SAIRPs). The grantee annual progress reports were giving snapshots of the activities, but mostly presented their results in terms of numbers of papers published and grants funded. Researchers identified publications: 105 were review articles, comments, or reports from congresses/meetings. Of the 689 journal articles reported, 450 were SAIRP publications, of which 336 (75 percent) were SAIRP-only; 370 publications were identified by National Library of Medicine MEDLINE searches, while an additional 80 publications were identified solely from the records provided by the program officer.
Publication productivity was shown to be stabilized around approximately 100 publications per year though publication rates might vary by institution. SAIRP publications appeared in five of the ten high-impact journals. Researchers recommended a cross-sectional approach to an outcome evaluation design as the most likely to demonstrate effects of the SAIR program with least risk of failure.
Report Title: Feasibility Study for an Evaluation of the Small Animal Imaging Research Program. Report may be obtained from Federal Contact
Agency Sponsor: NIH, National Institutes of Health
Federal Contact: Barbara Y. Croft, Ph.D., 301-435-9025
Performer: STPI/IDA, Science and Technology Policy Institute, Institute for Defense Analysis
PIC ID: 8742
Objective 4.2: Increase basic scientific knowledge to improve human health and human development.
How has the Trans-HHS Special Statutory Funding Program for Type 1 Diabetes Research Impacted Research Progress in the Field?
This process and outcome-oriented evaluation examined the impact that a special funding program for type 1 diabetes research had on the field of type 1 diabetes. (In type 1 diabetes, previously known as juvenile diabetes, the body does not produce insulin, a hormone needed to convert sugar (glucose), starches and other food into energy needed for daily life.) This special funding program administered by the National Institute of Diabetes and Digestive and Kidney Diseases in collaboration with other NIH Institutes and Centers and the Centers for Disease Control and Prevention (CDC). To conduct the evaluation, several metrics were employed, including professional assessment by groups of external experts in type 1 diabetes or related fields; stakeholder input by the program´s grantees; bibliometric analysis to examine the program-supported scientific publications and their impact on the scientific community; and a grant portfolio analysis.
The analysis found that research supported by the special funding program has led to significant scientific advances, yielded robust scientific output (at least 4,755 associated scientific papers that have been cited over 19,000 times in other publications), supported the development of key research resources that are being used by the broad scientific community, and attracted new investigators to pursue research on type 1 diabetes and its complications. Furthermore, the evaluation showed that the special funding program has created a critically important research pipeline that facilitates the identification of new therapies in the laboratory, readies these therapies for testing in people, and provides the infrastructure to support human clinical trials to test these promising therapies. Thus, research supported by the special funding program is directly impacting the health and quality of life of people with type 1 diabetes. Because many of the programs supported by the special funding program are recently established and require long time horizons to complete, external experts evaluating the program anticipate that ever greater benefits to the health of patients will be achieved in the coming years.
Report Title: Evaluation Report on the Special Statutory Funding Program for Type 1 Diabetes Research, http://www.T1Diabetes.nih.gov/evaluation
Agency Sponsor: NIH, National Institutes of Health
Federal Contact: Mary Hanlon, Ph.D., 301-496-6623
Performer: NIH with logistical support from Macro International, Inc.; Atlanta, GA
PIC ID: 8817
How Best Present Device and Radiological Health Information Online?
This study determined what content was important to Web site users and how best to group and label this content. Ninety four terms and phrases from FDA´s Center for Devices and Radiological Health (CDRH) Web site were used. Card sorting is a way to gain insights into what users think about web site content and how they would organize the information on the web site. Eighteen participants including consumers, healthcare professionals, and medical device manufacturing representatives, participated.
Participants had a moderately high level of agreement about the top-level categories. Participants tended to separate the contents into more groups than currently exist on the site. The study identified 16 phrases that caused serious confusion. An additional 40 phrases were partly misunderstood. Participants had difficulty sorting general topics such as Databases, Standards, and Device Advice. Participants identified potential overlap among phrases used for contacting CDRH. While each audience group appeared to find it convenient to use audience-based topic labels to determine what is being told to another audience group, they did not limit themselves to information designed for their own group.
Report Title: Report on the User Card Sort of Content from the CDRH Web Site. Report may be obtained from Federal Contact
Agency Sponsor: FDA, Food and Drug Administration
Federal Contact: Laurel Mendelson, 240-276-3252
Performer: UserWorks, Inc.
PIC ID: 8682
Should the Behavioral and Social Research Program Be Continued?
This evaluation assessed effectiveness of the Edward R. Roybal Centers Program for Translational Research on Aging. Although each Center is administratively reviewed annually via progress reviews, an external evaluation of the general effectiveness of the centers was sought to determine further directions for the program as a whole. The expert panel was comprised of five members, none affiliated with a currently funded Center.
There have been significant accomplishments attributed to the Centers. The panel recommended that the program be continued. The panel recommended that future published requests for applications articulate more clearly program focus, intent, and meaning of "translation research," program´s desired impact and how it would be measured. The panel also recommended increasing funding for the program and improving program staff coordination and communication with the project investigators.
Report Title: Review of the Edward R. Roybal Centers Program. Report may be obtained from Federal Contact
Agency Sponsor: NIH, National Institutes of Health, Behavioral and Social Research Program
Federal Contact: Georgeanne E. Patmios, 301-496-3138
Performer: Rose Li and Associates, Inc.
PIC ID: 8753
Should an Outcome Evaluation of In Vivo Cellular and Molecular Imaging Centers Be Conducted?
This study explored whether an outcome evaluation of the In Vivo Cellular and Molecular Imaging Centers (ICMIC) Program was both warranted and feasible, and, if so, to recommend an outcome evaluation design. The ICMIC Program has supported the emerging field of molecular imaging by funding Research Center Grants. The initiatives were designed to enhance molecular imaging impact on the diagnosis and treatment of cancer non-invasively and quantitatively. The ICMIC brought together interdisciplinary scientific teams to lead cutting-edge cancer molecular imaging research with clinical relevance; provided facilities to support oncology imaging research; provided flexibility to respond to pilot research opportunities; and provided interdisciplinary career development opportunities.
Sixteen Pre-ICMIC planning grants were awarded to establish multi-disciplinary infrastructure and preliminary data, which were necessary to eventually compete for ICMIC awards. The feasibility study of evaluating the ICMIC program involved: 1) consulting with cancer imaging program staff; 2) developing provisional logic model that describes the inputs, activities, outputs, outcomes, impacts, and external influences; 3) reviewing and analyzing existing data; and 4) developing an outcome evaluation design.
The ICMIC program was found to be ripe for an outcome evaluation. ICMIC activities, outcomes and impacts are sufficiently varied and complex that in-depth analysis beyond feasibility study is worthwhile. An evaluation could influence the management of Centers programs across the National Cancer Institute. Future outcome evaluations should be quasi-experimental, of an intervention-comparison form.
Report Title: Feasibility Study for an Evaluation of the In Vivo Cellular and Molecular Imaging Centers Program. Report may be obtained from Federal Contact
Agency Sponsor: NIH, National Institutes of Health
Federal Contact: Anne Menkens, 301-496-9531
Performer: Science and Technology Policy Institute/IDA
PIC ID: 8758
Objective 4.3: Conduct and oversee applied research to improve health and well-being.
Are Cancer Patients Concerned About Possible Financial Conflicts of Interest Between Researchers, Medical Centers and Drug Companies?
This study surveyed cancer clinical trial participants to determine their attitudes regarding financial ties between researchers, medical centers, and companies whose drugs are being tested and potential safeguards. There are two major reasons some might be concerned about financial conflicts of interest in the clinical research: they might increase risks to participants or undermine the scientific integrity of the research. A survey on financial conflicts of interest and potential safeguards was developed and subjected to cognitive and behavioral pre-testing. Trained interviewers, unaffiliated with the underlying cancer trials, conducted in-person interviews with 253 individuals (93 percent response rate) participating in cancer research trials at 5 geographically diverse medical centers in the U.S.
Most patients participating in the clinical trials: (1) were not worried about financial ties between researchers, medical centers, and drug companies whose drugs were being tested, (2) reported that they would have enrolled in the trial even if they had known about such financial ties, and (3) found these financial ties ethically acceptable. Research participants preferred to know that there was an oversight system in place to protect against conflicts of interest rather than to have the detailed financial ties of researchers or the institution disclosed to them.
Report Title: Financial Conflicts of Interest and their Regulation: The Perspectives of Research Participants, http://aspe.hhs.gov/pic/fullreports/06/8459.htm
Agency Sponsor: NIH, National Institutes of Health
Federal Contact: Peter S. Alterman, Ph.D., 301-496-7998
Performer: Ezekiel J. Emanuel
PIC ID: 8459
Does the Mining Research Program Effectively Target Causes of Occupational Injury, Illness, and Death?
The study examined whether mining research has reduced the number of adverse occupational health events. The Mining Research Program was planned and implemented to reduce occupational fatalities, injuries, and illnesses in mine workers. In the last three decades, improvements in mining technology and training have resulted in greater safety and health. A Framework Committee developed guidelines for evaluating the research programs. The National Academies organized an Evaluation Committee to assess the mining program´s progress toward reducing workplace illness and injury measuring relevance and impact of the research. The Committee considered how well the mining program targets new research to areas most relevant to future improvements in workplace protection and identified mining workplace health and safety issues.
The mining program has significantly enhanced health and safety in the mining industry. The Committee concluded that the Mining Program´s research targets high-priority areas and is connected to improvements in the workplace. The Committee also found that the Mining Program´s work has made major contributions in some areas such as respiratory disease prevention and traumatic injury prevention, The Committee recommended strategic goals, interaction effectiveness, outputs, surveillance, and technology transfer. These recommendations will guide the mining program´s future research and transfer activities.
Report Title: Mining Safety and Health Research at NIOSH http://books.nap.edu/catalog.php?record_id=11850
Agency Sponsor: CDC, Centers for Disease Control
Federal Contact: DeKeely Hartsfield, 404-498-2544
Performer: National Academies
PIC ID: 8660
How do Consumers Perceive the Food and Drug Administration's Early Risk Information on Drug Products?
For this study, the Center for Drug Evaluation and Research (CDER) gathered data from patients about the effectiveness of communication and overall usefulness of CDER´s patient information hand outs. Researchers conducted eight focus groups to explore how patients want to learn about newly discovered drug side effects. CDER´s major vehicle for communicating drug product safety information to healthcare practitioners has been the product´s approved labeling, a lengthy document containing extensive detail about the research supporting approval, as well as instructions to assure safe and effective use.
The focus groups discussed patients´ understanding of drug side effects, how patients get information about new drug side effects, and patients´ opinions about FDA´s role in notifying the public about new side effects. Participants discussed and reacted to four examples of current information about medicines that FDA has on its web site. The main qualifying criterion for participation in these focus groups was that each participant should currently use or have used a prescription medication in the past 6 months.
Focus group members indicated that many consumers stopped taking a drug due to an adverse event before talking to their physicians. Several participants understood the possibility of long-term adverse consequences from taking a drug long-term. The majority of participants considered physicians and pharmacists to be the most trustworthy sources. When prompted, participants said they trusted the FDA. Some suggested that FDA safety news should be sent out through TV and newspapers. It appears that consumers do some sort of risk/benefit decision-making concerning drug products. When participants were asked, "What does ´safe drug´ mean to you?" most agreed that it meant there was no chance of death or serious and/or permanent side effects. Participants found the sample Patient Information Sheets to be informative, used clear and understandable language, contained comprehensive information, and were clearly formatted. Participants preferred information in Public Health Advisories in bullet points and most liked bolded font but thought the most important information, e.g., the safety issue and ways to minimize harm should be listed first in any Public Health Advisory information. Participants concluded the Health Care Professional sheet was helpful and included enough information for a healthcare provider to start a discussion with a patient. The participants appreciated the way information was organized, the sequence in which information was provided and its clarity and conciseness.
Report Title: Consumer Perception of FDAs Early Risk Information on Drug Products. Report may be obtained from Federal Contact
Agency Sponsor: FDA, Food and Drug Administration
Federal Contact: Mary Mease, 301-443-5576
Performer: OMR Team
PIC ID: 8690
Does Active Surveillance Deter Intimate Partner Violence and Child Maltreatment?
This study assessed the impact of child maltreatment and intimate partner violence activities. Child maltreatment and intimate partner violence are significant public health problems in the United States, resulting in an array of detrimental consequences for individuals, families, and society. In light of the dire need for valid surveillance data, the Centers for Disease Control and Prevention funded State-based surveillance activities in nine States and assessed the impact of the funded activities. Public health surveillance is the ongoing, systematic collection, analysis, interpretation, and dissemination of data regarding a health-related event for use in public health action to reduce morbidity and mortality and to improve health.
The most common data sources for intimate partner violence surveillance were surveys. The next most common data sources were emergency room reports, police reports, court data, medical records and death certificates. Other data sources included media reports, social service data on adult protective service cases, and data collected with rape kits.
States demonstrated impacts at both prevention and system levels. Some States´ surveillance systems likely will become permanent after Federal funding ends. Some State surveillance efforts will discontinue at the end of Federal funding. Respondents for these States noted that a lack of organizational support and various leadership changes prevented stability of system resources. These two factors were mentioned by most States as important determinants of surveillance system impacts and sustainability.
States demonstrated impacts at both prevention and system levels. There was an increased awareness of issues by both public and government and support for law enforcement and prevention policy changes. Some State surveillance systems were likely to become permanent after Federal funding ends. Respondents for States likely to discontinue surveillance noted that a lack of organizational support and leadership changes would prevent stable system resources. These factors were mentioned by respondents from most States as important determinants of surveillance system impacts and sustainability.
Report Title: Evaluating the Impact of ESB Surveillance Activities for the Division of Violence Prevention http://aspe.hhs.gov/pic/fullreports/07/8749.pdf
Agency Sponsor: CDC, Centers for Disease Control
Federal Contact: Cindi Melanson, 404-638-4854
Performer: RTI International
PIC ID: 8749
Could Good Clinical Practice Computer-Based Training Change Researcher Behaviors and Improve Human Subject Safety, Data Integrity and Research Efficiency?
A feasibility study of the Good Clinical Practice (GCP) Computer-Based Training program was conducted to determine whether an outcome evaluation could be designed to provide objective data on whether the training program improved outcomes such as quality of data and patient safety. The GCP training program was implemented to provide a single training e-portal on the scientific and ethical standards of human subject research including NIH, FDA, and international clinical trial policies, guidelines, and regulations. The answers to these studies might provide the basis for the allocation of training resources and the establishment of policies for GCP training for the agency and perhaps other research communities.
The feasibility study showed it would not be possible to attribute directly to the training program improvements in patient safety, data integrity, and research efficiency. A second evaluation was proposed to develop benchmarks for participation rates, user satisfaction and knowledge acquisition. These benchmarks and ongoing evaluation will guide future training program development and quality improvement, allocation of training resources, and GCP training policies.
Report Title: Feasibility Study of Optimal Approaches for Evaluating the NIAID Good Clinical Practice Computer-Based Training (GCP CBT) Program. Report may be obtained from Federal Contact
Agency Sponsor: NIH, National Institutes of Health, National Institute of Allergy and Infectious Diseases (NIAID)
Federal Contact: Nancy L. Jones, Ph.D., 301-451-1399
Performer: NOVA Research Company
PIC ID: 8750
How Evaluate Whether Standard Policies and Procedures Improve Compliance with the Requirements in Sponsored Clinical Research?
This feasibility study identified evaluation methodologies, techniques, and tools to measure the implementation of the standardized policies and procedures for the Division of AIDS programs sponsored clinical research. This study developed how to documented processes related to dissemination, implementation and training and evaluation questions focused on short- term outcomes among target audiences (NIAID Project Officers and Division of AIDS-funded researchers). The National Institute of Allergy and Infectious Diseases restructured its HIV/AIDS clinical trials networks to create a more integrated, collaborative and flexible research structure. The Institute formalized and developed a standardized set of policies and procedures to be used by Division of AIDS staff, extramural researchers, institutions, and other stakeholders when planning and implementing clinical research. The overarching goal of the policies and procedures is to facilitate clinical research.
Areas identified as essential to assess implementation and impact included: awareness and accessibility of newly developed policies and procedures; understanding and applicability of the policies and procedures; and clarification of whether the policies and procedures facilitate the harmonization of Division of AIDS funded clinical research programs. There have been no systemic assessments of the impact of policies and procedures on clinical research and organizational functioning. The proposed evaluation of newly implemented policies and procedures should make a significant contribution to the existing knowledge in this area and provide information on how to improve the implementation of policies and procedures for conducting clinical research.
Report Title: Feasibility Study of Optimal Approaches for Evaluating the Implementation of NIAID Division of AIDS-wide Standardized Clinical Policies and Procedures. Report may be obtained from Federal Contact
Agency Sponsor: NIH, National Institutes of Health
Federal Contact:
Performer: NOVA Research Company
PIC ID: 8751
Objective 4.4: Communicate and transfer research results into clinical, public health, and human service practice.
American Customer Satisfaction Index: Ready for Broader HHS Use?
Could the American Customer Satisfaction Index, widely by the private sector and other government agencies, be useful across NIH? This study evaluated its use for 60 NIH web sites. The Index is an online customer satisfaction survey methodology widely used across government to meet the Federal directive to measure citizen satisfaction with e-government. The evaluation focused on: (1) how the individual participating web site teams applied the Index to evaluate their sites and the ways these sites benefited from using the Index, and (2) whether broad use of the Index across individual web sites provided additional benefits for NIH. An objective was to determine whether the Index site-level data provided any additional insight into how NIH web sites were used and how they performed relative to NIH communication goals. Researchers reviewed secondary data, surveyed participating teams, and interviewed selected teams.
The Index filled a gap for most NIH web site teams that did not already have resources for evaluation and/or previous experience in measuring customer satisfaction. Two-thirds of the teams indicated overall satisfaction with their use of the Index for site evaluation. Dissatisfied teams were those that used the Index for a shorter period, did not receive results within the evaluation period, or were unsure about the methodology. The Index provided web site teams with a convenient way to measure customer satisfaction. It allowed continuous qualitative data collection at a lower cost than options such as a one-time user survey. Use of the Index across sites provided additional benefits, such as establishing a network of NIH web site professionals for sharing experiences, knowledge, and tips about evaluation in general, and about customer satisfaction measurement and Index use.
Report Title: Trans-NIH American Customer Satisfaction Index (ACSI) Web Site Evaluation. Report may be obtained from Federal Contact
Agency Sponsor: NIH, National Institutes of Health
Federal Contact: Fred Wood, 301-402-9278
Performer: Interagency Agreement with Federal Consulting Group/US Department of the Treasury; subcontracts to ForeSeeResults Inc., and Westat Inc
PIC ID: 8385
How Ensure That Newborns Return for Essential Follow-Up for Early Hearing and Intervention Screening?
Researchers identified the reasons families do not return with newborns for early hearing screening in a timely fashion in five States. The success of infant hearing screening has been impressive. According to estimates from the Centers for Disease Control and Prevention (CDC) in 2005, at least 91.5 percent of all infants in the US were screened for hearing loss. National data suggests nearly half of newborns that failed screening did not return for one or more follow-up services (a hearing re-screen, formal hearing test, medical diagnosis, or intervention). The full value of newborn hearing screening will not be reached unless high rates are also achieved for follow-up services. The purposes of the project were to explore and document factors that contribute to loss to follow-up including system, cost, and personal barriers. Data collection included focus groups with parents, physicians, advocates and program staff, a survey of new mothers prior to hospital discharge, and a telephone survey of mothers whose infants had been referred for additional re-screening or diagnosis.
Although overall completion rates to follow-up and diagnosis were quite high among the women surveyed, a number of barriers to follow-up need to be addressed. These include shortage of audiologists in rural areas and those trained to work with infants, inadequate private and Medicaid coverage, physician knowledge and attitudes about early hearing screening, too little information and communication with the family, and a lack of systematic links from screening through intervention.
Report Title: Assessment of Loss to Follow-Up in State Early Hearing Detection and Intervention (EHDI) Programs
Agency Sponsor: CDC, Centers for Disease Control; Early Hearing Detection and Intervention Program (EHDI)
Federal Contact: Pam Costa, 404-498-3027
Performer: Research Triangle Institute (RTI International)
PIC ID: 7872
How Can State and Territorial Health Departments Reduce Smoking Prevalence?
This study evaluated the sustainability of State tobacco control programs based on both the program´s proven effectiveness and appropriate use of resources. Good evaluation is key to demonstrating program results that lead to improved community health. Selecting the right indicators to measure is key to effective evaluation. To arrive at these indicators, the Centers for Disease Control and Prevention (CDC) engaged a panel of experts in tobacco control practice, evaluation, and research to assess CDC´s indicators with the following criteria: strength of evaluation evidence, utility, validity to policy makers, conformity with accepted practice, uniqueness, overall quality, how essential the indicator was for evaluating State tobacco control programs, and cost to collect and analyze the data.
The experts suggested additional indicators and sources of data. CDC reviewed the experts´ responses, comments, and suggestions and compiled the results into an individual rating across criteria for each indicator. The contractor rated the strength of scientific evidence for each indicator. A Consumer Reports-style guide was prepared for State and territorial health departments providing information on 120 key outcome indicators for evaluation of Statewide comprehensive tobacco prevention and control programs. Detailed information is provided for each indicator, including indicator definition, example data sources and measures, and graphic depictions of expert panel ratings across various criteria, such as overall quality and resource utilization.
Report Title: Key Outcome Indicators for Evaluating Comprehensive Tobacco Control Programs http://www.cdc.gov/tobacco/tobacco_control_programs/surveillance_evaluation/key_outcome/00_pdfs/Key_Indicators.pdf
Agency Sponsor: CDC, Centers for Disease Control
Federal Contact: Michael Schooley, 770-488-5780
Performer: Battelle
PIC ID: 7975
How Improve Outcomes of Safety Knowledge, Attitudes, and Behavior-Influence of a Fire-Fighter Fatality Investigation and Prevention Program?
The program had a low profile within the fire service. Most officers were familiar with the National Institute for Occupational Safety and Health (NIOSH), and most had seen and read an investigation and prevention report. However, over half were not familiar with the investigation and prevention program itself, particularly with the process of identifying incidents to investigate, conducting the investigation, and reporting findings. The majority of fire departments in the country require firefighters to be trained on five of the six types of recommendations addressed in this evaluation: use of personal protective equipment, fighting structure fires, driving safety, use of radio communication devices, the Incident Command System, and maintenance of self-contained breathing apparatus. Only seven percent of the fire departments have a required physical fitness training program, and most fire departments do not require firefighters to be screened for cardiovascular risk factors and cardiovascular disease. About a third of all fire departments say they are sometimes unable to establish rapid intervention teams because there are not enough firefighters at the scene of the fire. Firefighters said that learning about specific incidents helped develop safer work practices, and they appreciated that the line of duty death reports were unbiased. Only half of officers agreed that NIOSH reports were practical, easy to understand, specific, and concrete. Officers suggested that the recommendations be made stronger, more straightforward, and less generic, and that they take into consideration the size and resources of the department.
There were several key implications from the evaluation: small, volunteer departments have the greatest challenges to following safety guidelines; existing resources limit safety practices; gaps in knowledge and attitudes also limit safety; investigations and line of duty death reports provide useful information; fire departments need additional information in the line of duty death reports; firefighters and fire departments need information presented in additional formats; materials need to be better marketed and distributed; and increasing awareness would likely improve safety practices.
Report Title: Fire Fighter Fatality Investigation and Prevention Program Evaluation http://aspe.hhs.gov/pic/fullreports/06/8299.pdf
Agency Sponsor: CDC, Centers for Disease Control
Federal Contact: Tim Pizatella, 304-285-5894
Performer: Research Triangle Institute
PIC ID: 8299
Does Service of the Genetic and Rare Disease Information Center Satisfy Users?
This study examined satisfaction of patient, public, and professional customers with services provided by information specialists at the Genetic and Rare Disease Information Center. A customer satisfaction survey asked what was the demographic profile of information center customers, how did customers learn about the information center, did customers find the information responses satisfactory, and what did customers do with the information? All individuals who submitted inquiries to the Center by telephone or e-mail during a four-month period were included in the survey. They were given the option of responding through a Web-based or paper survey available in English and Spanish, consisting of five demographic and 16 value questions.
The typical information center customer was a white, non-Hispanic, English-speaking female between the ages of 31 and 40 with a post-graduate degree. Customers usually got their health information over the Internet. Customers found the responses to their inquiries new, useful, right for their personal situation, and trustworthy. The responses arrived within 5-10 business days, were right for the customers´ reading levels, clear and easy to understand, and contained the right amount of information. Customers shared or planned to share the information they received with family members or friends. The researchers recommended that, for future user surveys, more demographic information be sought and that efforts be made to reach minority populations. Researchers also recommended that the Center consider developing a web site where the information it provides could be made available.
Report Title: Customer Satisfaction Survey of the NHGRI/ORD Genetic and Rare Diseases (GARD) Information Center. Final Report of Analyses of Survey Data, http://aspe.hhs.gov/pic/fullreports/06/8461.pdf
Agency Sponsor: NIH, National Institutes of Health
Federal Contact: Vence Bonham, J.D., 301-594-3973
Performer: Lisa Lanier
PIC ID: 8461
Are Users of Online Toxicological Information Resources Satisfied?
A series of focus groups were conducted to solicit user feedback regarding five on-line Web resources that are part of a site known collectively as "TOXNET," maintained by the National Library of Medicine. All five resources provide information on toxic chemicals, environmental health, and related areas. They include: (1) World Library of Toxicology, an international portal on toxicology resources; (2) LactMed, a database of information on the use of prescription drugs during lactation; (3) Tox Town, an interactive guide to environmental health and toxicology; (4) Environmental Health and Toxicology, a portal to databases and resources to assist professionals and laypersons in the environmental health and toxicology community; and (5) ToxSeek, a newly-developed web interface that performs metasearch and then clusters results from multiple sites and databases containing environmental health and toxicology information. Separate focus groups were asked to use the resources and provide comments/suggestions regarding how well the on-line information resources performed.
Reactions to the LactMed and Tox Town web sites were generally positive, reactions to the environmental health and toxicology website were enthusiastically positive, and reactions to ToxSeek and the World Library of Toxicology were mixed. Results from these focus groups have been used to refine the Web resources.
Report Title: Qualitative Research Studies http://aspe.hhs.gov/pic/fullreports/06/8470.htm
Agency Sponsor: NIH, National Institutes of Health
Federal Contact: Cindy Love, 301-496-5306
Performer: Solomon Solutions, Mary Beth Solomon
PIC ID: 8470
What Data Exist on the Health and Well-being of Native Americans?
The purpose of this project was to identify and compile in a catalog existing sources of reliable socioeconomic and health data pertaining to American Indians, Alaska Natives, and Native Americans. As with most subpopulations, the data currently available regarding these groups are severely limited. This project examined Federal surveys, research survey databases, State and community surveys, and administrative databases that include information about American Indian, Alaska Native, and Native American population characteristics and measures of health and well-being.
The Data Catalog lists the characteristics, strengths and limitations of 68 databases. The majority of entries focus on health issues. Others focus on such issues as: child, elder and family well-being; demographic characteristics and economic status; education; housing; criminal justice issues; military service; and transportation. Most datasets provide aggregate data for American Indians and Alaska Natives combined. A smaller number provide some data by subgroup categories, e.g., American Indians, Alaska Natives, Native Hawaiians and other Pacific Islanders. The Catalog is a resource tool that can be used by Native communities; researchers from government, academic institutions, and foundations; and policy makers.
Report Title: Data on Health and Well-being of American Indians, Alaska Natives, and Other Native Americans -- Data Catalog http://aspe.hhs.gov/hsp/06/catalog-AI-AN-NA
Agency Sponsor: ASPE-OHSP, Office of Human Services Policy
Federal Contact: Peggy Halpern, 202-260-0285; Alana Landey, 202-6636
Performer: Westat, Inc.
PIC ID: 8573
How Do Pharmacists Perceive Food and Drug Administration's Communication Regarding Emerging Drug Risks?
Participants were asked to share their attitudes, beliefs, feelings, and experiences regarding drug product emerging risks. They were asked to share their thoughts and opinions about: how they learned about the risks of the drug products they used; their primary and preferred information sources for this information; the Food and Drug Administration´s (FDA´s) role as a source of information about emerging risks; the impact of emerging risk information on participants, practice and patients; and the usefulness of emerging risk information disseminated by FDA.
In response to its charge to improve public knowledge of emerging drug safety issues, the Drug Safety Board recommended that the Center for Drug Evaluation develop and issue healthcare practitioner and patient information sheets that described the emerging safety issue. FDA conducted four focus groups with a sample of pharmacists who worked in a variety of professional settings, including independent and chain pharmacies, managed care, hospitals, Veterans Administration pharmacies, long-term care facilities, university student health centers, and veterinary clinics.
It would be useful for pharmacists to have a single, credible source they could rely on for timely and accurate information about serious emerging drug risks. Focus group participants suggested that FDA develop and maintain a separate web site dedicated solely to emerging drug risk information, while working with licensing boards and associations to have links on their sites that will lead pharmacists to FDA´s emerging drug risk information site. The focus group findings suggest that FDA needs to engage in targeted outreach through direct and indirect marketing to pharmacists to brand the Agency and its web site as the best source of information on serious emerging drug risks.
Report Title: Findings from Focus Groups Examining Pharmacists? Perceptions of FDA´s Communications Regarding Emerging Drug Risks. Report may be obtained from Federal Contact
Agency Sponsor: FDA, Food and Drug Administration
Federal Contact: Mary Mease, 301-443-5576
Performer: Food and Drug Administration with the Maryland Pharmacists Association (MPhA)
PIC ID: 8688
What Were Population Based Admission Trends to Substance Abuse Treatment Facilities, 1995-2005?
This study examined data from clients admitted to substance abuse treatment between 1995 and 2005, as reported to the Treatment Episode Data Set (TEDS). TEDS includes information on clients treated at facilities that receive State alcohol and/or drug agency funds (including Block Grant funds) for the provision of substance abuse treatment services. TEDS collects data on the demographic and substance abuse characteristics of individuals admitted to treatment for abuse of alcohol and drugs. Since the system is based on treatment admissions, an individual admitted multiple times in a year would be counted once for each admission.
The alcohol admission rate declined by 28 percent between 1995 and 2005, from 408 to 292 per 100,000 population aged 12 and older. The admission rate for methamphetamine/amphetamine increased 127 percent during this period from 30 to 68 per 100,000 population aged 12 and older. Adolescent (aged 12-17) treatment admissions increased 16 percent between 1995 and 2005. The increase in adolescent admissions was largely due to an increase in the number of adolescent marijuana admissions (47 percent increase between 1995 and 2005). The proportion of adolescent admissions for marijuana grew from 52 percent of all adolescent admissions in 1995 to 65 percent in 2005.
Report Title: Treatment Episode Data Set (TEDS) 1995-2005 - National Admissions to Substance Abuse Treatment Services, http://wwwdasis.samhsa.gov/teds05/tedsad2k5web.pdf
Agency Sponsor: SAMHSA, Substance Abuse and Mental Health Services Administration
Federal Contact: Deborah Trunzo, 240-276-1267
Performer: Synectics for Management Decisions, Inc.
PIC ID: 8711
What Were Admission Rates Into Substance Abuse Treatment Facilities in 2005?
This study compiled summary data on clients admitted to substance abuse treatment in 2005 in the United States, as reported to the Treatment Episode Data Set.
Five substances accounted for 95 percent of all reported admissions in 2005: alcohol (39 percent), opiates (17 percent; primarily heroin), marijuana/hashish (16 percent), cocaine (14 percent), and stimulants (9 percent; primarily methamphetamine). In 2005, admissions to substance abuse treatment involving methamphetamine and narcotic pain medications continued to rise compared with previous years. The number of methamphetamine admissions rose 120 percent between 1995 and 2005, from 47,695 in 1995 to 152,368 in 2005. For opiates other than heroin (largely prescription pain medications), there was a 221 percent increase in the number of admissions to treatment between 1995 and 2005, from 16,121in 1995 to 67,887 in 2005. Between 1995 and 2005, the proportion of admissions for primary alcohol and cocaine abuse declined while the proportion of admissions for marijuana, stimulants, and opiates increased.
Report Title: Treatment Episode Data Set (TEDS) Highlights, 2005: National Admissions to Substance Abuse Treatment Services, http://oas.samhsa.gov/teds2k5/tedshi2k5.pdf
Agency Sponsor: SAMHSA, Substance Abuse and Mental Health Services Administration
Federal Contact: Deborah Trunzo, 240-276-1267
Performer: Synectics for Management Decisions, Inc.
PIC ID: 8712
How Prevalent Was Substance Abuse and Mental Illness During 2006?
The civilian, non-institutionalized population in the United States, aged 12 and older was surveyed. This National Survey on Drug Use and Health is conducted annually. In 2006, approximately 67,500 individuals responded to the survey. This initial study on the 2006 data provided national estimates of rates of use, numbers of users, persons meeting criteria for substance use disorders, and other measures related to illicit drugs, alcohol, and tobacco products. Researchers also developed measures of mental health problems, including major depressive episode and serious psychological distress, as well as data on the co-occurrence of substance use disorders and mental health problems.
The level of current marijuana use among youths aged 12 to 17 decreased from 8.2 percent in 2002 to 6.7 percent in 2006; the decline was particularly notable among male youths. The level of underage drinking (i.e., among those aged 12 to 20), was at 28.3 percent in 2006, unchanged from 2002, and past month cigarette smoking declined from 2002 to 2006 among young adults aged 18 to 25. The percentage of 12-to-17-year-olds who experienced a major depressive episode in the past year decreased from 8.8 percent in 2005 to 7.9 percent in 2006.
Report Title: Results from the 2006 National Survey on Drug Use and Health (NSDUH): National Findings, http://oas.samhsa.gov/nsduh/2k6nsduh/2k6Results.pdf
Agency Sponsor: SAMHSA, Substance Abuse and Mental Health Services Administration
Federal Contact: James Colliver, 240-276-1252
Performer: RTI International
PIC ID: 8713
Do Self-Reports and Laboratory Tests Results of Drug Use by Youth and Young Adults Match?
Researchers examined data from a Validity Study conducted in 2000 and 2001 in conjunction with the National Household Survey on Drug Abuse, an annual survey that tracks the prevalence of substance use in the United States. The Validity Study provided information on the validity of self-reported drug use in the general population survey by comparing the self-reports of respondents with the results of drug tests of urine and hair specimens obtained from those same respondents. The study also investigated methodological issues, such as technical aspects of collecting urine and hair, the willingness of respondents to provide specimens, and questionnaire strategies. A national sample of almost 6,000 persons aged 12 to 25 was selected for the Validity Study, and more than 4,400 completed an interview.
Most youths aged 12 to 17 and young adults aged 18 to 25 reported their recent drug use accurately. There were some reporting differences in either direction with some not reporting use and testing positive, and some reporting use and testing negative.
Approximately 81 percent of those interviewed provided both urine and hair specimens, and about 89 percent provided at least one specimen. The Validity Study demonstrated that it is possible to collect urine and hair specimens with a high response rate from persons aged 12 to 25 in a household survey environment.
Report Title: Comparing Drug Testing and Self-Report of Drug Use among Youths and Young Adults in the General Population, http://oas.samhsa.gov/validity/drugTest.pdf
Agency Sponsor: SAMHSA, Substance Abuse and Mental Health Services Administration
Federal Contact: Art Hughes, 240-276-1261
Performer: RTI International
PIC ID: 8714
What Characterized Substance Abuse Treatment Facilities During 2006?
A survey was carried out collecting information on substance abuse treatment facilities´ locations, services offered, and numbers of clients in treatment. The National Survey of Substance Abuse Treatment Services is an annual survey of all identified alcohol and drug abuse treatment facilities in the 50 States, the District of Columbia and other U.S. jurisdictions.
The number of facilities remained relatively constant between 2002 and 2006, 13,720 reporting facilities versus 13,771, respectively. The number of clients in treatment on the survey reference date decreased by less than 1 percent over the same period, to 1,130,881 in 2006. Approximately 8 percent of persons in treatment on the survey reference date were under the age 18. Eighty-nine percent of all clients in treatment were in outpatient treatment, 10 percent were in non-hospital residential treatment, and 1 percent were in hospital inpatient treatment. Nearly half of all clients were in treatment for both alcohol and drug abuse, approximately one-third for drug abuse only, and 18 percent for abuse of alcohol alone. The majority of facilities in the treatment system were operated by private non-profit organizations (59 percent of all facilities in 2006). Private for-profit facilities made up 28 percent of all facilities.
Report Title: National Survey of Substance Abuse Treatment Services: 2006 – Data on Substance Abuse Treatment Facilities, http://oas.samhsa.gov/DASIS.htm#nssats2
Agency Sponsor: SAMHSA, Substance Abuse and Mental Health Services Administration
Federal Contact: Deborah Trunzo, 240-276-1267
Performer: Synectics for Management Decisions, Inc.
PIC ID: 8716
What Was the Prevalence of Substance Use, Abuse, Dependence and Mental Health Problems in 2004 and 2005?
Researchers prepared State estimates for 23 measures of substance use or mental health problems based on the 2004 and 2005 National Surveys on Drug Use and Health. The surveys are ongoing and cover the civilian, non-institutionalized population of the United States aged 12 years or older. Interview data from approximately 136,100 persons were collected in 2004-2005. Separate estimates have been produced for four age groups: 12-17, 18-25, over 25, and over 11.
Estimates of past month use of illicit drugs ranged from a low of 5.9 percent in Iowa to a high of 12.2 percent in Alaska for all persons aged 12 or older in 2004-2005. Five States showed significant decreases in past month use of illicit drugs among youths: California (from 12.1 to 10.6 percent), Michigan (from 12.3 to 10.6 percent), New Mexico (from 16.2 to 13.0 percent), North Dakota (from 10.8 to 8.5 percent), and Washington (from 11.7 to 9.6 percent). This study estimated substance dependence, abuse, and treatment need; mental heath; and alcohol and tobacco use.
Report Title: State Estimates of Substance Use from the 2004-2005 National Surveys on Drug Use and Health, http://www.oas.samhsa.gov/2k5state/pdf/2k5state.pdf
Agency Sponsor: SAMHSA, Substance Abuse and Mental Health Services Administration
Federal Contact: Art Hughes, 240-276-1261
Performer: RTI International
PIC ID: 8717
Do Workers Use Illicit Drugs and Alcohol; Are They Aware of Workplace Substance Use Policies?
This study collected information about illicit drug and alcohol use among adult full-time workers aged 18 to 64 and on workplace drug policies and programs, based on data from the 2002, 2003, and 2004 National Surveys on Drug Use and Health. The National Surveys document variations in rates of substance use, dependence and abuse by type of business, specific occupation, and industry as well differences by demographic group and geographic area. A large part of the study was dedicated to drug-testing policies and programs and workplace behaviors and attitudes toward drug testing.
Approximately 8.2 percent of full-time workers aged 18 to 64 were found to be current illicit drug users. The highest rates of past month illicit drug use were found among workers in the accommodations and food services (16.9 percent) and construction (13.7 percent) industries. Illicit drug use and heavy alcohol use were found to be associated with higher levels of absenteeism and frequent job changes. Around 30 percent of the full-time work force reported that random drug testing took place in their current employment setting. While over half of workers reported that it made no difference to them if an employer tests employees randomly for drug use after hiring, 39.8 percent said they would be more likely to work for such an employer while 8.7 percent reported they would be less likely.
Report Title: Worker Substance Use and Workplace Policies and Programs, http://oas.samhsa.gov/work2k7/work.pdf
Agency Sponsor: SAMHSA, Substance Abuse and Mental Health Services Administration
Federal Contact: James Colliver, 240-276-1252
Performer: RTI International
PIC ID: 8718
How Best Measure Success of the Innovative Molecular Analysis Program?
This study examined the feasibility and informed the design of an outcome evaluation for the National Cancer Institute´s Innovative Molecular Analysis Technologies (IMAT) program. IMAT is a trans-NCI program aimed at accelerating technology development efforts to better treat, diagnose, detect, and prevent cancer. The study: (1) reviewed literature and resources; (2) identified questions and key variables; (3) reviewed existing data to provide information on key variables; (4) identified new data collection efforts; (5) prepared clearance packages; (6) developed an outcome evaluation plan; and (7) recommended an evaluation design. The IMAT program had not undergone a formal evaluation. Stakeholders sought to determine evaluation structure, metrics and similar parameters in order to conduct a study of whether the program operated as planned and whether it was achieving its goals.
Conducted over the course of an 8-week performance period, the study concluded that an outcome evaluation of the program was possible. Key variables identified during the course of the study included the changing landscape of biomedical technology development and the program´s evolution. Information collected supported a full outcome evaluation based on tracking the development and impact of technologies developed with program support. This approach would provide an assessment of the program´s overall efficacy in achieving its objectives.
Report Title: Feasibility Study for the Innovative Molecular Analysis Technologies Program Evaluation. Report may be obtained from Federal Contact
Agency Sponsor: NIH, National Institutes of Health
Federal Contact:
Performer: ORC Macro / MACRO International
PIC ID: 8754
Has the Bench-to Bedside Program Sped Translation of Promising Laboratory Discoveries into New Medical Treatments?
This study assessed the performance of the Bench-to-Bedside (B2B) program, including the breadth of participation, project accomplishments, investigators´ self-reports of programs process and funding, and the benefits of the recent extension of the program to encourage intramural-extramural collaboration. The program encourages innovative projects that involve close collaboration between laboratory and clinical researchers to accelerate patient-oriented research for the diagnosis and therapeutic intervention of medical disorders. Three hundred twenty-four selected investigators were invited to participate in the study by completing a two-part Web-based data-collection instrument.
Over two-thirds of responding project investigators indicated that, in their projects, "collaboration between bench and clinical scientists was enhanced by the project" and that "it would not have been initiated without funds." Nearly 40 percent reported that the program´s "peer review and endorsement" to be helpful. The unstructured responses were nearly all positive endorsements of the B2B program. Three-quarters of the project investigators said they achieved major milestones. For the FY 2006 projects including extramural investigators, 89 percent indicated that new collaborations between intramural and extramural investigators were established as a result of their project and 95 percent of the responding investigators from the latest cohort indicated the intramural/extramural partnership was critical to the success of their projects.
Report Title: A Quantitative Assessment of the NIH Bench-to-Bedside Program: Accomplishments of the First 100 Projects, 1999-2006. Report may be obtained from Federal Contact
Agency Sponsor: NIH, National Institutes of Health; National Institute of Health Clinical Center
Federal Contact: John I. Gallin, MD, 301-496-4114
Performer: Charles Roger Sherman
PIC ID: 8757
What Are Costs of Cancer Registry Operations?
This study looked at the feasibility of conducting a full-scale process evaluation of the National Cancer Institute's Surveillance, Epidemiology and End Results (SEER) Program to analyze the costs of the program's central cancer registries. SEER registries collect data on the occurrence and characteristics of reportable malignancies. The information service helps assess and control the impact of cancer on the community. The registries routinely collect data on patient demographics, primary tumor site, morphology, stage at diagnosis, first course of treatment, and follow-up for vital status. The 15 SEER cancer registries are complex organizations and each has multiple revenue sources, mixtures of funding periods, and unique internal accounting and personnel arrangements. The study clarified the questions to be answered with central registry accounting and operations data, creating a cost analysis framework based on the logic model of the program, and developing a data collection and analysis tool. All of the registries participated in developing the data collection and analysis instrument and five then conducted a pilot test whose results indicated that the cost analysis framework and data collection instrument, with additional modifications, could be used to answer basic questions to be more fully investigated later.
The proposed cost analysis framework was appropriate for future studies. All five registries derived revenues from a number of other Federal and non-Federal funding sources in addition to SEER-awarded funds and two of the five registries reported earned revenues from activities performed for the health care community. Labor costs represented between 72 and 92 percent of the total costs for the five registries, fringe benefits 8 to 14 percent and other direct costs 5 to 26 percent; indirect costs represented 3 to 41 percent of total costs. Preliminary estimates of the costs of activities that were unique to SEER registry operation suggested that 2 to16 percent of total direct costs might be associated with activities that were unique to SEER.
Report Title: Surveillance, Epidemiology, and End Results (SEER) Program Cost Analysis Feasibility Study. Report may be obtained from Federal Contact
Agency Sponsor: NIH, National Institutes of Health
Federal Contact: Amy Garson, 301-435-5014
Performer: CSR, Inc.
PIC ID: 8391
Appendix A - full set of the 2007-2012 HHS Strategic Plan Goals and Objectives.
We cannot discover what ought to be the case by examining what is the case.
We must decide what ought to be the case. – Paul Taylor
Goal 1: Health Care: Improve the safety, quality, affordability and accessibility of health care including behavioral health care and long term care.
Objective 1.1: Broaden health insurance and long-term care coverage.
Objective 1.2: Increase health care service availability and accessibility.
Objective 1.3: Improve health care quality, safety, cost, and value.
Objective 1.4: Recruit, develop, and retain a competent health care workforce.
Goal 2: Public Health Promotion and Protection, Disease Prevention, and Emergency Preparedness: Prevent and control disease, injury, illness, and disability across the lifespan, and protect the public from infectious, occupational, environmental, and terrorist threats.
Objective 2.1: Prevent the spread of infectious diseases.
Objective 2.2: Protect the public against injuries and environmental threats.
Objective 2.3: Promote and encourage preventive health care, including mental health, lifelong healthy behaviors and recovery.
Objective 2.4: Prepare for and respond to natural and manmade disasters.
Goal 3: Human Services: Promote the economic and social well-being of individuals, families and communities.
Objective 3.1: Promote the economic independence and social well-being of individuals and families across the lifespan.
Objective 3.2: Protect the safety and foster the well-being of children and youth.
Objective 3.3: Encourage the development of strong, healthy, and supportive communities.
Objective 3.4: Address the needs, strengths, and abilities of vulnerable populations.
Goal 4: Scientific Research and Development: Advance scientific and biomedical research and development related to health and human services.
Objective 4.1: Strengthen the pool of qualified health and behavioral science researchers.
Objective 4.2: Increase basic scientific knowledge to improve human health and human development.
Objective 4.3: Conduct and oversee applied research to improve health and well-being.
Objective 4.4: Communicate and transfer research results into clinical, public health, and human services.
Appendix B - each agency's and office's program mission and evaluation program.
Agency Mission and Evaluation Program Statements
This appendix provides brief statements for each agency or office, of the Department of Health and Human Services, that conducts evaluations. As further described in Chapter II, the agencies and offices either receive funding under Section 241 of the Public Health Service Act or expend other discretionary and mandatory program funds on evaluation activities. The statements indicate both broad missions and more detailed objectives for each component. Shown for each agency and office is either its home Web (URL) address or, if it has one, an evaluation-specific Web address where it posts additional evaluation material or, in the case of some, all their evaluation reports. These online resources supplement what is available from the HHS Policy Information Center (PIC) database at http://aspe.hhs.gov/pic/performance/.
Every HHS agency and office actively seeks to maximize its effectiveness and efficiency, consistent with the provisions of the Government Performance Results Act (GPRA), and the Program Assessment Rating Tool (PART), which forms part of the Administrations effort to further implement the intentions of GPRA. Most recently, a new component of this effort has been added with the President´s signing, November 15, 2007, Executive Order 13450, Improving Government Program Performance. The executive order established a Performance Improvement Council and directed each Department to appoint a Performance Improvement Officer to represent it on the Council and to promote effective and efficient work of the agencies. The Council is charged with, among other things, recommending criteria for evaluating program performance.
OPERATING DIVISIONS
Administration for Children and Families
Mission
Promote the economic and social well-being of families, children, individuals, and communities.
Evaluation Program
The Administration for Children and Families (ACF) administers a broad range of formula and discretionary programs, including family self-sufficiency, child support, children and family services (Head Start, Child Welfare, Child Care Subsidies, Family Preservation and Support, and youth programs), and special programs for targeted populations, such as the developmentally disabled, refugees, and Native Americans.
ACF´s evaluation objectives are to: furnish information on designing and operating effective programs; test new service delivery approaches capitalizing on the success of completed demonstrations; apply evaluation data to policy development, legislative planning, budget decisions, program management, and strategic planning and performance measures development; and disseminate findings of completed studies and promote application of results by state and local governments.
ACF stays current on emerging issues affecting its programs and identifying questions for evaluation studies by actively engaging other federal agencies, state and local policy and program officials, national organizations, foundations, professional groups and practitioners, and consumers.
Studies are often funded as joint ventures with the Office of the Assistant Secretary for Planning and Evaluation (ASPE) and other federal agencies and foundations. Such collaboration permits large-scale efforts that are better informed and more representative of varying perspectives. Multidisciplinary experts review proposals. Evaluation study designs are carefully developed in collaboration with project partners and technical experts in order to address specific research questions. Work groups of various kinds are used to monitor the progress of projects and to provide advice about design refinements and the presentation of findings.
Evaluation Web Site: http://www.acf.hhs.gov/programs/opre/index.html
Administration on Aging
Mission
Foster development of services to help older persons maintain their independence.
Evaluation Program
The Administration on Aging (AoA) is the federal focal point and advocate agency for the concerns of older persons. The agency administers key federal programs mandated under various titles of the Older Americans Act. These programs help vulnerable older persons remain in their own homes by providing supportive services. Other programs offer opportunities for older Americans to enhance their health and to be active contributors to their families, communities, and the nation through employment and volunteer programs. AoA works closely with its nationwide network of regional offices and state and area agencies on aging to plan, coordinate, and develop community‑level systems of services that meet the unique needs of individual older persons and their caregivers. AoA collaborates with other federal agencies, national organizations, and representatives of business to ensure that, whenever possible, their programs and resources are targeted to the elderly and coordinated with those of the network on aging. As the responsibilities of this nationwide network of state and area agencies on aging continue to grow, it is essential that they have the necessary information to meet these responsibilities.
The overall evaluation priorities of the AoA are to support studies that provide information on: successful program implementation in meeting the goals of the Older Americans Act; design and operation of effective programs; and, issues relevant to policy development, legislative planning, and program management.
Web Site: http://www.aoa.gov/
Agency for Healthcare Research and Quality
Mission
Improve the quality, safety, efficiency and effectiveness of health care for all Americans.
Evaluation Program
The Agency for Healthcare Research and Quality (AHRQ) provides executive management, program officers and audiences external to the Agency with evaluative findings concerning the Agency´s effectiveness and efficiency in order to meet its performance goals. The work is conducted by external, independent evaluators. Evaluation components are built into virtually all major AHRQ programmatic or portfolio activities beginning at the design phase. Among evaluation mechanisms used by the Agency are targeted evaluation studies undertaken through contracts, using a variety of quantitative and qualitative methods, and that tend increasingly to provide more real-time monitoring feedback. Evaluation activities also include satisfaction feedback from AHRQ customers regarding the usefulness of its research findings and dissemination products.
Evaluation Web Site: http://www.ahrq.gov/research/
Agency for Toxic Substances and Disease Registry
Mission
Serve the public by using the best science, taking responsible public health actions, and providing trusted health information to prevent harmful exposures and disease related to toxic substances.
Evaluation Program
The Comprehensive Environmental Response, Compensation, and Liability Act (CERCLA), more commonly known as Superfund, created the Agency for Toxic Substances and Disease Registry (ATSDR) as a federal agency. ATSDR was created to carry out the health‑related sections of CERCLA and other laws that protect the public from hazardous waste and environmental spills of hazardous substances. The ATSDR evaluation program is coordinated with the HHS-wide strategic planning process. ATSDR´s strategic goals and its annual performance plan are the result of an interactive process that reflects a long‑term commitment by Agency staff to develop stronger relationships among external clients and stakeholders, to assess products and services using relevant data, and to improve our processes and systems for more efficient accomplishment of its mission.
ATSDR Data Resources Web Site: http://www.atsdr.cdc.gov/2p-data-resources.html
Centers for Disease Control and Prevention
Mission
Promote health and quality of life by preventing and controlling disease, injury, and disability.
Evaluation Program
The Centers for Disease Control and Prevention (CDC) conducts evaluation studies designed to provide essential information about its programs, goals, and priorities. These projects support the assessment of CDC´s strategies, which are to protect the health and safety of Americans, provide credible information to enhance health decisions, and promote health through strong partnerships.
CDC emphasizes evaluations that advance its health protection goals and answer policy, program and strategic planning questions related to the goals and objectives of Healthy People 2010. Performance improvement studies, such as those focusing on the development of key performance indicators are of particular interest and import to the Agency. CDC supports a variety of activities to enhance the quality, use, and understanding of evaluations.
Evaluation Web Site: http://www.cdc.gov/eval/index.htm
Centers for Medicare & Medicaid Services
Mission
Assure health care security for beneficiaries.
Evaluation Program
The research arm of the Centers for Medicare & Medicaid Services (CMS), the Office of Research, Development, and Information (ORDI), performs and supports research and evaluations of demonstrations (through intramural studies, contracts and grants) to develop and carry out new health care financing policies and provide information on the impact of CMS´ programs. ORDI´s activities embrace all areas of health care: costs, access, quality, service delivery models, and financing. ORDI´s responsibilities include evaluating ongoing Medicare and Medicaid programs and demonstration projects that test new health care financing and delivery approaches.
Examples of research themes include state program flexibility, the future of Medicare, provider payment and delivery, and vulnerable populations and dual-eligibles.
Evaluation Web Site: http://www.cms.hhs.gov/Reports/Reports/list.asp#TopOfPage
Food and Drug Administration
Mission
The FDA is responsible for protecting the public health by assuring the safety, efficacy, and security of human and veterinary drugs, biological products, medical devices, our nation´s food supply, cosmetics, and products that emit radiation. The FDA is also responsible for advancing public health by helping to speed innovations that make medicines and foods more effective, safer, and more affordable; and helping the public get the accurate, science-based information they need to use medicines and foods to improve their health.
Evaluation Program
Evaluation plays an integral role in carrying out the FDA mission. Assessing various aspects of Agency program performance allows staff to identify means of improving that performance. The evaluation function has three goals: 1) provide information and analyses that helps Agency officials, the Department, and members of Congress make decisions related to programs, policies, budgets, and strategic planning; 2) help FDA managers improve program operations and performance; and 3) disseminate evaluation results and methodological tools useful to FDA program managers and, in some cases, to the larger public health community.
FDA evaluation activities serve one or more of the following purposes:
- Performs program and policy evaluations and analytical studies of significantly broad Agency issues;
- Recommends alternative courses of action to increase effectiveness of agency allocation of resources and to improve program and project performance;
- Monitors program evaluation activities in Agency components and collaborates with DHHS in the development of the annual DHHS evaluation plan;
- Applies quantitative and qualitative techniques to assess systems, processes, and operations to help Agency officials discover optimal courses of action; and
- Assists and consults with Agency components to design, develop and complete FDA User Fee performance reports for Congress.
Evaluation Web Site: http://www.fda.gov/ope/org.html
Health Resources and Services Administration
Mission
Provide national leadership, program resources and services needed to improve access to culturally competent, quality health care.
Evaluation Program
The Health Resources and Services Administration (HRSA) supports a wide array of very different programs and activities that promote access to needed health care for underserved populations, including primary health care centers, the National Health Service Corps, HIV/AIDS programs, maternal and child health activities, health professions training, rural health programs, organ donation and transplantation initiatives, and telehealth activities. To provide underpinning for these efforts, HRSA´s evaluation program is designed to enhance strategic planning, strengthen budget and legislative development, and improve program performance.
Evaluation Web Site: http://www.hrsa.gov
Indian Health Service
Mission
To raise the physical, mental, social, and spiritual health of American Indians and Alaska Natives to the highest level.
Evaluation Program
The goal of the Indian Health Service (IHS) is to assure that comprehensive, culturally acceptable, personal and public health services are available and accessible to American Indian and Alaska Native people. The importance of evaluation in supporting this goal has increased significantly in recent years and includes American Indians and Alaska Natives as the primary stakeholders in defining the purpose, design, and execution of evaluations. The stakeholders use the end product of the evaluations, and are the population or groups most likely to be affected by the findings. The IHS has formally adopted the principle of a responsive evaluation practice to address the needs and concerns of Native Americans and Alaska Natives.
The evaluation needs of the IHS service components are coordinated using two major types of short‑term studies: policy assessments and program evaluations. Policy assessments contribute to decision making about budget, legislation, and program modifications including information to support the Agency´s initiatives. Evaluations are focused at the program level, or Area Offices, and focus on specific needs.
The evaluation program of the IHS is managed by the Office of Public Health Support, Division of Planning, Evaluation, and Research, which provides national leadership and consultation for IHS and Area Offices on strategic and tactical planning, program evaluation and assessment, public health and medical services, research grants for Native Centers for Healthcare Research, and special public health initiatives for the Agency.
Planning and Evaluation Web Site:
http://www.ihs.gov/NonMedicalPrograms/PlanningEvaluation/index.asp
Research Web Site
http://www.ihs.gov/MedicalPrograms/Research/
National Institutes of Health
Mission
Uncover new knowledge that will lead to better health for everyone.
Evaluation Program
The National Institutes of Health (NIH) pursue new knowledge about the prevention, detection, diagnosis, and treatment of disease and disability. To that end, NIH has a wide range of programs to support health-related research and training and professional development. Evaluating these numerous and diverse programs is one important tool that NIH administrators use to determine the extent to which these programs are operating efficiently and achieving their intended outcomes.
NIH Institutes and Centers and components within the Office of the Director, use program evaluations and evaluation-related activities to improve decision-making and, ultimately, enhance program performance. Many NIH activities are crosscutting in nature and require program evaluations that involve more than one Institute, Center, or Office of the Director office to be examined effectively. Program evaluations are professional systematic investigations or studies that evaluate the merit of particular programs, or contribute to making such an evaluation possible. In most cases, the purpose of program evaluations is to help NIH administrators improve a program or make other programmatic decisions (e.g., how to allocate resources). A "program" is broadly defined as any set of activities funded by the NIH to achieve one or more predefined goals.
NIH recognizes that results-based management is a basic requirement for the sound and productive operation of government agencies and their programs. With additional efforts to increase public sector accountability, such as passage of the Chief Financial Officers Act and the Government Management Reform Act, interest in evaluation has increased steadily among program administrators.
A distinguishing feature of the NIH Evaluation Program is its position within a larger institutional framework of several evaluation strategies including the use of national advisory councils, boards of scientific counselors, consensus development conferences, and ad hoc committees. This framework helps to chart scientific directions and select the most promising research to support.
Evaluation Web Site: http://opasi.nih.gov/desa/eb/intranet/setaside/fundedstudies.asp
Substance Abuse and Mental Health Services Administration
Mission
Build resilience and facilitate recovery for people with, or at risk for, substance abuse and mental illness.
Evaluation Program
The Substance Abuse and Mental Health Services Administration (SAMHSA) conducts evaluations to ensure accountability for federal funds and to measure results toward its programmatic and policy objectives. SAMHSA is improving performance management and results by identifying annual, long-term and cost-efficiency performance measures to manage its programs.
SAMHSA has a strategic planning process through which it identifies priorities that drive the development of grant programs and evaluations. The formulation of programmatic and evaluation priorities includes consultation with SAMHSA Center Advisory Councils, with other HHS agencies, and with experts in the fields of evaluation and service delivery. Early and continuous coordination of program planning and evaluation activities results in the articulation of program objectives that may be evaluated. Evaluations measure achievement of grant programs overall objectives, and these results are used for program and policy development. The strategic planning and policy development processes then use these results to refine SAMHSA´s priorities and performance objectives.
The specific type of evaluation required depends on the type and purpose of the particular grant program. To the greatest extent possible, SAMHSA encourages the use of comparable data elements and instruments across its programs. Efforts to improve evaluation are continuing and SAMHSA is committed to using systematic approaches in using data to accomplish its mission.
Evaluation Web Site: http://ncadistore.samhsa.gov/catalog/results.aspx?h=drugs&topic=48
OFFICE OF THE SECRETARY
Office of the Assistant Secretary
for Planning and Evaluation
Mission
Provide the Secretary analyses and advice for policy development, and help the development and coordination of department-wide program planning and evaluations.
Evaluation Program
The Office of the Assistant Secretary for Planning and Evaluation (ASPE) independently funds or conducts necessary policy and evaluation research; in partnership with others, especially HHS agencies, plans and carries out evaluations; and as required, provides oversight and advice to the Secretary regarding evaluation across the Department. To support its role as a principal advisor to the Secretary on policy development, ASPE conducts a variety of health and human services evaluation and policy research studies on issues of national importance. In its evaluation coordination role, ASPE provides annual guidance to all HHS agencies and staff offices regarding evaluation priorities, procedures, and review requirements and prepare planning and summary reports on evaluation activities as required by Congress; identifies crosscutting health and human services program or policy issues of particular concern to the Secretary and specific program and policy areas not covered by the HHS Agency evaluation plans; and conducts collaborative exploration of ways to strengthen evaluation activities across the Department.
ASPE supports and promotes the development and improvement of databases that HHS agencies and ASPE use to evaluate health care programs and health trends. ASPE co-chairs and provides support to the HHS Data Council, which is charged with integrating key national surveys, such as linking health status indicators with indicators of well being. ASPE uses evaluation funds to study and promote effective use of evaluation-generated information in program management and policymaking. The Office accomplishes this through disseminating evaluation findings and other activities, such as providing technical assistance to agencies developing performance measures. Working with ASRT, ASPE staff prepares the annual Evaluation Set-Aside Report that must be submitted to Congress before funds authorized by Section 241(a) of the Public Health Service Act are expended. ASPE also is responsible for coordinating and providing to the Secretary for transmittal to Congress, this annual Performance Improvement Report summarizing the findings of evaluations carried out by the Department.
Evaluation Web Site: http://aspe.hhs.gov/pic/performance/
Office of the Assistant Secretary
for Resources and Technology
Mission
The Office of the Assistant Secretary for Resources and Technology (ASRT) provides advice and guidance to the Secretary on budget, financial management, and information technology, and grants management and provides direction and coordination of these activities throughout the Department.
Evaluation Program
ASRT systematically evaluates the effectiveness of HHS programs and strategies, including examination of program purpose and design, strategic planning systems, program management, and program results. ASRT oversees the development of the HHS annual performance plans and reports pursuant to the requirements of the Government Performance Results Act. The position of HHS Performance Improvement Officer, established by the Presidential Executive Order, Improving Government Program Performance, is housed in ASRT. In conjunction with ASPE, to prepare the annual Evaluation Set-Aside Report; ASRT staff generates the budget allocation tables for this report.
Office Web Site: http://www.hhs.gov/asrt/
Office of Inspector General, Office of Evaluation and Inspections
Mission
To protect the integrity of HHS programs, as well as the health and welfare of beneficiaries, by conducting evaluations that provide timely, useful, and reliable information and recommendations to decision makers and the public.[10]
Evaluation Program
OEI develops evaluation techniques and coordinates projects with other Office of Inspector General and HHS components. It provides programmatic expertise and information on new programs, procedures, regulations and statutes. It maintains liaison with other components in HHS, follows up on implementation of corrective action recommendations, evaluates the actions taken to resolve problems and vulnerabilities identified, and provides additional data or corrective action options, where appropriate.[11]
Evaluation Web Site: http://www.oig.hhs.gov/oei/oeisearch.html
Office of the National Coordinator for Health Information Technology
Mission
The Office of the National Coordinator for Health Information Technology (ONC) provides counsel to the Secretary and Departmental leadership of HHS for the development and nationwide implementation of an interoperable health information technology infrastructure. Use of this infrastructure will improve the quality, safety and efficiency of health care and the ability of consumers to manage their health information and health care.
Evaluation Program
The Office of the National Coordinator for Health Information Technology is engaged in funding research and programs to foster the development of interoperable nation-wide health information exchange. Initiatives are being funded to: harmonize standards for interoperability; certify electronic health record systems; evaluate the variation of organization-level business practices, policies, and state law that relate to privacy and security; and develop best practices and consensus-based policies for health information exchange.
Office Web Site: http://www.hhs.gov/healthit/
Office of Public Health and Science
Mission
Provide advice to the Secretary on public health and science, provide executive direction to program offices within the Office of Public Health and Science (OPHS), and, at the Secretary´s direction, coordinate crosscutting public health and science initiatives in the Department. The Assistant Secretary for Health heads OPHS and is responsible for oversight of and policy development for the Public Health Service Commissioned Corps. The Surgeon General implements Corps policy and manages Corps operations.
OPHS Evaluation Program
The Office of Public Health and Science, provides advice, policy and program coordination, and leadership in the implementation, management, and development of activities related to public health and science, as directed by the Secretary. OPHS helps HHS conduct broad‑based public health assessments to better address and solve public health problems. It assists other components of HHS anticipate future public health issues and helps ensure that HHS designs and carries out appropriate approaches, interventions, and evaluations that will maintain, sustain, and improve the health of the Nation. OPHS provides leadership and policy recommendations on population‑based public health and science and, at the Secretary´s direction, leads or coordinates initiatives that cut across agencies and operating divisions. The Office communicates and interacts, on behalf of the Secretary, with professional and constituency organizations on matters of public health and science. It links important HHS programs or fill gaps in areas needing better policy formulation and coordination.
OPHS´ evaluation strategy focuses on public health and science issues that cut across multiple interests of the operating divisions and require a coordinated approach to achieve effective results. OPHS evaluations support the Assistant Secretary for Health as the Secretary´s senior advisor for public health and science. OPHS conducts evaluations specific to the needs of the programs operated from the offices located within OPHS, such as women´s health, minority health, disease prevention and health promotion, and research integrity. Some evaluation funds are also made available to the ten HHS Regional Health Administrators.
Evaluation Web Site: http://www.hhs.gov/ophs/index.html
Appendix C - table of the studies in this report, organized by agency and office, indicating the Objective where the study may be found.
Elements of evaluation:
Effective programs achieve results. Results derive from good management which requires good decisions. Good decision-making depends on good information. Good information requires good data and careful analysis. Creative project officers, skillful researchers, thoughtful and receptive leaders contribute to value-added evaluation.
| AGENCY | ID | KEY RESEARCH QUESTION | STRATEGIC OBJECTIVE | FEDERAL CONTACT |
|---|---|---|---|---|
| ACF | 8578 | How Many and Who Receives What Kind of Energy Assistance Under the Low Income Home Energy Assistance Program? | 3.3 Encourage the development of strong, healthy, and supportive communities. | Litow, Leon |
| 8599 | Are Social Services Block Grant Program Funds Used by States and Territories to Provide Services to Adults and Children? | 3.1 Promote the economic independence and social well-being of individuals and families across the lifespan. | Werner, Marsha | |
| 8596 | How Does Outcome Performance of State and Local Community Services Block Grant Agencies Impact the Lives of Low-income Americans? | 3.1 Promote the economic independence and social well-being of individuals and families across the lifespan. | Wright, Anita | |
| 8590 | How Do Community Services Block Grant Projects Reduce Poverty, Revitalize Low-Income Communities and Empower Family and Individual Self-Sufficiency? | 3.1 Promote the economic independence and social well-being of individuals and families across the lifespan. | Wright, Anita | |
| 8520 | Do Chicago Employment Retention and Advancement Program Welfare Recipients Hold Jobs Longer or Advance in Those Jobs? | 3.1 Promote the economic independence and social well-being of individuals and families across the lifespan. | Baker, Timothy | |
| 8518 | Do Minnesota Employment Retention and Advancement Program Participants Hold Jobs Longer or Advance in Those Jobs? | 3.1 Promote the economic independence and social well-being of individuals and families across the lifespan. | Baker, Timothy | |
| 8512 | Do Post-Employment Services Help Working Poor? | 3.1 Promote the economic independence and social well-being of individuals and families across the lifespan. | Baker, Timothy | |
| 8473 | How Can We Help the Poor Become Employed? | 3.1 Promote the economic independence and social well-being of individuals and families across the lifespan. | Baker, Timothy | |
| 8624 | Do Faith-Based and Community Organizations Receiving Capacity Building Compassion Capital Funds Expand Capacity? | 3.3 Encourage the development of strong, healthy, and supportive communities. | Campbell, Nancye | |
| 8503 | What Does Past Research Say Regarding How Children´s Experiences and Biology Affect Their Attitudes and Decisions about Marriage? | 3.1 Promote the economic independence and social well-being of individuals and families across the lifespan. | Campbell, Nancye | |
| 8472 | How Best Use National Survey Data to Study Family Formation? | 3.1 Promote the economic independence and social well-being of individuals and families across the lifespan. | Campbell, Nancye | |
| 8471 | What Education Promotes Healthy Marriages Among Low-Income Stepfamily Couples? | 3.1 Promote the economic independence and social well-being of individuals and families across the lifespan. | Campbell, Nancye | |
| 8547.1 | What Does the Low-Income Child Care Market Look Like After Welfare Reform; What Characterizes Family Child Care? | 3.1 Promote the economic independence and social well-being of individuals and families across the lifespan. | Chamberlain, Seth | |
| 8521 | Has the Population of Families Receiving Welfare, and Those That Have Left Welfare, Become More Disadvantaged Since Welfare Reform? | 3.1 Promote the economic independence and social well-being of individuals and families across the lifespan. | Chamberlain, Seth | |
| 8576 | What Characterizes Early Head Start Programs? | 3.1 Promote the economic independence and social well-being of individuals and families across the lifespan. | Cohen, Rachel | |
| 8585 | Will Targeted Training Improve Teaching Practices For School Readiness of At-Risk, Low-Income Children? | 3.4 Address the needs, strengths, and abilities of vulnerable populations. | Martinez-Beck, Ivelisse | |
| 8510 | How Did Eight Selected Sites Change their Sanction Policies and Procedures in Response to More Stringent Deficit Reduction Act of 2005 Work Participation Rate Requirements? | 3.1 Promote the economic independence and social well-being of individuals and families across the lifespan. | Sternbach, Leonard | |
| AHRQ | 8745 | Does AHRQ Contribute to Child Health Policies, Clinical Practice, and Outcomes by Developing and Disseminating Knowledge? | 1.3 Improve health care quality, safety, cost, and value. | Chesley, Francis |
| 8743 | What Current and Future Market Exists for Quality Indicators? | 1.3 Improve health care quality, safety, cost, and value. | Pancholi, Mamatha | |
| 8591 | What Can Health Plans Do to Reduce Healthcare Disparities Among Racial and Ethnic Minority Enrollees with Diabetes | 1.3 Improve health care quality, safety, cost, and value. | Palmer, Cynthia | |
| 8594 | Does the Pharmaceutical Outcomes Portfolio, Including the Centers for Education and Research on Therapeutics, Achieve Its Goals? | 1.3 Improve health care quality, safety, cost, and value. | Smith, Scott | |
| 8807 | Does the Partnerships for Quality Program Improve the Rate of Research Translation and Quality? | 1.3 Improve health care quality, safety, cost, and value. | Mullican, Charlotte | |
| ASPE | 8655 | How Have States Sought to Save Money and Serve More People with Intellectual and Developmental Disabilities through "Supports" Waivers? | 1.1 Broaden health insurance and long-term care coverage. | Bergofsky, Linda |
| 8643 | What Changes Were Observed Among Private Long-Term Care Insurance Claimants? | 1.1 Broaden health insurance and long-term care coverage. | Doty, Pamela | |
| 8642 | What Long-Term Care Choices Do Claimants Make Who Have Private Long Term Care Insurance? | 1.1 Broaden health insurance and long-term care coverage. | Doty, Pamela | |
| 8647 | How Risky is Individual Health Insurance? Where Do Individuals Obtain Health Insurance? | 1.1 Broaden health insurance and long-term care coverage. | Drabek, John | |
| 8645 | Who Has Individual Health Insurance, and How Does It Compare With Other Private Coverage Obtained Through Employers? | 1.1 Broaden health insurance and long-term care coverage. | Drabek, John | |
| 8337 | Can Health IT Standards Overcome Known Terminology and Messaging Challenges to Standardize Assessment Information Collected and Exchanged on Behalf of Nursing Home Residents? | 1.3 Improve health care quality, safety, cost, and value. | Harvell, Jennie | |
| 8331 | How Evaluate the Business Case for Using Health Information Technology in Long-Term Care Settings? | 1.3 Improve health care quality, safety, cost, and value. | Harvell, Jennie | |
| 8654 | To What Extent do Medicaid State Plans and Home and Community-Based Services Waivers Cover Assistive Technology and Home Modification Services? | 1.3 Improve health care quality, safety, cost, and value. | Kennedy, Gavin | |
| 8549.3 | Does Payment Source Predict Skilled Nursing Facility and Nursing Home Resident Use of or Expenditures for Drugs? | 1.3 Improve health care quality, safety, cost, and value. | Polniaszek, Susan | |
| 8549.2 | How Did Medicare Beneficiaries in Long-Term Care Facilities Use Drugs Compared to Community Residents Treated at the Same Time? | 1.3 Improve health care quality, safety, cost, and value. | Polniaszek, Susan | |
| 8549.1 | What Was National Drug Spending for Residents of Long-Term Care Facilities, 1998-2001? | 1.3 Improve health care quality, safety, cost, and value. | Polniaszek, Susan | |
| 8549 | How Do Medicare Beneficiaries Use of Medications in Long-Term Care Facilities Compare to Community Residents´ Use Before the Addition of Medicare Drug Coverage? | 1.3 Improve health care quality, safety, cost, and value. | Polniaszek, Susan | |
| 8531 | How Do Health Care Outcomes Vary in Different Medicare Post Acute Settings for Patients Who Have Had Strokes? | 1.3 Improve health care quality, safety, cost, and value. | Polniaszek, Susan | |
| 8530 | Did Nursing Home Chains Divest, Withdraw from Markets, or Change Corporate Structure Due to Rising Liability Claims and Medicare Prospective Payments? | 1.2 Increase health care service availability and accessibility. | Polniaszek, Susan | |
| 8528 | What Information Resources Do Individuals Use When Seeking Nursing Home Care? | 1.2 Increase health care service availability and accessibility. | Polniaszek, Susan | |
| 8623 | How Appropriate Are Medicare Drug Coverage Risk-Adjustments for the Disabled and Low-Income Subsidy-Eligible Persons? | 1.3 Improve health care quality, safety, cost, and value. | George Greenberg | |
| 8482 | What Are the Historical and Projected Trends in Medicaid Enrollment and Spending? | 1.2 Increase health care service availability and accessibility. | Musco, Thomas | |
| 8575 | Can Increases in Physician Payments Be Made Systematically, Reasonably, and Conflict Free? | 1.3 Improve health care quality, safety, cost, and value. | Nonnemaker, Lynn | |
| 8542 | Does Marital Status Influence Health? | 2.3 Promote and encourage preventive health care, including mental health, lifelong healthy behaviors, and recovery. | Burnszynski, Jennifer | |
| 8532 | Why Does Child Support Debt Grow; Is It Collectable? | 3.1 Promote the economic independence and social well-being of individuals and families across the lifespan. | Burnszynski, Jennifer | |
| 8586 | Which Poor Single Mothers Exit and Remain Out of Poverty? | 3.1 Promote the economic independence and social well-being of individuals and families across the lifespan. | Chadwick, Laura | |
| 8759 | What Causes Obesity Among American Indians/Alaska Natives; How to Prevent It? | 1.3 Improve health care quality, safety, cost, and value. | Halpern, Peggy | |
| 8573 | What Data Exist on the Health and Well-being of Native Americans? | 4.4 Communicate and transfer research results into clinical, public health, and human service practice. | Halpern, Peggy | |
| 8581 | How Dependent Are Americans On Social Welfare Programs? | 3.1 Promote the economic independence and social well-being of individuals and families across the lifespan. | Hauan, Susan | |
| 8529 | Why and How Use Vouchers in Federal Assistance Programs? | 3.1 Promote the economic independence and social well-being of individuals and families across the lifespan. | Landey, Alana | |
| 8527 | What Native American Health and Well-being Data are Missing; How Can They Be Obtained? | 3.4 Address the needs, strengths, and abilities of vulnerable populations. | Landey, Alana | |
| 8769 | How Do State Data Warehouses Support Child Support Performance? | 3.1 Promote the economic independence and social well-being of individuals and families across the lifespan. | Mellgren, Linda | |
| 8768 | How Could Using Administrative Data Improve State Child Support Agencies´ Performance? | 3.1 Promote the economic independence and social well-being of individuals and families across the lifespan. | Mellgren, Linda | |
| 8767 | How Develop Marriage and Family Life Support Services for Prisoners and Their Partners? | 3.4 Address the needs, strengths, and abilities of vulnerable populations. | Mellgren, Linda | |
| 8764 | What Are The Fertility Patterns Of Married and Unmarried Men? | 3.1 Promote the economic independence and social well-being of individuals and families across the lifespan. | Mellgren, Linda | |
| 8509 | Under What Circumstances Should a State or Community Consider Privatizing its Child Welfare Services? | 3.2 Protect the safety and foster the well-being of children and youth. | Radel, Laura | |
| 8185.4 | How May Domestic Violence and Child Welfare Programs Best Serve Families in Which Children are Endangered by Domestic Violence? | 3.2 Protect the safety and foster the well-being of children and youth. | Silverman, Jerry | |
| 8185.3 | How May Communities Better Assess Their Family Domestic Violence and Child Maltreatment Services? | 3.2 Protect the safety and foster the well-being of children and youth. | Silverman, Jerry | |
| 8185.2 | How Can Domestic Violence Treatment and Prevention Providers More Effectively Help Battered Mothers in the Child Welfare System? | 3.2 Protect the safety and foster the well-being of children and youth. | Silverman, Jerry | |
| 8592 | Are Child Care and Development Funds Serving Rural Children? | 3.1 Promote the economic independence and social well-being of individuals and families across the lifespan. | Swenson, Kendall | |
| 8627 | How Effective is a Supplemental Life Skills Education Component Aimed at Increasing Sexual Abstinence? | 3.2 Protect the safety and foster the well-being of children and youth. | Trivits, Lisa | |
| 8626 | How Effective Are Four Abstinence Education Programs? | 3.2 Protect the safety and foster the well-being of children and youth. | Trivits, Lisa | |
| CDC | 7872 | How Assure That Newborns Return for Essential Follow-Up for Early Hearing and Intervention Screening? | 4.4 Communicate and transfer research results into clinical, public health, and human service practice. | Costa, Pam |
| 8708 | How Have Communities Been Made Aware of and How Did They Decide to Implement the Protocol for Assessing Community Excellence in Environmental Health? | 3.3 Encourage the development of strong, healthy, and supportive communities. | Hubbard, Brian | |
| 8749 | Does Active Surveillance Deter Intimate Partner Violence and Child Maltreatment? | 4.3 Conduct and oversee applied research to improve health and well-being. | Melanson, Cindi | |
| 8299 | How Improve Outcomes of Safety Knowledge, Attitudes, and Behavior-Influence of a Fire-Fighter Fatality Investigation and Prevention Program? | 4.4 Communicate and transfer research results into clinical, public health, and human service practice. | Pizatella, Tim | |
| 7975 | 4.4 Communicate and transfer research results into clinical, public health, and human service practice. | Schooley, Michael | ||
| 8300 | What Are Available Heart Disease and Stroke Prevention Policies? | 1.3 Improve health care quality, safety, cost, and value. | Slaton, Terrie | |
| 8660 | Does the Mining Research Program Effectively Target Causes of Occupational Injury, Illness, and Death? | 4.3 Conduct and oversee applied research to improve health and well-being. | Zajac, Julie | |
| CMS | 8605 | What Are the Care Pathways for Individuals Hospitalized with Congestive Heart Failure and Individuals Entering Nursing Homes? | 1.3 Improve health care quality, safety, cost, and value. | Buczko, William J. (Bill) |
| 8589 | How Can Medical Inpatient Cost Estimates Be Improved? | 1.3 Improve health care quality, safety, cost, and value. | Cotterill, Philip | |
| 8588 | How Can Diagnostic-Related Service Classifications Be Used in the Inpatient Prospective Payment System? | 1.3 Improve health care quality, safety, cost, and value. | Cotterill, Philip | |
| 7380 | State Child Health Insurance: How Successful? | 3.1 Promote the economic independence and social well-being of individuals and families across the lifespan. | Radke, Susan | |
| 8695 | How Prevalent In the Medicaid Population are Individuals With Special Health Needs; What Are These Needs; What Factors Determine Access to or Loss of Medicaid Eligibility? | 1.2 Increase health care service availability and accessibility. | Clark, Bill | |
| 8662 | Do Early Implementation Costs and Quality Meet Expectations in the Medicare Health Support Program? | 1.3 Improve health care quality, safety, cost, and value. | Kapp, Mary | |
| 8601 | What Practice Profiling Criteria Best Identify Efficient Qualified Physicians? | 1.4 Recruit, develop, and retain a competent health care workforce. | Levy, Jesse | |
| 8685 | What Was the Effect of Improved Financing for Medicare Advantage Plans on Plan Offerings? | 1.2 Increase health care service availability and accessibility. | Montgomery, Melissa | |
| 8649 | How Has Beneficiary Enrollment in Preferred Provider Organizations Affected Medicare Expenditures? | 1.2 Increase health care service availability and accessibility. | Mohr, Penny | |
| 8658 | How Does the Medicare Replacement Drug Demonstration Affect Patient Access to Care, Health Outcomes, and Medicare Cost-Effectiveness? | 1.3 Improve health care quality, safety, cost, and value. | Mohr, Penny | |
| 8657 | What is the Cost-effectiveness of Disease-Modifying Therapies for Treating Multiple Sclerosis? | 1.3 Improve health care quality, safety, cost, and value. | Mohr, Penny | |
| 8656 | What Are the Costs and Benefits of Biologic Therapies for Treating Rheumatoid Arthritis? | 1.3 Improve health care quality, safety, cost, and value. | Mohr, Penny | |
| 8687 | Did Various Chronic Disease Treatment Programs Perform Cost Effectively, Improve Quality, and Satisfy Patients and Providers? | 1.3 Improve health care quality, safety, cost, and value. | Magee, Carol | |
| FDA | 8763 | Do Users of the Center for Devices and Radiological Health and its Custom Information Technology Applications Need Training in These Systems? | 1.2 Increase health care service availability and accessibility. | Choi, Simon |
| 8762 | How do Medical Device Companies View the Food and Drug Administration´s Pre-Market Review Process? | 1.3 Improve health care quality, safety, cost, and value. | Markovitz, Bonnie | |
| 8690 | How do Consumers Perceive Food and Drug Administration´s Early Risk Information on Drug Products? | 4.3 Conduct and oversee applied research to improve health and well-being. | Mease, Mary | |
| 8688 | How Do Pharmacists Perceive Food and Drug Administration´s Communication Regarding Emerging Drug Risks? | 4.4 Communicate and transfer research results into clinical, public health, and human service practice. | Mease, Mary | |
| 8686 | How Can Information Sharing with FDA´s Center for Devices and Radiological Health Be Improved? | 2.2 Protect the public against injuries and environmental threats. | Mendelson, Laurel | |
| 8682 | How Best Present Device and Radiological Health Information Online? | 4.2 Increase basic scientific knowledge to improve human health and human development. | Mendelson, Laurel | |
| 8697 | How Do Patients and their Caregivers Regard Medical Device Recalls and Safety Information? | 1.3 Improve health care quality, safety, cost, and value. | Silberburg, Paula | |
| HRSA | 8058 | Does Infant Adoption Awareness Training Program Improve the Ability of Trainees to Present All Courses of Action to Pregnant Women? | 1.2 Increase health care service availability and accessibility. | Carr, Willine |
| 8388 | What Impact Do Interventions Using Information Technology Have on Delivery and Quality of Primary Care for Underserved People Living with HIV? | 1.2 Increase health care service availability and accessibility. | Cajina, Adan | |
| 8389 | What Impact Do HIV Outreach and Intervention Models Have? | 1.1 Broaden health insurance and long-term care coverage. | Cajina, Adan | |
| 8386 | What Features Make Targeted Insurance Programs Successful With the Poor? | 3.1 Promote the economic independence and social well-being of individuals and families across the lifespan. | Townsend, Jessica | |
| IHS | 8094 | How Thorough is Influenza and Pneumococcal Vaccination Coverage? | 2.1 Prevent the spread of infectious diseases | Vogel, Lucie
|
| NIH | 8459 | Are Cancer Patients Concerned About Possible Financial Conflicts of Interest Between Researchers, Medical Centers and Drug Companies? | 4.3 Conduct and oversee applied research to improve health and well-being. | Alterman, Peter |
| 8754 | How Best Measure Success of the Innovative Molecular Analysis Program? | 4.4 Communicate and transfer research results into clinical, public health, and human service practice. | Aragon, Richard | |
| 8461 | Does Service of the Genetic and Rare Disease Information Center Satisfy Users? | 4.4 Communicate and transfer research results into clinical, public health, and human service practice. | Bonham, Vence | |
| 8742 | Should an Outcome Evaluation of the Small Animal Imaging Resource Program Be Conducted? | 4.1 Strengthen the pool of qualified health and behavioral science researchers. | Croft, Barbara Y | |
| 8757 | Has the Bench-to Bedside Program Sped Translation of Promising Laboratory Discoveries into New Medical Treatments? | 4.4 Communicate and transfer research results into clinical, public health, and human service practice. | Gallin, John | |
| 8391 | What Are Costs of Cancer Registry Operations? | 4.4 Communicate and transfer research results into clinical, public health, and human service practice. | Garson, Amy | |
| 8751 | How Evaluate Whether Standard Policies and Procedures Improve Compliance with the Requirements in Sponsored Clinical Research? | 4.3 Conduct and oversee applied research to improve health and well-being. | Hafner, Richard | |
| 8817 | How has the Trans-HHS Special Statutory Funding Program for Type 1 Diabetes Research Impacted Research Progress in the Field? | 4.2 Increase basic scientific knowledge to improve human health and human development. | Hanlon, Mary | |
| 8748 | What Progress Has Been Made Collecting, Classifying, and Analyzing Safety Data Across NIH-Sponsored Clinical Trials? | 1.3 Improve health care quality, safety, cost, and value. | Hawk, Ernest | |
| 7627 | What Direction Should the Extramural Associates Research Development Award Program Pursue? | 4.1 Strengthen the pool of qualified health and behavioral science researchers. | Johnson, Paul | |
| 8750 | Could Good Clinical Practice Computer-Based Training Change Researcher Behaviors and Improve Human Subject Safety, Data Integrity and Research Efficiency? | 4.3 Conduct and oversee applied research to improve health and well-being. | Jones, Nancy | |
| 8470 | Are Users of Online Toxicological Information Resources Satisfied? | 4.4 Communicate and transfer research results into clinical, public health, and human service practice. | Love, Cindy | |
| 8758 | Should an Outcome Evaluation of In Vivo Cellular and Molecular Imaging Centers Be Conducted? | 4.2 Increase basic scientific knowledge to improve human health and human development. | Menkens, Anne | |
| 8753 | Should the Behavioral and Social Research Program Be Continued? | 4.2 Increase basic scientific knowledge to improve human health and human development. | Patmios, Georgeanne | |
| 8458 | Is it Feasible to Evaluate Training and Career Development Programs? | 4.1 Strengthen the pool of qualified health and behavioral science researchers. | Peterman, Wilma | |
| 8385 | American Customer Satisfaction Index: Ready for Broader HHS Use? | 4.4 Communicate and transfer research results into clinical, public health, and human service practice. | Wood, Fred | |
| OPHS | 8805 | How Should Healthy People National Disease Prevention and Health Promotion Objectives for 2020 Be Developed? | 2.1 Prevent the spread of infectious diseases | Blakey, Carter |
| 8804 | What Health Education Methods Encourage Youth to Adopt Healthy Nutritional and Physical Activity Behaviors? | 2.3 Promote and encourage preventive health care, including mental health, lifelong healthy behaviors, and recovery. | Blakey, Carter | |
| 8468 | What Progress Has Been Made toward Healthy People 2010 Goals and Objectives? | 2.1 Prevent the spread of infectious diseases | Ochiai, Emmeline | |
| 8625 | Does Cultural Competency Training for Doctors Improve Their Services to and Health Outcomes Achieved by Racial/Ethnic Minorities and New Immigrant Patients? | 3.4 Address the needs, strengths, and abilities of vulnerable populations. | Pacheco, Guadalupe | |
| 8659 | Do Efforts to Involve Parents in Their Kids´ Pregnancy Prevention Programs Work? | 3.2 Protect the safety and foster the well-being of children and youth. | Dunnell, Susan | |
| OS-OIG | 8780 | Are Payments for Surgical Removal of Dead or Unhealthy Tissue From Wounds Correct? | 1.3 Improve health care quality, safety, cost, and value. | Claire Barnard |
| 8781 | How Often Do States Survey and Certify Medicare Hospices; What Rate of Health Deficiencies Are Seen? | 1.3 Improve health care quality, safety, cost, and value. | Claire Barnard | |
| 8774 | Do States Meet Federal Fraud and Abuse Prevention Requirements for State Children´s Health Insurance Programs? | 1.3 Improve health care quality, safety, cost, and value. | Claire Barnard | |
| 8783 | How Do States Apply Medicaid Standards to Durable Medical Equipment Providers? | 1.3 Improve health care quality, safety, cost, and value. | Claire Barnard | |
| 8785 | Were Government Purchase Card Uses After Hurricane Katrina Appropriate? | 1.2 Increase health care service availability and accessibility. | Claire Barnard | |
| 8784 | Were Government Purchase Card Uses After Hurricane Katrina Appropriate? | 2.4 Prepare for and respond to natural and manmade disasters. | Claire Barnard | |
| 8775 | Are Users Satisfied With the Medicare´s 1-800-MEDICARE Customer Service Telephone Line? | 1.2 Increase health care service availability and accessibility. | Claire Barnard | |
| 8773 | How Well Did the Commissioned Corps Respond to Citizens´ Needs After Hurricanes Katrina and Rita? | 2.4 Prepare for and respond to natural and manmade disasters. | Claire Barnard | |
| 8778 | How Do States Promote Health Information Technology and Exchange? | 1.2 Increase health care service availability and accessibility. | Claire Barnard | |
| 8782 | How Many Referrals of Suspected Fraud Do Medicare Fraud Control Units Receive and from Whom? | 1.3 Improve health care quality, safety, cost, and value. | Claire Barnard | |
| 8776 | At What Rates do Quality Improvement Organizations Identify and Respond to Quality-of-Care Concerns? | 1.3 Improve health care quality, safety, cost, and value. | Claire Barnard | |
| 8770 | How Identify End Stage Renal Disease Facilities Needing Quality Improvement? | 1.3 Improve health care quality, safety, cost, and value. | Claire Barnard | |
| 8779 | What Services Does Medicare Include Under Part B For Nursing Home Residents Who Do Not First Receive Hospital Services Under Part A? | 1.2 Increase health care service availability and accessibility. | Claire Barnard | |
| 8786 | Do Selected Suppliers of Durable Medical Equipment, Prosthetics, Orthotics and Supply Suppliers Physically Exist? | 1.2 Increase health care service availability and accessibility. | Claire Barnard | |
| 8777 | Were Medicaid Payments for Pediatric Dental Services Appropriate? | 1.3 Improve health care quality, safety, cost, and value. | Claire Barnard | |
| 8771 | Do Medicare Carriers Correctly Calculate Copayments for Mental Health Services Rendered to Those With Alzheimer's Disease? | 1.3 Improve health care quality, safety, cost, and value. | Claire Barnard | |
| 8791 | Have States Reduced the Number of Uninsured Low-Income Children? | 1.2 Increase health care service availability and accessibility. | Claire Barnard | |
| 8787 | How Much Did Medicaid Pay for Medical Services and Prescription Drugs to Evacuees from Hurricanes Rita and Katrina? | 1.3 Improve health care quality, safety, cost, and value. | Claire Barnard | |
| 8788 | Where Were the Highest Fraudulent Claims for Infusion Therapy? | 1.3 Improve health care quality, safety, cost, and value. | Claire Barnard | |
| 8789 | Do Average Sales Prices for Specific Prescription Drugs Exceed Average Manufacturer Prices? | 1.3 Improve health care quality, safety, cost, and value. | Claire Barnard | |
| OS-ONC | 8595 | How Build a Nationwide Health Information Network? | 1.3 Improve health care quality, safety, cost, and value. | Fyffe, Kathleen |
| 8593 | How Can State-Level Health Information Exchanges Advance Interoperability? | 1.3 Improve health care quality, safety, cost, and value. | Fyffe, Kathleen | |
| 8580 | How Widely Have Electronic Health Records Been Adopted? | 1.3 Improve health care quality, safety, cost, and value. | Fyffe, Kathleen | |
| 8579 | What is the Scope of the Health Care Fraud Problem that Using Electronic Health Records Can Help Reduce? | 1.3 Improve health care quality, safety, cost, and value. | Fyffe, Kathleen | |
| SAMHSA | 7885 | What Interventions Best Prevent or Reduce Ecstasy, Methamphetamine, and other Club Drugs Use Among Youths? | 2.3 Promote and encourage preventive health care, including mental health, lifelong healthy behaviors, and recovery. | Bailey, Daniel |
| 8730 | What Characterizes Better Mental Health Responses to Survivors of Catastrophic Disasters Such as the Gulf Coast Hurricanes Katrina, Wilma, and Rita? | 2.4 Prepare for and respond to natural and manmade disasters. | Bellamy, Nikki | |
| 8718 | Do Workers Use Illicit Drugs and Alcohol; Are They Aware of Workplace Substance Use Policies? | 4.4 Communicate and transfer research results into clinical, public health, and human service practice. | Colliver, James | |
| 8713 | How Prevalent Was Substance Abuse and Mental Illness During 2006? | 4.4 Communicate and transfer research results into clinical, public health, and human service practice. | Colliver, James | |
| 8717 | What Was the Prevalence of Substance Use, Abuse, Dependence and Mental Health Problems in 2004 and 2005? | 4.4 Communicate and transfer research results into clinical, public health, and human service practice. | Hughes, Art | |
| 8714 | Do Self-Reports and Laboratory Tests Results of Drug Use by Youth and Young Adults Match? | 4.4 Communicate and transfer research results into clinical, public health, and human service practice. | Hughes, Art | |
| 7716.1 | Did Community Consensus-Building Projects to Encourage Exemplary Evidence-Based Mental Health Services Implement Successfully? | 3.1 Promote the economic independence and social well-being of individuals and families across the lifespan. | Morrisette, David | |
| 8736 | Did Special Family Treatment Drug Courts Serve Better Than Traditional Court Handling of Child Welfare Cases? | 1.2 Increase health care service availability and accessibility. | Robertson, Kenneth | |
| 7883.1 | Does Minority Substance Abuse and HIV Prevention Reduce or Delay Drug Use and Increase HIV/AIDS Avoidance Behavior? | 2.1 Prevent the spread of infectious diseases | Roddy, Pamela | |
| 7722 | Do Patients Who Are Depressed or Who Suffer At-Risk-Drinking Fare Better in Integrated Primary Care Settings or in Specialty Care? | 1.3 Improve health care quality, safety, cost, and value. | Scheinholtz, Marian | |
| 7887 | What Impact Has the Buprenorphine Waiver Had? | 1.3 Improve health care quality, safety, cost, and value. | Stanton, Arlene | |
| 8716 | What Characterized Substance Abuse Treatment Facilities During 2006? | 4.4 Communicate and transfer research results into clinical, public health, and human service practice. | Trunzo, Deborah | |
| 8712 | What Were Admission Rates Into Substance Abuse Treatment Facilities in 2005? | 4.4 Communicate and transfer research results into clinical, public health, and human service practice. | Trunzo, Deborah | |
| 8711 | What Were Population Based Admission Trends to Substance Abuse Treatment Facilities, 1995-2005? | 4.4 Communicate and transfer research results into clinical, public health, and human service practice. | Trunzo, Deborah |
Appendix D - glossary of evaluation terms, terms-of-art used by some offices or agencies, and acronyms for the organizational units of HHS.
The glossary, new with this 2008 issue of the report, provides some assistance to readers who may be unfamiliar with the terms and acronyms found in the report.
1915(c) waivers – refers to section 1915(c) of the Medicaid program allowing the Secretary of HHS to waive certain program requirements in the law. Waivers permit States greater flexibility to target program eligibility and provide home and community based services for the disabled and/or elderly populations.
Accountability – responsibility for the expenditure, administrative and programmatic activities that occur in organizational units over which one has formal authority.
ACF – Administration for Children and Families.
AOA – Administration on Aging.
AHRQ – Agency for Healthcare Research and Quality.
ATSDR – Agency for Toxic Substances and Disease Registry.
Appreciative inquiry – Appreciative inquiry rejects the more traditional ´problem-focused´ approach and instead seeks to identify what is working well or opportunities for positive change.
Arrearages – in ACF, past-due child support payments.
Balanced Budget Act of 1997 (BBA) – designed to balance the federal budget by 2002. Among many other things, the Act contained major Medicare reforms.
Balanced Budget Refinement Act of 1999 (BBRA) – moved to reinstate some of the funding that the Balanced Budget Act (BBA) of 1997 had cut. It provided financial relief to Medicare and
Medicaid providers and State Children´s Health Insurance Programs (SCHIPs).
Bayesian – a statistical approach that assesses the probability of a hypothesis being correct (for example, whether an association is valid) by incorporating the prior probability of the hypothesis and the experimental data supporting the hypothesis (Named after the Reverend Thomas Bayes, 1702-1761).
Benchmark – standard or point of reference (often some standard of best practices) against which program processes or outcomes can be compared.
Best practices – program models or activities for which effectiveness in achieving specified goals or objectives has been demonstrated or suggested, across a number of implementations and evaluations.
Benefits Improvement and Protection Act of 2000 (BIPA) – provided $35 billion over a 5-year period to hospitals, nursing homes, managed care plans, home health agencies, hospices, and DME providers to reinstate some of the reimbursements that the Balanced Budget Act of 1997 cut.
Bias – systematic distortion in a measurement instrument which results in data that tend to be either too high or too low in relation to the true value of a measure.
Biologic – a virus, serum, toxin, antitoxin, vaccine, blood, blood component or derivative, allergenic product, or other similar product used to prevent, treat or cure disease or injury.
Capitation – the system of payment for each customer served, rather than by service performed.
Case studies – methods of inquiry that focus on intensive data collection and analysis that investigates only a few units of analysis.
CCF – see Compassion Capital Fund.
CDC – Centers for Disease Control and Prevention.
Charge compression – the tendency of hospitals to hospitals tend to markup high cost items less than they markup low cost items (the term is used by the Centers for Medicare and Medicaid Services).
Clinical efficacy – In a medical context it indicates that the therapeutic effect of a given intervention (e.g. intake of a medicine, an operation, or a public health measure) is acceptable.
CMS – Centers for Medicare and Medicaid Services.
Commissioned Corps – a force of more than 6,000 well-trained, highly qualified public health professionals dedicated to protecting, promoting, and advancing the health and safety of the Nation. The Surgeon General implements Corps policy and manages operations of the Corps including training and assignment of officers, deployment of special response teams to public health emergencies, and allocation of officers to underserved communities and populations. Commissioned Corps officers serve throughout Office of Public Health and Science (OPHS), in assignments across the Department of Health and Human Services, as well as in other agencies and programs, providing essential public health leadership and fulfilling service roles.
Community-Level Social Indicator – a social indicator that can be collected, reported and meaningfully interpreted for geo-political units such as neighborhoods, towns or cities, metropolitan areas, or regions (see also, social indicator).
Community-Level Social Indicator System – a compilation of community-level social indicators based on data from one or more sources such as archival, surveillance, or administrative data developed for other purposes and, in some cases, other information including data developed from surveys implemented specifically for tracking local indicators.
Comparison group, control group – people who are not exposed to the program and who are compared to the program group.
Compassion Capital Fund (CCF) – Federal grant opportunities––for the purpose of organizational capacity building––that are of interest to faith-based and community groups. Managed by the Administration for Children and Families (ACF).
Cost-benefit (or benefit-cost) ratio – the ratio of total discounted program benefits to total discounted program costs.
Cost-benefit analysis – process of comparing values of all benefits less those of related costs when benefits can be valued in dollars the same way as costs. A cost-benefit analysis is performed in order to select the alternative that maximizes the benefits of the program.
Cost-effectiveness analysis – comparison of the relative costs and benefits of two or more approaches to a problem.
Cost-utility analysis – a form of cost-effectiveness analysis of alternative interventions in which costs are measured in monetary units and outcomes are measured in terms of their utility, usually to the patient, e.g., using QALYs.
Diabetes – The World Health Organization recognizes three main forms of diabetes mellitus: type 1, type 2, and gestational diabetes (occurring during pregnancy), which have different causes and population distributions. While, ultimately, all forms are due to the beta cells of the pancreas being unable to produce sufficient insulin to prevent hyperglycemia, the causes are different. Type 1 diabetes is usually due to autoimmune destruction of the pancreatic beta cells. Type 1 diabetes is usually diagnosed in children and young adults, and was previously known as juvenile diabetes. In type 1 diabetes, the body does not produce insulin. Insulin is a hormone that is needed to convert sugar (glucose), starches and other food into energy needed for daily life.
Type 2 diabetes is characterized by insulin resistance in target tissues. This causes a need for abnormally high amounts of insulin and diabetes develops when the beta cells cannot meet this demand. Gestational diabetes is similar to type 2 diabetes in that it involves insulin resistance; the hormones of pregnancy can cause insulin resistance in women genetically predisposed to developing this condition.
Diagnosis-Related Groups (DRG) – classification system that groups patients according to diagnosis, type of treatment, age, and other relevant criteria. Under the prospective payment system, hospitals are paid a set fee for treating patients in a single DRG category, regardless of the actual cost of care for the individual.
Discounted, discounting – process of determining the net present value of a dollar amount of costs or benefits.
Discount rate – rate of interest used in discounting costs and benefits, that is, converting all costs and benefits over the life of the policy, program, or project into net present values.
DMEPOS – Medicare durable medical equipment, prosthetics, orthotics, and supply suppliers
DRG – see Diagnosis Related Groups.
Drug risk-adjustment – the process by which the Centers for Medicare and Medicaid Services (CMS) modifies medical insurance payments to drug insurance plans for prescription drugs to account for known differences in health status of the enrollees served––to take into account the higher costs of individuals who have medical conditions which require greater use of pharmaceuticals––in order to neutralize incentives drug plans have to enroll only healthy individuals with low drug utilization in order to maximize their profits.
Dual eligibles – persons entitled to Medicare (Part A and/or Part B) and who are also eligible for Medicaid.
Effectiveness – extent to which the observed outcomes are consistent with the intended objectives.
Enrollment growth – increases in the number of people eligible for and receiving benefits.
Environmental factors – factors in the surroundings of a program that may have an effect on it and on the intended outcomes.
Evaluability Assessment – systematic process used to determine the feasibility of a program evaluation. It also helps determine whether conducting a program evaluation will provide useful information that will help improve the management of a program and its overall performance.
Evidence-based – a philosophy that emphasizes the importance of using defensible evidence as the basis for actions/decisions ("evidence-based decision making is sometimes associated with performance management).
Experimental/impact design – a research design involving one or more treatment (program) and control groups, where program and control participants are randomly assigned to the groups, ensuring that the groups are equal except for the program itself.
FDA – Food and Drug Administration.
Fee-For Service – a system in health care by which particular services are paid for individually rather than provided as part of a comprehensive plan
FFS – see Fee-For-Service.
Focus group – group of persons selected for their relevance for a particular evaluation question.
Formative evaluation -- an assessment of program efforts prior to their completion for the purpose of improving the efforts; examples include developmental and implementation evaluation.
HCBS – see Home and Community-Based Services.
HIE – see Health Information Exchange.
HIT – see Health Information Technology.
HRSA – Health Resources and Services Administration.
Home and Community Based Services (HCBS) – programs that offer different choices to some people with Medicaid; if a person qualifies, they receive care in their home and community so they can stay independent and close to family and friends. HCBS programs help the elderly and disabled, mentally retarded, developmentally disabled, and certain other disabled adults. These programs give quality and low-cost services.
Health Information Exchange (HIE) – the mobilization of healthcare information electronically across organizations within a region or community.
Health Information Technology (HIT) – software and infrastructure used in the clinical practice of medicine to support documentation, storage and exchange of patient data.
Health Maintenance Organization (HMO) – form of health insurance combining a range of coverages on a group basis. A group of doctors and other medical professionals offer care through the HMO for a flat monthly rate with no deductibles. However, only visits to professionals within the HMO network are covered by the policy. All visits, prescriptions and other care must be cleared by the HMO in order to be covered. A primary physician within the HMO handles referrals.
HEDIS – Health Plan Employer Data and Information Set, a list of about 60 standardized performance measures developed and maintained by the National Committee for Quality Assurance (NCQA) in Washington, DC. Currently, most health plans report their results directly to NCQA as well as to their larger customers.
HHS – standard acronym used in this report designating the United States Department of Health and Human Services.
HMO – see Health Maintenance Organization.
IHS – Indian Health Service.
Impact evaluation -- Focuses on the long-range results of the program or project, and changes or improvements as a result (for e.g., long-term maintenance of desired behavior, reduced absenteeism from work, reduced morbidity and mortality). Because such evaluations are the most comprehensive and focus on long-term results of the program and changes or improvements in health status, they are the most desirable. However, impact evaluations are rarely possible because they are frequently costly and involve extended commitment. Also, the results often cannot be directly related to the effects of a program, project, or activity because of other (external) influences on the target audience, which occur over time.
Information Technology (IT) – a general term encompassing the use of hardware, software and services to create, store, retrieve, transfer, process and present information. IT projects typically involve the introduction or enhancement of systems or technology to meet a particular business need.
Input Measure: measure of what an agency or manager has available to carry out the program or activity to produce an output or outcome.
Interoperability – ability of two or more systems or components to exchange information and to use the information that has been exchanged.
Interoperable health information exchange – the ability of two or more health information systems to exchange and use health-related information.
Logic model – tool for planning, implementing, and evaluating programmatic efforts, by mapping out the theory or rationale that supports what is being done. Logic models typically tie together: long-term problem(s) to be addressed; factors that must be addressed that contribute to the problem(s); strategies and practices, and supporting resources, that can be mobilized to address the factors and the problems; and measurable impacts and outcomes that can be expected to result from implementing the strategies and practices – as these relate to the long-term problem(s).
Medicaid – joint Federal and State program that helps with medical costs for some people with low incomes and limited resources. Medicaid programs vary from state to state, but most health care costs are covered if a person qualifies for both Medicare and Medicaid.
Medicaid Information Technology Architecture (MITA) – framework developed by CMS to help States modernize their Medicaid information systems.
Medicare – Federal health insurance program for persons 65 years of age or older, the disabled, and those with end-stage renal disease.
Medicare Advantage – Medicare program that gives a person more choices among health plans. Everyone who has Medicare Parts A and B is eligible, except those who have End-Stage Renal Disease (unless certain exceptions apply). Medicare Advantage Plans used to be called Medicare + Choice Plans.
Medicare Economic Index (MEI) – index often used in the calculation of the increases in the prevailing charge levels that help to determine allowed charges for physician services. In 1992 and later, this index is considered in connection with the update factor for the physician fee schedule.
Medicare+Choice (M+C) – public or private entity organized and licensed by a State as a risk-bearing entity (with the exception of provider sponsored organization receiving waivers) that is certified by CMS as meeting the M+C contract requirements.
Medicare physician payment update process – annual revisions to the amounts physicians are reimbursed, based on a statutory formula. It utilizes a comparison between target spending for Medicare physicians´ services and actual spending.
Medicare Prescription Drug, Improvement, and Modernization Act (MMA) of 2003 –statute that updated, revised portions of the Medicare program, allowed for increased benefits, and provided seniors with prescription drug benefits and more choices in health care.
Medicare private fee-for-service (PFFS) – type of Medicare Advantage Plan in which a person may go to any Medicare-approved doctor or hospital that accepts the plan´s payment. The insurance plan, rather than the Medicare Program, decides how much it will pay and what the beneficiary pays for the services they get. The patient may pay more or less for Medicare-covered benefits and may receive extra benefits that the original Medicare plan doesn´t cover.
MedPAR – the Medicare Provider Analysis and Review file, a data file containing records for all Medicare beneficiaries who use hospital inpatient services. The records are stripped of most data elements that would permit identification of beneficiaries.
Meta-analysis, meta-evaluation – systematic analysis of a set of existing evaluations of similar programs in order to draw general conclusions, develop support for hypotheses, and/or produce an estimate of overall program effects.
MMA – see Medicare Prescription Drug, Improvement, and Modernization Act of 2003.
MMA benefit stabilization funds – a Medicare+Choice organization can request that an excess amount be withheld and reserved in a stabilization fund. This fund is used to stabilize and prevent undue fluctuations in additional benefits required.
National Health Plan Collaborative – in NIH, a project to bring together major health insurance companies, in partnership with organizations from the public and private sectors, to identify ways to improve the quality of health care for racially and ethnically diverse populations.
Needs assessment – study that measures the nature and extent of the need for a program, either before a new program is developed or during its lifetime.
NIH – National Institutes of Health.
Non-experimental design – only one group receiving the intervention is being observed or studied without the use of a comparison group to control for outside factors. Thus, such designs generally involve less data collection and are easier to plan and carry out. They typically involve observing and/or collecting all relevant data–including data on key performance measures–on participants at selected points in time during the project. Examples of such design include, but are not limited to, case studies, structured interviews, surveys, pre-/post-tests, ethnographic studies, and document reviews.
Objectives – these statements are derived from the program goals and explain how the program goals will be accomplished. Objectives are well-defined, specific, quantifiable statements of the program's desired results and they should include the target level of accomplishment, thereby further defining goals and providing the means to measure program performance.
Office of Child Support Enforcement (OCSE) – located within ACF; seeks child care payments due from absent parents.
Office of Minority Health (OMH) – located within OPHS, funds health care services and research relating to minorities.
Office of Inspector General – although many federal agencies have an Inspector General, when used in this report, the Office of Inspector General or the Inspector General always refers to the Inspector General of the United States Department of Health and Human Services. Inspectors General have a dual reporting responsibility – their reports are not cleared by the Department in which they work and through which they receive their funding and staffing. But, they submit their reports directly to Congress. This is different from all other components which must clear their work through senior departmental officers before being released to Congress or the public.
OPHS – Office of Public Health and Science.
OSCAR – Online Survey, Certification and Reporting data system, provides staffing data for all U.S. nursing homes that Medicare and/or Medicaid certifies. State survey and certification agencies collect the data, which are part of the annual nursing home certification and recertification process. Each facility completes a standardized form about the facility characteristics, e.g., number of beds, affiliation, etc., resident characteristics, e.g., limitations, chair bound, etc., and staffing levels. State surveyors review the form and enter the data into the OSCAR database. State surveyors also visit each facility and decide whether the facility meets each standard.
Outcome evaluation – used to obtain descriptive data on a program or project and to document (typically) short- and intermediate-term results. Task-focused results are those that describe the output of the activity. Shorter-term results describe the immediate effects of the project on the target audience. Information from such evaluation can show results such as knowledge and attitude changes, short-term or intermediate behavior shifts, and policies initiated or other institutional changes.
Outcome Measure – measure of an event, occurrence, condition, or result of a program or project that indicates achievement of objectives and goal(s); this type of measure is used to measure the success of a program, project, or system (e.g., the percentage of people who do not get influenza).
Output Measure – measure of a product, service, or result of a particular activity (e.g., number of people vaccinated with the influenza vaccine, number of personnel trained; number of phone calls processed by the OMH Resource Center); this type of measure provides information about the activity, not the success in achieving the objectives and goals of the program/project.
Part B – Medicare medical insurance that helps pay for doctors' services, outpatient hospital care, durable medical equipment, and some medical services that are not covered by Part A.
Performance measurement – process of designing and implementing quantitative and qualitative measures of program results, including outputs and outcomes.
Population – group of people that may or may not be from the same geographic area, who receive services from public sector or nonprofit organizations.
PPO – see Preferred Provider Organization.
Preferred Provider Organization – plan that (a) has a network of providers that have agreed to a contractually specified reimbursement for covered benefits with the organization offering the plan, (b) provides for reimbursement for all covered benefits regardless of whether the benefits are provided with the network of providers, and (c) is offered by an organization that is not licensed or organized under State law as an HMO.
Probabilistic analysis – a way to define statistical distributions for input parameters (e.g. joint orientation, shear strength, water level), to account for uncertainty in the values of input parameters. When the analysis is computed, this results in a safety factor distribution from which a probability of failure is calculated.
Process/implementation evaluation – examine the tasks and procedures involved in implementing a program or activities, including the administrative and organizational aspects of, and delivery procedures involved in, the efforts. Such evaluations enable monitoring to ensure feedback during the course of the program or project.
Process measure – measure of the procedures, tasks, or processes involved in implementing program or project activities to produce an output or outcome.
Program – group of individual (grantee) projects, unified by a set of goals, health issues of focus, recommended types of activities, eligible grant recipients, etc.
Project – an individual project (grantee), usually within an overall program, addressing one or more specific target populations or communities, and health issues.
Program components – major clusters of activities in a program that are intended to drive the process of producing outcomes.
Program effectiveness – extent to which the program achieves its intended outcomes.
Program evaluation – systematic process for gathering and interpreting information intended to answer questions about a program.
Program outcomes – what the program appears, through a process of measurement, to have achieved.
Public Health Service Commissioned Corps – see Commissioned Corps.
Public health surveillance – the ongoing, systematic collection, analysis, interpretation, and dissemination of data regarding a health-related event for use in public health action to reduce morbidity and mortality and to improve health.
QALY – see quality-adjusted life-years.
Quality-adjusted life-years – a way of measuring both the quality and the quantity of life lived, as a means of quantifying in benefit of a medical intervention. It is a method of estimating utility that assigns a preference weight to each health state, determines the time spent in each state, and estimates life expectancy as the sum of the products of each preference weight and the time spent in each state.
Quasi-experimental – research designs that do not involve random assignment to program and control groups but do include comparisons that make it easier to sort out the cause and effect linkages that are being tested.
Randomized controlled trials – see experimental design, randomized experiments.
Randomized experiments – research designs that involve randomly assigning units of analysis (usually people) to program and control groups.
Random sample – sample that is selected at random from the population, where each member of the population has an equal or known chance of being selected, which enables the research results to be generalized to the whole population.
Relevance – extent to which the objectives of the program are connected to the assessed needs.
Reliability – extent to which a measurement instrument produces consistent results over repeated applications.
Representative sample – when the characteristics of a sample (demographic characteristics, for example) match those same characteristics for the population, the sample is said to be representative.
Resource and Patient Management System – an integrated data system for management of clinical, business practice and administrative information in Indian Health Care facilities.
RPMS – see Resource and Patient Management System.
SAMHSA – Substance Abuse and Mental Health Services Administration.
SCHIP – State Children´s Health Insurance Program.
Social Indicator – a measure reflecting the status of the population (e.g., age range, income level, education attainment), and contextual influences (e.g., social, economic, ecological, and political influences) known to affect well-being at a particular time or over a period of time.
Social Security Administration (SSA) – Federal agency responsible for administering the Social Security program, which provides economic relief to citizens. The agency also plays important roles in public health, including disability determination and supporting electronic death registration systems.
Sonya Slifka Longitudinal Multiple Sclerosis Study – named for a woman with multiple sclerosis whose family is supporting the study. The study has followed over 2,000 people with MS for five years.
Stakeholders – all persons, agencies and organizations with an investment in the health and well-being of the community and the local public health and welfare systems.
Statistical significance – when the analysis of data results in statistical significance, it means that the result is not likely to have occurred by chance. It confirms a relationship or difference between variables.
Summative evaluation – look at a combination of measures and conclusions for larger patterns and trends in performance, to assess, in summary, whether the program or project overall did what it was designed to do. Summative evaluations are primarily retrospective, document evidence, and show results and achievement. Examples of summative evaluations include outcome and impact evaluations, cost-effectiveness and cost-benefit analyses, and meta-analyses. (see also Formative evaluation)
Sustainable Growth Rate (SGR) – system for establishing goals for the rate of growth in expenditures for physicians' services.
Treatment groups – persons who are provided with a program or some other intervention that is being evaluated.
Triangulation – process of collecting data to answer an evaluation question from a variety of sources and/or using a variety of measurement procedures.
Type 1 (or Type 2 or gestational) diabetes – see Diabetes.
Uniform Data Set (UDS) -- systematic data reporting system recently developed for all OMH-funded activities that organizes data collection and reporting by type of activity conducted. The UDS is an Internet-based system.
UAF – see Update Adjustment Factor.
Update Adjustment Factor – a payment revision method that includes the sustainable growth rate and squares up the actual Medicare expenditures with targeted Medicare expenditures for the year.
Utility – in economics, utility is a measure of the relative satisfaction from or desirability of consumption of goods.
Utilization – extent to which the program evaluation process and results (findings, conclusions, and recommendations) are deemed by stakeholders to be useful to them.
Validity – extent to which a measuring instrument measures what it is intended to measure.
Variable – an observable characteristic that we expect will be affected by one or more independent variables – in most evaluations, the observed outcomes are dependent variables.
Appendix E - guidance regarding online access to the full database of evaluations.
How To Obtain More Information
This report provides summaries of the most recent evaluations.Here are 5 ways you can get started if you want to obtain more information than provided here.
DIFFERENT WAYS TO OBTAIN MORE INFORMATION
Log into the Policy Information Center (PIC) Database and conduct a search. Users may retrieve, online, the over 8,000 additional summaries and links to full evaluations. This site is found at http://aspe.hhs.gov/pic/performance/. More information about this is provided below.
Call the Federal Contact identified for each entry in Chapter III. This individual may be the Project Officer responsible for the study or another individual from the office of agency that conducted the study who is responsible for making the report available or for assisting individuals seeking additional information.
Contact the Performer, identified for each entry, which did the work of the study in question. More than likely, they will have a web site. In some instances, they also post copies of their final reports on the study even when the PIC Database does not identify it as available. A caution: since we can only provide the name of the performer, this route may be problematic although prominent organizations have well designed and current web sites that can be a wealth of information.
Check the sponsoring agency´s web site, found in Appendix B; some agencies make all work they carry out available this way (for example the HHS Office of Inspector General routinely posts all their reports).
Search the full HHS web site, the main gateway to HHS online is http://www.hhs.gov/
SEARCHING THE PIC DATABASE
Option 1 – Clicking the link in this report on line. Each summary in Chapter III of this report for which there is an online report has a hot link you can select.
Option 2 – To see all the annual reports in this series, go to the PIC database, at http://aspe.hhs.gov/pic/performance/ and click "Performance Improvement Reports."
Option 3 – To search the PIC database, go to http://aspe.hhs.gov/pic/performance/ and click "Search Full Database." Here there are three ways to find contents:
- If you know the unique 4-digit number (the “PIC ID”), enter it in the second field on the search page and press Enter to retrieve the individual record.
- Conduct a Full-Text Search (described below).
- Conduct a Specialized Search (described below).
Contuct a Full-Text Search
Enter words or phrases you want to search into the first field on the Search age.
Searching the full text of the PIC database examines ALL fields for each entry, usually making it unnecessary to use specialized searches (described below).
As needed, use the following special terms:
| Term | Action | Examples |
|---|---|---|
| AND | The AND operator means both words must be present. Use it to combine two ideas which are both important. | tractors and safety violence and classroom alcohol and pregnancy |
| OR | The OR operator means either word can be present. Use it to include synonyms or alternate terms in your search. | adolescent or teenager female or woman sex or gender |
| NOT | The NOT operator means a word should not be present in the search results. Use it with caution since you can easily eliminate items you want. | television not cable cancer not mice crime not murder |
| Nesting | By combining operators you can fashion a search for a very specific topic. Usually this is done by nesting, e.g. placing certain terms in parentheses. | (hogs or pigs) and market (sex or gender) and pay (cancer and fat) not mice |
Also, the ASTERISK ( * ) may be used. It functions as a “wild card” (Example: “immuniz*” will retrieve both immunize and immunization).
Proximity Designators – Another option is to use the formula WORD<near/#>WORD. (Example: “child<near/5>welfare” retrieves summaries in which the words “child” and “welfare” appear within 5 words of each other).
After entering your search, click SEARCH immediately to the right of the text entry box.
Editorial note: the full text search capability, outlined above, is the most powerful of all the search strategies and is, generally, the approach recommended when seeking all the studies on a particular area of interest. Of course, it will always be necessary to experiment with terms to use to obtain the most and clearly relevant retrievals.
Conduct Specialized Searches
There are 5 fields allowing the user to conduct specialized searches:
- PIC ID (already described above)
- SEARCH DESCRIPTORS
- AGENCY
- PROJECT OFFICER
- CONTRACT PERFORMER
Both the PIC ID and the Search Descriptors of PIC database fields have dedicated SEARCH buttons. Only these buttons, next to the field, will result in a search of that field and that button can only be used for that one field:
1. PIC ID
If you know the unique number of the database item, enter its 4-digit number or number with suffix (e.g., 8546 or 8546.2) and click the SEARCH button to the right of the field.
This is the failsafe way to keep track of a particular record. Once a number is assigned, it is always the same, even when other records are deleted from the system.
2. Search Descriptors of PIC Database
- Highlight individual or groups of terms (“Control” and click allows you to select several individual terms; “Shift” and click allows you to select several contiguous terms)
- Click on the >> button between the boxes
- Highlight the descriptors in the right-hand box
- Click the SEARCH button that is immediately below the two boxes
Editorial note: contents of this field are selected by project officers; not all records for which the descriptors apply have been so labeled; there is no review or standardization by HHS about how the terms are used. A search using the whole text field will likely reveal more records in which the descriptors apply. On the other hand, some records, in which the specific term/descriptor is not used may still present information relevant to that policy area. You may wish to search separately using both descriptors and the whole text search features in order to assure the most inclusive record selection; this applies to the fields below as well.
3. The last set of 3 fields, described below, have a single SEARCH button serving them (at the bottom of the search page) and also a CLEAR button that serves only these last 3 fields. These fields can be searched individually or in combination with one another.
(1) In one or more of the three fields, highlight individual or groups of terms (“Control” and click allows you to select several individual terms; “Shift” and click allows you to select several contiguous terms).
(2) Click the SEARCH button that is immediately below the three boxes
These three fields contain an historical record of ALL the agencies, project officers, and contract performers who have EVER been associated with one or more records that were, or are, in the database even if they are no longer.
Editorial note: regarding search strategy, if for instance, you were interested in finding studies carried out by 5-6 different contract performers, you could either run separate searches or, if you wished a consolidated output, you could select and highlight all of the different performers. The search results would combine these into a single set. The downside is that they would not be grouped other than in the order the individual records are maintained in the database.
The search engine can search for groups of entities in more than one field simultaneously, for instance. The three areas that can be searched are:
- Agency – the Shift and Control features are particularly useful for this field where there are multiple entries for most agencies
- Project Officer – this field is valuable for an individual who wants to track or retrieve the final entries under their own, or a particular person’s name.
- Contract Performer – this field, especially in conjunction with the Shift and Control features, is also useful in locating studies by an entity or group of related (or unrelated!) entities.
Example of a search strategy
How to find and look at all the records for a particular agency:
- go to: http://aspe.hhs.gov/pic/performance/
- click on the Search Full Database tab
- after the full page loads, scroll down to the “Agency” field (4th one down)
- click into the box, type the first letter of the agency in which you are interested
- click on the first entry for a series of related agency listings so that it is highlighted
- leaving the first item highlighted, use the right hand scroll bar to move to the end of the related series
- holding the SHIFT key on your keyboard down, click on the last entry for the agency series --- at this point all the related agency items should be highlighted
- click outside the box
- scroll to the bottom of the page
- click SEARCH
Brief entries for the write ups for a group of agency entries are shown, about 15 to a page. The agencies included in the search are listed across the top of the screen so you can check to see that they were all included in the search. Click on the red bolded titles of each entry and see the full database entry. Entries for which the reports are online will also have hot links to these reports.
Appendix F - optional evaluation form users of this report are invited to fill out and return.
Readers’ Evaluation
Performance Improvement 2008 Report User Comments
No report on evaluation would be complete without inclusion of an opportunity for user evaluation and feedback. Since this annual mandatory report to Congress is an evolving product, we welcome your comments, suggestions, and requests for ways to improve it in the future.
- What is your organizational, work, or academic affiliation?
- Did this report meet your information needs regarding our evaluation activities? If not, what additional information would make this document more useful?
- Were the contents clear? If not, how were they unclear?
- Which sections did you find most helpful? How?
- Which were the least useful? Why?
- Have you used our online PIC database site?
- Was it helpful? Please describe.
- Do you wish to be contacted for a follow-up conversation about this feedback? If so, please provide name and contact information.
Please Email to:
Or mail to:
Policy Information Center
Room 404 E
200 Independence Avenue, SW
Washington, DC 20201
Credits
This report was prepared by the Office of the Assistant Secretary for Planning and Evaluation. Andy Rock, Project Director, managed the design, organization, editing, and final preparation; he may be reached at 202-401-8179, andy.rock@hhs.gov. To answer technical questions regarding specific studies, or to obtain copies of reports not available on the web call the Federal Contact listed for the study. Policy Information Center staff provided systems and technical support and assistance in the final preparation of the document. Graphic/photo images used in this report are in the domain of the Department of Health and Human Services or were provided by the Project Director.
The unsung heroes and heroines of the annual evaluation work of HHS are Project Officers, most of whom are named as the Federal Contacts for each study in Chapter III. They often have conceived the study need or framed the questions, crafted the scopes of work, overseen the studies, and drafted the summaries you see here. They, along with the diligent effort and creative thought of their legions of contracted colleagues (whose organizations are also named for each entry in this report), make these evaluations possible.
The last, and most important group who contribute to creating this report, are the Group Information Managers for each agency and office. These individuals, comprised of both project officers and agency evaluation leadership organize, coordinate, communicate, edit, and obtain agency clearance for this report. These individuals, who act as the primary agency/office contacts deserve mention:
Group Information Managers
- Administration for Children and Families – Carol Apelt, Stan Chappell, Linda Cloud, Julie Hocker, Karl Koerper, David Siegel, and Girley Wright
- Administration on Aging – Jennifer Klocinski
- Agency for Healthcare Research and Quality – Lucie Levine and Cynthia Boone
- Centers for Disease Control and Prevention – Julie Zajac
- Centers for Medicare and Medicaid Services – Brigid Goody, Melissa Hulbert, Pauline Karikari-Martin, Renee Mentnech, Mary Pratt, Joe Razes, Thomas Reilly, Effie Shockley
- Food and Drug Administration – Rose Johnson and John Uzzell
- Health Resources and Services Administration – Emily DeCoster
- Indian Health Service – Phil L. Smith and Lucie Vogel
- National Institutes of Health – Juliana Blome and Deshiree Belis
- Substance Abuse and Mental Health Services Administration – Nancy Brady, Jennifer Fiedelholtz and Dana Roberts
- Office of the Assistant Secretary for Health – Sarah Linde-Feucht, Mahak Nayyar and Valerie Welsh
- Office of the Assistant Secretary for Planning and Evaluation – Laura Chadwick, Scott Douglas, Laurie Feinberg, Susan Hauan, Ruth Katz, Martha Moorehouse, Canta Pian, Laura Radel, and Brenda Veazey
- Office of the Assistant Secretary for Preparedness and Response – Richard Morris
- Office of the Assistant Secretary for Resources and Technology – Marc Griego and Carmen-Rosa Torres
- Office of Inspector General – Sue Nonemaker and Stuart Wright
- Office of the National Coordinator for Health Information Technology – Mary Hollander
(Evaluation matters because) if things occur that we don´t know, it is almost as if they didn´t happen. Anonymous
To obtain this report online and search the entire database, go to: http://aspe.hhs.gov/pic/performance
http://www.oig.hhs.gov/organization/oigorgstatement070204.pdf.