
U.S. Department of Health and Human Services
A Study of Stroke Post-Acute Care Costs and Outcomes: Final Report
Andrew Kramer, MD, Danielle Holthaus, BS, Glenn Goodrish, MS and Anne Epstein, PhD
University of Colorado, Denver, Health Sciences Center
December 28, 2006
PDF Version (225 PDF pages)
This report was prepared under contracts #HHS-100-97-0013 and #HHS-100-00-0023 between the U.S. Department of Health and the University of Colorado. For additional information about this subject, you can visit the DALTCP home page at http://aspe.hhs.gov/_/office_specific/daltcp.cfm or contact the ASPE Project Officer, Susan Polniaszek, at HHS/ASPE/DALTCP, Room 424E, H.H. Humphrey Building, 200 Independence Avenue, S.W., Washington, D.C. 20201. Her e-mail address is: Susan.Polniaszek@hhs.gov..
The opinions and views expressed in this report are those of the authors. They do not necessarily reflect the views of the Department of Health and Human Services, the contractor or any other funding organization.
TABLE OF CONTENTS
A. Medicare Post-Acute Care Treatment Settings
B. Prospective Payment Systems for PAC
C. Substitution of PAC Settings
D. Outcome and Cost Differences Across PAC Settings
E. Need for Uniform Core Data Elements for Outcome Measurement Across PAC Settings
F. Study Aims
G. Reference List
2. METHODS
A. Design Overview
B. Data Sample
C. Data Sources
D. Measures
E. Reference List
A. Introduction
B. Methods
C. Activities of Daily Living
D. Self-Reported Instrumental Activities of Daily Living
E. Ambulation
F. Social/Role Function
G. Comparison of Functional Measures
H. Indices as Outcome Measures
I. Summary
J. Reference List
A. Introduction
B. Methods
C. Results
D. Discussion
E. Reference List
5. OUTCOMES AND COSTS OF POST-ACUTE CARE FOR STROKE PATIENTS
A. Introduction
B. Methods
C. Results
D. Discussion
E. Reference List
A. Introduction
B. Methods
C. Results
D. Discussion
E. Reference List
APPENDICES
APPENDIX A: SNF/IRF Patient Screening Form
APPENDIX B: Post-Acute Care Admission Interview and 90-Day Telephone Follow-Up Interview
APPENDIX C: Barthel Index Creation
LIST OF FIGURES
FIGURE 2.1: Sample Selection
FIGURE 3.1: Patients with Partial Functional Recovery by Domain
FIGURE 4.1: Patterns of Post-Acute Care for Stroke Victims Following Discharge from Acute Hospital and Admission to Inpatient Rehabilitation Facility
FIGURE 4.2: Patterns of Post-Acute Care for Stroke Victims Following Discharge From Acute Hospital and Admission to Nursing Home
FIGURE 4.3: Patterns of Post-Acute Care for Stroke Victims Following Discharge From Acute Hospital and Admission to Home Health
FIGURE 6.1: Discharge to Inpatient PAC Over Time
FIGURE 6.2: Discharge Destination by IRF PPS and Age
FIGURE 6.3: Length of Stay for Acute Hospital, IRF and SNF
FIGURE 6.4: IRF and SNF LOS over Time; Unit vs. Freestanding
LIST OF TABLES
TABLE 2.1: Characteristics of Participating Post-Acute Care Facilities
TABLE 2.2: Exclusions and Eligibility Criteria by Provider Type
TABLE 2.3: Characteristics of Participating Stroke Post-Acute Care Patients
TABLE 2.4: Outcome Measures
TABLE 2.5: Cost and Utilization Measures
TABLE 2.6: Covariates by PAC Setting
TABLE 3.1: Baseline Performance and Recovery in ADL Function
TABLE 3.2: Baseline Performance and Recovery in IADL Function
TABLE 3.3: Baseline Performance and Recovery in Ambulation
TABLE 3.4: Baseline Performance and Recovery in Social/Role Function
TABLE 3.5: Correlations in Recovery Between Indices
TABLE 3.6: ANOVA Comparisons of Index Outcomes
TABLE 4.1: Providers Used for Medicare Beneficiaries with Stroke within 90-Days of Hospital Discharge
TABLE 4.2: Characteristics of Stroke Patients Discharged Directly to IRFs, SNFs, and HH Agencies
TABLE 4.3: Characteristics of Stroke Patients Discharged Directly to IRFs by Subsequent PAC Setting
TABLE 4.4: Characteristics of Stroke Patients in IRF-SNF vs. Direct SNF Episodes
TABLE 5.1: Outcomes of Stroke Patients Discharged to IRFs, SNFs, and HH Agencies
TABLE 5.2: Costs of Stroke Patients Discharged Directly to IRFs, SNFs, and HH Agencies
TABLE 5.3: Outcomes of Stroke Patients Discharged to IRFs by Subsequent Provider
TABLE 5.4: Likelihood of Recovery in IADLs for Patients Admitted to Outpatient Following IRF
TABLE 5.5: Likelihood of Recovery in Ambulation for Patients Admitted to HH Following IRF
TABLE 5.6: Likelihood of Recovery in ADLs for Patients Admitted to Outpatient Following IRF
TABLE 5.7: Costs of Stroke Patients Discharged to IRFs by Subsequent PAC Setting
TABLE 5.8: Cost Difference for PAC Episode and 90 Days Between Patients Receiving HH vs. OP Care Following IRF
TABLE 5.9: Medicare Cost and Utilization Profiles in 90 Days for IRF-HH and IRF-OP Patients
TABLE 5.10: Outcomes of Stroke Patients in IRF-SNF vs. Direct SNF Episodes
TABLE 5.11: Costs of Stroke Patients in IRF-SNF vs. Direct SNF Episodes
TABLE 6.1: State Variation in Discharge Destination
TABLE 6.2: Discharge Distribution across SNFs and IRFs
TABLE 6.3: Number of SNFs and IRFs by Stroke Patient Volume in 1998 and 2004
TABLE 6.4: Logistic Regression of Likelihood of Going to IRF
TABLE 6.5: Logistic Regression of Likelihood of Going to SNF
TABLE C.1: Source of Barthel Index Components from the IRF-PAI Data
TABLE C.2: Source of Barthel Index Components from the MDS Data
TABLE C.3: Source of Barthel Index Components from the OASIS Data
EXECUTIVE SUMMARY
Post-acute care (PAC) refers to care received after an acute hospitalization, which is typically provided in skilled nursing facilities (SNFs), inpatient rehabilitation facilities (IRFs), home health (HH) agencies, and/or outpatient (OP) rehabilitation settings. In 2002, approximately one-third of Medicare beneficiaries discharged from hospitals utilized some form of PAC within one day of leaving the hospital. Although care received in different PAC settings varies to some extent, many experts believe that patients with similar care needs may be treated in different PAC settings and that the choice of discharge destination is often driven by factors other than patient characteristics (e.g., availability of beds, physician or family preference, practice patterns).
In an effort to contain rapid growth in Medicare PAC expenditures during the late 1980s to mid-1990s, Congress passed the Balanced Budget Act of 1997 that required the development and implementation of prospective payment systems (PPS) for all types of PAC. The PPSs have been phased in over the past eight years, beginning with SNFs in July 1998, followed by OP hospital care in August 2000, HH agencies in October 2000, and IRFs in January 2002.
This study, funded by the Office of the Assistant Secretary for Planning and Evaluation, had three primary aims, including:
1) To compare quality, outcomes, and costs of PAC episodes involving single and multiple-providers (e.g., IRF care followed by HH care, IRF care followed by OP care) provided to Medicare beneficiaries with stroke after PPS implementation.
Using stroke as a tracer condition, this study examined PAC outcomes and costs for single and multiple-provider episodes of care. Outcomes studied included return to community residence, functional outcomes (including activities of daily living (ADLs), instrumental activities of daily living (IADLs), social/role function, and function related to walking), self-reported health, and satisfaction. Costs included cost to the Medicare program and to beneficiaries. Few prior studies have examined outcomes and costs of multiple-provider episodes, particularly those involving OP rehabilitation care, and no major studies have been conducted subsequent to PPS implementation in all PAC settings. This study, therefore, represents a unique opportunity to explore these various facets of PAC during the post-PPS era.
2) To compare and contrast various quality of care and outcome measures that can be used across PAC settings.
This study explored whether a core set of measures can be identified that captures outcomes and quality of PAC episodes involving both single and multiple-providers. Given the current policy interest in uniform assessment for quality monitoring and comparing outcomes across settings, this research provides invaluable information in moving toward this goal.
3) To examine the effect of PPS implementation on patterns of PAC utilization (including IRF, SNF, and HH agency) for stroke patients.
This objective involved analysis of national claims data to complement the in-depth primary data analysis conducted for the first objective. Recent research on the use of IRF care before and after the implementation of the IRF PPS was conducted by RAND; however, this work was limited to only the early stages of the IRF PPS (the first year of IRF PPS implementation). No studies to date have assessed the effects of PPS in terms of PAC utilization and patterns of care following PPS implementation in all PAC settings. Given the financial incentives that exist under the different PPSs, PAC utilization patterns are likely to be altered, with the potential to influence cost and quality of care.
Methods
This study of PAC included a national sample of 88 PAC providers comprised of 35 IRFs, 33 SNFs, and 20 HH agencies in 20 states. Subject eligibility was limited to Medicare beneficiaries admitted to PAC from the hospital for an acute stroke, who were at least 65 years of age and enrolled in the Medicare fee-for-service program rather than managed care. Excluded were individuals who were comatose, those residing in a long-term care facility prior to this stroke, and those without a proxy if cognitively impaired or with severe speech/language impairment. The sample included a total of 674 subjects enrolled between late 2002 and early 2005: 555 whose first admission was to IRF, 62 whose first admission was to SNF, and 57 whose initial admission was to HH.
Patient characteristics analyzed in the study included demographics, and pre-stroke condition in available supports, function, and global health rating. Acute stroke characteristics included stroke characteristics and comorbidities. At the time of admission to PAC, the assessment included cognition, visual neglect, speech/language, function, and depression. Cognition and depression were assessed by direct interview with the patient (or proxy), whereas PAC admission function was obtained from the Minimum Data Set for SNFs, the Inpatient Rehabilitation Facility Patient Assessment Instrument for IRFs, and the Outcome and Assessment Information Set (OASIS) for HH agencies. In addition, a range of facility characteristics and community characteristics were collected.
Outcome and quality measures included: location at 90 days; functional recovery in four domains; recovery in self-rated overall health; and patient/proxy satisfaction. Location measures examined both nursing home vs. community residence and whether the 90-day residence was an equally independent living situation to the setting prior to the stroke. The functional recovery measures included the domains of ADLs, IADLs, ambulation, and social/role function. Function was assessed for multiple activities within each of these domains by an on-site data collector by interview for the baseline period prior to stroke, and by telephone for the 90-day follow-up.
Cost analyses included the costs to Medicare and to beneficiaries for all types of care. These costs were obtained from Part A and Part B claims data. Utilization data were obtained from Medicare claims for services covered by Medicare.
Results
Patterns of Post-Acute Care:
- Nearly 170 different PAC patterns were identified in 90 days.
- Volume of direct stroke admissions from the hospital for Medicare patients not enrolled in managed care decreased markedly in both SNFs and HH agencies from the period prior to PPS.
- Patterns were predominately multiple-provider episodes beginning with IRF. Length of initial IRF stays decreased by two days between 2003 and 2004.
- Sixty percent of IRF admissions used a second PAC provider and 30 percent used three or more in 90 days.
- About a third of direct admissions to SNFs used a second PAC provider after the SNF and 29 percent used three or more in 90 days.
- Only 20 percent of direct admissions to HH agencies used a subsequent PAC provider in 90 days.
Patient Characteristics:
- SNF patients were the most disabled prior to the stroke; most cognitively and physically impaired following their stroke; and had the greatest speech/language impairments and symptoms of depression after their stroke.
- On the other end of the spectrum, HH patients were more functional with less cognitive impairment than IRF patients, although they were more similar to IRF patients than SNF patients.
- Among patients admitted directly to IRF, IRF to SNF (IRF>SNF) patients had the greatest cognitive impairment, visual impairment, speech/language impairment, and functional impairment upon admission to PAC. Their characteristics were similar to the patients discharged directly from acute hospital to SNF.
- Patients admitted to HH from IRF were similar to patients admitted to OP from IRF with respect to pre-morbid status, cognition, and most functional measures following their stroke, but they had lower incomes.
Outcomes:
- Descriptive outcomes for all patients admitted to IRF, HH, or SNF followed the patterns one would expect based on patient characteristics: the best recovery of function occurred among HH patients, the worst recovery occurred among SNF patients, and IRF patients were in the middle. Due to the differentiation in patient characteristics based on initial provider setting, it was not feasible to equitably compare outcomes for all patients.
- IRF>SNF patients had comparable outcomes to patients discharged directly to SNF in 90-day residence and in functional recovery. Satisfaction appeared to differ between these two options, with greater satisfaction in terms of goals and progress in the IRF>SNF group, and greater satisfaction with discharge preparation and family preparation in the direct SNF group.
- Relative to patients discharged to HH following IRF, outcomes for patients admitted to OP care following IRF were comparable with respect to 90-day residence and significantly better in two dimensions of functional recovery, even after risk adjustment.
Costs and Service Utilization:
- Descriptive cost comparisons among direct discharges to IRF, SNF, and HH followed the patterns one would expect based on reimbursement systems. Costs of care for stroke patients discharged directly to IRFs were generally twice as high as cost for SNF patients in the PAC episode and eight times as high as costs for HH patients for PAC services during 90 days.
- Relative to direct discharges to SNF, PAC costs for IRF>SNF patients were three times higher, and 90-day costs for IRF>SNF patients were twice as high. Total PAC length of stay for the IRF>SNF group was about 73 days in contrast to 46 days for the SNF group.
- Relative to IRF>OP costs, total cost per PAC episode was $2,200 higher and total cost per 90 days was $5,200 higher for IRF>HH patients. Despite the lower costs, IRF>OP patients received about 40 therapy visits in contrast to 21 therapy visits for IRF>HH patients in PAC episodes with comparable duration. However, average PAC beneficiary costs were $400 higher for the IRF>OP group.
- The 90-day costs were also comparable between IRF>OP patients and IRF patients who were discharged to a residence because the latter group required more acute and additional PAC services after they were discharged to the community and the initial PAC episode was complete.
National Trends:
- Admissions of stroke patients to SNFs directly from hospital have been steadily declining since 1998, and admissions to IRFs and acute long-term care hospitals have been increasing.
- The number of high-volume SNFs and IRFs is declining, with patients more evenly distributed among providers.
- Even basic characteristics, such as age, differed significantly between SNF and all IRF patients. However, the 25 percent of IRF discharges who received care in SNF following IRF have characteristic similar to patients who went directly to SNF.
- Length of stay significantly declined in IRFs and also freestanding SNFs since PPS was implemented.
Measures:
- A core group of self/proxy-reported functional measures exist that address different dimensions of function and are useful for comparing outcomes across both single and multiple-provider episodes.
- These measures are hierarchical in terms of how stroke patients recover function.
- Location at 90 days and return to an equally independent setting were also valid global outcomes for PAC.
Policy Implications
Declining lengths of stay in the IRF setting and discharge to subsequent PAC providers, resulting in multiple-provider episodes, are natural consequences of the IRF per discharge PPS. That is, the incentive exists to admit patients to IRF, contain costs with a shorter stay in the IRF, and then discharge patients to a second type of PAC provider, which could be a SNF, HH agency, or OP care. This response is similar to declining acute hospital lengths of stay and the increased use of IRF, SNF, and HH care following the implementation of the per discharge acute hospital PPS. As per discharge payments for IRF care are readjusted based on length of stay trends, savings in IRF payments may help to offset the costs of the additional care in subsequent providers. However, the impact on quality of care, outcomes, and costs as a result of this discontinuity is important to monitor.
For the diagnosis of stroke, the increased use of IRFs and decline in use of SNFs immediately following the hospitalization suggests that IRFs have an increasing incentive to admit stroke patients under PPS, which may be accompanied by a decreased incentive in SNFs for admitting stroke patients. This could occur because payment rates for stroke patients in IRFs are among the most profitable based on the case mix groups and because other policies such as the 75 percent rule may encourage IRFs to admit patients with diagnoses such as stroke. SNFs may have difficulty covering the costs of the therapy services for stroke patients requiring substantial rehabilitation (which is the case for many stroke patients discharged directly from the hospital). Because the highest Resource Utilization Group rehabilitation category includes patients with 12 hours of therapy per week, and under PPS SNFs have no incentive to provide more than 12 hours of therapy per week, patients requiring more therapy are likely to be admitted to IRFs.
The HH PPS includes a substantial payment rate increase if ten therapy visits are provided; however, there is no payment incentive to admit patients who require any more than ten therapy visits. In combination, the PPS could result in greater differences in the patients admitted to each PAC provider from the hospital because of their need for and ability to tolerate therapy.
For the subgroup of stroke patients discharged to IRF and subsequently a SNF (about 25 percent of discharges to IRF from hospital), substitution with patients discharged directly to SNFs appears to exist. The major difference was that the IRF>SNF episodes were almost twice as likely in communities with high IRF use rates and occurred more frequently in urban areas, suggesting differences in practice patterns. Overall, 60 percent of these patients had cognitive impairment, 75 percent had significant functional impairment, and 25 percent met strict criteria for depression. Nevertheless, outcomes were comparable between the IRF>SNF group and those admitted directly to SNFs, whereas costs were 2-3 times higher for IRF>SNF patients. From a policy perspective, if these individuals can be identified upon acute hospital discharge, then direct discharge to SNF would be more cost-effective. One way to encourage more cost-effective care would be to pay IRFs at a reduced payment rate equivalent to the SNF level of care for IRF days in cases when the patient is ultimately discharged to a SNF. A similar policy is currently in place whereby Medicare pays IRFs a lower rate for patients with stays of less than four days. Under this scenario, even if patients were to receive a very brief trial of rehabilitation in an IRF, as soon as it is apparent they require longer term, less intense rehabilitation, they would be discharged to a SNF.
The cost-effectiveness of OP services subsequent to IRF care was very apparent in this study. Stroke patients who received OP care subsequent to an IRF stay had better outcomes, received more therapy visits, and at lower cost to Medicare relative to patients discharged to HH agencies subsequent to an IRF stay. The comparability between these HH patients and OP patients raises questions about why some patients are considered "homebound" and others are not. While most of the patients receiving more HH or OP care following IRF may meet the relatively loose definition of "homebound," OP services were more likely to be used by stroke patients with higher incomes. Not surprisingly, the IRF>OP pattern resulted in higher beneficiary costs because of the larger coinsurance. Reducing the cost to beneficiaries by reducing the OP coinsurance might increase the utilization of OP services relative to home care services following the IRF stay, which would be offset by fewer patients using higher cost HH services. Even if more patients in total were to use OP services (i.e., those previously discharged home with no further care), total cost would not be impacted for such patients due to the costs of Medicare services (increased hospitalizations and subsequent PAC services) that would have been needed by these patients if they had not received OP care. The difficulty in paying the coinsurance associated with OP service and the potential lack of reliable transportation may encourage people to use the more expensive HH care rather than OP services. From a policy perspective, we need to begin to recognize the important role of OP care in PAC used either immediately following the acute stay or subsequent to other PAC providers. It may offer the most cost-effective benefit for patients in many circumstances.
A uniform set of core measures is required to assess PAC outcomes for patients admitted to single or multiple PAC settings. The current setting-specific assessment tools cannot be used for this purpose because they use different elements, only some of which can be cross-walked, and have different follow-up intervals, making it impossible to compare change over fixed time periods. For outcome measurement, a baseline time point and a fixed follow-up point are required, regardless of the number of PAC providers that are utilized by a patient. An ideal baseline is pre-morbid function so that one can determine the extent to which prior function was recovered, and 90 days represents a follow-up point at which most PAC is completed. Functional measures across a range of domains, such as ADL, IADL, ambulation, and social/role function, are critical to assess because they are unique functional dimensions that recover at different rates. Changes in residence and global health ratings from baseline to 90 days are excellent general markers of rehabilitation success.
From this national study of PAC prospective payment between late 2002 and early 2005, we observed major changes in patterns of PAC utilization for stroke patients. Overall, providers were strongly responding to the PPS incentives. Substitution between patients directly discharged to SNFs and those discharged to SNF following IRF, and between patients discharged to OP following IRF and discharged to HH following IRF, showed that cost-effectiveness of PAC may be improved through changes in incentives. Continued collection of uniform outcome and cost data is essential if we intend to maximize opportunities for improving PAC provided to Medicare beneficiaries.
1. POST-ACUTE CARE POLICY ISSUES
A. MEDICARE POST-ACUTE CARE TREATMENT SETTINGS
Post-acute care (PAC) refers to care received after an acute hospitalization, which is typically provided in skilled nursing facilities (SNFs), inpatient rehabilitation facilities (IRFs), home health (HH) care, and/or outpatient (OP) rehabilitation care. SNFs are nursing homes that are certified by the Centers for Medicare & Medicaid Services (CMS) to provide Medicare-reimbursable skilled nursing services on an inpatient basis. They consist of both hospital-based and freestanding facilities, and nearly 80 percent of their Medicare admissions receive physical, occupational, and/or speech therapy.1 IRFs are hospitals that provide intensive inpatient rehabilitation care; they are required to have a certain proportion of their patients require intensive rehabilitation for one of 13 broad medical conditions, one of which is stroke. IRFs are also characterized by much greater physician presence, particularly from rehabilitation specialists. HH care is provided to Medicare beneficiaries who are homebound (unable to leave their residence without considerable and taxing effort) and require intermittent or part-time skilled nursing care and therapy services. Hospital OP rehabilitation care generally consists of therapy and physician services of physical medicine and rehabilitation services.
In 2002, approximately one-third of Medicare beneficiaries discharged from hospitals utilized some form of PAC within one day of leaving the hospital.2 Although care received in different PAC settings varies to some extent as described above, many experts believe that patients with similar care needs may be treated in different PAC settings and that the choice of discharge destination is often driven by factors other than patient characteristics (e.g., availability of beds, physician or family preference, practice patterns). This issue is further discussed in Section C.
B. PROSPECTIVE PAYMENT SYSTEMS FOR PAC
In an effort to contain the rapid growth in Medicare PAC expenditures during the late 1980s to mid 1990s, Congress passed the Balanced Budget Act of 1997 that required the development and implementation of prospective payment systems (PPSs) for all types of PAC. The PPSs have been phased in over the past seven years, beginning with SNFs in July 1998, followed by OP hospital care in August 2000, HH in October 2000, and IRFs in January 2002.
1. Reimbursement Under PPS
Under a PPS, instead of being tied to an individual providers cost of delivering services, fixed payments are established in advance of the service delivery and vary only by regional wage differences. This fixed payment is based on patient characteristics, called case mix, which determines the average resources required to meet the patients service needs. The case mix is determined by an assessment in each PAC setting. The payment algorithm and payment units for each PAC setting are different. The units of payment may be for the service, the day, an episode of care, or the entire stay. Brief descriptions of the PPS for each of the four PAC settings follow.
- SNF PPS: Under the PPS for SNFs, facilities are paid a predetermined rate for each day of care based on the patients service needs, including all nursing, therapy, and ancillary services. Patients are assigned to 44 groups, referred to as resource utilization groups, version III (RUG-III), which are intended to classify patients according to their needs for nursing and therapy care. Assessments at five, 14, 30, 60, and 90-day intervals are based on the Minimum Data Set (MDS) patient assessment (which is further described in Section E). Medicare payment rates for each of the groups consist of three components: (1) a fixed amount for routine administrative expenses; (2) a variable amount based on intensity of nursing care required; and (3) a variable amount based on intensity of therapy services required. CMS recently revised the RUG-III classification system, increasing the number of RUG groups from 44 to 53. For beneficiaries needing skilled care following a hospital stay of at least three days, Medicare covers a maximum of 100 days of SNF care per episode of illness. The first 20 days of care are covered at 100 percent, and for the 21st through 100th day, the beneficiary is responsible for coinsurance equal to one-eighth of the inpatient hospital deductible per day. In 2006, the SNF coinsurance rate was $119 per day.3
- IRF PPS: The IRF PPS pays facilities a predetermined rate per discharge for the entire stay based on the patients condition (diagnoses, functional and cognitive status, and age). Stays are categorized into one of 385 case mix groups (CMGs), which are derived based on information collected through the Inpatient Rehabilitation Facility Patient Assessment Instrument (IRF-PAI), which is described in more detail in Section E. Medicare coverage for IRF care is handled like other inpatient hospital stays in that Medicare beneficiaries are required to pay daily copayments that begin on the 61st day of the stay. They are not required to make copayments for the first 60 days after an inpatient hospital deductible that in 2006 was $952. The Medicare inpatient hospital benefit covers 90 days per episode, with a 60-day lifetime reserve (which the beneficiary may elect to use after the 90th day). The coinsurance for the 61st-90th day of care is a per day charge equal to one-fourth of the inpatient hospital deductible, and the coinsurance for 60 lifetime reserve days is equal to one-half of the inpatient hospital deductible. In 2006, the inpatient hospital coinsurance rate for days 61-90 was $238 per day, and for the lifetime reserve days, the coinsurance rate was $476 per day.3
- HH PPS: Several years prior to implementation of PPS in HH, an interim payment system (IPS) was established to constrain per visit Medicare payments until the HH PPS was implemented. The PPS for HH pays agencies a predetermined rate for each 60-day episode of HH care. The payment rates are determined by the patients condition and anticipated service use, based on the Outcome and Assessment Information Set (OASIS), which is further discussed in Section E. In instances when fewer than five HH visits are provided, agencies are paid on a per visit (rather than per episode) basis. Patients receiving five or more visits are allocated to one of 80 home health resource groups (HHRGs), which are determined by diagnosis, functional capacity, and service use information gathered through the OASIS. HH episodes that require at least ten therapy visits receive substantially higher payments than those not meeting the threshold. Medicare Beneficiaries are not required to make copayments or pay coinsurance for HH services.
- Hospital Outpatient PPS: The hospital OP PPS is established as a fee schedule that sets payment rates for individual services and procedures. Services and procedures are grouped into 570 ambulatory payment classifications (APCs). This PPS payment unit is based on services provided rather than patient case mix. As with the grouping systems under the previously described PPSs, however, each APC consists of services that are clinically similar and require comparable resources. Under Medicare, the coinsurance amount for OP care is determined by the APCs. Over the past several years, there has been substantial pressure to reduce coinsurance in the OP PPS to a target of 20 percent.4, 5, 6, 7 OP therapy services are excluded from the APCs and are covered by a fee schedule in which Medicare covers 80 percent and the beneficiary is responsible for 20 percent, which is paid out-of-pocket or from supplemental insurance. Therapy services require a physician order, a specific treatment plan, and must be provided by skilled, qualified providers. No limits exist for provision of therapy services in OP hospitals; however, an annual limit of $1,740 exists for combined OP physical therapy (PT) and speech therapy (ST) with a $1,740 limit for occupational therapy (OT) when services are provided outside a hospital in the year 2006 (certain exceptions to this policy are allowed). The caps on OP therapy services were originally implemented in 1999. However, moratoriums on enforcing the caps have delayed final implementation until 2006. The exception process to the caps allows Medicare beneficiaries meeting certain conditions to receive therapy above the caps.
2. Incentives and Preliminary Evidence of Changes Under PPS
Different types of payment systems (per discharge, per day, per episode, per service) create different financial incentives for the provision of care, often resulting in variation in practices and utilization across PAC settings.
SNF PPS: Under a per diem payment system, financial incentives exist to increase the number days over which service is provided. In their 2003 Medicare Data Book, the Medicare Payment Advisory Commission (MedPAC) indicated that the average length of stay in SNFs decreased by more than five days from 1996 to 1998 (prior to SNF PPS implementation), but progressively increased by approximately one day per year during the early years of the SNF PPS (between 1998 and 2001) -- providing initial evidence in support of the notion that the per diem SNF PPS provides an incentive for longer SNF stays.8
A study by Hutt et al. assessed the impact of the SNF PPS on the amount of therapy provided and community discharge rates in a six state demonstration of the SNF PPS in comparison to non-participating states.9 Under the SNF PPS demonstration, facilities were reimbursed using the RUG-III system, which assigns patients to one of seven hierarchies. The rehabilitation hierarchy, in which the payments are generally the highest, requires that patients receive therapy, and payments are determined by the quantity of therapy provided, the number of therapy specialties provided, and the patients functional status. Therefore, there is an incentive in the SNF PPS to provide therapy and to provide the amount of therapy that places patients in the most profitable groups. However, there is no incentive to provide more therapy than the minimum required to qualify for that payment group. Hutt and colleagues found that patients with the highest levels of function in participating sites received approximately 40 percent more therapy during the PPS demonstration than they had prior to the demonstration, while the volume of therapy received by similar patients in the non-participating sites remained constant. Interestingly, they found that the more intense levels of therapy in participating states were not associated with improved community discharge rates.
Further evidence of SNFs changing practices under the PPS was provided in an August 2002 Report to Congress by the General Accounting Office (GAO), which examined the mix of patients treated and Medicare services received across and within payment groups. The reports findings indicated that two years after implementation of the SNF PPS: (1) the mix of SNF patients across categories of payment groups had shifted; and (2) the majority of patients in rehabilitation groups received less therapy than in early 1999 (shortly after implementation of the SNF PPS).10
- IRF PPS: Per discharge payment systems (such as the one implemented under the IRF PPS) provide a fixed payment per patient discharge regardless of the patients length of stay. Therefore, under a per discharge payment system, it is in the providers best financial interest to discharge patients as quickly as possible, limiting the cost of services provided. Even prior to IRF PPS implementation Ottenbacher et al. found a significant decrease in IRF length of stay between 1994 and 2001 for patients within five impairment groups: stroke, brain dysfunction, spinal cord dysfunction, other neurologic conditions, and orthopedic conditions.11 Recent research by RAND Health examining the early stages of IRF PPS implementation found a decline in average IRF length of stay of 13 percent between 1999 and 2002, and 5.8 percent between 2001 to 2002.12, 13 This research also found that the rate of decline in length of stay varied across hospitals, with those with relatively long lengths of stay in 1999 having greater percentage declines between 1999 and 2002.
- HH PPS: Prior to implementation of the HH PPS, an IPS was implemented in HH agencies that applied reimbursement caps to the previously established fee-for-service (FFS) system. Unlike the HH PPS, the IPS did not include outlier payments for high cost patients, and incentives existed for HH agencies to admit patients needing fewer, less expensive visits.14 Research by McCall et al. examining Medicare HH utilization and spending before and after implementation of the IPS for HH revealed a dramatic decrease in use of HH services following IPS implementation (i.e., 55 percent and 52 percent drop in visits and payments, respectively).15 Overall, the proportion of beneficiaries using HH services following the IPS implementation dropped by more than one-fifth and many HH agencies closed their doors. The HH PPS replaced the IPS in October 2000. Given that the HH PPS pays a fixed rate per 60-day episode regardless of the number of visits (as long as the episode includes at least five visits), an incentive exists for providers to reduce the number of visits provided. However, the additional payment associated with HH episodes consisting of ten or more therapy visits provides a strong incentive for provision of ten and no more than ten therapy visits. According to the MedPAC, the average number of HH visits and minutes per episode and have decreased (by 47 percent and 37 percent, respectively) between 1997 and 2002, but the amount of therapy delivered as proportion of those visits has increased by 17 percent.2
Changing Patterns of Care and Use of Multiple-Provider Episodes: Due to the substantial changes in Medicare PAC reimbursement under PPS and the varying incentives under each system, interest has grown in whether PAC utilization patterns have changed subsequent to PPS implementation. A recent study by Direct Research LLC, which compared episodes of PAC use in 1996 (prior to implementation of any PAC PPS) and 2001 (after PPS implementation in SNFs and HH) found that the number episodes involving HH only decreased by 46 percent; whereas episodes involving only SNF care increased by 28 percent and those involving care by long-term care hospitals (LTCHs), IRFs, or psychiatric hospitals increased by 33 percent.16 Episodes consisting of SNF care followed by HH care decreased by 13 percent, and those involving other combinations of providers increased by 17 percent.
Another study by McCall et al. examined patterns of PAC utilization for Medicare beneficiaries with stroke, chronic obstructive pulmonary disease (COPD), heart failure, hip fracture, and diabetes during the period when the HH IPS was in effect and the SNF PPS was being instituted.17 They found substantial changes in patterns of PAC, with use of IRFs increasing and use of HH services falling as both an initial PAC setting and a subsequent setting following initial treatment in an institutional setting.
Earlier research by Liu et al. in 1999 revealed that prior to implementation of PAC PPS, 51 percent of PAC patients used HH care only, 26 percent used SNF care only, 4 percent used IRF care only, and 19 percent used more than one PAC setting.18 Now that PPS has been implemented in all PAC settings, further research is needed to examine the effects of these new systems on PAC utilization and patterns of care.
Given the varying incentives under the PPSs for different PAC settings, one might expect that the number of PAC episodes consisting of more than one provider would increase, especially when ownership or contractual relationships play a role (e.g., when an IRF, SNF, and/or HH agency fall under the same ownership, which is sometimes the case for hospital-based PAC facilities). Few studies to date have directly addressed this issue. The previously mentioned study by Direct Research LLC found a decrease in episodes involving SNF care followed by HH care, but an increase in other types of multiple-provider episodes.16 A study by Coleman et al., the goal of which was to describe patterns of post-hospital care transitions from 1997-1998, found 46 distinct types of care patterns during the 30 days following acute hospital discharge, 61 percent of which were limited to a single transfer, 18 percent of which involved two transfers, and 13 percent of which involved three or more transfers -- with an additional 8 percent that resulted in death.19 Concerns have been raised regarding the potential negative effects of poorly executed transitions between health care settings, with patient safety issues and medication errors of particular concern.20, 21 Further investigation is needed to determine the impacts of PAC PPS on the occurrence of multiple-provider episodes, as well as the outcomes associated with multiple care transitions within a PAC episode.
C. SUBSTITUTION OF PAC SETTINGS
Evidence suggested that prior to PPS at least some degree of overlap existed in the characteristics of patients treated across SNFs and IRFs, with controversy over the overlap between HH agency and institutional PAC. Work by Kramer et al. involving a database of 518 hip fracture patients and 485 stroke patients treated in SNFs or IRFs utilized propensity score methodology to predict placement into SNFs vs. IRFs by stratifying on the probability of assignment to one type of PAC setting.22 Kramer et al. found a number of overall differences between patients treated in IRFs and in SNFs; on average, IRF patients had more functional independence upon admission, better pre-morbid function, better cognitive function, and were more likely to have an able and willing caregiver than SNF patients. However, stratification for probability of SNF placement using propensity scores demonstrated that certain patient subgroups were treated in both settings, whereas other subgroups were treated predominately in one setting or the other. For example, hip fracture patients with caregivers and good physical and cognitive function were represented in both SNFs and IRFs, whereas hip fracture patients with no caregiver, and particularly those with cognitive impairment, were prevalent in SNFs and extremely rare in IRFs. Stroke patients who had no caregivers and lower cognitive function were found only in SNFs, whereas stroke patients who had caregivers and higher cognitive function were prevalent in both settings, although more so in IRFs. Both hip fracture and stroke patients in IRFs were more likely to participate in social and recreational activities than patients in SNFs. Through this stratification process, five variables were found to determine the strata for hip fracture: availability of a caregiver, cognition, participation in social and recreational activities, functional independence, and pre-morbid walking ability. Three of these variables -- availability of a caregiver, cognition, and participation in social and recreational activities -- determined the strata for stroke. Given the differences between the two settings, these covariates could be considered critical for inclusion in any model controlling for selection bias between SNFs and IRFs.
Research by Neu, Harrison, and Heilbrunn of RAND explored utilization rates across different health service market areas to determine whether market areas with unusually high utilization of one type of PAC setting demonstrate relatively low utilization of other types of PAC settings. These authors found some evidence for substitution between SNF and HH care, an effect that was more pronounced for certain diagnoses than for others.23 Less consistent evidence of substitution patterns was found through this research for care involving IRFs. Early work by Kramer et al. comparing nursing home and HH case mix found pronounced differences in functional and cognitive ability between Medicare patients treated in the two settings, with nursing home patients much more likely to be functionally dependent.24
In a later study of PAC utilization, Gage found that use of different PAC settings varies to a great extent by geographic region, and the potential for substitution among settings varies by diagnosis.25 Similarly, research by Bronskill et al. examined the extent to which factors beyond patient characteristics contribute to variation in post-acute service use in elderly Medicare patients with acute myocardial infarction.26 After controlling for patient and hospital characteristics, researchers found that for-profit ownership of the acute hospital and the provision of HH services through the acute hospital or a subsidiary significantly predicted the use of PAC services, suggesting that the organizational structure of hospitals can influence the patterns of PAC service use for clinically similar patients.
Kane et al. found substantial geographic variation in both the overall level of PAC use and the patterns of PAC, which the authors believe are likely to reflect differences in PAC availability and practice styles across regions.27 Similary, Lee, Huber, and Stason found wide geographic variation in the use of different PAC settings for stroke rehabilitation, indicating substantial variation in treatment practices and substitution between different PAC rehabilitation settings across different geographic regions.28 Research by Liu et al. found that SNF and HH care may substitute for one another under certain circumstances.29 Data sources included: the Medicare Current Beneficiary Survey, which contained data on patient characteristics; Medicare claims, which included data on SNF and HH service use; and data from various sources on market area characteristics. They found that older patients and those with a history of Alzheimers disease were more likely to use SNFs than HH, and that patients with emphysema were more likely to use HH than SNFs. They also found that patients with a second source of health insurance (Medicaid or supplemental insurance) were more likely to use SNFs than HH, and that use of SNF care increased as SNF and IRF bed availability increased.
Taken together, these findings suggest that factors other than patients clinical characteristics -- such as geographic location, acute hospital ownership type, PAC provision through the acute hospital, availability of PAC services, and insurance coverage -- often played a role in determining the setting in which PAC was provided prior to PPS. In the pre-PPS era there was evidence of substitution among IRFs and SNFs for some subgroups of patients, but controlling for the patient characteristics that differed across these settings (such as cognition, pre-morbid function, and social support) was critical in any comparisons. The overlap between HH and institutional PAC was less clear, and patient characteristics beyond diagnosis seemed to be strongly associated with placement. The extent of substitution in the post-PPS era remains to be seen.
D. OUTCOME AND COST DIFFERENCES ACROSS PAC SETTINGS
In recent years, studies have compared outcomes and costs of PAC services received in different settings. Among the outcomes most commonly examined are mortality, physical function, rehospitalization, and return to community. Because care for certain clinical conditions such as stroke, hip fracture, and joint replacements is frequently provided in various PAC settings, these conditions are most frequently examined in research comparing outcomes and costs across sites of PAC. These studies all attempt to take advantage of the natural variation that exists in PAC treatment settings; however, they all struggle with the challenge of selection bias by setting, which confounds the comparisons. Thus, the strength of the evidence generated by these studies should be considered in the context of the overall design, the covariates that are investigated, and the analysis methods. Furthermore, none of the work to date takes into consideration the multiple-providers that contribute to PAC outcomes; rather, they focus only on the initial treatment setting.
1. Stroke
A retrospective study of 331 patients from an IRF and 97 from a SNF by Keith et al. found that IRF treatment resulted in greater functional improvement and a somewhat higher likelihood of discharge to community than treatment in a SNF.30 However, the study had significant limitations in that 5 percent of the SNF group and 14 percent of the IRF group were admitted from a setting other than the hospital (including other PAC settings), SNF patients had 4.5 fewer days since their stroke upon admission to PAC, and the authors controlled only for demographic variables and amount of therapy in this comparison. Two measures of cost-effectiveness (charges per successful discharge to the community and charges per one-point gain in functional improvement on the Functional Independence Measure, or FIM) revealed SNF care to be a more cost-effective option than IRF care.
The aforementioned 1997 study by Kramer et al. in 92 sites found that stroke patients treated in IRFs had better outcomes at six months in terms of both community residence and function than those treated in SNFs, but at a much higher cost.22 This study used an extensive primary database including pre-stroke function, social situation, stroke severity, and even uniform readings of CT/MRI studies.
In a study of 487 stroke patients from three cities discharged to home without HH (n=160), HH (n=125), SNF (n=123) and IRF (n=79), Chen et al. found that stroke patients discharged to HH showed more improvement in activity of daily living (ADL) function than those discharged to IRF, SNF, or home without home care at six weeks, six months, and one year post-discharge.31 In addition, they found that patients discharged to IRFs demonstrated more functional improvement at these time points than patients discharged to SNFs. Data sources included patient and family interviews, hospital medical records, and Medicare billings. To adjust for selection bias across the various PAC settings, Chen et al. employed a two-stage instrumental variable estimation method. They also found that costs for patients receiving HH were considerably lower than those receiving care in an institutional setting (SNF or IRF).
A study by Kane et al. using the same data source found that stroke patients receiving PAC in SNFs had higher mortality rates at six weeks, six months, and one year than those in IRFs or HH, and that stroke patients discharged to HH had lower rehospitalization rates at one year than those discharged to SNFs or IRFs.32 Independent variables examined came from interviews, the Medicare Denominator File, and medical records; they included patient characteristics such as functional independence, living arrangements, cognitive status, and informal supports, as well as various case mix variables to adjust for stroke severity.
2. Hip Fracture
Over the years, studies of outcomes and costs for hip fracture patients treated in different PAC settings have yielded mixed results. The previously mentioned study by Kramer et al. found comparable outcomes in both SNFs and IRFs, with IRF care at a substantially higher cost.22 A study conducted by Deutsch et al. involving clinical data review of 29,793 Medicare FFS beneficiaries who received treatment for hip fracture in 1996 or 1997 found that SNF-based rehabilitation was a less costly alternative to IRF care, yielding similar or better improvement in motor functional status and community discharge outcomes in most areas assessed.33 This study examined a number of covariates including motor and cognitive function, time from fracture to PAC admission, type of hip fracture repair, pre-hospital living arrangements, and geographic location, but did not include caregiver support or participation in social or recreational activities. The potential for sample selection bias was examined using propensity scores.
Other research suggests that SNFs may not be the best setting for provision of PAC for hip fracture patients. Kane et al. found that hip fracture patients treated in HH or IRFs had significantly more functional improvement than those treated in SNFs at six weeks, six months, and one year.32 Independent variables examined included patient characteristics such as pre-morbid and PAC discharge functional independence, living arrangements, self-reported pre-morbid health status, cognitive status, and informal supports, as well as various case mix variables to adjust for stroke severity. However, pre-fracture walking ability and participation in activities, two covariates that Kramer et al. found to be critical, were not included.
In a study of 42 hip fracture patients admitted to IRF and 34 admitted to SNF from one hospital, Munin and colleagues found that hip fracture patients receiving IRF care were more likely to regain 95 percent of their pre-fracture function by 12 weeks post-hospital discharge than patients receiving SNF care.34 IRF patients were also more likely than SNF patients to be discharged home, and SNF patients were more likely than IRF patients to be discharged to a nursing home. Covariates examined included depression, cognition, medical complexity, pre-fracture motor function, delirium, participation during rehabilitation, and social support. This study suffered from serious risks of selection bias in that SNF patients were more cognitively impaired, had worse social supports, had worse function immediately post-fracture, and 12.5 percent were admitted from personal care homes in contrast to 5 percent of IRF patients. Whether there was actual overlap between groups is uncertain, and if there was overlap, the authors ability to adjust for selection differences with these small samples is doubtful.
3. Joint Replacement
In a large-scale comparison of Medicare spending and outcomes for all elderly beneficiaries who underwent hip or knee replacements (with no preceding hip fracture) and were discharged from an acute hospital between January 2002 and June 2003, Beeuwkes Buntin et al. found no differences in mortality between patients across different sites of PAC.35 However, using an instrumental variable approach they found that patients receiving care in IRFs and SNFs were more likely than HH patients to be institutionalized 120 days after their initial hospitalization. They also found that Medicare payments for PAC episodes in IRFs and SNFs were far higher than for those receiving HH care, with IRF payments being the highest of the three. Data sources included Medicare claims, MDS and IRF-PAI patient assessment data, cost report and provider of service (POS) data, and hospital discharge records. Independent variables assessed included such items as individual predictors (e.g., age, gender, race, place of residence), clinical predictors (comorbidities and complexities derived from hospital discharge records), discharging hospital characteristics (e.g., size, teaching status, ownership status, Medicare patient percentage), PAC availability (distance from patients home to the closest provider and number of PAC providers within a specified radius around the patients home), and functional status (using a measure similar to the Barthel Index derived from the MDS and IRF-PAI). Important covariates such as availability of a caregiver, cognition, participation in activities, and pre-morbid walking ability were not included.
E. NEED FOR UNIFORM CORE DATA ELEMENTS FOR OUTCOME MEASUREMENT ACROSS PAC SETTINGS
The Medicare, Medicaid, and State Childrens Health Insurance Program Benefits Improvement and Protection Act of 2000 mandated the Secretary of Health and Human Services to report, by January 1, 2005, on the development of health and functional assessments for various Medicare beneficiaries using PAC and other specified services. The legislation specified that information across providers be readily comparable and that only information necessary to meet program objectives be collected. The Secretary was also required to make recommendations regarding use of patient assessment instruments for payment purposes.
Currently, Medicare requires that patients be evaluated in three of the four PAC settings discussed in this chapter using different patient assessment instruments. The MDS is used in SNFs, the IRF-PAI is used in IRFs, and the OASIS is used in HH. Currently, no assessment instrument is required for patients receiving OP rehabilitation care. These assessment tools differ in terms of the elements they assess, their assessment periods, and their rating scales. A recent empirical comparison of the MDS, IRF-PAI, OASIS and the physical function scale of the Short-Form-36 (an assessment sometimes used with ambulatory care populations) revealed differences between and limitations within each of the instruments in terms of their content, breadth of coverage, and measurement precision.36 In addition, the tools were designed to achieve different objectives (e.g., care planning, quality measurement, outcome monitoring, and patient classification) -- differences that limit their comparability for measuring quality of care.
In their June 2005 Report to Congress, MedPAC recommended that data elements be identified for use by CMS in establishing payments and evaluation of patient outcomes across PAC settings, asserting that the data elements predict resource use; capture relevant clinical data; be reliable, valid, and well accepted; and minimize the burden to providers and CMS.2 The Institute of Medicine also recommends that the Federal Government accelerate, expand, and coordinate its use of standardized performance measurement and reporting to improve health care quality, and that current performance measurement mechanisms within and across government programs be replaced by standardized measurement and reporting mechanisms.37 In working toward these goals, it will be necessary to determine the core outcome measures that accurately and reliably measure quality of care and outcomes both within and across PAC settings.
Under the Deficit Reduction Act of 2005, Congress required that CMS explore costs and outcomes across different PAC settings and episodes. This demonstration will involve examination of the use of a comprehensive assessment tool at hospital discharge to determine appropriate PAC placement.
F. STUDY AIMS
This study has three primary aims:
1. Compare Quality, Outcomes, and Medicare Costs of PAC Episodes Involving Single and Multiple-Providers for Medicare Beneficiaries with Stroke after PPS Implementation
Using stroke as a tracer condition, this study examines PAC outcomes and costs for single and multiple-provider episodes of care lasting 90 days after discharge from the hospital. Outcomes studied include mortality, rehospitalization, return to community residence, and functional outcomes (including ADLs, instrumental activities of daily living (IADLs), social/role function, and function related to walking). Few prior studies have examined quality and outcomes of multiple-provider episodes, particularly those involving OP rehabilitation care, and none have done so subsequent to PPS implementation in all PAC settings. This study, therefore, represents a unique opportunity to explore these various facets of PAC during the post-PPS era.
2. Compare and Contrast Various Quality of Care and Outcome Measures that Can be Used Across PAC Settings
This study explores whether a core set of measures can be identified that captures outcomes and quality of PAC episodes involving both single and multiple-providers. Given the current policy interest in identifying a uniform assessment for quality monitoring and payment purposes, this research will provide invaluable information in moving toward this goal.
3. Examine the Effect of PPS Implementation on Patterns of PAC Utilization for Stroke Patients
As previously discussed, the implementation of four different PPSs for PAC services has recently occurred. No studies to date have assessed the effects of PPS on PAC utilization and patterns of care following PPS implementation using recent data. Given the financial incentives that exist under the different PPSs and the way providers respond to these incentives over time, the findings of this study on such issues should prove to be particularly policy relevant.
G. REFERENCE LIST
- DataPRO Team. Skilled nursing facilities prospective payment system quality medical review Data Analysis Pro: Final Report for CMS Contract 500-99-CO01, Attachment J-19. 2002.
- Medicare Payment Advisory Commission. Report to the Congress: issues in a modernized Medicare program. Chapter 5: Payment for post-acute care. 2005.
- Medicare Learning Network. Medlearn matters: information for Medicare providers. Update to Medicare deductible, coinsurance, and premium rates for 2006. MM4132. November 4, 2005. Centers for Medicare & Medicaid Services.
- Center for Medicare Education. Medicare Outpatient Prospective Payment System. Issue Brief 2003; 4(1).
- Centers for Medicare & Medicaid Services. Medicare announces payment rates and policy changes for hospital outpatient services in 2006. Beneficiary coinsurance rates continue to fall. Medicare News 2005.
- Medicare Payment Advisory Commission. Report to the Congress: Medicare payment policy. Chapter 9: Reducing beneficiary coinsurance under the hospital outpatient prospective payment system. 2001; 141-151. Washington, DC: MedPAC.
- MedPAC. Medicare basics: Outpatient therapy services. December 28, 2005. Washington, DC: MedPAC.
- Medicare Payment Advisory Commission. A data book: healthcare spending and the Medicare program. Section 8: Post-acute care. 2003.
- Hutt E, Ecord M, Eilersten TB, Frederickson E, Kowalsky JC, Kramer AM. Prospective payment for nursing homes increased therapy provision without improving community discharge rates. J Am Geriatr Soc 2001; 49: 1071-1079.
- General Accounting Office. Skilled nursing facilities: providers have responded to Medicare payment system by changing practices. GAO-02-841. 2002. Washington, DC.
- Ottenbacher KJ, Smith PM, Illig SB, Linn RT, Ostir GV, Granger CV. Trends in length of stay, living setting, functional outcome, and mortality following medical rehabilitation. JAMA 2004; 292(14): 1687-1695.
- Beeuwkes Buntin M, Carter GM, Hayden O, Hoverman C, Paddock SM, Wynn BO. Inpatient rehabilitation facility care use before and after implementation of the IRF prospective payment system. 2006. RAND Health.
- Paddock SM, Escarce JJ, Hayden O, Beeuwkes Buntin M. Changes in patient severity following implementation of the inpatient rehabilitation facility prospective payment system. 2006. RAND Health.
- Medicare Payment Advisory Commission. Report to the Congress: Medicare payment policy. Section 2D: Assessing payment adequacy and updating payments for home health services. 2003. Washington, DC: MedPAC.
- McCall N, Komisar HL, Petersons A, Moore S. Medicare home health before and after the BBA. Health Aff 2001; 20(3): 189-198.
- Medicare Payment Advisory Commission. Report to Congress: variation and innovation in Medicare. Chapter 5: Monitoring post-acute care. 2003.
- McCall N, Korb J, Petersons A, Moore S. Reforming Medicare payment: early effects of the 1997 balanced budget act on postacute care. Milbank Q 2003; 81(2): 277-303.
- Liu K, Gage B, Harvell J, Stevenson D, Brennan N. Medicares post-acute benefit: background, trends, and issues to be faced. For contract #HHS-100-97-0010. 1999. The Urban Institute [Available http://aspe.hhs.gov/daltcp/reports/mpacb.htm]
- Coleman EA, Min S, Chomiak A, Kramer AM. Posthospital care transitions: patterns, complications, and risk identification. Health Serv Res 2004; 39(5): 1449-1465.
- Coleman EA, Berenson RA. Lost in transition: challenges and opportunities for improving the quality of transitional care. Ann Intern Med 2004; 141(7): 533-536.
- Moore C, Wisnivesky J, Williams S, McGinn T. Medical errors related to discontinuity of care from an inpatient to an outpatient setting. J Gen Intern Med 2003; 18: 646-651.
- Kramer AM, Steiner JF, Schlenker RE, Eilertsen TB, Hrincevich CA, Tropea DA, et al. Outcomes and costs after hip fracture and stroke: a comparison of rehabilitation settings. JAMA 1997; 277(5): 396-404.
- Neu CR, Harrison SC, Heilbrunn JZ. Medicare patients and postacute care: who goes where? 1989; 1-83. Santa Monica, CA: The RAND Corporation.
- Kramer AM, Shaughnessy PW, Pettigrew ML. Cost-effectiveness implications based on a comparison of nursing home and home health case mix. Health Serv Res 1985; 20(4): 387-405.
- Gage B. Impact of the BBA on post-acute utilization. Health Care Fin Rev 1999; 20(4): 103.
- Bronskill SE, Normand ST, McNeil BJ. Post-acute service use following acute myocardial infarction in the elderly. Health Care Fin Rev 2002; 24(2): 77-93.
- Kane RL, Wen-Chieh L, Blewett LA. Geographic variation in the use of post-acute care. Health Serv Res 2002; 37(3): 667-682.
- Lee AJ, Huber JH, Stason WB. Poststroke rehabilitation in older Americans. The Medicare experience. Med Care 1996; 34(8): 811-825.
- Liu K, Wissoker D, Rimes C. Determinants and costs of post-acute care use of Medicare SNFs and HHAs. Inquiry 1998; 35(1): 49-61.
- Keith RA, Wilson DB, Gutierrez P. Acute and subacute rehabilitation for stroke: a comparison. Arch Phys Med Rehabil 1995; 76(6): 495-500.
- Chen Q, Kane RL, Finch MD. The cost-effectiveness of post-acute care for elderly Medicare Beneficiaries. Inquiry 2000; 37: 359-375.
- Kane RL, Chen Q, Finch M, Blewett L, Burns R, Moskowitz M. Functional outcomes of posthospital care for stroke and hip fracture patients under Medicare. J Am Geriatr Soc 1998; 46: 1525-1533.
- Deutsch A, Granger CV, Fiedler RC, DeJong G, Kane RL, Ottenbacher KJ, et al. Outcomes and reimbursement of inpatient rehabilitation facilities and subacute rehabilitation programs for Medicare beneficiaries with hip fracture. Med Care 2005; 43(9): 892-901.
- Munin MC, Seligman K, Dew MA, Quear T, Skidmore ER, Gruen G, et al. Effect of rehabilitation site on functional recovery after hip fracture. Arch Phys Med Rehabil 2005; 86: 367-372.
- Beeuwkes Buntin M, Deb P, Escarce J, Hoverman C, Paddock S, Sood N. Comparison of Medicare spending and outcomes for beneficiaries with lower extremity joint replacements. A study conducted by RAND Health for the Medicare Payment Advisory Commission. June 2005.
- Jette AM, Haley SM, Ni P. Comparison of functional status tools used in post-acute care. Health Care Fin Rev 2003; 24(3): 13-24.
- Institute of Medicine. Leadership by example: coordinating government roles in improving health care quality. 2005. National Academies Press.
2. METHODS
A. DESIGN OVERVIEW
MedPAC reported in 2005 that one-third of the Medicare beneficiaries discharged from the hospital used at least one day of PAC services. As described in Chapter 1, CMS has recently implemented PPSs for each of the PAC settings that are intended to curtail the rapid increase in the expenditures for PAC. While all PAC settings offer the rehabilitation needed by persons who have had a stroke, the assessment used, services provided, and incentives from the PPSs differ widely across PAC settings. To explore the role of various PAC settings for stroke patients, this study addressed the three primary objectives as described below.
- Compare Quality, Outcomes, and Medicare Costs of PAC Episodes Involving Single and Multiple-Providers for Medicare Beneficiaries with Stroke after PPS Implementation. The first step in this analysis was to describe the patterns of stroke care provided to elderly Medicare beneficiaries from admission to an IRF, SNF, or HH agency until 90 days after admission. The characteristics of patients admitted to each setting and to the major multiple-provider PAC episodes were then compared to determine the potential for substitution among providers. Further analyses were conducted that found similarities in characteristics between patients receiving care in IRFs followed by HH agency and IRFs followed by OP care, and between patients admitted directly to SNFs and those admitted to IRFs followed by SNFs. These similarities suggest possible substitution of PAC settings. Outcomes and costs of care were then compared for each of these pairs.
- Compare and Contrast Various Quality of Care and Outcome Measures that Can Be Used Across PAC Settings. Because of the lack of uniformity in assessment items and time periods across PAC instruments, we relied on a large-scale primary data collection effort to evaluate core measures. These core measures within 90 days of admission to PAC included: residence in the community; functional recovery in ADLs, IADLs, ambulation, and social/role function; global self-reported health; and satisfaction. We developed indices for the four functional domains and examined the likelihood of recovery in each. We used all of these measures in comparisons across episodes of PAC.
- Examine the Effect of PPS Implementation on Patterns of PAC Utilization for Stroke Patients. We examined the effect of PPS implementation on patterns of PAC utilization by studying the population of Medicare stroke patients from 1998 to 2004. Medicare Provider and Analysis Review (MedPAR) data provided records for every inpatient stay that were linked into 90-day episodes of PAC. We analyzed trends in various aspects of PAC utilization including: discharge destination, length of stay, and distribution of stroke patients among providers. Examination of geographic differences was also performed. Finally, regression models of the likelihood of selected discharge destinations reinforced the trends observed, using the limited case mix adjustment data available from the PAC data.
This chapter describes sampling methods for PAC settings and patients, data and data collection, and the analysis variables. Details on the statistical methods used to address the three objectives can be found in the relevant chapters to avoid confusion on the methods employed to address each objective.
B. DATA SAMPLE
1. Provider Selection and Recruitment
The study objectives relate to PAC for Medicare FFS beneficiaries who were hospitalized for a stroke and subsequently received PAC services in differing patterns of care. The primary settings of PAC reviewed for this study were IRFs, SNFs, and HH agencies. For the purposes of estimating the size of the universe of providers and patients for IRFs and HH agencies, we used 1999 Medicare Part A claims data files constructed by the Research Data Assistance Center. These files excluded providers with ten or fewer beneficiaries in order to preserve provider confidentiality. For SNFs, we used a more refined national claims-based file designed specifically for tracking SNF care (DataPRO) from which providers with ten or fewer stays were also excluded.1
The primary stratifier for sampling in this study was provider type. However, the number of providers for each provider type is unbalanced and the patient loads for patients with stroke differ among provider types. To maximize the similarities of selected subjects across provider types for comparison purposes, while assuring a representative mix of facilities within the operational and budgetary limitations of the project, we conducted a secondary explicit stratification on two other factors. First, providers were stratified on whether they were located in a community with low or high use of IRFs. For each community (defined as CMSA, MSA, or state-specific non-MSA), we estimated the ratio of IRF admissions relative to acute care hospitalizations for Medicare patients. This ratio was inversely related to the SNF admission/acute care hospital ratio (correlation -0.29; P<0.001). Stratifying on this ratio at 0.040 (4 percent of Medicare acute hospital stays admitted to IRF), approximately 62 percent of SNF patients and 29 percent of IRF patients were treated in low rehabilitation hospital use communities, whereas 38 percent of SNF patients and 71 percent of IRF patients were treated in high rehabilitation hospital use communities. By sampling in proportion to these two strata, more SNF patients were included from areas where fewer patients were admitted to IRFs and more IRF patients were enrolled from communities where fewer patients were admitted to SNFs. This stratification helped to ensure that both SNF and IRF patients were sampled from the same community, which improved the precision in the estimates.
A secondary explicit stratification was based on statewide availability of community-based services, which has a substantial influence on one of the primary outcomes for comparing the different modalities -- rate of community residence at 90 days after admission to PAC. States that were above the median on residential care beds per capita and below the median on nursing facility beds per capita were classified as high on community-based services and those with the inverse were classified as low. Thus, states that had high numbers of licensed assisted living facility beds and other types of residential care per capita and low numbers of nursing home beds per capita were high on community-based services. In the nine states that were either above or below the median for both of these criteria, the number of Medicaid recipients per thousand beneficiaries enrolled in a statewide home-based services waiver program was used to classify the state, recognizing that this was not a perfect classification method because these programs vary in their use and coverage across states. Facilities were then assigned a value of this stratifier based on the state in which they were located.
Only providers with a history of admitting at least 12 stroke patients per year were included in the study sample to reduce the project resources and burden that would be required to enroll facilities with a low volume of such Medicare admissions. Within each of the sampling cells, we initially selected the desired number of facilities using a probability-proportionate-to-size sampling technique so that larger facilities of the same type were given a higher probability of selection than the smaller ones of that type. A stratified sample of each type of facility (IRF, SNF, HH agency) was selected from the national census of Medicare facilities. Although this method resulted in a sample that was more likely to include large facilities, concerns about bias were tempered in that we did not believe that outcomes and quality would be tied systematically to facility size across facility types.
Each of the initial sampled facilities was contacted for enrollment in the study. Recruitment was performed through phone calls and written communication with facilities by research staff who continued to pursue each facility until a definite acceptance or refusal was proffered. Participating facilities were asked to complete a facility questionnaire to verify the address and contact information of the facility, as well as to obtain further information regarding the volume of Medicare stroke patients the facility admitted on a yearly basis and the names and telephone numbers of staff members who could serve as the facilitys data collector. We asked each facility to provide the contact information for at least one data collector. With the increased attention to protecting patient health information, many facilities required approval from internal Institutional Review Boards (IRBs). In those facilities, research staff proceeded to complete the requested forms in order to comply with the review process. With the need for IRB approval and the need to find and train data collectors who met the study standards, several months elapsed between initial contact and the first screened patient in some facilities. While an effort was made to enroll each of the facilities, there may be some non-response bias based on those not enrolled. However, we do not believe that responsiveness was tied to a facilitys predilection for secondary PAC, making it unlikely to create significant bias in our results.
A second stratified sample of IRFs and four additional stratified samples of SNFs were created using the methodology described above, as investigators determined a need to expand the number of enrolled facilities. Table 2.1 describes the facilities that participated in the study. A total of 88 facilities participated, comprised of 35 IRFs, 33 SNFs, and 20 HH agencies in 20 states. For the 12 SNFs that screened patients but did not enroll any subjects, participation lasted an average of 11 months. For the seven HH agencies that screened patients but did not enroll any subjects, participation lasted an average of 12 months.
| TABLE 2.1: Characteristics of Participating Post-Acute Care Facilities | |||
| IRF | SNF | HH Agency | |
| Participating Facilities | 35 | 33 | 20 |
| Facilities that Enrolled at Least One Subject | 35 | 21 | 13 |
| Medicare Admissions Mean (Std Deviation) | 652 (587) | 266 (167) | 2,291 (2,944) |
| Strokes Treated Prior Year Mean (Std Deviation) | 122 (121) | 18 (12) | 118 (196) |
| Ownership n (percent) | |||
| For-Profit | 5 (14%) | 11 (52%) | 2 (15%) |
| Non-Profit | 24 (69%) | 9 (43%) | 11 (85%) |
| Government | 6 (17%) | 1 (5%) | 0 (0%) |
| Total Enrolled Subjects | 555 | 62 | 57 |
| Subjects Per Facility Mean (Std Deviation) | 15.9 (14.4) | 3.0 (3.8) | 4.4 (4.6) |
| Range | 1 - 48 | 1 - 17 | 1 - 15 |
2. Subject Selection and Recruitment
Using a screening form, the on-site data collector reviewed records of all new stroke admissions to identify stroke patients who were eligible for the study. Subject eligibility was limited to Medicare beneficiaries admitted to PAC for an acute stroke (either first or recurrent), with the diagnoses based on ICD-9 codes (study codes and their descriptions can be found in Appendix A as part of the screening form that the data collectors filled out on each potential subject) and confirmed by chart review. Hospitalization for an acute stroke must have occurred within the 30 days prior to PAC admission without an intervening PAC episode. Subjects had to be at least 65 years of age and if cognitively impaired, or with severe speech and language impairment (for example, aphasia), must have had an able and willing caregiver/proxy available for interview. Because we targeted post-acute rehabilitation, we excluded individuals who were not able to receive therapy, were comatose, or resided in a long-term nursing facility prior to their acute stroke.
| FIGURE 2.1: Sample Selection |
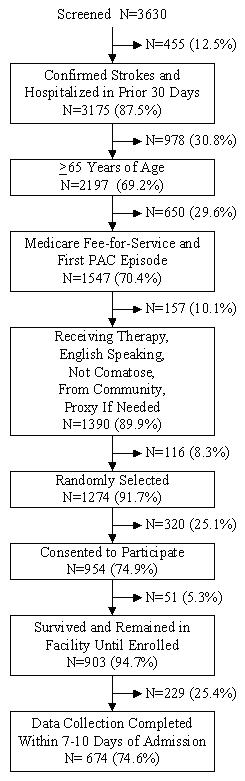 |
Figure 2.1 provides a breakdown of sample selection for screened patients at all PAC providers. Data collectors identified 3,630 hospital admissions for stroke admitted to a participating PAC provider. Confirming the diagnosis of stroke and admission to the PAC setting within 30 days of the hospitalization left a total of 3,175 cases to represent the population of stroke survivors in PAC settings of interest. Approximately 31 percent of confirmed stroke patients receiving care in the study facilities were under 65 years of age and were eliminated from the study. Our population of interest included only Medicare patients who were subject to PPS (non-HMO) for whom the study facility was the first PAC admission for that stroke, eliminating approximately 30 percent of elderly stroke patients. These patients were then subject to exclusionary criteria necessary to acquire accurate data for our study and to focus on rehabilitation care. The exclusionary criteria included: not receiving therapy, non-English speaking, comatose, nursing home resident prior to hospitalization, and no identifiable proxy. One-hundred fifty-seven (157) patients (10 percent) were excluded, leaving 1,390 eligible for our study.
| TABLE 2.2: Exclusions and Eligibility Criteria by Provider Type | ||||||
| IRF | SNF | HH agency | ||||
| n | % | n | % | n | % | |
| Confirmed Stroke Casesa | 2,335 | 73.5% | 377 | 11.9% | 463 | 14.6% |
| Exclusions:b | ||||||
| Age <65 | 814 | 34.9% | 61 | 16.2% | 103 | 22.2% |
| Prior PAC | 110 | 4.7% | 64 | 17.0% | 182 | 39.3% |
| HMO | 215 | 9.2% | 64 | 17.0% | 58 | 12.5% |
| Any of Above Exclusions | 1,128 | 48.3% | 183 | 48.5% | 317 | 68.5% |
| >65/FFS/First PACc | 1,207 | 100.0% | 194 | 100.0% | 146 | 100.0% |
| Eligibility Criteria:d | ||||||
| Receiving therapy | 2 | 0.2% | 14 | 7.2% | 10 | 6.8% |
| English speaking | 60 | 5.0% | 5 | 2.6% | 5 | 3.4% |
| Not Comatose | 4 | 0.3% | 9 | 4.6% | 0 | 0.0% |
| Not nursing home resident prior | 19 | 1.6% | 17 | 8.8% | 8 | 5.5% |
| Had a proxy (if needed) | 13 | 1.1% | 1 | 0.0% | 0 | 0.0% |
| Any of Above | 96 | 8.0% | 39 | 20.1% | 22 | 15.1% |
| Remaining Eligible Cases | 1,111 | 92.0% | 155 | 79.9% | 124 | 84.9% |
| Enrollede | 555 | 50.0% | 62 | 40.0% | 57 | 46.0% |
| ||||||
One-hundred sixteen (116) patients (8.3 percent) of the cases eligible for our study were randomly eliminated to moderate burden when too many patients were admitted in a single week. The remaining eligible patients were contacted by the data collector for recruitment into the study and to schedule an interview. Twenty-five percent (25 percent) of the approached patients refused, and of the remaining patients, 5.3 percent died or were discharged before data collection was conducted. Two-hundred twenty-nine (229) patients were not enrolled largely because the data collector could not complete the interview within the 7-10 day interval since admission due to issues with the data collector or patient schedule. The final sample for the study was 674 patients. Of these, claims data were matched for 642 patients, so analyses requiring claims data were on this slightly smaller sample.
Of the 3,175 cases with a confirmed stroke and hospitalized in 30 days, the majority were admitted to IRFs (74 percent), with the remainder split almost evenly between SNFs and HH agencies (Table 2.2). Despite attempts to enroll the highest volume SNFs and HH agencies into the study, the 33 SNFs admitted an average of 11.4 stroke patients (0.9 per screening month) during the study period and the 20 HH agencies admitted an average of 23.1 stroke patients (1.9 per screening month), in contrast to 66.7 stroke patients admitted per IRF for the 35 IRFs (4.9 per screening month).
| TABLE 2.3: Characteristics of Participating Stroke Post-Acute Care Patients | |
| Demographic | % (n) |
| Age | |
| 65 - 74 | 34.1% (230) |
| 75 - 84 | 46.6% (314) |
| 85+ | 19.3% (130) |
| Mean (Std Deviation) | 77.7% (7.1) |
| Female | 55.6% (375) |
| Marital Status | |
| Married | 46.7% (313) |
| Widowed | 43.2% (290) |
| Divorced | 7.0% (47) |
| Separated | 0.9% (6) |
| Never Married | 2.2% (15) |
| Race and Ethnicity | |
| American Indian | 1.0% (7) |
| Asian | 0.6% (4) |
| Black | 8.2% (55) |
| White | 86.7% (584) |
| Hispanic | 2.8% (19) |
| Other race | 0.7% (5) |
| Years of Education: Mean (Std Deviation) | 12.1 (3.3) |
The percent of total confirmed subjects who were excluded for age less than 65 years, received PAC services in a prior setting, or an HMO payer was highest in HH agencies (68.5 percent). The major reason for exclusion in HH was prior PAC (39 percent). Just less than half (48.5 percent) of SNF patients were excluded due to any of the three exclusion criteria. IRF patients were excluded largely due to age <65 (35 percent). The volume of stroke admissions, particularly FFS with no prior PAC stay, was so low that 12 of 33 SNFs and 7 of 20 HH agencies did not have a single patient who met these study criteria. This problem was compounded by the 20 percent of SNF patients and 15 percent of HH patients who were ineligible largely because they were not receiving therapy or had been residing in a nursing home. Thus, relatively few FFS Medicare stroke patients meeting study criteria were admitted directly from the hospital to participating SNFs and HH agencies.
Patient characteristics are described in Table 2.3. Participants were predominantly between 75-84 years of age, and roughly 56 percent were female. Most participants were married (47 percent) or widowed (43 percent), and the vast majority were White (87 percent).
C. DATA SOURCES
Data were acquired from three sources: (1) patient (or proxy) report from interviews conducted after PAC admission; (2) follow-up patient (or proxy) report from interviews conducted 90 days post-PAC admission; and (3) Medicare claims and electronic clinical data (i.e., MDS, OASIS or IRF-PAI) for the period from the index hospitalization to 90 days post-PAC admission for all study subjects. The 90-day time interval for follow-up was chosen because functional outcomes following stroke have largely peaked at 90 days, and because the intent of this study was to attribute differences in outcomes to the PAC episode. Longer periods of follow-up make attribution of outcomes to the PAC episode more difficult, and may overlap with subsequent PAC episodes because of the high rehospitalization rates associated with stroke.
Although similar in many respects, the admission and 90-day follow-up instruments were designed separately and for different purposes. The admission instrument was designed for administration within 7-10 days of PAC admission; it assessed baseline function (ADL, IADL, ambulation, and social/role function) during the week prior to hospitalization, as well as current mental health (depression and cognition). The follow-up instrument was designed for administration 90 days after PAC admission; it assessed the same functional measures, as well as residence, and some measures of satisfaction including satisfaction with care, adequacy of patient/family education, and degree of patient/family involvement in care. The admission and follow-up survey instruments are presented in Appendix B. Medicare secondary data used in the study included electronic clinical data from patient assessments completed in each of the PAC settings that report assessments of patient condition and Medicare data from both Part A and Part B claims. Each of these data sources is explained in greater detail below.
1. Admission Interview
- Data Collectors and Training: Admission interviews were conducted by facility data collectors who were skilled personnel consisting of licensed nurses, physical therapists, occupational therapists, or social workers. All on-site data collectors participated in a telephone training session prior to beginning data collection at their respective facilities. The training session covered the following areas: (1) study goals and objectives; (2) patient screening and sampling procedures; (3) study protocols and instruments; (4) protocols for locating and interviewing proxy respondents; (5) general interviewing techniques; and (6) safeguarding data and confidentiality guidelines. Prior to the training session, each data collector received a training manual, which included general information about the study and study objectives, all instruments and protocols, as well as training modules that highlighted the various phases of data collection: screening and sampling; initial patient contact; consent; and data collection. In addition to the formal training session, each data collector completed one or more mock interviews with research staff before performing his/her first interview for the study. All specific questions about the instruments or interpretations of responses were addressed by research staff via a series of memos, with copies sent to all data collectors to help ensure that they were able to apply the protocols and procedures uniformly.
- Administration: The admission interview was administered within 7-10 days of the study participants admission to PAC. Subjects were interviewed face-to-face, either in the PAC facility for inpatients, or at home for HH patients. Efforts were made to accommodate patient preferences as to time of interview. If, during the screening process, it was found that the patient had aphasia or severe dysarthria, data collectors located and contacted a proxy, advised him/her of the study, and asked him/her to participate in the study on the patients behalf. Additionally, proxies were used in cases where the patient was not able to understand or give consent -- either in the data collectors initial contact, or if the patients score was less than 17 on the Mini-Mental State Exam (MMSE)2 during the administration of the admission interview, indicating severe cognitive dysfunction that may have impaired a subjects capacity to consent to participate in the study. Further, if in the data collectors determination the patient appeared too fatigued, confused, or agitated to complete the interview, the data collector discontinued the interview with the patient and attempted to contact a proxy. Proxies were identified according to the following priorities: (1) legal guardian, if one was assigned; (2) close relative who lived with the patient, such as spouse, son, daughter, sister, brother, or significant other; (3) close friend/companion who lived with the patient; (4) close relative/friend who lived in the same area, and was in frequent (at least weekly) contact with the patient. In all cases, preference was given to individuals who were most familiar with the patients health and health care use. Overall, of the 674 study subjects, 463 were patient and 211 were proxy interviews. Completed interviews were submitted to research staff on a weekly basis.
- Data Review: For ongoing management, each on-site data collector was assigned to a supervisor who maintained weekly contact and reviewed all admission interviews received for consistency and accuracy, addressing any data quality concerns with the data collector in a timely fashion and asking for corrections or clarifications when needed. The supervisor was also available on a daily basis to respond to any questions or issues encountered by the data collector. Upon receipt, data collector supervisors reviewed hardcopy baseline instruments for completeness and to ensure that the interviewer instructions were correctly followed. If a critical item was missing, a call was made to the on-site data collector to retrieve the missing data and reinforce the need to provide complete information. Once the editing process was completed and callbacks were made to retrieve critical data items, the documents were entered by trained staff. Each document was data entered a second time to reduce the number of entry errors, and at completion of data entry the two databases were compared. Inconsistencies between the databases were minimal, and differences were subsequently reviewed and corrected.
2. Follow-Up Interview
Follow-Up Interview Administration: The follow-up interviews were conducted by research staff, which included a core of supervisors and interviewers experienced in interviewing the frail elderly. We used contact information provided by the subject for themselves and two other persons who would be likely to know the whereabouts of the subject. During the follow-up interview, responses were entered directly into a telephone interview database with forms designed uniquely for this study. Because our goal was to conduct the follow-up interviews approximately 90 days after PAC admission, interviewers made an initial attempt to contact each patient 80-85 days after his or her PAC admission, and completed the follow-up interview no later than 115 days after PAC admission. Interviewers accommodated subjects schedules as much as possible, completing interviews in the evenings or weekends when requested.
The interview began with a brief competency assessment comprised of a series of simple questions (name, address, reason for hospitalization). Based on the patients or proxys responses, telephone data collectors determined whether the patient/proxy understood the questions being asked of him/her. If, in the data collectors determination, the responses seemed incoherent or illogical, he or she discontinued the interview and asked to speak with a proxy (as defined by the priorities specified above). If at any time during the telephone interview, the respondent seemed too fatigued, confused, or agitated to complete the interview, data collectors either offered to schedule the remainder of the interview at another time (in cases of fatigue) or contacted a proxy to complete the remainder of the interview (in cases of confusion or agitation).
- Follow-Up Interview Response Rates: We were able to complete follow-up interviews with 87 percent of those subjects alive at 90 days. There were 39 subjects (5.8 percent) who died between admission and 90 days, 30 (4.4 percent) who could not be located, 39 (5.8 percent) who refused, eight who were unable to complete the interview (1.2 percent), and five (<1 percent) cases for which there was a data collector error. This left 553 cases for which a 90-day follow-up interview was conducted. Of these cases, 483 (87 percent) were conducted with the original respondent (70 or 13 percent were completed with a different respondent). Also, there were 318 cases that were conducted with the patient at both the baseline and 90-day period, 58 cases with patient at baseline and proxy at 90 days, four cases with proxy at baseline and patient at 90 days, and 173 cases with a proxy at both time points. For the 173 proxy-proxy combinations, 165 kept the same proxy across time points (eight changed).
- Data Review: The database was periodically reviewed for consistency, with unusual responses examined and corrections applied. Follow-up interview responses were also compared to baseline interview responses to flag subjects with unlikely recovery patterns, and responses were dropped when concerns about their accuracy arose. As an example, if a patient was unable to walk 20 feet before the stroke based on the admission interview, and then had no difficulty walking 20/50/300 feet at 90 days, this would be considered unlikely. For such cases, the suspicious items were set to missing for analysis purposes.
3. Medicare Secondary Data
We requested claims data and electronic clinical data (MDS, OASIS, and IRF-PAI) for all study subjects from the beginning of the data collection period to 90 days after the last subject was enrolled in the study. We also requested national MedPAR discharge data for the years 1998-2004 on all stroke discharges and POS files for PAC providers. These secondary data sources provided additional covariates, as well as outcome, cost, and utilization measures.
Electronic Clinical Data: These data sources include: the MDS for SNFs, the IRF-PAI for IRFs, and the OASIS for HH agencies. These data were used in three ways. First, they provided a uniform method for comparing characteristics at the time of PAC admission; obtaining such information from secondary data sources reduced the overall burden imposed on patients. Data corresponding to basic ADL function upon admission (or soon after admission) to PAC from these sources that were obtained using a cross-walk to the Barthel Index (discussed later in the chapter) were particularly useful. As previously mentioned, the admission interviews assessed baseline function during the week prior to hospitalization (before the stroke), but not upon admission to PAC. Second, the uniform information from these assessment instruments was used sparingly to risk adjust in comparing outcomes and costs between PAC episodes.
Third, these data allowed us to correct Medicare numbers for a number of patients for whom we were requesting Medicare claims data. When we first matched available assessment data to our data, it was determined that there were several leftover patients in the electronic clinical data for whom we did not have a match. By reviewing names and dates of birth, we were able to identify the correct person and obtain the correct Medicare number since all of these assessments require this information for the beneficiary. This improved our match rate to claims data, especially for cases in 2004. Our final match rate was excellent, with a loss of only 4.9 percent of IRF cases, 4.8 percent of SNF cases, and 3.5 percent of HH cases to missing claims data.
- Medicare Claims: Medicare Part A, hospital OP, and carrier claims data were analyzed to obtain information regarding the relative cost to Medicare for different types of PAC episodes. In addition, Medicare claims provided information regarding primary and comorbid diagnoses. Claims data also provided information on different PAC services provided and charges for different types of services. Medicare claims-based data included: acute hospital; PAC IRFs, SNFs, and HH agencies; all OP; physician; and other Part B data from the Carrier file. MedPAR data were used for national analysis of institutional PAC trends. The MedPAR file contains all Medicare discharges from inpatient hospitals (including rehabilitation hospitals) and SNFs. MedPAR represents all services rendered to a beneficiary from the time of admission to a facility through discharge, collapsing all claims for a stay into one record.
- Provider of Service (POS): Facility questionnaire responses were confirmed and additional provider-level covariates were extracted from the POS files for the PAC providers participating in the study.
D. MEASURES
1. Outcome and Quality Measures
The outcome and quality measures in this study were derived from a PAC quality measurement instrument developed under an earlier, related Office of the Assistant Secretary for Planning and Evaluation contract.3 Under that contract, investigators conducted an extensive review of the medical literature to generate a comprehensive list of potential quality indicators for stroke and three other prevalent PAC conditions. These lists of indicators were then reviewed by a panel of health care providers and researchers, experienced in PAC, who rated each indicator according to importance and feasibility for inclusion in a PAC quality assessment instrument for use in health services research. Based on these ratings, draft longitudinal quality measurement instruments were assembled, using validated measures wherever possible. These draft instruments were pilot tested on a local level for feasibility of administration and presented to a second panel comprised of content experts, methodologists, providers, and policy officials who commented on such issues as relevance and feasibility of administration, response burden, sampling issues, and redundancy with other requirements. Based on experience gained through the pilot testing and input from the second panel meeting, revisions were made to the instruments and a second wave of local pilot testing was conducted. The quality measurement instruments for the stroke condition were then adapted for use in the current study.
The process of developing these measures was guided by several principles. First, wherever possible, reliable and previously validated measures were included, particularly if they had been evaluated in older frailer patients and/or in PAC settings. Second, in developing the instruments, burden of data collection was minimized. When available, shorter versions of validated questionnaires were used; in some cases, when short forms of validated questionnaires were not available, the questionnaires were shortened for inclusion in the proposed instruments. Third, the measures included had to be applicable to PAC provided by all three provider types -- SNFs, IRFs, and HH agencies.
Measures included in this study fall within five dimensions, including: (1) residence location at 90 days; (2) functional loss; (3) functional recovery; (4) self-reported health recovery; and (5) patient/proxy satisfaction. Table 2.4 lists and defines each of the outcome measures that we compared across settings in latter chapters. All of these measures were based on primary data collected in the admission and 90-day interviews because this information is not available uniformly across PAC data systems. The development, refinement, and properties of these indices are reported in Chapter 3.
| TABLE 2.4: Outcome Measuresa | |
| Outcomes | Definition |
| Location | |
| Place of residence 90 days after PAC admission | Place of residence 90 days after PAC admission: Own home or apartment; home of relative or friend, or adult foster care; boarding home/assisted living residence; or nursing home. |
| Equally independent setting | Dichotomous variable indicating residence in an equally independent setting at 90 days and before the stroke. |
| Mortality | Deceased within 90-day PAC episode. |
| Functional Loss | |
| ADL functional loss (0-18) | Change between self-reported pre-stroke ADL difficulty (during the week prior to hospitalization) and ADL difficulty 90 days after PAC admission. Questions derived from the Longitudinal Study on Aging.6, 7, 10 |
| IADL functional loss (0-21) | Change between self-reported pre-stroke IADL difficulty (during the week prior to hospitalization) and IADL difficulty 90 days after PAC admission: no difficulty. Calculated as a summary score over six IADLs (shopping, managing money, using telephone, preparing/taking medicine, getting in/out of car, preparing meals, climbing stairs). |
| Ambulation functional loss (0-100) | Change between self-reported pre-stroke difficulty walking three distances (during the week prior to hospitalization) and difficulty walking 90 days after PAC. Calculated using revised Walking Impairment Questionnaire.11 |
| Social/role functional loss (6-24) | Change between self-reported pre-stroke social/role function (during week prior to hospitalization) and social/role function 90 days after PAC admission -- as assessed by revised Reintegration to Normal Living (RNL) Index.12, 13 Items relate to patient/proxys perceptions about: ambulation, community mobility recreational activities; work-related activities; social activities; and participation in family. |
| Functional Recovery | |
| ADL recovery (0-1) | "0" denotes 90-day ADL function is worse than baseline corresponding to pre-stroke function; "1" denotes 90-day function at least as good as baseline. |
| IADL recovery (0-1) | "0" denotes 90-day IADL function is worse than baseline corresponding to pre-stroke function; "1" denotes 90-day function at least as good as baseline. |
| Ambulation recovery (0-1) | "0" denotes 90-day ambulation function is worse than baseline corresponding to pre-stroke function; "1" denotes 90-day function at least as good as baseline. |
| Social/role recovery (0-1) | "0" denotes 90-day social/role function is worse than baseline corresponding to pre-stroke function; "1" denotes 90-day function at least as good as baseline. |
| Self-Reported Health Recovery | |
| Recovery in self-rated health (0-1) | "0" denotes 90-day self-reported patient/proxy rating of overall health is worse than pre-stroke (during week prior to hospitalization); "1" denotes patient/proxy rating of overall health 90 days after PAC admission is equal or better than baseline using five-point Likert scale. |
| Satisfaction | |
| Satisfaction with care | Patient/proxy self-reported satisfaction with care received from facility: four-point Likert scale. |
| Satisfaction with recovery | Overall patient/proxy self-reported satisfaction with recovery (over entire PAC episode): four-point Likert scale. |
| Goal attainment | Patients/proxys self-reported expectations for rehabilitation. Degree to which care met patients/proxys expectations: four-point Likert scale. |
| Patient/family participation in goal setting | Did patient/proxy participate in setting goals for rehabilitation. Was patient/proxy invited to participate in setting goals for rehabilitation. |
| Goal explanation | Patient/proxy rating of clarity of explanation of goals and likely progress of rehabilitation. Explained: very clearly; clearly; not very clearly; not at all clearly. |
| Instructions and training | Patient/proxy rating of instructions and training given by staff: excellent; good; fair; poor. |
| Preparation to care for self | How prepared to take care of self upon discharge: four-point Likert scale. |
| Preparation of family to care for patient | How prepared is family to help manage patients needs: four-point Likert scale. |
| |
With our population of prior community dwellers, location at 90 days was a fundamental marker for return to pre-stroke lifestyle and function. We show the patient's reported location at 90 days based on the follow-up interview. The Equally Independent Setting variable is based on the following hierarchy of living situations from most to least independent: 1-own home or apartment; 2-home of relative or friend, or adult foster care; 3-assisted living or board and care; and 4-nursing home. Using this hierarchy, a "0" denoted a change to a less independent setting, whereas "1" indicated an equally independent setting at 90 days relative to pre-stroke residence. Deaths and patients in the hospital at 90 days were excluded. Thus, 0 would denote a patient who went from living in his/her own home prior to his/her stroke to living with a family member at 90 days, and 1 would denote assisted living both before and after the stroke. Anyone residing in a nursing home at 90 days would be considered a "0," because all subjects were in one of the first three locations (i.e., not nursing home residents) before their strokes.
Functional loss and functional recovery are two different ways of measuring change in function. Functional loss measures the ordinal change between 90 days and pre-stroke function in each of four functional indices: ADLs, IADLs, ambulation ability, and social/role function. The indices were refined based upon analysis of study data. The development, refinement, and properties of these indices are reported in Chapter 3. The range of the index for each domain is included in Table 2.4 (higher represents more independence) and the outcome is the difference between the 90-day and pre-stroke values. Thus, a larger number represents greater loss in function. Recovery is a dichotomous measure where "0" denotes that the 90-day function is not as good as the pre-stroke function and "1" denotes that the values are at least equal. Thus, for each domain we calculate a rate or percentage of patients recovered to pre-stroke function. Self-reported health recovery is a measure of recovery in global health using a five-point Likert scale prior to stroke and 90 days post-stroke. A patient is recovered if the 90-day value is at least as good as baseline.
Satisfaction outcome measures fell into two categories. Most measures related to satisfaction with the health care received in the PAC setting, but one measure referred to satisfaction with overall recovery. All of these measures were rated as: 1-dissatified; 2-satisfied; 3-very satisfied; and 4-extremely satisfied. They were collected once at 90 days.
2. Cost and Utilization Measures
To compare the relative cost of Medicare PAC across settings, we used three types of cost measures: (1) total payments; (2) Medicare payments; and (3) beneficiary payments (Table 2.5). The beneficiary burden of payment (deductibles and coinsurance) varies among the settings, impacting PAC utilization patterns. We obtained Medicare payment estimates from the Medicare claims data. Claims data used in the study include the Medicare payment amounts and Medicare charges in total and for different categories of services. Medicare costs were assessed for PAC episodes involving all PAC providers utilized and for the 90-day interval.
PAC episode cost measures were defined differently from 90-day cost measures. Methodologically, costs were assigned to PAC if claims occurred during the PAC episode. The PAC episode was defined as care beginning with the first PAC provider until a break of 30 days in PAC services; or a discharge to residence without rehospitalization or death in three days; or death or hospitalization from a PAC setting; or 90 days. PAC costs were also restricted to costs incurred for IRF, SNF, HH, OP services, or Carrier costs (durable medical equipment (DME), physician supplier). Ninety-day costs included all claims in the 90-day period from admission to PAC, such as PAC costs plus hospital costs, physician services in the hospital or an office, laboratory, x-ray services, DME, etc.
Medicare costs were distinguished from beneficiary costs; total costs were the sum of these. Costs paid by the beneficiaries included deductibles and coinsurance based on the figure from the claims, recognizing that providers may not have been able to collect full payment from beneficiaries. Medicare costs were the Medicare payments from the claims. Per episode costs reflected the sum of all costs over the PAC episode or 90 days, while per-day costs were these costs divided by the PAC length of stay. The latter accounted for attrition due to death or discharge.
| TABLE 2.5: Cost and Utilization Measures | |
| Measures | Definition |
| Post-Acute Care Cost Measuresa | |
| PAC Episode: | |
| Total | Sum of IRF, SNF, HH, OP, and carrier costs (physician, lab, DME) incurred during the PAC episode. |
| Medicare | Medicare reimbursed component of total. |
| Beneficiary | Beneficiary payments portion. |
| Per Day: | |
| Total | Total PAC episode costs divided by length of PAC stay. |
| Medicare | Medicare PAC episode costs divided by length of PAC stay. |
| Beneficiary | Beneficiary PAC costs divided by length of PAC stay. |
| 90-Day Cost Measures | |
| 90-day Period: | |
| Total | Sum of all Medicare costs including IRF, SNF, HH, OP, carrier (physician, lab, DME) and hospital costs incurred during 90 days. |
| Medicare | Medicare reimbursed component of total. |
| Beneficiary | Beneficiary payments portion. |
| Per Day: | |
| Total | Total 90-day costs divided by 90 days. |
| Medicare | Medicare 90-day costs divided by 90 days. |
| Beneficiary | Beneficiary 90-day costs divided by 90 days. |
| Utilization Measuresb | |
| Length of Stay: | |
| Acute stroke hospitalization | Number of days between admission and discharge for prior acute stay. |
| Index PAC stay | Number of days from admission to PAC until discharge from initial PAC provider. |
| Total PAC stay | Number of days from admission to PAC until a lapse in PAC services of 30 days. |
| Number of Visits: | |
| HH visits | Number of HH visits for any service. |
| HH therapy visits | Number of PT, OT, or ST visits. |
| OP visits | Number of OP visits to any provider. |
| OP therapy visits | Number of PT, OT, or ST OP visits. |
| Hospitalization | Rehospitalized within 90 days. |
| |
Utilization measures included the length of stay for acute hospitalizations, the initial PAC episode (the first episode following the hospital), and the total PAC episode. The total PAC episode ended when a patient was discharged from PAC services for 30 days, died or was discharged to hospital from PAC, or was discharged from PAC to residence and was not rehospitalized or did not die within three days. The latter decision was made to eliminate unsuccessful PAC discharges that resulted either in rehospitalization or death immediately following the discharge, but to avoid requiring 30 days without PAC in cases where individuals returned to the hospital or died beyond the control of the PAC provider. For HH or OP, a 30-day window of no services was required to define the end of the PAC stay. Therefore, each patient was assigned a number of days in PAC based upon the last service date in the last claim of the episode. These calculations required extensive investigation of the claims for all Medicare covered services during the 90-day episode. For example, consider a patient admitted to the rehabilitation facility on August 25. After ten days, he was discharged home and received HH care for the next two weeks. Finally, he received OP rehabilitation services three times a week with the last service date of October 10, 2004. The number of days in his episode of care was 47. We artificially truncated episodes potentially longer than 90 days to 90 days due to data restrictions with our claims data.
At the end of the PAC stay, if the subject did not die or was not rehospitalized, he/she was considered in a residence. This residence was classified as: (1) nursing home; (2) assisted living, boarded care, and residential care; or (3) home alone or with others including senior housing. Information on residence was based on the 90-day interview with the assumption that the 90-day residence was a reasonable indication of residence at the end of the PAC stay. For a subject who was home at 90 days, it is reasonable to assume he/she went home directly from PAC, and for a subject who was in a nursing home at 90 days, it is also reasonable to assume he/she went to the nursing home from PAC -- especially since the interval between the end of the PAC stay and 90 days was often relatively short. Because claims do not contain this information, the 90-day interview was the best available source of data.
PAC length of stay was the number of days from the first PAC admission to the end of the episode, or 90 days for those patients whose episode did not end before 90 days. In some cases, there were gaps between PAC providers for which we needed to account. For example, a patient may have received PAC in an IRF, and then no care at all for a week and then OP care several times per week. In such a case, we did not count these interim days as part of the PAC length of stay but instead, counted only days for which there was claim activity. If the days occurred between visits to an OP or HH provider, however, they were counted as part of the PAC stay because intermittent visits are the nature of these modalities.
3. Covariates
In addition to the above outcome and utilization measures, measures from the interview survey instruments and secondary data sources were needed to compare patients across settings and adjust for case mix across PAC settings. Covariates were selected for inclusion based on previous research with similar populations,4, 5, 6, 7, 8 as well as feedback from clinical panels and the technical advisory group (TAG).a The patient-level covariates employed in this study are defined in Table 2.6, categorized by time of assessment including pre-stroke conditions; acute stroke care stay; and PAC admission. A fourth group included facility characteristics, and a fifth group included community characteristics. A few of these covariates requiring further clarification are discussed as well.
| TABLE 2.6: Covariates by PAC Setting (used to adjust for case mix) | |
| Covariate | Definition |
| Pre-Stroke Conditionsa | |
| Support available for tasks | Availability of someone who could help with tasks. If yes, ability to help for: as long as needed; only a short period. |
| Living alone/with others prior to stroke | If with others, specify: spouse/partner; daughter; son; sister/brother; other family/relatives; friends/neighbors; unrelated others, not friends or neighbors. |
| Smoking | Patient a smoker at time of stroke. |
| Age | Age of the patient at time of stroke. |
| Race | Self-reported race of patient. The patient may identify more than one racial category. |
| Gender | Patient gender. |
| Marital status | Was the patient married at the time of his or her stroke. |
| Education | Highest level of education attained by the patient. |
| Income | Household income from al sources before taxes. |
| Acute Stroke Care Stayb | |
| Selected comorbid conditions ICD-9 codes such as: | |
| Atrial fibrillation | Chronic or intermittent atrial fibrillation -- as indicated by acute hospital diagnoses ICD-9: 427.31. |
| Hypertension | Hypertension -- as indicated by acute hospital diagnoses. ICD-9: 40X.XX. |
| Prior stroke | Prior stroke reported on claims. |
| Congestive heart failure | Congestive heart failure -- as indicated by acute hospital diagnoses ICD-9: 428.XX or 398.91. |
| Diabetes mellitus | Diabetes mellitus -- as indicated by acute hospital diagnoses ICD-9: 250.XX. |
| Myocardial infarction | Myocardial infarction -- as indicated by acute hospital diagnoses ICD-9: 410.XX. |
| Chronic obstructive pulmonary disease | Chronic obstructive pulmonary disease - as indicated by acute hospital diagnoses ICD-9: 491.XX or 492.XXS. |
| Deyo Comorbidity Index14 | Comorbidity index based on the Charlson Comorbidity index adapted for use with administrative data. (See citation for detailed ICD-9 codes.) |
| Comorbidity Index15 | An administrative data comorbidity index adapted for exclusions of comorbidities in the presence of other conditions. (See citation for detailed ICD-9 codes.) |
| Stroke type | Ischemic/thrombotic/embolic vs. hemorrhagic vs. other. |
| Physical therapy indicator | Received PT during acute hospitalization. Defined by the presence of a PT cost center. |
| Speech therapy indicator | Received ST during the acute hospitalization. Defined by the presence of a ST cost center. |
| Occupational therapy indicator | Received OT during the acute hospitalization. Defined by the presence of an OT cost center. |
| Post-Acute Care Admission | |
| Visual neglect14 | Visual neglect such as hemianopia, hemianopsia, field loss, and discrimination. |
| Blindness14 | Blind. |
| Aphasia/Severe dysarthria14 | Diagnosis of aphasia or severe dysarthria. |
| Barthel Index (0-90) | Weighted functional index including eating, transferring, grooming, toileting, bathing, dressing, walking, bowel incontinence, and bladder incontinence. Mapped from the IRF-PAI, MDS, and OASIS (Appendix C).2 |
| Self-Care FIM (0-42) | Sum of IRF-PAI items grooming, eating, bathing, upper dressing, lower dressing, and toileting (all items 0-7). |
| Sphincter FIM (0-14) | Sum of IRF-PAI items bladder and bowel incontinence. |
| Communication FIM (0-14) | Sum of IRF-PAI items comprehension and expression. |
| Social Cognition FIM (0-21) | Sum of IRF-PAI items social interaction, problem solving, and memory. |
| Mobility/Transfer FIM (0-21) | Sum of IRF-PAI items bed/chair, toileting, and tub ambulation items. |
| Locomotion FIM (0-14) | Sum of IRF-PAI items walking and stairs. |
| Total Sum (0-126) | Sum of all listed FIM components above. |
| Depression assessed by the Geriatric Depression Scale (GDS) or Cornell Scale for Depression in Dementia (CSDD)a | The GDS is a self-report assessment of depression specifically developed for use in an older population.16 The GDS has been employed in prior studies of this population.5, 17 The CSDD was adapted from a clinician-administered instrument that uses information from interviews with the patient and a caregiver to a proxy report.18 |
| Mini Mental Status Exam (2) | Patient interview to measure cognition approximated by Cognitive Performance Scale when proxy required.19 |
| Facility Characteristics | |
| Stroke volumed | Number of Medicare stroke admissions; number of Medicare HMO stroke admissions. |
| Ownership statusf | Ownership type of facility -- investor owned/proprietary; government; religious not-for-profit; secular not-for-profit; other. |
| Freestanding vs. hospital-based statuse | Freestanding, hospital-based, or other. |
| Medical school affiliationd | Any affiliation with a medical or nursing school. |
| Chain membershipd | Chain is defined as a group of two or more health care facilities that are owned and/or controlled by a single individual or organization. |
| Community Characteristics | |
| Urban | Provider located in an urban area |
| High IRF use rate | Above national median in IRF use in 2001 |
| High community resources | State above median in residential care beds and below on nursing home beds. Number of enrollees in home-based waiver programs when above or below in both of above. |
| |
Despite the differences in the three PAC assessment instruments, we derived a comparable functional measure by mapping the items to a modified Barthel Index.9 The modified Barthel Index measured basic function through performance of nine ADLs. The original Barthel also included stairs, which was not available in our data. A detailed description of the data items used from each instrument and their cross-walks to the Barthel can be found in Appendix C.
Several other functional measures at the time of admission to PAC are the FIM subscales based on the IRF-PAI data. These scales address different components of function, many of which overlap with the Barthel. Because the necessary data are collected only in IRFs and there is no way to map other assessment instruments to these measures, they are used only in comparisons where the episode begins with an IRF admission.
Community characteristics included both urban/rural defined based on MSA, and two community related utilization characteristics that had served as sample stratifiers. The first utilization characteristic was the volume of inpatient rehabilitation care (number of admissions) provided in the community, with high rehabilitation communities defined as those above the median and low as those below the median. The second community variable was based on statewide availability of alternatives to nursing homes, specifically the number of licensed residential care beds (e.g., assisted living facilities) relative to nursing home beds. States above median on residential care and below median on nursing home beds were high resources, and states with the inverse were low. If a state was above median in residential care and also in nursing beds or below median on both, then the number of home and community-based services recipients was used to determine high or low. The rationale for using this stratifier was that states in which community resources were high relative to nursing home beds would be expected to use nursing homes less.
Covariates were compared among patients admitted to the three primary PAC discharge settings from the hospital and among patients receiving selected patterns of PAC. Variables that evidenced strong differences across settings were considered for inclusion as risk adjustment variables for outcomes and costs in multivariate models.
4. Data Editing and Transformations
For all variables, we examined frequency distributions to evaluate missing data as well as extremely rare or skewed responses. Selected consistency checks were conducted within cases, seeking atypical response patterns. Sites and variables with a high rate of missing data or atypical responses were thoroughly reviewed for data quality, and if necessary excluded from the analyses. Transformations of the raw data elements into the analysis measures were completed for all case mix, outcome, and cost variables.
E. REFERENCE LIST
- Data Analysis Peer Review Organization (DataPRO). National SNF file. Centers for Medicare & Medicaid Services, editor. 1999.
- Folstein MF, Folstein SE, McHugh PR. Mini-Mental State: a practical method for grading the cognitive state of patients for the clinician. J Psychiatr Res 1975; 12(3): 189-198.
- Johnson M, Holthaus D, Harvell J, Coleman E, Eilertsen T, Kramer AM. Medicare post-acute care: quality measurement final report. 2001. Denver, CO: Center on Aging Research Section, University of Colorado Health Sciences Center. [Available http://aspe.hhs.gov/daltcp/reports/mpacqm.htm]
- Coleman EA, Kramer AM, Kowalsky JC, Eckhoff D, Lin M, Hester EJ, et al. A comparison of functional outcomes after hip fracture in group/staff HMOs and fee-for-service systems. Eff Clin Pract 2000; 3(5): 1-11.
- Kramer AM, Steiner JF, Schlenker RE, Eilertsen TB, Hrincevich CA, Tropea DA, et al. Outcomes and costs after hip fracture and stroke: a comparison of rehabilitation settings. JAMA 1997; 277(5): 396-404.
- Wolinsky FD, Johnson RJ. The use of health services by older adults. J Gerontol B Psychol Sci Soc Sci 1991; 46(6): S345-S357.
- Wolinsky FD, Callahan CM, Fitzgerald JF, Johnson RJ. The risk of nursing home placement and subsequent death among older adults. J Am Geriatr Soc 1992; 47(4): S173-S182.
- Samsa GP, Bian J, Lipscomb J, Matchar DB. Epidemiology of recurrent cerebral infarction: a Medicare claims-based comparison of first and recurrent strokes on 2-year survival and cost. Stroke 1999; 30: 338-349.
- Mahoney FI, Barthel DW. Functional evaluation: the Barthel Index. Md State Med J 1965; 14: 61-65.
- Fitti JE, Kovar MG. The supplement on aging to the 1984 national health interview survey. U.S. Department of Health and Human Services, Publication #87-1323, 1987. Washington, DC: U.S. Government Printing Office.
- Regensteiner JG, Steiner JF, Panzer RJ, Hiatt WR. Evaluation of walking impairment by questionnaire in patients with peripheral arterial disease. J Vasc Med Biol 1990; 2(3): 142-152.
- Wood-Dauphinee S, Opzoomer A, Williams JI, Marchand B, Spitzer WO. Assessment of global function: the reintegration to normal living index. Arch Phys Med Rehabil 1998; 69: 583-590.
- Wood-Dauphinee S, Williams JI. Reintegration to normal living as a proxy to quality of life. J Chron Dis 1987; 40(6): 491-499.
- Deyo RA, Cherkin DC, Ciol MA. Adapting a clinical comorbidity index for use with ICD-9-CM administrative databases. J Clin Epidemiol 1992; 45(6): 613-619.
- Elixhauser A, Steiner C, Harris DR, Coffey RM. Comorbidity measures for use with administrative data. Med Care 1998; 36(1): 8-27.
- Yesavage JA, Brink TL, Rose TL, Lum O, Huang V, Adey M, et al. Development and validation of a geriatric depression screening scale: a preliminary report. J Psychiatr Res 1983; 17(1): 37-49.
- Lesher E, Berryhill J. Validation of the geriatric depression scale-short form among inpatients. J Clin Psychol 1994; 50: 256-260.
- Alexopoulos GS, Abrams RC, Young RC, Shamoian CA. Cornell scale for depression in dementia. Biol Psychiatry 1988; 23: 271-284.
- Morris JN, Fries BE, Mehr DR, Hawes C, Phillips C, Mor V, et al. MDS cognitive performance scale. J Gerontol A Bio Sci Med Sci 1994; 49(4): M174-M182.
NOTES
- The TAG was comprised of PAC research and policy experts who provided feedback regarding research design, sampling issues, and data collection methods for the proposed project. Members of the TAG were consulted on an ongoing basis to provide overall guidance and direction for the project.
3. FUNCTIONAL MEASURES
A. INTRODUCTION
The clinical manifestations of stroke are varied and often result in one or more disabilities, defined as an inability or a restriction on performing an activity within normal ranges. Disabilities can occur in mobility, self-care, or the ability to manage higher levels of activities such as managing finances or medications, shopping, or driving. PAC rehabilitation services, including PT and OT, and speech, language pathology, seek to achieve the highest possible level of functional independence for patients through training, exercise, and physical manipulation. Patients may need to relearn simple motor activities such as walking, sitting, or standing as well as more complex skills. Rehabilitation may retrain the body to coordinate movements or may teach stroke survivors new ways of performing activities to compensate for residual disabilities.
For patients living in the community prior to their strokes, persistent functional disabilities may represent a barrier to returning to their former level of independence and may decrease their quality of life. As such, functional measures are frequently used as outcome measures in stroke recovery during the period following a stroke. Various functional measurement batteries exist that categorize function in different ways, yielding different indices.1, 2, 3 The most traditional approach for classifying physical functions in older and chronically ill patients is to delineate basic ADLs, which pertain to fundamental self-care, and IADLs, which involve more complex functions that require a higher level of motor function than is needed for ADL function. IADLs are typically necessary for independent living within the community but are not necessarily performed on a daily basis.
The composition of ADL and IADL indices -- as well as the distinction between the two constructs -- varies to some extent in the literature. For example, the Katz ADL Index4 includes six basic functions -- bathing, dressing, toileting, transfer, continence, and feeding; whereas the Barthel Index5 includes the six Katz Index items plus grooming, walking, ascending/descending stairs, and bowel continence. Lawton and Brodys Physical Self-Maintenance Scale6 includes IADL items related to using the telephone, shopping, preparing food, housekeeping, laundry, transportation, taking medication, and handling finances, while other IADL indices also include more socially-focused activities (e.g., playing games, keeping track of current events, and remembering appointments).7 Some ADL and IADL indices include items related to ambulation and walking,5, 8 while other measurement instruments, such as the Walking Impairment Questionnaire,9 assess walking independently of other functions.
Our study goals as discussed in Chapter 1 included the need to identify core measures for accurate comparison across settings. To this end, we addressed the issue of necessary domains of function for measuring stroke recovery. Based on input from expert panels (discussed in Chapter 2) and literature review, we determined that four domains of function were essential to measure in order to assess outcomes of stroke care. These four domains are ADLs, IADLs, social/role function, and ambulation. In subsequent sections of this chapter, we provide the overall methods for developing indices in each of these areas, and discuss the specific index that was developed for each domain. We also run comparisons of outcomes among the indices, noting whether they possess similar or dissimilar patterns in recovery. Variation in recovery suggests the need for all of the domains to be included when comparing outcomes across PAC settings, as opposed to the most commonly used ADL functions.
B. METHODS
1. Data
To measure functional items, data were collected at baseline, upon or soon after admission to PAC, and at 90 days after PAC admission for a range of functions covering all four domains. The data were self-reported by patients or proxies because self-reported information that is truly patient-centered is gaining acceptance as the preferred type of information on which to base quality and outcome assessments.1, 3, 10, 11, 12, 13 The structure of the questions was adapted from the Longitudinal Study on Aging.14 The following two-stage question was used for each function. (The item related to dressing from the PAC admission interview is given as an example.)
1a. During the week before you went to the hospital, did you have any difficulty completely dressing by yourself because of a health or physical problem?
YESNODID NOT COMPLETELY DRESS FOR REASON OTHER THAN HEALTH/PHYSICAL PROBLEMUNKNOWN
1b. Was this some difficulty, a lot of difficulty, or were you unable to do this?
SOME DIFFICULTYA LOT OF DIFFICULTYUNABLEUNKNOWN
This type of question is easy for respondents to follow both in person and over the telephone. Data at baseline pertained to the period prior to the stroke so that we could measure recovery to prior functional state.
2. Index Creation
In each domain, we created a single measure of function that consolidated disability levels from multiple functions within the domain. We had three goals in constructing indices in the domains: (1) to create indices that were sensitive to clinical differences in recovery status; (2) to retain the most complete level of information from the study instrument; and (3) to create indices that meaningfully measured different components of stroke recovery.
Before collapsing the individual activities into indices, we computed simple means and correlations to identify potential functions that were outliers in each domain (i.e., any function that did not appear to follow the same baseline or recovery patterns or were not at all correlated with other functions in the domains). After dropping outlier functions, each function was converted into a four-point scale that incorporated the presence and level of disability. Combining the scales into indices retained the detailed information from each function into the final measure. As metrics, indices produced greater sensitivity and reduced the natural skew of the underlying individual recovery distributions. Finally, the constructed indices were compared to each other to determine if they provided statistically different measures of recovery and whether they generated patterns of recovery in our study subjects. An illustrative example of the mechanics of the index creation process is described under Section C.1.
C. ACTIVITIES OF DAILY LIVING
Selection of ADL measures for this study was guided by several criteria, including: the need for adaptation for use in person or by telephone; prior use with post-acute populations; and most importantly, relevance of question content. For the period prior to the stroke and at 90 days, patients or their proxies were asked to report level of difficulty in performing seven ADLs (bathing, dressing, grooming, eating, bed/chair transfer, toileting, and controlling bladder) using the question structure previously described. These responses were converted into the following score: 3-no difficulty, 2-some difficulty, 1-a lot of difficulty, and 0-unable. Thus, higher levels on the scores represented greater independence. To create an index measure of overall functional recovery in the basic ADLs, we examined the correlations among recovery measures for each of the seven functions. Recovery was defined as a 90-day level of disability equal to or better than the level of disability prior to stroke. For example, a patient who had "some difficulty" eating prior to stroke was recovered in eating at 90 days if he/she had either "some difficulty" or "no difficulty." The ADL functions were reasonably correlated in all cases, with the exception of bladder control. Further investigation noted that the bladder control function could have been capturing recovery due to the presence of a catheter rather than through improvement in bladder control; therefore, this function was dropped from our ADL index.
Summing the scores of each activity created an ADL index with a range from 0 to 18, with higher scores indicating a greater level of function. We dealt with missing items by dropping them from the index for a particular patient and rescaling the score to the 18-point index. Patients missing more than one-half of the activities were deemed to have too little information to create an adequate measure of function and their ADL indices were assigned to missing.
2. Self-Reported Baseline and Recovery in ADL Functions
Means and standard deviations of the pre-stroke and 90-day scores for each of the six ADLs included in the index are presented in Table 3.1 along with two outcome indicators: (1) the difference between the 90-day score and the pre-stroke score, measuring residual impairment; and (2) percentage of patients achieving recovery to pre-stroke function. Most patients were functionally independent in each of the individual ADLs pre-stroke, ranging from 81.4 percent who were able to transfer in and out of chairs and bed with no difficulty to 96.1 percent who were able to eat with no difficulty. Consistent with our subject population of community dwelling stroke patients, over two-thirds (70.9 percent) of subjects were functionally independent in all of the ADLs prior to having a stroke.
| TABLE 3.1: Baseline Performance and Recovery in ADL Function | ||||||||
| Pre-Stroke Percentwith No Difficulty | Pre-Stroke Mean | STD | Post-Stroke Mean | STD | Residual Impairment*** | STD | Percent RecoveredPre-Stroke Function | |
| Dressing* | 96% | 2.83 | 0.50 | 2.24 | 1.07 | 0.60 | 1.07 | 63% |
| Bathing* | 83% | 2.77 | 0.61 | 2.05 | 1.18 | 0.72 | 1.20 | 57% |
| Grooming* | 90% | 2.88 | 0.43 | 2.51 | 0.91 | 0.37 | 0.91 | 74% |
| Eating* | 96% | 2.96 | 0.22 | 2.83 | 0.51 | 0.13 | 0.55 | 88% |
| Transfer* | 81% | 2.79 | 0.51 | 2.32 | 0.98 | 0.46 | 1.02 | 66% |
| Toilet* | 90% | 2.88 | 0.40 | 2.46 | 0.99 | 0.41 | 0.97 | 74% |
| ADL Index** | 71% | 17.10 | 2.05 | 14.35 | 4.56 | 2.74 | 4.38 | 41% |
| * 0=unable; 1=lot of difficulty; 2=some difficulty; 3=no difficulty ** 0-18 where 0 represents unable to perform all ADLs and 18 represents independence in all ADLs. *** Pre-stroke mean minus post-stroke mean is the residual impairment. | ||||||||
At 90 days after PAC admission, a majority of patients were recovered to pre-stroke function in any given activity, with the lowest recovery rate in bathing, 57 percent, and the highest recovery rate in eating, 88 percent. However, only 41 percent of patients were recovered to pre-stroke levels in the index of all ADLs and the mean residual impairment was 2.74 points with a standard deviation of 4.78, indicating a broad range of recovery levels. Residual impairment mirrored recovery, with the largest mean impairment in bathing (0.72) and the smallest in eating (0.13). The degree of recovery skews these means, however, because the majority of individuals recovered and had residual impairment of 0. As an example, excluding subjects who recovered, the residual impairment in bathing increases from 0.72 to 1.87. One implication is that the dichotomous recovery indicator may be a better outcome indicator than residual impairment scores because of this skewed distribution. A few subjects in each functional ability queried reported 90 day function levels greater than prior stroke function, results that may be a form of measurement error or may be the result of prior disabilities improving from receiving rehabilitation as a result of stroke. (Personal mobility was assessed under a separate index, described in Section E.1.)
D. SELF-REPORTED INSTRUMENTAL ACTIVITIES OF DAILY LIVING
IADLs are indicators of functional well-being that measure the ability to perform more complex tasks that are necessary for independent living within the community but that are not necessarily performed on a daily basis. IADL functional recovery was assessed in a similar manner to the ADLs across seven separate functions.
1. IADL Functions
During the developmental stages of the study, expert panels strongly advocated for inclusion of IADLs as responsive measures of the quality of care delivered to persons with stroke. IADL measures selected for inclusion represented higher levels of function as recommended by the panels. However, IADLs with high non-response rates (i.e., those likely due to gender bias such as housework) based on our prior studies involving IADL measurement were excluded. The seven IADL functions contained in the study instrument were shopping, managing money, using the telephone, preparing/taking medicine, getting in/out of car, preparing meals, and climbing stairs. Scales for individual items and for the index were created in the same manner as for the ADL items.
| TABLE 3.2: Baseline Performance and Recovery in IADL Function | ||||||||
| Pre-Stroke Percentwith No Difficulty | Pre-Stroke Mean | STD | Post-Stroke Mean | STD | Residual Impairment*** | STD | Percent RecoveredPre-Stroke Function | |
| Shopping* | 84% | 2.66 | 0.85 | 1.50 | 1.39 | 1.04 | 1.36 | 53% |
| Money* | 87% | 2.73 | 0.76 | 1.80 | 1.36 | 0.85 | 1.28 | 61% |
| Phone Use* | 91% | 2.85 | 0.52 | 2.46 | 0.98 | 0.37 | 0.89 | 75% |
| Medication* | 86% | 2.73 | 0.72 | 2.21 | 1.11 | 0.55 | 1.05 | 66% |
| Car* | 79% | 2.70 | 0.63 | 2.12 | 1.12 | 0.63 | 1.06 | 58% |
| Meal Preparation* | 85% | 2.68 | 0.82 | 1.40 | 1.37 | 1.16 | 1.39 | 47% |
| Stairs* | 70% | 2.47 | 0.92 | 1.97 | 1.22 | 0.52 | 1.17 | 63% |
| IADL Index** | 63% | 19.11 | 3.90 | 14.05 | 6.81 | 5.04 | 6.14 | 31% |
| * 0=unable; 1=lot of difficulty; 2=some difficulty; 3=no difficulty ** 0-21 where 0 represents unable to perform all IADLs and 21 represents independence in all IADLs. *** Pre-stroke minus post-stroke. | ||||||||
2. Baseline and Recovery in IADL Functions
As compared to ADL functions, subjects were more likely to have a disability prior to their stroke in IADL functions and less likely to be recovered to pre-stroke function at 90-days after PAC admission. Pre-stroke function ranged from 70 percent of subjects with full independence in climbing stairs to 91 percent of patients with full independence using the telephone. Unlike ADL function, the recovery patterns did not align completely with pre-stroke disability rates. Patients were least likely to recover in their ability to prepare a meal but most likely to recover in phone use. Less than one-third (31 percent) of subjects were fully recovered across all IADLs at 90 days, and again, we observed a broad distribution of residual impairment, with a mean residual impairment level of 5.04 and a standard deviation of 6.14.
E. AMBULATION
The expert panels ranked ambulation among the most important outcome indicators for patients with stroke. Panels also recommended including assessments of transfer mobility (as assessed in the above ADL index), as well as home and community mobility. With this in mind, we referred to the Walking Impairment Questionnaire,9 which was designed to capture self-reported degree of difficulty in walking varying distances. The original Walking Impairment Questionnaire assessed degree of difficulty in walking three, two, one, and one-half city block or less. In order to minimize response burden, we initially limited the distances assessed to three levels: around the house (20 feet), one city block, and several city blocks. Pilot testing revealed that further revision to the scale was warranted to adapt the scale to an older post-acute population, rendering the following levels: around the house (20 feet), 50 feet, and one city block (300 feet) -- using the same two-part question collapsed into the scale (3-no difficulty; 2-some difficulty; 1-a lot of difficulty; 0-unable). (Community mobility was assessed as part of the social/role function index, which is described in Section E.) Following the index calculation methods in the Walking Impairment Questionnaire,9 we weighted the responses by the walking distance, rescaling the results to a 100-point scale for ease of interpretation.
| TABLE 3.3: Baseline Performance and Recovery in Ambulation | ||||||||
| Pre-Stroke Percentwith No Difficulty | Pre-Stroke Mean | STD | Post-Stroke Mean | STD | Residual Impairment*** | STD | Percent RecoveredPre-Stroke Function | |
| Walk 20* | 89% | 2.85 | 0.45 | 2.49 | 0.95 | 0.36 | 0.97 | 76% |
| Walk 50* | 79% | 2.70 | 0.65 | 2.54 | 0.84 | 0.17 | 0.98 | 77% |
| Walk 300* | 64% | 2.34 | 1.02 | 2.06 | 1.17 | 0.34 | 1.25 | 67% |
| Walking Index** | 64% | 79.89 | 30.61 | 66.27 | 38.80 | 14.51 | 40.71 | 60% |
| * 0=unable; 1=lot of difficulty; 2=some difficulty; 3=no difficulty ** 0-100 where 0 represents unable to perform all ambulation functions and 100 represents independence in all ambulation functions. *** Pre-stroke minus post-stroke. | ||||||||
2. Baseline and Recovery in Ambulation
Pre-stroke function declined progressively as the walking distance increased, ranging from 89 percent of subjects with no difficulty walking around the house to 64 percent of patients with no difficulty walking a city block. Residual impairment in each of the distances was low as compared to most of the ADL and IADL functions, and three-fifths of subjects recovered to pre-stroke function in ambulation.
F. SOCIAL/ROLE FUNCTION
1. Social/Role Function Activities
In their review of the outcome indicators, expert panel members emphasized the importance of assessing social/role function to capture important aspects of functional status for stroke patients not addressed by traditional measures of physical function. We reviewed numerous measures of health-related quality of life, and found that although these measures included items related to social and role function, many were not relevant to older post-acute patients and appeared to not fully capture the concept as it applied to this patient population. The RNL Index15 was recommended by several expert panelists and was selected based on the relevance and wording of items for the population of interest, the development strategy employed in choosing the items, and its brevity.
The RNL was designed to assess global functional status by incorporating both objective performance indicators and patients perceptions of their own abilities.15, 16 These items combine traditional measures of physical function (i.e., difficulty performing various activities) with patients feelings about performing various activities (i.e., difficulty performing activities that were necessary or important to the patient) -- with the goal of understanding more about patients social/role function and quality of life. In addition to acceptable psychometric properties, the RNL had been specifically tested in post-acute populations.15 The authors of the RNL solicited input from three advisory panels made up of patients with chronic illness, healthy persons, health care providers, psychologists, and clergymen to ensure broad-based input and representation.16 The RNL instrument is comprised of 11 items, uses a visual analog scale for response, and can be converted to a 100-point score.
To adapt the RNL for the purposes of this study, items of less relevance to measuring quality in the post-acute population were removed. In addition, because the follow-up interviews were administered by telephone, we initially adapted the visual analog scale for telephone using a five-point Likert scale. Pilot testing of the instruments revealed that the five-point scale was too cumbersome for subjects to answer, so the response scale was modified to a format similar to that used for the ADL, IADL, and ambulation items described above (i.e., presence or absence of difficulty, and if present, level difficulty encountered).
Subjects were asked if they could perform the following activities as they felt was necessary: (1) move around the house; (2) move around the community; (3) take trips; (4) take part in recreational activities; (5) perform work or other necessary activities; (6) take part in social activities; and (7) take part in family life. They were also asked if they: (8) had difficulty taking part in family life the way that their family wanted; and (9) whether they felt their personal needs were being met.
Correlations and recovery measures among the social/role functions revealed one function that did not appear to move in conjunction with the other activities: satisfaction with how personal needs were met with or without help from others. As with the bladder control function within the ADL index, this function contained different responses than the other functions in this domain. Further, the phrase with help from others led to counterintuitive responses. For example, a nursing home resident may receive significant assistance with personal needs, but is not able to perform any of their prior social functions in the community. This item was dropped from the index.
2. Baseline and Recovery in Social/Role Function
Pre-stroke social/role function disability levels were very similar across the eight functions included in the index, ranging from 77 percent (performing work or other necessary activities) to 86 percent (moving around house) reporting no difficulties. Return to pre-stroke function was least likely in performing work/other necessary activities (51 percent) and most likely in moving around the house (77 percent) and in taking part in social activities (77 percent). Although the mean residual impairment (3.69) and recovery rate (38 percent) were between the level of ADL and IADL function, the distribution of impairment was broader than both with a standard deviation 6.44, indicating greater variation in recovery levels than either ADL or IADL function.
| TABLE 3.4: Baseline Performance and Recovery in Social/Role Function | ||||||||
| Pre-Stroke Percentwith No Difficulty | Pre-Stroke Mean | STD | Post-Stroke Mean | STD | Residual Impairment*** | STD | Percent RecoveredPre-Stroke Function | |
| Moving around house* | 86% | 2.83 | 0.48 | 2.50 | 0.96 | 0.33 | 0.99 | 77% |
| Moving around community* | 80% | 2.65 | 0.80 | 2.10 | 1.22 | 0.56 | 1.25 | 66% |
| Taking trips* | 80% | 2.63 | 0.87 | 2.18 | 1.26 | 0.40 | 1.22 | 74% |
| Taking part in recreational activities* | 84% | 2.75 | 0.66 | 2.42 | 0.97 | 0.33 | 1.08 | 73% |
| Performing work or other necessary* | 77% | 2.58 | 0.86 | 1.71 | 1.27 | 0.88 | 1.34 | 51% |
| Taking part in social activities* | 87% | 2.79 | 0.63 | 2.52 | 0.91 | 0.26 | 0.98 | 77% |
| Taking part in family -- Self* | 85% | 2.80 | 0.58 | 2.26 | 1.07 | 0.55 | 1.10 | 65% |
| Taking part in family -- Family* | 83% | 2.76 | 0.61 | 2.35 | 1.00 | 0.41 | 1.02 | 69% |
| Social/Role Index** | 63% | 21.83 | 4.13 | 18.15 | 6.58 | 3.69 | 6.44 | 38% |
| * 0=unable; 1=lot of difficulty; 2=some difficulty; 3=no difficulty ** 0-24 where 0 represents unable to perform all social/role functions and 24 represents independence in all social/role functions. *** Pre-stroke minus post-stroke. | ||||||||
G. COMPARISON OF FUNCTIONAL MEASURES
While each of these functional domains contributes to the ability of stroke survivors to return to living in the community and to quality of life after stroke, the extent to which they are associated is unknown. They involve different levels and combinations of motor skills, cognition, and social abilities and were designed to capture different components of stroke recovery. We focused on the dichotomous return to pre-stroke function measure for comparison as most appropriate given the relative differences in scales for the indices.
1. Components of Recovery
We expected that subjects would have various levels of global recovery and so the likelihood of recovery in a given domain was believed to be correlated with the likelihood of recovery in other domains, but not to be fully predictive of recovery in other domains. The observed correlations support these assumptions, as all indices were positively but not highly correlated with each other (as shown in Table 3.5).
| TABLE 3.5: Correlations in Recovery Between Indices | ||||
| Walking | ADL | Social | IADL | |
| Walking | 1.000 | 0.431 | 0.400 | 0.382 |
| ADL | 1.000 | 0.470 | 0.459 | |
| Social | 1.000 | 0.497 | ||
| IADL | 1.000 | |||
To further ascertain whether, in fact, these indices were measuring identical components of recovery, we compared the likelihood of recovery in the indices to each other, controlling for within person recovery tendencies using a randomized block analysis of variance (ANOVA) design. Sensitive to differences in recovery within subjects, the ANOVA regression revealed significant differences in the likelihood of patients to be recovered across indices and presented in Table 3.6. Post-hoc comparisons of the mean recovery rates for all pairs of indices suggested that recovery in each domain had a different likelihood, after adjusting for the correlations among domain recovery within subjects. These differences lended support to our third goal, creating indices to measure different components of recovery.
2. Patterns of Recovery
Several physical mechanisms are presumed to be involved in stroke recovery, such as resolution of neural edema, neural plasticity, and behavioral compensation strategies. Some general patterns of recovery are observed in stroke patients. Motor functions grow more smooth over the duration of recovery,17 and patients move from recovery in gross motor to fine motor skills. Recovery of motor functions is earlier and often more complete in the lower extremities than recovery in the upper extremities.18 Higher order cognitive functions may return in parallel or on a different path than motor functions. Rehabilitation is believed to enhance or modulate generally observed recovery patterns by interacting with these underlying processes, but we expect to find some evidence that individual functional indices or combinations of indices were more or less likely to be recovered.
| TABLE 3.6: ANOVA Comparisons of Index Outcomes | |
| Percent Returned to Pre-Stoke Function | |
| ANOVA Random Control Block | |
| Index | F = 42.26** |
| Enrollee | F = 4.13** |
| Means | |
| ADL | 45.6 |
| IADL | 33.2 |
| Walking | 59.7 |
| Social | 40.7 |
| Post-Hoc Mean Comparisons* | |
| ADL vs IADL | T,L,D |
| ADL vs Walking | T,L,D |
| ADL vs Social | L,D |
| IADL vs Walking | T,L,D |
| IADL vs Social | T,L,D |
| Walking vs Social | T,L,D |
| * Indicates significant differences between the mean percent returned to pre-stroke function. Post-Hoc comparisons include three methods: T=Tukeys test, D=Duncan, and L=Least Squares Means testing. ** Significant at P<=0.01. | |
Excluding deaths and missing data, we were able to calculate index outcome measures in all four indices for 461 subjects. Approximately one-fifth of subjects were recovered in all four indices (90), while a larger proportion (125) were recovered in none of the indices. This left the majority of the patients with partial functional recovery (i.e., recovered in a single index or a combination of indices but not in all indices). All possible combinations of index recovery were observed; however, some patterns emerged. Figure 3.1 graphically depicts the distribution of recovery by index and by the number of domains in which a patient achieved recovery. The height of the bars in the graph mirrors the ANOVA findings of the previous section. Overall, subjects were more likely to recover ambulation, as 180 (or 75.3 percent) out of the 239 patients with return to prior function in some, but not all, indices recovered. ADL and social/role function recovery was similar, although ADL recovery remained more likely than recovery of social/role function and subjects were least likely to recover in IADL where only 60 (or 25.1 percent) of subjects with partial recovery of functional indices returned to their pre-stroke level of function.
| FIGURE 3.1: Patients with Partial Functional Recovery by Domain |
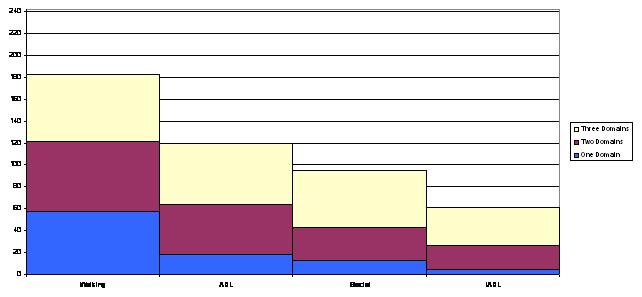 |
The bands of color indicate the distribution of recovery in a given index among the possible level of overall partial recovery: recovery in one domain, recovery in two domains, and recovery in three domains. The blue bands show that recovery in one domain was by far more likely to occur in ambulation than any other functional index, while the yellow bands show that recovery to pre-stroke function in IADL was only likely to occur in subjects that had recovered in at least two other domains. The likelihood of recovery may be due either to a time pattern of recovery or to the overall likelihood for long-term recovery. For example, IADL recovery may be less likely to be observed in our study because it is the functional index with the least chance of recovery or because it is often the last index to recover and recovery occurs after our end point of 90 days.
H. INDICES AS OUTCOME MEASURES
Our functional indices displayed desirable characteristics as outcomes measures. First, good dispersion in outcome values across subjects was found in each index, consistent with sensitivity to small differences in recovery. Second, recovery was positively correlated among all of the indices, suggesting that the indices do not provide contradictory information as recovery outcomes.
We also found evidence to support our design of indices to represent different domains of function. While recovery in any given index was positively correlated with each of the other indices, the simple correlations were less than 0.5, suggesting that no index was a pure substitute for another. Our ANOVA analysis provided evidence that each index had different likelihoods of recovery. The majority of subjects were recovered in one or more, but not all domains. These results emphasize the need to use each of the domains for a comprehensive comparison of recovery in PAC.
I. SUMMARY
Our study subjects provided self-reported levels of functional disability prior to their stroke and 90 days post-stroke in 26 separate activities under four domains of function. We constructed indices incorporating the individual functions to measure recovery under each of the four domains consistent with clinical meaningfulness and statistical findings. These indices proved to have different likelihoods of recovery in our subjects and to present some general recovery patterns across domains while displaying some attractive features as outcome measures. The literature of stroke outcomes often limits recovery to physical functions such as ADLs, while, variation in outcomes among indices suggests a strong need to incorporate all four domains when comparing outcomes across PAC settings.
J. REFERENCE LIST
- Duncan PW, Wallace D, Lai SM, Johnson D, Embretson S, Laster LJ. The Stroke Impact Scale Version 2.0: evaluation of reliability, validity, and sensitivity to change. Stroke 1999; 30: 2131-2140.
- Duke University Center for the Study of Aging and Human Development. Multidimensional functional assessment: the OARS methodology. 1978. Durham, NC: Duke University Press.
- Gilson BS, Gilson JS, Bergner M, Bobbitt RA, Kressel S, Pollard WE, et al. The sickness impact profile development of an outcome measure of health care. Am J Public Health 1975; 65(12): 1304-1310.
- Katz S, Akpom CA. Index of ADL. Med Care 2001; 14(5): 116-118.
- Mahoney FI, Barthel DW. Functional evaluation: the Barthel Index. Md State Med J 1965; 14: 61-65.
- Lawton M, Brody EM. Assessment of older people: self-maintaining and instrumental activities of daily living. Gerontologist 1969; 9: 179-186.
- Pfeffer RI, Kurosaki TT, Harrah CH, Chance JM, Filos S. Measurement of functional activities in older adults in the community. J Geront 1982; 37(3): 323-329.
- Wolinsky FD, Callahan CM, Fitzgerald JF, Johnson RJ. The risk of nursing home placement and subsequent death among older adults. J Am Geriatr Soc 1992; 47(4): S173-S182.
- Regensteiner JG, Steiner JF, Panzer RJ, Hiatt WR. Evaluation of walking impairment by questionnaire in patients with peripheral arterial disease. J Vasc Med Biol 1990; 2(3): 142-152.
- Kramer AM. Rehabilitation care and outcomes from a patients perspective. Med Care 1997; 35(6): JS48-JS57.
- Ahlmen M, Nordenskiold U, Archenholtz B, Thyberg I, Ronnqvist R, Linden L, et al. Rheumatology outcome: the patients perspective. A multicentre focus group interview study of Swedish rheumatoid arthritis patients. Rheumatol 2005; 44: 105-110.
- Coleman EA, Mahoney E, Parry C. Assessing the quality of preparation for posthospital care from the patients perspective: the care transitions measure. Med Care 2005; 43(3): 246-255.
- Schor EL, Lerner DJ, Malspeis S. Physicians assessment of functional health status and well-being: the patients perspective. Arch Intern Med 1995; 155(3): 309-314.
- Fitti JE, Kovar MG. The supplement on aging to the 1984 national health interview survey. US Department of Health and Human Services, Publication #87-1323; 1987. Washington, DC: US Government Printing Office.
- Wood-Dauphinee S, Opzoomer A, Williams JI, Marchand B, Spitzer WO. Assessment of global function: the reintegration to normal living index. Arch Phys Med Rehabil 1988; 69: 583-590.
- Wood-Dauphinee S, Williams JI. Reintegration to normal living as a proxy to quality of life. J Chron Dix 1987; 40(6): 491-499.
- Rohrer B, Fosoli S, Krebs HI, Hughes R, Volpe B, Frontera WR, et al. Movement smoothness changes during stroke recovery. J Neurosci 2002; 22(18): 8297-8304.
- Desrosiers J, Molouin F, Richards C, Bourbonnais D, Rochette A, Bravo G. Comparison of changes in upper and lower extremity impairments and disabilities after stroke. Int J Rehab Research 2003; 26(2): 109-116.
4. PATTERNS OF POST-ACUTE CARE FOLLOWING IMPLEMENTATION OF PPS
A. INTRODUCTION
In an effort to contain the rapid growth in Medicare PAC expenditures during the late 1980s to mid-1990s, Congress established PPSs for IRFs, SNFs, and HH agencies under the Balanced Budget Act of 1997. The SNF PPS was implemented in July 1998, the HH PPS was implemented in 2000, and the IRF PPS was implemented in January 2002, with an OP care PPS implemented in August 2000. The SNF PPS resulted in a per diem rate for each day of care based on the provision of specific services and patient condition. The IRF PPS rate is per discharge based on the patient's condition (e.g., diagnosis, function), and the HH PPS rate is for a 60-day episode based on patient condition and services provided. The OP PPS is a fee schedule setting rates per visit for individual services and procedures.
Just as each PAC setting has its own patient assessment instrument, the PPS for each PAC care setting has its own case mix classification system and reimbursement incentives. The incentives under these PPSs are likely to have substantial effects on both the patterns of PAC use and the characteristics of patients admitted to different PAC providers.
The SNF and HH PPS classification systems use therapy services as a basis for categorizing patients for payment. The RUG-III case mix classification system for SNFs has five rehabilitation RUG categories determined by the amount of therapy provided. In general, rehabilitation RUGs are paid at the highest rates. Due to legislation enacted in November 1999, three rehabilitation groups received a 20 percent add-on payment: high rehabilitation (325 minutes) functional category C; medium rehabilitation (150 minutes) functional category C; and medium rehabilitation functional category B. The effect was an immediate increase in the admission of patients requiring therapy at these levels and a major decrease in the admission of patients in the very high (500 minutes) and ultra-high (720 minutes) therapy groups.1 Because many stroke patients require more than 325minutes of therapy per week, there was a disincentive to admit stroke patients to SNFs until this add-on was redistributed across all rehabilitation payment groups in 2001.2 Furthermore, many stroke patients can benefit from even more therapy than the 720minutes and twotherapies that is the minimum for the ultra-high group. Because SNFs do not receive additional payment if more than the minimum therapy to qualify for the RUG category is provided, they are under a disincentive to admit stroke patients with rehabilitation needs that exceed these minimums.
The HH PPS provides a higher reimbursement rate per 60-day episode of care for patients who require at least ten visits of therapy. Thus, HH agencies have an incentive to accept patients who require the minimum of ten therapy visits. However, there is no incentive to accept patients who require substantially more than the ten visits.
The per discharge system developed for IRFs has the same type of incentive as the acute hospital PPS implemented in 1983 based on diagnosis-related groups (DRGs), a classification system under which reimbursement is provided based on patient condition regardless of time spent in the facility. Under the IRF PPS, patients are classified into one of 385 CMGs based on diagnosis and functional status, resulting in an incentive to discharge patients in as few days as possible to reduce costs of care relative to the payment. For most IRFs, this would provide an incentive to rapidly discharge patients to subsequent post-acute providers for additional needed care. Thus, we would expect to see declining IRF lengths of stay and an increase in multiple-provider episodes for individuals admitted initially to IRFs.
Prior to PPS, Kramer et al. (1997)3 found overall differences between IRF and SNF patients for stroke and hip fracture, but identified subgroups of patients through propensity score analyses who were treated in reasonably high proportions in both settings. Identification of these subgroups, however, required information on cognition, availability of caregivers, and pre-morbid function -- none of which are available in larger administrative databases. Comparisons between HH patients and patients receiving institutional rehabilitation under the Medicare program have shown significant differences in function, cognition, and social supports, whereas studies using administrative data have argued that substitution between HH care and IRF or SNF care may have existed for some subgroups of patients.4, 5, 6 Gage et al. argued that because of the importance of patient factors in the placement of patients with stroke, it is unlikely that the advent of PPS for PAC will increase substitution across settings.7 Substitution of provider types may persist because of variations in PAC provider availability and practice patterns among geographic areas. However, to the extent that the payment systems result in incentives and disincentives for the different PAC settings to admit certain types of patients, providers may further differentiate with regard to the types of patients they admit, thus reducing the degree of substitution across settings.
The purpose of this chapter is to examine patterns of PAC for stroke patients following implementation of PPS for all PAC provider types. We hypothesize a dominance of multiple-provider episodes, at least for patients admitted initially to IRFs. Through an analysis of the characteristics of stroke patients admitted from hospital to different PAC settings and among those receiving various multiple-provider care patterns, we also plan to assess the extent of substitution that now exists across settings.
B. METHODS
1. Sampling
- Providers: A total of 88facilities participated in the study, including 35 IRFs, 33 SNFs, and 20 HH agencies from 20 different states. Characteristics of these facilities are provided in Table 2.1. Providers were required to admit at least 12 stroke patients per year in the prior year to be eligible for the study based on screening from secondary data sources and then confirmation upon recruitment. Thus, the average number of stroke admissions in the prior year was 122 to IRFs, 18 to SNFs, and 118 to HH agencies. These stroke admissions were not necessarily direct admits from hospital to the PAC provider, meaning that these providers were not necessarily the first PAC provider for the enrolled patients.
- Subjects: Subjects were enrolled largely between 2003 and early 2005 (eight enrolled late in 2002). In total, 3,175 Medicare subjects with a confirmed stroke diagnosis who had been hospitalized in the past 30 days were screened for inclusion in the study. Of the 3,175 confirmed stroke patients who were screened upon admission to a participating IRF, SNF, or HH agency, the majority were admitted to IRFs (74 percent), with the remainder split almost evenly between SNFs and HH agencies (Table 2.2). Despite attempts to enroll the highest volume SNFs and HH agencies into the study, the 33 SNFs admitted an average of 11.4 stroke patients (0.9 per screening month) during the study period and the 20 HH agencies admitted an average of 23.2 stroke patients (1.9 per screening month), in contrast to 66.7 stroke patients admitted per IRF for the 35 IRFs (4.9 per screening month). Patients younger than 65 years of age and Medicare beneficiaries enrolled in a health maintenance organization (HMO) or anything other than traditional FFS Medicare were excluded, as were patients who received care in a prior PAC setting. The percent of total screened subjects who were excluded for these criteria was highest in HH agencies (68.5 percent) due particularly to prior PAC (39 percent). Just less than half (48.5 percent) of SNF patients were excluded due to any of three exclusion criteria, with 34 percent excluded due to HMO enrollment and prior PAC. IRF patients were excluded largely due to age <65 (35 percent).
- Eligibility Criteria Included: receiving therapy, English speaking, not comatose, did not reside in nursing home prior to hospitalization, and availability of an identifiable proxy (if needed). The patient eligibility criteria eliminated more patients from SNFs, particularly due to prior nursing home residence and lack of therapy (Table 2.2). Of patients meeting these criteria (n=1,390), 8 percent were dropped at random to moderate data collection burden on individual providers; 25 percent of the remainder refused; 5 percent of these were eliminated due to deaths, transfers, or various delays; and 25 percent of the remainder were dropped because data collectors could not complete the interview. Of the remaining 674patients for whom interview data were available, Medicare claims were matched for 642 (IRF n=528; SNF n=59; HH agency n=55). IRFs admitted an average of 16patients to the study (range 1-48); SNFs admitted an average of threepatients (range 1-17), and HH agencies admitted an average of fourpatients (range 1-15).
2. Variables
The variables included patient characteristics, utilization measures from hospital and PAC services, facility characteristics of PAC services providers, and community characteristics. Patient characteristics were collected prior to the stroke, during acute hospitalization, at admission to PAC setting, and 90 days after the stroke. Pre-stroke conditions related to pre-morbid ADL function, IADL function, walking ability, and social/role function (described in Chapter 3). In addition, pre-stroke variables included a five-point Likert Scale of self-reported health ranging from poor to excellent (range 0-4), social support assessments, and demographics (Table 2.6). Acute stroke care stay variables related to stroke type and individual comorbidities (e.g., atrial fibrillation), as well as the Deyo Comorbidity Index.8 PAC assessment measures obtained close to admission pertained to cognition, vision, speech/language, function, and depression. To assess cognition, the 30-item MMSE was used.9 For individuals who required proxy respondents, the MMSE was approximated using the Cognitive Performance Scale.10 As an assessment of ADL function, the Barthel Index was mapped from the MDS, IRF-PAI, and OASIS instruments using an algorithm that approximated each function, excluding stairs, which is not included in these instruments (range 0-90; described in Chapter 2). Data from the IRF-PAI and OASIS were collected on the second day after hospital discharge on average, whereas MDS data were collected 11days after hospital discharge on average. The result is that the Barthel Index from SNFs was measured after a period of recovery lasting more than a week, so we can assume that this assessment would have been lower -- representing greater impairment -- if collected on the second day after hospital discharge. The GDS was utilized in the patient interview to screen for symptoms of depression for individuals who could respond.11
Utilization variables included length of stay for the most recent acute hospitalization in the prior 30 days, length of stay for the initial PAC stay occurring immediately following hospitalization, and the total PAC stay ending with the conclusion of all Medicare PAC services or 90 days, whichever came first. Length of stay determination rules are defined more fully in Chapter 2. Facility and community characteristics are reported at the patient level. For example, proprietary ownership refers to the number of patients in each group who were admitted to proprietary facilities, not the number of proprietary facilities in each group (reported in Chapter 2). Facility characteristics relate to Medicare volume, ownership, organizational type and affiliations. Community characteristics include urban vs. rural and then the two community stratifiers of high IRF use rate and high community resources. As described in Chapter 2, high IRF use rate refers to where the community stands relative to the median national IRF use rates. High community resources refers to availability of assisted living facility beds relative to nursing home beds in the state and secondarily home and community-based services availability. These are defined further in Chapter 2. Also in Chapter 2 are descriptions of the data collection instruments and methods.
3. Analysis
- Patterns of PAC in 90 Days: For each patient included in the study, we captured Medicare claims to delineate the pattern of service provider utilization that included IRF, SNF, HH, OP, and hospital and determined when the patient was in a residence with no Medicare PAC services. To do this, we combined all of the claims for the 90-day episode for each patient in a single file with admission dates and service end dates. Provider numbers were compared for patients with multiple claims for a particular setting and patients were assigned a transition to another site if the provider number changed and the dates of care did not overlap. Therefore, a secondprovider of the same type as the initial provider was specified as a subsequent provider when the provider number changed. A period of 30days in which no services were delivered was determined to be indicative of the end of stroke rehabilitation, which coincides with the Medicare payment requirement to qualify for PAC rehabilitation care. When a period of 30 days with no services occurred, residence was the denoted location. The type of residence was determined from the 90-day interview because this information is not available in claims (see Chapter 2 for further discussion). In addition to determining the sequence of providers for each patient, the proportion of patients receiving care in a subsequent provider was determined for patients admitted to each setting as the first admission. Subsequent providers could be used anytime within the 90-day episode and multiple subsequent providers could be used.
- Comparisons of Patient Characteristics among Settings: We compared characteristics of patients admitted to a SNF, IRF, and HH as the initial provider. For patients initially admitted to an IRF, we also compared patient characteristics among the various patterns of multiple-provider episodes upon discharge from the IRF. These multiple-provider episodes were defined based on the transferring PAC setting. Comparisons were conducted using the t-test or Mann-Whitney for non-normally distributed variables, and the Chi-Square Test for dichotomous variables.
C. RESULTS
1. Patterns of PAC
Nearly 170 different patterns of PAC in the first 90 days following hospitalization for stroke were found among 642 patients for whom PAC pattern information was available (Figure 4.1, Figure 4.2, and Figure 4.3). Residence represents the point at which no further Medicare PAC services were provided for a period of 30 days. The type of residence (e.g., nursing home, home) was based on the 90-day interview information because this information is not available from claims. Most of these patterns occurred only rarely (1-2 patients), and only a few patterns were noteworthy. From IRF, direct PAC discharges occurred most frequently to HH agencies, then OP, then SNFs (Figure 4.1). The following care patterns in 90 days accounted for 49 percent of IRF admissions in total:
- IRF-HH residence (n=90; 17 percent) -- residence was 89 percent private home; 11 percent assisted living.
- IRF-OP residence (n=66; 13 percent) -- residence was 92 percent private home; 5 percent assisted living; 3 percent nursing home.
- IRF residence (n=36; 7 percent) -- residence was 93 percent private home; 7 percent assisted living.
- IRF HH (n=34; 6 percent).
- IRF OP (n=34; 6 percent).
These latter two patterns represent situations where HH and OP were ongoing at the 90-day time point. For the 14 patients with the IRF>SNF residence pattern, 46 percent went to a private home, 45 percent went to a nursing home, and 9 percent went to an assisted living facility.
For hospital discharges to SNFs (Figure 4.2), only one pattern was prevalent: SNF residence (n=13; 22 percent). Of these, 90-day residence was home in 33 percent, assisted living in 25 percent, and nursing home in 42 percent. For hospital discharges to HH (Figure 4.3), a single pattern accounted for 67 percent of the HH admissions: HH residence (n=37). Ninety-five percent (95 percent) of patients went to a private home and 5 percent went to an assisted living facility.
| TABLE 4.1: Providers Used for Medicare Beneficiaries with Stroke within 90-Days of Hospital Discharge | |||||||||||
| First Provider | Subsequent Providersa | ||||||||||
| Total n | Only | Outpatient | HH agency | SNF | IRF | ||||||
| n | % | n | % | n | % | n | % | n | % | ||
| Inpatient Rehabilitation Facility | 528 | 55 | 10.4% | 209 | 39.6% | 258 | 48.9% | 113 | 21.4% | 34 | 6.4% |
| Skilled Nursing Facility | 59 | 22 | 37.3% | 14 | 23.7% | 15 | 25.4% | 16 | 27.1% | 5 | 8.5% |
| Home Health Agency | 55 | 44 | 80.0% | 7 | 12.7% | 5 | 9.1% | 1 | 1.8% | 0 | 0.0% |
| Total | 642b | 121 | 18.8% | 230 | 35.8% | 278 | 43.3% | 130 | 20.2% | 39 | 6.1% |
| |||||||||||
Distilling the patterns down to a first provider and any subsequent PAC providers used by a patient within the 90 days provides a simpler view of the patterns (Table 4.1). Subsequent PAC providers could be used any time in the 90 days and more than one could be used, so the percent of patients using the various subsequent providers (rows) summed to greater than 100 percent. These subsequent providers did not include rehospitalizations. For stroke patients discharged to IRF, almost 90 percent used more than one PAC provider in 90 days (i.e., not IRF only). Usually, the subsequent providers were either HH or OP, but use of SNFs occurred in one in five IRF admissions for stroke. Use of two separate IRFs in 90 days was unusual but did occur (6.4 percent). Sixty (60 percent) of IRF patients used two PAC providers, and 30 percent used three or more PAC providers in 90 days.
For direct SNF admissions from hospital, no additional PAC provider in 90 days was the most prevalent (37.3 percent), but OP, HH and/or another SNF were each used in around one-quarter of cases. About a third of SNF patients used a total of two PAC providers and 29 percent used three or more PAC providers in 90 days. Thus, multiple-provider episodes were clearly dominant for stroke patients admitted to institutional rehabilitation, particularly to IRFs.
In contrast, only 20 percent of HH admissions from hospital used some other type of provider, which was usually OP, but sometimes another HH agency. Overall, HH agencies and OP were the most frequently used subsequent providers, 43 percent and 36 percent respectively, following the initial PAC admission.
2. Comparison of Stroke Patients Discharged to IRFs, SNFs, and HH agencies
Table 4.2 provides a comparison of the characteristics of stroke patients in which the first or initial provider was IRF, SNF, or HH agency. Demographic characteristics were relatively similar across the three settings, with the exception that HH patients were more likely to be women, and SNF patients were less well educated than both HH and IRF patients. SNF patients had worse pre-morbid function in ambulation, ADLs, IADLs, and social role function than IRF patients, as well as worse pre-morbid function in ADLs and IADLs than HH patients. SNF patients also had worse global self-reported health, meaning they were more likely to rate their health as fair or poor, relative to IRF and HH patients.
| TABLE 4.2: Characteristics of Stroke Patients Discharged Directly to IRFs, SNFs, and HH Agencies | ||||
| IRFa n=555 | SNFa n=62 | HHa n=57 | Significanceb,c,d | |
| PRE-STROKE CONDITION | ||||
| Age (years) | 77.4 | 78.6 | 79.4 | c |
| Gender (% female) | 54.2 | 56.5 | 68.4 | c |
| Race | ||||
| White | 88.3 | 91.9 | 92.7 | |
| African American | 8.6 | 6.5 | 7.3 | |
| Other | 4.9 | 1.6 | 1.8 | |
| Hispanic Ethnicity | 3.1 | 1.6 | 1.8 | |
| Married | 48.0 | 38.7 | 42.1 | |
| Education Completed (years) | 12.2 | 10.8 | 12.3 | b, d |
| Income | ||||
| <$15,000 | 32.4 | 41.7 | 43.8 | |
| Between $15,000 and $30,000 | 39.3 | 37.5 | 33.3 | |
| >$30,000 | 28.2 | 20.8 | 22.9 | |
| Support Available for Tasks | 92.4 | 93.2 | 96.4 | |
| Support Available for As Long As Needed | 92.7 | 90.2 | 87.0 | |
| Smoker at Time of Stroke | 8.8 | 12.2 | 5.7 | |
| Ambulation Ability (0-100)e | 81.8 | 65.8 | 78.9 | b |
| Activities of Daily Living Index (0-18)e | 17.2 | 14.6 | 16.8 | b, d |
| Instrumental Activities of Daily Living Index (0-21)e | 19.2 | 15.1 | 18.1 | b, d |
| Social/Role Index (0-24)e | 21.9 | 18.1 | 20.9 | b |
| Global Health Rating (0-4)f | 1.9 | 2.4 | 1.9 | b, d |
| ACUTE STROKE CARE STAY | ||||
| Stroke Type | ||||
| Hemorrhagic | 7.6 | 7.3 | 16.4 | c |
| Occlusion | 74.8 | 63.6 | 47.3 | c |
| Other | 17.6 | 29.1 | 36.4 | b, c |
| Comorbidities | ||||
| Chronic or Intermittent Atrial Fibrillation | 23.8 | 20.3 | 16.1 | |
| Hypertension | 74.5 | 72.9 | 76.8 | |
| Prior Stroke within Last Calendar Year | 11.0 | 11.9 | 17.9 | |
| Congestive Heart Failure | 15.1 | 6.8 | 14.3 | |
| Diabetes Mellitus | 29.7 | 20.3 | 33.9 | |
| Myocardial Infarction | 2.8 | 5.1 | 0.0 | |
| Chronic Obstructive Pulmonary Disease | 2.1 | 5.1 | 1.8 | |
| Deyo Comorbidity Index (1-6) | 1.0 | 1.0 | 0.8 | |
| Physical Therapy | 94.9 | 86.4 | 89.3 | b |
| Speech Therapy | 69.2 | 59.3 | 50.0 | c |
| Occupational Therapy | 77.5 | 50.8 | 62.5 | b, c |
| POST-ACUTE CARE ADMISSION | ||||
| Mini-Mental Status Exam (0-30)g | 23.0 | 19.1 | 24.5 | b, c, d |
| Blindness | 4.6 | 1.7 | 7.0 | |
| Visual Neglect | 28.6 | 30.2 | 23.4 | |
| Aphasia/Severe Dysarthria | 20.5 | 45.2 | 19.3 | b, d |
| Barthel Index (0-90)e | 39.9 | 33.7 | 64.4 | b, c, d |
| Geriatric Depression Scale (0-15)h | 3.6 | 5.9 | 4.0 | b, d |
| UTILIZATION | ||||
| Acute Stroke Hospitalization (days) | 6.5 | 6.6 | 4.9 | c, d |
| Initial PAC Length of Stay (days) | 20.9 | 33.3 | 32.7 | b, c |
| Total PAC Length of Stay (days) | 55.2 | 46.4 | 36.7 | b, c, d |
| FACILITY | ||||
| # Medicare Stroke Admissions | 134.9 | 20.7 | 80.6 | b, c, d |
| # Medicare HMO Admissions | 66.3 | 24.8 | 141.4 | b, c |
| Ownership | ||||
| Proprietary | 18.6 | 41.9 | 3.5 | b, c, d |
| Non-Profit, Religious | 27.4 | 1.6 | 22.8 | b, d |
| Non-Profit, Secular | 40.7 | 54.8 | 73.7 | b, c, d |
| Government | 13.3 | 1.6 | 0.0 | b, c |
| Other | 0.0 | 0.0 | 0.0 | |
| Organizational Type | ||||
| Freestanding | 38.2 | 54.8 | 40.4 | b |
| Hospital-Based | 61.8 | 45.2 | 59.6 | b |
| Other | 0.0 | 0.0 | 0.0 | |
| Affiliation with Medical/Nursing School | 52.6 | 36.1 | 6.3 | b, c, d |
| Facility Chain | 53.0 | 75.4 | 68.8 | b, c |
| COMMUNITY | ||||
| High IRF Use Rate | 87.4 | 41.9 | 40.4 | b, c |
| High Community Resources | 71.5 | 51.6 | 66.7 | b |
| Urban (SMSA) | 93.3 | 58.1 | 98.2 | b, d |
| ||||
Compared to IRF patients, HH patients were more likely to have hemorrhagic and other strokes rather than occlusion (arterial blockage). These hemorrhagic and other strokes could have been more focal causing less generalized neurological impairment, but this would depend more on the size of the area affected rather than the type of stroke. There was no difference in comorbidities. Of interest is the lower rate of PT and OT in the hospital for SNF patients relative to IRF patients despite comparable acute hospital lengths of stay, and a lower rate of ST and OT in HH agencies relative to IRFs. Cognition, speech and language, ADL function (Barthel Index), and depression (among those patients who did not require a proxy) were all worse upon admission to SNFs than IRFs or HH agencies. The Barthel Index for SNF patients is inflated relative to IRF and HH because the assessment is nine days later, so these functional differences are probably even greater. In addition, ADL function and cognition upon admission to IRF was worse than in HH care.
In combination, these profiles suggest substantially different characteristics of stroke patients admitted from the hospital to SNFs relative to IRFs and HH agencies. SNF patients were less well educated; more disabled prior to the stroke; more impaired following the stroke cognitively, physically and in speech and language; and had greater symptoms of depression. HH patients, while more similar to IRF patients in some areas, were more likely to be women, less likely to have occlusive strokes, and were more functional with less cognitive impairment than IRF patients.
Lengths of stay in the acute hospital, the initial PAC stay, and the total PAC stay across all survivors differed among admissions to the three settings (Table 4.2). HH patients tended to have shorter acute hospital lengths of stay, suggesting lower severity of the acute stroke and related conditions, and the shortest total PAC stays relative to either of the other provider types. IRF patients had the shortest initial PAC stay, but the longest total PAC stay, which is not surprising based on the pattern analysis previously presented showing that multiple-providers were used after IRF. Of particular note is a decline in the initial IRF length of stay from 21.8 to 19.7 days (p<0.05) between subjects enrolled in 2003 (n=224) and those enrolled in 2004 (n=261). Median lengths of stay were lower than the mean values because of the effect of outliers on the means; however, the median dropped from 21 to 18 between 2003 and 2004.
Relative to the means, median acute hospital lengths of stay for the whole sample were shorter by about a day or more (IRF=5, SNF=5, HH agency=4). Relative to the means, median initial PAC stays were a day shorter in IRFs and about eight days shorter in SNFs and HH agencies (25 days) because of the effects of outliers. For total PAC lengths of stay, medians were 53 days, 41 days, and 29 days for IRFs, SNFs, and HH agencies, respectively.
The number of Medicare stroke admissions that were reported by facilities in the prior year was much higher than we found in SNFs and HH agencies during screening (Table 4.2), showing a decline in number of stroke admissions. IRF patients were largely from non-profit, hospital-based units, although for-profit hospitals were also well represented. The sample included a disproportionate number of non-profit, hospital-based SNF patients because these facilities were more likely to have an adequate volume of stroke admissions and were more likely to admit stroke patients during the study period. Similarly, HH patients were disproportionately from hospital-based agencies because they treated a higher volume of stroke patients; these agencies were more likely to be non-profit. As might be expected, relative to SNF and HH patients, IRF patients were more likely to be located in high IRF use communities. Relative to SNF patients, IRF and HH patients were also more likely to be located in urban communities.
3. Comparison of Stroke Patients Discharged to IRFs by Subsequent PAC Setting
With most patients admitted first to IRFs, comparisons of multiple-provider settings after the initial IRF stay were of interest. Because complete patterns of PAC are far too numerous to contrast (Figure 4.1), characterizing patients based on the second PAC setting following IRF care provides valuable insights regardless of the care that follows. Table 4.3 provides the characteristics of stroke patients receiving subsequent care in four options: SNF, HH, OP, and residence with no further PAC.
Patients admitted from IRF to SNF were more likely to be unmarried women with lower incomes. IRF to SNF patients also were more likely to have atrial fibrillation than IRF to OP patients, but no differences existed in overall comorbidity (Deyo Index). Patients admitted from IRF to SNF had greater cognitive impairment, visual impairment, aphasia, and functional impairment upon admission to PAC based on both the Barthel Index and FIM Scales, consistent with direct admits to SNF. The groups were relatively similar with respect to demographics and pre-stroke function and self-reported health. Thus, patients who were admitted to SNF following IRF, relative to other options, were more impaired after their strokes. These patients had many characteristics that were similar to patients discharged directly from acute hospital to SNF (Table 4.2).
Modest but statistically significant functional differences, particularly in mobility, were found between IRF patients who went to HH and those who received OP, and also between patients who went from IRF to HH and those who went from IRF to residence. Interestingly, those who went directly to residence from IRF care without further PAC had slightly worse pre-morbid ADL and social/role function than those who subsequently received OP care. Many similarities existed between patients who received HHA and OP following IRF care, and to a lesser extent those who were discharged to their residences with no further care.
| TABLE 4.3: Characteristics of Stroke Patients Discharged Directly to IRFs by Subsequent PAC Setting | |||||
| SNFa n=80 | HHa n=209 | OPa n=134 | RESa n=46 | Significanceb,c,d,e,f,g | |
| PRE-STROKE CONDITION | |||||
| Age (years) | 78.3 | 77.9 | 76.4 | 75.9 | |
| Gender (% female) | 70.0 | 51.7 | 47.0 | 50.0 | b, c, d |
| Race | |||||
| White | 90.0 | 88.1 | 86.6 | 84.8 | |
| African American | 7.5 | 10.4 | 9.7 | 8.7 | |
| Other | 3.8 | 2.5 | 4.5 | 17.4 | d, f, g |
| Hispanic Ethnicity | 2.5 | 4.4 | 1.0 | 2.2 | |
| Married | 32.5 | 49.3 | 57.5 | 40.0 | b, c |
| Education Completed (years) | 12.5 | 11.9 | 12.5 | 12.1 | b, e |
| Income | |||||
| <$15,000 | 50.0 | 34.3 | 24.6 | 41.0 | b, c |
| Between $15,000 and $30,000 | 32.1 | 38.9 | 42.1 | 33.3 | |
| >$30,000 | 17.9 | 26.9 | 33.3 | 25.6 | c |
| Support Available for Tasks | 88.5 | 93.2 | 91.3 | 93.2 | |
| Support Available for As Long As Needed | 83.6 | 93.3 | 93.9 | 94.6 | b, c |
| Smoker at Time of Stroke | 7.4 | 10.9 | 6.1 | 5.3 | |
| Ambulation Ability (0-100)h | 83.2 | 81.7 | 85.8 | 77.8 | |
| Activities of Daily Living Index (0-18)h | 17.2 | 17.3 | 17.3 | 16.6 | g |
| Instrumental Activities of Daily Living Index (0-21)h | 19.0 | 19.2 | 19.7 | 18.2 | e |
| Social/Role Index (0-24)h | 21.6 | 22.0 | 22.6 | 20.1 | g |
| Global Health Rating (0-4)I | 1.8 | 1.8 | 1.7 | 2.0 | |
| ACUTE STROKE CARE STAY | |||||
| Stroke Type | |||||
| Hemorrhagic | 7.5 | 4.9 | 9.7 | 15.6 | f |
| Occlusion | 75.0 | 76.6 | 77.6 | 60.0 | f, g |
| Other | 17.5 | 18.5 | 12.7 | 24.4 | |
| Comorbidities | |||||
| Chronic or Intermittent Atrial Fibrillation | 35.0 | 24.9 | 17.2 | 26.1 | c |
| Hypertension | 73.8 | 74.6 | 76.9 | 65.2 | |
| Prior Stroke within Last Calendar Year | 11.3 | 11.5 | 11.2 | 4.3 | |
| Congestive Heart Failure | 15.0 | 16.7 | 13.4 | 10.9 | |
| Diabetes Mellitus | 27.5 | 28.2 | 34.3 | 23.9 | |
| Myocardial Infarction | 5.0 | 1.4 | 3.7 | 0.0 | |
| Chronic Obstructive Pulmonary Disease | 2.5 | 2.4 | 1.5 | 2.2 | |
| Deyo Comorbidity Index (1-6) | 0.9 | 1.0 | 1.0 | 0.8 | |
| Physical Therapy | 96.3 | 93.3 | 97.8 | 93.5 | |
| Speech Therapy | 77.5 | 60.8 | 78.4 | 58.7 | b, d, e, g |
| Occupational Therapy | 75.0 | 77.0 | 85.1 | 63.0 | g |
| POST-ACUTE CARE ADMISSION | |||||
| Mini-Mental Status Exam (0-30) j | 19.9 | 23.6 | 23.8 | 23.7 | b, c, d |
| Blindness | 4.0 | 5.9 | 3.1 | 4.3 | |
| Visual Neglect | 42.9 | 26.3 | 22.0 | 22.2 | b, c, d |
| Aphasia/Severe Dysarthria | 31.3 | 15.3 | 21.6 | 21.7 | b |
| Barthel Index (0-90)h | 27.4 | 40.2 | 45.1 | 50.1 | b, c, d, e, f |
| Self-Care FIM (0-42) | 14.7 | 19.2 | 20.3 | 21.5 | b, c, d, f |
| Sphincter FIM (0-14) | 4.9 | 7.3 | 7.7 | 8.6 | b, c, d |
| Communication FIM (0-14) | 7.6 | 9.3 | 9.3 | 9.0 | b, c, d |
| Social Cognition FIM (0-21) | 9.6 | 13.2 | 13.0 | 12.4 | b, c, d |
| Mobility/Transfer FIM (0-21) | 4.9 | 7.2 | 8.3 | 8.9 | b, c, d, e, f |
| Locomotion FIM (0-14) | 1.7 | 2.3 | 2.9 | 3.5 | b, c, d, e, f |
| Total Sum of 6 FIM (0-126) | 43.4 | 58.5 | 61.6 | 63.8 | b, c, d |
| Geriatric Depression Scale (0-15)k | 4.7 | 3.6 | 2.7 | 4.0 | b, c, e |
| UTILIZATION | |||||
| Acute Stroke Hospitalization (days) | 7.5 | 5.9 | 6.4 | 5.6 | b, d |
| Initial PAC Length of Stay (days) | 25.8 | 21.7 | 19.2 | 16.5 | b, c, d, e, f |
| Total PAC Length of Stay (days) | 72.6 | 62.6 | 62.6 | 16.5 | b, c, d, f, g |
| FACILITY | |||||
| # Medicare Stroke Admissions | 151.7 | 131.5 | 135.8 | 138.1 | |
| # Medicare HMO Admissions | 57.7 | 71.4 | 59.5 | 85.3 | |
| Ownership | |||||
| Proprietary | 20.0 | 16.7 | 18.7 | 21.7 | |
| Non-Profit, Religious | 26.3 | 29.2 | 24.6 | 23.9 | |
| Non-Profit, Secular | 42.5 | 37.8 | 44.0 | 47.8 | |
| Government | 11.3 | 16.3 | 12.6 | 6.5 | |
| Other | 0.0 | 0.0 | 0.0 | 0.0 | |
| Organizational Type | |||||
| Freestanding | 46.3 | 36.4 | 36.6 | 45.7 | |
| Hospital-Based | 53.8 | 63.6 | 63.4 | 54.3 | |
| Other | 0.0 | 0.0 | 0.0 | 0.0 | |
| Affiliation with Medical/Nursing School | 50.0 | 47.4 | 58.2 | 67.4 | f |
| Facility Chain | 46.3 | 49.3 | 58.2 | 58.7 | |
| COMMUNITY | |||||
| High IRF Use Rate | 85.0 | 89.0 | 89.6 | 89.1 | |
| High Community Resources | 75.0 | 69.4 | 70.1 | 71.7 | |
| Urban (SMSA) | 92.5 | 93.8 | 95.5 | 87.0 | |
| |||||
4. Comparison of Stroke Patients Discharged directly to SNF and discharged to IRF and then SNF
The only significant demographic difference between patients admitted directly to SNFs vs. patients first admitted to IRF and then SNF was that the IRF>SNF group averaged twomore years of education (Table 4.4). IRF>SNF patients were more independent in ambulation, ADLs, IADLs, and social/role functioning prior to their stroke than patients admitted directly to SNF on average. They were more likely to have atrial fibrillation and received more PT, OT, and ST in the hospital. At the time of post-acute admission following the stroke, however, patients in the twogroups were relatively comparable with respect to cognition, visual problems, speech and language problems, function, and depression. They had similar acute lengths of stay and initial PAC stays, but the total PAC length of stay was much greater for the IRF>SNF patients because it involved the IRF stay, the SNF stay, and any other subsequent stays.
| TABLE 4.4: Characteristics of Stroke Patients in IRF-SNF vs. Direct SNF Episodes | |||
| IRF-SNFa n=80 | SNFa n=62 | Significance | |
| PRE-STROKE CONDITION | |||
| Age (years) | 78.3 | 78.6 | 0.78 |
| Gender (% female) | 70.0 | 56.5 | 0.12 |
| Race | |||
| White | 90.0 | 91.9 | 0.78 |
| African American | 7.5 | 6.5 | 0.99 |
| Other | 3.8 | 1.6 | 0.63 |
| Hispanic Ethnicity | 2.5 | 1.6 | 0.99 |
| Married | 32.2 | 38.7 | 0.48 |
| Education Completed (years) | 12.5 | 10.8 | <0.001 |
| Income | |||
| <$15,000 | 50.0 | 41.7 | 0.43 |
| Between $15,000 and $30,000 | 32.1 | 37.5 | 0.68 |
| >$30,000 | 17.9 | 20.8 | 0.80 |
| Support Available for Tasks | 88.5 | 93.2 | 0.39 |
| Support Available for As Long As Needed | 83.6 | 90.2 | 0.41 |
| Smoker at Time of Stroke | 7.4 | 12.2 | 0.49 |
| Ambulation Ability (0-100)b | 83.2 | 65.8 | 0.003 |
| Activities of Daily Living Index (0-18)b | 17.2 | 14.6 | <0.001 |
| Instrumental Activities of Daily Living Index (0-21)b | 19.0 | 15.1 | <0.001 |
| Social/Role Index (0-24)b | 21.6 | 18.1 | 0.01 |
| Global Health Rating (0-4)c | 1.8 | 2.4 | 0.005 |
| ACUTE STROKE CARE STAY | |||
| Stroke Type | |||
| Hemorrhagic | 7.5 | 7.3 | 0.99 |
| Occlusion | 75.0 | 63.6 | 0.18 |
| Other | 17.5 | 29.1 | 0.14 |
| Comorbidities | |||
| Chronic or Intermittent Atrial Fibrillation | 35.0 | 20.3 | 0.09 |
| Hypertension | 73.8 | 72.9 | 0.99 |
| Prior Stroke within Last Calendar Year | 11.3 | 11.9 | 0.99 |
| Congestive Heart Failure | 15.0 | 6.8 | 0.18 |
| Diabetes Mellitus | 27.5 | 20.3 | 0.43 |
| Myocardial Infarction | 5.0 | 5.1 | 0.99 |
| Chronic Obstructive Pulmonary Disease | 2.5 | 5.1 | 0.65 |
| Deyo Comorbidity Index (1-6) | 90.0 | 96.6 | 0.71 |
| Physical Therapy | 96.3 | 86.4 | 0.05 |
| Speech Therapy | 77.5 | 59.3 | 0.03 |
| Occupational Therapy | 75.0 | 50.8 | 0.004 |
| POST-ACUTE CARE ADMISSION | |||
| Mini-Mental Status Exam (0-30)d | 19.9 | 19.1 | 0.97 |
| Blindness | 4.0 | 1.7 | 0.63 |
| Visual Neglect | 42.9 | 30.2 | 0.19 |
| Aphasia/Severe Dysarthria | 31.3 | 45.2 | 0.12 |
| Barthel Index (0-90)b | 27.4 | 33.7 | 0.13 |
| Geriatric Depression Scale (0-15)e | 4.7 | 5.9 | 0.17 |
| UTILIZATION | |||
| Acute Stroke Hospitalization (days) | 7.5 | 6.6 | 0.43 |
| Initial PAC Length of Stay (days) | 25.8 | 33.3 | 0.39 |
| Total PAC Length of Stay (days) | 72.6 | 46.4 | <0.001 |
| FACILITY | |||
| # Medicare Stroke Admissions | 151.7 | 20.7 | <0.001 |
| # Medicare HMO Admissions | 57.7 | 24.8 | <0.001 |
| Ownership | |||
| Proprietary | 20.0 | 41.9 | 0.006 |
| Non-Profit, Religious | 26.3 | 1.6 | <0.001 |
| Non-Profit, Secular | 42.5 | 54.8 | 0.18 |
| Government | 11.3 | 1.6 | 0.04 |
| Other | 0.0 | 0.0 | 0.0 |
| Organizational Type | |||
| Freestanding | 46.3 | 50.2 | 0.40 |
| Hospital-Based | 53.8 | 45.2 | 0.40 |
| Other | 0.0 | 0.0 | 0.0 |
| Affiliation with Medical/Nursing School | 50.0 | 36.1 | 0.12 |
| Facility Chain | 46.3 | 75.4 | <0.001 |
| COMMUNITY | |||
| High IRF Use Rate | 85.0 | 41.9 | <0.001 |
| High Community Resources | 75.0 | 51.6 | 0.005 |
| Urban (SMSA) | 92.5 | 58.1 | <0.001 |
| |||
The relatively small difference between the Barthel upon admission to IRF and the initial Barthel for direct admits to SNF (27.4 vs. 33.7) may in part have been due to the lag in Barthel scores for SNF patients. Thirty-four (34) of the MDS assessments used to estimate the Barthel were five-day assessments and 26 were 14-day assessments, with an average of 11 days post-admission for the date of the SNF Barthel, in contrast to the average of two days following admission for IRF patients. Thus, SNF patients would have had an opportunity to recover function (and raise their Barthel) for about nine days or more prior to the functional assessment relative to IRF patients. The Barthel Index was almost identical upon SNF admission for the subjects admitted directly to SNFs and at the time of SNF admission following the IRF stay (33.7 vs. 34.1) based on the SNF MDS assessments. However, it was also interesting to note that between admission and discharge, the IRF Barthel increased from 27.4 to 46.2 according to the FIM functional items that were mapped to the Barthel. The reason that the discharge FIM score was so much higher than the admission SNF score is unclear, but the incentives under PPS are to downcode function at admission because higher payments are provided for IRF and SNF patients with worse functional status at time of admission. In contrast, quality review incentives exist to demonstrate improvement by the time patients are discharged and thus encourage upcoding at discharge.
Patients in the IRF>SNF group were discharged from acute hospitals to facilities with higher Medicare stroke volumes that were less likely to be for-profit. The number of patients admitted to hospital-based units vs. freestanding units was comparable in the IRF>SNF vs. direct SNF admit group. The most striking difference was that more than twice as many of the IRF>SNF patients were in communities with high IRF use rates relative to the median as compared to direct SNF patients (85 percent vs. 42 percent). The direct SNF patients were more likely to be in communities that were high in nursing home beds relative to residential care beds. Furthermore, 93 percent of IRF>SNF patients were in urban areas. These factors suggest that geographic availability played a major role in determining the PAC setting to which these patients were discharged.
D. DISCUSSION
The results of this national study of Medicare FFS PAC under PPS suggested four major findings: (1) the number of direct stroke admissions to many SNFs and HH agencies appears to have dropped in the period since PPS was implemented; (2) stroke patients are generally treated by multiple PAC providers within a 90-day episode; (3) with respect to initial PAC admission for stroke, IRFs, SNFs, and HH agencies have become more differentiated with minimal substitution across settings; and (4) potential substitution exists across certain multiple-provider combinations, particularly between IRF to HH and IRF to OP episodes, and between direct SNF and IRF to SNF episodes.
The study targeted SNFs and HH agencies with high-volumes of stroke admissions in 1999 based on secondary data and confirmed by site administrators upon recruitment in 2001. Nevertheless, relatively few stroke patients were admitted to SNFs and HH agencies in 2002-2005; less than one per month to SNFs and less than two per month to HH agencies. Of these, 34 percent of SNF patients and 52 percent of HH patients either had a prior PAC stay or were in an HMO. These data suggest that either a smaller percentage of non-HMO Medicare stroke patients are admitted directly to SNFs and HH agencies as the first PAC setting following implementation of PPS, or that these patients are less concentrated in such high-volume providers. IRFs, in contrast, admitted about five stroke patients per month on average, were the first PAC provider in 95 percent of these cases, and admitted a smaller proportion of HMO patients (about 9 percent). The modest use of IRFs by HMOs is consistent with pre-PPS findings showing that large Medicare-risk HMOs tended to use SNF care more than IRF care for older stroke patients.12Chapter 6 uses national data to elaborate on these issues for SNFs and IRFs to better understand the impact of PPS on use of institutional PAC.
The second major finding emerging from these analyses is the large proportion of multiple-provider episodes beginning with IRFs. Ninety percent (90 percent) of IRF admissions used one or more subsequent providers and while the initial PAC stay averaged 21 days in the IRF, the total PAC stay averaged 55 days -- longer than PAC stays beginning with SNF or HH. Subsequent providers were predominately HH or OP rehabilitation, but use of SNFs occurred in approximately 21 percent of admissions to IRF. Thirty percent (30 percent) of IRF patients used three or more PAC providers in 90 days. Thus, use of multiple-providers for a single PAC episode beginning with IRF was the norm, and frequently this involved three or more settings in 90 days.
The widespread use of multiple-provider episodes following per case payment for IRF care is a natural consequence of PPS. This study also found a two-day drop in mean length of stay (three-day drop in median IRF stay) in the year following PPS implementation, which is more than twice the decline in IRF stays leading up to implementation of PPS.13 Presuming that IRFs are discharging patients as rapidly as possible, the use of a second PAC provider is logical. If the IRF is owned by the same entity that owns the subsequent provider, the incentive is even stronger. This response is similar to declining acute hospital lengths of stay and the increase in the use of IRF, SNF, and HH care following implementation of the acute hospital PPS.14, 15 Although it may seem appropriate that patients receive care in each setting for only as long as a level of care is required, potential downsides exist for use of multiple-providers in a single episode. First, several studies have shown the increased risk of care problems such as medication errors during transfers from one provider to the next, because of poor communication and coordination between providers.16, 17, 18, 19 Second, the cost of treatment for the episode can be greater if Medicare makes multiple payments for different PAC providers and/or care transitions result in rehospitalizations. The daunting 170different patterns of PAC 90days following stroke for these 642patients reinforce these concerns.
The third finding suggested by these results is that under Medicare PPS further differentiation exists between direct admissions to IRFs, SNFs, and HH agencies, as the first PAC provider. SNF patients were significantly less well educated, more disabled prior to the stroke, more impaired following the stroke cognitively, physically and in speech/language, and had greater symptoms of depression. On the other end of the spectrum, HH patients were more likely to be women and were more functional with less cognitive impairment than IRF patients, although they were more similar to IRF patients than SNF patients. These differences were substantial and pervasive across a range of characteristics that were measurable by the rich primary database included in this study. In combination with the small number of Medicare FFS patients admitted directly to SNFs and HH agencies, the results suggest that the extent of substitution across IRFs, SNFs, and HH agencies may be less than prior to PPS for elderly Medicare FFS stroke patients. Unfortunately, larger secondary data studies will not be very helpful for confirming this finding in that most of these characteristics are not available in these data sets.
While less substitution may generally be the case, substitution appears to exist between multiple-provider episodes with the pattern of IRF to HH and IRF to OP. These patients had no meaningful differences in pre-morbid status and were extremely similar with respect to cognition and many functional measures following their strokes. Even total PAC length of stay was comparable across these two types of multiple-provider episodes. HH patients are expected to meet the homebound criteria, which is not the case for OP patients; this may be reflected in the modest difference in the mobility/transfer FIM item and Barthel Index, but there will most certainly be overlap in these populations given the small magnitude of these differences. One explanation for whether a patient is discharged to a HH agency or OP facility might be which of these settings the IRF owns or manages because this would be the most natural referral and would result in continued revenues to the same entity. Thus, comparison of outcomes and costs would seem appropriate for patients admitted from IRF to OP care with those admitted from IRF to HH.
Evidence was also found that the stroke patients admitted directly to SNFs were similar to patients receiving care first in an IRF and then transferred to a SNF. IRF>SNF patients were better educated and more functional prior to their stroke, but following their stroke were very similar to direct SNF admits in terms of cognition, function, speech/language, and visual symptoms. Although the sample sizes were not large and the power to detect differences was relatively modest, differences in patient characteristics were small in comparison to the extremely large differences in geographic characteristics, including IRF use rates in the community, statewide nursing home beds relative to residential care beds, and urban location. Thus, the determining factor in whether patients go directly to SNF or to an IRF and then SNF appears to be more related to availability of providers in the community and other geographic practice patterns as opposed to patient characteristics following a stroke. This implies there is substitution across geographic areas, suggesting comparisons of outcomes and costs are warranted for the subgroup of patients admitted to these two types of PAC episodes. The PAC episodes clearly differ, with total PAC length of stay much longer for the IRF>SNF group (72.6 days vs. 46.4 days).
The dominance of IRFs as the first PAC provider and the greater differentiation in patient characteristics across PAC settings when SNFs and HH agencies are used as the first provider may result from PPS as well as other factors. Under SNF PPS reimbursement, SNFs may not be willing to provide more than the minimum amount of therapy in the ultra-high and very high therapy categories.20 The Medicare reimbursement for the ultra-high categories was as much as $441 per day beginning in October 2001, but 720minutes of therapy per week are necessary to qualify. Reimbursement for the very high categories was as much as $343per day but at least 500minutes of therapy per week are required. Many stroke patients admitted from the hospital require higher levels of therapy.
For HH agencies, the per case payment includes an incentive to admit patients requiring ten or more therapy visits because of an additional payment. Although this increase is about $2,000 per case, the cost of providing many more than ten therapy visits may be difficult for the HH agency to cover with Medicare per case payment.21 Tentherapy visits are unlikely to be adequate for patients discharged from the hospital with stroke who have very significant functional disabilities like those admitted to SNFs and IRFs. In contrast, the per case payment for stroke patients in an IRF is based on a case mix index of 1.2 or greater, depending on functional status, and the payments were derived from costs that included three hours of therapy per day and the much higher cost structure of IRFs. Thus, IRFs have an incentive to admit disabled stroke patients from the hospital, which is not the case for either SNFs or HH agencies.
Other factors may also have contributed to an evolution toward admission of stroke patients directly to IRFs. Several studies in the mid-1990s showed better outcomes for stroke patients admitted to IRFs than SNFs, albeit at substantially higher cost.22, 23, 24, 25, 26 This evidence may have influenced providers to refer stroke victims to IRFs whenever possible despite higher costs in order to maximize both short- and long-term outcomes. Furthermore, the number of IRFs has increased from 1,001 to 1,206 (20 percent) in the last decade, which has increased the availability of IRF beds. With improved access to IRFs, higher payment rates in IRFs, and these outcome findings, patients with the greatest rehabilitation potential may be more likely to be admitted to IRFs.
In conclusion, during the period after PPS, the number of stroke patients admitted to previously high-volume SNFs and HH agencies appears to have declined. SNFs and HH agencies appear to treat a more circumscribed population and play a major role as subsequent providers along with OP care. IRFs have responded to the per discharge PPS by shortening stays and discharging to other PAC settings. These findings raise important questions regarding the impact of these changes on quality and costs of care for Medicare beneficiaries in the PPS era.
| FIGURE 4.1: Patterns of Post-Acute Care for Stroke Victims Following Discharge from Acute Hospital and Admission to Inpatient Rehabilitation Facility (n=528) |
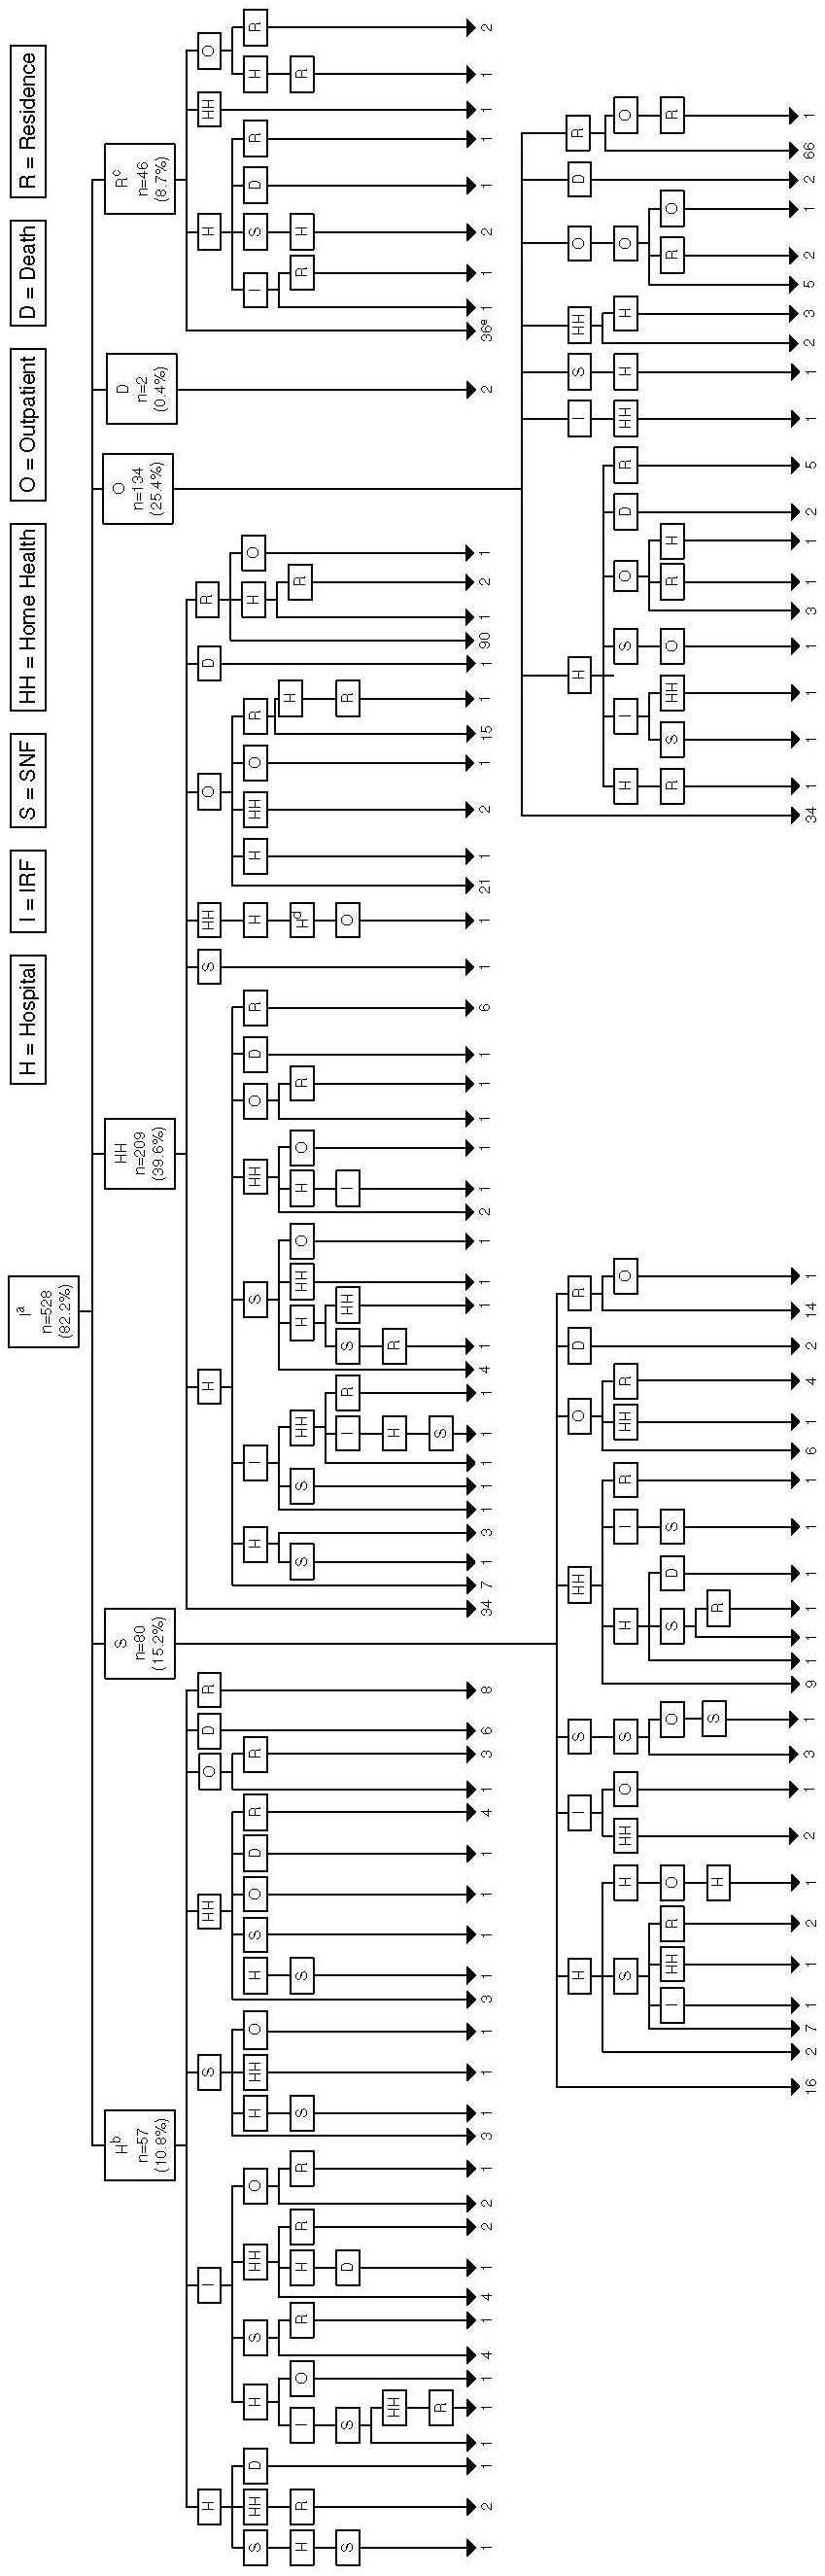 |
|
| FIGURE 4.2: Patterns of Post-Acute Care for Stroke Victims Following Discharge from Acute Hospital and Admission to Nursing Home (n=59) |
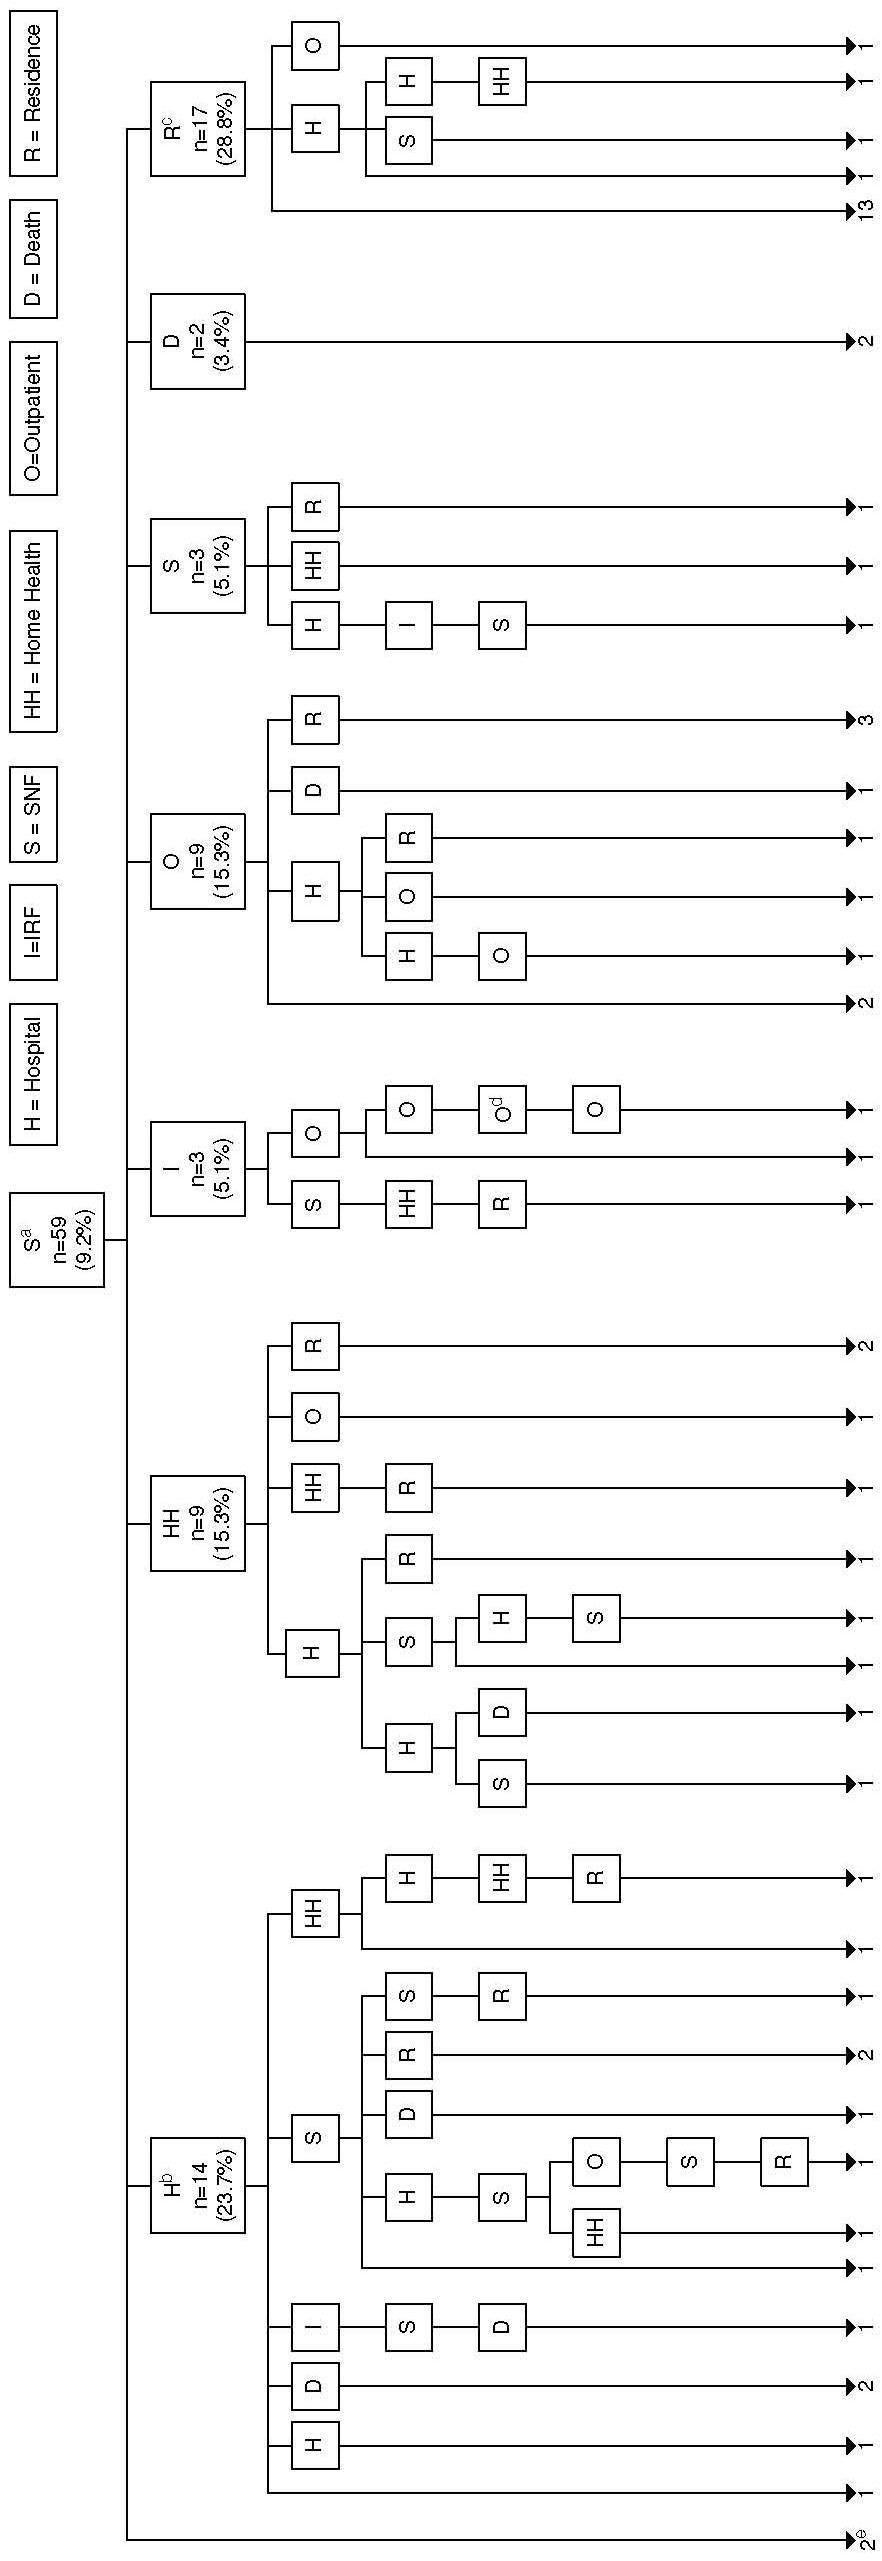 |
|
| FIGURE 4.3: Patterns of Post-Acute Care for Stroke Victims Following Discharge from Acute Hospital and Admission to Home Health (n=55) |
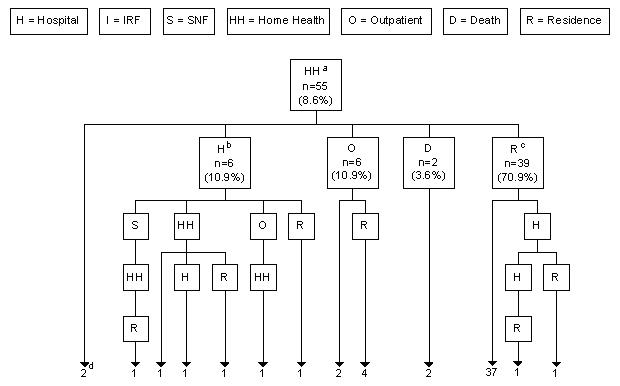 |
|
E. REFERENCE LIST
- DataPRO Team. Skilled nursing facilities prospective payment system findings from RUG trend analysis: summary and selected figures. Report II. CMS Contract #500-99-C001, Attachment J-19. 2001.
- General Accounting Office. Skilled nursing facilities: providers have responded to Medicare payment system by changing practices. GAO-02-841. 2002. Washington, DC.
- Kramer AM, Eilertson TB, Ecord MK, Morrison M. Prospective payment for skilled nursing facilities: indicators for subacute skilled nursing care. 1997. Denver, CO: University of Colorado Health Sciences Center.
- Kramer AM, Shaughnessy PW, Pettigrew ML. Cost-effectiveness implications based on a comparison of nursing home and home health case mix. Health Serv Res 1985; 20(4): 387-405.
- Liu K, Wissoker D, Rimes C. Determinants and costs of post-acute care use of Medicare SNFs and HHAs. Inquiry 1998; 35(1): 49-61.
- Neu CR, Harrison SC, Heilbrunn JZ. Medicare patients and postacute care: who goes where? 1989; 1-83. Santa Monica, CA: The RAND Corporation.
- Gage B. Impact of the BBA on post-acute utilization. Health Care Financing Review 1999; 20(4): 103.
- Deyo RA, Cherkin DC, Ciol MA. Adapting a clinical comorbidity index for use with ICD-9-CM administrative databases. J Clin Epidemiol 1992; 45(6): 613-619.
- Folstein MF, Folstein SE, McHugh PR. Mini-Mental State: a practical method for grading the cognitive state of patients for the clinician. J Psychiatr Res 1975; 12(3): 189-198.
- Morris JN, Fries BE, Mehr DR, Hawes C, Phillips C, Mor V, et al. MDS cognitive performance scale. Journals of Gerontology Series A: Biological Sciences and Medical Sciences 1994; 49(4): M174-M182.
- Yesavage JA, Brink TL, Rose TL, Lum O, Huang V, Adey M, et al. Development and validation of a geriatric depression screening scale: a preliminary report. J Psychiatr Res 1983; 17(1): 37-49.
- Kramer AM, Kowalsky JC, Lin M, Grigsby J, Hughes R, Steiner JF. Outcome and utilization differences for older persons with stroke in HMO and fee-for-service systems. Journal of the American Geriatrics Society 2000; 48: 726-734.
- Ottenbacher KJ, Smith PM, Illig SB, Linn RT, Ostir GV, Granger CV. Trends in length of stay, living setting, functional outcome, and mortality following medical rehabilitation. Journal of the American Medical Association 2004; 292(14): 1687-1695.
- Medicare Payment Advisory Commission. Report to Congress. Context for a changing Medicare program: hospitalization and post-acute care utilization. 1998; 87-104.
- Manton KG, Woodbury MA, Vertrees JC, Stallard E. Use of Medicare services before and after introduction of the prospective payment system. Health Serv Res 1993; 28(3): 269-292.
- Coleman EA. Falling through the cracks: challenges and opportunities for improving transitional care for persons with continuous complex care needs. J Am Geriatr Soc 2003; 51(4): 549-555.
- Forster AJ, Murff HJ, Peterson JF, Gandhi TK, Bates DW. The incidence and severity of adverse events affecting patients after discharge from the hospital. Ann Intern Med 203; 138(161): 167.
- Institute of Medicine. Crossing the quality chasm: a new health system of the twenty-first century. Washington, DC: National Academy Press, 2001.
- Moore C, Wisnivesky J, Williams S, McGinn T. Medical errors related to discontinuity of care from an inpatient to an outpatient setting. Journal of General Internal Medicine 2003; 18: 646-651.
- General Accounting Office. Skilled nursing facilities: providers have responded to Medicare payment system by changing practices. GAO-02-841. 2002. Washington, DC.
- Medicare Payment Advisory Commission. Report to the Congress: issues in the modernized Medicare program. Chapter 5: Payment for post-acute care. 2005.
- Kramer AM, Eilertson TB, Ecord MK, Morrison M. Prospective payment for skilled nursing facilities: indicators for subacute skilled nursing care. 1997. Denver, CO: University of Colorado Health Sciences Center.
- Chen Q, Kane RL, Finch MD. The cost-effectiveness of post-acute care for elderly Medicare beneficiaries. Inquiry 2000; 37: 359-375.
- Kane RL, Chen Q, Finch M, Blewett L, Burns R, Moskowitz M. Functional outcomes of posthospital care for stroke and hip fracture patients under Medicare. J Am Geriatr Soc 1998; 46: 1525-1533.
- Keith RA, Wilson DB, Gutierrez P. Acute and subacute rehabilitation for stroke: a comparison. Archives of Physical Medicine and Rehabilitation 1995; 76(6): 495-500.
- Kramer AM, Steiner JF, Schlenker RE, Eilertsen TB, Hrincevich CA, Tropea DA, et al. Outcomes and costs after hip fracture and stroke: a comparison of rehabilitation settings. Journal of the American Medical Association 1997; 277(5): 396-404.
5. OUTCOMES AND COSTS OF POST-ACUTE CARE FOR STROKE PATIENTS
A. INTRODUCTION
The effectiveness of rehabilitation in different PAC settings, including IRFs, SNFs, and HH agencies, is of major interest because of the substantial differences in Medicare costs for different provider settings and the potential resulting disability for patients who are not rehabilitated in the period following an acute event. In the 1990s, prior to implementation of PPSs for PAC, research suggested that outcomes such as community residence, functional improvement, and mortality were generally better for stroke patients discharged to IRFs relative to SNFs, but at substantially greater cost.1, 2, 3 Outcomes for stroke patients discharged to home were found to be better than all other options in one study.4 These studies relied on geographic variation to conduct natural experiments5 using various methods to control for selection differences, which in some cases were very large. All of these studies were conducted more than a decade ago -- prior to implementation of PPSs for PAC -- and took into consideration only the initial PAC provider following hospitalization, even for episodes involving multiple-providers.
With the advent of a PPS for SNFs that was implemented in 1998, for HH agencies that was implemented in 2000, and for IRFs that was implemented in 2002 under the Balanced Budget Act of 1997, substantial changes in utilization patterns, rehabilitation costs, and outcomes are entirely possible. The IRF PPS rate is per discharge based on the patients condition (e.g., diagnosis, function), the HH PPS rate is for a 60-day episode based on patient condition and therapy services, and the SNF per diem rate is based on patient condition and provision of therapy and skilled services. In August 2000, an OP PPS was implemented on a fee schedule, setting rates for individual services and procedures. The PPSs were designed to reduce the rapid growth in Medicare PAC expenditures that occurred during the late 1980s and 1990s. The incentive under the IRF PPS is to shorten length of stays, under the HH PPS is to reduce numbers of HH visits, and under the SNF PPS is to minimize services within payment groups. The costs and outcomes following implementation of these wholesale changes in Medicare reimbursement, which could be substantial, have not been previously studied for any conditions.
Several findings related to patterns of PAC following implementation of PPS have implications for costs and outcomes (Chapter 4). First, PAC involved multiple-providers in the first 90 days for about 90 percent of IRF admissions and about two-thirds of SNF admissions. About 60 percent of IRF patients used two PAC providers and 30 percent used three or more PAC providers in 90 days; the most prevalent combinations were IRF to OP and IRF to HH.
Second, substantial differentiation was found among stroke patients discharged directly to IRFs, SNFs, and HH agencies in the post-PPS era. SNF patients less well educated; were substantially more disabled prior to the stroke; were more impaired cognitively, physically, and in speech/language following their stroke; and had greater symptoms of depression. SNF patients were also more likely to be admitted from nursing homes or be comatose (both of whom were excluded from the study). HH patients, while more similar to IRF patients in some areas, were more likely to be women and were more functional and less cognitively impaired than IRF patients. These results suggested that the extent of overall substitution across settings may have been diminished under PPS.
Nevertheless, stroke patients admitted directly to SNFs were relatively similar to stroke patients admitted to SNF following an IRF stay. The greatest differences were in community characteristics such as IRF use rates, nursing home beds, and urban vs. rural location. These patients differed quite substantially from patients discharged from IRF to HH or to OP care with respect to greater cognitive impairment, greater visual neglect, more aphasia, and greater functional impairment following their stroke. In addition, relatively modest differences were found between patients discharged from IRF to HH and those discharged from IRF to OP care, suggesting substitution may also exist between those patient groups.
The purpose of this analysis is three fold. First, we describe outcome and cost patterns for stroke patients discharged to different post-acute settings and multiple-provider episodes. Second, we compare outcomes and costs between episodes of IRF followed by OP care and those involving IRF followed by HH care. Third, we compare outcomes and costs between direct admissions to SNF and patients admitted to IRF and then SNF.
B. METHODS
1. Subjects
The subjects of this study, as described in Chapter 2, consisted of 555 patients admitted directly to IRF, 62 patients admitted directly to SNF, and 57 patients admitted directly to HH. The IRF to HH group included 209 patients, the IRF to OP group included 134 patients, and the IRF>SNF group contained 80 patients. Patients with these multiple-provider episodes may have received care in additional PAC providers as part of the PAC episode.
Outcome Measures: Fivecategories of outcomes were analyzed: (1) location at 90days, (2) functional loss, (3) functional recovery, (4) self-reported health, and (5) satisfaction. These measures are defined in Chapter 2 (Table 2.4), with more detail on the properties of the functional measures (Categories 2 and 3) in Chapter 3. All of these outcome measures were based on primary data collected on admission to PAC (pertaining to the period before the stroke, or baseline) and at 90 days post-PAC admission.
In summary, location at 90 days represents the subjects residence at 90 days where he/she was reached for the 90-day follow-up interview. "Equally independent setting" is a summary variable for change in location, yielding the percent of subjects who were residing in an equivalent setting with respect to provided assistance at 90 days relative to baseline (more details in Chapter 2). The functional outcome variables are measures of change between the period prior to stroke (baseline) and 90 days following stroke. Functional loss represents the difference between the 90-day value and the baseline value for scales of ADL, IADL, ambulation, and social/role functioning. Higher numbers, therefore, represent greater loss in function. Functional recovery denotes the percentage of patients who recovered to their baseline functional level in each function by 90 days. A similar recovery scale was included for recovery on a five-point Likert scale related to self-reported health. Satisfaction measures were collected only at one point in time (90 days), reflecting patient/proxy satisfaction with the PAC episode rated on a four-point Likert scale with "1" denoting dissatisfied and "4" denoting extremely satisfied.
- Cost and Utilization Measures: After combining claims information from all sources, several cost and utilization measures were created for comparison among settings (Table 2.5). PAC costs were computed for the period beginning with the first PAC provider until the end of the PAC stay (defined as a break of 30 days in PAC services; or a discharge to residence without rehospitalization or a death in threedays; or a death or hospitalization from a PAC setting; or 90days). PAC costs also included costs for PAC services and carrier costs such as DME or physician supplier. All service costs for 90days, however, included all costs over 90days from admission to PAC (e.g., PAC, hospital, labs). Cost variables were calculated on a per-episode basis and a per-day basis. Per-episode costs summed the costs across the entire period, whereas per-day costs divided the per-episode costs by the number of days in the period. We estimated mean total costs, and also calculated the mean Medicare component and the mean beneficiary component costs. For some comparisons, we broke out costs into the various provider costs (e.g., IRF, acute hospital) and also examined utilization. Utilization variables included days (IRF days, hospital days) and visits (HH visits, OP therapy visits). All of this information was obtained from claims.
2. Analysis
- Bivariate Comparisons: All outcomes and costs were compared between pairs of PAC settings using the most appropriate bivariate method for the type of variable: t-tests for continuous normally distributed variables, Mann-Whitney for non-normally distributed variables, and Chi-square tests (Fishers Exact test for small sample size comparisons) for dichotomous variables. Setting comparisons were patterned after those performed on patient characteristics in Chapter 4. Initial setting comparisons examined each pair of primary settings, IRF vs. SNF, SNF vs. HH, and IRF vs. HH. Within the group of IRF patients, the subsequent settings were also compared. A subsequent setting was defined as the setting to which a patient was transferred from the IRF. Fourpossible transfers occurred: (1) IRF>SNF, (2) IRF>HH, (3) IRF>OP, and (4) IRF>residence. We also compared patients who were discharged directly to SNF with patients in the IRF>SNF group.
- Multivariate Models: Based on the bivariate comparisons, we targeted further analysis on the episodes with the largest sample of patients where substitution seemed likely to occur: IRF>HH vs. IRF>OP. Sample sizes were too small for multivariate modeling in the SNF vs. IRF>SNF comparisons. Regression models were estimated to control for case mix differences between treatment settings while assessing relationships between setting and cost and outcome measures. The effect of OP vs. HH care for this group of patients was determined using a dichotomous variable for subsequent OP care vs. HH. Ordinary least squares regression was used for continuous functional recovery measures and costs, whereas logistic regression was performed on dichotomous functional recovery variables and utilization variables. Many models were tested using different covariates, but we report the meaningful and consistent findings that emerged. For example, regression models for functional loss supported the functional recovery models that we report.
We designed the covariate selection process with the goal of deriving outcome and cost models that incorporated the most influential case mix variables but limited the number of covariates in deference to sample size considerations. A correlation matrix of the outcome and cost measures against all of the potential covariates in our data was produced (enumerated in Table 2.6). Factors with strong univariate relationships to outcomes and/or the cost of treatment were selected based on variable reduction activities taking into account clinical considerations and differences between the groups being compared. Table 2.6 presents definitions for the variables that were considered for the models. In the final models presented in the Results section, we removed variables that did not improve the model fit.
C. RESULTS
1. Outcomes and Costs for Stroke Patients Based on Initial Discharge Location
Outcomes: Unadjusted outcome results generally followed the pattern that would be expected given the case mix differences presented in Chapter 4 (Table 5.1). Over one-third of discharges to SNF were residing in a nursing home at 90 days, reflecting their high rate of post-stroke functional and cognitive impairment; in contrast, about 13 percent of IRF patients, who had less cognitive impairment and less pre and post-stroke disability, resided in a nursing home at 90 days. No HH patients were residing in a nursing home at 90 days, consistent with the lack of significant cognitive impairment and ADL impairment following their stroke. Changes in location to more dependent settings (e.g., from assisted living to nursing home; from home alone to with friend or relative) followed this same pattern, such that most HH patients (98 percent) and fewest SNF patients (41 percent) were residing in an equally independent setting at 90 days. The higher mortality rate among SNF patients was also consistent with signs of stroke severity including aphasia/dysarthria, and greater cognitive and functional impairments.
Lack of functional recovery between the pre-stroke period and 90 days was substantial, with less than half of patients recovering their pre-stroke functional status on average in ADLs, IADLs, and social/role function and slightly more than half recovering in ambulation. SNF patients were least likely to recover in all domains relative to HH, but not significantly less than IRF patients (Table 5.1). HH patients also were more likely to recover their pre-stroke function than IRF patients in IADLs and ambulation. These findings were highly consistent with the types of patients who were admitted directly to HH -- those with more modest post-stroke rates of cognitive, speech, and functional impairment.
The impact of stroke was also apparent from the self-reported health recovery in the range of 60 percent, suggesting that two out of every five patients with stroke experienced a decline in their global health, even at 90 days. This was further supported by the satisfaction with recovery score of 2.1-2.3 out of four, reflecting a rating of satisfied, which is low for satisfaction measures. The satisfaction with care scores generally reflected 3-very satisfied across the different settings, with somewhat higher levels of satisfaction for individual aspects of care. Satisfaction measures so often cluster at the very high end of a scale (e.g., extremely satisfied) that we would expect at least ratings of 3. Overall satisfaction with care and satisfaction with instruction and training were somewhat less for SNF patients than IRF patients.
- Costs: Total PAC costs per episode and Medicare payments were substantially higher for patients admitted to IRFs than SNFs (Table 5.2), resulting from both the cost of IRFs and the use of subsequent PAC providers. PAC episode costs included all the costs of subsequent PAC providers until the point where no further PAC was being received by the beneficiary, which was longer for IRF than SNF episodes as previously reported (55.2 vs. 46.2 days, respectively). Direct admits to HHs, not surprisingly, had the lowest cost to Medicare because HH care is less intense, was shorter in duration (36.7 days), and does not include room and board costs. The cost to beneficiaries was highest in SNFs because of the large copayments in SNFs after the 20th day. All service costs for the 90 days followed a similar pattern of differences; however, the addition of hospital and other costs increased costs for all provider types, particularly for frail SNF patients who were more likely to use these additional services.
| TABLE 5.1: Outcomes of Stroke Patients Discharged to IRFs, SNFs, and HH Agencies | ||||
| Outcomes | IRFa n=555 | SNFa n=62 | HHa n=57 | Significanceb,c,d |
| Location at 90 Days | ||||
| Home | 62.1 | 21.8 | 76.8 | b, c, d |
| Friend/Relative Home | 8.2 | 7.3 | 8.9 | |
| Nursing Home | 13.2 | 36.4 | 0.0 | b, c, d |
| Assisted Living | 5.8 | 7.3 | 5.4 | |
| Died | 5.6 | 16.4 | 3.6 | b, d |
| Hospital | 3.6 | 5.5 | 0.0 | |
| Other | 1.6 | 5.5 | 5.4 | |
| Equally Independent Setting | 78.6 | 41.2 | 97.7 | b, c, d |
| Functional Loss (Mean) | ||||
| Activities of Daily Living (0-18) | 2.9 | 5.0 | 1.7 | b, c, d |
| Instrumental Activities of Daily Living (0-21) | 5.6 | 6.7 | 2.2 | c, d |
| Ambulation Ability (0-100) | 18.3 | 18.6 | 3.9 | c |
| Social/Role Index (0-24) | 3.8 | 5.2 | 1.8 | c, d |
| Functional Recovery | ||||
| Activities of Daily Living | 40.6 | 28.9 | 54.0 | d |
| Instrumental Activities of Daily Living | 27.5 | 16.7 | 52.1 | c, d |
| Ambulation Ability | 55.4 | 44.0 | 73.8 | c, d |
| Social/Role Index | 37.4 | 23.7 | 49.0 | d |
| Self-Reported Health Recovery | 57.3 | 63.2 | 63.5 | |
| Satisfaction (Mean) | ||||
| Satisfaction with Recovery (1-4) | 2.3 | 2.1 | 2.3 | |
| Satisfaction with Care (1-4) | 3.0 | 2.7 | 2.8 | b |
| Participate in Goal Setting (%) | 82.7 | 77.5 | 70.6 | |
| Goals/Progress Explained (1-4) | 3.5 | 3.4 | 3.4 | |
| Instruction/Training (1-4) | 3.5 | 3.3 | 3.6 | b, d |
| Discharge Preparation (1-4) | 3.1 | 2.8 | 3.2 | |
| Family Preparation (1-4) | 3.6 | 3.4 | 3.6 | |
| ||||
| TABLE 5.2: Costs of Stroke Patients Discharged Directly to IRFs, SNFs, and HH Agencies | ||||
| Costs | IRFa n=522 | SNFa n=58 | HHa n=55 | Significanceb,c,d |
| Post-Acute Care Costs | ||||
| Per Episode: | ||||
| Total | 26,024 | 14,516 | 3,280 | b, c, d |
| Medicare | 25,370 | 12,626 | 3,170 | b, c, d |
| Beneficiary | 641 | 1890 | 60 | b, c, d |
| Per Day: | ||||
| Total | 594 | 323 | 106 | b, c, d |
| Medicare | 583 | 287 | 103 | b, c, d |
| Beneficiary | 10 | 36 | 1 | b, c, d |
| All Services Costs for 90 Days | ||||
| Per Episode: | ||||
| Total | 32,095 | 23,288 | 5,666 | b, c, d |
| Medicare | 31,110 | 20,596 | 5,440 | b, c, d |
| Beneficiary | 972 | 2692 | 174 | b, c, d |
| Per Day: | ||||
| Total | 357 | 259 | 63 | b, c, d |
| Medicare | 346 | 229 | 60 | b, c, d |
| Beneficiary | 11 | 30 | 2 | b, c, d |
| ||||
2. Outcomes and Costs for Stroke Patients Discharged to IRFs by Subsequent Care Provider
| TABLE 5.3: Outcomes of Stroke Patients Discharged to IRFs by Subsequent Provider | |||||
| Outcomes | SNFa n=80 | HHa n=209 | OPa n=134 | RESa n=46 | Significanceb,c,d,e,f,g |
| Location at 90 Days (%) | |||||
| Home | 20.0 | 69.5 | 79.5 | 65.9 | b, c, d |
| Friend/Relative Home | 5.7 | 10.2 | 7.4 | 12.2 | |
| Nursing Home | 54.3 | 5.3 | 3.3 | 2.4 | b, c, d |
| Assisted Living | 5.7 | 7.0 | 3.3 | 9.8 | |
| Died | 5.7 | 1.6 | 3.3 | 4.9 | |
| Hospital | 7.1 | 3.7 | 3.3 | 0.0 | |
| Other | 1.4 | 2.7 | 0.0 | 4.9 | |
| Equally Independent Setting | 23.6 | 89.2 | 93.3 | 87.1 | b, c, d |
| Functional Loss (Mean) | |||||
| Activities of Daily Living (0-18) | 5.9 | 2.8 | 1.7 | .6 | b, c, d, e, f |
| Instrumental Activities of Daily Living (0-21) | 11.0 | 5.5 | 3.7 | 2.6 | b, c, d, e, f |
| Ambulation Ability (0-100) | 41.8 | 20.1 | 10.7 | 6.1 | b, c, d, e |
| Social/Role Index (0-24) | 7.0 | 4.1 | 2.6 | .5 | b, c, d, f, g |
| Recovered to Pre-Stroke Function (%) | |||||
| Activities of Daily Living | 19.6 | 37.9 | 50.9 | 61.5 | b, c, d, e, f |
| Instrumental Activities of Daily Living | 5.9 | 23.5 | 39.5 | 43.2 | b ,c, d, e, f |
| Ambulation Ability | 31.7 | 50.0 | 70.0 | 58.3 | b, c, d, e |
| Social/Role Index | 24.5 | 35.4 | 41.7 | 59.0 | c, d, f |
| Self-Reported Health Recovery (%) | 53.6 | 54.5 | 60.3 | 51.3 | |
| Satisfaction (Mean) | |||||
| Satisfaction with Recovery (1-4) | 1.9 | 2.0 | 2.5 | 2.7 | c, d, e, f |
| Satisfaction with Care (1-4) | 3.0 | 3.0 | 3.1 | 3.1 | |
| Participate in Goal Setting (%) | 90.2 | 82.9 | 82.9 | 81.1 | |
| Goals/Progress Explained (1-4) | 3.6 | 3.4 | 3.5 | 3.5 | |
| Instruction/Training (1-4) | 3.5 | 3.5 | 3.6 | 3.5 | |
| Discharge Preparation (1-4) | 2.3 | 3.1 | 3.3 | 3.4 | b, c, d, e |
| Family Preparation (1-4) | 3.0 | 3.7 | 3.7 | 3.8 | b, c, d |
| |||||
Outcomes: About half of patients who went from IRF to SNF were still located in a nursing home at 90 days, which was substantially higher than the rate of nursing home placement for other types of multiple-provider episodes starting with IRF (Table 5.3). Residence in an equally independent setting at 90 days occurred for about 90 percent of IRF patients discharged to HH, OP, and residence in contrast to 24 percent of those admitted to IRF then SNF. These differences were highly consistent with post-stroke differences reported in Chapter 4 in which IRF>SNF patients had greater post-stroke cognitive impairment, visual neglect symptoms, speech impairments, and functional impairments. Relative to other combined episodes, IRF>SNF patients also experienced greater functional losses and were less likely to recover pre-stroke function in ADLs, IADLs, ambulation, and social/role functioning. IRF>SNF patients were also less satisfied with discharge and family preparations, which probably reflected on the SNF discharge, but may have been influenced by the multiple transitions.
Relative to patients admitted to OP therapy from IRFs, patients receiving HH following their IRF stay had greater functional losses and lower rates of recovery in ADLs, IADLS, and ambulation. These differences might be attributed to the modest case mix differences in the Barthel Index or the mobility/transfer subscale of FIM noted in Chapter 4. However, following risk adjustment for factors associated with the outcomes of IADL, ambulation, and ADL recovery, and those that differed between the groups, patients admitted to OP care had significantly higher odds of recovery than patients admitted to HH agencies following the IRF admission (Table 5.4, Table 5.5, and Table 5.6, respectively). When the FIM scale was substituted for the Barthel Index (they were collinear and therefore could not be used in the same model), the model fit and the significance of the differences did not change. Thus, patients admitted to OP therapy following an IRF stay appeared to have greater recovery in the domains of IADL and ambulation (borderline significance in ADL) than those admitted to HH following IRF, even after controlling for patient differences in demographics, function, cognition, and selected stroke and provider characteristics. Similar results were found after using regression to adjust the functional loss variables in these domains.
Costs: During the PAC episode, total, Medicare, and beneficiary costs all differed significantly among the fourdifferent types of episodes beginning with IRF (Table 5.7). For total and Medicare costs, patients admitted to SNFs following IRF had the highest cost, followed by those admitted to HH, then OP, with the lowest cost per episode for the IRF>RES group. SNF services, which require the highest copayments, resulted in the highest beneficiary costs. OP therapy copayments resulted in higher beneficiary costs for IRF>OP patients in contrast to IRF>HH patients (as no copayment is required for HH care).
PAC costs per episode and 90-day all service costs differed significantly between IRF>HH and IRF>OP patients after adjustment for patient and facility characteristics associated with cost and/or differences between these patient groups (Table 5.8). Total cost per PAC episode was $2,202 higher for IRF>HH patients after risk adjustment relative to IRF>OP (p=0.003), and total cost per 90 days was $5,211 higher for IRF>HH patients relative to IRF>OP (p=0.001). These models explained a large amount of the variation in cost (R2=0.67 and 0.37, respectively), and were not sensitive to using different functional measures (e.g., FIM) in the model, for example. Thus, these cost differences appear to exist independently of case mix and facility characteristics.
Table 5.9 provides profiles of Medicare cost categories and utilization over the 90-day period for the IRF>HH and IRF>OP groups. IRF costs were somewhat higher for patients going to HH in contrast to OP settings, consistent with the difference in IRF length of stay. The HH group averaged about 28 HH visits at a higher cost to Medicare ($3,879) than the 45 OP visits in the OP group ($1,689). IRF>HH patients also received an average of ten OP visits, which must have occurred subsequent to HH care, and OPs received more than one HH visit, which must have occurred subsequent to OP care. However, the HH group only received a sum of 21 therapy visits (17 HH and four OP) in contrast to 40 in the OP group (39 OP and one HH). In other utilization, the HH group averaged more hospital days (2.0 vs. 0.5 days), a higher hospitalization rate (21 percent vs. 15 percent), and higher hospital costs. Thus, the total cost per stay difference resulted largely from IRF costs, the higher cost of HH care relative to OP care, and the additional hospitalization costs for IRF>HH patients.
| TABLE 5.4: Likelihood of Recovery in IADLs for Patients Admitted to Outpatient Following IRF (n=244) | ||
| Odds Ratio | Significance | |
| Age | 0.98 | 0.28 |
| Caucasian | 0.87 | 0.81 |
| Gender | 0.75 | 0.36 |
| Education Level | 0.92 | 0.11 |
| Pre-stroke IADL | 0.89 | 0.06 |
| MMSE | 1.10 | 0.01 |
| Barthel Index | 1.03 | 0.001 |
| Government | 0.22 | 0.01 |
| Home Health vs. Outpatient | 2.00 | 0.02 |
| C-statistic 0.75 | ||
| TABLE 5.5: Likelihood of Recovery in Ambulation for Patients Admitted to HH Following IRF (n=237) | ||
| Odds Ratio | Significance | |
| Age | 0.98 | 0.43 |
| Caucasian | 1.75 | 0.24 |
| Gender | 0.98 | 0.93 |
| Education Level | 1.02 | 0.65 |
| Pre-stroke Walking | 1.00 | 0.93 |
| MMSE | 1.02 | 0.36 |
| Barthel Index | 1.02 | 0.01 |
| Home Health vs. Outpatient | 2.27 | 0.005 |
| C-statistic 0.69 | ||
| TABLE 5.6: Likelihood of Recovery in ADLs for Patients Admitted to Outpatient Following IRF (n=252) | ||
| Odds Ratio | Significance | |
| Age | 1.02 | 0.30 |
| Caucasian | 1.74 | 0.29 |
| Gender | 0.60 | 0.07 |
| Education Level | 1.02 | 0.67 |
| Pre-stroke ADL | 0.79 | 0.02 |
| MMSE | 1.04 | 0.09 |
| Barthel Index | 1.03 | <0.001 |
| Government | 0.59 | 0.21 |
| Home Health vs. Outpatient | 1.70 | 0.07 |
| C-statistic 0.74 | ||
| TABLE 5.7: Costs of Stroke Patients Discharged to IRFs by Subsequent PAC Setting | |||||
| Costs | SNFa n=79 | HHa n=206 | OPa n=134 | RESa n=45 | Significanceb,c,d,e,f,g |
| Post-Acute Care Costs | |||||
| Per Episode: | |||||
| Total | 41,642 | 26,258 | 22,637 | 18,184 | b, c, d, e, f, g |
| Medicare | 38,956 | 26,081 | 22,054 | 18,009 | b, c, d, e, f, g |
| Beneficiary | 2,686 | 177 | 571 | 61 | b, c, d, e, f, g |
| Per Day: | |||||
| Total | 578 | 468 | 401 | 1201 | b, c, d, e, f, g |
| Medicare | 544 | 465 | 392 | 1179 | b, c, d, e, f, g |
| Beneficiary | 34 | 3 | 9 | 6 | b, c, d, e, f, g |
| All Services Costs for 90 Days | |||||
| Per Episode: | |||||
| Total | 45,400 | 30,777 | 24,228 | 23,312 | b, c, d, e, f |
| Medicare | 42,135 | 30,398 | 23,600 | 22,924 | b, c, d, e, f |
| Beneficiary | 3,265 | 378 | 616 | 274 | b, c, d, e, g |
| Per Day: | |||||
| Total | 504 | 342 | 269 | 259 | b, c, d, e, f |
| Medicare | 468 | 338 | 262 | 255 | b, c, d, e, f |
| Beneficiary | 36 | 4 | 7 | 3 | b, c, d, e, g |
| |||||
| TABLE 5.8: Cost Difference for PAC Episode and 90 Days Between Patients Receiving HH vs. OP Care Following IRF | ||||
| PAC Cost | 90-Day Cost | |||
| Estimate | Significance | Estimate | Significance | |
| Age | -182 | 0.001 | -199 | 0.06 |
| Caucasian | 2,558 | 0.03 | 2,479 | 0.29 |
| Gender | 117 | 0.87 | -1,390 | 0.34 |
| Pre-stroke ADL | 282 | 0.19 | 661 | 0.12 |
| CHF | 2,066 | 0.05 | 5,002 | 0.01 |
| MMSE | -48 | 0.41 | -189 | 0.10 |
| Barthel Index | -386 | <0.001 | -384 | <0.001 |
| Acute Hospital LOS | 282 | 0.001 | 280 | 0.09 |
| Freestanding | -1,429 | 0.07 | -1,004 | 0.53 |
| Urban | 1,047 | 0.51 | 3,907 | 0.21 |
| Government | 984 | 0.38 | 728 | 0.74 |
| Home Health vs. Outpatient | -2,202 | 0.003 | -5,211 | <0.001 |
| R2= | 0.64 | 0.37 | ||
| TABLE 5.9: Medicare Cost and Utilization Profiles in 90 days for IRF-HH and IRF-OP Patients | |||
| HH (n=209) | OP (n=134) | Significance | |
| Costs | |||
| IRF | 20,968 | 18,799 | p=0.02 |
| HH | 3,879 | 156 | p<0.001 |
| OP | 359 | 1,689 | p<0.001 |
| Hosp | 2,508 | 745 | p=0.01 |
| Other (physician, lab, DME) | 2,133 | 1,941 | p=0.2 |
| Utilization | |||
| IRF Days | 22.2 | 19.4 | p=0.01 |
| HH (all 6 disc) | 27.7 | 1.6 | p<0.001 |
| HH Therapy Visits | 17.0 | 1.0 | p<0.001 |
| OP Visits | 10.4 | 44.6 | p<0.001 |
| OP Therapy Visits | 4.2 | 39.0 | p<0.001 |
| Hospital Days | 2.0 | 0.5 | p<0.001 |
3. Outcomes and Costs of Direct Discharge to SNF Compared to IRF>SNF Episodes
Outcomes: At 90days, rates of residing in the patient's private home, the home of a friend or relative, and assisted living were comparable between patients receiving care in an IRF>SNF episode vs. direct discharges to SNFs (Table 5.10). Although IRF>SNF patients had a higher rate of nursing home placement, this was offset by a higher death rate in the direct discharge to SNF group, suggesting that the somewhat more frail SNF patients died before 90days in the nursing home. The higher rate of direct SNF discharges residing in an equally independent setting was most likely the result of the higher mortality rate for direct SNF discharges, because deaths were excluded from this variable. When we recoded deaths as residing in the nursing home, a combined outcome variable, then the rate of nursing home residence and equally independent settings was very similar between the two groups. While we can't be sure with the small numbers and the differences in mortality rates, the evidence suggests that the IRF>SNF group and the direct discharge to SNF group had comparable location outcomes.
The selection bias with the significantly higher mortality rate among direct discharges to SNF also influenced the functional outcome variables, where deaths were by necessity excluded. The result was that the greater mean IADL functional loss in the IRF>SNF group may have resulted from the fact that patients with the greatest functional losses in the direct SNF discharge group died by 90 days. Similarly, the higher mean loss in ambulation in the IRF>SNF group may have resulted because the direct SNF discharge group patients with the greatest loss in ambulation ability also died. When we combined the death outcome with the functional loss outcome such that all deaths were rated "0" on the functional scale at 90 days, the difference in IADL loss was diminished (11.6 vs. 8.2; p=0.03) and the ambulation change was more comparable (45.1 vs. 27.2; p=0.14). The pattern across all indices for this small sample suggests comparability in functional recovery between the IRF>SNF patients and the direct SNF discharges.
The satisfaction measures present a mixed picture. Satisfaction with care and explanation of goals/progress seemed to favor the IRF>SNF group, whereas discharge preparation and family preparation seemed to favor the direct SNF group. These differences may highlight some of the strengths of the two different provider types, wherein IRFs may engage patients and families more in goals and progress discussions, and SNFs may focus more on the discharge process.
Costs: Per-episode costs and costs to the Medicare program for IRF>SNF patients were approximately threetimes higher than costs for direct SNF patients during the PAC episode (Table 5.11). Beneficiary costs were also significantly higher for IRF>SNF patients. Per-day costs were closer than total episode costs because IRF>SNF patients had significantly longer lengths of stay in PAC, but still were significantly different.
While the difference between IRF>SNF episodes and direct discharges to SNFs in all service costs for 90 days was less, they were still approximately twice as high for the IRF>SNF episodes. The substantial increase in the direct SNF discharge costs was not surprising due to the frailty of these individuals and associated hospitalization and physician care that they received following the shorter PAC episodes. However, the total costs, costs to Medicare program, and costs to beneficiaries of the combined IRF>SNF episodes far outweighed the cost of direct discharges to SNFs and was highly statistically significant even in this small sample.
| TABLE 5.10: Outcomes of Stroke Patients in IRF-SNF vs. Direct SNF Episodes | |||
| Outcomes | IRF-SNF n=80 | SNF n=55 | Significance |
| Location at 90 Days (%) | |||
| Home | 20.0 | 21.8 | 0.83 |
| Friend/Relative Home | 5.7 | 7.3 | 0.73 |
| Nursing Home | 54.3 | 36.4 | 0.05 |
| Assisted Living | 5.7 | 7.3 | 0.73 |
| Died | 5.7 | 16.4 | 0.08 |
| Hospital | 7.1 | 5.5 | 0.99 |
| Other | 1.4 | 5.5 | 0.32 |
| Equally Independent Setting | 23.6 | 41.2 | 0.10 |
| Functional Loss (Mean) | |||
| Activities of Daily Living (0-18) | 5.9 | 5.0 | 0.32 |
| Instrumental Activities of Daily Living (0-21) | 11.0 | 6.7 | <0.01 |
| Ambulation Ability (0-100) | 41.8 | 18.6 | 0.07 |
| Social/Role Index (0-24) | 7.0 | 5.2 | 0.36 |
| Functional Recovery (%) | |||
| Activities of Daily Living | 19.6 | 28.9 | 0.33 |
| Instrumental Activities of Daily Living | 5.9 | 16.7 | 0.14 |
| Ambulation Ability | 31.7 | 44.0 | 0.43 |
| Social/Role Index | 24.5 | 23.7 | 0.99 |
| Self-Reported Health Recovery (%) | 53.6 | 63.2 | 0.40 |
| Satisfaction (Mean) | |||
| Satisfaction with Recovery (1-4) | 1.9 | 2.1 | 0.23 |
| Satisfaction with Care (1-4) | 3.0 | 2.7 | 0.06 |
| Participate in Goal Setting (%) | 90.2 | 77.5 | 0.14 |
| Goals/Progress Explained (1-4) | 3.6 | 3.4 | 0.03 |
| Instruction/Training (1-4) | 3.5 | 3.3 | 0.13 |
| Discharge Preparation (1-4) | 2.3 | 2.8 | 0.06 |
| Family Preparation (1-4) | 3.0 | 3.4 | 0.09 |
| TABLE 5.11: Costs of Stroke Patients in IRF-SNF vs. Direct SNF Episodes | |||
| Costs | IRF-SNF n=79 | SNF n=58 | Significance |
| Post-Acute Care Costs | |||
| Per Episode: | |||
| Total | 41,642 | 14,516 | <0.0001 |
| Medicare | 38,956 | 12,626 | <0.0001 |
| Beneficiary | 2,686 | 1,890 | 0.0092 |
| Per Day: | |||
| Total | 578 | 323 | <0.0001 |
| Medicare | 544 | 287 | <0.0001 |
| Beneficiary | 34 | 36 | 0.8359 |
| All Services Costs for 90 Days | |||
| Per Episode: | |||
| Total | 45,400 | 23,288 | <0.0001 |
| Medicare | 42,135 | 20,596 | <0.0001 |
| Beneficiary | 3,265 | 2,692 | 0.1041 |
| Per Day: | |||
| Total | 504 | 259 | <0.0001 |
| Medicare | 468 | 229 | <0.0001 |
| Beneficiary | 36 | 30 | 0.1041 |
D. DISCUSSION
This national outcome and cost study of PAC for elderly stroke beneficiaries yielded three overriding conclusions pertaining to cost-effectiveness. First, outcome patterns for direct admits to IRFs, SNFs, and HH agencies from the hospital reflect the major differences in case mix that were previously noted and cost differences reflect the services, and PPS payment rules and incentives. Because unique stroke populations are discharged directly to these PAC settings for the most part, outcome and cost comparisons for comparable patients are not possible based solely on the initial PAC provider. Second, relative to direct discharges to SNF, discharges to IRF followed by SNF care (a subgroup of the IRF group with similar characteristics) cost substantially more with apparently comparable outcomes. These care patterns were found in different communities, whereas patient characteristics were comparable, suggesting that this identified subgroup might be treated most cost-effectively in SNFs. Third, among IRF admissions who mostly receive care in multiple-provider episodes, comparisons suggest OP care following an IRF may be more cost-effective than HH care following IRF, and perhaps preferable even to IRF care with no immediate follow-up after discharge. Cost in this case refers to Medicare payments; however, higher costs to beneficiaries of OP services raise policy issues if this is to become a more desirable option.
The first of these findings is anticipated by the previously reported differences in characteristics between elderly Medicare stroke victims admitted directly to IRFs, SNFs, and HH agencies from the hospital (Chapter 4). SNF patients were significantly less well educated, more disabled prior to their stroke, more cognitively and physically impaired following their stroke, and had greater speech/language impairments and greater symptoms of depression. On the other end of the spectrum, HH patients were more likely to be women and had less post-stroke functional and cognitive impairment than IRF patients. Given these differences, associated differences in outcomes between settings would be anticipated. That is, the higher rate of nursing home residence at 90 days among discharges to SNFs than either IRFs or HH agencies and the lowest rate of residence in equally independent settings is a logical outcome of these differences. The highest rates of functional recovery found for direct HH admissions would also be anticipated. While a trend toward less functional recovery was found in SNFs relative to IRFs, these were not statistically significant. The combination of the large selection bias in direct discharges to these settings and the lack of statistical power to reject the null hypothesis in view of the small sample sizes in direct admits to SNFs and HH agencies rendered rigorous outcome comparisons of all direct discharges to the three settings unfeasible and inappropriate.
The cost data demonstrate the high cost in total and to Medicare of using IRFs in the post-PPS era, both during the PAC episode and over 90 days. This occurs because of the high cost per discharge of IRF services and also the use of other providers in the PAC episode. In the Medicare program, one patient can receive PAC in an IRF for the cost of treating two in a SNF and for the same cost as treating eight in an HH agency; however, given the difference in the patient populations and associated outcomes, the cost-effectiveness of all episodes beginning with IRF vs. SNF vs. HH subsequent to PPS implementation cannot be compared. The HH agencies are treating a healthier population, with functional and cognitive characteristics that enable them to go home, and the SNFs are treating the most disabled population who receive less therapy and physician care in a different staffing environment.6 The lower cost in both SNFs and HH agencies is consistent with prior work suggesting that patients who are most independent and those with the greatest dependence generally receive and need fewer therapy resources than those in the middle who can benefit the most.7
The second set of findings relate to the subgroup of patients discharged directly to SNFs, who were found to be extremely similar to patients discharged to IRF and then subsequently transferred to an SNF (Chapter 4). Even though IRF>SNF patients were more independent in ADLs, IADLs, social/role functioning, and ambulation, had higher global health ratings, and were better educated prior to their stroke than direct SNF patients, the two patient groups were very similar after their stroke. They had comparable cognitive status, with an average MMSE of 19-20; about 60 percent were below 23 on the MMSE (suggesting likely cognitive impairment) and 25 percent were below 17 (suggesting more significant impairment).8, 9, 10 They had average Barthel scores of about 30 out of 90, with 75 percent of patients with Barthel scores of 40 or less, representing significant functional impairment. Thirty (30) to 45 percent had speech or language impairments. Over half had depressive symptoms according to the GDS Short Form, with 25 percent meeting more strict criteria for depression.11, 12 The major distinguishing characteristics between the IRF>SNF group and the direct discharges to SNFs were community characteristics, suggesting that PAC care patterns may have occurred in large part because of provider availability. IRF>SNF episodes were almost twice as likely than direct SNF episodes to be in communities with high IRF use rates, and SNF episodes were significantly more likely to be in states with high rates of nursing home beds and low rates of residential care. IRF>SNF episodes were also more likely to occur in urban areas. Thus, for this patient subgroup, the study provided an opportunity for a natural experiment.
A mortality rate that was three times higher in the direct SNF group vs. the IRF>SNF group made outcome comparisons difficult because the most frail patients with the greatest functional losses were likely residing in nursing homes. Nevertheless, even if we scored all of these patients with the worst possible value for location at 90 days (i.e., nursing home) and function at 90 days (i.e., 0), then location outcomes and functional outcomes were similar between the two groups. Total and Medicare PAC costs were three times higher for the IRF>SNF patients, and all service costs for 90 days were twice as high for the IRF>SNF group. This difference in PAC costs is not surprising given the PAC length of stay difference of 72.6 vs. 46.4 days and the fact that so many IRF patients use three types of PAC, not just two. Thus, direct discharge to SNF appears to be a more cost-effective alternative for this subgroup of patients.
Several issues surround restructuring incentives to treat these patients in SNFs without first admitting them to IRFs. The first issue is whether they can be accurately identified upon hospital discharge without a trial in an IRF setting. Some would argue that it is not the IRFs intent upon admitting these patients to discharge them to a SNF, but because they do not progress as expected, the need for this additional institutional care becomes apparent. However, if it is possible to identify these patients at the time of acute hospital discharge, then discharge to an IRF is not appropriate. In such cases, an SNF with adequate rehabilitation resources needs to be available in the community. Alternatively, a policy mechanism might be designed to encourage either immediate or early discharge from IRF to SNF in the appropriate situations. One possibility is to develop some type of transfer CMG policy whereby the IRF would receive a reduced payment equivalent to SNF level of care for IRF days if the patient is ultimately discharged to a SNF. A similar policy is currently in place whereby Medicare pays IRFs lower rates for patients with stays of less than four days. While further study of this issue is needed because of the subgroup sample size in this study, the IRF>SNF group appears to be a relatively homogenous set of patients who are distinct from other patients typically admitted to IRFs. Their admission to IRFs may be based more upon practice patterns and their pre-stroke function rather than their post-stroke disability.
The third finding relating to IRF care episodes followed by HH, OP, or direct discharge to residence raises some important policy considerations. The first concern is what distinguishes patients who follow these different PAC pathways. To qualify for HH care, a beneficiary must require intermittent skilled nursing, PT, or ST (fewer than eight hours per day and 28 hours per week); be under the care of a physician; have the services furnished under a plan of care prescribed and periodically reviewed by a physician; and be confined to his/her residence (i.e., homebound).13 A beneficiary is homebound when he/she has a condition that results in a normal inability to leave home except with considerable and taxing effort, and absences from home are infrequent or are of relatively short duration or attributable to receiving medical treatment. The definition of homebound has been controversial, which is not surprising in that terms such as considerable and taxing effort and infrequent or of relatively short duration are quite subjective. In fact, one might imagine twocomparable individuals living in their homes, one who receives her medical treatment in an OP facility and the other who is visited by HH staff because he differs in what he considers considerable or taxing effort.
Our case mix findings suggest relative comparability between IRF>HH and IRF>OP patients. Over 65 percent of IRF admissions went to one of these two options, with more than half of these going to HH agencies. Between stroke patients admitted to these two settings, very modest post-stroke case mix differences were noted, including a difference of about five points in the Barthel Index on a 90-point scale, and a difference of about one point on the FIM mobility/transfer subscale, which is 21 points.14 Among those who could respond, there was also a modest difference in the abbreviated GDS Short Form. Twoimportant socioeconomic status differences were that patients who went from IRF to OP were better educated by about oneyear on average and had higher incomes, with 10 percent fewer in the less than $15,000 income bracket and more in the $15,000-$30,000 and $30,000 and above bracket. No differences were found in availability of social supports nor in pre-stroke function.
So why did some patients use HH care following rehab while others used OP services? One answer may be the cost to beneficiaries, which was higher for the episode and across 90 days for patients admitted to OP settings due to the copayments for OP services. No copayment or coinsurance is required of beneficiaries for HH services, which makes HH attractive to persons with lower incomes. For OP services, a coinsurance amount is required that for most services is determined by the APCs. Over the past several years, there has been substantial pressure to reduce coinsurance in the OP PPS to a target of 20 percent.15, 16, 17 OP therapy services are excluded from the APCs and are covered by a fee schedule in which Medicare covers 80 percent and the beneficiary is responsible for 20 percent, which is paid out-of-pocket or from supplemental insurance. Therapy services require a physician order, a specific treatment plan, and must be provided by skilled, qualified providers. No limits exist for provision of therapy services in OP hospitals; however, an annual limit of $1,740 exists for combined OP PT, and ST with a $1,740limit for OT when services are provided outside a hospital for the year 2006.
These coinsurance costs result in a cost to Medicare patients for each visit in contrast to lack of any beneficiary cost for HH patients. Thus, a clear financial incentive exists for a beneficiary who does not have supplemental insurance that would cover the coinsurance to use HH services. Reducing the cost to beneficiaries due to this coinsurance for OP services, or requiring a copayment for HH services, might increase the utilization of OP services relative to home care services following the IRF stay. As the findings in this report suggest, this could ultimately reduce the cost of PAC to Medicare for stroke victims over the 90 days following the PAC episode.
Another possible incentive for patients to use HH agencies instead of OP care is the cost of transportation. Although we did not collect data on transportation abilities at discharge from the IRF, the 90-day use of car IADL variable showed that about 55 percent of the HH group had difficulty getting in and out of a car in a contrast to 28 percent of the OP group and that a third of these persons were unable in contrast to 20 percent of the OP group. This may be the argument for being homebound; however, some patients in the OP group had difficulty and were unable to use cars as well. If handicapped transportation services were provided, either through Medicare or another payment program, more stroke victims might avail themselves of OP services instead of HH services.
The evidence on outcome differences across different types of multiple-provider episodes suggests that even after adjusting for baseline differences that were relatively modest, IRF patients who went to OP care had better outcomes with respect to functioning in the community (IADLs), ambulation, and to some extent ADLs at 90 days. One possible explanation for the difference in outcomes is that OPs received a total of 40 therapy visits (39 OP and one HH) in contrast to about 22 (17 HH and five OP) for HH patients. The HH PPS that provides an incentive to deliver ten therapy visits (which increases the HHRG payment substantially) without an incentive to provide any more than ten visits may be working against optimal care for stroke patients.
The other issue is whether HH rehabilitation, which is aimed at treating a heterogeneous group of Medicare beneficiaries, is optimally suited for highly specialized treatment of stroke victims. Earlier studies that have demonstrated the benefits of IRFs and specialized stroke units18, 19 argue for the benefits of more specialized rehabilitation for a complex multifaceted disease such as stroke. Returning to an OP rehabilitation setting with specialized stroke services may provide the greatest benefit for stroke victims after discharge from an IRF. In this study, 60 percent of the IRF>OP group received OP care in an OP program that was affiliated with the IRF from which they were discharged, and the remainder went to freestanding facilities. Although about 60 percent of OPHH patients received care in a hospital-based HH agency; only 36 percent of these received their care in an HH agency that was affiliated with the treating IRF. While important restrictions exist for referrals to jointly-owned settings (StarkII legislation), benefits may exist for referral to a specialized rehabilitation facility for OP care where there is greater care continuity, reducing the likelihood of problems in care transitions.20, 21 Obviously, this is a double-edged sword from a policy perspective, opening the door for selective referral to providers where there is shared financial interest.
Not only does the IRF>OP option appear to lead to enhanced outcomes, but costs are significantly lower during the PAC episode and over 90 days. The $2,500 per episode cost difference for the PAC episode and the $4,300 difference per 90 days are substantial, after taking into consideration case mix characteristics that explained a large amount of the variation in costs. These models that experienced substantial variation also suggested that modeling costs per total PAC episode using patient characteristics and selected facility characteristics may not be as difficult as some have argued. Interestingly, even the 90-day cost for the small sample of individuals who were discharged directly from the IRF to their residence without either HH or OP care in 30 days, were comparable to patients discharged directly to OP services due to hospital costs, associated services, and OP and HH costs received later. This provides further support for the benefit of immediate OP services following discharge from IRFs.
Because all the data from this study are in the post-PPS era, the study does not address the change in patient outcomes and costs due to PPS. However, the incentives under the current systems encourage discharge of most stroke victims to an IRF (resulting in a per discharge payment), and then a minimal IRF length of stay followed by discharge to a subsequent setting. The two-day decline in length of stay between 2003 and 2004 (Chapter 4) suggests that IRFs are responding to this incentive, which may lead to an adjustment in per discharge payments relatively soon. One result is the use of IRF>SNF episodes that are more costly than direct SNF discharge for comparable patients, yielding similar outcomes. Other incentives appear to result in greater differentiation among settings in direct discharges from the acute hospital; this change reduces the opportunities for natural experiments in which outcomes and costs can be compared across settings. Our findings suggest that it is important to continue monitoring the relatively substantial impacts of PPS on PAC.
Policy options recommended by this report such as reducing the coinsurance for OP services, including coverage for handicap transportation services under Medicare, and reducing IRF payments for the subgroup of patients who are discharged to SNFs, may ultimately lead to lower cost rehabilitation with improved or comparable outcomes for elderly stroke victims under PPS. Ultimately, new CMS initiatives on the horizon such as the Section5008 Post-Acute Care Payment Reform Demonstration and the Pay-for-Performance Demonstration (if rehabilitation measures are included) may stimulate providers to create innovative, cost-effective solutions for achieving optimal patient treatment outcomes across the spectrum of care under PPS.
E. REFERENCE LIST
- Kramer AM, Steiner JF, Schlenker RE, Eilertsen TB, Hrincevich CA, Tropea DA, et al. Outcomes and costs after hip fracture and stroke: a comparison of rehabilitation settings. JAMA 1997; 277(5): 396-404.
- Kane RL, Chen Q, Finch M, Blewett L, Burns R, Moskowitz M. Functional outcomes of posthospital care for stroke and hip fracture patients under Medicare. J Am Geriatr Soc 1998; 46: 1525-1533.
- Holthaus D, Kramer A. Study of stroke post-acute care and outcomes: draft final report. Chapter 1: Post-acute care policy issues. 2005. Aurora, CO: Division of Health Care Policy and Research, University of Colorado at Denver Health Sciences Center.
- Chen Q, Kane RL, Finch MD. The cost-effectiveness of post-acute care for elderly Medicare beneficiaries. Inquiry 2000; 37: 359-375.
- Lee AJ, Huber JH, Stason WB. Poststroke rehabilitation in older Americans. The Medicare experience. Med Care 1996; 34(8): 811-825.
- Kramer AM, Kowalsky JC, Lin M, Grigsby J, Hughes R, Steiner JF. Outcome and utilization differences for older persons with stroke in HMO and fee-for-service systems. Journal of the American Geriatrics Society 2000; 48: 726-734.
- Eilertsen TB, Kramer AM, Schlenker RE, Hrincevich CA. Application of Functional Independence Measure-function related groups and Resource Utilization Groups-Version III systems across post acute settings. Med Care 1998; 36(5): 695-705.
- Murden RA, McRae TD, Kaner S, Bucknam ME. Mini-Mental State Exam scores vary with education in blacks and whites. J Am Geriatr Soc 1991; 39(2): 149-155.
- Folstein MF, Folstein SE, McHugh PR. Mini-Mental State: a practical method for grading the cognitive state of patients for the clinician. J Psychiatr Res 1975; 12(3): 189-198.
- McDowell I, Newell C. Mental status testing. Measuring health: a guide to rating scales and questionnaires. New York, NY: Oxford University Press, 1996.
- Lesher E, Berryhill J. Validation of the geriatric depression scale-short form among inpatients. J Clin Psychol 1994; 50: 256-260.
- Sheikh JI, Yesavage JA. Geriatric depression scale (GDS): recent evidence and development of a short version. Clin Gerontol 1986; 5: 165-172.
- U.S. General Accounting Office. Report to congressional committees. Medicare home health care: prospective payment system will need refinement as data become available. GAO/HES-00-9. 2000. Washington, DC: General Accounting Office.
- Kramer AM, Goodrich G, Holthaus D, Epstein A. Study of stroke post-acute care and outcomes: draft final report. Chapter 4: Patterns of post-acute care following implementation of PPS. 2005. Aurora, CO: Division of Health Care Policy and Research, University of Colorado at Denver Health Sciences Center.
- Medicare Payment Advisory Commission. Report to the Congress: Medicare payment policy. Chapter 9: Reducing beneficiary coinsurance under the hospital outpatient prospective payment system. 2001; 141-151. Washington, DC: MedPAC.
- Center for Medicare Education. Medicare outpatient prospective payment system. Issue Brief 2003; 4(1).
- Centers for Medicare & Medicaid Services. Medicare announces payment rates and policy changes for hospital outpatient services in 2006. Beneficiary coinsurance rates continue to fall. Medicare News 2005.
- Langhorne P, Williams BO, Gilchrist W, Howie K. Do stroke units save lives? Lancet 1993; 342(8868): 395-398.
- Ottenbacher KJ, Jannell S. The results of clinical trials in stroke rehabilitation research. Arch Neurol 1993; 50(1): 37-44.
- Coleman EA, Min S, Chomiak A, Kramer AM. Posthospital care transitions: patterns, complications, and risk identification. Health Serv Res 2004; 39(5): 1449-1465.
- Coleman EA, Berenson RA. Lost in transition: challenges and opportunities for improving the quality of transitional care. Ann Intern Med 2004; 141(7): 533-536.
6. TRENDS IN INPATIENT POST-ACUTE CARE FOR STROKE
A. Introduction
PPSs were implemented for Medicare PAC over the past seven years in the two primary inpatient destinations: SNFs in July 1998, and in IRFs in January 2002. PPS implementation also occurred for OP hospital care in August 2000, and for HH care in October 2000. Initial data suggest that PPS has dramatically affected the economics of the targeted PAC settings.
In our national study of PAC for stroke patients following PPS from late 2002 to early 2005, we made several observations from our primary data. First, we found it increasingly difficult to locate sufficient numbers of stroke patients receiving rehabilitation who were admitted directly to SNFs under PPS. Second, we observed significant differences in characteristics of stroke patients admitted to various PAC settings following acute hospitalization. Third, we found declining lengths of stay over the period of study for IRF patients. However, our sample was limited to 674 patients in 69 facilities for whom we collected primary data. Thus, analysis on a larger national sample is needed to confirm these findings.
PAC settings include inpatient settings of IRF, long-term acute care hospitals, and SNFs, and community settings of HH and hospital and community-based OP services. We chose to use the MedPAR file for national data. The limitation to using the MedPAR file is that it contains only inpatient records. However, given the importance of analyzing national data, we determined that the MedPAR data would provide further insight into the use of SNF and IRF settings for beneficiaries who were hospitalized with a stroke.
In particular, we will address the following research questions:
- Do trends in PAC discharge destination of stroke patients show an increase in discharges to IRF and a decrease in SNF admissions?
- Do the SNF and IRF stroke populations appear to have different clinical characteristics?
- Did facility-level volume of admissions change in response to PPS (i.e., did the distributions of patients among providers change in ways consistent with the trends in national discharges or did individual facilities respond differently)?
- What are differences in characteristics, such as the length of stay changes, among hospital-based and freestanding SNFs and IRFs?
B. METHODS
1. Data
We extracted data from the MedPAR files for calendar years 1998-2004, after the start of implementation of the PPS for PAC. The MedPAR file contains inpatient hospital (including inpatient rehabilitation stays and LTCH stays) and SNF records. Each MedPAR record represents a stay in an inpatient hospital or SNF collapsing all claims for that stay into a final action record. MedPAR presented an opportunity to examine the entire population of Medicare stroke patients over 1998-2004. In addition to its restriction to inpatient records, the biggest drawback to MedPAR data is the limited information included in the file. Since clinical data from PAC assessments are not included in the records, it did not allow for comprehensive case mix adjustment or comparisons of patient characteristics among patient populations. We cannot observe any direct information for HH or OP use, and reported discharge destination information is notoriously suspect in all administrative data.
Starting from the full MedPAR file, we identified stroke patients in the MedPAR dataset using stroke DRGs 14 and 15. We selected all records for these beneficiaries because some records that are part of a stroke episode may not be coded by DRG, particularly in IRF or SNF records. Over 7,000,000 records were identified in this manner. We then collapsed the records into sequenced episodes of inpatient stays similar to the episodes created for our study subjects. Episodes were required to begin with an acute hospital stay including a primary diagnosis matching those in the screening form for our study subjects as noted in Chapter 2. Each PAC episode included 90 days following the discharge date of the first acute hospital stay. To be considered part of the 90-day episode, subsequent admissions had to occur within 30 days of the prior inpatient stay. A new episode for a given beneficiary was triggered by any gap of at least 180 days between inpatient discharges.
Each episode became a record in our final data set. Maryland patients were removed from the data for the majority of the analyses as outliers since they are not subject to prospective payment and their PAC patterns are distinctly different. To match our study population of interest, we dropped patients under age 65. In our time period, admissions from 1998 to 2004, we had 1.88 million episodes.
2. Analysis
Descriptive analyses were completed by collapsing episodes into categories and profiling the SNF and IRF discharges over time or by other variables of interest. Bivariate comparisions followed the same methods described in prior chapters. Comparisons were conducted using the t-test or Mann-Whitney for non-normally distributed variables and the Chi-Square test for dichotomous variables.
For the trend analyses, the discharge date for the acute hospital stay was used and discharges were joined into quarterly averages, smoothing out some of the random variation which emerged using monthly averages. Because we are interested in full 90-day episodes, acute hospital discharges were dropped for the last three months of 2004 for all trend analysis. We utilized logistic regression to examine the trend in the likelihood of discharge to IRF and the likelihood of discharge to SNF, controlling for case mix. Case mix variables were generated to match those used in the outcome analyses from Chapter 5, where at all possible.
C. RESULTS
1. Trend in Primary Discharge Destination
| FIGURE 6.1: Discharge to Inpatient PAC Over Time |
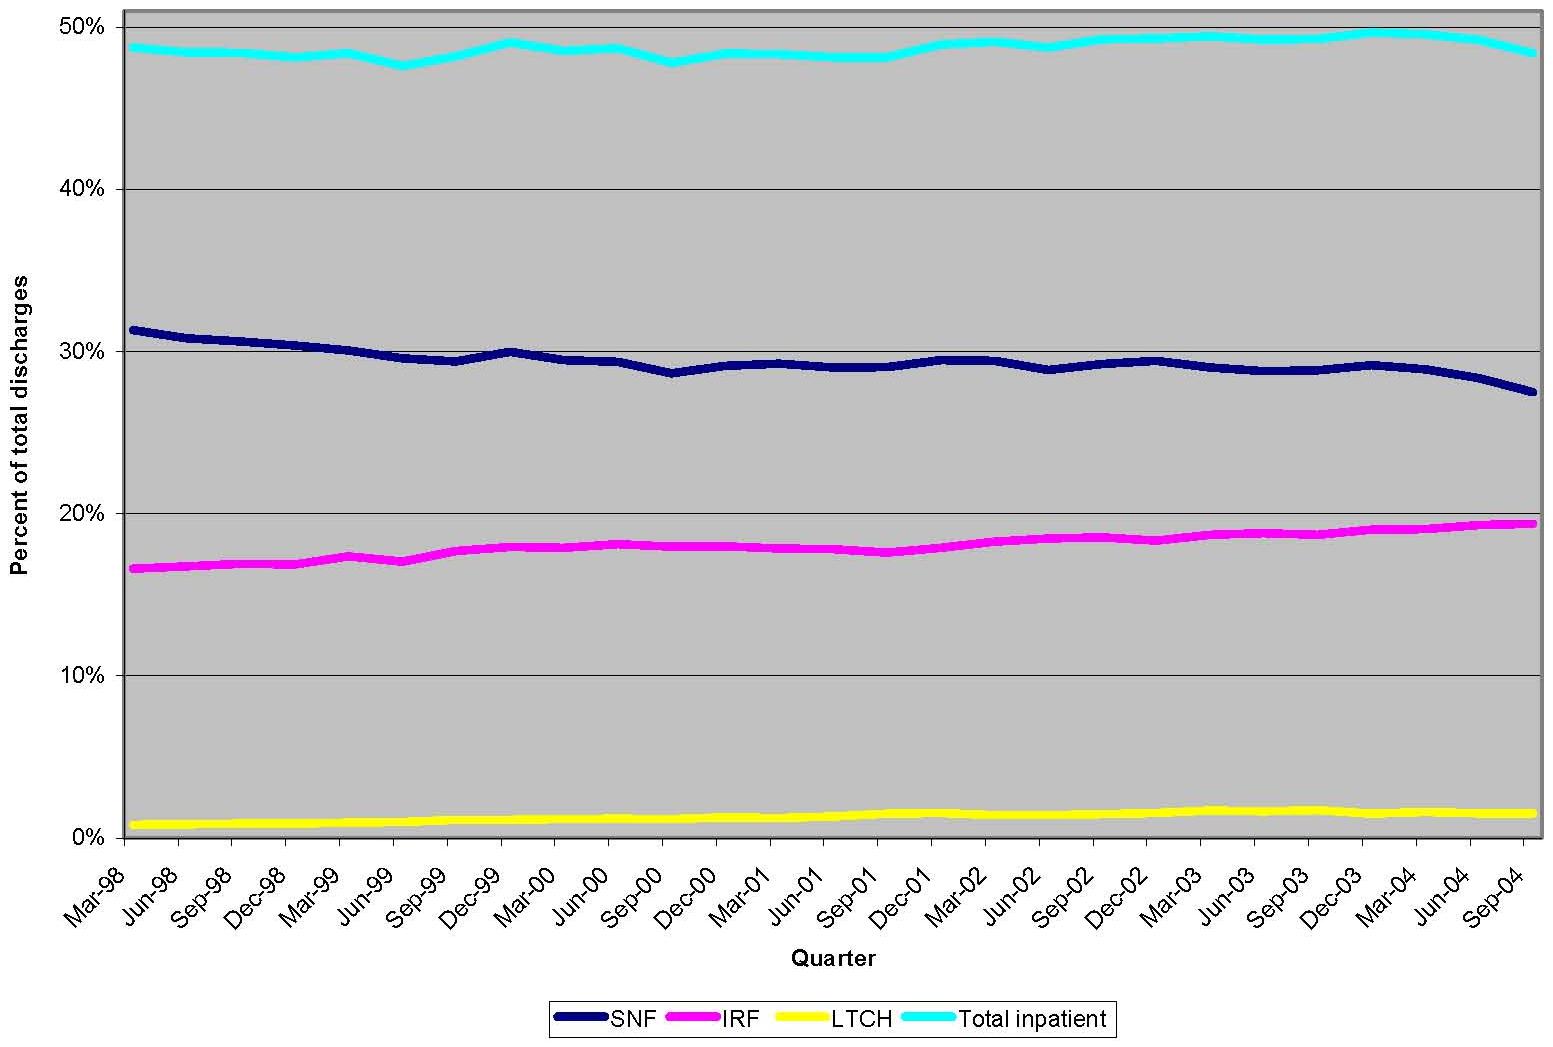 |
Figure 6.1 depicts the trend in primary discharge destination for inpatient PAC from 1998 to 2004. The overall percentage of stroke patients receiving inpatient PAC remained fairly steady across the time period, at close to 50 percent. The distribution of destinations changed over time as IRF and LTCH use increased while SNF use decreased. The drop in SNF usage and increase in IRF usage appeared more dramatic in 2004. Although LTCH discharges remained a small percentage of inpatient care over time, they increased by nearly 90 percent (from 0.82 percent to 1.53 percent). We also looked at the trend of using SNF after an initial discharge to IRF over this time period. While the use of this combination did increase over the time period, it appears to be associated with the overall increase in IRF usage, and the percent of patients discharged to an IRF that also use a SNF within 90 days of hospital discharge fluctuated around 25 percent.
While Figure 6.1 represents the national averages in discharges, strong geographical disparities exist in the use of PAC. We found a large variation in discharge destination by state, both in the usage of inpatient PAC and in the distribution of inpatient PAC between IRF and SNF (Table 6.1). The states are ordered from highest (Nevada) to lowest (Maryland) use of IRF. The numbers in parentheses in columns 2-4 represent the state rank in that category from highest to lowest. States that have high IRF usage tended to have low SNF usage (see Nevada, Arkansas, Louisiana, and Oklahoma). Conversely, only some states with low IRF usage tended to have high SNF usage (see Connecticut and Oregon), which created broad differences in the ratio of IRF to all inpatient care received across states, from a low of 22 percent in Connecticut to a high of 59 percent in Nevada.
| TABLE 6.1: State Variation in Discharge Destination (2002-2004) | |||||||
| State | Discharge to IRF | Rank | Discharge to SNF | Rank | Any Inpatient | IRF as a % of Inpatient | Rank |
| Nevada | 30% | (1) | 15% | (50) | 50% | 59% | (1) |
| Arkansas | 28% | (2) | 20% | (47) | 49% | 57% | (2) |
| Louisiana | 27% | (3) | 14% | (51) | 52% | 53% | (5) |
| Oklahoma | 26% | (4) | 19% | (48) | 49% | 53% | (3) |
| Arizona | 24% | (5) | 21% | (44) | 46% | 53% | (4) |
| Pennsylvania | 23% | (6) | 30% | (21) | 54% | 43% | (14) |
| North Dakota | 23% | (7) | 27% | (34) | 50% | 45% | (10) |
| Kansas | 23% | (8) | 21% | (43) | 45% | 50% | (6) |
| Texas | 22% | (9) | 21% | (46) | 49% | 46% | (8) |
| New Hampshire | 22% | (10) | 27% | (33) | 50% | 45% | (11) |
| South Dakota | 22% | (11) | 25% | (37) | 48% | 46% | (9) |
| Missouri | 22% | (12) | 26% | (35) | 48% | 45% | (12) |
| Utah | 21% | (13) | 29% | (25) | 50% | 42% | (17) |
| Rhode Island | 20% | (14) | 32% | (12) | 53% | 39% | (25) |
| Idaho | 20% | (15) | 34% | (5) | 55% | 37% | (32) |
| Tennessee | 20% | (16) | 28% | (27) | 49% | 41% | (20) |
| Colorado | 20% | (17) | 28% | (29) | 49% | 41% | (21) |
| Washington | 20% | (18) | 34% | (7) | 54% | 37% | (31) |
| Indiana | 20% | (19) | 32% | (15) | 52% | 38% | (28) |
| New Mexico | 19% | (20) | 24% | (40) | 44% | 44% | (13) |
| Michigan | 19% | (21) | 25% | (36) | 45% | 43% | (15) |
| Delaware | 19% | (22) | 28% | (31) | 47% | 41% | (19) |
| South Carolina | 19% | (23) | 25% | (38) | 45% | 42% | (18) |
| Illinois | 19% | (24) | 31% | (18) | 50% | 38% | (29) |
| Maine | 18% | (25) | 34% | (6) | 53% | 35% | (35) |
| Kentucky | 18% | (26) | 28% | (28) | 47% | 39% | (24) |
| Montana | 18% | (27) | 29% | (24) | 47% | 39% | (26) |
| Wisconsin | 18% | (28) | 31% | (17) | 50% | 37% | (33) |
| California | 18% | (29) | 32% | (14) | 51% | 35% | (34) |
| Massachusetts | 18% | (30) | 32% | (13) | 57% | 31% | (43) |
| Wyoming | 17% | (31) | 23% | (42) | 41% | 42% | (16) |
| Ohio | 17% | (32) | 33% | (9) | 52% | 33% | (40) |
| Washington, DC | 17% | (33) | 32% | (16) | 51% | 33% | (39) |
| West Virginia | 17% | (34) | 28% | (32) | 45% | 37% | (30) |
| New York | 17% | (35) | 32% | (11) | 49% | 34% | (37) |
| Georgia | 17% | (36) | 24% | (41) | 42% | 40% | (23) |
| New Jersey | 17% | (37) | 36% | (2) | 53% | 31% | (42) |
| Alaska | 16% | (38) | 17% | (49) | 34% | 48% | (7) |
| Mississippi | 16% | (39) | 21% | (45) | 39% | 40% | (22) |
| Hawaii | 15% | (40) | 25% | (39) | 40% | 38% | (27) |
| North Carolina | 15% | (41) | 28% | (26) | 44% | 35% | (36) |
| Virginia | 15% | (42) | 30% | (20) | 45% | 33% | (38) |
| Minnesota | 14% | (43) | 35% | (4) | 50% | 28% | (47) |
| Florida | 14% | (44) | 33% | (10) | 48% | 30% | (46) |
| Alabama | 14% | (45) | 28% | (30) | 43% | 32% | (41) |
| Nebraska | 13% | (46) | 29% | (23) | 47% | 28% | (48) |
| Vermont | 13% | (47) | 30% | (19) | 43% | 30% | (45) |
| Iowa | 13% | (48) | 29% | (22) | 42% | 30% | (44) |
| Connecticut | 12% | (49) | 40% | (1) | 56% | 22% | (50) |
| Oregon | 11% | (50) | 33% | (8) | 45% | 25% | (49) |
| Maryland | 4% | (51) | 35% | (3) | 39% | 10% | (51) |
Less variation was found in the percent of all stroke patients utilizing any inpatient PAC, with the exception of the low rates in Alaska (34 percent), Mississippi (39 percent), and Maryland (39 percent). Note that Maryland, which is exempt from PPS, uses far more SNF care than IRF care and is one of the states with a smaller percentage going to inpatient care. While we also looked at the change in IRF and SNF usage over time for all of the states, no patterns emerged. Some states increased and some states decreased their use of IRF and of SNF over the time, but the size and direction of the change did not appear to be associated with the distribution of discharge destinations in 1998, nor did it cause the variation in use among states to expand or contract over the time period.
2. Comparison of Patient Populations Post-IRF PPS
Within our study subjects, IRF and SNF patients generally showed different clinical profiles, a finding supported in the MedPAR population to the limited extent that we were able to compare the populations. MedPAR did not provide assessments of the level of function in the discharges, but we did find some interesting differences between SNF and IRF patients in the period of our study, the post-IRF PPS period 2002-2004. SNF patients were significantly older (SNF mean=82.3 (STD 7.7), IRF mean=78.2 (STD 7.30)); female (SNF=66.4 percent, IRF=57.1 percent); less likely to have an occlusive stroke (SNF proportion=66.5 percent, IRF proportion=73.1 percent); and had a longer mean length of stay in their first PAC stay (SNF mean=24.8 (STD 28.8) vs. IRF mean=16.6 (STD 9.3)).
The profile of the acute hospital stay in each of the groups was also markedly different. SNF patients stayed longer, with an average length of stay almost 30 percent longer (7.0 days (STD 5.2) vs. 5.5 days (STD 3.5)). The IRF patients, on the other hand, were more likely to have spent time in a specialized unit, either ICU (33.1 percent vs. 27.1 percent) or CCU (12.3 percent vs. 10.5 percent) and to have received ST (63.2 percent vs. 58.5 percent), PT (94.0 percent vs. 85.6 percent), and OT (71.9 percent vs. 56.4 percent) while in the hospital. Finally, IRF patients were more likely to be living in an urban area, 76.4 percent as compared to 72.0 percent. No difference was found in the likelihood of having a prior stroke within the last calendar year.
Age appeared to be strongly related to the discharge destination for stroke patients. Figure 6.2 shows the likelihood of discharge to IRF and to SNF by age, separated into pre-IRF PPS and post-IRF PPS. The likelihood of discharge to SNF increased steadily as age increased until age 94, when it plateaued. Discharge rates to IRF remained generally constant until the mid-seventies, when they began to decrease steadily. The similar curves for pre- and post-PPS indicate that the average age in each facility type remained similar after implementation of the IRF PPS; however, older stroke patients were always more likely to go to SNF relative to IRF. This age pattern may also be responsible for the gender differences we observed between the SNF and IRF populations as older patients are much more likely to be women.
| FIGURE 6.2: Discharge Destination by IRF PPS and Age |
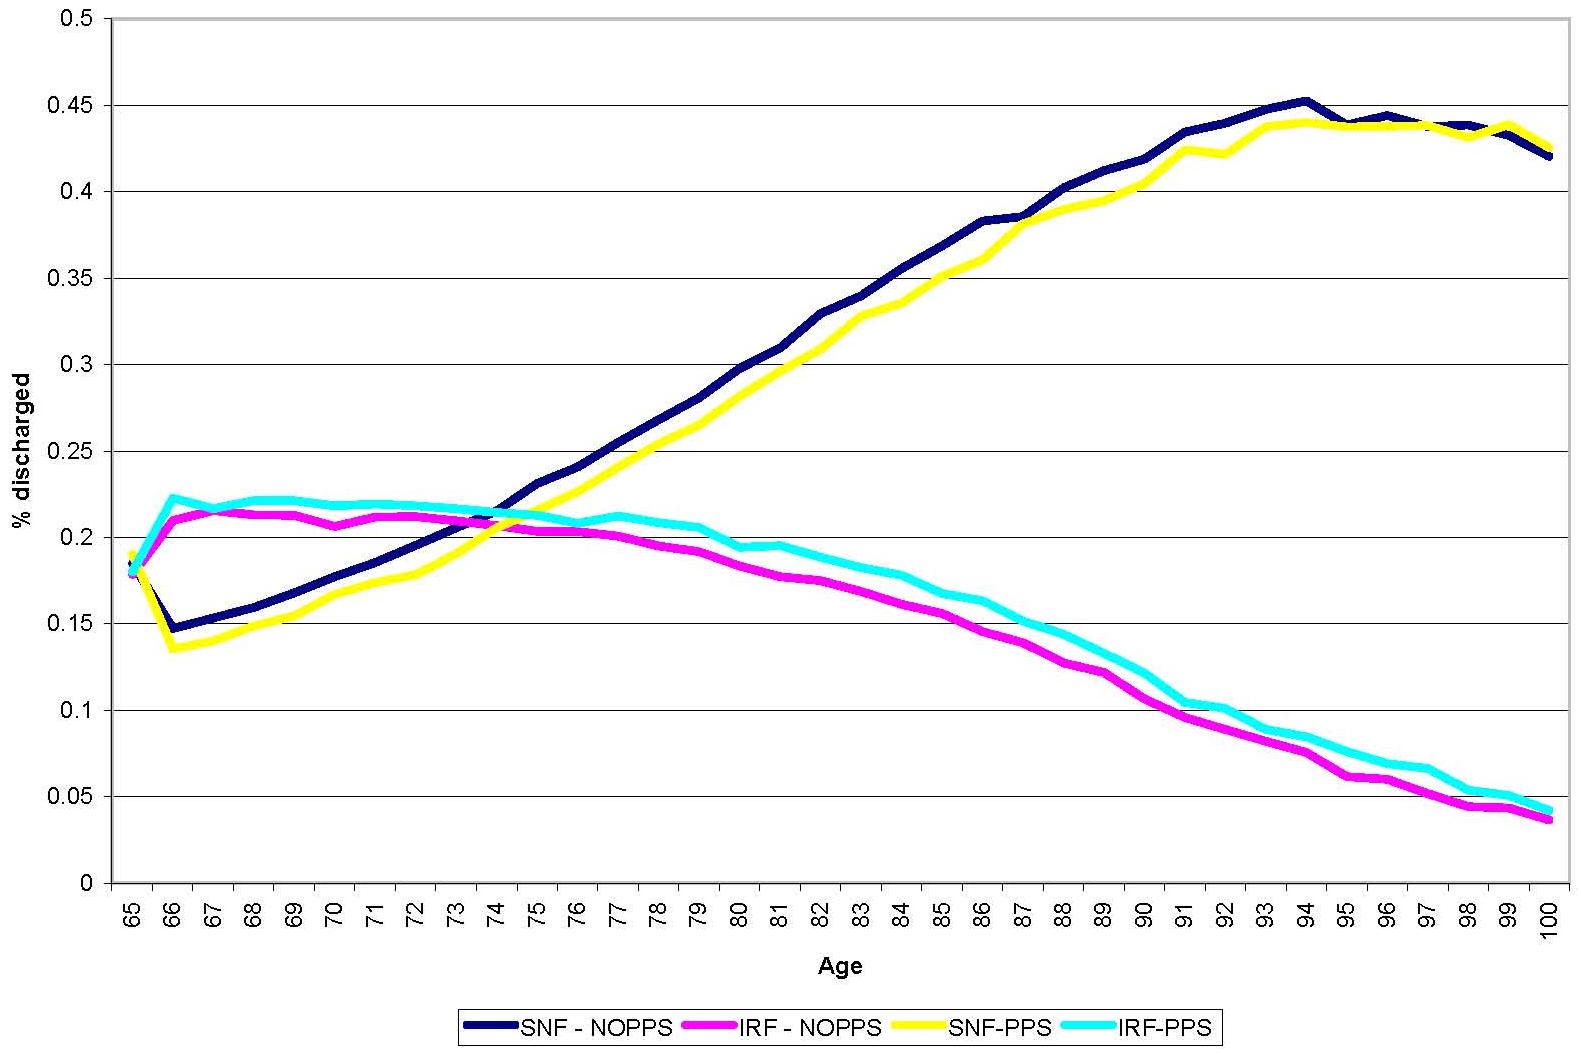 |
3. Facility Trends and Distributions
Table 6.2 presents highlights of the distribution of discharges across facilities for SNF and IRF. Over 1998-2004, the number of IRFs increased by 8 percent, but the facilities had gradually decreasing numbers of discharges. SNFs also showed declining stroke volume, and the average dropped to nearly one discharge every two months. The SNFs at the 90th percentile volume, although at the upper end of the distribution of discharges, only averaged about one discharge per month in 2004, a decline from 1.5 per month in 1998. For both SNFs and IRFs, the largest drop in volume appeared to be in the high-volume facilities, which is consistent with the lowering of the coefficient of variation over time.
| TABLE 6.2: Discharge Distribution across SNFs and IRFs | |||||
| Year | # of IRFs | Mean # of Discharges | 90th Percentile | 25th Percentile | Coefficient of Variation |
| 1998 | 1,139 | 43.4 | 85 | 20 | 79.9 |
| 1999 | 1,149 | 42.1 | 85 | 20 | 79.8 |
| 2000 | 1,164 | 41.7 | 83 | 20 | 78.3 |
| 2001 | 1,182 | 40.2 | 79 | 18 | 77.8 |
| 2002 | 1,199 | 40.5 | 82 | 18 | 80.9 |
| 2003 | 1,217 | 40.0 | 78 | 19 | 78.6 |
| 2004 | 1,228 | 36.7 | 71 | 18 | 76.8 |
| Year | # of SNFs | Mean # ofDischarges | 90thPercentile | 25thPercentile | Coefficient ofVariation |
| 1998 | 12,828 | 7.09 | 17 | 2 | 119.5 |
| 1999 | 12,622 | 6.54 | 15 | 2 | 116.3 |
| 2000 | 12,544 | 6.28 | 14 | 2 | 112.5 |
| 2001 | 12,608 | 6.19 | 14 | 2 | 107.1 |
| 2002 | 12,674 | 6.10 | 13 | 2 | 104.2 |
| 2003 | 12,760 | 5.88 | 13 | 2 | 103.0 |
| 2004 | 12,635 | 6.41 | 12 | 2 | 99.3 |
Table 6.3 shows the changes in numbers of facilities with different stroke patient volumes, indicated by the average number of discharges with stroke per year. Between 1998 and 2004, the higher volume facilities for both SNFs and IRFs saw a sharp decline, while the low to moderate volume facilities saw slight increases.
| TABLE 6.3: Number of SNFs and IRFs by Stroke Patient Volume in 1998 and 2004 | |||
| SNF Volume | SNF Facilities 1998 | SNF Facilities 2004 | % Change |
| Low (1-4) | 6,709 | 7,333 | 9% |
| Moderate (5-9) | 3,249 | 3,397 | 5% |
| Moderate-High (10-14) | 1,313 | 1,116 | -15% |
| High (15+) | 1,421 | 791 | -44% |
| IRF Volume | IRF Facilities1998 | IRF Facilities2004 | % Change |
| Low (1-20) | 305 | 356 | 17% |
| Moderate (21-40) | 340 | 419 | 23% |
| Moderate-High (41-79) | 364 | 368 | 1% |
| High (80+) | 130 | 81 | -38% |
The length of stay trends for acute hospitals, IRFs, and SNFs are provided in Figure 6.3. Acute length of stay declined over 1998-2004 for stroke patients by close to a day, falling from an average stay of 6.4 days to an average stay of 5.5 days. Average IRF length of stay dropped as well over the time period, from 18.4 days to 15.7 days, while average SNF length of stay did not appear to change. These overall patterns in PAC resolve into very different trends when facilities are separated by provider type: hospital-based and freestanding.
| FIGURE 6.3: Length of Stay for Acute Hospital, IRF and SNF |
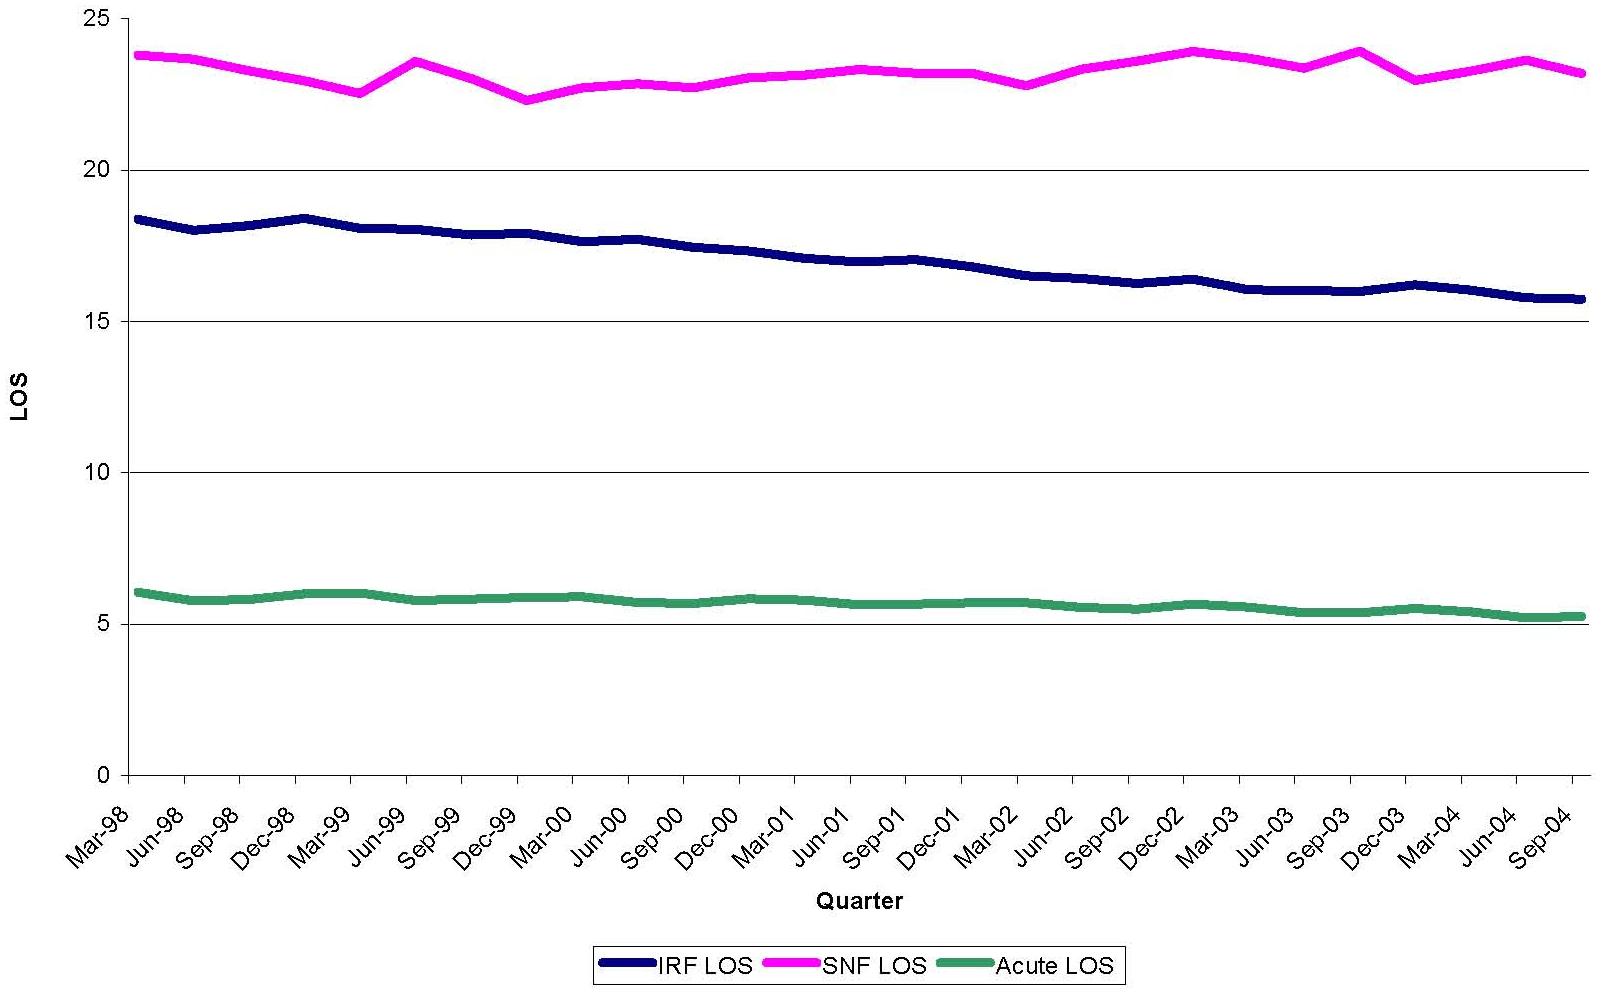 |
Figure 6.4 separates the trend in length of stay into hospital-based and freestanding facility stays. In both setting types, freestanding facilities showed consistent declines in length of stay over time. In IRFs, mean length of stay dropped from 21.5 to 17.8 days while in SNFs, average length of stay fell from 31.5 to 27.5. Hospital-based IRFs showed a slight decline, 17.1 to 14.9 days that seemed to plateau around 2002, while hospital-based SNFs showed, at most, a very slight decline from 15.1 to 14.6 days. Hospital-based units in both settings had shorter lengths of stay than freestanding facilities. Interestingly, average hospital-based SNF and hospital-based IRF length of stay became very similar at the beginning of 2001 and continued that way through 2004.
| FIGURE 6.4: IRF and SNF LOS over Time; Unit vs. Freestanding |
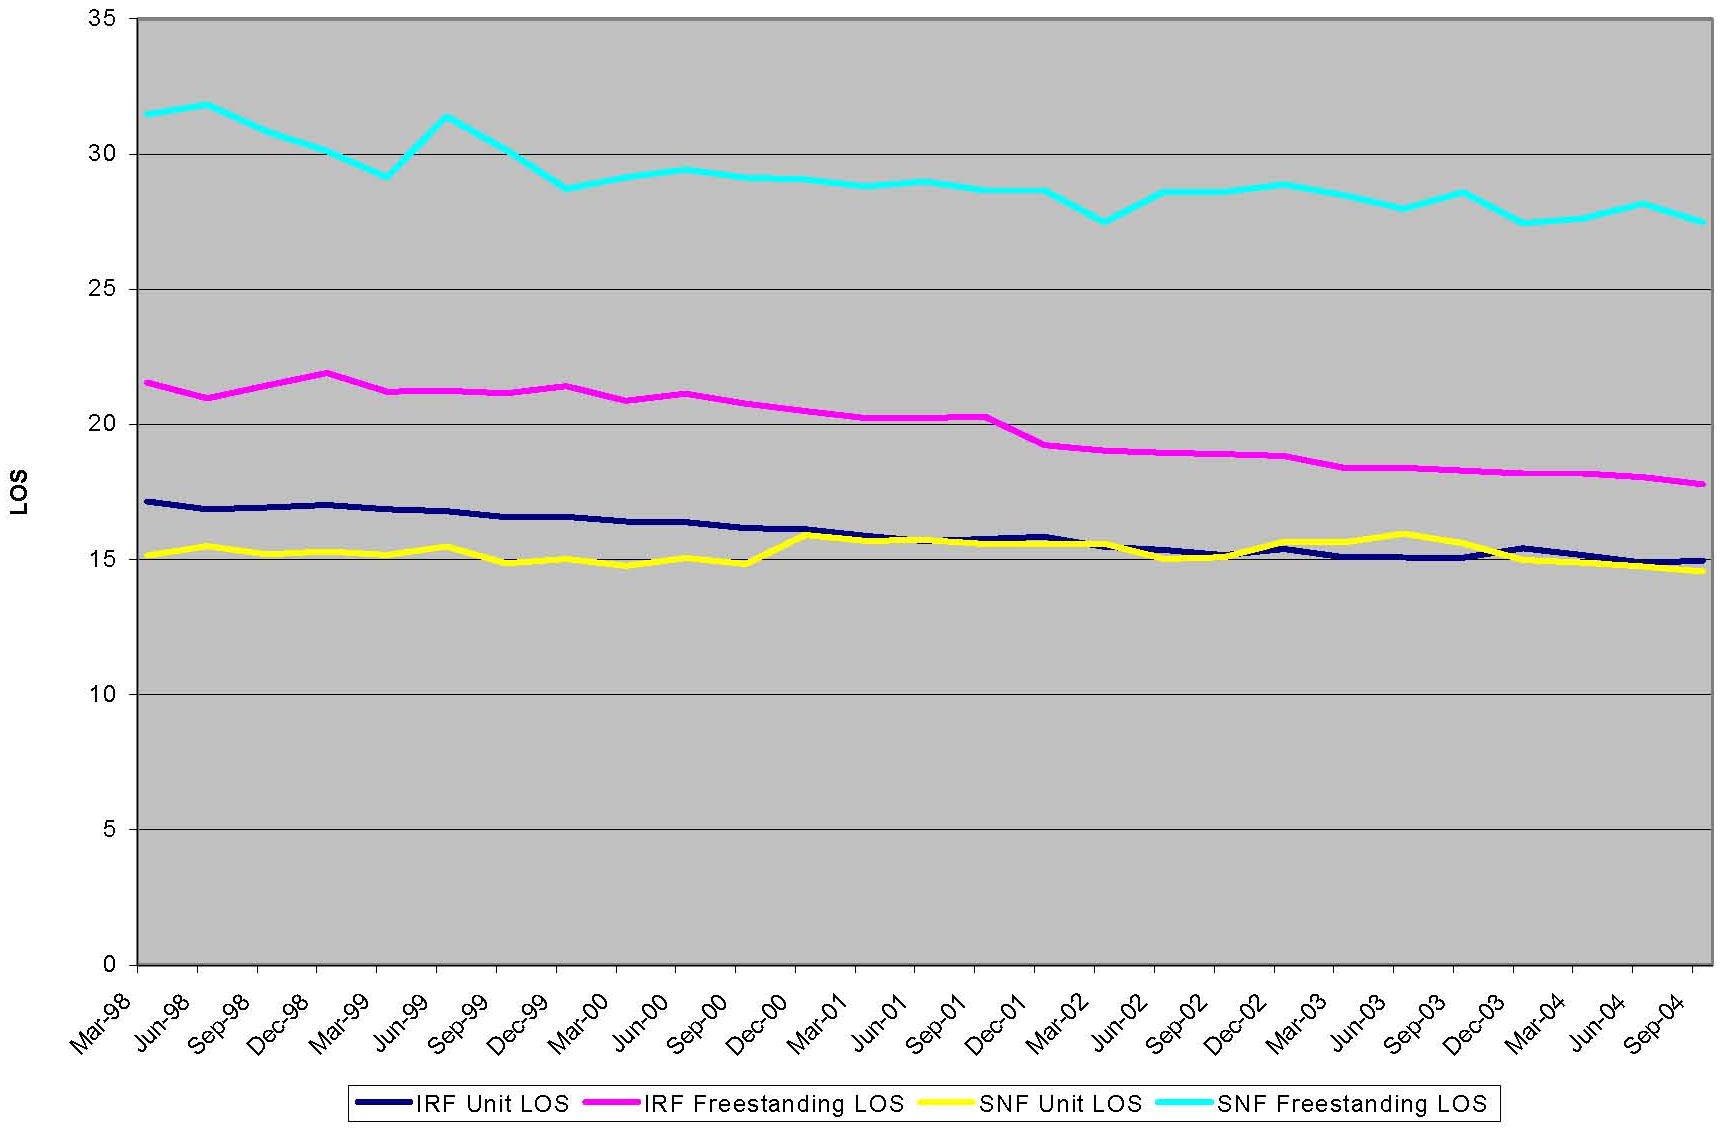 |
4. Likelihood Regressions
The next two tables, Table 6.4 and Table 6.5 present the models for likelihood of discharge to IRF if discharged alive and likelihood of discharge to SNF if discharged alive. We tested a number of different models and these represent our best approach. The change in both IRF use and SNF use appears to be a continuing trend over the 1998-2004 time period, an average of 1.5 percent increase annually of likelihood of going to IRF and a nearly 1 percent decrease annually in the likelihood of going to SNF, controlling for case mix variables. Other variables of interest showed that living in an urban area made one more likely to use an IRF and less likely to use a SNF. Hospital length of stay was positively associated with going to SNF and negatively associated with going to IRF. ICU and CCU use in the hospital were positively associated with going to IRF.
Age was positively associated with going to SNF and negatively associated with going to IRF. Age was left as a continuous variable rather than collapsed into levels based on the observed relationship between age and discharge destination in Figure 6.1. Fit, in terms of C-statistic, was modest, reflecting the limits of the data in terms of case mix variables and the fact that placement is driven in part by factors such as practice patterns, as shown previously.
| TABLE 6.4: Logistic Regression of Likelihood of Going to IRF | |||
| Variable | Estimate | STE | P Value |
| Trend | 0.015 | 0.001 | <0.0001 |
| Urban | 0.210 | 0.005 | <0.0001 |
| Female | -0.064 | 0.004 | <0.0001 |
| Black | 0.034 | 0.006 | <0.0001 |
| Hispanic | -0.105 | 0.017 | <0.0001 |
| ICU in Hospital | 0.325 | 0.005 | <0.0001 |
| CCU in Hospital | 0.212 | 0.006 | <0.0001 |
| Atrial Fibrillation | -0.022 | 0.005 | <0.0001 |
| Hypertension | 0.265 | 0.004 | <0.0001 |
| Prior Stroke | -0.068 | 0.009 | <0.0001 |
| Congestive Heart Failure | -0.217 | 0.006 | <0.0001 |
| Diabetes Mellitus | -0.259 | 0.005 | <0.0001 |
| Myocardial Infarction | -0.124 | 0.019 | <0.0001 |
| COPD | -0.382 | 0.015 | <0.0001 |
| Hemorrhagic Stroke | 0.160 | 0.008 | <0.0001 |
| Occlusive Stroke | 0.274 | 0.005 | <0.0001 |
| Age | -0.025 | 0.000 | <0.0001 |
| Deyo Index | 0.331 | 0.003 | <0.0001 |
| Hospital Length of Stay | -0.010 | 0.000 | <0.0001 |
| Intercept | -0.127 | 0.024 | <0.0001 |
| C-statistic | 0.620 | ||
| TABLE 6.5: Logistic Regression of Likelihood of Going to SNF | |||
| Variable | Estimate | STE | P Value |
| Trend | -0.009 | 0.001 | <0.0001 |
| Urban | -0.039 | 0.004 | <0.0001 |
| Female | 0.237 | 0.004 | <0.0001 |
| Black | -0.110 | 0.006 | <0.0001 |
| Hispanic | -0.173 | 0.016 | <0.0001 |
| ICU in Hospital | -0.141 | 0.004 | <0.0001 |
| CCU in Hospital | -0.113 | 0.006 | <0.0001 |
| Atrial Fibrillation | 0.058 | 0.004 | <0.0001 |
| Hypertension | -0.073 | 0.004 | <0.0001 |
| Prior Stroke | 0.121 | 0.009 | <0.0001 |
| Congestive Heart Failure | 0.153 | 0.005 | <0.0001 |
| Diabetes Mellitus | -0.024 | 0.005 | <0.0001 |
| Myocardial Infarction | 0.132 | 0.016 | <0.0001 |
| COPD | -0.122 | 0.013 | <0.0001 |
| Hemorrhagic Stroke | 0.001 | 0.007 | <0.0001 |
| Occlusive Stroke | -0.108 | 0.004 | <0.0001 |
| Age | 0.063 | 0.000 | <0.0001 |
| Deyo Index | 0.196 | 0.003 | <0.0001 |
| Hospital Length of Stay | 0.118 | 0.000 | <0.0001 |
| Intercept | -6.667 | 0.023 | <0.0001 |
| C-statistic | 0.71 | ||
D. Discussion
Four general conclusions emerged from the analysis of MedPAR data. First, admissions of stroke patients to SNFs directly from the hospital have been steadily declining since 1998 -- around the time the SNF PPS was implemented and admissions to IRFs and acute LTCHs have been increasing. Second, the distribution of stroke patients in SNFs and IRFs is becoming less variable due to declines in the number of high-volume providers. Together, these factors help to explain why it was so difficult to enroll stroke patients from SNFs that were historically high-volume providers. Third, characteristics such as age were quite different between SNF and IRF patients for the most part; nevertheless, geographic variation still existed across states in use of SNF and IRF, with an inverse relationship between the two. Fourth, consistent with PPS incentives, length of stay declined in IRFs, but length of stay also declined in freestanding SNFs.
In the years following the implementation of the IRF PPS, a sharp increase occurred in Medicare spending in IRFs, with total Medicare spending increasing 15 percent per year between 2002 and 2004, as opposed to 3 percent per year between 2000 and 2001.1 MedPAC estimated that increased margins for IRFs during this period were in the range of 11.1-17.7 percent, in contrast to the range of 1.1-2.9 percent prior to PPS. The rapid increase in profitability created incentives for IRFs to sharply increase their patient volumes. This rapid increase was not found after PPS for stroke patients. A more rapid increase may have occurred for other patient types that were more profitable under PPS.
The shift in the likelihood of SNF vs. IRF discharge that was observed for stroke occurred over many years, not just between 2002 and 2004, consistent with RANDs findings for stroke over the shorter term (through July of 2003).2 This could mean that the change was prompted by implementation of the SNF PPS and further stimulated by the IRF PPS. Such a change may occur slowly due to capacity constraints. Adding beds and certifying new facilities takes a long time, so such shifts are likely to occur gradually. Industry skepticism regarding the long-term profitability of Medicare in IRFs could contribute to a gradual response. Potential investors and existing IRF owners may be reluctant to build or expand facilities with the uncertainty of revisions to the current IRF PPS system design that affect payment rates and other regulations such as the definition of a facility to qualify for being paid higher IRF rates.
Instead, facilities may choose to respond in less capital intensive ways, by changing treatment patterns for admitted patients. Shortening length of stay may be one example. Freestanding IRFs showed a steeper decline in length of stay following IRF PPS and their estimated margins shifted from being very similar to unit IRFs in 2001 (1.5 and 1.4 percent, respectively) to being much greater by 2004 (24.2 to 12.0 percent).1 Additional work with more detailed facility-level variables would be of interest, to see if PPS response changed based on other characteristics such as an association with a SNF or HH agency and ownership status.
The pronounced decline in high-volume providers for both SNFs and IRFs and redistribution of stroke patients to low or moderate volume facilities could result from either greater competition for stroke patients or a tendency for facilities to want to balance their case mix with other types of cases. SNF volume for stroke PAC is extremely small in most facilities; 85 percent of facilities in 2004 had less than ten stroke admissions for primary PAC. Although these numbers are boosted slightly if we include the admissions from IRFs for additional PAC, they remain small enough to give rise to concerns about the ability to maintain sufficient expertise in stroke rehabilitation for many SNFs. Stroke causes deficits in areas not found in typical joint and fracture rehabilitation, requiring specialized physician and nursing knowledge and a multidisciplinary therapy staff with stroke expertise.
The MedPAR data reinforced some of our study findings regarding differences in the IRF and SNF patient population. The limited bivariate comparisons suggested that IRF and SNF patients had some differences in characteristics. Age appears to be a prime indicator of whether a stroke patient goes to an IRF or a SNF and merits further investigation to determine whether it is simply a marker for functional status that leads to PAC placement, or whether it is a unique determinant. Our primary data analysis suggested that other characteristics such as cognition, function, and speech and language differed significantly between IRF and SNF patients. However, patients discharged directly to a SNF were found to be very similar to patients who went to a SNF subsequent to an IRF stay.
The degree of geographic variation in discharge destination indicated that some substitution between settings was possible and practice patterns likely influence destination. The geographic disparity observed prior to PPS4 continued after implementation of PPS in all three major PAC settings. Use of PAC has been tied to its availability of setting types.3, 4
We observed strong length of stay trends in inpatient PAC for stroke from 1998 to 2004. Length of stay fell in freestanding IRFs and SNFs, although the financial incentives to shorten length of stay are not obvious in the SNF case. Perhaps SNFs began to discharge patients more to other settings, resulting in shorter average lengths of stay over time. This is an area that may benefit from further study, particularly into changes in the discharge destination of these patients.
E. REFERENCE LIST
- Medicare Payment Advisory Commission. Report to the Congress: Medicare Payment Policy. Chapter 4: Post acute care providers: an overview of the issues. March 2006.
- Beeuwkes Buntin M, Escarce JJ, Hoverman C, Paddock SM, Totten M, Wynn BO. Effects of payment changes on trends in access to post-acute care. 2005. RAND Health.
- Cohen MA, Tumlinson A. Understanding the state variation in Medicare home health care: the impact of Medicaid program characteristics, state policy and provider attributes. Medical Care 1997; 35(6): 618-633.
- Kane RL, Wen-Chieh L, Blewett LA. Geographic variation in the use of post-acute care. Health Serv Res 2002; 37(3): 667-682.
APPENDIX A: SNF/IRF PATIENT SCREENING FORM
This Appendix is currently only available in PDF form. It can be viewed at strokePAC-A.pdf.
APPENDIX B: POST-ACUTE CARE ADMISSION INTERVIEW AND 90-DAY TELEPHONE FOLLOW-UP INTERVIEW
This Appendix is currently only available in PDF form. It can be viewed at strokePAC-B.pdf.
APPENDIX C: BARTHEL INDEX CREATION
The Barthel Index for IRF patients was created from the admission IRF-PAI form, using the items and scoring system presented in Table C.1. None of the following items listed were missing on the assessments of interest for computation. Matching admission dates were the matching criteria for IRF patients.
| TABLE C.1: Source of Barthel Index Components from the IRF-PAI Data | |||
| Barthel Component | IRF-PAI Item(s) | Raw Values | Barthel Points |
| Eating | 39Aa | 5, 6, 7 | 10 |
| Eating | 39Aa | 3,4 | 5 |
| Transferring | 39Ia | 5,6,7 | 15 |
| Transferring | 39Ia | 3,4 | 10 |
| Transferring | 39Ia | 2 | 5 |
| Grooming | 39Ba | 5,6,7 | 5 |
| Toileting | 39Fa and 39Ja | (39Fa=5,6,7) and (39Ja=5,6,7) | 10 |
| Toileting | 39Fa and 39Ja | (39Fa=3,4) and (39Ja=3,4) | 5 |
| Toileting | 39Fa and 39Ja | (39Fa=3,4) and (39Ja=5,6,7) | 5 |
| Toileting | 39Fa and 39Ja | (39Fa=5,6,7) and (39Ja=3,4) | 5 |
| Bathing | 39Ca | 5,6,7 | 5 |
| Walking | 39La and 39Laa | (39La=5,6,7) and (39Laa=W) | 15 |
| Walking | 39La and 39Laa | (39La=2,3,4) and (39Laa=W) | 10 |
| Walking | 39La and 39Laa | (39La=1,2,3,4,5,6) and (39Laa=C) | 5 |
| Dressing | 39Ea and 39Da | (39Ea=5,6,7) and (39Da=5,6,7) | 10 |
| Dressing | 39Ea and 39Da | (39Ea=3,4) and (39Da=3,4) | 5 |
| Dressing | 39Ea and 39Da | (39Ea=5,6,7) and (39Da=3,4) | 5 |
| Dressing | 39Ea and 39Da | (39Ea=3,4) and (39Da=5,6,7) | 5 |
| Bowel Incontinence | 39Ha | (39Ha=5,6,7) | 10 |
| Bowel Incontinence | 39Ha | (39Ha=3,4) | 5 |
| Bladder | 30a | (30a=6,7) | 10 |
| Bladder | 30a | (30a=4,5) | 5 |
The Barthel Index for SNF patients was created from the five-day MDS form, using the items and scoring system presented in Table C.2. None of the following MDS items were missing. All assessments were either five-day, 14-day, or none of the above. The assessment chosen was the closest in time to the admission date.
| TABLE C.2: Source of Barthel Index Components from the MDS Data | |||
| Barthel Component | MDS Item(s) | Raw Values | Barthel Points |
| Eating | G1HA | 0 | 10 |
| Eating | G1HA | 1,2 | 5 |
| Transferring | G1BA | 0,1 | 15 |
| Transferring | G1BA | 2 | 10 |
| Transferring | G1BA | 3 | 5 |
| Grooming | G1JA | 0,1 | 5 |
| Toileting | G1IA | 0,1 | 10 |
| Toileting | G1IA | 2 | 5 |
| Bathing | G2A | 0,1 | 5 |
| Walking | G1DA and G5B | G1DA=0 | 15 |
| Walking | G1DA and G5B | G1DA=1,2 | 10 |
| Walking | G1DA and G5B | G1DA=(3,4) and (G5B=1) | 5 |
| Dressing | G1GA | 0,1 | 10 |
| Dressing | G1GA | 2 | 5 |
| Bowel Incontinence | H1A | 0 | 10 |
| Bowel Incontinence | H1A | 1,2 | 5 |
| Bladder Control | H1B | 0 | 10 |
| Bladder | H1B | 1,2 | 5 |
The Barthel Index for HH patients was created from the admission OASIS form, using the items and scoring system presented in Table C.3. None of the OASIS items were missing and the assessment used was either a start of care or resumption of care. The choice was made based on the closest date match to the admission date.
| TABLE C.3: Source of Barthel Index Components from the OASIS Data | |||
| Barthel Component | OASIS Item(s) | Raw Values | Barthel Points |
| Eating | M0710 (current) | 0 | 10 |
| Eating | M0710 (current) | 1 | 5 |
| Transferring | M0690 (current) | 0 | 15 |
| Transferring | M0690 (current) | 1 | 10 |
| Transferring | M0690 (current) | 2,3 | 5 |
| Grooming | M0640 (current) | 0 | 5 |
| Toileting | M0680 (current) | 0 | 10 |
| Toileting | M0680 (current) | 1,2,3 | 5 |
| Bathing | M0670 (current) | 0,1 | 5 |
| Ambulation | M0700 (current) | 0,1 | 15 |
| Ambulation | M0700 (current) | 2 | 10 |
| Ambulation | M0700 (current) | 3 | 5 |
| Dressing | M0650/M0660 (current) | (M0650=0) and (M0660=0) | 10 |
| Dressing | M0650/M0660 (current) | (M0650=1,2) and (M0660=1,2) | 5 |
| Bowel Incontinence | M0540 | 0 | 10 |
| Bowel Incontinence | M0540 | 1,2 | 5 |
| Bladder | M0520/M0530 | M0520=0 | 10 |
| Bladder | M0520/M0530 | (M0520=1) and (M0530=0) | 5 |