
U.S. Department of Health and Human Services
A National Study of Assisted Living for the Frail Elderly: Results of a National Survey of Facilities
Catherine Hawes, Ph.D., Miriam Rose, M.Ed., and Charles D. Phillips, Ph.D., M.P.H.
Myers Research Institute
December 14, 1999
PDF Version: http://aspe.hhs.gov/daltcp/reports/facres.pdf (122 PDF pages)
This report was prepared under #HHS-100-94-0024 and #HHS-100-98-0013 between HHS's ASPE/DALTCP and the Research Triangle Institute. Additional funding was provided by American Association of Retired Persons, the Administration on Aging, the National Institute on Aging, and the Alzheimer's Association. For additional information about this subject, you can visit the DALTCP home page at http://aspe.hhs.gov/_/office_specific/daltcp.cfm or contact the ASPE Project Officer, Gavin Kennedy, at HHS/ASPE/DALTCP, Room 424E, H.H. Humphrey Building, 200 Independence Avenue, S.W., Washington, D.C. 20201. His e-mail address is: Gavin.Kennedy@hhs.gov.
The opinions and views expressed in this report are those of the authors. They do not necessarily reflect the views of the Department of Health and Human Services, the contractor or any other funding organization.
TABLE OF CONTENTS
1. BACKGROUND
1.1 Background on Residential Care for the Elderly
1.2 Emergence and Growth of Assisted Living
1.3 Reasons for the Study
1.4 Organization of the Report
2.1 Study Goals
2.2 Sample Design
2.3 Data Collection
2.4 Analytic Methods
3. DESCRIPTION OF THE ASSISTED LIVING INDUSTRY
3.1 Size of the Assisted Living Industry
3.2 General Characteristics of the Industry
4.1 Privacy
4.2 Accommodations
5. SERVICES AND NURSE STAFFING
5.1 Service Availability
5.2 Nurse Staffing
6. ADMISSION AND DISCHARGE POLICIES
6.1 Admission and Retention Policies
6.2 Resident Characteristics
6.3 Resident Discharges
7. DIFFERENT MODELS OF ASSISTED LIVING
7.1 Self-Described Assisted Living
7.2 Free-Standing Compared to ALFs on Multi-Level Campus
7.3 Different Models of Assisted Living
9. CONCLUSIONS
APPENDICES
APPENDIX A: Telephone Survey Questionnaire
APPENDIX B: Detailed Tables Describing National Sample of Facilities and Their Characteristics
LIST OF EXHIBITS
EXHIBIT ES1: Distribution of Resident Units Between Rooms and Apartments
EXHIBIT ES2: Distribution of Units by Privacy
EXHIBIT ES3: Availability of Services by RN or LPN
EXHIBIT ES4: Distribution of ALFs by Categories
EXHIBIT ES5: Distribution of ALF Monthly Basic Prices
EXHIBIT 1: Hypothesized Relationship Between Assisted Living and Other Types of Residential Long-Term Care
EXHIBIT 2: Final Disposition of the Facility Screening Sample
EXHIBIT 3: Assisted Living Industry Size
EXHIBIT 4: Estimated Distribution of Listing of Candidate ALFs
EXHIBIT 5: General Industry Characteristics
EXHIBIT 6: Distribution of ALFs by Bed Size
EXHIBIT 7: Distribution of ALFs by Affiliation
EXHIBIT 8: Distribution of ALFs by Years in Business
EXHIBIT 9: Distribution of ALFs by Percent of Units That Were Private
EXHIBIT 10: Privacy Levels
EXHIBIT 11: Privacy Comparison Among Self-Described & Other ALFs
EXHIBIT 12: Distribution of Units by Privacy
EXHIBIT 13: Privacy of Resident Bathrooms
EXHIBIT 14: Distribution of Unit Types
EXHIBIT 15: Distribution of Resident Units Between Rooms and Apartments
EXHIBIT 16: Distribution of Rooms by Type
EXHIBIT 17: Distribution of Apartment by Type
EXHIBIT 18: Services Offered
EXHIBIT 19: Nurse Staffing
EXHIBIT 20: Facility Practice on Availability of Services by RN or LPN
EXHIBIT 21: Admission & Retention Policies
EXHIBIT 22: Comparison of Resident Characteristics by Setting
EXHIBIT 23: Comparison of Self-Described and Other ALFs
EXHIBIT 24: Comparison of Free-Standing & Multi-Level ALFs
EXHIBIT 25: Comparison Between High and Low Privacy ALFs
EXHIBIT 26: Comparison Between High and Low Services ALFs
EXHIBIT 27: Comparison Between High Service ALFs and Low Service ALFs That Were Willing To Arrange Nursing Services
EXHIBIT 28: Distribution of ALFs by Categories
EXHIBIT 29: Differences in ALF Characteristics Based on Combined Levels of Services and Privacy
EXHIBIT 30: Monthly Prices
EXHIBIT 31: Distribution of Average Basic Monthly Rates
EXHIBIT 32: Differences in ALF Prices Based on Combined Levels of Service and Privacy
EXHIBIT 33: Comparison of Income of Persons Aged >75 and Average ALF Basic Yearly Rates
LIST OF TABLES
TABLE B1: General Characteristics of Facilities
TABLE B2: Facility Characteristics--Privacy and Services
TABLE B3: Facility Retention and Admission Policies
TABLE B4: Services Offered and Residential Characteristics
TABLE B5: Comparison Among ALFs Based on Services and Privacy--General Characteristics
TABLE B6: Comparison Among ALFs Based on Services and Privacy
TABLE B7: Comparison Among ALFs Based on Services and Privacy--Retention and Admission Policies
TABLE B8: Comparison Among ALFs Based on Services and Privacy--Services Offered and Resident Characteristics
TABLE B9: Comparison Between Single-Level and Multi-Level Facilities--General Characteristics
TABLE B10: Comparison Between Single-Level and Multi-Level Facilities--Privacy and Services
TABLE B11: Comparison Between Single-Level and Multi-Level Facilities--Retention and Admission Policies
TABLE B12: Comparison Between Single-Level and Multi-Level Facilities--Services Offered and Resident Characteristics
TABLE B13: Comparison Between Self-Described ALFs and Other Eligible Facilities--General Characteristics
TABLE B14: Comparison Between Self-Described ALFs and Other Eligible Facilities--Privacy and Services
TABLE B15: Comparison Between Self-Described ALFs and Other Eligible Facilities--Retention and Admission Policies
TABLE B16: Comparison Between Self-Described ALFs and Other Eligible Facilities--Services Offered and Resident Characteristics
TABLE B17: Comparison Between High and Low Service Facilities--General Characteristics
TABLE B18: Comparison Between High and Low Service Facilities--Privacy and Services
TABLE B19: Comparison Between High and Low Service Facilities--Retention and Admission Policies
TABLE B20: Comparison Between High and Low Service Facilities--Services Offered and Resident Characteristics
TABLE B21: Comparison Between High and Low Service Facilities--General Characteristics
TABLE B22: Comparison Between High and Low Service Facilities--Privacy and Services
TABLE B23: Comparison Between High and Low Service Facilities--Retention and Admission Policies
TABLE B24: Comparison Between High and Low Service Facilities--Services Offered and Resident Characteristics
EXECUTIVE SUMMARY
This is the first in a series of planned reports based on data collected from surveys of a national probability sample of assisted living facilities. These data were collected as part of a study, "A National Study of Assisted Living for the Frail Elderly," funded by the U.S. Department of Health and Human Services, Office of the Assistant Secretary for Planning and Evaluation (ASPE), with additional support provided by the AARP, the Administration on Aging (AoA), the National Institute on Aging (NIA), and the Alzheimer's Association.
This report presents data from a telephone survey of the administrators of assisted living facilities across the country. These facilities were selected from a national probability sample of all facilities that met the criteria for inclusion in the study. Thus, the findings are representative of the industry as a whole. As such, they represent the first empirical data on the characteristics of the assisted living industry nationwide based on a representative national sample of facilities.
STUDY PURPOSE
The overall purpose of the study was to learn about the role assisted living facilities play in providing a residential setting and supportive long-term care services to the elderly. The specific objectives of this telephone survey were to:
-
Determine the size and nature of the supply of assisted living facilities
-
Describe the basic characteristics of the assisted living industry particularly in terms of the services, accommodations and basic price
-
Begin examining the extent and way in which the current supply of facilities embodies the key philosophical tenets of assisted living, and
-
Identify facilities for subsequent, more extensive data collection.
STUDY METHODS
In order to conduct the survey and obtain generalizable results, the project staff implemented a complex, multi-stage sampling design. At the first stage, project staff selected a random sample of 60 geographic areas, known as first stage sampling units (FSUs). These 60 FSUs were comprised of 1,086 counties in 34 states. In these geographic areas, project staff created a comprehensive listing of places thought to be assisted living facilities. Staff used a combination of sources to create this list, including state licensure agencies, industry trade associations, local and national retirement directories, telephone book "yellow" page advertisements, and Internet listings.
Tamara HodlewskyNational Center for Assisted Living, 1998
From this list of potential candidate facilities, project staff selected a stratified, random sample of 2,945 places. These places were then surveyed by telephone to determine their eligibility for the study and, if eligible, to secure information about the facility's size, services, price and accommodations.
Eligibility Criteria. The study's three basic eligibility criteria were that a facility had to:
1. Have more than ten beds1
2. Serve a primarily elderly population
In addition, the facility either had to:
3a. Represent itself as an assisted living facility
OR
3b. Offer at least a basic level of services, which were:
- 24-hour staff oversight
- Housekeeping
- At least 2 meals a day, and
- Personal assistance, defined as help with at least two of the following: medications, bathing, or dressing.
The administrators of a sample of 2,945 candidate facilities were then surveyed by telephone during 1998. If the candidate facility met the study eligibility criteria specified in a set of screening questions, then the administrator was asked to respond to questions about the facility, its size, occupancy, accommodations, services, price and basic admission and discharge criteria. A total of 1,251 facilities were contacted, found to be eligible, and interviewed.
The results of this screening activity and of the more extended telephone survey are the topic of this report. The results reported here are statistical estimates about the universe of assisted living facilities, based on responses from the nationally representative probability sample of facilities that were surveyed.
RESULTS
-
SIZE OF THE ASSISTED LIVING INDUSTRY
There were an estimated 11,459 assisted living facilities (ALFs) nationwide, with approximately 611,300 beds and 521,500 residents, as of the beginning of 1998.
-
GENERAL CHARACTERISTICS OF THE ASSISTED LIVING INDUSTRY
The average bed-size was 53 beds; 67 percent of the ALFs had 11-50 beds; 21 percent had 51-100 beds; and 12 percent had more than 100 beds. Facility occupancy averaged 84 percent. The average length of time the ALFs had been in business was 15 years, but slightly more than half (58%) of the ALFs had been in business for 10 years or less. About one-third (32%) had been in business no more than five years.
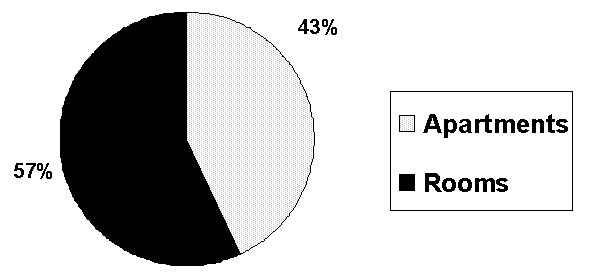
| EXHIBIT ES1. Distribution of Resident Units Between Rooms and Apartments2 |
 |
-
ACCOMMODATIONS
Unit Type. A room was the dominant type of resident unit (57%) in ALFs; 43 percent of the units were apartments.2 The most common type of room was a private room with a full bathroom (42% of all single rooms). The most common type of apartment was a one-bedroom, single occupancy apartment (41%).
Privacy. Most assisted living facilities offered consumers a range of options in terms of private or shared accommodations. Only 27 percent of the facilities had all-private accommodations. A plurality of ALFs (45%) had a mix of private and shared units. However, slightly more than one-fourth of the ALF administrators (28%) reported that the facility had at least one bedroom shared by three or more residents.
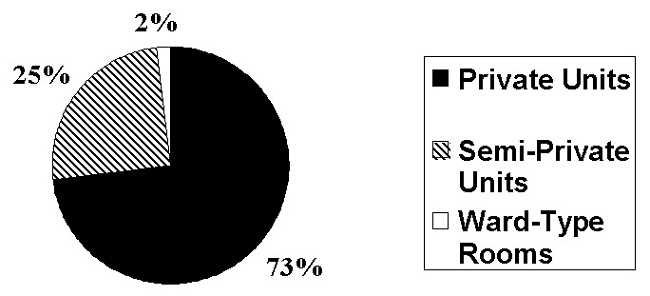
Although ALFs offered residents a range of options, 73 percent of all resident units were private. Twenty-five percent of the units were semi-private, that is, shared by two unrelated persons. Two percent of resident units were in "ward-type" rooms that housed three or more unrelated persons.
| EXHIBIT ES2. Distribution of Units by Privacy |
 |
Bathrooms. While nearly three-quarters (73%) of the rooms or apartments were private, slightly less than two-thirds (62%) of the units offered a private full bathroom (i.e., toilet, sink and shower or tub). An additional six percent of the units had a private "half" bath (i.e. toilet and sink) but no bathing facilities except communal facilities shared with other residents. Thus, more than one-third (38%) of all ALF units required the resident to share a bathroom.
-
SERVICES AND NURSE STAFFING
General Services. Nearly all facilities provided or arranged 24-hour staff, three meals a day, and housekeeping. More than 90 percent of the ALF administrators also reported that the facility provided medication reminders and assistance with bathing and dressing; 88 percent of the ALFs provided or arranged central storage of drugs or assistance with administration of medications.
Nurse Staffing. Almost three-quarters of the ALFS (71%) had a licensed nurse, either a registered nurse (RN) or licensed vocational nurse (LVN), working on staff full- or part-time. Slightly more than half of the ALFs (55%) reported having an RN on staff either full or part- time. Forty percent of the ALFs reported having a full-time RN on staff.
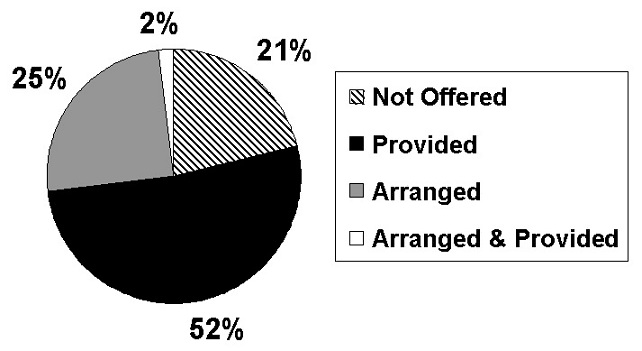
Providing or Arranging Services. Administrators were also asked whether the facility provided services with their own staff or arranged with an outside agency for the provision of the service. With the exception of therapies, if an ALF offered a service, such as help with bathing, dressing, and managing medications, most provided it with their own staff. About half (52%) of the facilities provided some care or monitoring by a licensed nurse (RN or LPN) with their own staff, and one-quarter (25%) arranged for nursing care with an agency. However, one in five ALF administrators (21%) reported that the facility did not arrange or provide any care or monitoring by a licensed nurse.
| EXHIBIT ES3. Availability of Services by RN and LPN |
 |
-
ADMISSION & RETENTION POLICIES
Most ALFs reported a willingness to admit residents with moderate physical limitations, such as using a wheelchair (71%) or needing help with locomotion (62%) (i.e., walking or using a wheelchair or cart). But fewer than half the ALFs (44%) were willing to admit residents who needed assistance with transfers (i.e., in or out of bed, a chair or wheelchair). Administrators also reported that fewer than half the ALFs would admit a resident with moderate to severe cognitive impairment (47%).3
Facilities also had criteria about the retention of residents with certain types of conditions or problems, although, as with admission policies, many facilities had idiosyncratic policies (see footnote #3). Nearly one-third of the administrators (31%) reported that the ALF would not retain a resident who used a wheelchair (or that "it depends"), and 38 percent would discharge a resident who needed assistance with locomotion. Fewer than half (45%) of the ALFs would definitely retain a resident with moderate to severe cognitive impairment, and 76 percent would not retain residents with behavioral symptoms (e.g., wandering). Seventy-two percent of the ALFs would not retain a resident who needed nursing care for more than 14 days. Nearly three-quarters of the ALFs (72%) reported that one of more of their residents had been discharged within the last six months because the resident needed skilled nursing care.
-
RESIDENT CHARACTERISTICS
ALF administrators estimated that about 24 percent of their residents received help with three or more activities of daily living (ADLs), such as bathing, dressing, and locomotion. They estimated that about one-third of the residents (34%) had moderate to severe cognitive impairment.
-
DIFFERENT MODELS OF ASSISTED LIVING
The information provided by administrators identified two significant variations among the ALFs that are worth noting. One group of ALFs identified or described themselves as assisted living facilities. Another much smaller group provided the same basic services but identified themselves by some other designation, such as adult congregate living, residential care, or community residential facility. Another significant variation was between ALFs that were free-standing and ALFs located on a campus that offered multiple levels of care. Such "multi-level" campuses typically housed an ALF and a nursing home or some other type of residential care, such as congregate apartments or independent living facilities.
Self-Described ALFs. Seven of ten (72%) of the administrators represented or described the facility as being an "assisted living facility or residence." Twenty-eight percent of the administrators did not describe the facility as assisted living; however, the facility still met study eligibility criteria. Despite the differences in how the administrators characterized the facilities, the two groups of facilities were remarkably similar in terms of their size, the services they offered, their nurse staffing, most admission and retention criteria, and the basic characteristics of their residents. Self-described ALFs, however, tended to have lower occupancy rates, had been in business for a shorter period of time, were more likely to offer apartments and private units, and were more likely to admit and retain residents who used a wheelchair or received help with locomotion. They also tended, on average, to have higher monthly prices.
Free-Standing ALFs Compared to ALFs Located on a Multi-Level Campus. The majority of ALFs (55%) were free-standing, while 45 percent were located on a campus housing multiple facilities or residential settings offering different levels of care. ALFs on a multi-level campus had higher occupancy rates and tended to have higher monthly prices than free-standing ALFs. They were also more likely to have private units and apartments and to provide or arrange more services for residents, most notably nursing care and therapies. ALFs on multi-level campuses also tended to have higher levels of nurse staffing than free-standing ALFs. In addition, they were more likely to admit and retain residents who needed nursing care and residents who used a wheelchair. Despite this, the administrators did not report having a "heavier care" resident case mix than the free-standing ALFs.
Categorization of ALFs By Combined Levels of Service and Privacy. Any attempt to understand assisted living and its role in providing long-term care to the frail elderly is hindered by the lack of a common definition of "assisted living." Currently, places known as ALFs differ widely in ownership, auspice, size, services, staffing, accommodations, and price. Thus, analyzing data on facilities and reaching conclusions about "assisted living" as a whole involves comparing "apples to oranges." As a result, project staff developed a classification that divided the universe of assisted living facilities into distinct categories or types of facilities, representing their mix of services and privacy. The four types the study identified represent reasonably homogeneous groups of facilities. Moreover, the data revealed significant differences among groups.
Definitions of high, low and minimal privacy. "High privacy," meant that at least 80 percent of the resident units were private. A total of 31 percent of the facilities met this definition of high privacy. Twenty-eight percent of the ALFs offered "minimal privacy" because they had one or more rooms that housed at least three residents. The remainder of the ALFs (41%) fell between these two types of facilities in a "low privacy" category.
Definitions of high, low and minimal services. "High services" was defined as having a full-time RN on staff and providing nursing care, as needed, with facility staff, as well as providing help with at least two ADLs, 24-hour staff, housekeeping, and at least 2 meals a day. Thirty-one percent of the ALFs met this criterion. Five percent of the ALFs did not offer help with even two ADLs and were thus defined as providing "minimal" services. The remaining ALFs (65%)4 were categorized as "low service," although some that did not provide nursing care with their own staff were willing to arrange a higher level of services through an outside provider, such as a home health agency.5
Combining the mix of services and privacy revealed four basic types of ALFs. The first type of ALF combined facilities in the "minimal" group of ALFs (i.e., the 32% with either minimal privacy or minimal services) and facilities offering low privacy and low service (i.e., 27% of the ALFs). The combined low/minimal privacy and services group was the most common type of assisted living facility, comprising 59 percent of all the ALFs. This type of assisted living facility cannot be easily distinguished from the traditional concept of board and care homes. A significant proportion of resident rooms were shared rather than private, and such facilities offered little beyond assistance with medications, bathing, or dressing. In two of five (41%) ALFs described by this model, there was at least one room shared by three or more people. Facilities of this type not only represented the majority of all ALFs nationwide, they also constituted 58 percent of all the facilities that described themselves as assisted living.
| EXHIBIT ES4. Distribution of ALFs by Categories | |
| Category | National Estimate |
| 1a. Low Privacy & Low Service | 27% |
| 1b. Minimal Privacy or Service | 32% |
| 2. High Privacy & Low Service | 18% |
| 3. High Service & Low Privacy | 12% |
| 4. High Privacy & High Service | 11% |
Another ALF type offered a high degree of privacy in accommodations but low services, a sort of "cruise ship" model of assisted living. In this type of ALF, more than 80 percent of the accommodations were private. However, these facilities would have had a difficult time helping residents age in place, since they had no RN on staff and most were unwilling or unable to provide or arrange any nursing care for residents. Only 19 percent of the ALFs in this model would provide or arrange nursing care and retain a resident who needed such care. This ALF type comprised 18 percent of all ALFs nationwide.
A third type of ALF was one described as high service/low privacy. In such facilities, two-thirds of the accommodations were in single rooms rather than apartments, and fewer than 80 percent of the rooms were private. However, all such facilities had a full-time RN on staff. About half (53%) the ALFs of this type were willing to provide or arrange nursing care, as needed, and retain residents who needed such care. This was also the type of ALF that had the most expansive admission and retention criteria and the highest resident acuity. For example, such facilities were more likely to retain residents who needed assistance with transfers and to retain residents who needed nursing care. Compared to the other ALF types, the high service/low privacy type also had a much higher proportion (35%) of residents who received assistance with three or more activities of daily living (ADLs), such as help with locomotion or using the toilet, as well as bathing and dressing. An estimated 12 percent of the ALFs across the country were in this category.
A fourth type of ALF offered high service and high privacy. Only 11 percent of all ALFs fell into this category. While resident accommodations were almost evenly split between rooms and apartments, nearly all (98%) of the accommodations were private. In addition, 41 percent of the high service/high privacy ALFs offered to arrange or provide nursing care and retain residents who needed such care. All had an RN on staff.
-
PRICE OF ASSISTED LIVING
There were many variations in pricing structure among the ALFs nationwide. Some ALFs had a single monthly price for what they defined as basic services and accommodations. Other ALFs had multiple rates, varying with either the type of accommodation or the service package provided to the resident.
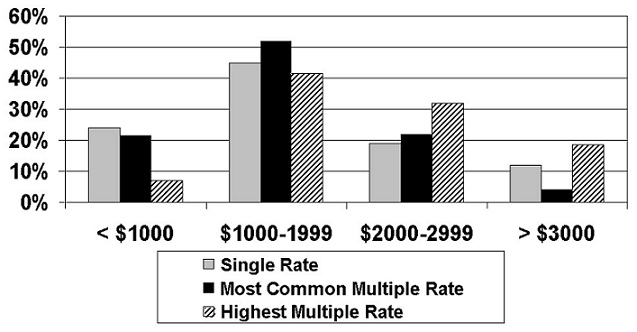
The most common monthly basic price was between $1000 and $1999 for both facilities with a single rate (i.e., 45% were in this range) and facilities with multiple rates (i.e., the range covered the most common rate for 52% of the ALFs). Thus, the most common basic price was between $12,000 and $24,000 per year. However, it is important to note that the average price was depressed by the presence of a very large number of ALFs (59%) that offered minimal or low privacy and services and had relatively low monthly rates. The most common base price for facilities with multiple rates was just over $22,000 per year for the high service/low privacy ALFs and just over $21,000 for the high privacy/low service ALFs. The basic annual charge was slightly more than $23,000 for the high service/high privacy ALFs.
| EXHIBIT ES5. Distribution of ALF Monthly Basic Prices |
 |
These rates are striking for two reasons. First, in many ALFs, they do not cover all services. Residents often pay extra for such services as medication administration, transportation, and any assistance with ADLs or nursing care above the minimum covered by the basic rate in a facility.
Second, the rates are largely out of reach for most low-income older persons and unaffordable for many moderate-income elderly, unless they supplement their income with additional funds generated by disposal of their assets. According to data from the U.S. Bureau of the Census,6 40 percent of persons aged 75 and older had incomes in 1997 of less than $10,000 per year. Eight-four percent of persons aged 75 and older had incomes of less than $25,000 per year in 1997. This would make the average high service ALF or the average high privacy ALF unaffordable for the vast majority of older persons, particularly since they must also pay for other basic needs (e.g., supplemental insurance, out-of pocket spending on health care and medications, clothing).7
CONCLUSIONS
-
WHAT IS ASSISTED LIVING?
Any attempt to understand assisted living and its role in providing long-term care to the frail elderly is hindered by the lack of a common definition of "assisted living." Places known as ALFs differed widely in ownership, auspice, size, and philosophy. Indeed, the results of this national survey identified four different types of ALFs within the industry that had very different patterns with respect to accommodations, services, staffing, policies on admission and retention of residents, and price. Some of these types, such as those offering high privacy and the high privacy/high service ALF, appeared to be consistent with the philosophy of assisted living. Other types, such as the low-minimal privacy/low service types were much closer to the traditional concept of domiciliary care or board and care, with few services and relatively little privacy.
-
DOES THE ENVIRONMENT OF ALFS MATCH THE PHILOSOPHY OF ASSISTED LIVING?
The answer to this question is mixed. On the one hand, residents of assisted living facilities had considerably more privacy and choice than residents of most nursing homes and the majority of board and care homes. On the other hand, there was significant variability within the assisted living industry, and a substantial segment of the industry provided environments that did not appear consistent with the environmental aspects of the assisted living philosophy.
-
DO ALF SERVICES MATCH THE PHILOSOPHY OF ASSISTED LIVING?
The ability of assisted living facilities to meet health-related unscheduled needs of residents is still an open question - in part because of facility policies (e.g., staffing, retention criteria or discharge policies) and in part because of potential constraints imposed by state licensure regulations.
-
CAN ALF RESIDENTS AGE IN PLACE?
The answer depends on one's concept of aging in place. For example, in most ALFs, a resident could move from relative independence (e.g., needing or wanting only meal preparation, housekeeping, and staff that can respond to emergencies) to a more complex stage at which the resident needed help with bathing, dressing, and managing medications and used a wheelchair to get around. If this "span" or change in needs were the definition of "aging in place," then the admission and retention policies of ALFs suggested that they were willing to allow residents to age in place.
On the other hand, if aging in place meant that the average consumer could select an assisted living facility and reasonably expect to live there to the end of his or her life, regardless of changes in health or physical and cognitive functioning, then the answer must be "no." In most ALFs, a resident whose functional limitations necessitated help with transfers or whose cognitive impairment progressed from mild to moderate or severe or who exhibited behavioral symptoms would be discharged from the facility. The same was true for a resident who needed nursing care for more than two weeks.
Thus, there was a limitation in terms of the ability of ALF residents to age in place.
-
IS ASSISTED LIVING AFFORDABLE FOR LOW AND MODERATE INCOME OLDER PERSONS?
Assisted living was largely not affordable for moderate and low-income persons aged 75 or older unless they disposed of their assets and spent them down to supplement their income. Further, to the degree that some assisted living facilities were affordable for low- and moderate-income older persons, they were more likely to be ALFs categorized as low-minimal service/low-minimal privacy facilities.
1. BACKGROUND
A variety of demographic factors and policy initiatives have led to increased demand for residential facilities that offer supportive services for the frail elderly. These factors include:
-
A rapidly growing elderly population with significant levels of physical disability and mental impairment;
-
A strong preference of the elderly for in-home and community-based services rather than nursing homes;
-
Incentives at the state level to constrain the use of nursing homes.
- Personal care homes
- Residential care facilities for the elderly
- Adult congregate living facilities
- Homes for the aged
- Domiciliary care homes
- Assisted living facilities
Although families continue to be the major source of long-term care, a variety of residential settings with supportive services have emerged to supplement their efforts. These arrangements support those families whose members need more care than the family can provide and the elderly and disabled who have no family. Other than nursing homes, the most common form of residential setting with services for people with disabilities is the entity generically known as "board and care" homes. This term is used in a variety of ways across the states; however, in general "board and care" refers to non-medical community-based residential settings that house two or more unrelated adults and provide some services such as meals, medication supervision or reminders, organized activities, transportation, or help with bathing, dressing, and other activities of daily living (ADLs).
1.1 BACKGROUND ON RESIDENTIAL CARE FOR THE ELDERLY
In most states, entities known as "assisted living" have been considered part of the residential care or board and care home sector. Board and care or residential care are the generic terms often used to describe various types of housing with supportive long-term care services, exclusive of licensed nursing homes. Board and care homes are regulated at the state level, and each state has different definitions and names for these facilities.8 The best estimate is that there are more than thirty names for licensed residential care facilities, and they are regulated by more than sixty different state agencies (Hawes, Wildfire and Lux, 1993; Mollica, 1998). In addition, more recently, many states have renamed or expanded the category of residential care facilities to include a specific category known as "assisted living" (Mollica, 1998).
Tamara Hodlewsky, National Center on Assisted Living, 1998
Traditionally, board and care homes served a mixed population of residents. These homes fell into one of three basic types of licensed facilities (Clark et al., 1994): (1) homes serving residents with mental retardation or developmental disabilities; (2) homes serving residents with mental illness; and (3) homes serving a mixed population of physically frail elderly, cognitively impaired elderly, and persons with mental health problems (Clark et al., 1994). Most board and care homes fell into this last category, but many still cared for residents with a wide range of needs and disabilities, including sizeable numbers of persons with psychiatric conditions. Assisted living facilities, however, mainly serve only the frail elderly.
1.2 EMERGENCE AND GROWTH OF ASSISTED LIVING
Starting in the late 1980s and early 1990s, this population of board and care homes expanded to include a growing number of facilities that identified themselves as "assisted living facilities," although most states did not have a specific licensure category with this designation. According to estimates generated from the National Health Provider Inventory based on a 1991 survey, there were an estimated 34,000 licensed board and care homes in the United States, including facilities known as assisted living, with more than 613,000 beds (Clark et al., 1994). A 1991/92 survey of state licensing agencies found a higher number, with an estimated 34,000 homes serving only older persons (Hawes, Wildfire and Lux, 1993). Added to this were an unknown number of unlicensed homes, some of which were assisted living facilities. A ten-state study that enumerated unlicensed homes estimated that, on average, the supply of unlicensed homes in 1993 was about 12 percent of the licensed supply serving a mainly elderly population (or elderly/mixed) (Hawes et al., 1995a). Applying this estimate to the nation would mean that, as of 1993, there were probably 38,000 licensed and unlicensed residential care homes with something between 800,000 and 900,000 beds serving an elderly/mixed population. Adding an estimated 7,000 places serving only persons with persistent mental illness or developmental disabilities brought the estimated total of all residential care beds to nearly one million (Clark et al., 1994; Hawes et al., 1995; Hawes, Wildfire and Lux, 1993; U.S. House, 1989). As a point of comparison, there were an estimated 17,000 licensed nursing homes with approximately 1.68 million beds serving more than 1.5 million nursing home residents (DuNah et al., 1993).
This supply of residential care facilities significantly expanded with the recent growth of assisted living facilities. By the mid-1990s, the most rapidly expanding type of residential care was among facilities known as "assisted living." Assisted living originally developed as a Scandinavian model of residential long-term care, emphasizing the importance of the social aspects of care and departing from what is generally termed a "medical" model or organization of the care setting (Coleman, 1995). Essentially, the goal of a social model of care is to create a normal, homelike living environment that is organized around promoting independence rather than the provision of health care services or performance of personal care assistance tasks.
1.2.1 What Is the Philosophy of Assisted Living
Assisted living means different things to different people, but there is general agreement on the key aspects of what constitutes assisted living. For example, one commonly accepted definition has been offered by Kane and Wilson (1993):
Any residential group program that is not licensed as a nursing home, that provides personal care to persons with need for assistance in daily living, and that can respond to unscheduled needs for assistance.
- Services and oversight available 24-hours a day
- Services to meet scheduled and unscheduled needs
- Care & services provided or arranged so as to promote independence
- An emphasis on consumer dignity, autonomy and choice
- An emphasis on privacy and a homelike environment
A similar but more expansive definition was specified by the Assisted Living Quality Coalition. This coalition is a group representing consumer groups (the Alzheimer's Association and AARP) and provider associations (the American Association of Homes and Services for the Aging [AAHSA], the Assisted Living Federation of America [ALFA], the American Seniors Housing Association [ASHA], and the American Health Care Association's [AHCA]/ National Center for Assisted Living [NCAL]). According to the Coalition, an assisted living setting is:
A congregate residential setting that provides or coordinates personal services, 24-hour supervision and assistance (scheduled and unscheduled), activities, and health related services; designed to minimize the need to move; designed to accommodate individual residents' changing needs and preferences; designed to maximize residents' dignity, autonomy, privacy, independence, and safety; and designed to encourage family and community involvement.
As would be expected, the provider associations that belong to the Coalition espouse definitions that are very much in line with the Coalition's. For example, ALFA defined an "assisted living" residence as:
A special combination of housing, supportive services, personalized assistance and healthcare designed to respond to the individual needs of those who need help with activities of daily living (ADLs) and instrumental activities of daily living (IADLs). Supportive services are available, 24 hours a day, to meet scheduled and unscheduled needs, in a way that promotes maximum dignity and independence for each resident and involves the resident's family, neighbors and friends (ALFA, 1996).
AAHSA also emphasized the central tenets of choice, privacy and dignity and noted that in assisted living, services may be provided or arranged:
Assisted living is a program that provides and/or arranges for the provision of daily meals, personal and other supportive services, health care and 24-hour oversight to persons residing in a group residential facility who need assistance with activities of daily living and instrumental activities of daily living. It is characterized by a philosophy of service provision that is consumer driven, flexible and individualized and maximizes consumer independence, choice, privacy and dignity (Gulyas, 1997).
Assisted Living Quality Coalition, 1998
Similarly, an investment banking firm defined assisted living as:
A combination of housing and services provided in facilities that are designed as multi-unit properties containing communal dining and recreation areas. The facilities offer a broad spectrum of continuous or as-needed services to elderly senior citizens in an effort to promote their independence and personal dignity while replicating a safe and home-like environment for them to age in place (Conway et al., 1997).
Finally, the National Center for Assisted Living noted an important distinction regarding the place of assisted living in the continuum of long-term care services:
Assisted living represents an option of care that is generally less than that provided by and required of skilled nursing facilities but more than is offered by independent living apartment complexes (Hodlewsky, 1998).
In summary, there is substantial agreement among provider and consumer groups about the key elements of the assisted living philosophy. Moreover, some, like the Assisted Living Quality Coalition, argue that some of these elements or principles distinguish it from other types of long-term care. There is less agreement on the degree to which the current industry embodies those principles.
1.2.2 Variability Among "Assisted Living" Facilities
In the view of many observers in the United States, assisted living facilities represent a promising new model of long-term care, one that blurs the sharp and invidious distinction between nursing homes and community-based long-term care and reduces the chasm between receiving long-term care in one's own home and in an "institution." In addition, assisted living facilities are thought to provide (or be capable of providing) a range of long-term care services that makes them a viable but less institutional alternative to nursing homes (Kane & Wilson, 1993; Mollica and Snow, 1996; Wilson, 1993).
Tamara Hodlewsky, National Center for Assisted Living, 1998
Other observers hold a more jaundiced view of the performance of the industry. First, some evidence suggests that assisted living predominantly serves a private-pay market of well-to-do elderly. If true, this would make its reality more limited than its promise. In addition, there is ample evidence of considerable variability in the ownership, auspice, operation, size, service package, physical plant, and client orientation in the industry (Manard et al., 1992). Indeed, even among industry trade associations there is no uniformity among the various facilities known as assisted living. For example, members of ALFA include both "purpose-built" assisted living facilities with private apartments and providers from the National Association of Residential Care Facilities (NARCF), which merged with ALFA. NARCF represented older, more traditional board and care homes in which the predominant accommodation is in a semi-private bedroom. Thus, even within ALFA, there is considerable variation. As the National Center on Assisted Living observes:
Assisted living...is known by dozens of different terms throughout the country...The multitude of names for assisted living reflects the diversity of services offered in the cloudy nexus between retirement housing and skilled nursing care (Hodlewsky, 1998).
Many places that call themselves assisted living are licensed as board and care homes and look like board and care homes. Others are "purpose-built" assisted living facilities whose physical plant and other environmental characteristics are quite distinct from most board and care homes. However, even in purpose-built facilities, studies find tremendous variability in their basic policies, the services they provide, their approach to care, and the resident population they serve. Indeed, many assisted living facilities look very similar to what have traditionally been known as board and care homes (Hawes et al., 1995b; Kane and Wilson, 1993; Lux, 1995).
Given these factors, there is likely to be considerable variation in how assisted living facilities define their role and how they operationalize key concepts of consumer autonomy and choice. Evidence from a prior survey of ALF administrators found that there was substantial variation in policies and practices on several issues thought to be related to consumer autonomy and choice. For example, almost half the facilities surveyed by Kane and Wilson (1993) reported they had assigned seating of residents at meals; 60 percent reported they did not require staff to knock on residents' doors before entering their rooms or apartments. Only half allowed overnight guests in the tenant's room/apartment. Only 14 percent said that it was the tenant's choice to refuse services, and one-third said such refusal was grounds for discharge.
In short, there are significant variations in the environment, services, and policies about resident autonomy among facilities known as "assisted living." Thus, even if some assisted living facilities embody the key tenets of assisted living's philosophical model, that is, the autonomy, dignity, and service flexibility that facilitates maximum independence and aging-in-place, the degree to which this model predominates or is even widespread in the industry is unknown.
There are several reasons for this variability. First, assisted living has not developed in an orderly, planned manner. It began largely as a market phenomenon, one thought to be responsive to consumer preferences and local conditions, rather than a planned outgrowth of public policy (i.e., regulatory and reimbursement policy) (Kane and Wilson, 1993; Manard et al., 1992; Mollica and Snow, 1996). Second, there are no federal regulations, oversight , or federal minimum standards for assisted living. Instead, regulation, where it exists, is a state responsibility. As a result, there has been enormous variation across the country in (a) the degree to which assisted living facilities are regulated and (b) the way they are regulated (Mollica and Snow, 1996; Mollica, 1998). Third, to some degree, the term "assisted living" may be more significant as a marketing tool than as a useful descriptor of a facility that distinguishes it from other residential care settings. For example, as previously noted, many of the members of ALFA were formerly members of the National Association of Residential Care Facilities (NARCF), but assisted living has been viewed as the more appealing "name." Thus, many members simply began calling themselves assisted living rather than residential care facilities.
In the sections that follow, we describe the expansion of assisted living and the emerging role of public policy in fueling and shaping that growth.
1.2.3 Growth of Assisted Living
From its start in the United States in the late 1980s, mainly in Oregon, assisted living has become the most rapidly growing source of residential care for the elderly (American Seniors Housing Association [ASHA], 1998; Citro and Hermanson, 1999; Mollica, 1998). For example, construction of housing for seniors grew by 11 percent between 1997 and 1998,9 with assisted living residences dominating the new construction. Indeed, assisted living represented three-quarters of all new senior housing construction (ASHA, 1998). This pattern of rapid growth has been particularly striking among larger assisted living facilities (>25 beds) and among high-profile, publicly-traded multi-facility systems. For these firms, such as Sunrise, Assisted Living Concepts, Marriott, and American Retirement Villas, more than half their total supply of facilities were developed or acquired in a five-year period between 1991 and 1996.
- The aging of the population
- Consumer demand
- Changing health care delivery & service practices
- Advances in civil rights for persons with disabilities
- Public policies, particularly those aimed at limiting nursing home use
- State interest in substituting other forms of residential care for nursing home care
- Availability of financing for construction and conversion
This growth has been, in no small measure, the product of investor interest in fabled returns being earned by some firms. For example, The SeniorCare Investor ranked one of the major assisted living corporations as having the most outstanding stock market performance in 1998. This firm had a return to shareholders of 159 percent, a rate that far outstripped the rates achieved by firms concentrated in nursing homes, subacute care, and traditional residential care facilities (SeniorCare, 1998). In fact, in 1997-98, seven of the top ten stock market performers in the area of senior care were assisted living companies, with an average return for the group of 47 percent (SeniorCare, 1998).
Predictably, stock analysts were bullish about assisted living. Fortune magazine identified assisted living as one of the top three potential growth industries for 1997 (GAO, 1997). Similarly, the investment banking firm of Salomon Brothers reported in 1997, "we are enthusiastic about the sector and the underlying factors driving its explosive growth" (Conway, MacPherson and Sfiroudis, 1997). As a result, both the stock market and lenders provided considerable support to companies wishing to expand (Conway, MacPherson and Sfiroudis, 1997; Leaman, 1998; Meyer, 1998; Manard and Cameron, 1997).10
Despite this growth and soaring interest among lenders and developers in the mid-1990s, assisted living is still "new enough that the businesses offering it and the states that license it do not agree on a precise definition," as observed by the National Center for Assisted Living (Hodlewsky, 1998).
1.2.4 Expansion of State Involvement in Assisted Living
The last decade has seen a tremendous expansion in state activity regulating and paying for assisted living; however, this has led to greater variability rather than a common definition of what assisted living is or should be.
While assisted living initially developed as a market phenomenon in the absence of much regulation or public financing (except for Oregon), states have moved fairly rapidly to develop and implement assisted living regulations. The first licensure regulation specifically directed at assisted living was in Oregon in 1989. By 1992, fewer than 10 states had such regulations in place. By 1994, 14 states had developed regulations or enacted legislative statutes. By the summer of 1996, that had grown to 22 states, with an additional 10 states having study commissions addressing how to regulate and pay for assisted living. Further, the number of states providing some type of Medicaid funding for Medicaid eligible elderly in assisted living facilities (mainly through Medicaid waiver programs) grew from 10 to 21 between 1994 and 1996. Indeed, by 1996, when combining all State activities -- legislation, current regulation, study commissions, and Medicaid funding -- only 14 states had no activity related to assisted living (Mollica and Snow, 1996).
By 1998, 30 states had passed legislation or issued regulations, and 22 states had licensing regulations using the term "assisted living," up from 15 in 1996. Other states were considering draft regulations or revising their regulations, and 35 states reimburse or plan to reimburse services in assisted living or board and care facilities as a Medicaid-covered service (Mollica, 1998).
Although there has been increasing state policy activity, to date, no consensus has emerged on the appropriate regulatory model for assisted living. As Mollica and Snow noted (1996), the models varied. In some states, policies sought to create assisted living as a unique long-term care arrangement, with distinctive environmental features (e.g., requiring that assisted living facilities provide apartments with kitchens). Other states, however, basically allowed the same types of accommodations and services as board and care homes (Mollica, 1998). In addition, states differed on whether the features that ought to be subject to regulation should include the housing component or should be limited to only the service component, in effect treating assisted living as a kind of "home health" service (Mollica, 1998; Mollica and Snow, 1996). Thus, regulation was a contributor to the emergence of different models of assisted living around the country, leading to a lack of uniformity on environment, services, and other policies. As Mollica and Snow (1996) observed:
A common definition or understanding of assisted living grows increasingly unlikely as state policy makers, legislators, consumers and providers develop models that address local circumstances.
Despite this variation, states have clearly been interested in expanding the use of assisted living and other residential settings that offer supportive long-term care services. In part, states have been interested because some research suggested that housing with supportive services could be a cost-effective alternative to nursing homes (Leon, Cheng, and Neumann, 1998; Mor, Sherwood and Gutkin, 1986). It also appears that some states substituted residential care beds for nursing home beds in their long-term care system (Hawes et al., 1993; Hawes et al., 1995c).
In addition to creating new licensure categories and expanding Medicaid waiver programs, many states began making more aggressive use of Medicaid personal care service payments for residents in board and care homes (Harrington and DuNah, 1994; Mollica, 1998). Further, they have started allowing higher levels of care to be provided outside nursing homes. For example, the majority of state licensing agencies allow board and care homes to house residents who are chair-fast because of health problems or who use wheelchairs to get around inside the facility. Indeed, even in the early 1990s, one-third of the licensing agencies allowed board and care homes to retain residents who were bedfast (Hawes, Wildfire and Lux, 1993). Some states also embarked on more aggressive strategies for expanding the potential role of board and care homes and assisted living facilities by permitting the provision of daily or intermittent nursing care (including skilled care) and hospice care (Hawes, Wildfire and Lux, 1993; Kane and Wilson, 1993; Manard et al., 1992; Mollica, 1998; Mollica and Snow, 1996; Newcomer, Wilson and Lee, 1997).
1.3 REASONS FOR THE STUDY
Given the promise of the philosophy of assisted living and its rapid growth, as well as the forces that have contributed to tremendous variability across the country, there is natural interest in the role assisted living can play in meeting the long-term care needs of the elderly. In addition, there are natural concerns about the quality of care and consumer protection issues (Cody, 1996; Hawes et al., 1995a; Hawes et al., 1997; US-GAO, 1997; 1999). Thus, a number of public and private agencies have recently initiated studies of assisted living.11
This is the first in a series of planned reports based on data collected from a survey of a national probability sample of 2,945 places thought to be assisted living facilities. These data were collected as part of a study, "A National Study of Assisted Living for the Frail Elderly." This study was initiated and funded by the U.S. Department of Health and Human Services, Office of the Assistant Secretary for Planning and Evaluation (ASPE). Additional support for the project has been provided by AARP, the Administration on Aging (AoA), the National Institute on Aging (NIA), and the Alzheimer's Association.
Both ASPE and AARP have a long-standing interest in the potential of housing with supportive services, including board and care homes and assisted living facilities, to meet the needs of aged and disabled persons for residential long-term care services. ASPE commissioned a study in the early 1980s by Denver Research Institute (DRI) that described board and care homes and residents in five States and investigated the effect of regulation on quality of care (Dittmar and Smith, 1983). Other studies during the 1980s also attempted to describe homes and residents, the regulation of these homes by States, and the role these facilities play in providing long-term care (i.e., Mor, Sherwood and Gutkin, 1986; Sherwood, Mor, and Gutkin, 1981; Reichstein and Bergofsky, 1980).
In the early 1990s, both ASPE and AARP initiated a new examination of board and care homes and their role in the long-term care system. Specifically, they supported studies that examined the supply (Manard et al., 1990); described regulatory systems (Hawes, Wildfire and Lux, 1993); and described the facilities, residents, and staff (Hawes et al., 1995b). Finally, ASPE sponsored a study of the effects of regulation on quality in licensed and unlicensed homes, including a sizeable number of assisted living facilities (Hawes et al., 1995a).
ASPE and AARP placed a high priority on examining board and care homes, quality, and regulatory effectiveness for several reasons. These included increased state and federal expenditures on home and community-based care, growing disability among residents, concerns about inadequate quality, and questions about the effectiveness of state regulatory efforts.
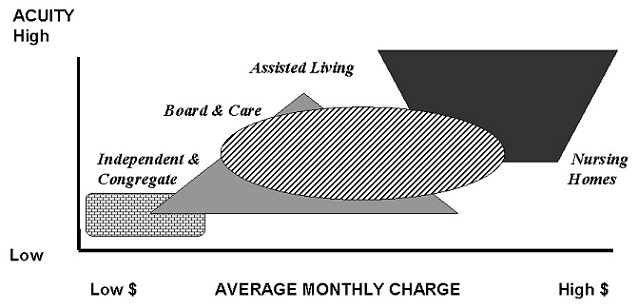
While those were the major reasons for examining board and care homes, ASPE and AARP's interest in assisted living has been rooted more in its promise for meeting the needs of frail elders while enhancing the quality of their lives. In particular, they are interested in determining the role ALFs play in meeting the needs of the frail elderly and where assisted living fits in the long-term care "continuum," an issue displayed in Exhibit 1.
| EXHIBIT 1. Hypothesized Relationship Between Assisted Living and Other Types of Residential Long-Term Care |
 |
Associated with this over-arching issue are a host of questions about the role of assisted living, some addressed by this study and some by other ongoing studies of assisted living. These questions include:
-
What are trends in demand and supply and what factors affect them
-
What is the meaning of "quality" in assisted living; how do residents and families define quality
-
What features of assisted living are most valued by residents and families
-
How do consumers select assisted living and what are key consumer protection issues
-
Are residents able to age in place in ALFs
-
Do ALFs serve low and moderate income elderly To what extent do ALFs serve as a viable substitute for nursing homes
-
What is the relationship between traditional board and care homes and their newer incarnation, assisted living facilities
-
To what degree does the current industry embody the philosophy of assisted living
-
How are personal and health care services organized and provided
-
What is the effect of various arrangements (services and privacy) on such factors as consumer satisfaction, length of stay, cost, case mix
-
What is the total cost of assisted living, including ancillary services
-
What is the impact of the use of assisted living on Medicare and Medicaid
In addition, the phenomenal growth in the supply of facilities that advertise themselves as "assisted living" has augmented ASPE and AARP's interest in issues related to demand, supply and quality in assisted living. The result has been a number of projects and reports sponsored by ASPE and AARP. These ongoing interests also led to the funding of the current project.
1.4 ORGANIZATION OF THE REPORT
The remainder of the report focuses on the current study.
-
Section 2 describes the overall study goals and the specific objectives of the telephone screening and survey. It also presents a brief overview of the study methods.
-
Section 3 presents general descriptive data on the industry, based on the results of this telephone survey.
-
Section 4 discusses the accommodations provided by the assisted living industry.
-
Section 5 presents data on the services and staffing.
-
Section 6 describes the admission and discharge policies of assisted living facilities and presents data on resident case mix.
-
Section 7 discusses different models of assisted living and the consequences of the model differences on variations in accommodations, services, staffing, and admission and discharge policies.
-
Section 8 presents data on the price of assisted living.
-
Section 9 discusses the implications of the study findings, particularly in terms of the degree to which the characteristics of the industry conform to the basic philosophical principles of assisted living.
2. STUDY PURPOSE AND APPROACH
The Myers Research Institute at Menorah Park Center for Senior Living and Research Triangle Institute (RTI) collaborated on this effort to examine the role of assisted living for the frail elderly.12
2.1 STUDY GOALS
The National Study of Assisted Living for the Frail Elderly was designed to achieve the following objectives:
-
To identify trends in demand for and supply of assisted living facilities;
-
To identify barriers to the development of assisted living and factors that contribute to those trends in demand and supply;
-
To determine the extent to which the current supply matches the central philosophical and environmental tenets embodied in the concept of "assisted living" and to describe the key characteristics of the universe of assisted living facilities; and
-
To examine the effect of key features that embody the philosophical tenets on selected outcomes, including resident satisfaction, autonomy, affordability, and potential to provide nursing home level of care.
To achieve these objectives, the project team implemented a number of activities and issued several reports that are available from ASPE.13 In addition, the project team will issue subsequent reports on the characteristics of the assisted living industry and its staff, as well as the residents. These are based on data collected during site visits to 300 facilities and interviews with administrators, staff caregivers, residents, and family members. Project staff will also interview and report on the experiences of a sample of discharged residents or their next-of-kin.14 However, the current report addresses only the results of a telephone survey of administrators in 2,945 places thought to be assisted living facilities.
2.1.1 Specific Objectives of the Telephone Survey
The specific objectives of this telephone survey were to:
-
Screen a listing of places thought to be assisted living facilities and determine their eligibility for the study
-
Determine the size and nature of the supply of assisted living facilities
-
Describe the basic characteristics of the industry particularly in terms of the services, accommodations and price
-
Begin examining the extent to which the current industry embodies the key philosophical tenets of assisted living
-
Identify facilities for subsequent, more extensive data collection.
2.2 SAMPLE DESIGN
To accomplish the objectives of the initial telephone survey, project staff (1) implemented a complex sample design; (2) created a comprehensive list of potentially eligible facilities; (3) determined whether a sample of facilities on the list met study eligibility criteria; (4) conducted a telephone survey of eligible facilities; and (5) analyzed the data. This section of the report provides a brief overview of these activities. Other reports will provide greater detail about study methods.15
2.2.1 Sample Design for the Telephone Screening and Survey
In order to conduct the survey and to obtain results that could be generalized to the nation as a whole, project staff implemented a stratified, multi-stage national probability sample. At the first stage, a random sample of geographic areas, known as first stage sampling units (FSUs), were selected. At the second stage of sampling, staff selected a sample of facilities.16
The sample design called for selection of a set of geographic areas prior to selecting the facility sample for several reasons. First, in order to conduct the survey, staff had to construct a listing of assisted living facilities. There is no national list that is comprehensive and exhaustive. Moreover, as noted earlier, definitions of assisted living vary across the states. In some states, there are no limits on the type of facility that may call itself "assisted living" or advertise that it provides assisted living, regardless of the kind of services and accommodations it provides. Further, some states did not have a licensure category known as "assisted living."17 As a result, the study could not rely on state licensure lists to provide a comprehensive and exhaustive listing of assisted living facilities. Some places meeting study criteria would be missed, while other facilities licensed under the category of "assisted living" might not meet more commonly understood definitions of assisted living.
Lists from established trade associations were also insufficient as a sampling frame. First, while there are multiple trade associations, their combined membership accounts for an unknown proportion of the total number of assisted living facilities (ALFs) in operation. Second, ALFA merged with the association that represented board and care homes (i.e., the National Association of Residential Care Facilities). As a result, the membership of ALFA was expected to include both assisted living facilities and places that are more traditionally thought of as board and care homes, some of which would meet study criteria and some which might not.
Further, the study could not rely solely on retirement directories or local advertisements, since they appeared to have differing definitions (or no criteria) for what should be classified as assisted living. Similarly, in many localities, there were no restrictions on the kinds of places that could call themselves "assisted living."
As a result, a crucial aspect of the sampling design was the development of an enumeration strategy that would enable selection of a nationally representative sample of ALFs. However, because of the extensive level of effort involved, creating a comprehensive list at the national level (i.e., in each of the >3,000 counties) would have been prohibitively expensive for this project. Thus, project staff decided to select a random sample of geographic areas across the country in which to enumerate an exhaustive list of facilities.18 This involved a two-stage enumeration and screening process to provide comprehensive coverage of the target population of assisted living facilities.
2.2.1.1 Creating a List of ALFs
In order to create a list or sampling frame of assisted living facilities, project staff first had to define the relevant study population. These are the criteria used to determine whether a place was eligible for inclusion in the study. As noted, the definition of assisted living was variable across the country. Thus, to define "assisted living" for this study, project staff specified selected features about which there was general agreement among industry and consumer groups that the feature was characteristic of "assisted living."
2.2.1.1.1 Eligibility Criteria
The project's first criterion was that to be eligible for this study, a facility had to serve a mainly elderly population. Second, it had to have more than 10 beds.
ELIGIBILITY CRITERIA
To be eligible for the study, a facility had to:
1. Serve a mainly elderly resident population2. Have more than 10 beds
AND Either
3a. Be a self-described ALF
OR
3b. Provide
- 24-hour staff
- Housekeeping
- At least 2 meals per day
- Help with at least 2 of the following: medications, bathing or dressing
There were several reasons for this size restriction. First, we had several reasons for expecting that small facilities would not meet study criteria. A 1993 survey funded by DHHS/ASPE examined board and care homes in ten states (Hawes et al., 1995b). Two-thirds of the board and care homes had 10 or fewer beds. Few of those facilities identified themselves as assisted living or provided personal assistance with two or more activities of daily living (ADLs). In addition, during the period of sampling, none of the states that had specific licensure categories known as assisted living had licensed facilities with fewer than 11 beds. Thus, project staff expected that few small facilities would meet the service-related criteria. Second, small homes tended to have significant numbers of non-elderly residents and were more likely to have residents with mental retardation, developmental disabilities, and persistent and serious mental illness. These findings were consistent with those of other studies (e.g., Dittmar and Smith, 1983; Hawes et al., 1995c; Sherwood and Seltzer, 1981; Sherwood, Mor and Gutkin, 1981). Finally, the small homes were well-described in the prior study. As a result of all these factors, ASPE and project staff concluded that including these facilities on the sample frame would be a costly endeavor that would produce little if any "pay-off" in terms of identifying eligible ALFs.
In addition to the eligibility criteria based on population served (i.e., elderly) and size (i.e., >10 beds), the facility had to describe or represent itself as being an assisted living facility or it had to be a place that offered at least a basic level of services. Those services were:
- 24-hour staff oversight
- Housekeeping
- At least 2 meals a day, and
- Personal assistance, defined as help with at least two of the following: medications, bathing, or dressing.
The next project task was to select a sample of FSUs. As noted earlier, this involved a two-stage enumeration and screening process. First, staff developed a nationwide, county-level sampling frame that estimated the relative distribution of study-eligible facilities across the 3,141 counties and county equivalents that are listed in the 1990 Census. Staff did this in order to focus the sample of FSUs in counties with the highest concentrations of ALFs so that the project would be able to obtain a sufficient sample for all phases of the data collection.
Project staff initially considered the use of county size measures based on the population aged 65 or older in selecting FSUs. This was based on the assumption that the number of ALFs serving the frail elderly in a geographic area would be proportional to the number of older persons. However, the available evidence about development and construction indicated that the industry was expanding at different rates in different states (e.g., ALFA, 1996; Mollica and Snow, 1996). If the distribution of ALFs did not match the distribution of older persons, project staff could expect that this method of selecting FSUs would concentrate the sample in states with high numbers of elderly but few ALFs.
Selection of the FSUs. In order to increase the efficiency of the sample, project staff created an initial national listing of places thought to be eligible for the study in all 3,141 counties (or county equivalents) across the country. The sources were the unduplicated listing of a national retirement directory (DRF, 1995) that reported having listings from licensing agencies in all 50 states and three national associations that had members who identified themselves as assisted living facilities. (It is important to note that the primary purpose of this activity was to focus the sample in counties with concentrations of ALFs not to enumerate the entire population of ALFs.) Based on this 1995 listing of more than 17,000 places in all counties, project staff selected 60 FSUs, giving a somewhat higher probability of selection to those counties with higher concentrations of candidate facilities.
As expected, the FSUs identified by the process differed from those that would have been selected based only on the proportion of the population aged 65 and older. For example, without this initial enumeration process at the national level, the sample of FSUs would have been more heavily concentrated in states like Texas, Ohio and Illinois, which had few ALFs compared to relatively high numbers of older persons. Instead, FSUs in states like Pennsylvania, California or Oregon, which had a large number of ALFs relative to their older population, had higher selection probabilities.
The 60 FSUs were randomly selected, with higher selection probabilities for those FSUs containing large numbers of "expected" assisted living facilities. These FSUs contained 1,086 counties in 34 states. They also contained 40 percent of the U.S. population aged 65 and older and 43 percent of the initial sample frame of "expected" assisted living facilities.
2.2.1.1.2 Source of Listings of Candidate ALFs
The next task, which was completed in September, 1997, was to create a comprehensive list of candidate ALFs in each of the 60 FSUs. This involved the collection of multiple lists of places that described themselves as assisted living facilities and other places that appeared to meet the study's eligibility criteria. For each FSU, project staff obtained data from the following:
-
ALFA's 1997 list of members
-
The AHCA 1997 list of assisted living members
-
AAHSA's 1997 list of assisted living members
-
The 1997 HCIA Directory of Retirement Facilities (DRF, 1997)
-
State licensure agency lists for 1997 for all types of residential care facilities that have 11 or more beds
-
Listings and advertisements from telephone book "yellow" pages
-
State directories of local ALFA members, in those states in which the state affiliate of ALFA had one, and
-
Local retirement directories and Internet listings of facilities.19
After collecting these multiple lists, project staff spent considerable effort making sure they were in one of the 60 FSUs20 and creating an unduplicated list. Creating an unduplicated list was particularly complex because of the large number of multi-facility systems and the large number of facilities at the same address on campuses that housed several different levels of care. In addition, staff found high prevalence of multi-level settings that housed two or more places that met the eligibility criteria.21
Eliminating Known Ineligibles From the Sampling Frame. Prior to creating a sample frame, project staff excluded some places from the unduplicated listing generated from the sources mentioned above. For example, based on the definition provided by the HCIA Directory of Retirement Facilities (DRF), project staff included places listed under the category "assisted living/residential care" and places listed as "congregate living". On the other hand, places listed by the DRF only as "independent living" were excluded from the sampling frame of candidates because the DRF definition made it clear that they did not: (1) describe themselves as assisted living nor (2) provide the basic level of staffing and services required. However, if another source (e.g., licensure list or association membership list) listed an "independent living" facility as a potential candidate for the study, it was included on the sampling frame. As a result, there were still a large number of facilities on the second-stage sampling frame that identified themselves as "independent living." As expected, the subsequent telephone survey revealed that few met the study's eligibility criteria (e.g., did not provide 24-hour staff and help with at least two of the following: medications, bathing, or dressing).
- 7,578 (41%) were ineligible because of size
Among the remaining 10,720 candidates:
- 70% appeared on only one source listing
- 19% appeared on two source listings
- 11% appeared on three or more source listings
- Small facilities were more likely to appear on only one source list (e.g., 86% of the small facilities were on only one list), while about half of the larger facilities appeared in two or more source listings
Utility of sources:
- 63% of the candidates appeared on the DRF (but many ineligibles also appeared)
- 46% of the candidates appeared on the state licensure lists
Size of facilities on master list: of candidate ALFs:
- 39% had 11-50 beds
- 23% had 51 or more beds
From all these sources, for the 60 FSUs, a total of 18,298 candidate facilities were listed. Project staff then eliminated known ineligibles based on size. Information on size was missing from many lists (e.g., ALFA and other membership lists); however, size of each facility was present for almost all of the candidates (i.e., 97%) on the state licensure lists. Thus, at the start, size was unknown for 4,204 facilities (23%) on the list. For facilities for which size was known, small homes (i.e., 2-10 beds) were deemed ineligible and removed from the master list. Project staff found that among the 18,298 candidates 7,578 places (41%) were ineligible because they had 10 or fewer beds. The degree to which such small facilities might otherwise have met study criteria (e.g., be a self-described assisted living facility or provide the required services) is unknown. However, as noted earlier, prior studies found that small facilities tend to have a younger resident population and to provide supervision but less hands-on assistance with ADLs than larger facilities (Dittmar and Smith, 1983; Hawes et al., 1995; Wildfire et al., 1995; Sherwood, Mor and Gutkin, 1981; Sherwood and Seltzer, 1981).
Selecting The Sample For The Telephone Screening and Survey. The next task was to select a sample of facilities from the remaining 10,720 candidates on the combined listing (e.g., after eliminating the 7,578 places with 10 or fewer beds).
In selecting the sample to be screened by telephone, project staff oversampled the larger facilities (>51 beds) in order to increase the likelihood of encountering ALFs offering a high level of services. This was based on an earlier study of residential care which found that larger facilities were more likely to have nurse staffing and to offer more services (Hawes et al., 1995a,1995b). Thus, project staff's assumption at this stage was that larger facilities would have greater capacity to offer more services. Further, this approach would improve the sampling efficiency at later stages (i.e., when the resident sample was selected, since most residents lived in large ALFs). This oversampling did not affect final estimates about the prevalence of various types of ALFs (including various sizes), since data were weighted to account for the oversampling.22
From this list of 10,720 potential candidate facilities, project staff selected a stratified (by size), random sample of 2,945 facilities for the telephone survey.
2.3 DATA COLLECTION
The administrators (or their designees) in 2,945 facilities were interviewed by telephone to determine facility eligibility for the study. The telephone survey was conducted by Research Triangle Institute (RTI) during the period of January March, 1998. RTI used computer-assisted telephone interviews (CATI) for this task. The respondent was the administrator (or in his/her absence, the assistant administrator or resident care director). (A copy of the questionnaire appears in Appendix A.)
First, the interviewer had to determine whether the sample facility was on a multi-level campus that contained several distinct levels of care or residential settings (e.g., assisted living, congregate care, nursing home). If it was on a multi-level campus, then the questionnaire was automatically routed by the CATI program to a set of questions aimed at determining what those levels were and whether any of the multiple units or divisions were eligible for the study. This process was also intended to ensure that the responses (e.g., bed size, accommodation type, services offered) were specific to each single unit or residential setting.
Next, in the questionnaires for both the settings on multi-level campuses and for free-standing facilities, there was a set of questions intended to determine whether the sample facility was eligible for the study. If the facility was determined to be eligible, then the respondent was asked a series of additional questions that took about 10 minutes. The topics covered included:
- Size, occupancy rate, and length of time in business
- Price
- Type of accommodations
- Nurse staffing, services offered and whether arranged or provided, and
- Admission and retention policies.
Exhibit 2 displays the results of the telephone screening for eligibility, the reasons for ineligibility of the listed candidates, and the response rates. As shown, the most striking finding was the rate of ineligibility.23 The listings on the sample frame, as noted earlier, were from multiple sources that most observers presumed were reliable sources or identifiers of assisted living facilities. It is also worth noting that the source of the largest number of valid listings, the DRF, was also the source of the largest number of ineligibles. This demonstrates the difficulty involved in determining how many assisted living facilities are currently in operation and in identifying those facilities, given varying definitions and criteria across our sources of listings, across states, and across facilities themselves. It may also help explain why some estimates of the total supply of assisted living facilities are quite high, as discussed in the next section.
| EXHIBIT 2. Final Disposition of the Facility Screening Sample | ||
| Disposition | Total Percent | |
| RESPONDING LOCATIONS | ||
| 42.5% | |
| 41.0% | |
| Subtotal | ||
| 1. Ten or fewer beds | (9.8%) | |
| 2. Independent living only | (12.2%) | |
| 3. Other ineligibility based on few or no services | (13.2%) | |
| 4. Site closed or not a facility (frame error) | (5.8%) | |
| NON-RESPONDING LOCATIONS | 16.2% | |
| Subtotal | ||
| ||
| 1. Refused to participate | (7.6%) | |
| 2. Not interviewed (multiple call-backs but no completion, language barrier) | (2.4%) | |
| (6.2%) | |
| TOTAL | 100% | |
| *The places listed as "unable to contact" were also assumed to be ineligible. First, project staff used multiple sources, including "white" and "yellow-page" telephone listings, retirement directory listings, local information, and so on, to secure telephone numbers. We assumed that an eligible ALF would have a listed number if it were still in business. Second, project staff made at least 10 telephone calls during business hours to each place. We assumed that if the place was an eligible ALF, there would have been staff on duty 24 hours per day and someone would have answered at least one of >10 telephone calls at various times of the day. Thus the total number of ineligibles was estimated as 46% (i.3., 41 + 6.2). | ||
The reasons for ineligibility are also interesting. At the first level of "cleaning" the list of candidate facilities, staff eliminated a large number of small facilities (i.e., more than 40% of the originally compiled list). This effort was apparently fairly successfully, since only 10 percent of the remaining sample were ruled out because of size. However, a total of 25 percent of the facilities on the sample frame (i.e., the "independent living" facilities and other ineligibles) were ruled out because they offered few services and little, if any, personal assistance (e.g., help with medications, bathing, dressing).24 Most observers would agree that such facilities should not be regarded as "assisted living." Finally, staff concluded that an additional 12 percent of the listings were ineligible. These miscellaneous reasons for ineligibility were because the facility was closed or was something other than an eligible facility (e.g., was a convent or a licensed nursing home) (5.8%) or the facility fell into the category "unable to contact" (6.2%) (See footnote 23).
2.4 ANALYTIC METHODS
For most of the analysis, this report presents descriptive statistics for individual variables, such as the mean for interval indicators and percentages for categorical measures. Project staff utilized t statistics for comparisons between two groups (e.g., self-described ALFs and other facilities). For comparisons among more than two categories (e.g., the combination of different levels of service and privacy), regression equations were estimated that allowed the research team to compare the overall sample mean for all facilities with the mean for facilities in each category and to test the statistical significance of any difference.
All of the analyses were carried out on data weighted to represent the assisted living industry in the nation as a whole. SUDAAN, a statistical software package that provides appropriate variance estimates for clustered data derived from multi-stage samples, was used for all analyses.
3. DESCRIPTION OF THE ASSISTED LIVING INDUSTRY
Despite the enormous interest and enthusiasm generated by the philosophy of assisted living and its rapid growth in this country, there is little definitive data available on the number and characteristics of facilities and residents. While there have been a number of studies, particularly surveys sponsored by national trade associations, they have been limited by two factors.
First, many prior studies of assisted living facilities have focused on the industry in only a few states (personal communications from Kane; Newcomer; Zimmerman and Sloane). Second, most of the national surveys have been conducted by industry trade associations and have not selected the facilities from a nationally representative sample (e.g., ALFA, 1998; Gulyas, 1997; Hodlewsky, 1998). The lack of a national listing of facilities, the limitations of state licensure lists, given the variability in licensure policy and definitions, and the potential bias introduced from surveying only trade association members have hindered attempts to describe the assisted living industry and to understand its role in meeting the needs of frail elders. Third, the existing national surveys of facilities have been limited by somewhat low response rates among the facilities surveyed.25 As a result, the available data cannot be regarded as representative. Thus, there are no definitive data generalizable to the nation as a whole that describe the assisted living industry.
- Served the elderly
- Had more that 10 beds
And
- Identified themselves as assisted living
Or
- Provided 24-hour staff, >2 meals per day, housekeeping, and help with at least two of the following: medications, bathing, and dressing.
The ASPE study fills that void with empirical data drawn from a survey of a nationally representative sample of assisted living facilities and a response rate of better than 84 percent. The sections that follow provide data on the size and characteristics of the assisted living industry in the United States.
3.1 SIZE OF THE INDUSTRY
As noted earlier, there is general agreement that assisted living is the most rapidly growing type of senior housing in the United States. There is less agreement, however, on the size of the current supply of assisted living facilities. In 1998, for example, estimates of the number of facilities ranged from a total of about 27,000 facilities to more than 40,000 ALFs (Mollica, 1998; ALFA, 1998; Hodlewsky, 1998). Estimates of the number of beds ranged from about 350,000 to more than one million (Citro and Hermanson, 1999; Mullen, 1997; ALFA, 1998; Hodlewsky, 1998). Thus, one of the key objectives of the ASPE study was to determine the size of the current supply of assisted living.
As shown in Exhibit 3, estimates based on the telephone survey of administrators indicated that in early 1998, there were 11,459 facilities and 611,300 beds that met the definition of assisted living that was embodied in the study's eligibility criteria.26
| EXHIBIT 3. Assisted Living Industry Size | |
| Industry Characteristics | National Estimate |
| Estimated Total Number of Facilities | 11,459 |
| Estimated Total Number of Beds | 611,300 |
| Estimated Total Number of Residents | 521,500 |
In comparison to other estimates about the assisted living industry, the ASPE study estimate is considerably lower than those of provider organizations, such as ALFA. However, there are several reasons for believing the ASPE study represents an accurate estimate of the number of ALFs that met study eligibility as of early 1998.
First, this study's estimates are the product of an extensive attempt to secure a comprehensive list of all possible eligible facilities. Second, they are based on a national probability sample of facilities, unlike other studies. Third, it involved a systematic effort to determine whether the places believed to be assisted living or "called" assisted living met a commonly accepted definition of "assisted living." In particular, the ASPE study made a concerted effort to exclude facilities on the list of candidate ALFs that in reality provided few services or did not offer meaningful personal assistance to residents.27 Fourth, as noted, the ASPE study excluded small facilities (i.e., 2-10 beds). Exhibit 4 displays the distribution of the candidate facilities that were provided to project staff on various lists and represented as being ALFs. As shown, the majority of facilities on those lists did not meet study eligibility criteria. Finally, the survey results and estimates are based on very high participation rates among the sampled facilities. These features of the ASPE study have helped overcome limitations in other studies that estimated the supply of assisted living facilities as being much larger.
| EXHIBIT 4. Estimated Distribution of Listing of Candidate ALFs |
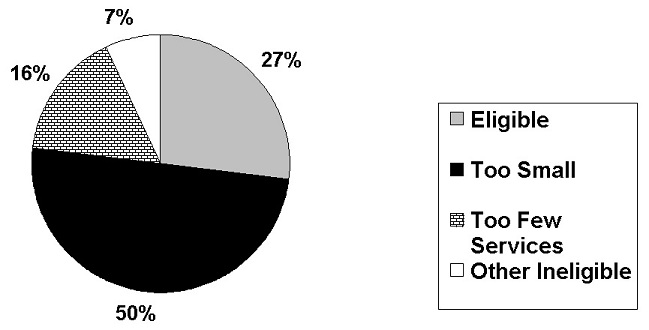 |
3.2 GENERAL CHARACTERISTICS OF THE INDUSTRY
As shown in Exhibit 5, the majority of facilities (72%) that met study eligibility criteria described themselves as assisted living facilities or advertised that they provided assisted living services. However, more than one-quarter (28%) of the facilities that met study eligibility criteria did not hold themselves out as being "assisted living," even though they provided the same type of care and services as places calling themselves "assisted living."28 In part, this may be a product of state licensure regulations. For example, in Wisconsin, assisted living facilities are termed residential care apartment complexes or community-based residential care facilities (Mollica, 1998).
| EXHIBIT 5. General Industry Characteristics | |
| Characteristic | National Estimate |
| Self-Described Assisted Living | 72% |
| Free-Standing ALFs | 55% |
| ALFs on Multi-Level Campus | 45% |
| Average Length of Time in Business | 15 years |
| Average Occupancy | 84% |
| Average Number of Beds | 53 |
| Average Number of Residents | 46 |
3.2.1 Facility Size, Distribution of Beds, and Occupancy Rate
ALFs ranged in size from 11 beds to more than 1500. The average facility had 53 beds (in rooms or apartments) with a median of 48 beds. Most ALFs (67%) had between 11 and 50 beds, as displayed in Exhibit 6. Twenty-one percent of the ALFs had 51-100 beds, while 12 percent had more than 100 beds.
| EXHIBIT 6. Distribution of ALFs by Bed Size |
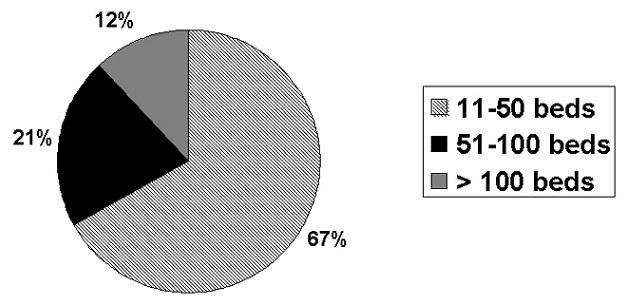 |
While most facilities were in the range of 11 to 50 beds, two-thirds (67%) of the residents -- were in the larger facilities (i.e., >50 beds). This was consistent with ASPE's earlier study of board and care homes that found most residents lived in larger facilities, even though two-thirds of the homes were very small (i.e., 2-10 beds) (Hawes et al., 1995).
The average occupancy was an estimated 84 percent nationwide.
3.2.2 Affiliation
Another feature of facilities was their affiliation. The administrators reported that the majority of facilities were free-standing (55%); however, a sizeable proportion of ALFs (45%) were located on multi-level campuses that housed other types of residential settings or multiple levels of care. An estimated 5,220 facilities were located on such multi-level campuses at the start of 1998.
Exhibit 7 displays the main types of residential care settings found on multi-level campuses. Some multi-level campuses housed several different types of residential settings (e.g., nursing home, assisted living, congregate or independent living).29 Other multi-level campuses housed only an assisted living facility and a nursing home. In fact, a campus with a nursing home and an eligible "assisted living" facility was the most common configuration on multi-level campuses. In addition, the administrators of ALFs located on a multi-level campus were asked whether there was any kind of SCU on campus.30 As shown in Exhibit 7, five percent of the administrators reported that the ALF was located on a campus with an SCU that was part of a licensed nursing home. Six percent reported that an SCU providing residential care or assisted living was located on the campus.
| EXHIBIT 7. Distribution of ALFs by Affiliation |
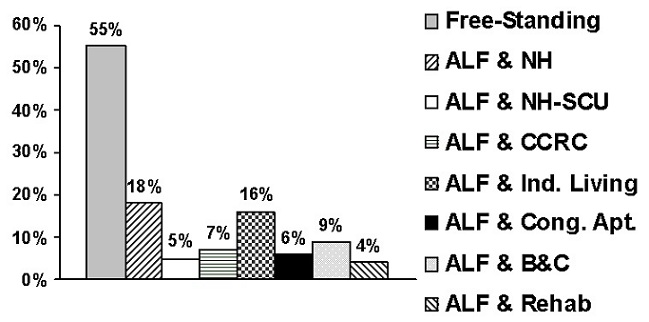 |
3.2.3 Length of Time in Business
The assisted living industry also displayed considerable variation in terms of the length of time the facilities had been in business as of early 1998. The average was 15 years, but there was a wide range around that. As shown in Exhibit 8, almost one-third (32%) of the facilities had been in business for five or fewer years as of early 1998. More than half (58%) of the facilities eligible for the study had been in business for a decade or less. Thus, while many facilities (19%) had been providing residential care with supportive services for more than 20 years, the majority ALFs started in business during the preceding decade.
| EXHIBIT 8. Distribution of ALFs by Years in Business |
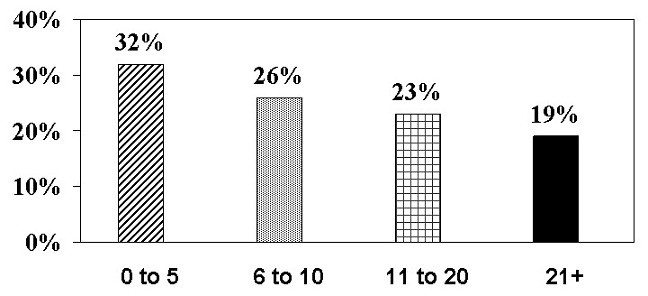 |
4. PRIVACY AND ACCOMMODATIONS
For many advocates of assisted living, environmental characteristics are considered one of the most important features that distinguish assisted living from nursing homes and other types of residential care facilities. As noted earlier, privacy and consumer choice are key elements of the philosophy of assisted living in the view of both consumer and provider groups (Assisted Living Quality Coalition, 1998). Moreover, individual and focus group interviews with consumers found that they overwhelmingly preferred to reside in private rooms or apartments (Jenkens, 1997; Kane et al., 1998). Thus, the nature of the environment, that is the accommodations, is a key component of assisted living.
Despite widespread consensus among residents about their preferences, there is disagreement within the industry about the environmental features that are essential for a place to be defined as an "assisted living facility," particularly about whether private rooms or apartments and kitchens were essential features. In addition, there is disagreement among policymakers about whether privacy and apartments are key features of a place that can be licensed or reimbursed under Medicaid waivers as "assisted living" (Mollica, 1998).
4.1 PRIVACY
Privacy31 and consumer control of the environment encompass a variety of concepts and features of the environment, facility policies, and staff behavior. Typically, these are defined in terms of such policies or features as the ability of residents to lock their doors; control the temperature in their units; or have pets. Autonomy, however, can also include other features, such as whether the resident can control arrangement of furniture, whether staff knock on doors before entering, and so on. These multi-facted aspects of environmental autonomy and control will be addressed in a forthcoming report.32 The initial telephone survey concentrated only on whether units were shared or private.
As noted above, there is ample evidence that consumers prefer private living units. In one study, 82 percent of the elderly respondents indicated their preference for a private room or apartment in assisted living. Only four percent indicated a preference for sharing their accommodations with an unrelated person (Jenkens, 1997). In another study, 94 percent of the residents of assisted living facilities who were interviewed indicated that a private room and bath were important features and that they considered such private accommodations essential to maintaining their independence and dignity (Kane et al., 1998).
| EXHIBIT 9. Distribution of ALFs by Percent of Units That Were Private |
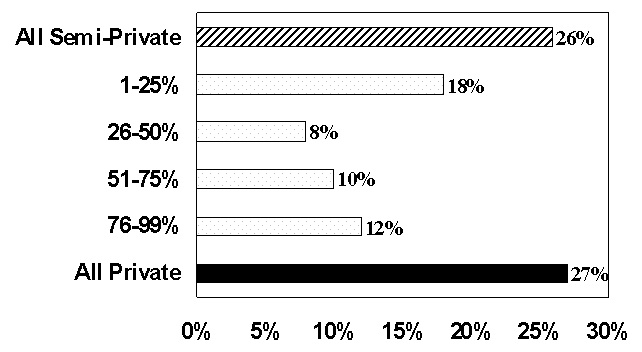 |
Despite the widespread agreement among consumers about the importance of privacy, the supply of places calling themselves assisted living did not uniformly meet this preference. As shown in Exhibit 9, the majority of facilities (73%) had some shared bedrooms (in a room or apartment unit).33 Only 27 percent of the assisted living facilities nationwide had all-private units. While this arrangement may not meet the general preferences of consumers, it did allow consumers choice about accommodations and may have made assisted living affordable for moderate- and low-income seniors.
4.1.1 Privacy at The Facility Level: Categorization Of Facilities
Because state policy had not reached a consensus about the environmental features that are an essential component of assisted living, one goal of the study was to examine the effect of different levels of privacy and services. In order to describe the assisted living industry more systematically and to facilitate comparisons among ALFs, facilities were classified according to the level of privacy they offered.
High Privacy. Initially, project staff defined high privacy facilities as only those in which all units (rooms or apartments)34 were private. However, members of industry trade associations argued that many facilities offered a few shared units to meet the needs and preferences of some residents. Thus, a high privacy facility was defined as one in which 80 to 100 percent of the units were private. As shown in Exhibit 9, all units were private in only 27 percent of the ALFs. Allowing up to 20 percent of the units to be shared raised the proportion of ALFs in the "high privacy" category to 31 percent, as displayed in Exhibit 10.
| EXHIBIT 10. Privacy Levels | |
| Level of Privacy | National Estimate |
| High Privacy | 31% |
| Low Privacy | 40% |
| Minimal Privacy | 28% |
Low Privacy. Any ALF that had no bedrooms shared by three or more unrelated persons but in which fewer than 80 percent of the bedrooms were private was defined as low privacy. As shown in Exhibit 10, 40 percent of all the assisted living facilities were categorized as offering a "low privacy" setting.
| EXHIBIT 11. Privacy Comparison Among Self-Described & Other ALFs |
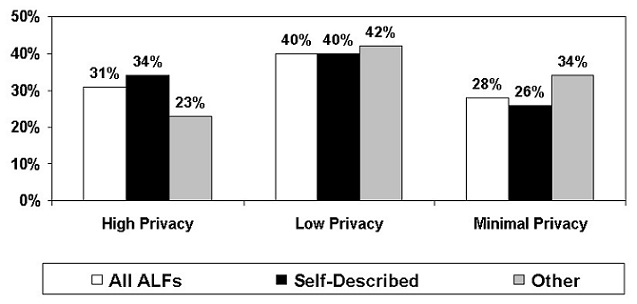 |
Minimal Privacy. Any facility that housed three or more unrelated individuals in the same bedroom (whether in a room or apartment) was defined as providing minimal privacy. Such a room, referred to as a "ward-type bedroom," was considered incompatible with the concept of assisted living. Thus, any facility with such rooms was defined as providing "minimal privacy" regardless of the characteristics of their other units. As shown in Exhibit 10, more than a quarter of all facilities had at least one bedroom that housed three or more residents.
The proportion of facilities that offered low or minimal privacy seemed large for an industry in which one of the chief philosophical tenets is "privacy." To examine this issue more carefully, comparisons were made between two groups of facilities that met study eligibility criteria. The two groups were: (1) those that defined or identified themselves as an "assisted living facility" (a "self-described" ALF) and (2) those that did not call themselves "assisted living" but met specified criteria related to availability of services (the "other " ALFs).
As shown in Exhibit 11, facilities offering "minimal privacy" were less common among self-described ALFs (26%) than among the "other" ALFs (34%). Similarly, high privacy facilities were more common among self-described ALFs (34%) than among the "other" ALFs (23%). Despite the fact that self-described ALFs were more likely to offer high privacy than "other" ALFs, the proportion of self-identified ALFs with low privacy (40%) or minimal privacy (26%) was still substantial. At the same time, the fact that more than two-thirds of self-identified ALFs (70%) offered consumers both private and semi-private accommodations can be viewed as offering consumers a greater range of choices.
| EXHIBIT 12. Distribution of Unites by Privacy |
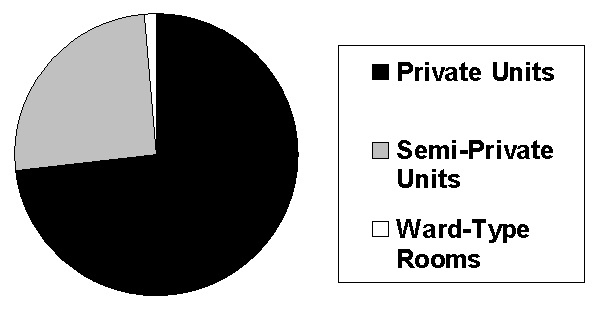 |
4.1.2 Privacy At The Resident Unit-Level
Facility-level distributions indicated significant variability among the industry. However, an examination of the actual distribution of units provides a more accurate picture of privacy from the resident's perspective. While most facilities offered shared units (either rooms or apartments), as shown in Exhibit 12, an estimated three-quarters of the units (73%) across all ALFs were private. Only an estimated one-quarter (25%) were semi-private rooms or apartments. Only two percent of the units were "ward-type" rooms shared by three or more unrelated individuals. The reports by administrators demonstrated that while the majority of ALFs offered some semi-private units, the industry as a whole recognized consumers' preferences for privacy.35
There was somewhat less privacy for residents with respect to bathrooms. Administrators reported that only 62 percent of all resident units had private full bathrooms (i.e., toilet, sink and bathtub or shower), as shown in Exhibit 13. An additional five percent of all units had a private "half" bath (i.e., toilet and sink); however, residents had to share bathing facilities. Further, a third (33%) of all units in ALFs required the resident to share a full bathroom, including the toilet, sink and bathing facilities (i.e., tub or shower). Thus, a total of 38 percent of the resident units involved sharing all or part of bathroom facilities.
| EXHIBIT 13. Privacy of Resident Bathrooms |
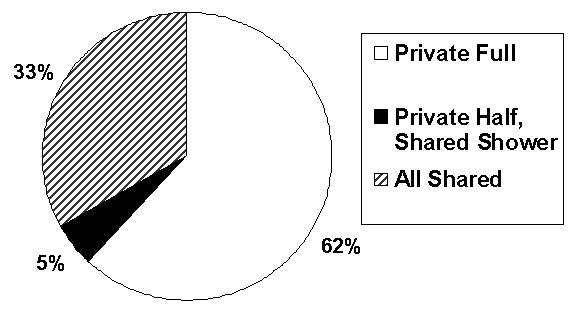 |
4.2 ACCOMMODATIONS
The survey also asked administrators about the types of rooms or apartments offered and the bathrooms available to residents.
4.2.1 Resident Units: The Mix of Rooms and Apartments
As noted earlier, no model of regulation at the state level has emerged to define the essential characteristics of assisted living. The earliest legislative model, which was in Oregon, however, defined a model of assisted living that required resident accommodations or units to be apartments and generally mandated privacy for both bedrooms and bathrooms.36 However, this initial environmental model has not been universally adopted across the United States.
As Mollica (1998) noted, states have treated assisted living very differently in their regulations. One type of state policy essentially treated assisted living as a new model of residential long-term care that required apartments. Another state model viewed assisted living as a service rather than a particular environmental configuration and allowed that service to be provided in a variety of settings. A third type of state approach used the term "assisted living" for a licensure category that incorporated the state's generic board and care facilities and thus did not differentiate assisted living in terms of setting or services. As a result, in most states a variety of places may call themselves assisted living, regardless of the type of accommodations they offer. At the time of the ASPE study survey, 30 states that had established or proposed assisted living policy. Apartment units were required in only half of these states either through licensure rules or Medicaid payment policy for ALFs participating in waiver programs (Mollica, 1998).
| EXHIBIT 14. Distribution of Unit Types | |
| Industry Characteristic | National Estimate |
| % of Facilities with only Apartments | 26% |
| % of Facilities with mix of Apartments and Bedrooms | 6% |
| % of Facilities with only Bedrooms | 68% |
As a result of both state policy and choices by owners and operators, there was considerable variability among facilities and the type of units they offered. As shown in Exhibit 14, the majority of ALFs (68%) did not offer any apartment accommodations; they offered only rooms. An estimated one-quarter of the ALFs (26%) offered only apartments. Relatively few ALFs (6%) offered a mix of rooms and apartments.
For residents, the most common accommodation was in a room (57%), as displayed in Exhibit 15. An estimated 43 percent of all resident units were apartments.37
| EXHIBIT 15. Distribution of Resident Units Between Rooms and Apartments |
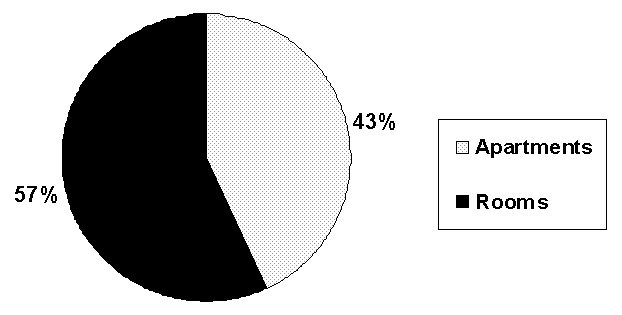 |
4.2.2 Resident Room and Apartment Types
As reported above, most resident units were rooms rather than apartments. According to the administrators, the most common type of room was a single occupancy bedroom with a private full bathroom. As shown in Exhibit 16, this type of resident unit accounted for 42 percent of all resident rooms and was the most common type of resident accommodation.
| EXHIBIT 16. Distribution of Rooms by Type | |
| Type of Room/Bathroom Combinations | Percent |
| Single occupancy BR, private full bath | 42% |
| Single occupancy BR, private ½ bath | 9% |
| Single occupancy BR, semi-private full bath | 4% |
| Single occupancy BR, semi-private ½ bath | 2% |
| Semi-private BR, roomates share full bath | 13% |
| Semi-private BR, roomates share ½ bath | 6% |
| Semi-private BR, 4 people share full bath | 4% |
| Semi-private BR, 4 people share ½ bath | 2% |
| Semi-private BR, communal bath | 8% |
| Ward-type bedroom, communal bathroom | 8% |
| Other room type* | 7% |
| * The "other room type" included a variety of arrangements and was excluded from the estimation of private rooms. | |
As shown in Exhibit 17, the two most common apartment types were one bedroom, single occupancy apartments (41% of all apartment units) and single occupancy studio apartments (32% of all apartment units).38
It is also interesting to note that most of the apartment units were private.39 Only 21 percent of the apartments were shared with an unrelated individual. By contrast, at least 43 percent of the rooms were shared.
| EXHIBIT 17. Distribution of Apartment Types | |
| Type of Apartment | Percent |
| One BR, single occupancy | 41% |
| Studio apartment, single occupancy | 32% |
| Two BR, single occupancy | 6% |
| One BR, shared occupancy | 7% |
| Studio apartment, shared occupancy | 4% |
| Two BR, shared occupancy* | 5% |
| Other apartment type** | 5% |
| * We assumed this apartment type included a shared bathroom.** The "other apartment type" included a variety of arrangements and were thus excluded from the privacy estimations. | |
5. SERVICES AND NURSE STAFFING
The services a facility provides have generally been determined by internal policies related to the types of residents the facility wants to serve and its pricing structure (Manard, 1997). They may also be affected by state licensure regulations. In 1997, most states did not list a specific set of services or staffing that were required; however, many states indirectly affected services by specifying admission and retention criteria for assisted living or residential care facilities (Mollica, 1998). However, over the last decade, studies found that many states were expanding both the types of residents that assisted living and residential care facilities could admit and retain and the level of care and services that could be provided in such facilities (Hawes, Wildfire and Lux, 1993; Mollica, 1998). Thus, states and facilities differed about both the types of services and staffing that would be available and about whether the facility could provide the services directly or had to arrange for the provision of services with an external provider, such as a home health agency.
The survey explored differences in staffing and service arrangements for several reasons. As noted earlier, one of the key philosophical principles of assisted living is that the facility will, as defined by ALFA (1998), ensure that "supportive services are available, 24 hours a day, to meet scheduled and unscheduled needs." Given this, one of the key questions for this research was whether the industry provided the range of services needed to meet the scheduled and unscheduled needs of residents. In addition, facilities' service arrangements were of interest for several other reasons. For example, whether services were provided by ALF staff or arranged through an outside provider might affect the admission and retention policies of facilities and thus the ability of residents to age in place. Further, these arrangements could affect the continuity of care, as well as the cost of care and who bears the cost. Finally, the degree to which assisted living could substitute for nursing home care was of interest to policymakers, and that capacity may be affected by staffing and service arrangements.
While addressing each of the issues listed above is beyond the scope of this study, at the least, the study is designed to describe the variety of arrangements found in ALFs across the country. This section of the report describes the variations in nurse staffing and service availability.
5.1 SERVICE AVAILABILITY
As shown in Exhibit 18, nearly all facilities provided or arranged 24-hour staff, housekeeping, and three meals per day. Moreover, more than 90 percent of the facilities also provided or arranged medication reminders or assistance and help with bathing and dressing, and 87 percent of the ALFs offered central storage of or assistance with medications. Finally, most of the facilities that offered these services provided them with facility staff. However, it is interesting to note that between seven and nine percent of the ALFs arranged for these services through an external agency or provider.
The picture of service availability changed for care or monitoring by any licensed nurse, which included Registered Nurses (RNs) and Licensed Vocational Nurses (LVNs) or Licensed Practical Nurses (LPNs). As shown in Exhibit 18, one out of five facilities (21%) did not offer any care or monitoring by a licensed nurse.
| EXHIBIT 18. Services Offered | ||||
| Service | Estimated % of ALFs With The Service Available | |||
| Not Offered | Provided | Arranged | Provided & Arranged | |
| Housekeeping | 1% | 90% | 8% | 1% |
| >2 meals a day | 1% | 92% | 7% | 0% |
| 3 meals a day | 2% | 91% | 7% | 0% |
| 24-hour staff | 1% | 91% | 7% | 0% |
| Medication reminders | 8% | 83% | 8% | 0% |
| Central medication storage/assistance | 12% | 80% | 7% | 0% |
| Bathing assistance | 3% | 87% | 9% | 1% |
| Dressing assistance | 6% | 85% | 8% | 1% |
| Care or monitoring by RN or LVN/LPN | 21% | 52% | 25% | 2% |
| Therapy services | 26% | 12% | 60% | 2% |
Among the facilities that did offer some nursing care, about two-thirds provided the service with facility staff, while one-third arranged nursing services only through an external provider, such as a home health agency. Still, a significant majority (79%) of assisted living facilities reported they would provide or arrange needed nursing care by an RN or LPN.
Therapy services were the least frequently offered service and the one most commonly arranged through an outside agency. One quarter of the facilities (26%)did not offer therapy services. Only 12 percent offered therapy services with facility staff, while the majority (60%) would arrange the provision of therapy through an external agency.
5.2 NURSE STAFFING
The administrators were also interviewed about the facility's staffing pattern with respect to licensed nurses. Assisted living was developed on a social model; however, as NCAL argued, "nursing and other health-related services are playing an increasingly large role in the industry" (Hodlewsky, 1998). This is because of a variety of factors, including the basic philosophy of assisted living and factors that are expected to contribute to increased acuity among residents (Manard and Cameron, 1997; Mollica, 1998).
As shown in Exhibit 19, more than half (55%) of the ALFs reported having an RN on staff either full or part- time (i.e., 40 hours a week or less). Only 40 percent had a full-time RN on staff. Further, nearly three-quarters of all ALFs (71%) had a licensed nurse (RN or LPN/LVN) on duty full- or part-time in the facility. By contrast, a 1993 study of traditional board and care homes in 10 states estimated that only 21 percent of the facilities had a licensed nurse on staff full- or part-time ((Hawes et al., 1995a).
| EXHIBIT 19. Nurse Staffing | |
| % Of ALFs With Nursing Staff | National Estimate |
| Any RN or LPN full or part-time | 71% |
| Full-time RN | 40% |
| Part-time RN | 25% |
| Full or part-time RN | 55% |
| LPN full or part-time | 53% |
The survey of administrators also asked about whether the facility would provide nursing care, and the results indicated that not all ALFs with a nurse on staff would provide nursing care with their own staff. As displayed in Exhibit 20, slightly more than half (54%) of the ALFs reported that they would provide some nursing services with their own staff or with their own staff in combination with outside staff. Another quarter (25%) of the ALF administrators reported that they would arrange for nursing care with an outside provider, such as a home health agency. However, a substantial proportion of ALFs (21%) would neither provide nor arrange care or monitoring by a licensed nurse.
| EXHIBIT 20. Facility Practice on Availability of Services by RN or LPN |
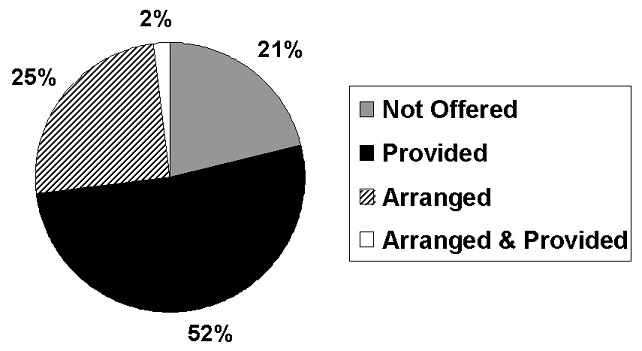 |
6. ADMISSION AND DISCHARGE POLICIES
A combination of facility policies and state regulations govern the admission and discharge criteria used by assisted living facilities. Some policies, such as the amount of nursing care a resident may receive in a residential care setting other than a nursing home, may be defined by state regulations. Other admission and retention criteria are more clearly a product of facility decisions alone in most states. For example, the decision about whether to accept and retain residents with behavioral symptoms, such as wandering, is typically set by the facility alone. Further, while state regulations may set parameters for admission and retention policies, ALFs are nearly always free to set their own policies within these overall constraints.
Admission and retention policies, whatever their origin, can have widespread effects on both consumers and providers of long-term care services. First, they affect who may enter and receive care in an assisted living facility. Second, admission and retention policies will have an impact on the ability of residents to "age in place," once they have moved to an ALF. Third, they affect the ability of ALFs to substitute for nursing home care. As such, admission and retention policies can be expected to affect not only residents but also the nature and, potentially, the financial viability of at least two segments of the health and long-term care sector assisted living facilities and nursing homes. Further, they may indirectly affect the board and care sector, as well as other forms of housing with supportive services. Thus, gathering data that described the admission and retention policies of a national probability sample of ALFs was a central focus of the survey.
6.1 ADMISSION AND RETENTION POLICIES
ALF administrators were asked whether they would admit or retain a resident who had a particular condition or service need. Exhibit 21 displays national estimates about the admission and discharge policies in place for assisted living facilities, based on responses from the administrators. As shown, admission and discharge policies were essentially the same. Generally, facilities would admit the same types of residents they were willing and able to retain.40
| EXHIBIT 21. Admission & Retention Policies | ||
| % of Facilities That Will Admit or Retain Residents | Admit "Yes" | Retain "Yes" |
| With behavioral symptoms | 28% | 24% |
| With urinary incontinence | 61% | 63% |
| Who needs nursing care | 32% | 32% |
| Who uses a wheelchair | 71% | 69% |
| Who receives help with locomotion | 62% | 62% |
| Who receives help with transfers | 44% | 46% |
| Who needs temporary nursing care | * | 82% |
| Who needs nursing care >14 days | * | 28% |
| With moderate to severe cognitive impairment | 47% | 45% |
| * Not asked about admission policies. | ||
The policies on admission and retention reported by administrators raised questions about whether assisted living facilities could reasonably meet their philosophical commitment to enabling residents to age in place. One example can be seen in policies related to changes in residents' physical functioning. More than two-thirds of the ALF administrators (71%) reported they would admit a resident who used a wheelchair, and 62 percent reported they would admit and retain residents who needed assistance with locomotion (i.e., walking or using a wheelchair). However, fewer than half would retain (46%) a resident who needed help with transfers (e.g., from bed to a chair or wheelchair or to standing). Similarly, nearly two in five ALFs (37%) would not retain a resident with urinary incontinence.41
Facility policies on retention of residents who needed nursing care also raised questions about the ability of ALFs to meet residents' unscheduled needs and represented another limitation on residents' ability to age in place. Most facilities (82%) were willing to accept or retain a resident who required temporary nursing care or monitoring. However, only slightly more than one-quarter of the ALFs (28%) reported being willing to retain residents who needed nursing care or monitoring for more than 14 days. These policies raise the question of whether such facilities can be regarded as able to meet residents' unscheduled needs and certainly limited their ability to allow residents to age in place. Indeed, focus group interviews with residents of assisted living facilities revealed that many residents were dissatisfied with being discharged to a hospital or nursing home whenever they needed any daily nursing care or monitoring (Hawes and Greene, 1998).
Finally, many facilities had restrictive policies on admission and retention of residents with cognitive impairment.42 These policies raised questions about the general role of ALFs in meeting the long-term care needs of the elderly and disabled. Further, the retention policies related to conditions common among persons with Alzheimer's disease or other dementias represented a potentially very significant limitation on the ability of many residents to age in place. As shown in Exhibit 21, fewer than half the administrators reported that they were willing to admit (47%) or retain (45%) residents with moderate to severe cognitive impairment. Similarly, only about one-quarter of facilities reported that they were willing to admit (28%) or retain (24%) residents with behavioral symptoms, such as wandering, physical or verbal aggression, or socially inappropriate behavior. Such admission and discharge policies limit the ability of many assisted living facilities to provide care for individuals with Alzheimer's disease and other types of dementia. They also limit the ability of those ALFs to enable such residents to age in place.
ALF admission and discharge policies also affect the degree to which ALFs could reasonably be regarded as a substitute for nursing homes. Nursing homes regularly provide care for individuals with moderate and severe cognitive impairment, as well as individuals with behavior problems, and they provide daily nursing care and monitoring as a matter of course. While some ALFs appeared willing to retain residents who would be eligible for nursing home care, the majority of ALFs were not. Moreover, the ability of ALFs to provide appropriate care for such persons is unknown.
6.2 RESIDENT CHARACTERISTICS
Part of this project involves in-person interviews with a national probability sample of approximately 1,500 residents of assisted living facilities across the country. Analysis and reporting of these data are forthcoming and will provide the most accurate picture of the characteristics of residents in assisted living facilities. However, in the telephone interviews reported here, administrators were asked to estimate the proportion of their residents who had moderate to severe cognitive impairment and the proportion of "heavy care" residents.
-
Heavy Care Residents were defined as residents who, during the preceding 7 days, received hands-on assistance with one or more of the following ADLs: locomotion, transfers, toileting or eating. As shown in Exhibit 22, administrators estimated that 24 percent of the residents had such limitations in ADLs during the seven days prior to the interview date.
-
Moderate to Severe Cognitive Impairment was defined as problems with short-term memory, orientation to time, place and person, and impaired judgment or cognitive skills for daily decision making. ALF administrators estimated that 34 percent of the residents were cognitively impaired.
If accurate, these estimates by assisted living facility administrators help place in context the role of assisted living in meeting the needs of the elderly and disabled who need residential long-term care. There appears to be some overlap of residents across all three settings, if one considers only physical functioning in ADLs and cognitive status. However, the administrators' estimates suggest that ALFs, on average, had a resident case mix that was slightly less impaired in terms of cognitive status than that of traditional board and care homes. On the other hand, ALF residents appeared to be more impaired than board and care home residents, on average, in terms of limitations in physical functioning. The ALF residents, however, were estimated to be significantly less impaired than most nursing home residents, as displayed in Exhibit 22.43
| EXHIBIT 22. Comparison of Resident Characteristics by Setting43 |
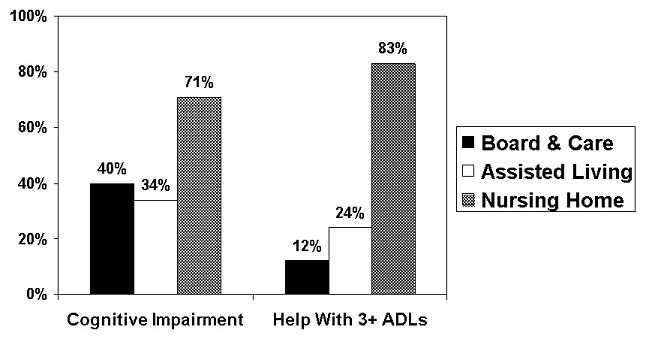 |
6.3 RESIDENT DISCHARGES
We also asked facilities about whether any residents had been discharged during the preceding six months because they needed nursing care. Nearly three-quarters of the facilities (72%) reported that one or more residents had been discharged because the resident needed skilled nursing care.
7. DIFFERENT MODELS OF ASSISTED LIVING
As noted earlier, prior studies have suggested considerable variability among ALFs (Gulyas, 1997; Hodlewsky, 1998; Manard et al., 1992) and among states in the laws and regulations that governed assisted living facilities (Mollica, 1998). Thus, one focus of the analysis of the data reported by administrators was on the differences and similarities among ALFs. Several different types of assisted living facilities were identified and are examined in this section of the report.
-
First, as noted earlier, two types of facilities were included in this study. One group described or represented themselves as an "assisted living" facility. The other group did not hold themselves out as ALFs but nevertheless met eligibility criteria for the study, in particular by offering a specified range of services thought to be consistent with "assisted living." Thus, one key comparison is between these two types of facilities.
-
Second, another major difference was found in the affiliation of the ALFs. As noted earlier, most ALFs were free-standing, that is ALFs operating on a campus with no other affiliated facility. However, a sizeable number of ALFs were located on a multi-level campus, that is, on a campus that encompassed other health or housing settings. This section of the report also examines the differences and similarities between these two types of ALFs.
-
Finally, one key analytic goal of the study is to examine the effect of differences among ALFs in the services and environment they provide. Thus, as an initial part of this examination, a model has been defined that characterizes facilities by the mix of services and privacy they provide.
7.1 SELF-DESCRIBED ASSISTED LIVING FACILITIES
One of the key comparisons was between places that described or represented themselves as assisted living facilities (i.e., self-described ALFs) and "other" ALFs. Other ALFs were those that called themselves by some other name (e.g., residential care facility, adult congregate care facility) but offered the same basic supportive long-term care services (i.e., 24-hour staff, housekeeping, meals, assistance with >2 ADLs). As noted earlier, nearly three-quarters (72%) of the facilities held themselves out as being "assisted living facilities." Twenty-eight percent fell into the "other" category.
These two types of facilities were remarkably similar on a variety of characteristics, such as size, services provided or arranged, nurse staffing, most of the admission and retention criteria, and the characteristics of their residents (i.e., resident case-mix). However, self-described ALFs differed from the other facilities on key features, as displayed in Exhibit 23.44 As shown, the self-described ALFs had lower occupancy rates and, on average, had been in business for a shorter period of time. Self-described ALFs were also significantly more likely to offer apartments than the other facilities and more likely to offer private accommodations than the other ALFs. Self-described ALFs were also more likely to admit and retain residents who used a wheelchair and who received help with locomotion. Further, they had somewhat higher reports of discharging residents who needed nursing care. Finally, among facilities that had several basic rates, depending on the services or accommodation, (i.e., multiple rate facilities), the self-described ALFs had significantly higher monthly prices than the facilities that did not describe themselves as "assisted living."
| EXHIBIT 23. Comparison of Self-Described and Other ALFs | ||
| Facility Characteristics | National Estimates | |
| Self-Described | Other | |
| Occupancy rate | 83% | 87%** |
| Length of time in business | 12 years | 23 years** |
| Average % of units that are apartments | 33% | 17%** |
| % of ALFs with 100% private accommodations | 30% | 19%** |
| Multi-rate facility: average most common monthly rate | $1,624 | $1,454* |
| Multi-rate facility: average highest monthly rate | $2,194 | $1,968* |
| Will retain residents who receive help with locomotion | 66% | 51%** |
| Will admit residents who use a wheelchair | 75% | 61%** |
| Discharged a resident because of need for nursing care | 75% | 64%** |
| * Significant at p.01** Significant at p .001 | ||
7.2 FREE-STANDING COMPARED TO ALFs ON A MULTI-LEVEL CAMPUS
As noted earlier, the majority of ALFs nationwide were free-standing (55%). However, a sizeable number (45%) were located on what are referred to as a "multi-level campus." A multi-level campus housed more than one residential setting and provided more than one level of care. The most common additional levels of care were licensed nursing homes, congregate apartments, and independent living settings.
ALFs that were free-standing and those located on a multi-level campus were similar on such characteristics as size, length of time in business, the percent that described themselves as assisted living facilities, and the administrators' estimates of general resident characteristics. However, these facilities also had a number of statistically significant differences, as displayed in Exhibit 24. As shown, ALFs situated on a multi-level campus had higher occupancy rates and tended, on average, to have higher monthly prices. At the same time, they were more likely to offer private units and to have a higher proportion of apartments, compared to single rooms. They also tended to provide or arrange more services, most notably nursing care and therapies. Further, they had much higher levels of nurse staffing, including full-time staffing by RNs and full or part-time staffing by RNs and LPNs. Not surprisingly, ALFs on multi-level campuses were also more likely to admit and retain residents who needed nursing care. They were also more likely to admit and retain residents who used a wheelchair. Finally, ALFs on multi-level campuses were more likely to have discharged a resident who needed nursing care. This could be a result of having an affiliated alternative level of care available, such as a nursing home, to which to discharge residents. Alternatively, it is possible that such ALFs admit or retain a higher acuity resident mix because of the services they could offer. However, there is no evidence, based on estimates provided by administrators on two dimensions, that ALFs on multi-level campuses had a more intense resident case mix.
| EXHIBIT 24. Comparison of Free-Standing & Multi-Level ALFs | ||
| Facility Characteristic | National Estimates | |
| Free-Standing | Multi-Level | |
| Occupancy rate | 83% | 86%* |
| Average @ of units that are apartments | 14% | 46%** |
| % of ALFs with 100% private accommodations | 20% | 35%** |
| Single rate facility: average monthly rate | $1,502 | $1,975** |
| Multi-rate facility: average lowest rate | $1,221 | $1,477** |
| Multi-rate facility: average most common monthly rate | $1,451 | $1,742** |
| Multi-rate facility: average highest monthly rate | $1,957 | $2,348** |
| Nursing care arranged or provided | 73% | 88%** |
| Therapy arranged or provided | 66% | 83% |
| Any RN/LPN full or part-time | 60% | 85%** |
| RN on staff full-time | 29% | 53%** |
| RN on staff full or part-time | 45% | 67%** |
| LPN on staff full or part-time | 40% | 68%** |
| Will admit resident who needs nursing care | 26% | 39%** |
| Will admit residents who use a wheelchair | 64% | 79%** |
| Discharged a resident because of need for nursing care | 66% | 79%** |
| * Significant at p.01** Significant at p .001 | ||
7.3 DIFFERENT MODELS OF ASSISTED LIVING
Attempts to understand assisted living and its role in providing long-term care to the frail elderly have been hindered by the lack of a common definition of "assisted living." Both the vagaries of the market place and variability in state policies have contributed to a situation in which a multiplicity of places are known as assisted living. Yet there are enormous differences among places known "assisted living facilities." These include differences in size, services, staffing, accommodations, and price (Gulyas, 1997; Hodlewsky, 1998; Manard and Cameron, 1997). Thus, analyzing data on facilities and reaching conclusions about "assisted living" can involve combining "apples and oranges," to borrow a phrase from Susan Hughes' description of evaluations of home and community-based care (Hughes, 1985).
The data reported by administrators also revealed substantial variability among places known as assisted living. To facilitate descriptions and comparisons among these ALFs, project staff developed a classification that divides the universe of assisted living facilities into four categories of ALFs. These four models classify ALFs based on their particular mix of services and privacy. Moreover, they represent very different conceptions of the role of assisted living. Thus, this classification scheme can be used to provide a more meaningful description of the universe of ALFs. It should also facilitate examination of the effects of different arrangements on outcomes of interest, such as resident length of stay, consumer satisfaction, affordability, and the capacity of such facilities to serve as a viable alternative to nursing home care.
7.3.1 Environmental Dimension
As briefly discussed in Section 4, ALFs were classified into two categories based on the level of privacy they offered. While privacy per se does not necessarily ensure consumer control over their environment, the previously cited studies clearly indicate the importance that consumers have placed on having a private room or apartment. Thus, privacy of the resident unit was selected as one axis or dimension of the classification. Within that, three levels of privacy were defined:
-
High Privacy. The initial approach was to define high privacy facilities as those in which all resident units (rooms or apartments) were private (i.e., not shared by unrelated individuals). However, it was also important to recognize the importance of a facility being able to offer consumers some choice, for example, a few shared units to meet the needs and preferences of some residents. Thus, high privacy was defined as a facility in which between 80 and 100 percent of the units were private. An estimated 40 percent of the ALFs were categorized as high privacy.
-
Minimal Privacy. A facility was categorized as "minimal privacy" if it had one or more rooms that housed two or more unrelated individuals in the same bedroom. Such a room, referred to as a "ward-type bedroom," was considered incompatible with the concept of assisted living regardless of the characteristics of their other units. An estimated 28 percent of the ALFs were categorized as minimal privacy.
-
Low Privacy. Any ALF that had no bedrooms shared by three or more persons but in which fewer than 80 percent of the bedrooms were private was defined as low privacy (i.e., 1-79% of the units were private). An estimated 31 percent of the ALFs were classified as low privacy.
The key analysis focused on the differences between high and low privacy ALFs. As shown in Exhibit 25, high privacy ALFs had higher occupancy rates, on average, and a higher basic monthly price. They were also more likely to be located on a multi-level campus. Finally, none of the high privacy ALFs had more than half their resident units as shared (i.e., semi-private). Indeed, three-quarters (75%) of the high privacy ALFs were completely private, that is, none of the units were shared.
| EXHIBIT 25. Comparison Between High and Low Privacy ALFs | ||
| Low | High | |
| Average occupancy rate | 82% | 86%* |
| Proportion that are self-described ALFs | 70% | 79%* |
| Located on a multi-level campus | 44% | 60%** |
| Average most common basic monthly price | $1,56 1 | $1,791** |
| % of ALFs with 100% private units | 0% | 75%** |
| % of ALFs with fewer than 50% private units | 77% | 0%** |
| Admit residents with behavioral symptoms | 31% | 16%** |
| Admit residents with urinary incontinence | 64% | 50%** |
| Retain residents with behavioral symptoms | 28% | 14%** |
| Retain residents with urinary incontinence | 66% | 54%* |
| Retain residents who needs help with locomotion | 64% | 57%* |
| Resident who needs nursing care >14 days | 32% | 22%* |
| Central storage or assistance w/medications | 90% | 82%* |
| * Significant at p.01** Significant at p .001 | ||
The most striking comparisons between high and low privacy ALFs, however, relates to differences in their admission and retention policies. As displayed in Exhibit 25, high privacy facilities were significantly less willing to admit and retain residents with behavioral symptoms, such as wandering or socially inappropriate behavior, and those with urinary incontinence. Similarly, they were less willing to retain residents who needed help with locomotion or who needed nursing care for 14 or more days. Finally, high privacy facilities were less likely to provide central storage of or assistance with medications.
7.3.2 Service Dimension
Services were another key dimension since the philosophy of assisted living embodies the concept of aging in place and services intended to meet the scheduled and unscheduled needs of residents. Three levels of services were defined:
(1) High Service ALFs. A facility was classified as providing high services if it provided at least the following:
- 24-hour staff oversight
- Housekeeping
- At least 2 meals a day
- Personal assistance, defined as help with at least two of the following: medications, bathing, or dressing
- At least one full-time registered nurse (RN) on staff; and
- Nursing care with facility staff.
Some observers would argue that the last two criteria were not an essential component of assisted living. For example, one might argue that a facility that would arrange nursing care through an external agency could also be classified as high services and that an RN on staff was not necessary. However, for purposes of distinguishing between ALFs, those that also have an RN on staff and offer nursing care with their own staff do provide more extensive services. Moreover, one could argue that providing such services might improve the ability of the facility to appropriately supervise assistance with medications, monitor the health status of residents, assess changes over time, and supervise and monitor the quality of the services provided or arranged. Further, such services might enhance residents' ability to age in place and enable the ALF to serve as a viable alternative to nursing home care. An estimated 31 percent of the ALFs were categorized as high service.
(2) Low Service ALFs. An ALF was classified as providing low services if it did not have an RN on staff OR did not provide nursing care with its own staff but did provide the following:
- 24-hour staff oversight
- Housekeeping
- At least 2 meals a day
- Personal assistance, defined as help with at least two of the following: medications, bathing, or dressing
These ALFs included both those facilities that were willing to provide or arrange nursing care for residents but did not have an RN on staff or were unwilling to provide nursing care with their own staff and facilities that provided basic services but did not offer any nursing care. An estimated 65 percent of the ALFs were classified as providing low services.
(3) Minimal Service ALFs. A facility was categorized as providing minimal services if it did not provide at least some level of personal/ADL assistance. Essentially, this is the level of services typically associated with congregate or domiciliary care, that is, basic room and board plus oversight. Such services would include: 24-hour staff oversight, housekeeping, and meals. However, the facility did not offer personal assistance with at least two of the following: medications, bathing, or dressing. Only an estimated four percent of ALFs were classified as providing minimal services.
The differences between high and low service ALFs were striking. High service ALFs were more likely to be located on a multi-level campus and to have a higher basic monthly rate structure, as shown in Exhibit 26.
| EXHIBIT 26. Comparison Between High and Low Service ALFs | ||
| Low | High | |
| Located on a multi-level campus | 36% | 65%** |
| Average most basic common monthly rate | $1,481 | $1,838** |
| Proportion of ALFs with 50% private units | 56% | 44%* |
| Admit residents with behavioral symptoms | 25% | 37%** |
| Admit residents with urinary incontinence | 59% | 69%* |
| Admit residents who need nursing care | 24% | 49%** |
| Admit resident who needs help with locomotion | 60% | 69%* |
| Admit resident who needs help with transfers | 40% | 54%** |
| Retain residents with behavioral symptoms | 22% | 30%* |
| Retain residents who need nursing care | 25% | 50%** |
| Retain residents who use wheelchairs | 67% | 76%* |
| Retain residents who need help with locomotion | 60% | 68%* |
| Retain residents who need help with transfers | 42% | 56%** |
| Retain residents who have moderate-severe cognitive impairment | 43% | 52%* |
| Retain resident who needs nursing care or monitoring for >14 days | 24% | 37%** |
| Average % of residents who received assistance with >3 ADLS | 20% | 34%** |
| Any RN on staff (full- or part-time) | 35% | 100%** |
| Any LPN on staff (full- or part-time) | 43% | 77%** |
| Arrange or provide therapy services | 69% | 89%** |
| * Significant at p.01** Significant at p .001 | ||
The high service ALFs also had more overall nurse staffing compared to the low service ALFs, including both RNs and LPNs. They were also less likely to have most of their units as semi-private. More important, high service ALFs were more willing than low service ALFs to admit and retain residents who could be viewed as "heavier care," including residents with behavioral symptoms and urinary incontinence, those who need help with locomotion and transfers, and those who need nursing care. Further, high service ALFs were more willing to retain residents with moderate to severe cognitive impairment and whose who used wheelchairs. The effect of the services and the high service ALF admission and retention policies can been seen in their resident characteristics. High service ALFs were significantly more likely to have residents who received help with three or more ADLs, according to administrator estimates.
The differences between high service ALFs and the low service ALFs that were willing to provide or arrange nursing care were also examined, as shown in Exhibit 27. This analysis was important since some felt that the latter type of ALF, which typically arranged for nursing services through a home health agency or similar provider, represented a desirable model that could meet the scheduled and unscheduled needs of residents.
| EXHIBIT 27. Comparison Between High Service ALFs and Low Service ALFs Willing To Arrange Nursing Services | ||
| Facility Characteristic | Low Service That Arrange Nursing | High Service |
| Retain resident who needs nursing care | 41% | 68%** |
| Retain resident who uses wheelchair | 78% | 88%* |
| Retain resident who needs help with locomotion | 72% | 81%* |
| Retain resident needing nursing care >14 days | 36% | 56%** |
| Admit resident with behavioral symptoms | 47% | 57%* |
| Admit resident with urinary incontinence | 76% | 84%** |
| Admit resident who needs nursing care | 35% | 63%** |
| Admit resident who needs help with locomotion | 68% | 77%* |
| Admit resident who receives help with transfers | 49% | 61%** |
| Any therapy services | 83% | 89%* |
| Any licensed nurse on staff (RN/LPN) full- or part-time | 66% | 100%** |
| Any RN on staff--full- or part-time | 32% | 100%** |
| LPN on staff full- or part-time | 50% | 77%** |
| Average percent of "heavy care" residents (receive assistance w/>3 ADLs) | 20% | 34%** |
| * Significant at p.01** Significant at p .001 | ||
As shown in Exhibit 27, there were significant differences in nurse staffing between the two types of ALFs, with high service ALFs having both more RN staffing and more staffing by LPNs. They were also more likely to arrange or provide therapy services. What is interesting is that these staffing differences were accompanied by differences in admission and retention policies. Despite their stated willingness to arrange nursing services, these low service ALFs were less willing than high service ALFs to admit residents who:
- Exhibited behavioral symptoms
- Had urinary incontinence
- Needed nursing care or monitoring (by RN or LPN)
- Received assistance with locomotion; and
- Received help with transferring
Similarly, the high service ALFs were more willing to retain residents who:
- Needed any nursing care or monitoring (by RN or LPN)
- Needed nursing care for >14 days
- Used a wheelchair
- Received assistance with locomotion; and
- Received help with transferring
These differences in admission and retention policies also played out in resident case mix. The administrators in high service ALFs reported having a resident population with a greater level of limitations in physical functioning (i.e., more residents who received help with >3 ADLs) than that reported for the low service ALFs that were willing to arrange nursing care.
In summary, the facilities classified as high service had more generous admission criteria, more expansive retention criteria (allowing residents to age in place longer), a higher resident case mix. They were also more willing to arrange or provide extensive services (nursing care >14 days and therapies).
7.3.3 Mix of Privacy and Services
While the effects of the single dimensions of services and privacy were interesting, an ALF is, in operation, a mix of the two dimensions. Thus, the analysis focused on describing the distribution of facilities across the cells representing different mixes of services and privacy and on examining the differences among the various types of ALFs. Exhibit 28 displays the distribution of assisted living facilities nationwide into the dimensions of service and privacy. Combining the mix of services and privacy revealed four basic types of ALFs.
| EXHIBIT 28. Distribution of ALFs by Categories | |
| Category | National Estimate |
| 1a. Low Privacy & Low Service | 27% |
| 1b. Minimal Privacy or Service | 32% |
| 2. High Privacy & Low Service | 18% |
| 3. High Service & Low Privacy | 12% |
| 4. High Privacy & High Service | 11% |
The first type of ALF encompassed facilities in the "minimal" group of ALFs (i.e., the 32% of ALFs that offered either minimal privacy or minimal services) and facilities offering low privacy and low service (i.e., 27% of the ALFs). The combined low/minimal privacy and services group was the most common type of assisted living facility, comprising 59 percent of all the ALFs.
A second type of ALF offered a high degree of privacy in accommodations but low services, a sort of "cruise ship" or hotel model of assisted living. An estimated 18 percent of the ALFs fell into this category.
A third type of ALF offered high services but a relatively low level of privacy. An estimated 12 percent of all ALFs fell into this category. As shown in Exhibit 29, three-quarters of these ALFs (74%) were facilities in which the majority of units were semi-private. One might think of this model as having characteristics of the traditional nursing home arrangement.
The fourth type of facility was in the "high privacy and high service" category and comprised only 11 percent of all ALFs.
The effects of these different service and environmental models will be examined in a subsequent set of reports that use more detailed facility, staff and resident-level information. However, even the limited information administrators were asked to provide during the telephone interviews revealed interesting differences between the different types or models of ALFs, as shown in Exhibit 29.
| EXHIBIT 29. Differences in ALF Characteristics Based on Combined Levels of Service and Privacy | |||||
| Facility Characteristic | National Estimates1 | ||||
| HS/HP | HS/LP | LS/HP | LS/LP | Minimals | |
| % of all ALFs | 11% | 12% | 18% | 27% | 32% |
| Average bed size | 62 | 67 | 49 | 45** | 55 |
| Occupancy rate | 87% | 86% | 84% | 81%* | 85% |
| % of Self-described ALFs | 74% | 65% | 80%* | 70% | 69% |
| % of ALFs on multi-level campuses | 74%** | 67%** | 52% | 35%** | 34%** |
| Average % bedrooms | 52%** | 68% | 58%* | 83%** | 79%** |
| Average % apartments | 48%** | 32% | 42%* | 17%** | 21%** |
| % with 100% private units | 75%** | 0%** | 77%** | 0%** | 13%** |
| Single rate facility: av. monthly rate | $2,003 | $2,091 | $1,869 | $1,655 | $1,396** |
| Multi-rate facility: average lowest rate | $1,607** | $1,543 | $1,506 | $1,261** | $1,151** |
| Multi-rate facility: average most common monthly rate | $1,940** | $1,839 | $1,771 | $1,458** | $1,373** |
| Multi-rate facility: average highest monthly rate | $2,625** | $2,429 | $2,218 | $1,986** | $1,960** |
| Any RN on staff full-time | 100%2 | 100%2 | 12%** | 13%** | 36%** |
| RN on staff full or part-time | 100%2 | 100%2 | 34%** | 33%** | 52%** |
| LPN on staff full or part-time | 76%** | 77%** | 50% | 40%** | 49%** |
| ALF will admit residents... | |||||
| With behavioral symptoms | 20% | 42% | 14%** | 26% | 36%* |
| Who need nursing care | 44% | 50%** | 22%** | 27%* | 30% |
| Who use a wheelchair | 79% | 78% | 75% | 70% | 64%** |
| Who need help with transfers | 45% | 55%* | 37%* | 42% | 44% |
| Who have moderate to severe cognitive impairment | 44% | 52% | 39%* | 45% | 52% |
| ALF will retain residents...3 | |||||
| With urinary incontinence | 60% | 74% | 51%* | 64% | 66% |
| Who need nursing care for >14 days | 28% | 42%* | 18%* | 28% | 30% |
| With behavioral symptoms | 17% | 37% | 11%** | 25% | 28% |
| Who need help with transfers | 48% | 57%** | 40%* | 46% | 45% |
| Who need nursing care | 41% | 54%** | 21%* | 28%* | 32%* |
| % of residents with >3 ADLs | 31% | 35%** | 20%* | 19%** | 23% |
| % of residents with moderate to severe cognitive impairment | 35% | 38% | 28%* | 35% | 35% |
* Significant difference compared to overall mean at p.01** Significant difference compared to overall mean at p.001
| |||||
The High Service/High Privacy (HS/HP) facilities were more likely to be located on a multi-level campus and to have a higher proportion of apartments. In addition, they were much more likely than average to have all-private resident units (i.e., 75% of the HS/HP ALFs had no shared units). Further, HS/HP ALFs that had several monthly rates, depending on the accommodations or services provided to the resident, tended to have higher than average monthly basic rates. By definition, they were more likely to have a full-time RN on staff, but the difference in full-time RN staffing was striking (e.g., 100% compared to an average of 13% among the low service facilities and 36% among the "minimal" ALFs). Similarly, they were more likely than any of the low or minimal service facilities to have an LPN on staff as well (i.e., 76% compared to 50%).
One interesting finding is that HS/HP ALFs did not have significantly more expansive admission and retention policies or a more functionally impaired resident case mix, relative to the overall mean rates. As noted earlier, there were significant differences on admission and retention policies and resident case mix between ALFs when they were categorized only on the basis of their services. However, this trend toward more expansive admission and retention policies was reversed for ALFs classified on the privacy dimension alone (i.e., high privacy facilities had no difference or had less expansive policies). Thus, it appears in the case of ALFs that offered both high services and high privacy the combination of services and privacy effectively cancelled out the individual trends with respect to admission and retention policies.
The High Service/Low Privacy (HS/LP) ALFs were more likely to be situated on a multi-level campus and more likely to have all types of nursing staff. Unlike HS/HP ALFs, however, they had more expansive admission and retention policies.
They were significantly more likely to admit and retain residents who needed any nursing care and residents who needed help with transfers than other facilities. Similarly, they were more likely to retain residents who needed nursing care for more than 14 days. Finally, their admission and retention policies showed in their resident case-mix, since HS/LP ALFs were significantly more likely to have residents who received hands-on assistance with three or more ADLs, particularly relative to both types of low service ALFs.
The Low Service/High Privacy (LS/HP) ALFs were more likely to be self-described assisted living facilities. In addition, they appeared to be the emerging model, with a length of time in business (an average of 10.8 years) that was significantly lower than the other ALF types. Like the HS/HP ALFs, they were more likely to have apartments than the average facility; however, they were significantly less likely than the high service facilities to have any RN on staff. LS/HP ALFs also had restrictive admission and retention policies. They were less likely than the average ALF to admit or retain residents with behavioral symptoms, those who needed nursing care, residents with moderate to severe cognitive impairment, or those who needed help with transfers. They were also less likely to retain residents with urinary incontinence and residents who needed nursing home care for more than 14 days. Finally, their admission and discharge criteria were reflected in their resident casemix. According to the administrators, the LS/HP ALFs were significantly less likely to have residents with moderate to severe cognitive impairment and residents with functional limitations in three or more ADLs.
Compared to the other ALF types, the Low Service/Low Privacy (LS/LP) ALFs had lower occupancy rates and were more likely to be free-standing rather than located on a multi-level campus. They were also less likely to have apartments than the average ALF. Further, they were significantly less likely to offer 100 percent private accommodations to residents. In 78% of the LS/LP ALFs, the majority of resident units were semi-private. LS/LP ALFs were also significantly less likely to have any type of nurse staffing and less likely to admit or retain residents who needed any type of nursing care or monitoring. They were also significantly less likely to have residents who received hands-on assistance with three or more ADLs. Finally, the monthly price in LS/LP ALFs that had a "multi-rate" pricing structure was significantly lower than average basic monthly rate in the other types of ALFs.
The Minimal ALFs included all facilities that offered either minimal privacy or minimal services. These ALFs, like the LS/LP facilities, were less likely to be located on a multi-level campus and more likely to offer rooms rather than apartments. They were also significantly less likely to have all-private units. In fact, the majority of resident accommodations were semi-private or ward-type rooms in more than two-thirds (70%) of the minimal ALFs. In terms of admission and retention policies, they were more likely than all but the HS/LP ALFs to admit residents with behavioral symptoms. However, ALFs in this category were less likely than the average ALF to admit residents who used a wheelchair and less likely to retain residents who used a wheelchair or who needed any type of nursing care. Finally, their monthly basic rates were lower than average.
In summary, it is clear from the information reported by ALF administrators that there were significant differences among assisted living facilities and that some distinct types emerged.
-
First, there were differences in accommodations not merely in terms of privacy for residents in their units but also in the proportion of apartments. The 59 percent of the ALFs categorized as low privacy/low service or minimal privacy or service were much less likely to offer private units and much less likely to offer apartment accommodations.
-
Second, there were significant differences in nurse staffing, not merely for RNs but also for LPNs. Regardless of the type of environment they offered, the high service ALFs were consistently more likely to have more availability of some type of nurse staffing.
-
Third, both privacy and service dimensions capture important features of ALFs; however, the interaction or mix of services and privacy appears to modify the effect of a single dimension. For example:
-
The ALFs with the most expansive admission and retention criteria were the category of homes known as high service/low privacy.
-
The ALFs offering high services/high privacy did not have more expansive admission and retention criteria than the average ALF. Further, they were the most restrictive in terms of admission or retention of residents with behavioral symptoms and retention of residents with moderate to severe cognitive impairment.
-
The ALFs offering high privacy and low services had the most restrictive admission and retention criteria, particularly with respect to residents who might need nursing care or monitoring or hands-on assistance with transfers.
-
-
Fourth, the admission and retention criteria adopted by many ALFs represent a potential limitation for many residents with Alzheimer's disease or other dementias. For many such individuals, the ultimate trajectory of their cognitive performance involves decline and for some includes the likelihood of having behavioral symptoms at some time during the course of the disease. However, fewer than half of the ALFs were willing to retain residents with moderate to severe cognitive impairment. In only those ALFs classified as high service/low privacy (50%) or minimal service or privacy (50%) did at least half the administrators indicate a clear willingness to retain residents with moderate to severe cognitive impairment. Moreover, with the exception of low privacy/high service ALFs, fewer than one-quarter of the ALFs were unequivocally willing to retain residents with behavioral symptoms. Thus, it would appear that with respect to many ALFs, individuals with Alzheimer's disease or other dementias may have fewer options in terms of privacy, high services, and apartments, particularly if the resident's cognitive performance declines as the resident ages in place.
-
Finally, the differences in basic monthly price were fairly predictable. Low service/low privacy and minimal service or minimal privacy ALFs tended to have the lowest monthly rates, on average, while the high privacy/high service ALFs had the highest rates. The low privacy/high service and high privacy/low service ALFs fell in between.
The different types or models of assisted living that emerged illustrate the fallacy in assuming that "an assisted living facility is an assisted living facility." Moreover, they highlight the challenges faced by consumers who are attempting to determine whether "assisted living" can meet their needs or to select a particular facility.
8. PRICE OF ASSISTED LIVING
This section of the report presents information provided by the administrators of a national probability sample of ALFs on the basic monthly prices charged by ALFs. A forthcoming report will present additional data on charges, based on more extensive interviews with the administrators, residents and families.
As shown in Exhibit 30, the administrators reported that the vast majority of facilities (82%) had more than one basic, monthly rate. These ALFs had rates that varied depending on such factors as the nature of the accommodations, the services provided to the resident, or both.45
ALF administrators also reported considerable variation in basic rates. For example, administrators reported rates that ranged from a low of $ 300 per month to a high of $7,130 per month or from $3,600 per year to more than $85,000 per year. However, these extremes are not representative of the usual rates charged. For facilities with a multiple rate structure, the average lowest basic rate was $1,338 per month or about $16,000 per year. The average highest basic rate was $2,137 per month or almost $26,000 per year. The most common basic monthly rate, however, was about $20,500 per year for ALFs with a single rate structure and almost $19,000 per year for ALFs with multiple rates.
| EXHIBIT 30. Monthly Prices | |
| Monthly Charge By Price Structure | National Estimates |
| % of Facilities with Single Rate | 18% |
| Range: $300-$6,400 | |
| Average Rate | $1,710 |
| % of Facilities with Multiple Rates | 82% |
| Range: $300-$7,130 | |
| Average Lowest Rate | $1,338 |
| Average Most Common Rate | $1,582 |
| Average Highest Rate | $2,137 |
In considering these reported rates, it is important to note that the facilities were extremely varied in the accommodations and services offered. Further, as shown in the preceding section of this report, rates varied tremendously according to the level of privacy and services offered by the facility.
Exhibit 31 displays the distribution of the monthly charges across major price categories and the price structure encountered by residents. As shown, the most common monthly price range was between $1000 and $1999 per month or $12,000 to $24,000 per year. Among ALFs with single rate structures, 45 percent fell into this rate group. Among ALFs with multiple rate structures, about half (52%) had basic monthly rates within this group.
| EXHIBIT 31. Distribution of Average Basic Monthly Rates |
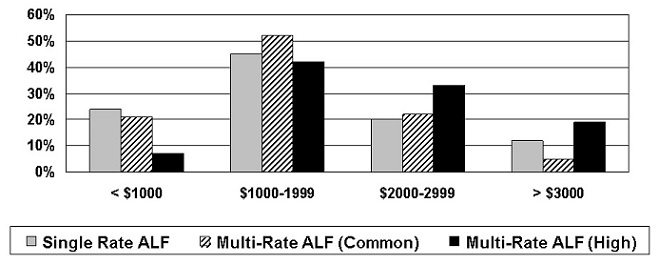 |
It is important to note that the average monthly price was skewed by the presence of a very large number of ALFs (i.e., 59%) that offered minimal or low privacy and services and had lower than average prices, as shown in Exhibit 32. For example, the most common price for "minimal" ALFs with multiple rates was $1,373 per month, while for low service/low privacy ALFs, it was $1,458. The fact that these low privacy and low service ALFs constituted more than half of the ALFs (59%) nationwide meant that their significantly lower rates brought down the average basic monthly price for all ALFs. The most common monthly price for high service/high privacy ALFs was $1,940 per month or more than $23,000 per year. Similarly, the average most common rates for high service/low privacy facilities and for low service/high privacy facilities were $22,000 and just over $21,000 per year, respectively. For the average highest monthly rate reported by administrators for high service/low privacy facilities and low service/high privacy ALFs, the annual rates were $29,000 and just over $26,600. Thus, residents who were seeking either a high level of services or high privacy could expect to pay considerably more than the industry average -- about 33 percent more than the average basic rate for low service/low privacy facilities and about 40 percent more than the average rate for "minimal" facilities.
It is also important to place the price charged for assisted living in perspective, given the income of older persons. As shown in Exhibit 33, the income of most persons aged 75 and older in 1997 would have been insufficient to cover the basic monthly price for the majority of assisted living facilities, according to data provided by the U.S. Bureau of the Census in the Current Population Survey.46 As shown, more than 60 percent of the ALFs had a basic monthly price of $15,000 per year or higher. However, only about one-third (36%) of persons aged 75 or older had incomes this high. Given the fact that the basic monthly price does not cover ancillary services or such costs as clothing, insurance, medications, and so on, the actual annual expenses of residents in ALFs was likely quite a bit higher than the basic rate. Thus, even fewer of persons aged 75 or older would have been able to afford residence in an ALF if they used only their income.
| EXHIBIT 32. Differences in Average ALF Prices--Based on Combined Levels of Service and Privacy | |||||
| Facility Characteristic | National Estimates1 | ||||
| HS/HP | HS/LP | LS/HP | LS/LP | Minimals | |
| % of all ALFs | 11% | 12% | 18% | 27% | 32% |
| Single rate facility: Average monthly rate | $2,003 | $2,091 | $1,869 | $1,655 | $1,396** |
| Multi-rate facility: Average lowest rate | $1,607** | $1,543 | $1,506 | $1,261** | $1,151** |
| Multi-rate facility: average most common rate | $1,940** | $1,839 | $1,771 | $1,458** | $1,373** |
| Multi-rate facility: Average highest rate | $2,605** | $2,429 | $2,218 | $1,986** | $1,960** |
* Significant at p.01 compared to overall mean** Significant at p.001 compared to overall mean
| |||||
Finally, the reader is cautioned about making direct comparisons of costs between the monthly basic rate for assisted living and that for nursing homes. First, as noted earlier, the resident characteristics and care needs are very different, with nursing homes, on average, having a much "heavier" case mix. Second, nursing home per diems typically cover not only all personal care and nursing care but also such other costs as medications, laundry, incontinence supplies, and so on. With the exception of some personal assistance, these are typically not covered in the monthly price set by ALFs. Third, there are some indications that nursing homes reduce residents' use of Medicare-covered health services, particularly hospital costs, while residents in assisted living and residential care facilities may incur higher costs of this type, although this is an issue under debate (Leon et al., 1999; Phillips et al.,1998). Thus, more data are needed to address fully the cost of assisted living.
| EXHIBIT 33. Comparison of Income of Persons Aged >75 & Average ALF Basic Yearly Prices46 |
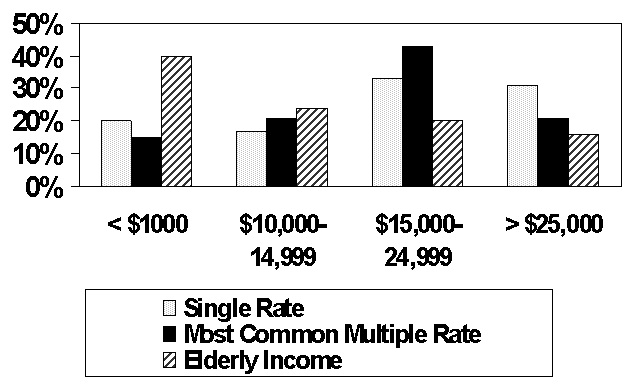 |
9. CONCLUSIONS
As the preceding sections have shown, there is a large and growing supply of places known as assisted living facilities that, as of the beginning of 1998, were providing care to more than one-half million frail older persons. Assisted living holds out the promise of dramatically affecting the provision of long-term care. Its philosophy of emphasizing the dignity, autonomy, and independence of older persons is one that should inform the entire long-term care sector from home and community-based care to all forms of residential long-term care, including nursing homes. Further, its philosophy of providing services to meet the scheduled and unscheduled needs of older persons should enable the frail elderly to age in place. One should be able to have residential settings in which services change to meet the needs and preferences of residents as opposed to the too-frequent situation of older persons being shuffled from one setting to another in order to secure needed services as their needs change over time. Finally, the philosophy of assisted living, if implemented, should lead to residential environments that are much closer to the preferences of older persons than those offered by the current supply of traditional board and care facilities and nursing homes.
Given the vast promise of assisted living, the information garnered from this first survey of a nationally representative sample of assisted living facilities raised a number of issues and questions.
1. WHAT IS ASSISTED LIVING?
As noted earlier, attempts to understand assisted living and its role in providing long-term care to the frail elderly have been hindered by the lack of a common definition of "assisted living." One of the clear findings from this study is that there was enormous variation among the places known as "assisted living facilities." Assisted living is still a relatively new industry, and it is one that has not developed in an orderly, planned manner. Both market forces and public policy have contributed to a multiplicity of models and facility types within the broad umbrella term of "assisted living." However, even within the study's restrictive eligibility criteria, places known as ALFs differed widely in ownership, auspice, size, and philosophy. Indeed, the responses by administrators suggested several different models within the broad rubric of "assisted living." Each model or type had different patterns with respect to services, staffing, policies on admission and retention of residents, accommodations, and price. Thus, based simply on a description of the multiplicity of facility types, it is difficult to say what "assisted living" is.
| Typology and Distribution of ALFs by Levels of Service and Privacy | |
| Category | National Estimate |
| High Privacy & High Service | 11% |
| High Privacy & Low Service | 18% |
| Low Privacy & High Service | 12% |
| Low Privacy & Low Service | 27% |
| Minimal Privacy or Minimal Service | 32% |
Another difficulty inherent is answering the question -- "what is assisted living" -- derives from disagreement over which of the models identified best captures the philosophy of assisted living. Some would argue that the high service/high privacy model best exemplifies the philosophy of assisted living since it captures both key environmental dimension (i.e., privacy) and offers residents the widest range of services, which should facilitate aging in place another key component of the philosophy. Unfortunately, the high privacy/high service ALFs did not appear to have admission and retention policies consistent with aging in place, unless one has a circumscribed definition. (This is discussed below.) Moreover, this type of ALF constituted only 11 percent of the industry in 1998.
On the other hand, one might argue that assisted living explicitly rejects a "medical model" of long-term care, including the requirement of RN staffing. In this view, the high privacy/low services model could conceivably be regarded as best capturing the chief philosophical tenets of assisted living, particularly for those ALFs that were willing to arrange nursing and therapy services as needed by residents. The difficulty is that such ALFs had neither service patterns nor the admission and retention policies consonant with meeting residents' scheduled and unscheduled needs or enabling them to age in place. In essence, such facilities had higher than average costs and lower than average resident case mix, which raises questions about whether this model embodied the philosophy of assisted living.
Finally, many would argue that other models, such as the low privacy/low service ALFs and the "minimal" ALFs, which constituted more than half the supply of facilities, appeared to be much closer to the traditional domiciliary care or board and care model of residential care, with few services and considerably less privacy than seem inherent in the concept of assisted living. However, there is disagreement among members of the industry that describe themselves as assisted living facilities over whether such environmental and service features are a necessary component of the ALF concept.
Given this variability among ALFs and the lack of agreement on an operational definition of assisted living, the answer to the question -- "what is assisted living" -- appears to be that it is many different things, at present. In effect, the term "assisted living" may be more useful to providers as a marketing tool than it is to consumers or policy-makers as a useful descriptor that would distinguish assisted living from other residential long-term care settings. This represents a real challenge for older persons and their families as they attempt to determine whether assisted living is a viable alternative and to select an ALF that has the environment, services, staffing, and policies that will meet their needs.
2. DOES THE ENVIRONMENT OF ASSISTED LIVING FACILITIES MATCH THE PHILOSOPHY OF ASSISTED LIVING?
Based on the information provided by ALF administrators, the answer to this question is clearly mixed. On the one hand, residents of assisted living facilities had considerably more privacy than residents of most nursing homes and the majority of board and care homes. On the other hand, there was significant variability within the assisted living industry, and some facilities provided environments that did not appear consistent with the environmental aspects of the assisted living philosophy. Further, the answer is preliminary, since other key features of the environment and resident satisfaction with them will be examined in a subsequent report.
In many respects, the supply of facilities did match key elements of the philosophy of assisted living. First, ALF accommodations, overall, met residents' preferences for privacy. Most (73%) resident units were private, and most residents (62%) also had a private full bathroom, while another six percent had at least a private half-bath. Second, the environments offered some important choices to consumers. Most assisted living facilities, for example, offered consumers some choice in terms of privacy. Only 27% of the facilities had all private units. Thus, in the vast majority of ALFs, consumers had some opportunity to share a room or apartment, if they so desired. Further, consumers had choices among ALFs based on whether they offered apartments or rooms. Forty-three percent of the resident units were apartments.
At the same time, a large number of ALFs had environmental features that were arguably inconsistent with the philosophical tenets of assisted living. As noted, 28 percent of the ALFs had one or more rooms that housed three or more unrelated persons a model considered incompatible with the concept of "assisted living." Further, in more than one-quarter (26%) of the ALFs nationwide, only semi-private units were available. In addition, in slightly more than half the ALFs (52%) nationwide, fewer than half the resident units were private. These are settings that would appear incompatible with the general thrust of the assisted living philosophy, although as noted above, some would disagree.
There is less agreement about whether apartments are an essential part of the assisted living model of care. To some, the availability of apartments and the autonomy that entails for consumers is a hallmark of assisted living. Certainly, that was the model that started in the United States in Oregon. However, it was not the dominant model in the industry. Sixty-eight percent of the ALFs offered only rooms (not apartments) as accommodations, and rooms were the dominant unit type (i.e., an estimated 57% of all resident units). Further, only six percent of the ALFs offered consumers a choice by having a mix of rooms and apartments.
In summary, the majority of residents' accommodations met the key criteria of privacy, embodying, in part at least, a key element of the assisted living environmental philosophy. Similarly, many facilities offered a range of choices to consumers. At the same time, there was considerable variation in the industry both in terms of privacy and in the provision of apartments. This was particularly true at the "low-end" of the price market, which was dominated by the low and minimal privacy ALFs. This raises the possibility that low and moderate income older persons will have access to board and care-type facilities, while only well-to-do elderly will have access to the types of environmental models that seem to embody key elements of the assisted living philosophy.
3. DO ASSISTED LIVING FACILITY SERVICES MATCH THE PHILOSOPHY OF ASSISTED LIVING?
The philosophy of assisted living addresses a variety of issues related to services, including, for example, how services are provided (i.e., so as to maintain the resident's dignity and independence) and how service arrangements are negotiated between the consumer and provider. Thus, the philosophy of assisted living encompasses key concepts of consumer choice and autonomy in relation to services. In addition, the assisted living concept speaks to the provision of services to meet the scheduled and unscheduled needs of residents and of the desirability of helping residents age in place by altering services as residents' needs and preferences change.
The data from this set of interviews with administrators was quite limited with respect to answering this question about services, but they did provide some initial results about this important issue.
Nearly all the ALF administrators reported that they provided or arranged basic hospitality, supervision, and personal assistance services. These would be sufficient to meet residents' basic needs for help with instrumental activities of daily living (IADLs), such as housekeeping, meal preparation, medications, and at least basic assistance with early-loss ADLs, such as bathing and dressing. In addition, the vast majority (80%) of ALFs indicated they would provide or arrange some nursing care and, if needed, therapies (74%).
At the same time, the amount or extent of nursing care that would be made available was limited. First, just over one in five ALFs (21%) would not arrange or provide any nursing care or monitoring. Second, only about half (55%) the ALFs reported having an RN on staff full- or part-time, and only 40 percent had a full-time RN. This limited the ability of those ALFs with little or no RN services to assess residents' health care needs, including unmet care needs, medication reactions or interactions, and access to preventive health care services and limit their ability to develop care plans that would maximize residents' functional well-being. Although a social model of care can exist in a facility that has an RN on staff, residents' ability to remain physically independent and socially active may be enhanced by systematic assessment and monitoring by a nurse.
The implication of this is that for some residents, even a short-term illness could not be handled in the ALF in which they lived. In fact, in focus group interviews, many assisted living residents reported dissatisfaction with the fact that even an episode of a temporary illness such as influenza would result in a transfer to a hospital or nursing home (Hawes and Greene, 1998).
Thus, the ability of assisted living facilities to meet unscheduled health-related needs is probably still an open question in part because of facility policy and in part because of potential constraints imposed by state licensure regulations and nurse practice acts.47
4. DO ASSISTED LIVING FACILITIES ALLOW OLDER PERSONS TO AGE IN-PLACE?
It probably begs the question to say that the answer to this question depends on how you define "aging in place." However, the operational definition of aging in place one adopts determines whether ALFs are regarded as promoting aging in place or as incompatible with the concept.
Aging in place could be conceived of as spanning only a limited segment of a potential change in a resident's health and physical and cognitive functioning. For example, many facilities were willing to accommodate a consumer whose needs changed from requiring relatively little help (e.g., meal preparation, housekeeping) to the stage at which the resident required help with bathing, dressing, and managing medications or used a wheelchair to get around. If this were the operational definition of aging in place, then the admission and retention policies of assisted living facilities suggested that they were willing to allow residents to age in place.
On the other hand, aging in place could be conceived of as a more expansive concept. It could mean that the average consumer could select an assisted living facility and reasonably expect to live there to the end of his or her life, regardless of changes in health or physical and cognitive functioning. If this were one's definition of aging in place, then the answer about whether ALFs allow aging in place would more often be a "no." The majority of ALFs reported they would not retain residents who needed help with transfers (54%) or who needed nursing care (68%). In fact, the vast majority (72%) would not retain a resident who needed nursing care for more than 14 days. More troubling, given demographic and morbidity trends, most facilities (55%) reported they were unwilling to retain residents with moderate to severe cognitive impairment, and only 28% would retain residents with behavioral symptoms. Further, three-quarters of the facilities (72%) reported that during the preceding six months, they had discharged one or more residents because they needed nursing care. Thus, whether because of facility policy or state regulations, most ALFs would not allow residents to age in place across the full spectrum of potential changes in need. At the same time, some ALFs, particularly the high service/low privacy ones, reported willingness to allow substantial physical and cognitive status limitations among residents but still retain the resident and provide or arrange the needed services.
Do ALFs Serve as a Viable Alternative to Nursing Homes? Because of the limitations ALFs placed on their resident mix, as evidenced by their admission and retention policies, the answer to this would have to be "no" for the majority of facilities. Further evidence supporting this position comes from an examination of the administrators' reports about resident characteristics. According to estimates by the administrators, only about one-quarter of ALF residents (24%) received help with three or more ADLs, while more than four in five (83%) of nursing home residents had such functional limitations. Similarly, only about one-third of ALF residents were estimated to have moderate to severe cognitive impairment, whereas more than two-thirds of nursing home residents were cognitively impaired. Thus, there may have been some overlap of residents at the "higher acuity" or "heavier care" end of assisted living and the "lower acuity" end of nursing homes. However, for the majority of homes and residents, the two types of facilities had somewhat distinct positions and functions in terms of the staffing and services they provided and the consumers they served.
It is important to note that a variety of forces militate against assisted living facilities serving as an alternative to nursing homes. These include preferences of many ALF residents to live in settings and with other residents who do not look "too much like a nursing home;" the concerns of state regulators; the interest and political power of the nursing home lobby; and the conception ALF owners and administrators have of their "niche."
5. IS ASSISTED LIVING AVAILABLE TO LOW OR MODERATE INCOME OLDER PERSONS?
Assisted living was largely unaffordable for moderate and low-income older people. Forty percent of all people aged 75 and older had incomes below $10,000 per year in 1997. Nearly two-thirds had incomes below $15,000 (U.S. Bureau of the Census, 1998). Thus, two out of three older persons could not afford even the most common basic monthly price of assisted living (i.e., almost $19,000 a year in multi-rate facilities). Indeed, they could not afford the most common monthly rate in even the low privacy/low service or minimal facilities (i.e., average annual basic prices of about $17,500 and $16,500, respectively).
Within this generalization, there were some exceptions. Some facilities, for example, reported charging less than $1,000 per month or $12,000 per year. However, these facilities were more likely to offer few services and little privacy. In other words, low income elders would have mainly had the option of an ALF that was most like traditional "board and care." While there were a few exceptions to this general rule, they were mainly small-scale, experimental programs or were situated in the few states, like Oregon, that had included payments for assisted living in their Medicaid budgets (i.e., for the personal care services not the room and board costs) and had set acceptable payment rates. Waiver programs that funded assisted living, while growing, did not serve large numbers of elderly (Mollica, 1998). And in any event, they were restricted to persons who met state Medicaid eligibility criteria. The vast numbers of near-poor and moderate-income elderly could neither afford most assisted living facilities nor qualify for public payments.
There are two other ways persons with low or moderate incomes could pay for assisted living. First, they could spend-down any assets they might have, using the additional funds to supplement their income and pay for the ALF. Second, they could receive assistance in paying for assisted living from a relative. Unfortunately, this survey did not address these possibilities. A subsequent report, however, will provide information on the income of a national probability sample of residents and will help determine the extent to which low and moderate income individuals reside in ALFs and the type of ALFs in which they reside.
REFERENCES
Assisted Living Federation of America (1996). An overview of the assisted living industry: 1996. Fairfax, VA: A report by Coopers & Lybrand.
Assisted Living Federation of America (1998). The assisted living industry: An overview--1998. Fairfax, VA: A report by Price Waterhouse.
American Seniors Housing Association (1998). Seniors housing construction report--1998. Washington, DC: Author.
Assisted Living Quality Coalition (1998). Assisted living quality initiative: Building a structure that promotes quality. Washington, DC: Author.
Buck, J.R. (1996). Assisted living: An uncharted course. Bifocal, Newsletter of the Commission on Legal Problems of the Elderly, 16(4), 1-7.
Citro, J., & Hermanson, S. (1999). Assisted living in the United States. (AARP Working Paper, unpublished). Washington, DC: American Association of Retired Persons, Public Policy Institute.
Clark, R., Turek-Brezina, J., Hawes, C., & Chu, C. (1994, November). The supply of board and care homes: Results from the 1990 National Health Provider Inventory. Presentation at the annual meeting of the Gerontological Society of America, Atlanta, GA.
Coleman, B.J. (1995). European models of long-term care in the home and community. International Journal of Health Services, 25, 455-474.
Conway, M., MacPherson, A., & Sfiroudis, J. (1997). The assisted living sector: The evolution continues. Global Equity Research, Health Services. New York: Salomon Brothers.
Dittmar, N.D., & Smith, G. (1983). Evaluation of the board and care homes: Summary of survey procedures and findings. Denver, CO: Denver Research Institute, University of Denver.
DRF (1995). The Directory of Retirement Facilities -- 1995. Baltimore, MD: HCIA, Inc.
DRF (1997). The Directory of Retirement Facilities -- 1997. Baltimore, MD: HCIA, Inc.
Dunah, R., Harrington, C., & Bednew, B. (1993). Variations and trends in licensed nursing home capacity in the states, 1978-1992. San Francisco: Institute on Health and Aging, University of California.
General Accounting Office, U.S. Congress (1997). Consumer protection and quality of care issues in assisted living. Washington, DC: U.S. Government Printing Office.
Gulyas, R. (1997). The not-for-profit assisted living industry: 1997 profile. Washington, DC: American Association of Homes and Services for the Aging.
Harrington, C., DuNah, R., Bedney, B., & Carillo, H. (1994). Variations and trends in licensed nursing home capacity in the states, 1978-1993. San Francisco: Institute for Health and Aging, University of California at San Francisco.
Hawes, C., Phillips, C.D., Morris, J.N., Mor, V., & Fries, B.F. (1994, November). Design of the evaluation of the national Nursing Home Resident Assessment Instrument (RAI) and effects on process quality. Presentation at the annual meeting of the Gerontological Society of America, Atlanta, GA.
Hawes, C., Lux, L., Wildfire, J., Green, R., Packer, L., Iannacchione, V., & Phillips, C. (1995c). Study of North Carolina domiciliary care home residents. Research Triangle Park, NC: Research Triangle Institute.
Hawes, C., Mor, V., Wildfire, J., Lux, L., Green, R., Iannacchione, V., & Phillips, C. (1995a). Executive summary: Analysis of the effects of regulation on the quality of care in board and care homes. Research Triangle Park, NC: Research Triangle Institute. [http://aspe.hhs.gov/daltcp/reports/care.htm]
Hawes, C., Wildfire, J., Mor, V., Wilcox, V., Spore, D., Iannacchione, V., Lux, L., Green, R., Greene, A., & Phillips, C. (1995b). A description of board and care facilities, operators and residents: Analysis of the effect of regulation on the quality of care in board and care. Research Triangle Park, NC: Research Triangle Institute. [http://aspe.hhs.gov/daltcp/reports/bcdesces.htm]
Hawes, C. and Greene, A.M. (1998). Focus group interviews with residents of assisted living facilities on how they define quality. Beachwood, OH: Myers Research Institute, unpublished paper.
Hawes, C., Wildfire, J., & Lux, L. (1993). The regulation of board and care homes, results of a 50-state survey: National summary. Washington, DC: American Association of Retired Persons.
Hodlewsky, R.T. (1998). Facts and trends: 1998 The assisted living sourcebook. Washington, DC: National Center for Assisted Living, American Health Care Association.
Hughes, S.L. (1985). Apples and oranges? Review of evaluations of community-based long-term care. Health Services Research, 20(4), 461-88: October.
Jenkens, R. (1997). Assisted living and private rooms: What people say they want. Washington, DC: American Association of Retired Persons, Public Policy Institute.
Kane, R.A. (1999). Personal communication about the study of assisted living study in Oregon.
Kane, R.A., & Wilson, K.B. (1993). Assisted living in the United States: A new paradigm for residential care for frail older persons? Washington, DC: American Association of Retired Persons.
Kane, R., et al. (1998). Consumer perspectives on private versus shared accommodations in assisted living settings. Washington, DC: American Association of Retire Persons, Public Policy Institute.
Krauss, N.A. and Altman, B.M. (1998). Characteristics of nursing home residents 1996. Rockville, MD: Agency for Health Care Policy and Research: 1998 MEPS Research Findings No.5. AHCPR Pub.No.99-0006.
Leaman, S. (1998). Interviews with lenders and developers. Research Triangle Park, NC: Research Triangle Institute, unpublished paper.
Leon, J., Cheng, C.K., & Neumann, P.J. (1998). Alzheimer's disease care: Costs and potential savings. Health Affairs, 17, 206-216.
Manard, B., et al. (1990). Methodology for developing a comprehensive list of licensed board and care homes. Unpublished report. Fairfax, VA: Lewin/ICF, Inc., and James Bell Associates.
Manard, B., Altman, N.B., Kane, L., & Zeuschner, A. (1992). Policy synthesis on assisted living for the frail elderly. Fairfax, VA: Lewin-VHI, Inc. [http://aspe.hhs.gov/daltcp/reports/polsynes.htm]
Manard, B. & Cameron, R. (1997). A national study of assisted living for the frail elderly: Report on in-depth interviews with developers. Washington, DC: The Lewin Group. [http://aspe.hhs.gov/daltcp/reports/indepth.htm]
Meyer, H. (1998, July 20). The bottom line on assisted living. Hospitals and Health Networks, pp. 22-28.
Mollica, R.L., Ladd, R.C., Dietsche, S., Wilson, K.B., & Ryther, B.S. (1992). Building assisted living for the elderly into public long-term care policy: A guide for states. Portland, ME: Center for Vulnerable Populations, National Academy for State Health Policy, and Brandeis University.
Mollica, R. (1998). State assisted living policy -- 1998. Portland, ME: National Academy for State Health Policy. [http://aspe.hhs.gov/daltcp/reports/98state.htm]
Mollica, R., & Snow, K. (1996). State assisted living policy: 1996. Portland, ME: National Academy for State Health Policy. [http://aspe.hhs.gov/daltcp/reports/96state.htm]
Moon, M., Gaberlavage, G., & Newman, S.J. (1989). Preserving independence, supporting needs: The role of board and care homes. Washington, DC: American Association of Retired Persons.
Mullen, A. (1997). The assisted living industry: A critical assessment from 1997 forward. Presentation at the Assisted Living Market Research and Feasibility Summit sponsored by the National Investment Conference.
National Investment Conference (1998). National survey of assisted living residents: Who is the customer. Annapolis, MD: M. Wylde.
Newcomer, R. (1999). Personal communication about study of assisted living in California.
Newcomer, R.J., Lee, P., & Wilson, K.B. (1997). Residential care for the frail elderly: State innovations in placement, financing, and governance. San Francisco: Institute for Health and Aging, University of California at San Francisco.
Phillips, C., Hawes, C., Green, R., and Norton, E. (1998). Medicare Utilization Among Board and Care Residents. Beachwood, OH: Myers Research Institute, Menorah Park Center for Senior Living.
Province Valuation Group (1997, Summer). National assisted living demand: A bed-need assessment using the most recently published national estimates and projections [Special issue]. Prognosis.
Reichstein, K.J., & Bergofsky, L. (1980). Report on the national survey of state administered domiciliary care programs in 50 states and the District of Columbia. New York: Horizon House Institute.
SeniorCare (1998, January). SeniorCare Investor. New Canaan, CT: Irving Levin Associates.
Sherwood, S., Mor, V., & Gutkin, C. (1981). Domiciliary care clients and the facilities in which they reside (Vols. 1-3). Boston: Hebrew Rehabilitation Center for the Aged.
U.S. Bureau of the Census (1997). Published data from the 1998 Current Population Survey, "Money Income in the United States, 1997" (Series P60-200), Table 8, Income Distribution of Older Persons, 1997.
U.S. House of Representatives, Select Committee on Aging (1989). Board and care homes in America: A national tragedy. Report by the Chairman of the Subcommittee on Health and Long-Term Care, House of Representatives, Comm.Pub.No. 101-711.
Wildfire, J., Hawes, C., Mor, V., Iannacchione, V., Lux, L., Green, R., Greene, A., Wilcox, V., Spore, D., & Phillips, C. (1995). A description of board and care facilities, operators, and residents. Research Triangle Park, NC: Research Triangle Institute. [http://aspe.hhs.gov/daltcp/reports/bcdesces.htm]
Wilson, K.B. (1993). Developing a viable model of assisted living. In P. Katz, R.L. Kane, & M. Mazey (Eds.), Advances in long-term care. New York: Springer.
Sloane, P. & S.I. Zimmerman, personal communication. (1999). Drs. Sloane and Zimmerman and their colleagues are conducting a longitudinal study of residents in ALFs, nursing homes and traditional board and care homes in four states in a study funded by NIA and AHCPR.
APPENDIX A. COPY OF THE FACILITY SCREENING QUESTIONNAIRE48
FACILITY SCREENING QUESTIONNAIRE
**NOTE** The letter "B" brackets [B] in many of the variable names is a token that represents one of 7 possible letters that could be found in this position. The letters represent the section of the facility being asked about, and follows the lettering system defined in Question 1 (e.g., B=Assisted Living, C=Congregate Care, etc.) Not all letters in the list are represented since some units were ineligible for continued questions.
| SNGMULTA | 1. | Is this a facility that provides multiple levels of care, such as nursing home, assisted living, residential care, or independent living at the same location? 1 YES (GO TO MULTI1@01) 2 NO |
| 2. | Which of the following types or levels of care does your facility offer? | |
| YES=1 NO=2 YES/NO | ||
| MULTI101 | a) | licensed nursing home |
| MULTI102 | b) | assisted living |
| MULTI103 | c) | congregate apartments/congregate care |
| MULTI104 | d) | independent living/independent apartments |
| MULTI105 | e) | board and care/personal care/residential care |
| MULTI106 | f) | continuing care retirement community or life care community |
| MULTI107 | g) | designated Alzheimer's Special Care Unit in a residential care or assisted living section of the facility |
| MULTI108 | h) | designated Alzheimer's Special Care Unit in a licensed nursing home |
| MULTI109 | i) | rehabilitation hospital/subacute care unit |
| MULTI110 | j) | hospital |
| MULTI111 | k) | Other (SPECIFY) |
| FOR EACH OF THE ABOVE TYPES OF CARE THE FACILITY SAYS THEY OFFER (THAT WE ARE INTERESTED IN) WE WILL ASK THE FOLLOWING: | ||
| MULTI2[B]A | 3. | How do you refer to this assisted living section? (Or congregate care, or independent living) |
| Q1U[B]A | 1. | Excluding any nursing home beds, do you have 11 or more beds in (the) NAME OF TYPE OF CARE SPECIFIED ABOVE (section)? 1 YES 2 NO (SKIP to end of interview) |
| Q3U[B]A | 3. | Excluding any nursing home residents, are at least half of the residents 65 years of age or older?Excluding any nursing home beds, do you have 11 or more beds in (the) NAME OF TYPE OF CARE SPECIFIED ABOVE (section)? 1 YES 2 NO (SKIP To END OF INTERVIEW) |
| Q4U[B]A | 4. | Do you refer to (the) (SECTION NAME FILL) (section) as an assisted living facility or do you advertise that you provide assisted living services in that section? This includes such things as having the phrase assisted living in the name of the facility or in any advertisements about what the (section/facility) provides.Excluding any nursing home beds, do you have 11 or more beds in (the) NAME OF TYPE OF CARE SPECIFIED ABOVE (section)? 1 YES 2 NO |
I am now going to ask about specific services the (SECTION NAME FILL) (section) may offer. Please tell me whether you regularly provide or arrange for their provision with an outside agency. By "arranging," we mean that you have a formal contract with the agency or that the facility takes responsibility for helping the resident arrange to receive the service. That would include identifying resident needs, contacting an agency or provider, and monitoring the performance of the service. "Regularly" means not on an ad hoc or for only one special resident.
| 5a. | Do you regularly provide or arrange.. | [Yes=1 No=2] | |
| IF THE RESPONDENT SAYS "YES" FOR A SERVICE, ASK: | |||
| 5b. | Do you provide this service with staff who work for the facility or do you arrange the service with an outside agency? | ||
| Services | YES(1)/NO(2) | PROVIDE(1)/ARRANGE(2)/BOTH(3) | |
| a. | housekeeping | Q5AU[B]H | Q5AU[B]H2 |
| b. | at least two meals per day | Q5AU[B]OM | Q5AU[B]OM2 |
| c. | three meals a day | Q5AU[B]EM | Q5AU[B]EM2 |
| d. | 24-hour direct care staff who can respond to resident's needs for assistance or monitoring | Q5AU[B]DC | Q5AU[B]DC2 |
| e. | medication reminders to residents | Q5AU[B]MR | Q5AU[B]MR2 |
| f. | central storage or assitance with self-administration of medications | Q5BU[B]ST | Q5BU[B]ST2 |
| g. | assistance with bathing | Q5BU[B]BT | Q5BU[B]BT2 |
| h. | assistance with dressing | Q5BU[B]DR | Q5BU[B]DR2 |
| i. | any care or monitoring by a licensed nurse (i.e., an RN or LPN/LVN) | Q5BU[B]MN | Q5BU[B]MN2 |
| j. | any therapy services (e.g., speech, physical, occupational therapy) | Q5BU[B]TH | Q5BU[B]TH2 |
| 6. | How long has (the) (FACILITY NAME FILL) (section) been in operation?IF LESS THAN 1 YEAR, CODE 00 FOR YEARS AND INDICATE NUMBER OF MONTHS. IF RANGE GIVEN, ACCEPT THE LOWEST ESTIMATE. | ||
| Q6U[B]YRS _____YEARS | Q6U[B]MNTS _____MONTHS | ||
| IF IN BUSINESS FOR LESS THAN 3 MONTHS, STOP AND GO TO "GOODBYE" | |||
| DECIU[B] | 6a. | Can you answer some more detailed questions about services and accommodations in (the) (SECTION NAME FILL) (section) or should I contact someone else? 1 I can answer 2 Contact someone else | |
INTRODUCTORY STATEMENT TO BE READ BEFORE Q9. FOR ONLY THOSE WHO ANSWER Q.7B.
In your response to the next questions, consider only those beds or units identified as part of (SECTION NAME FILL).
| Q9U[B]A | 9a. | How many beds are currently in operation or available for residents in the (SECTION NAME FILL) (section)? NOTE: SHOULD BE AT LEAST 11.__________ |
| Q9U[B]B | 9b. | How many residents are currently living in (the) (SECTION NAME FILL) section?__________ |
| Q11U[B]A | 11. | Do any of the resident bedrooms (including those in apartments) house more than 2 unrelated people? 1 YES 2 NO |
| Q12AU[B]A | 12a. | Now, I'd like to ask you about the type of accommodations you provide in (the) (SECTION NAME FILL) (section). By "apartment," we mean a bathroom, bedroom, living room, and kitchen or kitchen area. A studio apartment is also included. Are any apartments in (the) (SECTION NAME FILL) (section)? 1 YES 2 NO (SKIP to Q.13a) | ||||||||||||||||||||||||
| Q12BU[B]A | 12b. | What is the total number of apartments in your facility?__________ | ||||||||||||||||||||||||
| 12c. | Please tell me the number of your accommodations that are described by the following:
| |||||||||||||||||||||||||
| Q12DU[B]A | 12d. | Do all apartments have a full bath, by which we mean sink, toilet, and either a tub or shower? (SOME PEOPLE CALL SINK, TOILET AND A SHOWER A ¾ BATH. THAT COUNTS AS A FULL BATH HERE.) 1 YES 2 NO | ||||||||||||||||||||||||
| Q13AU[B]A | 13a. | Are any of the living units in (the) (SECTION NAME FILL) (section) only bedrooms (rather than apartments)? 1 YES 2 NO (SKIP to Q.14) | ||||||||||||||||||||||||||||||||||||
| Q12BU[B]A | 13b. | What is the total number of bedrooms (not counting those in apartments)?__________ | ||||||||||||||||||||||||||||||||||||
| 13c. | Please tell me the number of your accommodations that are described by the following: (Semi-private means shared by only two people.)
| |||||||||||||||||||||||||||||||||||||
| Q14U[B]A | 14. | We are also interested in learning if you have any "heavy care" residents, that is those who require significant help with certain activities of daily living or ADLs. This week, approximately what percentage of your residents receive hands-on help from staff with ANY of the following ADLs"
Percentage of residents: __________ |
| Q15U[B]A | 15. | We would also like to know if you are serving persons with moderate to severe cognitive impairment. This means that residents have short-term memory problems or poor ability to make decisions about their daily lives.This week, approximately what percentage of your residents are cognitively impaired?Percentage of residents: __________ |
| Q16AU[B]A | 16a. | Do you have a Registered Nurse (RN) on staff who works at least 40 hours per week? This includes contract staff. 1 YES (SKIP to Q.17) 2 NO |
| Q16BU[B]A | 16.b | Do you have an RN on staff who works less than 40 hours per week? 1 YES 2 NO |
| Q17U[B]A | 17. | Do you have a Licensed Practical or Vocational Nurse on staff who works 40 or fewer hours per week? This includes contract staff. 1 YES 2 NO |
Some facilities have policies about the level of disability they can serve. The next questions are about whether you would admit residents with certain problems and whether you would retain residents who develop these conditions.
FOR EACH CONDITION, READ BOTH QUESTIONS
| 18a. | Will you admit a resident that: | ||
| 18b. | Will you retain a resident that: | ||
| 1-YES 2-NO 3-DEPENDS | |||
| CONDITION | 18a. ADMITYES/NO/DEPENDS | 18b. RETAINYES/NO/DEPENDS | |
| a. | Has a behavior problem (e.g., wandering' socially inappropriate behavior) | Q18AU[B]1A | Q18AU[B]1B |
| b. | Has urinary incontinence | Q18AU[B]2A | Q18AU[B]2B |
| c. | Needs nursing care or monitoring by an RN or LPN | Q18AU[B]3A | Q18AU[B]3B |
| d. | Uses a wheelchair to get around | Q18AU[B]4A | Q18AU[B]4B |
| e. | Receives help getting around the facility (walking or using a wheelchair) | Q18BU[B]5A | Q18BU[B]5B |
| f. | Receives help transferring from bed to chair or wheelchair | Q18BU[B]6A | Q18BU[B]6B |
| g. | Has moderate to severe cognitive impairment | Q18BU[B]7A | Q18BU[B]7B |
| Q19U[B]A | 19. | Will you retain a resident who requires temporary nursing care, for example for a condition like flu that is expected to last less than 14 days?1-YES 2-NO 3-DEPENDS |
| Q20U[B]A | 20. | Will you retain a resident who needs longer term nursing care (e.g., for more than 14 day)?1-YES 2-NO 3-DEPENDS |
APPENDIX B. DETAILED TABLES DESCRIBING A NATIONAL PROBABILITY SAMPLE OF FACILITIES AND THEIR CHARACTERISTICS
| TABLE B1. General Characteristics of Facilities1 | |||
| Facility Characteristic | Response | 95% CI (+/-) | |
| GENERAL CHARACTERISTICS: | |||
| Total estimated number of eligible facilities2 | 11,459 | +/- 1271 | |
| Total estimated number of beds | 611,300 | +/- 60,100 | |
| Total estimated number of residents | 521,500 | +/- 52,500 | |
| Total estimated occupancy rate nationwide | 84.3% | +/- 2 | |
| Percent of eligible facilities on multi-level campuses | 45.5% | +/- 5.2 | |
| Percent that are self-described assisted living facility | 71.5% | +/- 3.4 | |
| Average length of time in business | 15.0 years | +/- 2.2 | |
| Average bed size | 53.3 beds | +/- 4.5 | |
| Average number of residents | 45.5 res. | +/- 4.1 | |
| RATES | |||
| For facilities with single rate, average monthly rate: | $1710 | +/- $164 | |
| Highest reported monthly rate in the facility sample | $6440 | n/a | |
| For facilities with multiple rates: | |||
| Average lowest monthly rate | $1338 | +/- $65 | |
| Average highest monthly rate | $2137 | +/- $94 | |
| Average most common monthly rate | $1582 | +/- $69 | |
| Highest reported rate in the facility sample | $7130 | n/a | |
| ACCOMMODATION TYPE | |||
| Proportion of units that are apartments | 43.2% | n/a | |
| Proportion of units that are bedrooms | 56.8% | n/a | |
| |||
| TABLE B2. Facility Characteristics--Privacy and Services | ||
| Facility Characteristic | Response | 95% CI (+/-) |
| LEVEL OF PRIVACY | ||
| Percent of facilities that are high privacy (>80% of accommodations are private) | 31.3% | +/- 4.0 |
| Percent of facilities that are low privacy >21% of accommodations are semi-private) | 40.3% | +/- 3.7 |
| Percent of facilities with minimal privacy (>1 bedroom shared by 3 or more persons) | 28.4% | +/- 3.7 |
| Percent of facilities with 100% private accommodations | 26.7% | +/- 3.6 |
| Percent of facilities with 50% private accommodations | 51.8% | +/- 4.5 |
| LEVEL OF SERVICES | ||
| Percent of facilities that provide high services (RN on staff at least 40 hours per week and provides nursing care with own staff) | 30.6% | +/- 3.8 |
| Percent of facilities with low services | 65.0% | +/- 3.9 |
| Percent of facilities with minimal services (does not offer assistance with>2 ADLS or >1 ADL and medications) | 4.3% | +/- 1.2 |
| Percent of facilities that provide or arrange nursing care and will retain resident who needs nursing care | 29.3% | +/- 3.6 |
| FACILITY TYPE | ||
| Percent of facilities with high services and high privacy | 10.9% | +/- 2.2 |
| Percent of facilities with high services and low privacy | 11.6% | +/- 2.0 |
| Percent of facilities with low services and high privacy | 18.4% | +/- 3.0 |
| Percent of facilities with low services and low privacy | 26.9% | +/- 3.7 |
| Percent of facilities with minimal services (does not offer help with medications and >1 ADL or help with > ADLs) or minimal privacy (> bedroom shared by 3 or more residents) | 32.2% | +/- 3.6 |
| TABLE B3. Facility Retention and Admission Policies | |||
| Facility Characteristic | Percent | 95% CI (+/-) | |
| PERCENT OF FACILITIES THAT WILL RETAIN... | |||
| a. | Resident with behavior symptoms (e.g., wanders, socially inappropriate behavior) | 24.0% | +/- 2.5 |
| b. | Resident with urinary incontinence | 63.2% | +/- 4.9 |
| c. | Resident who needs nursing care | 32.3% | +/- 3.8 |
| d. | Resident who uses wheelchair | 69.2% | +/- 3.7 |
| e. | Resident receives help with locomotion | 61.8% | +/- 4.2 |
| f. | Resident receives help with transferring | 45.7% | +/- 4.0 |
| g. | Resident has moderate to severe cognitive impairment | 45.0% | +/- 3.8 |
| h. | Resident who requires temporary nursing care | 81.9% | +/- 2.7 |
| i. | Resident who needs nursing care for >14 days | 28.0% | +/- 2.7 |
| Discharges: Percent of facilities that have discharged one or more residents in last 6 months because resident needed nursing care | 71.7% | +/- 3.4 | |
| PERCENT OF FACILITIES THAT WILL ADMIT... | |||
| a. | Resident with behavioral symptoms (e.g., wandering, socially inappropriate behavior) | 28.0% | +/- 3.2 |
| b. | Resident with urinary incontinence | 61.4% | +/- 5.0 |
| c. | Resident who needs nursing care | 31.5% | +/- 3.7 |
| d. | Resident who uses wheelchair | 70.7% | +/- 3.8 |
| e. | Resident receives help with locomotion | 61.9% | +/- 4.3 |
| f. | Resident receives help with transferring | 43.9% | +/- 4.4 |
| g. | Resident has moderate to severe cognitive impairment | 47.0% | +/- 3.9 |
| TABLE B4. Services Offered and Resident Characteristics | |||
| Facility Characteristic | Percent | 95% CI (+/-) | |
| PERCENT OF FACILITIES WITH SERVICES PROVIDED OR ARRANGED | |||
| A. | Housekeeping | 99.1% | +/- .7 |
| B. | At least two meals a day | 99.3% | +/- .5 |
| C. | Three meals a day | 98.3% | +/- .7 |
| D. | 24-hour staff | 98.8% | +/- .5 |
| E. | Medication reminders | 91.7% | +/- 1.8 |
| F. | Central medication storage or assistance with meds | 87.6% | +/- 2.3 |
| G. | Assistance with bathing | 97.3% | +/- .9 |
| H. | Assistance with dressing | 94.3% | +/- 1.5 |
| I. | Any care or monitoring by RN or LVN | 79.5% | +/- 3.0 |
| J. | Any therapy services | 73.8% | +/- 3.0 |
| NURSE STAFFING | |||
| Any licensed nurse on staff (RN/LPN) full or part time | 71.2% | +/- 4.5 | |
| Any RN on staff -- full or part time2 | 54.8% | +/- 4.9 | |
| RN on staff at least 40 hours per week | 39.8% | +/- 3.7 | |
| RN on staff less than 40 hours per week | 25.1% | +/- 6.1 | |
| LPN on staff full or part time | 52.9% | +/- 4.0 | |
| GENERAL RESIDENT CHARACTERISTICS | |||
| Percent of "heavy care" residents (receiving assistance w/>3 ADLs) | 23.6% | +/- 2.6 | |
| Percent of residents with moderate to severe cognitive impairment | 34.1% | +/- 2.5 | |
| TABLE B5. Comparison Among ALFs Based on Services and Privacy--General Characteristics | |||||
| Facility Characteristic | Min Priv. or Serv. | Low/ Low | Low Priv./ High Serv. | High Priv./ Low Serv. | High/ High |
| GENERAL CHARACTERISTICS: | |||||
| Total estimated number of eligible facilities | 3685(32%) | 3081(27%) | 1329(12%) | 2112(18%) | 1252(11%) |
| Total estimated number of beds | 201,900 (33%) | 139,400 (23%) | 88,400 (14%) | 104,200 (17%) | 77,400 (13%) |
| Average bed size | 54.8 | 45.3** | 66.5 | 49.4 | 61.8 |
| Total estimated number of residents | 174,300 | 114,800 | 76,900 | 87,400 | 68,100 |
| Average number of residents | 47.3 | 37.3** | 57.8 | 41.4 | 54.4 |
| Total estimated occupancy rate | 85% | 81%* | 86% | 84% | 87% |
| % of facilities found on multi-level campuses | 33.8%** | 34.8%** | 66.5%** | 51.8% | 73.9%** |
| % of facilities that are free-standing or on a single-level campus | 66.3%** | 65.2%** | 33.5%** | 48.2% | 26.1%** |
| % of facilities that are self-described ALFs | 69.4% | 70.3% | 65.4% | 79.5%* | 73.6% |
| Average length of time in business | 17.0 yrs. | 14.1 yrs. | 16.6 yrs. | 10.8 yrs.** | 16.7 yrs. |
| RATES | |||||
| For facilities with single rate, average monthly rate: | $1396** | $1655 | $2091 | $1869 | $2003 |
| For facilities with multiple rates: | |||||
| Average lowest monthly rate | $1151** | $1261** | $1543 | $1506 | $1607** |
| Average highest monthly rate | $1960** | $1986** | $2429 | $2218 | $2605** |
| Average most common monthly rate | $1373** | $1458** | $1839 | $1771 | $1940** |
| * Significant at P.01 compared to overall mean** Significant at P.001 compared to overall mean | |||||
| TABLE B6. Comparison Among ALFs Based on Services and Privacy | |||||
| Facility Characteristic | Min Priv. or Serv. | Low/ Low | Low Priv./ High Serv. | High Priv./ Low Serv. | High/ High |
| LEVEL OF PRIVACY | |||||
| % of facilities with 100% private accommodations | 12.8%** | 0%** | 0%** | 76.8%** | 74.5%** |
| % of facilities with 50% private accommodations | 70.2%** | 78.1%** | 74.2%** | 0%** | 0%** |
| LEVEL OF SERVICES | |||||
| % of facilities that have full-time RN on staff, provide OR arrange nursing care, and will retain resident who needs nursing care | 17.4% | 4.7%** | 53.0%** | 1.4%** | 40.5%** |
| % of facilities that provide or arrange nursing care and will retain resident who needs nursing care | 27.1% | 24.5%* | 53.0%** | 18.7%** | 40.5%* |
| * Significant at P.01 compared to overall mean** Significant at P.001 compared to overall mean | |||||
| TABLE B7. Comparison Among ALFs Based on Services and Policy--Retention and Admission Policies | ||||||
| Facility Characteristic | Min Priv. or Serv. | Low/ Low | Low Priv./ High Serv. | High Priv./ Low Serv. | High/ High | |
| PERCENT OF FACILTIES THAT WILL RETAIN... | ||||||
| a. | Resident with behavior symptoms (e.g., wanders, socially inappropriate behavior) | 28% | 25% | 37% | 11%** | 17% |
| b. | Resident with urinary incontinence | 66% | 64% | 74% | 51%* | 60% |
| c. | Resident who needs nursing care | 32%* | 28%* | 54%** | 21%* | 41% |
| d. | Resident who uses wheelchair | 60%** | 68% | 79% | 75% | 77% |
| e. | Resident receives help with locomotion | 61% | 63% | 70% | 55% | 62% |
| f. | Resident receives help with transferring | 45% | 46% | 57%** | 40%* | 48% |
| g. | Resident has moderate to severe cognitive impairment | 50% | 45% | 50% | 35%** | 44% |
| h. | Resident who requires temporary nursing care | 80% | 84% | 87% | 77% | 85% |
| i. | Resident who needs nursing care for >14 days | 30% | 28% | 42%* | 18%* | 28% |
| Discharges: Percent of facilities that have discharged >1 residents in last 6 mo. because of need for nursing care | 70% | 67% | 69% | 79% | 79% | |
| PERCENT OF FACILITIES THAT WILL ADMIT... | ||||||
| a. | Resident with behavior symptoms (e.g., wanders, socially inappropriate behavior) | 36%* | 26% | 42% | 14%** | 20% |
| b. | Resident with urinary incontinence | 66% | 62% | 73% | 47% | 57% |
| c. | Resident who needs nursing care | 30% | 27%* | 50%** | 22%** | 44% |
| d. | Resident who uses wheelchair | 64%** | 70% | 78% | 75% | 79% |
| e. | Resident receives help with locomotion | 63% | 62% | 69% | 56% | 60% |
| f. | Resident receives help with transferring | 44% | 42% | 55%* | 37%* | 46% |
| g. | Resident has moderate to severe cognitive impairment | 52% | 45% | 52% | 39%* | 45% |
| * Significant at P.01 compared to overall mean** Significant at P.001 compared to overall mean | ||||||
| TABLE B8. Comparison Among ALFs Based on Services and Privacy--Services Offered and Resident Characteristics | |||||
| Facility Characteristic | Min Priv. or Serv. | Low/ Low | Low Priv./ High Serv. | High Priv./ Low Serv. | High/ High |
| NURSE STAFFING | |||||
| Any licensed nurse on staff (RN/LPN) full or part time | 67%** | 56%** | 100%** | 65%** | 100%** |
| Any RN on staff -- full or part time | 52%** | 33%** | 100%** | 34%** | 100%** |
| RN on staff at least 40 hours per week | 36%** | 13%** | 100%** | 12%** | 100%** |
| RN on staff less than 40 hours per week | 26% | 24% | 0% | 26% | 0% |
| LPN on staff full or part time | 49%** | 40%** | 77%** | 50% | 76%** |
| GENERAL RESIDENT CHARACTERISTICS | |||||
| Percentage of "heavy care" residents (receive assistance w/>3 ADLs) | 23% | 19%** | 35%** | 20%* | 31% |
| Percentage of residents with moderate to severe cognitive impairment | 35% | 35% | 38% | 28%* | 35% |
| * Significant at P.01 compared to overall mean** Significant at P.001 compared to overall mean | |||||
| TABLE B9. Comparison Between Single-Level and Multi-Level Facilities--General Characteristics | |||
| Facility Characteristic | All Facilities | Free- Standing | Multi- Level |
| GENERAL CHARACTERISTICS | |||
| Total estimated number of eligible facilities | 11,4591 | 6241(54.5%) | 5218(45.5%) |
| Total estimated number of beds | 611,300 | 270,400 (44%) | 340,900 (56%) |
| Total estimated number of residents | 521,500 | 224,400 | 297,100 |
| Total estimated occupancy rate nationwide | 84.3%1 | 82.7% | 86.1%* |
| % that are self-described ALFs | 71.5% | 67.7% | 76.1% |
| Average length of time in business | 15.0 yrs. | 15.7 yrs. | 14.2 yrs. |
| Average bed size | 53.3 beds | 43.3 beds | 65.3 beds** |
| Average number of residents | 45.5 res. | 36.0 res. | 56.9 res.** |
| RATES | |||
| For facilities with single rate, average monthly rate: | $1710 | $1502 | $1975** |
| For facilities with multiple rates: | |||
| Average lowest monthly rate | $1338 | $1221 | $1477** |
| Average highest monthly rate | $2137 | $1957 | $2348** |
| Average most common monthly rate | $1582 | $1451 | $1742** |
* Significant at P.01** Significant at P.001 | |||
| TABLE B10. Comparison Between Single-Level and Multi-Level Facilities--Privacy and Services | |||
| Facility Characteristic | All Facilities | Free- Standing | Multi- Level |
| LEVEL OF PRIVACY | |||
| % of facilities that are high privacy (>80% of accommodations are private)5 | 31.3% | 22.8% | 41.5%** |
| % of facilities that are low privacy (>21% of accommodations are semi-private) | 40.3% | 41.4% | 39.1% |
| % of facilities with minimal privacy (>1 bedroom shared by 3 persons) | 28.4% | 35.8% | 19.5%** |
| Percent of facilities with 100% private accommodations | 26.7% | 19.8% | 35.0%** |
| Percent of facilities with 50% private accommodations | 51.8% | 63.2% | 38.2%** |
| LEVEL OF SERVICES | |||
| % of facilities that provide high services (RN on staff at least 40 hours per week and provides nursing care with own staff) | 30.6% | 19.9% | 43.5%** |
| % of facilities with low services | 65.0% | 76.4% | 51.4%** |
| % of facilities with minimal services (does not offer assistance with >2 ADLs or >1 ADL and medications) | 4.3% | 3.7% | 5.2% |
| FACILITY TYPE | |||
| Percent with high services and high privacy | 10.9% | 5.2% | 17.7%** |
| Percent with high services and low privacy | 11.6% | 7.1% | 16.9%** |
| Percent with low services and high privacy | 18.4% | 16.3% | 21.0% |
| Percent with low services and low privacy | 26.9% | 32.2% | 20.5%** |
| Percent with minimal service or minimal privacy | 32.2% | 29.1% | 23.8%** |
| * Significant at P.01** Significant at P.001 | |||
| TABLE B11. Comparison Between Single-Level and Multi-Level Facilities--Retention and Admission Policies | ||||
| Facility Characteristic | All Facilities | Free- Standing | Multi- Level | |
| PERCENT OF FACILITIES THAT WILL RETAIN... | ||||
| a. | Resident with behavior symptoms (e.g., wanders, socially inappropriate behavior) | 24.0% | 22.9% | 25.4% |
| b. | Resident with urinary incontinence | 63.2% | 64.1% | 62.0% |
| c. | Resident who needs nursing care | 32.3% | 26.1% | 39.7%** |
| d. | Resident who uses wheelchair | 69.2% | 62.7% | 77.0%** |
| e. | Resident receives help with locomotion | 61.8% | 57.8% | 66.5% |
| f. | Resident receives help with transferring | 45.7% | 43.8% | 48.0% |
| g. | Resident has moderate to severe cognitive impairment | 45.0% | 47.6% | 41.8% |
| h. | Resident who requires temporary nursing care | 81.9% | 80.5% | 83.7% |
| i. | Resident who needs nursing care for >14 days | 28.0% | 27.7% | 28.4% |
| Discharges: Percent of facilities that have discharged one or more residents in last 6 months because of need for nursing care | 71.7% | 65.7% | 78.8%** | |
| PERCENT OF FACILITIES THAT WILL ADMIT... | ||||
| a. | Resident with behavior symptoms (e.g., wanders, socially inappropriate behavior) | 28.0% | 27.6% | 28.5% |
| b. | Resident with urinary incontinence | 61.4% | 61.2% | 61.5% |
| c. | Resident who needs nursing care | 31.5% | 25.7% | 38.6%** |
| d. | Resident who uses wheelchair | 70.7% | 63.9% | 78.8%** |
| e. | Resident receives help with locomotion | 61.9% | 58.6% | 65.7% |
| f. | Resident receives help with transferring | 43.9% | 42.3% | 45.8% |
| g. | Resident has moderate to severe cognitive impairment | 47.0% | 49.5% | 43.9% |
| * Significant at P.01** Significant at P.001 | ||||
| TABLE B12. Comparison Between Single-Level and Multi-Level Facilities--Services Offered and Resident Characteristics | ||||
| Facility Characteristic | All Facilities | Free- Standing | Multi- Level | |
| PERCENT OF FACILITIES WITH SERVICES PROVIDED OR ARRANGED | ||||
| A. | Housing | 99.1% | 98.8% | 99.5% |
| B. | At least two meals a day | 99.3% | 99.3% | 99.3% |
| C. | Three meals a day | 98.3% | 99.1% | 97.4%* |
| D. | 24-hour staff | 98.8% | 98.7% | 98.8% |
| E. | Medication reminders | 91.7% | 91.5% | 91.9% |
| F. | Central medication storage or assistance with meds | 87.6% | 88.5% | 86.5% |
| G. | Assistance with bathing | 97.3% | 98.1% | 96.5% |
| H. | Assistance with dressing | 94.3% | 95.4% | 93.0% |
| I. | Any care or monitoring by RN or LVN | 79.5% | 72.9% | 87.5% |
| J. | Any therapy services | 73.8% | 66.2% | 82.9% |
| NURSE STAFFING | ||||
| Any licensed nurse on staff (RN/LPN) full or part time | 71.2% | 59.7% | 84.9%** | |
| Any RN on staff -- full or part time | 54.8% | 44.7% | 66.8%** | |
| RN on staff at least 40 hours per week | 39.8% | 28.7% | 53.2%** | |
| RN on staff less than 40 hours per week | 25.1% | 22.5% | 29.7% | |
| LPN on staff full or part time | 52.9% | 40.3% | 68.0%** | |
| GENERAL RESIDENT CHARACTERISTICS | ||||
| Average percent of "heavy care" residents (receive assistance w/>3 ADLs) | 23.6% | 21.5% | 26.2% | |
| Average percent of residents with moderate to severe cognitive impairment | 34.1% | 36.1% | 31.7% | |
| * Significant at P.01** Significant at P.001 | ||||
| TABLE B13. Comparison Between Self-Described ALFs and Other Eligible Facilities--General Characteristics | |||
| Facility Characteristic | All Facilities | Self- Described | Other |
| GENERAL CHARACTERISTICS: | |||
| Total estimated number of eligible facilities | 11,459 | 8195(71.5%) | 3264(28.5%) |
| Total estimated number of beds | 611,300 | 427,500 | 183,800 |
| Total estimated number of residents | 521,500 | 357,100 | 164,400 |
| Total estimated occupancy rate nationwide | 84.3% | 83.2% | 86.9%** |
| Percent of facilities on multi-level campus | 45.5% | 48.5% | 38.2% |
| Average length of time in business | 15.0 yrs. | 12.0 yrs. | 22.5 yrs.** |
| Average bed size | 53.3 beds | 52.2 beds | 56.3 beds |
| Average number of residents | 45.5 res. | 43.6 res. | 50.4 res. |
| RATES | |||
| For facilities with single rate, average monthly rate: | $1710 | $1751 | $1651 |
| For facilities with multiple rates: | |||
| Average lowest monthly rate | $1338 | $1373 | $1234 |
| Average highest monthly rate | $2137 | $2194 | $1968* |
| Average most common monthly rate | $1582 | $1624 | $1454* |
| * Significant at P.01** Significant at P.001 | |||
| TABLE B14. Comparison Between Self-Described ALFs and Other Eligible Facilities--Privacy and Services | |||
| Facility Characteristic | All Units | Self- Described | Other |
| LEVEL OF PRIVACY | |||
| Percent of facilities that are high privacy (>80% of accommodations are private) | 31.3% | 34.4% | 23.4** |
| Percent of facilities that are low privacy >21% of accommodations are semi-private) | 40.3% | 39.6% | 42.3 |
| Percent of facilities with minimal privacy (>1 bedroom shared by 3 persons) | 28.4% | 26.0% | 34.4* |
| Percent of facilities with 100% private accommodations | 26.7% | 29.7% | 19.0%** |
| Percent of facilities with 50% private accommodations | 51.8% | 47.1% | 63.8%** |
| LEVEL OF SERVICES | |||
| Percent of facilities that provide high services (RN on staff at least 40 hours per week and provides nursing care with own staff) | 30.6% | 30.7% | 30.5% |
| Percent of facilities with low services | 65.0% | 63.4% | 69.2% |
| Percent of facilities with minimal services (does not offer assistance with>2 ADLS or >1 ADL and medications) | 4.3% | 6.0% | Excluded *** |
| FACILITY TYPE | |||
| Percent with high services and high privacy | 10.9% | 11.2% | 10.1% |
| Percent with high services and low privacy | 11.6% | 10.6% | 14.1% |
| Percent with low services and high privacy | 18.4% | 20.5% | 13.2%* |
| Percent with low services and low privacy | 26.9% | 26.4% | 28.0% |
| Percent with minimal services or minimal privacy | 32.2% | 31.2% | 34.5% |
| * Significant at P.01** Significant at P.001*** "Other" facilities, that is those that did not self-identify as ALFs, were required to provide these services to be eligible for the survey; thus, the statistically significant differences are a product of different eligibility rules. | |||
| TABLE B15. Comparison Between Self-Described ALFs and Other Eligible Facilities--Retention and Admission Policies | ||||
| Facility Characteristic | All Units | Self- Described | Other | |
| PERCENT OF FACILITIES THAT WILL RETAIN... | ||||
| a. | Resident with behavior symptoms (e.g., wanders, socially inappropriate behavior) | 24.0% | 22.9% | 26.9% |
| b. | Resident with urinary incontinence | 63.2% | 65.1% | 58.3% |
| c. | Resident who needs nursing care | 32.3% | 32.5% | 31.7% |
| d. | Resident who uses wheelchair | 69.2% | 72.7% | 60.5%* |
| e. | Resident receives help with locomotion | 61.8% | 66.0% | 51.3%** |
| f. | Resident receives help with transferring | 45.7% | 47.7% | 40.7% |
| g. | Resident has moderate to severe cognitive impairment | 45.0% | 44.2% | 46.9% |
| h. | Resident who requires temporary nursing care | 81.9% | 80.9% | 84.5% |
| i. | Resident who needs nursing care for >14 days | 28.0% | 26.4% | 32.1% |
| Discharges: Percent of facilities that have discharged one or more residents in last 6 mo. because of need for nursing care | 71.7% | 74.9% | 63.5%** | |
| PERCENT OF FACILITIES THAT WILL ADMIT... | ||||
| a. | Resident with behavior symptoms (e.g., wanders, socially inappropriate behavior) | 28.0% | 26.0% | 33.2% |
| b. | Resident with urinary incontinence | 61.4% | 64.0% | 54.7% |
| c. | Resident who needs nursing care | 31.5% | 31.9% | 30.6% |
| d. | Resident who uses wheelchair | 70.7% | 74.5% | 61.1%** |
| e. | Resident receives help with locomotion | 61.9% | 65.9% | 51.7%** |
| f. | Resident receives help with transferring | 43.9% | 46.3% | 37.9% |
| g. | Resident has moderate to severe cognitive impairment | 47.0% | 46.9% | 47.2% |
| * Significant at P.01** Significant at P.001 | ||||
| TABLE B16. Comparison Between Self-Described ALFs and Other Eligible Facilities--Services Offered and Resident Characteristics | ||||
| Facility Characteristic | AllUnits | Self-Described | Other | |
| PERCENT OF FACILITIES WITH SERVICES PROVIDED OR ARRANGED | ||||
| A. | Housekeeping | 99.1% | 98.8% | 100%*** |
| B. | At least two meals a day | 99.3% | 99.0% | 100%*** |
| C. | Three meals a day | 98.3% | 98.3% | 98.3% |
| D. | 24-hour staff | 98.8% | 98.3% | 100%*** |
| E. | Medication reminders | 91.7% | 92.8% | 89.0% |
| F. | Central medication storage or assistance with meds | 87.6% | 88.4% | 85.6% |
| G. | Assistance with bathing | 97.3% | 96.3% | 100%*** |
| H. | Assistance with dressing | 94.3% | 93.6% | 96.1% |
| I. | Any care or monitoring by RN or LVN | 79.5% | 78.3% | 82.7% |
| J. | Any therapy services | 73.8% | 73.5% | 74.6% |
| NURSE STAFFING | ||||
| Any licensed nurse on staff (RN/LPN) full or part time | 71.2% | 71.1% | 71.4% | |
| Any RN on staff -- full or part time | 54.8% | 54.6% | 55.1% | |
| RN on staff at least 40 hours per week | 39.8% | 40.4% | 38.3% | |
| RN on staff less than 40 hours per week | 25.1% | 24.1% | 27.5% | |
| LPN on staff full or part time | 52.9% | 51.6% | 56.0% | |
| GENERAL RESIDENT CHARACTERISTICS | ||||
| Percentage of "heavy care" residents (receive assistance w/>3 ADLs) | 23.6% | 24.5% | 21.4% | |
| Percentage of residents with moderate to severe cognitive impairment | 34.1% | 34.7% | 32.7% | |
| * Significant at P.01** Significant at P.001*** "Other" facilities, that is those that did not self-identify as ALFs, were required to provide these services to be eligible for the survey; thus, the statistically significant differences are a product of different eligibility. | ||||
| TABLE B17. Comparison Between High and Low Service Facilities--General Characteristics | |||
| Facility Characteristic | All | Low Service | High Service |
| GENERAL CHARACTERISTICS: | |||
| Total estimated number of eligible facilities | 11,4591,2 | 7,450(65.0%)2 | 3,511(30.6%)2** |
| Total estimated number of beds | 611,300 | 344,3002 | 226,002 |
| Total estimated number of residents | 521,500 | 288,1002 | 197,5002 |
| Total estimated occupancy rate nationwide | 84.3% | 83.2% | 86.2% |
| % that are self-described ALFs | 71.5% | 69.7% | 71.6% |
| % that are part of multi-level campus | 45.5% | 36.0% | 64.6%** |
| Average length of time in business | 15.0 yrs. | 14.1 yrs. | 17.4 yrs. |
| Average bed size | 53.3 beds | 46.2 beds | 64.4 beds** |
| Average number of residents | 45.5 res. | 38.7 res. | 56.2 res.** |
| RATES | |||
| For facilities with single rate, average monthly rate: | $1710 | $1596 | $2033* |
| For facilities with multiple rates: | |||
| Average lowest monthly rate | $1338 | $1268 | $1524** |
| Average highest monthly rate | $2137 | $1989 | $2489** |
| Average most common monthly rate | $1582 | $1481 | $1838** |
* Significant at P.01** Significant at P.001 | |||
| TABLE B18. Comparison Between High and Low Service Facilities--Privacy and Services | |||
| Facility Characteristic | All Facilities | Low Service | High Service |
| LEVEL OF PRIVACY | |||
| % of facilities that are high privacy (>80% of accommodations are private)5 | 31.3% | 28.3% | 35.7% |
| % of facilities that are low privacy >21% of accommodations are semi-private) | 40.3% | 41.4% | 37.9% |
| % of facilities with minimal privacy (>1 bedroom shared by 3 persons) | 28.4% | 30.3% | 26.5% |
| Percent of facilities with 100% private accommodations | 26.7% | 24.8% | 30.7% |
| Percent of facilities with 50% private accommodations | 51.8% | 55.9% | 44.2%** |
| * Significant at P.01** Significant at P.001 | |||
| TABLE B19. Comparison Between High and Low Service Facilities--Retention and Admission Policies | ||||
| Facility Characteristic | All Facilities | Low Service | High Service | |
| PERCENT OF FACILITIES THAT WILL RETAIN... | ||||
| a. | Resident with behavior symptoms (e.g., wanders, socially inappropriate behavior) | 24.0% | 21.6% | 29.6%* |
| b. | Resident with urinary incontinence | 63.2% | 61.2% | 69.6% |
| c. | Resident who needs nursing care | 32.3% | 24.5% | 49.7%** |
| d. | Resident who uses wheelchair | 69.2% | 66.5% | 75.8%* |
| e. | Resident receives help with locomotion | 61.8% | 59.7% | 68.4%* |
| f. | Resident receives help with transferring | 45.7% | 42.4% | 55.7%** |
| g. | Resident has moderate to severe cognitive impairment | 45.0% | 42.7% | 52.2%* |
| h. | Resident who requires temporary nursing care | 81.9% | 81.2% | 84.7% |
| i. | Resident who needs nursing care for >14 days | 28.0% | 24.0% | 37.0%** |
| Discharges: Percent of facilities that have discharged one or more residents in last 6 months because of need for nursing care | 71.7% | 71.1% | 72.9% | |
| PERCENT OF FACILITIES THAT WILL ADMIT... | ||||
| a. | Resident with behavior symptoms (e.g., wanders, socially inappropriate behavior) | 28.0% | 24.5% | 36.7%** |
| b. | Resident with urinary incontinence | 61.4% | 59.2% | 69.1%* |
| c. | Resident who needs nursing care | 31.5% | 23.7% | 48.9%** |
| d. | Resident who uses wheelchair | 70.7% | 68.2% | 76.9% |
| e. | Resident receives help with locomotion | 61.9% | 59.8% | 68.7%* |
| f. | Resident receives help with transferring | 43.9% | 40.2% | 54.1%** |
| g. | Resident has moderate to severe cognitive impairment | 47.0% | 45.0% | 53.7% |
| * Significant at P.01** Significant at P.001 | ||||
| TABLE B20. Comparison Between High and Low Service Facilities--Services Offered and Resident Characteristics | ||||
| Facility Characteristic | All Facilities | Low Service | High Service | |
| PERCENT OF FACILITIES WITH SERVICES PROVIDED OR ARRANGED | ||||
| A. | Housekeeping | 99.1% | 100% | 100% |
| B. | At least two meals a day | 99.3% | 100% | 100% |
| C. | Three meals a day | 98.3% | 99.1% | 99.2% |
| D. | 24-hour staff | 98.8% | 100% | 100% |
| E. | Medication reminders | 91.7% | 92.1% | 95.3% |
| F. | Central medication storage or assistance with meds | 87.6% | 89.7% | 88.5% |
| G. | Assistance with bathing | 97.3% | 99.9% | 100% |
| H. | Assistance with dressing | 94.3% | 96.6% | 98.4% |
| I. | Any care or monitoring by RN or LVN | 79.5% | 72.3% | 100%** |
| J. | Any therapy services | 73.8% | 68.7% | 89.4%** |
| NURSE STAFFING | ||||
| Any licensed nurse on staff (RN/LPN) full or part time | 71.2% | 59.3% | 100%** | |
| Any RN on staff -- full or part time | 54.8% | 34.6% | 100%** | |
| RN on staff at least 40 hours per week | 39.8% | 12.3% | 100%** | |
| RN on staff less than 40 hours per week | 25.1% | 25.5% | 0%** | |
| LPN on staff full or part time | 52.9% | 42.9% | 77.3%** | |
| GENERAL RESIDENT CHARACTERISTICS | ||||
| Average percent of "heavy care" residents (receive assistance w/>3 ADLs) | 23.6% | 19.7% | 34.1%** | |
| Average percent of residents with moderate to severe cognitive impairment | 34.1% | 33.3% | 37.7% | |
| * Significant at P.01** Significant at P.001 | ||||
| TABLE B21. Comparison Between High and Low Privacy Facilities--General Characteristics | |||
| Facility Characteristic | All | Low Privacy | High Privacy |
| GENERAL CHARACTERISTICS: | |||
| Total estimated number of eligible facilities | 11,4591,2 | 4622(40.3%)2 | 3585 (31.3%)2** |
| Total estimated number of beds | 611,300 | 241,200 | 201,600 |
| Total estimated number of residents | 521,500 | 202,700 | 173,900 |
| Total estimated occupancy rate nationwide | 84.3% | 82.4% | 85.6%* |
| % that are self-described ALFs | 71.5% | 70.2% | 78.7%* |
| % that are part of multi-level campus | 45.5% | 44.1% | 60.3%** |
| Average length of time in business | 15.0 yrs. | 14.7 yrs. | 13.0 yrs. |
| Average bed size | 53.3 beds | 52.2 beds | 56.2 beds |
| Average number of residents | 45.5 res. | 43.9 res. | 48.5 res. |
| RATES | |||
| For facilities with single rate, average monthly rate: | $1710 | $1762 | $1872 |
| For facilities with multiple rates: | |||
| Average lowest monthly rate | $1338 | $1332 | $1512** |
| Average highest monthly rate | $2137 | $2115 | $2317** |
| Average most common monthly rate | $1582 | $1561 | $1791** |
* Significant at P.01** Significant at P.001 | |||
| TABLE B22. Comparison Between High and Low Privacy Facilities--Privacy and Services | |||
| Facility Characteristic | All Units | Low Privacy | High Privacy |
| LEVEL OF PRIVACY | |||
| Percent of facilities with 100% private accommodations | 26.7% | 0% | 74.6%** |
| Percent of facilities with 50% private accommodations | 51.8% | 77.3% | 0%** |
| LEVEL OF SERVICES | |||
| Percent of facilities that provide high services (RN on staff at least 40 hours per week and provides nursing care with own staff) | 30.6% | 28.8% | 34.9% |
| Percent of facilities with low services | 65.0% | 66.7% | 58.9% |
| Percent of facilities with minimal services (does not offer assistance with>2 ADLS or >1 ADL and medications) | 4.3% | 4.6% | 6.2% |
| ** Significant at P.001 | |||
| TABLE B23. Comparison Between High and Low Privacy Facilities--Retention and Admission Policies | ||||
| Facility Characteristic | All Facilities | Low Privacy | High Privacy | |
| PERCENT OF FACILITIES THAT WILL RETAIN... | ||||
| a. | Resident with behavior symptoms (e.g., wanders, socially inappropriate behavior) | 24.0% | 28.4% | 12.7%** |
| b. | Resident with urinary incontinence | 63.2% | 65.9% | 54.3%* |
| c. | Resident who needs nursing care | 32.3% | 35.3% | 28.6% |
| d. | Resident who uses wheelchair | 69.2% | 71.2% | 74.9% |
| e. | Resident receives help with locomotion | 61.8% | 64.4% | 56.7%* |
| f. | Resident receives help with transferring | 45.7% | 47.5% | 41.9% |
| g. | Resident has moderate to severe cognitive impairment | 45.0% | 45.6% | 37.1% |
| h. | Resident who requires temporary nursing care | 81.9% | 84.0% | 79.8% |
| i. | Resident who needs nursing care for >14 days | 28.0% | 31.5% | 21.9%* |
| Discharges: Percent of facilities that have discharged one or more residents in last 6 months because of need for nursing care | 71.7% | 67.7% | 78.5% | |
| PERCENT OF FACILITIES THAT WILL ADMIT... | ||||
| a. | Resident with behavior symptoms (e.g., wanders, socially inappropriate behavior) | 28.0% | 30.6% | 15.9%** |
| b. | Resident with urinary incontinence | 61.4% | 64.2% | 50.1%** |
| c. | Resident who needs nursing care | 31.5% | 33.0% | 30.7% |
| d. | Resident who uses wheelchair | 70.7% | 72.0% | 75.6% |
| e. | Resident receives help with locomotion | 61.9% | 62.7% | 56.6% |
| f. | Resident receives help with transferring | 43.9% | 45.4% | 39.8% |
| g. | Resident has moderate to severe cognitive impairment | 47.0% | 46.7% | 39.7% |
| * Significant at P.01** Significant at P.001 | ||||
| TABLE B24. Comparison Between High and Low Privacy Facilities--Services Offered and Resident Characteristics | ||||
| Facility Characteristic | All Facilities | Low Privacy | High Privacy | |
| PERCENT OF FACILITIES WITH SERVICES PROVIDED OR ARRANGED | ||||
| A. | Housekeeping | 99.1% | 99.1% | 98.8% |
| B. | At least two meals a day | 99.3% | 99.6% | 98.5% |
| C. | Three meals a day | 98.3% | 98.6% | 96.9% |
| D. | 24-hour staff | 98.8% | 98.3% | 98.5% |
| E. | Medication reminders | 91.7% | 92.2% | 90.0% |
| F. | Central medication storage or assistance with meds | 87.6% | 90.0% | 82.2%* |
| G. | Assistance with bathing | 97.3% | 97.6% | 95.7% |
| H. | Assistance with dressing | 94.3% | 94.6% | 90.1% |
| I. | Any care or monitoring by RN or LVN | 79.5% | 79.5% | 78.4% |
| J. | Any therapy services | 73.8% | 77.3% | 70.4% |
| NURSE STAFFING | ||||
| Any licensed nurse on staff (RN/LPN) full or part time | 71.2% | 68.0% | 76.7% | |
| Any RN on staff -- full or part time | 54.8% | 53.0% | 57.7% | |
| RN on staff at least 40 hours per week | 39.8% | 38.8% | 43.8% | |
| RN on staff less than 40 hours per week | 25.1% | 23.4% | 25.0% | |
| LPN on staff full or part time | 52.9% | 49.7% | 58.1% | |
| GENERAL RESIDENT CHARACTERISTICS | ||||
| Average percent of "heavy care" residents (receive assistance w/>3 ADLs) | 23.6% | 23.1% | 22.9% | |
| Average percent of residents with moderate to severe cognitive impairment | 34.1% | 35.2% | 20.0% | |
| * Significant at P.01** Significant at P.001 | ||||
NOTES
-
A previous study funded by DHHS/DALTCP focused on licensed and unlicensed board and care homes. Two-thirds of those facilities had 10 or fewer beds, and the study found that none of the small homes called themselves assisted living. Few provided assistance with more than two activities of daily living (ADLs). As a result, we concluded that the vast majority of these small facilities would not provide the services generally considered a fundamental part of assisted living. Further, the small homes tended to serve a younger population of residents and a population that was more likely to have mental retardation, developmental disabilities, or persistent and serious mental illness. In addition, no states that licensed a specific category known as "assisted living" reported any facilities with fewer than 11 beds. For all of these reasons, ASPE and the project staff decided to exclude small homes from this study of assisted living for the frail elderly.
-
These results are based on the most detailed information administrators provided about the accommodations (i.e., when they provided an exact count of the number of apartments and rooms). In another item on the survey, they were asked to estimate the distribution between rooms and apartments. The responses to this other item indicated that administrators estimated that 48% of the units were apartments and 52% were rooms.
-
Many facilities had idiosyncratic policies about admission and retention. That is, the administrators responded "it depends" when asked about whether the facility would admit or retain residents with a specified condition. For example, one-quarter (26%) of the administrators responded "it depends" when asked whether they would admit a resident with moderate to severe cognitive impairment. One-third (33%) reported that "it depends" when asked whether they would retain a resident with moderate to severe cognitive impairment. When the "it depends" response was given, it was counted as a "no" since residents and families could not rely on either admission or retention in such instances.
-
Numbers may not total 100% due to rounding.
-
The differences between facilities that had a full-time RN and provided nursing care with their own staff and those that did not have a full-time RN on staff but were willing to provide or arrange nursing care are discussed at greater length in Section 7 of this report.
-
U.S. Bureau of the Census, published data from the 1998 Current Population Survey, "Money Income in the United States, 1997" (series P60-200), Table 8, Income Distribution of Older Persons, 1997.
-
This is based on estimates of annual income. More people could afford assisted living for some period of time by selling their assets, such as a family home, and using those funds to pay the monthly charges for assisted living.
-
In some states, there are multiple names and multiple licensing agencies for different types of board and care homes.
-
Senior housing includes assisted living facilities, continuing care retirement communties, congregate apartments, senior/retirement apartments.
-
Some analysts and lenders became less enthusiastic in the later part of the 1990s, noting oversaturation of some markets, both in some geographic areas and, more particularly, at the "high price" end of the market. In addition, some observers began to note that facilities might have difficulty meeting the needs of a resident population with significant health care needs and still maintaining the high profitability level Wall Street had come to expect. The result more recently has been a significant decline in lender and some investor ardor for assisted living.
-
These include studies conducted by the U.S. General Accounting Office and studies funded through grants and contracts from the National Institute on Aging, the Agency for Health Care Policy and Research, the Alzheimer's Association, the Robert Wood Johnson Foundation, and the Hartford Foundation.
-
Subcontractors include Lewin, Inc. (Barbara Manard), the University of Minnesota Long-Term Care Resource Center (Rosalie Kane), and the National Academy for State Health Policy (Robert Mollica).
-
Summaries of prior reports can be found on the Homepage for the U.S. Department of Health and Human Services in the section for ASPE's Office of Disability, Aging and Long-Term Care Policy. Full copies of the reports can also be order at this site. The Internet address and mail addresses for viewing or ordering these reports are shown on the inside of the front cover of this report.
-
These reports will be issued in 2000.
-
At the end of the project, a sample design report will be submitted that covers all aspects of the study, including the telephone survey and additional data collection and analysis.
-
The third stage involved selection of the resident and staff samples for in-person interviews.
-
Nearly half the states lacked a licensure category known as "assisted living" or classified such facilities together with traditional "board and care" homes during the period in which we attempted to enumerate a list of assisted living facilities (Mollica and Snow, 1996).
-
The second reason for first selecting a limited number of geographic areas as FSUs was that it facilitated cost-effective data collection on site in sample facilities, a subsequent data collection task.
-
For example, the California Association of Homes and Services for the Aging posted a state-wide list of places offering housing with supportive services.
-
Some sources, such as most state licensure lists, identified the county, while other lists (e.g., telephone book yellow pages) did not.
-
For example, Menorah Park Center for Senior Living had two different residential settings (i.e., Stone Gardens Assisted Living and The R.H. Myers Congregate Apartments) that met study eligibility criteria, although only one self-identified as an assisted living facility. Both were on the same campus.
-
Facility candidates with unknown size were undersampled to improve the cost effectiveness of the telephone screening. The fact that they appeared, for the most part, on only one list, suggested that they were small and less likely to meet study eligibility criteria. And indeed, only 8 percent of the places with unknown size were found to be eligible during the telephone screening and survey. Again, weighting the final sample adjusted for this undersampling and generated valid estimates about the universe of assisted living facilities.
-
A total of 48% of the listings were ineligible. This includes the ineligible facilities that project staff were able to contact (41.3%) and interview as well as listings (6.2%) that they were unable to contact (i.e., with no obtainable telephone number or no response to >10 telephone calls). We assumed that an eligible ALF would have a listed telephone number and have someone on duty 24 hours per day who would thus answer one of more than ten telephone calls. Therefore, we assumed that places that could not be contacted were either out of business or not an otherwise eligible facility.
-
It should be noted that five percent of the places that identified themselves as an "assisted living facility" did not meet the service eligibility criteria that were imposed on other facilities on the list. However, because the project sought to describe the facilities that represent themselves as part of the assisted living industry, they were included in the descriptive segment of the study and in this report. These facilities are discussed at greater length in Section 7.
-
Response rates for national surveys ranged from six to 33 percent (Hodlewsky, 1998; Gulyas, 1997; ALFA, 1998). Higher rates (i.e., 54%) were based on a replacement strategy for facilities that refused (NIC, 1998). These generally low response rates for these other studies, combined with issues related to their sampling strategies, make if difficult to rely on them for generalizable data on the assisted living industry.
-
More detailed Tables, showing confidence intervals or statistical significance for all estimates, appear in Appendix B.
-
Most other studies did not restrict their estimates to only those facilities that met a commonly accepted definition of assisted living. Thus, they may base their estimates on membership figures or listings in large retirement directories that include very small facilities and facilities that provide few services. Similarly, licensure lists often include facilities that do not meet the commonly accepted concept of assisted living. For example, some states adopted rules that simply reclassified all board and care homes as "assisted living" in their state licensure regulations (Mollica, 1998). As a result, such sources may include large numbers of facilities that do not meet the ASPE study definition of assisted living.
-
That is, they provide, at a minimum, 24-hour staff oversight, housekeeping, at least two meals a day, and help with at least two of the following: medications, bathing, dressing.
-
NH = Licensed nursing home. NH-SCU = Licensed nursing home that contained a designated Alzheimer's Special Care Unit. CCRC = Continuing Care Retirement Community. Ind. Living = Independent living apartments. Cong. Apt. = Congregate apartments. B&C = Board and care home (e.g., personal care, residential care, adult care home). Rehab. Facility = Inpatient rehabilitation facility.
-
Unfortunately we could not determine the actual prevalence of SCUs from these items. Thus, describing the prevalence and characteristics of ALFs offering specialized care for persons with dementia will be done in a subsequent report, based on more detailed interviews with administrators.
-
Privacy was defined as a bedroom (in a room or apartment unit) that is not shared with an unrelated individual. Thus, a "private" unit may house, for example, a married couple. Semi-private meant that the bedroom was shared by no more than two unrelated individuals.
-
The next report from ASPE will present the results of site visits to some 300 ALFs nationwide, including interviews with administrators, staff, and residents, as well as a structured observation of the facility by trained research staff.
-
The question was about whether the ALF bedroom, whether in a room or an apartment, was private or shared. Thus, a "quad" apartment in which residents had private bedrooms but shared a living room and kitchen would be counted here as a "private" accommodation.
-
Studio units were counted as apartment.
-
The study findings estimated somewhat greater rates of shared rooms than other studies have reported. For example, a 1997 survey of the assisted living industry conducted for ALFA found that 86.1% of the units in responding facilities were private, 13.2% were semi-private and less than one percent (0.7%) of the units had three or more residents (ALFA, 1998). However, the findings from these other studies are limited by not being drawn from a nationally representative sample of ALFs and by low response rates.
-
A studio apartment is defined as an apartment, while privacy was defined as occupancy by one individual, unless the occupants were related by blood or marriage. In practice, state policy allowed a few units to be shared, if the resident chose that option.
-
Administrators were asked to provide detailed information on the exact nature of the accommodations they offered, including the number of units in single rooms and the number in apartments (which included studio apartments). Then, within each of those categories, they were asked for the number of different types of units and bathrooms, as well as whether the units were private or shared. These detailed reports are the basis for the estimated distribution of units between rooms and apartments.
-
The question about apartments and privacy was asked in terms of whether the bedroom portion of the apartment was shared or private, since some facilities offer arrangements similar to "quads" in dormitories with private bedrooms and shared living rooms. Greater detail on the exact nature of residents' accommodations will be provided in a subsequent report based on in-person interviews with administrators, staff and residents in a sample of facilities.
-
We excluded the 5% of the apartments that were classified in the "other apartment type" category from all the privacy calculations.
-
In general, respondents were asked to answer "yes" or "no" to the question of whether they would admit or retain a resident with a given condition. In Exhibit 21 and in the data reported here, only the unequivocal "yes" responses were counted as indicating a policy to admit or retain a resident with the specified need or condition. Many facilities had idiosyncratic policies about admission and retention. That is, some administrators responded "it depends" when asked about whether the facility would admit or retain residents with a specific condition. For example, one quarter (26%) of the administrators responded "it depends" when asked whether they would admit a resident with moderate to severe cognitive impairment. One third (33%) reported that "it depends" when asked whether they would retain a resident with moderate to severe cognitive impairment. When the "it depends" response was given, it was counted as a "no" since residents and families could not rely on either admission or retention in such instances.
-
The item on admission and retention of residents with urinary incontinence may have been misunderstood by the respondents and interpreted as meaning residents who could manage their own incontinence supplies. A subsequent report that used more detailed questions may provide a more reliable indication of admission and retention policies with respect to residents with incontinence
-
Assisted living facilities that specialize in providing care to persons with Alzheimer's disease or other dementias or that have a specialized care unit (SCU) may be the exception. Six percent of the ALFs on multi-level campuses reported that a residential care SCU was part of the campus. In addition, some of the free-standing ALFs may have had wings that were SCUs or may have designated the whole facility as an Alzheimer's-specific facility. The prevalence and characteristics of these facilities will be explored in a subsequent report that provides data from more extensive interviews with the administrators.
-
Source of the data for characteristics of board and care home residents is Hawes et al., 1995a; for nursing home residents, it is Krauss and Altman, 1998. It is important to note that the data are not strictly comparable; therefore, they are merely suggestive of differences between settings in resident case mix. The data on board and care home residents are from interviews with the residents and direct staff caregivers in 512 facilities in 10 states (Hawes et al., 1995a). Moreover, they are not based on a nationally representative sample of residents. Instead, they were drawn from a stratified, random sample of board and care homes in states with extensive or limited regulatory systems. The data on the characteristics of nursing home residents is more directly comparable. It is drawn from a nationally representative sample of nursing home residents in 1996 as part of the Nursing Home Component of the Medical Expenditure Panel Survey (MEPS) (Krauss and Altman, 1998).
-
Unless noted, all differences reported were statistically significant.
-
The basic monthly rate does not include charges for any ancillary services. According to prior studies, there is considerable variation among ALFs in the nature and extent of services covered under the basic rate (e.g., Gulyas, 1997; ALFA, 1998). The services covered by the base rate and charges for ancillaries are explored in a subsequent project report.
-
These income categories were calculated from data provided by the U.S. Bureau of the Census (1998) for income of older persons in 1997.
- Later in this project, staff will conduct follow-up interviews with a sample of residents who have "exited" assisted facilities since the initial round of in-person interviews. These interviews with discharged residents (or their next-of-kin) will provide better answers to this question.
-
This appendix is a recreation of the questions asked on the questionnaire. See the PDF version for a scanned version of the form itself.
OTHER REPORTS AVAILABLE
A National Study of Assisted Living for the Frail Elderly: Discharged Residents Telephone Survey Data Collection and Sampling Report
HTML http://aspe.hhs.gov/daltcp/reports/drtelesy.htm
PDF http://aspe.hhs.gov/daltcp/reports/drtelesy.pdf
A National Study of Assisted Living for the Frail Elderly: Final Sampling and Weighting Report
HTML http://aspe.hhs.gov/daltcp/reports/sampweig.htm
PDF http://aspe.hhs.gov/daltcp/reports/sampweig.pdf
A National Study of Assisted Living for the Frail Elderly: Final Summary Report
HTML http://aspe.hhs.gov/daltcp/reports/finales.htm
PDF http://aspe.hhs.gov/daltcp/reports/finales.pdf
A National Study of Assisted Living for the Frail Elderly: Report on In-Depth Interviews with Developers
Executive Summary http://aspe.hhs.gov/daltcp/reports/indpthes.htm
HTML http://aspe.hhs.gov/daltcp/reports/indepth.htm
PDF http://aspe.hhs.gov/daltcp/reports/indepth.pdf
A National Study of Assisted Living for the Frail Elderly: Results of a National Study of Facilities
Executive Summary http://aspe.hhs.gov/daltcp/reports/facreses.htm
HTML http://aspe.hhs.gov/daltcp/reports/facres.htm
PDF http://aspe.hhs.gov/daltcp/reports/facres.pdf
Assisted Living Policy and Regulation: State Survey
HTML http://aspe.hhs.gov/daltcp/reports/stasvyes.htm
PDF http://aspe.hhs.gov/daltcp/reports/stasvyes.pdf
Differences Among Services and Policies in High Privacy or High Service Assisted Living Facilities
HTML http://aspe.hhs.gov/daltcp/reports/alfdiff.htm
PDF http://aspe.hhs.gov/daltcp/reports/alfdiff.pdf
Family Members' Views: What is Quality in Assisted Living Facilities Providing Care to People with Dementia?
HTML http://aspe.hhs.gov/daltcp/reports/fmviews.htm
PDF http://aspe.hhs.gov/daltcp/reports/fmviews.pdf
Guide to Assisted Living and State Policy
HTML http://aspe.hhs.gov/daltcp/reports/alspguide.htm
PDF http://aspe.hhs.gov/daltcp/reports/alspguide.pdf
High Service or High Privacy Assisted Living Facilities, Their Residents and Staff: Results from a National Survey
Executive Summary http://aspe.hhs.gov/daltcp/reports/hshpes.htm
HTML http://aspe.hhs.gov/daltcp/reports/hshp.htm
PDF http://aspe.hhs.gov/daltcp/reports/hshp.pdf
National Study of Assisted Living for the Frail Elderly: Literature Review Update
Abstract HTML http://aspe.hhs.gov/daltcp/reports/ablitrev.htm
Abstract PDF http://aspe.hhs.gov/daltcp/reports/ablitrev.pdf
HTML http://aspe.hhs.gov/daltcp/reports/litrev.htm
PDF http://aspe.hhs.gov/daltcp/reports/litrev.pdf
Residents Leaving Assisted Living: Descriptive and Analytic Results from a National Survey
Executive Summary http://aspe.hhs.gov/daltcp/reports/alresdes.htm
HTML http://aspe.hhs.gov/daltcp/reports/alresid.htm
PDF http://aspe.hhs.gov/daltcp/reports/alresid.pdf
State Assisted Living Policy: 1996
Executive Summary http://aspe.hhs.gov/daltcp/reports/96states.htm
HTML http://aspe.hhs.gov/daltcp/reports/96state.htm
PDF http://aspe.hhs.gov/daltcp/reports/96state.pdf
State Assisted Living Policy: 1998
Executive Summary http://aspe.hhs.gov/daltcp/reports/98states.htm
HTML http://aspe.hhs.gov/daltcp/reports/98state.htm
PDF http://aspe.hhs.gov/daltcp/reports/98state.pdf
INSTRUMENTS AVAILABLE
Facility Screening Questionnaire
HTML http://aspe.hhs.gov/daltcp/instruments/FacScQ.htm
PDF http://aspe.hhs.gov/daltcp/instruments/FacScQ.pdf
To obtain a printed copy of this report, send the full report title and your mailing information to:
U.S. Department of Health and Human ServicesOffice of Disability, Aging and Long-Term Care PolicyRoom 424E, H.H. Humphrey Building200 Independence Avenue, S.W.Washington, D.C. 20201FAX: 202-401-7733Email: webmaster.DALTCP@hhs.gov
RETURN TO:
Office of Disability, Aging and Long-Term Care Policy (DALTCP) Home [http://aspe.hhs.gov/_/office_specific/daltcp.cfm]Assistant Secretary for Planning and Evaluation (ASPE) Home [http://aspe.hhs.gov]U.S. Department of Health and Human Services Home [http://www.hhs.gov]