
Catherine Hawes, Judith Wildfire, Vincent Mor, Victoria Wilcox, Diana Spore, Vince Iannacchione, Linda Lux, Rebecca Green, Angela Greene and Charles D. Phillips
Research Triangle Institute and Brown University
"Acknowledgments
Drug data entry and related analyses were funded by a grant from the Geriatric Drug Therapy Research Institute to Brown University. Diana Spore was supported by the Agency for Health Care Policy and Research Training Grant T32-HS00011 awarded to Brown University.
Section 1. Background
A variety of demographic factors and policy initiatives have increased demand for residential facilities that offer supportive services for the aged and disabled. These factors include
- A rapidly growing elderly population with significant levels of physical disability and mental impairment
- The almost universal rejection of nursing home care by younger persons with disabilities and their advocates
- A strong preference of the elderly for in-home and community-based services rather than nursing homes.
Although families continue to be the major source of long-term care, a variety of residential settings with supportive services have emerged to supplement their efforts. These arrangements support families whose members need more care than the family can provide and those elderly and disabled who have no family. Other than nursing homes, the most common form of residential setting with services for people with disabilities is board and care homes. This term is used in a variety of ways across the States. For this study, however, “board and care” refers to nonmedical community-based residential settings that house two or more unrelated adults and provide some services such as meals, medication supervision or reminders, organized activities, transportation, or help with bathing, dressing, and other activities of daily living (ADLs).
There are approximately 34,000 licensed board and care homes in the United States with more than 613,000 beds (Clark et al., 1994). These homes fall into one of three basic types of licensed facilities (Clark et al., 1994): (1) homes serving a clientele with mental retardation or developmental disabilities; (2) homes serving a clientele with mental illness; and (3) homes serving a mixed population of physically frail elderly, cognitively impaired elderly, and persons with mental health problems. The majority of homes fall into this last category. Not all board and care facilities, however, are licensed, and there is little uniform or comprehensive information about such homes. Unlicensed homes are as numerous as licensed facilities by some estimates (U.S. House, 1989). Thus, the total number of persons living and receiving long-term care in all types of board and care homes may be as high as 1 million (Clark et al., 1994; Hawes et al., 1993; Moon et al., 1989; U.S. House, 1989). As a point of comparison, there are an estimated 17,000 licensed nursing homes with approximately 1.68 million beds serving more than 1.5 million nursing home residents (DuNah et al., 1993).
The Office of the Assistant Secretary for Planning and Evaluation (ASPE) in the U.S. Department of Health and Human Services (DHHS) has a long-standing interest in the potential of board and care homes to meet the needs of aged and disabled persons for residential services. ASPE commissioned a study in the early 1980s by Denver Research Institute (DRI) that described board and care homes and residents in five States and investigated the effect of regulation on quality of care (Dittmar and Smith, 1983). Other studies during the 1980s also attempted to describe homes and residents, the regulation of these homes by States, and the role these facilities play in providing long-term care (i.e., Reichstein and Bergofsky, 1980; Sherwood et al., 1981).
In the early 1990s, ASPE initiated a new examination of board and care homes and their role in the long-term care system. This time the policy interest was threefold:
- To document the characteristics of board and care homes, how much they had grown in the United States since the initial studies of the 1980s, and the role they play in meeting the need for long-term care
- To describe the characteristics of board and care residents, particularly the extent of frailty and disability among residents
- To assess the quality of care received by board and care residents and examine the effect of State regulation on the quality of that care.
To address these questions, ASPE launched two related initiatives. The first by Lewin-VHI, Inc., was a national survey of State licensure agencies to determine the number and types of home and to generate a list of homes (Manard et al., 1990). The second initiative is the study reported here, and it addresses concerns related to board and care quality. ASPE placed a high priority on the need to evaluate board and care quality for several reasons.
First, the Federal expenditures directed at home and community-based services for persons with disabilities in all types of community-based residential settings was increasing rapidly in the early 1990s. Nevertheless, the Federal government played only a limited role in monitoring or regulating the quality of those services. The regulation of board and care was primarily a State responsibility, with the Federal role largely limited to the oversight specified in the Keys Amendments.1 The emphasis on strengthening Federal oversight of nursing home quality required by the Omnibus Budget Reconciliation Act of 1987 served to highlight the lack of systematic information on board and care residents and the effect of State regulations on their well-being. Second, there was a belief that the residents of board and care homes were far more disabled than they had been a decade before. Third, concerns were raised by the U.S. General Accounting Office, congressional hearings, and other studies that residents were not receiving adequate care or protection from health and safety risks (Avorn et al., 1989; Budden, 1985; GAO, 1989; 1992a; 1992b; Hartzema et al., 1986; U.S. House, 1989). These studies reported evidence of unsafe and unsanitary conditions, wide-spread use of psychotropic medications, lack of staff knowledge about medication administration, and other health and safety problems. Fourth, several reports raised questions about the effectiveness of State regulatory efforts (ABA, 1983; Dobkin, 1989; GAO, 1989; Hawes et al., 1993; Newcomer and Grant, 1988; Reichstein and Bergofsky, 1980; Stone and Newcomer, 1985; U.S. DHHS Inspector General, 1990). In addition, there were assertions that significant numbers of board and care homes were unlicensed and unregulated (U.S. House, 1989).
This is the second in a series of four reports that summarize study findings and methods. This report presents descriptive findings on the characteristics of board and care facilities, operators, staff, and residents. Section 2 briefly describes the study design and sampling and analytic methodology; more detailed discussion is presented in the Technical Report Study Methods. Section 3, Section 4, Section 5, and Section 6 describe the facilities, operators, staff, and residents in the board and care homes in this 10-State study.
Section 2: Overview of Study Methods
The goals of this project were to describe the quality of care in board and care homes and how it varies across licensure and regulatory systems. Accomplishment of these objectives required a study design that incorporated several activities, including a major collection of new data. The study design included:
- Review of current State regulatory approaches, using information from studies by the Office of the Inspector General and RTI’s 50-State survey for AARP, to create a ranking of State regulatory environment
- Implementation of a sampling plan with the following key features:
- Selection of 10 study States that represent the extremes of a continuum of regulatory systems ranging from very extensive to very limited
- Selection of homes, staff, and residents using a complex, multistage cluster design
- Creation of a sampling frame of unlicensed homes using the Social Security Administration’s State Data Exchange Tapes (SDX) and discussions with State and local agencies to identify eligible homes
- Primary data collection in 385 licensed and 129 unlicensed board and care homes, including interviews with 490 operators, 1,138 staff, 3,257 residents, and observations of the physical environment and care of residents.
This section of the report provides an overview of these study methods, which are described in more detail in the technical report Project Study Methods (RTI, 1995).
2.1 Study Design
The objective of this study was to determine whether regulation affects the quality of care in licensed and unlicensed board and care homes. Specifically, the study was designed to determine whether an extensive regulatory system is associated with better quality of care and, if such an association is found, to determine whether regulation affects licensed and unlicensed homes differently.
We chose a “polarized” approach to test the main hypothesis. If regulation affects quality of care, the association will be most apparent in the extremes of the regulatory environment. That is, for a given sample size, the best chance of detecting regulatory effects on quality is afforded by restricting the sample to homes located in States with the most extensive and most limited regulatory systems. If licensure status (licensed/unlicensed) is included with regulatory environment as a second factor, the result is a two-factor by two-level (i.e., 2x2) factorial design.
In the sections that follow, we discuss the definition of the study population and the sample design, including the selection of States and the selection of probability-based samples of board and care homes, their staff, and residents. We also summarize our strategies for measurement construction and analysis.
2.2 Selection of States
We produced a comparative ranking of the regulatory environments among the 50 States. We are confident that the States in the extensively regulated range have more stringent regulations, monitoring, and enforcement policies than do those on the limited end of the continuum. However, we did not assess the States’ regulatory environment with respect to a “gold standard” of very strong regulations. The 10 study States were: California, Florida, New Jersey, Oklahoma, and Oregon in the extensive regulatory stratum and Arkansas, Georgia, Illinois, Kentucky, and Texas in the limited regulatory stratum.
2.3 Definition of Licensed and Unlicensed Board and Care Homes
Each study State had different definitions or criteria for licensure of board and care homes, and, even within States, there were multiple categories of homes and multiple agencies that licensed homes. Because of this variation, we adopted decision rules about inclusion and exclusion for both licensed and unlicensed homes.
2.3.1 Exclusion of Homes Licensed for Special Populations
As a first step, we limited the study population by excluding homes specifically licensed to serve only special populations--children, the chronically mental ill, mentally retarded/developmentally disabled (MR/DD), and substance abusers. These facilities often operate under different licensure standards and have different programmatic funding compared to the vast majority of homes that are licensed to serve an unrestricted population. Because the main goal of the study was to assess the effectiveness of regulation and to describe the most prevalent homes and residents, this exclusion was necessary.
Once this exclusion was made, we included in the sample all other facilities licensed as board and care homes in the State. However, the construction of the sampling frame for licensed homes was complicated by the need to “capture” all relevant licensed homes, even those referred to by other names and those licensed by more than one agency or division. This meant, for example, that in some States, such as Oregon, we included three types of board and care homes serving an elderly/mixed population: adult foster care homes, residential care homes, and assisted living facilities. However, in California we included only residential care facilities for the elderly (RCFEs) and excluded residential care facilities (RCFs) that served only persons younger than 60 with chronic mental illness and developmental disabilities.
2.3.2 Defining Unlicensed Board and Care Homes
Given the variety of definitions of licensure across the 10 study States, developing criteria for the inclusion of unlicensed facilities was even more challenging. Because of licensure standard variations, for example, homes that were legally unlicensed in Texas (e.g., adult foster care homes with five or fewer beds) were required to be licensed in California and Oregon. Similar variation was found for facilities, often referred to as “assisted living,” that housed residents in apartments but whose residents received services similar to those in more traditional board and care homes. In some States, “assisted living” facilities must be licensed under the board and care regulations; in others, they are specially excluded from these licensure requirements. In all States, we expected to find some facilities that required licensure as a board and care home ignoring the requirement and operating “illegally.”
We developed an operational definition for an eligible unlicensed board and care home that we used across the States. We also defined specific criteria for inclusion of “assisted living” facilities and other places that included apartments, did not provide three meals a day or 24-hour staffing, but did provide key personal care services (e.g., medication reminders or supervision, money management, assistance with personal care). Thus, we defined two sets of criteria for inclusion of a place as an eligible unlicensed home in our sampling frame.
- Inclusion of “Traditional” Board and Care Homes. A facility was eligible if it provided room, meals, some type of 24-hour protective oversight or supervision, and one or more eligible services (e.g., personal care, transportation to medical and dental appointments, organized recreational activities, medication reminders) to two or more adults who were not related to the operator/owner.
- Inclusion of “Assisted Living” Facilities and Apartments. A place with only apartments was considered eligible if it provided either all the “core” criteria listed above (i.e., three meals, 24-hour staff supervision, services) or provided a more significant or intensive level of supportive services (e.g., medication storage and supervision, money management, and assistance with ADLs).
2.4 Sample Design
The sample design is a stratified, three-stage, cluster design. First-stage sampling units are counties, second-stage units are facilities, and third-stage sampling units are residents and staff of selected homes. Additionally, because we expected home size to affect quality, we stratified facilities to control the distribution of small, medium, and large facilities. Greater detail can be found in Iannacchione et al. (1994).
2.5 Descriptive Measures
The development of instruments to describe residents, homes, operators, and staff and to capture key elements of quality was another major task.
We developed three basic types of measures: (1) those used to describe homes and residents, (2) those used as covariates in the analysis of the effect of regulation and licensure on quality, and (3) those used to evaluate the quality of care and life in the homes.
We used fairly straightforward measures to describe residents and homes. Most come directly from individual items on the various survey instruments. In addition to these variables, we constructed several composite measures (e.g., facility occupancy rate, average payment per month per resident, counts of the number of different services offered by the facility, and an aggregate case mix classification describing the bulk of facility residents). Additionally, we used several scales to characterize residents’ physical and emotional functioning: a count of the number of ADL dependencies, the five-item Mental Health Inventory (McHorney et al., 1994) and a three-level mental health status measure that was constructed from the Blessed Scale, and, for residents with proxy respondents, ratings of the resident’s cognitive function using the Cognitive Performance Scale (Morris et al., 1994).
2.6 Data Collection
During the summer and early fall of 1993, RTI field interviewers (FIs) conducted in-person interviews in the sampled facilities with operators, staff, and residents in 10 States. In addition, interviewers followed a protocol to conduct a structured observational “walk-through” of the home, rating various qualities of the facility. We conducted site visits to 386 licensed and 126 unlicensed board and care homes. In these visits, we conducted interviews with 490 operators, 1,138 staff, and 3,257 residents and observed the physical environment and care of residents in each facility.
A detailed summary of the topics and items covered during each interview and the structured walk-through observation can be found in the technical report, Project Study Methods (RTI, 1995).
2.7 Analysis
Licensure status and the extensiveness of regulation in the two groups of States were the independent variables against which facility and resident quality measures were compared. Consistent with the sample design and original study power calculations, we used a probability level of 0.05 as the determination of statistical significance.
To study the relationship between regulation, licensure, and quality of care constructs at both the facility and the resident level, we used multivariate modeling techniques that control for multiple explanatory variables. For continuous quality measures we used linear regressions. When the outcome was binary, logistic regression was the technique of choice. Because no single measure of quality of care summarized all aspects of care, we fit multiple models with dependent variables that characterized the different aspects of care. The results of these analyses are presented in a separate report.
All analyses were conducted using weighted estimates of the number of homes and residents within the group based on the sampling design. To account for the multistage, complex cluster sampling techniques used, we used software that adjusts the standard errors of estimate for the intercorrelation among sampled units within clusters (SUDAAN). SUDAAN produces unbiased variance estimators for linear (or nonlinear) statistics no matter how subsampling occurs within FSUs.
Section 3: Facility Characteristics
Operators in 490 board and care facilities completed two questionnaires about their facilities’ characteristics and policies. These data suggest that there was enormous diversity among places known as board and care homes in size, price, setting, service mix, resident mix, and available services. This chapter presents our findings on these facility characteristics. We also examine whether there were significant differences between licensed and unlicensed facilities and licensed extensively regulated homes and licensed homes in States with limited regulations.
3.1 Size, Ownership, Affiliation, and Occupancy Rate
3.1.1 Size
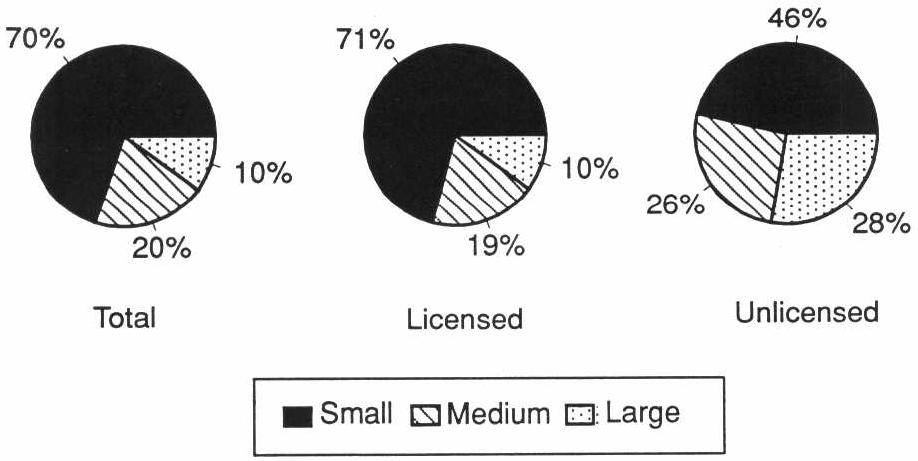
The widespread perception that board and care homes are small, “homelike” settings is misleading. The facilities in our study ranged in size from places with 2 beds to those with more than 1,400 and included family homes as well as multilevel facilities that also had congregate apartments and a skilled nursing home. More than 70 percent of the licensed and nearly 50 percent of the unlicensed homes were small (Exhibit 3-1). However, in licensed homes, 25 percent of the residents lived in medium-sized homes (11-50 beds), and 52 percent lived in large, licensed homes (51+ beds). Among residents of unlicensed homes, more than 80 percent lived in large facilities. These large unlicensed homes included assisted living facilities and retirement communities that provide meals, protective oversight, and some services.
EXHIBIT 3-1. Facility Size
3.1.2 Ownership and Affiliation
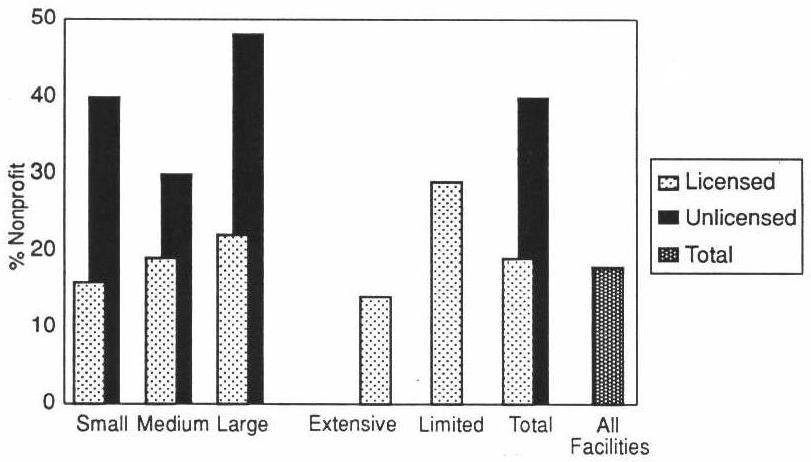
Less than 20 percent of all facilities were nonprofit, with licensed facilities being less likely to be nonprofit than unlicensed homes. Specifically, only 15 percent of small licensed homes were nonprofit compared to almost 40 percent of small unlicensed homes (Exhibit 3-2). In looking at licensed facilities, we observed that licensed homes in extensively regulated States are less likely to be nonprofit than those in States with limited regulations.
Overall, less than 10 percent of board and care homes were attached to nursing homes (Exhibit 3-3). Virtually no small homes reported affiliation to a nursing home compared to almost one-third of the large homes. However, licensed homes in States with limited regulations are twice as likely to be attached to nursing homes (see Table A-9).
Perhaps an indication of the rapid growth experienced by the board and care industry recently is the fact that about one-third of the operators reported owning or operating another board and care facility in addition to the one included in the study. Almost 10 percent reported owning or operating a nursing home.
EXHIBIT 3-2. Nonprofit Facilities by Licensure Status, Regulatory Environment, and Size
| EXHIBIT 3-3. Facility Affiliation with Nursing Homes and Ownership Patterns | ||
|---|---|---|
| Total Population | ||
| % | SE | |
| Attached to a nursing home | 7 | 1.5 |
| Operator owns/operates another board and care facility | 33 | 4.8 |
| Operator owns/operates a nursing home | 8 | 1.8 |
3.1.3 Occupancy Rates and Revenue
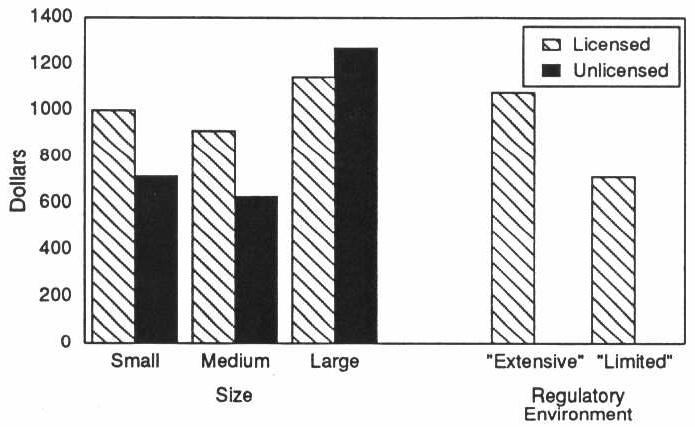
We observed no consistent differences in occupancy rates across various types of facilities, with the average occupancy rate being about 80 percent. Although the occupancy rates were similar, we found that the average monthly revenue per resident in licensed extensively regulated homes was over $300 higher than in licensed homes in States with limited regulations. In particular, licensed small and medium homes had significantly higher average per-resident monthly revenue than did comparably sized unlicensed homes (Exhibit 3-4).
EXHIBIT 3-4. Facility Average Monthly Revenue per Resident by Size, Licensure, and Regulatory Environment
3.2 Facility Policies
3.2.1 Medication Management
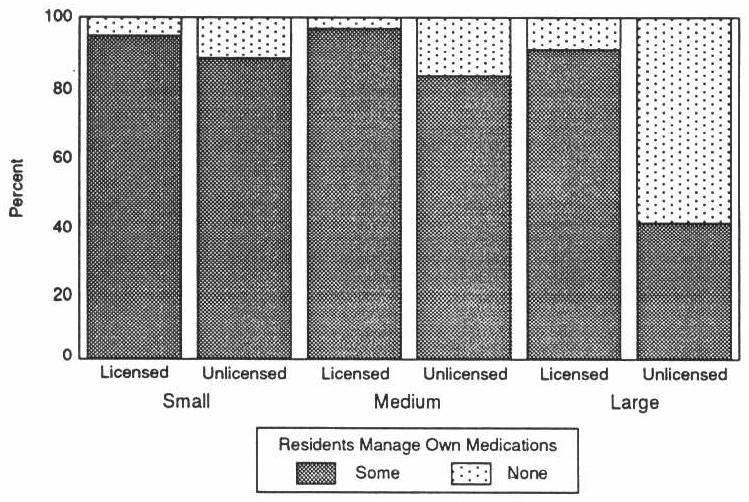
Because a large proportion of board and care residents take prescription medication, it is particularly important for facilities to have appropriate medication management practices. Licensed and unlicensed homes reported significantly different practices. Regardless of size, licensed homes were more likely to allow at least some residents to manage their own medications (Exhibit 3-5).
EXHIBIT 3-5. Medication Management Practices by Licensure and Size
3.2.2 Admittance and Discharge Policies
Board and care facilities varied immensely on criteria for admittance to their facilities. Almost half of the facilities reported that they would not admit residents who were mobility-impaired. Twenty-three percent would not admit incontinent residents, and 19 percent would not admit SSI recipients. Almost all facilities reported accepting residents with behavior problems (Exhibit 3-6).
| EXHIBIT 3-6. Facility Admission and Discharge Policies | ||
|---|---|---|
| Total Population | ||
| % | SE | |
| Will not admit residents who are/have | ||
| Mobility impairment | 46 | 5.4 |
| Behavior problems | 2 | 0.8 |
| Incontinent | 23 | 3.2 |
| SSI recipients | 19 | 3.7 |
| Will discharge residents who become/develop | ||
| Mobility impairment | 35 | 8.0 |
| Behavior problems | 2 | 2.1 |
| Incontinent | 8 | 4.1 |
| SSI recipients | 2 | 3.3 |
However, perhaps even more important to a resident who wishes to “age in place” is a facility’s discharge policy for residents who develop debilitating conditions while residing in the facility. We asked operators who reported that their facility did not admit residents with certain characteristics (e.g., incontinence, mobility impairment) whether the facility would discharge a resident who develops the conditions after being admitted to the home. Seventy-five percent of the facilities that did not admit mobility-impaired residents (35 percent of all facilities) reported discharging residents who became impaired while living in the home. Less than 10 percent of all facilities reported discharging residents who became incontinent, developed behavior problems, or started receiving SSI after moving to the facility.
Differences by Regulatory Environment. There were no differences in admission or discharge policies by regulatory environment, with the possible exception that licensed homes in extensively regulated States were significantly more likely to report that they will admit “no” SSI residents than was the case in limited regulation States (21 percent vs. 10 percent) (see Table A-11).
Differences by Licensure Status. We also examined resident admission and discharge policies for licensed homes compared to unlicensed. Large licensed homes were significantly less likely to admit mobility-impaired residents and were more likely to discharge them than were their unlicensed counterparts. Although licensed homes were somewhat more likely to report admitting SSI-funded residents than were unlicensed homes, almost no homes reported discharging residents once they became SSI recipients (see Table A-3).
3.3 Facility Staffing Patterns
As the board and care population becomes increasingly impaired, the experience, training, and knowledge of staff who care for them become more critical. An examination of facility staffing factors raises concerns about quality.
3.3.1 Staff Training Required by Facility
Nearly 20 percent of the operators in licensed homes and 33 percent in unlicensed homes reported that they did not require training for staff (Exhibit 3-7). Of those who required training, only 23 percent of licensed homes and 15 percent of unlicensed homes required staff to complete all training before they began providing resident care (i.e., preservice). Another 35 percent of operators in licensed homes and 22 percent in unlicensed homes reported that they required some preservice and some on-the-job training for staff.
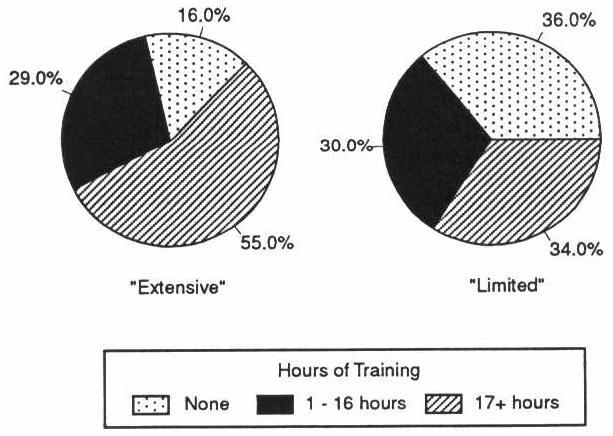
There were large differences in the number of hours of training required of board and care staff in licensed homes in extensively vs. limited regulation States. Over half of those in extensively regulated States required 2 or more days of training compared to about one-third in States with limited regulation (Exhibit 3-8).
EXHIBIT 3-7. Facility Policies on Staff Training
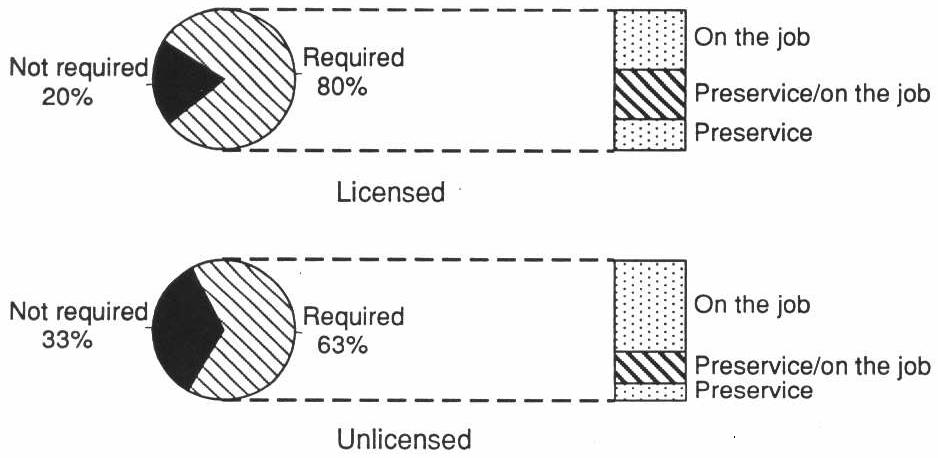
EXHIBIT 3-8. Staff Training Hours Required in Licensed Homes by Regulatory Environment
On major area of concern relates to staff qualifications and medication usage in board and care homes. As noted in Section 3.6, virtually all homes reported providing medication storage or supervision. In addition, three-quarters of the residents reported receiving assistance with medications, and many were taking psychotropic drugs (see Section 6.3 and Section 6.8). Despite this, only 21 percent of the homes had any licensed nurse on staff (Exhibit 3-9). This included full- or part-time nursing staff and registered nurses (RNs), as well as licensed practical or vocational nurses (LPNs/LVNs). Interviews with operators and staff showed that most staff who reported passing medications, 73 percent, were not licensed nurses even though only one State (Oregon) had a program for training and certifying nonnursing staff to pass medication. Eighteen percent reported being LPNs or LVNs, and only 10 percent were RNs. Of the staff passing medications, 26 percent reported they received no training on medication supervision or management. Of staff who reported giving injections to residents, only 21 percent were RNs, 51 percent were LPNs or LVNs, and 28 percent were not licensed nurses.
The influence of more extensive regulations was seen in the greater experience of operators and the more stringent staff training requirements they reported. Although they clearly indicate compliance with State regulations, these structural measures characterizing the training of staff are not necessarily evidence that more extensive regulation improves the quality of the home. Nonetheless, training of board and care home staff was one of the features our expert panel (TAG) felt could make a difference in the lives of the residents who are so dependent upon their caregivers.
| EXHIBIT 3-9. Training of Staff Who Pass Medications and Give Injections | ||
|---|---|---|
| Total Population | ||
| % | SE | |
| Facilities with licensed nurse on staff | 21 | 2.6 |
| Staff passing medications | 70 | 6.2 |
| Training of staff who pass medications | ||
| LPN/LVN | 18 | 4.6 |
| RN | 10 | 2.6 |
| Not a licensed nurse | 73 | 5.6 |
| Staff who give injections | 17 | 3.2 |
| Training of staff who pass medications | ||
| LPN/LVN | 51 | 11.8 |
| RN | 21 | 4.2 |
| Not a licensed nurse | 28 | 12.8 |
3.3.2 Resident/Staff Ratio
In almost one-fourth of the homes, the operator was the only paid staff person. We observed no difference in the average number of residents per direct care staff as a function of regulatory extensiveness. However, there was a significant difference between licensed and unlicensed homes of most size categories. Unlicensed medium and large homes had, on average, more residents per direct care staff than did comparably sized licensed homes. The average ratio in large unlicensed homes was almost 12 times that of large licensed homes (see Table A-5).
3.4 Social Environment of Facility
In considering the “social environment” of the home, indicators such as operators eating with the staff or family living and/or working in the home were thought to represent more “homelike” and less institutional facilities. Although licensed home operators in a limited regulatory environment were more likely to report always eating with residents, family were more likely to always eat and live in licensed homes in the more extensively regulated States. These homes were usually a family business, although not necessarily a family home. Overall, operators and/or their families lived in almost two-thirds of the facilities (see Table A-12).
3.5 Facility Resident Mix
For all of these homes, the resident mix was quite complex (Exhibit 3-10). Approximately three-quarters of the homes reported having one or more residents with cognitive impairment. Over half of the homes reported having residents with a diagnosis of mental illness or prior stay in a psychiatric hospital. One-third reported having residents with mental retardation or developmental disabilities. Moreover, board and care homes also coped with more complex problems. Forty-two percent of homes reported having one or more residents with alcohol abuse problems, and 15 percent said they had residents with a past history of drug abuse problems.
Some homes also housed residents with significant health problems and functional impairments. Almost 30 percent of the homes reported having one or more residents who stayed in their room all day in bed or in a chair because of health problems, and almost 60 percent of the homes reported having residents with urinary incontinence.
| EXHIBIT 3-10. Resident Case Mix Characteristics for Facilities by Licensure and Regulatory Environment | |||||||
|---|---|---|---|---|---|---|---|
| Case Mix Characteristics | Total Population | Licensed Homes | |||||
| Extensive States | States with Limited Regs | ||||||
| % | SE | % | SE | % | SE | pa | |
| Summary measure | b | ||||||
| 90%+ behavior problems | 21 | 4.1 | 16 | 2.8 | 36 | 4.1 | |
| 90%+ elderly | 56 | 4.4 | 62 | 3.8 | 36 | 4.7 | |
| Other resident mix | 23 | 2.8 | 22 | 3 | 29 | 4.1 | |
| Facility has residents who are/have | |||||||
| Bedfast | 5 | 1.9 | 5 | 1.8 | 5 | 1.7 | |
| Chairfast | 29 | 2.4 | 32 | 2.6 | 16 | 3.2 | b |
| Cognitively impaired | 71 | 3.3 | 74 | 3.9 | 62 | 5.3 | c |
| Alcohol problems | 42 | 2.8 | 43 | 4 | 35 | 4 | |
| Drug abuse | 15 | 2.6 | 14 | 2.6 | 18 | 2.1 | |
| HIV+ | 1 | 0.8 | 1 | 0.7 | 1 | 0.1 | |
| MR/DD | 34 | 5.8 | 30 | 4.4 | 48 | 4.3 | b |
| Psychiatric history | 57 | 4.9 | 56 | 4.4 | 60 | 3.8 | |
| Incontinent of urine | 59 | 2.4 | 66 | 4.1 | 44 | 4.6 | c |
| |||||||
3.5.1 Differences by Regulatory Environment
Board and care homes differed in their mix of residents (Exhibit 3-10). Some homes had a mainly elderly mix of residents. Over 60 percent of the licensed homes in States with an extensive regulatory system reported that residents were primarily elderly (65 and older). Only 36 percent of the homes in States with limited systems had this elderly resident mix. Other homes, even though not specifically licensed as such, housed mainly persons with persistent mental illness or developmental disabilities (MR/DD). Sixteen percent of the licensed homes in States with extensive regulatory systems and almost 40 percent in States with limited systems reported having primarily nonelderly residents, most of whom had a chronic mental illness or MR/DD. Slightly over 20 percent of licensed “extensive” homes reported having a mixed population that included the frail elderly and persons with cognitive impairment, compared to 29 percent of facilities in “limited” States.
Licensed extensively regulated homes were more likely to house chairfast, cognitively impaired, and incontinent residents than were licensed homes in States with limited regulations.
3.5.2 Differences by Licensure Status
In spite of similarities in admission and discharge policies (discussed in Section 3.2.2), the resident care mix across licensure status was considerably different (see Table A-2). Small licensed facilities were more likely to house 90 percent or more elderly residents than were small unlicensed homes. Indeed, 70 percent of small licensed homes reported housing all elderly residents compared to half of small unlicensed homes. The opposite was true in large homes, with about 75 percent of large licensed facilities reporting a primarily elderly population compared to 88 percent of large unlicensed homes. No consistent differences in case mix indicators measuring functional level or frailty were observed, although small unlicensed homes were more likely to house some residents with psychiatric histories than were small unlicensed homes. Finally, compared to unlicensed homes, licensed homes, particularly small and large facilities, had significantly higher proportions of residents who were SSI recipients.
3.6 Service Availability
To meet the needs of the complex mix of residents, some board and care homes offered a wide range of services. However, available services varied considerably from homes offering little more than room, meals, oversight, and a few services to places that provided or arranged for extensive and skilled nursing services and therapies.
3.6.1 Service Mix
More than three-quarters of the homes reported providing medication storage or supervision, organized activities, recreational trips, and transportation (Exhibit 3-11). Approximately one-quarter of all homes reported providing nursing services.
| EXHIBIT 3-11. Services Provided in Facility | ||
|---|---|---|
| Services Provided | Total Population | |
| % | SE | |
| Personal care/assistance | 92 | 2.0 |
| Medication storage | 99 | 0.7 |
| Reminders to take medication | 81 | 3.8 |
| Organized activities | 88 | 2.9 |
| Recreational trips | 80 | 3.8 |
| Transportation | 89 | 2.7 |
| Nursing care | 25 | 2.9 |
| Therapy | 16 | 1.6 |
| Money management | 39 | 4.5 |
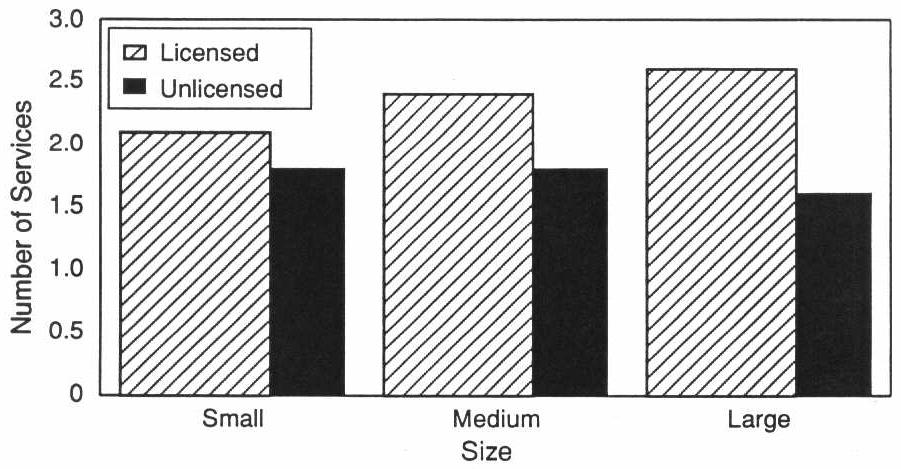
Differences by Licensure Status. By and large, licensed homes of all sizes were significantly more likely to provide therapy directly to their residents than were unlicensed homes. A “responsible” person is more likely to be present in medium and large licensed homes than in comparably sized unlicensed homes, and large licensed homes are more likely to provide transportation than are large unlicensed homes. Regardless of size, licensed homes were more likely to report providing personal care services. A similar pattern is observed for medication reminders and medication storage (see Table A-7). The average number of health services in a facility was greater in licensed homes of all sizes (Exhibit 3-12). Social services were more prevalent in large licensed homes than in comparably sized unlicensed homes (4.2 compared to 2.9).
With respect to arranging for outside services, the differences were not as consistent. Although small licensed homes were more likely to arrange for nursing and long-term care for their residents than were small unlicensed facilities, large licensed facilities were more likely to arrange for outside transportation for their residents than were large unlicensed homes; most other externally arranged services did not consistently differ by licensure status.
Differences by Regulatory Environment. The pattern of service availability in licensed facilities in limited and extensively regulated States was remarkably similar. We observed few significant differences. Licensed homes in limited regulation States were more likely to manage their residents’ money (64 vs. 31 percent) and to provide medication reminders (90 vs. 79 percent) than licensed homes in extensively regulated States (see Table A-15).
EXHIBIT 3-12. Average Number of Health Services Provided by the Facility by Size and Licensure
3.6.2 Services from External Agencies
Half the homes reported that outside agencies, such as home health agencies, provided nursing care to residents who needed such care on a temporary or episodic basis. In addition, as seen in Exhibit 3-13, 25 percent of the extensively regulated licensed and 23 percent of the licensed homes in States with limited regulation reported that agencies provided ADL/personal care to residents. Approximately one-third reported that some residents attended Senior centers or adult day care programs. About 30 percent of the homes reported that some residents attended sheltered workshops or day activity programs.
No significant differences were observed in the type, or number, of outside provided services arranged by the home, except that in limited regulation States homes were more likely to arrange for sheltered workshop programs than was the case in extensively regulated homes.
3.6.3 Approach to Residents Who Need Nursing Care
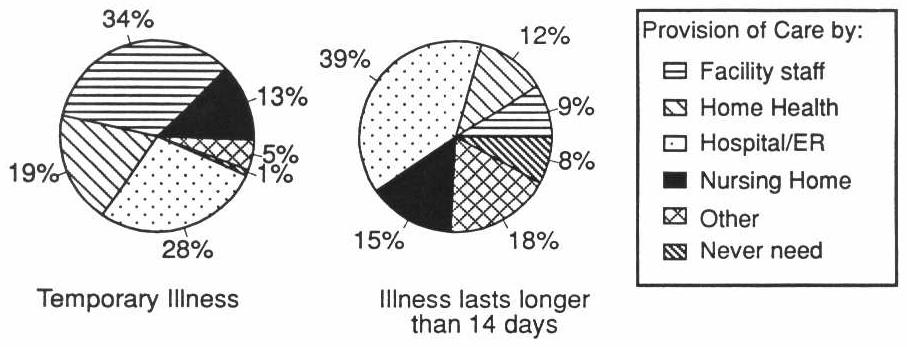
Although most homes reported providing many services directly and through external agencies, homes differed on whether residents who needed nursing care could remain in the home. Part of this variation is a function of the facility’s willingness and ability to provide or arrange care. In addition, licensing regulations in some States prohibited board and care homes from admitting or retaining residents who need daily nursing care. A few States, such as Florida and Oregon, allowed daily nursing care to be provided by some classes of board and care homes. Other States limited the services such homes could provide. As a result, there was considerable variation in how homes dealt with residents who needed nursing care. Over half of all facilities reported they provided services with facility staff or arranged for a home health agency to provide care if the resident needed only temporary nursing care. However, 28 percent of the homes reported that they sent the resident to a hospital/emergency room if the resident became ill and needed temporary nursing care (less than 14 days). More than half of all homes reported they would discharge a resident to a hospital or nursing home if the resident needed nursing care for more than 14 days (Exhibit 3-14).
| EXHIBIT 3-13. Services Provided by an Outside Agency to Facility Resident | |||||||
|---|---|---|---|---|---|---|---|
| Services Provided by an Outside Agency | Total Population | Licensed Homes | |||||
| Extensive States | States with Limited Regs | ||||||
| % | SE | % | SE | % | SE | pa | |
| Personal care/assistance | 25 | 3.7 | 25 | 2.9 | 23 | 3.9 | |
| Senior center/adult day care | 34 | 4.5 | 34 | 4.2 | 36 | 3.8 | |
| Transportation | 55 | 4.9 | 55 | 5.0 | 54 | 4.2 | |
| Nursing care | 53 | 3.5 | 55 | 3.6 | 46 | 4.4 | |
| Case management | 44 | 3.4 | 44 | 4.4 | 47 | 4.9 | |
| Shelter workshop/day activities | 32 | 5.0 | 28 | 3.8 | 43 | 3.8 | b |
| |||||||
3.6.4 Services Covered by Monthly Rate
Homes differed in terms of the services covered by the monthly rate. These monthly rates generally cover room, board, personal laundry, special diets, and assistance with eating, dressing, and toileting in all homes. However, in over 10 percent of the homes, there was an additional charge if the resident needed a special diet or personal assistance with eating, dressing, and toileting. Nearly three-quarters of the homes charged extra for incontinence supplies (Exhibit 3-15).
EXHIBIT 3-14. Facility Response to a Resident’s Need for Nursing Services
| EXHIBIT 3-15. Services Covered by Monthly Rate | ||
|---|---|---|
| Services Covered by Daily Rate | Total Population | |
| % | SE | |
| Personal laundry | 93 | 2.2 |
| Incontinence supplies | 29 | 2.6 |
| Special diets | 85 | 3.0 |
| Assistance with eating, dressing, or toileting | 89 | 1.8 |
3.7 Quality of Care
3.7.1 Facility Measures
The environmental surroundings of long-term care residents enhances or detracts considerably from the quality of care and life for residents. We defined several quality measures to characterize different aspects of the facility’s physical surroundings. These measures included scores that summarized the prevalence of safety features, assistive and supportive devices, social and recreational aids, and physical amenities. To create the structural measures, we combined varying numbers of elements (ranging from 4 to 21) and then calculated a percentage score for the number of factors present. A description of these results follows.
Facilities scored the lowest on components contributing to facility safety. The average facility safety score was 58 percent, indictating that about one-third of the safety features measured were absent from the average facility. Facilities scored higher on the prevalence of assistive and supportive devices and social and recreational aids, with average scores of 65 and 69 percent, respectively (Exhibit 3-16). Average scores of 72 and 74 percent on measures of physical attractiveness and evnvironmental diversity indicated that most facilities were clean, pleasant, and at least somewhat diverse.
It is important to note that the safety measure used in these analyses does not represent a gold standard for what constitutes a “safe” facility. It presents a summary measure of the 10 characteristics that contribute to a safe environment: smoke detector, fire extinguishers, fire sprinkler, call buttons in bathrooms and bedrooms, nonskid stair surfaces, adequate lighting, presence of obstructions in the halls or on the stairs, and an outside area that is visible to the front desk (Moos and Lemke, 1978). A closer look at the components of the measure indicate that the three most frequently missing safety characteristics of the facilities in this study were fire sprinklers (only 29 percent of the facilities had working systems) and call buttons in the bathrooms and bedrooms.
Board and care homes, though perceived as substantially less institutional than nursing homes, actually varied quite a bit in terms of environmental features or practices that many observers regard as “homelike.” Board and care homes varied from places in which three or four residents shared a room to places in which residents lived in private apartments. Most had common areas, which included community rooms or living rooms and outside sitting areas, although only about half of all homes allowed residents access to a kitchen to fix a snack, a cup of coffee, or a soft drink. Homes also differed in the degree to which the environment was “homelike” or more institutional and whether residents were allowed to bring their own furniture or only a few private possessions, such as quilts, photographs, and other small mementos.
Since the role of regulation also is to prevent the occurrence of “snake pits,” we also looked at facilities to determine which had very low scores on these measures. Only 6 percent of the facilities had the lowest possible scores in one or more of these areas. Another 27 percent had inadequate or barely adequate lighting. (A total of 32 percent of the homes had such lighting, but 5 percent had other environmental problems as well.) We defined lighting as problematic if it was absent, clearly inadequate, or barely adequate (e.g., low or glaring).
| EXHIBIT 3-16. Summary Quality Indicators | ||
|---|---|---|
| Total Population | ||
| Percent | SE | |
| Facility Indicators | ||
| Average prevalence | ||
| Safety features | 58 | 0.9 |
| Supportive devices | 65 | 2.2 |
| Social/recreational aids | 69 | 1.8 |
| Physical amenities | 80 | 0.6 |
| Average facility cleanliness/attractiveness | 72 | 0.6 |
| Average environmental diversity | 74 | 1.0 |
| Working fire sprinkler system | 29 | 3.9 |
| Staff Indicators | ||
| Staff knowledge of (total score = 100% | ||
| Normal aging | 14 | 1.5 |
| Basic care/monitoring | 66 | 2.5 |
| Ombudsman program | 65 | 2.9 |
| Use of physical restraints and/or psychotropics | 15 | 3.3 |
| Prevalence of physical and/or verbal abuse or punishment | 15 | 2.5 |
| Resident Indicators | ||
| Resident can eat whenever she wants | 64 | 3.0 |
| Visiting hours are anytime | 69 | 2.9 |
| Visiting hours area every day | 98 | 1.0 |
3.7.2 Staff Measures
Well-trained and knowledgeable staff are essential to provide high-quality care. The average staff knowledge scores ranged from 14 to 66 percent on three different measures. Staff scored lowest on questions about the normal processes of aging and highest on questions about basic care and medications monitoring.
We asked staff members which of the following were normal processes of aging: becoming incontinent, becoming forgetful or confused, becoming quarrelsome, or being sad and depressed. Almost three-fourths of all staff members reported that it is normal to become forgetful or confused with aging; over half of the staff members said that becoming incontinent and being sad or depressed were expected with aging.
To determine staff knowledge about basic care and medications monitoring, we presented four scenarios describing changes in a resident’s condition or a resident’s reaction to medication. We then asked staff to select an appropriate course of action. We also asked staff about monitoring residents on specific medications and what side-effects to watch for. Based on answers to these seven questions the average staff score was 66 percent.
3.7.3 Use of Physical Restraints
We found that the prevalence of physical restraints, although serious, was not widespread. Fifteen percent of the staff reported use of physical restraints, an intervention that is widely viewed as inappropriate for behavior control and ill-advised as a means of addressing the possibility of falls. A similar number of staff reported witnessing other staff engage in verbal abuse, threats, or similar forms of punishment (e.g., withholding food, isolation) to address difficult behaviors among residents.
3.8 Regulatory Environment
The operators’ views of the level of regulatory control were assessed in several questions about the number of inspections and whether the home operated under some regulatory corrective action.2 We observed that two-fifths of small and mid-sized licensed homes reported having experienced multiple inspections in the past year, a significantly higher rate than their unlicensed counterparts. As might be expected, licensed homes of all sizes were more likely to have been subject to corrective action in the last year than were unlicensed homes (see Table A-6).
3.9 Conclusions
Reflection on the “Niche” Served by Board and Care Homes. It seems clear that board and care homes do, in fact, fit in the “niche” between residential settings with few services and nursing homes. Moreover, while there is “overlap” between board and care homes and these two other modalities at either end of the continuum, it is apparent that board and care homes provide a distinct service.
In terms of services, board and care homes provided more care and services than congregate apartments and boarding houses. However, even with the addition of services provided by home health agencies, visiting nurses, and others, the average board and care home provided fewer skilled and rehabilitative services, less routine monitoring, assessment and care planning, and less nursing and restorative care than nursing homes. The fact that less than a quarter of the board and care homes had a full- or part-time RN or LPN on staff emphasizes the difference in services. Furthermore, most board and care homes, as noted, were unable or unwilling to provide nursing services for an illness that lasted longer than 14 days, and a substantial proportion reported being unable to handle even a temporary need for nursing care.
Section 4: Operator Characteristics
4.1 Demographic Profile
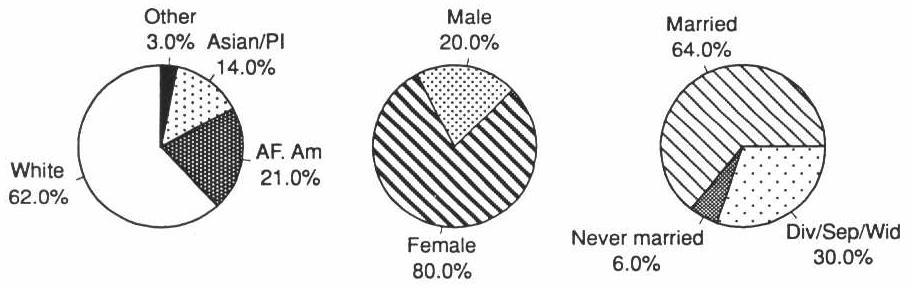
Operators tended to be female (80 percent), white (62 percent), and married (64 percent). However, African Americans and Asian Americans made up a significant percentage of the operators, 21 and 14 percent, respectively (Exhibit 4-1). The demographic profiles of operators in licensed and unlicensed facilities were virtually the same.
As shown in Exhibit 4-2, the educational background of operators in licensed homes was very similar to that of their unlicensed home counterparts. However, operators in licensed extensively regulated homes and those in comparable homes in States with limited regulation had very different educational backgrounds. Operators of licensed homes in extensively regulated States were better educated and more likely to have had prior experience in health care and training before becoming an operator than was true of operators in licensed homes in States with limited regulation. Almost one-fourth of the operators in the limited States had not completed high school compared to 13 percent of those in the extensively regulated States. Only 22 percent of operators in the limited regulated States has completed college, while almost one-third of those in the extensively regulated States were college graduates.
EXHIBIT 4-1. Operator Demographic Profile
| EXHIBIT 4-2. Operator Training and Experience | ||||||||||||
|---|---|---|---|---|---|---|---|---|---|---|---|---|
| Total Population | Licensed Homes | Licensed Homes | Unlicensed Homes | |||||||||
| Extensive States | State with Limited Regs | |||||||||||
| % | SE | % | SE | % | SE | pa | % | SE | % | SE | pb | |
| Previously worked in health care sector | 72 | 3.7 | 77 | 3.4 | 59 | 4.8 | c | 73 | 3.7 | 51 | 9.7 | c |
| Received training prior to operating the home | 67 | 2.1 | 70 | 3.8 | 57 | 4 | 67 | 2.1 | 57 | 6.4 | ||
| Education | d | c | ||||||||||
| Less than high school | 11 | 3.4 | 13 | 2.4 | 23 | 4 | 15 | 3.6 | 22 | 5.7 | ||
| High school or vocational education | 18 | 2.0 | 16 | 2.5 | 22 | 3.6 | 23 | 2.9 | 26 | 5.5 | ||
| Some college | 37 | 4.0 | 38 | 3.6 | 34 | 4.7 | 32 | 5.5 | 25 | 5.8 | ||
| 4-year college graduate | 18 | 3.2 | 20 | 2.5 | 9 | 2 | 18 | 3.3 | 9 | 2.7 | ||
| Postgraduate | 13 | 1.9 | 12 | 2.7 | 13 | 3.5 | 12 | 1.9 | 18 | 5.2 | ||
| ||||||||||||
4.2 Training and Experience
An overwhelming majority of operators (72 percent) reported having prior experience in the health care sector. Almost 70 percent of the operators received training on operating a board and care home and caring for residents before becoming an operator (Exhibit 4-2).
Operator training, however, differed considerably for licensed homes by whether it was in an extensively regulated State or not. Seventy percent of operators in the extensively regulated States were trained prior to becoming a board and care operator compared to 57 percent of those in States with limited regulations.
EXHIBIT 4-3. Prior Health Care Experience of Operators by Facility Licensure Status and Size
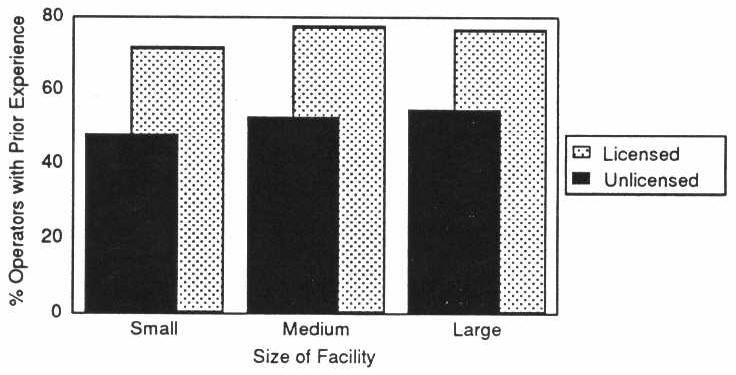
There were also differences between licensed and unlicensed homes in operators’ prior health care experience (Exhibit 4-3). Operators of small licensed homes were much more likely to have previously worked in health care institutions (e.g., nursing home, hospital, home health agency) than operators in small unlicensed homes. This pattern persisted across all sizes of licensed and unlicensed homes.
4.3 Personal Income
There was wide disparity in personal income reported by board and care operators. About one-fourth of the operators reported a total annual income from all sources less than $15,000. Conversely, slightly more than one-fourth reported income over $50,000 as shown in Exhibit 4-4.
| EXHIBIT 4-4. Operator Personal Income | ||
|---|---|---|
| % | SE | |
| <$7,000 | 6 | 2.0 |
| $7,000-14,999 | 20 | 1.7 |
| $15,000-24,999 | 16 | 1.6 |
| $25,000-49,999 | 31 | 2.7 |
| $50,000-75,000 | 15 | 1.4 |
| >$75,000 | 13 | 3.3 |
Section 5: Staff Characteristics
We interviewed 1,138 staff members of board and care homes. Of these staff members, about one-third were facility operators who provided direct care to residents (70 percent of all operators), thus they also completed the operator questionnaires. We will refer to these as “direct care” operators in this discussion to distinguish them from other staff.
5.1 Demographics
5.1.1 Age
Almost half of the board and care home staff members (47 percent) were between the ages of 35 and 54. Another 29 percent were younger than 35, including 10 percent who were younger than 25. Only 6 percent were 65 or older. The mean age of staff in board and care homes was 43 (Exhibit 5-1).
Licensed facilities employed more very young staff members (<25 years of age) than unlicensed facilities (10 vs. 1 percent). Unlicensed facilities employed slightly more elderly staff members than licensed facilities (9 vs. 6 percent).
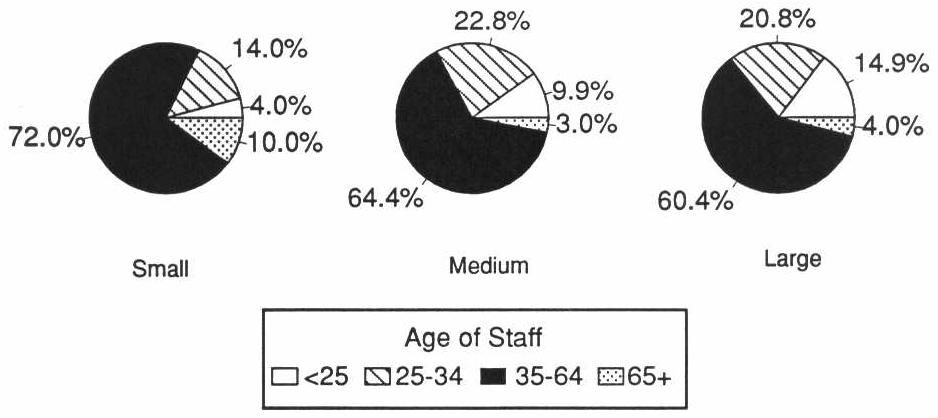
Large facilities employed more young and fewer elderly staff members than small facilities. Large facilities were three times more likely to employ very young staff; 10 percent of staff in small facilities were age 65 or older, compared with only 4 percent of staff in large facilities (Exhibit 5-2). The mean age of staff was 41 in large facilities and 47 in small facilities.
5.1.2 Race, Ethnicity, and Gender
Board and care staff were primarily white (62 percent) and overwhelmingly female (90 percent). Only 11 percent of the board and care home staff members were Hispanic. There was virtually no difference between the racial/ethnic staff distributions by licensure size. Staffing characteristics, however, did differ by size of the home. Large facilities employed more white staff members than small facilities (72 vs. 53 percent), while small facilities employed more Asians or Pacific Islanders than large facilities (18 vs. 3 percent).
5.2 Education, Training, and Experience
5.2.1 Education
Direct Care Operators. Twenty-five percent of the direct care operators had at least a college degree. Another 38 percent attended vocational or trade school, had some college, or were 2-year college graduates. About one-fifth (21 percent) were high school graduates. Perhaps the most disturbing fact was that 17 percent of these operators were not high school graduates (see Exhibit 5-3). There was no difference in the educational background of staff by facility licensure status.
| EXHIBIT 5-1. Demographics of Staff in Board and Care Homes by Licensure Status of Home | |||||||
|---|---|---|---|---|---|---|---|
| Licensed | Unlicensed | Significance Level | Total | ||||
| % | SE | % | SE | % | SE | ||
| Age | a | ||||||
| <25 | 10 | 2.1 | 1 | 0.9 | 10 | 2.1 | |
| 25-34 | 19 | 1.9 | 29 | 5.3 | 19 | 1.8 | |
| 35-44 | 28 | 1.6 | 19 | 7.6 | 27 | 1.6 | |
| 45-54 | 19 | 3.3 | 27 | 5.7 | 20 | 3.2 | |
| 55-64 | 19 | 1.5 | 15 | 3.0 | 19 | 1.5 | |
| 65+ | 6 | 0.9 | 9 | 1.2 | 6 | 0.9 | |
| Mean Age | 43 | 0.6 | 45 | 0.9 | 43 | 0.6 | |
| Race | NS | ||||||
| White | 63 | 4.1 | 56 | 5.2 | 62 | 4.0 | |
| African American | 21 | 3.1 | 36 | 3.9 | 22 | 2.9 | |
| Asian or Pacific Islander | 10 | 5.2 | 2 | 1.0 | 10 | 5.0 | |
| American Indian or Alaskan Native | 1 | 0.7 | 2 | 1.6 | 1 | 0.7 | |
| Other | 5 | 1.9 | 5 | 2.9 | 5 | 1.8 | |
| Hispanic | NS | ||||||
| Yes | 11 | 2.3 | 10 | 5.2 | 11 | 2.3 | |
| No | 89 | 2.3 | 90 | 5.2 | 89 | 2.3 | |
| Gender | NS | ||||||
| Female | 90 | 1.9 | 83 | 6.3 | 90 | 1.9 | |
| Male | 10 | 1.9 | 17 | 6.3 | 11 | 1.9 | |
NS = Not significant.
| |||||||
Operators of small board and care facilities were less likely to be well educated than those in large board and care facilities, with 43 percent of operators of small facilities having a high school education or less, compared with 20 percent or more in large facilities. Over 80 percent of operators in large homes had some post-high school education compared to slightly over half of the small home operators (see Table B-1).
EXHIBIT 5-2. Age of Staff in Board and Care Homes by Facility Size
Staff. Almost half (48 percent) of the staff members in board and care facilities who were not direct care operators attended vocational or trade school, some college, or were 2-year college graduates. Another 23 percent were high school graduates. Seventeen percent had less than a high school education and 12 percent had at least a 4-year college degree (Exhibit 5-3).
Similar to the educational patterns observed for direct care operators, staff members in large facilities were more likely to have attended vocational or trade school, have some college, or be 2-year college graduates than those in small facilities (59 vs. 37 percent). Small facilities have more nonoperator staff members with a high school education or less as well as more with a 4-year college degree or more than do large facilities (43 vs. 33 percent, and 21 vs. 9 percent, respectively) (see Table B-4).
| EXHIBIT 5-3. Education of Direct Care Operators and Staff in Board and Care Homes by Licensure Status of Home | |||||||
|---|---|---|---|---|---|---|---|
| Licensed | Unlicensed | Significance Level | Total | ||||
| % | SE | % | SE | % | SE | ||
| Direct Care Operators | NS | ||||||
| 8th grade or less | 4 | 1.2 | 3 | 1.9 | 4 | 1.2 | |
| Some high school | 12 | 3.3 | 14 | 4.6 | 13 | 3.1 | |
| High school grad/GED | 20 | 1.8 | 35 | 16.1 | 21 | 1.8 | |
| Vocational or trade/technical school | 4 | 3.0 | 5 | 2.1 | 4 | 2.8 | |
| Some college or 2-year college grad | 34 | 6.4 | 20 | 6.3 | 34 | 6.2 | |
| 4-year college grad | 18 | 3.9 | 8 | 3.1 | 17 | 3.7 | |
| Postgraduate | 7 | 2.2 | 16 | 6.9 | 8 | 2.0 | |
| Staff | NS | ||||||
| 8th grade or less | 4 | 1.5 | 2 | 1.2 | 4 | 1.5 | |
| Some high school | 13 | 3.3 | 15 | 5.6 | 13 | 3.2 | |
| High school grad/GED | 23 | 1.9 | 38 | 4.5 | 23 | 1.9 | |
| Vocational or trade/technical school | 20 | 6.6 | 6 | 3.9 | 20 | 6.5 | |
| Some college or 2-year college grad | 28 | 2.1 | 30 | 4.0 | 28 | 2.0 | |
| 4-year college grad | 8 | 3.3 | 8 | 4.2 | 8 | 3.2 | |
| Postgraduate | 4 | 1.4 | 3 | 1.7 | 4 | 1.4 | |
| NS = Not significant. | |||||||
5.2.2 Training
Direct Care Operators. About one-fourth of direct care operators were also licensed nurses. Sixteen percent were RNs, and 9 percent were LVNs or LPNs (Exhibit 5-4).
Seventy-seven percent of the direct care operators of board and care homes were trained in caring for the elderly, mentally ill (MI), and/or people with mental retardation or developmental disabilities (MR/DD) as well as in medication management. Eleven percent had been trained in caring for the elderly, MI, and/or MR/DD only, and 1 percent had been trained in medication management only.
Of direct care operators who received training, 43 percent got their training from a combination of sources. Forty percent got their training from a school or State agency only, 3 percent were trained within a board and care home, and 14 percent received their training from some other source.
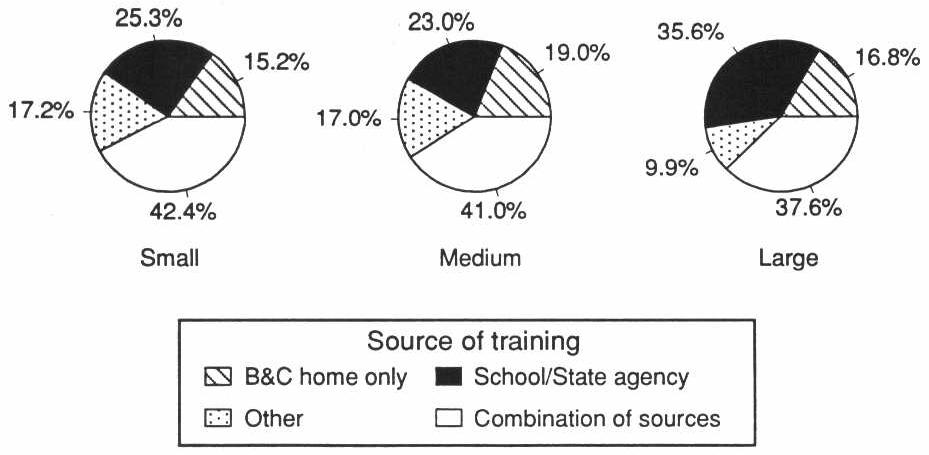
More than two-thirds of the direct care operators of large board and care homes (71 percent) received their training from a school or State agency only as opposed to 36 percent of the operators of small board and care homes. On the other hand, 44 percent of operators of small homes received their training from a combination of sources as opposed to only 20 percent of operators of large homes (Exhibit 5-5).
Staff. Only 20 percent of the staff of board and care homes were licensed nurses. Of those who were licensed, 5 percent were RNs and 15 percent were LVNs or LPNs (Exhibit 5-4).
Almost half of the staff of board and care homes (49 percent) had been trained in caring for the elderly, mentally ill, and/or people with MR/DD, as well as in medication management. Thirty-nine percent had been trained in caring for the elderly, MI, and/or MR/DD only, and 2 percent had been trained in medication management only. Approximately one-tenth (10 percent) had none of the above-mentioned training.
Of board and care staff who received training, 40 percent got their training from a combination of sources, 30 percent got their training from a school or State agency only, 17 percent were trained within a board and care home, and 13 percent received their training from some other source.
Staff in large facilities are more likely than those in small facilities to have received their training from a school or State agency only (36 vs. 25 percent), while staff in small facilities are more likely than those in large facilities to have received their training from a source other than a board and care home, school, or State agency (17 vs. 10 percent) (Exhibit 5-6).
| EXHIBIT 5-4. Training of Staff in Board and Care Homes | ||||
|---|---|---|---|---|
| Direct Care Operators | Staff | |||
| % | SE | % | SE | |
| Not RN, LVN, or LPN | 76 | 5.6 | 80 | 4.3 |
| RN | 16 | 4.3 | 5 | 1.7 |
| LVN or LPN | 9 | 2.1 | 15 | 3.6 |
| Training in ... | ||||
| Caring for the elderly, mentally ill, and/or people with MR/DD only | 11 | 1.6 | 39 | 3.7 |
| Medication management only | 1 | 0.7 | 2 | 0.6 |
| Caring for the elderly, MI, and/or MR/DD, and medication management | 77 | 2.0 | 49 | 2.1 |
| None of the above | 11 | 2.6 | 10 | 2.1 |
| Training from ... | ||||
| Board and care home only | 3 | 1.2 | 17 | 4.5 |
| School or State agency only | 40 | 7.6 | 30 | 5.0 |
| Other source only | 14 | 3.8 | 13 | 2.1 |
| Combination of sources | 43 | 5.9 | 40 | 3.0 |
EXHIBIT 5-5. Source of Training of Direct Care Operators by Facility Size

EXHIBIT 5-6. Source of Training of Board and Care Staff by Facility Size
5.3 Experience
5.3.1 Work Schedule
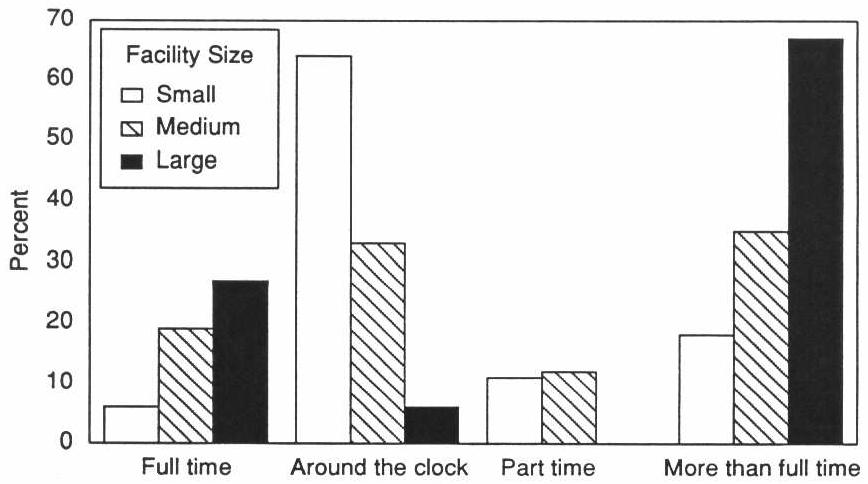
More than half of the direct care operators (54 percent) reported working around the clock with an additional 9 percent working more than 60 hours per week (Exhibit 5-7). Only 11 percent worked 40 hours per week and another 11 percent worked part time. The mean number of hours worked per week specified by those operators who did not work 40 hours per week or around the clock was 54.
Direct care operators of small facilities were much more likely to work around the clock than operators of large facilities (64 vs. 6 percent), perhaps indicative of a small family-run facility. Conversely, operators of large facilities were more likely to work 40 hours per week than those in small facilities (27 vs. 6 percent) (Exhibit 5-8).
On the other hand, board and care staff members usually worked 40 hours per week or less with almost the same percentage working part time as full time (39 and 34 percent, respectively). Only 10 percent reported working around the clock. The mean number of hours worked per week by staff who did not work 40 hours or around the clock was 37 (Exhibit 5-9).
In large facilities, 45 percent of staff worked 40 hours per week compared to 20 percent of those in small facilities. On the other hand, 33 percent of staff in small facilities reported working around the clock as opposed to only 1 percent of staff in large facilities. In addition, 19 percent of the staff in small facilities reported working more than 60 hours per week as opposed to virtually none in large facilities.
5.3.2 Length of Employment
Relevant experience of direct care operators varied immensely. While half of direct care operators had more than 5 years of board and care operating experience, 15 percent of these operators were relatively new to the board and care field with less than 2 years of experience (Exhibit 5-7). In contrast to these operators, other board and care staff had a much greater turnover rate. Over one-third of staff (35 percent) had worked in their current facility for less than 1 year (Exhibit 5-9), perhaps indicating a rapid turnover of board and care staff and little change from the trends observed in previous research. In looking at board and care facilities that served a primarily elderly population, Dittmar and Smith (1983) reported that the mean length of employment was less than 1 year in about one-third of the facilities. It is important to note that, since Dittmar and Smith reported average staff length of employment as a facility characteristic and this study measured length of employment as a characteristic of each staff respondent, we cannot make direct comparisons between the two measures but can only use them as indicators for a similar trend.
| EXHIBIT 5-7. Experience of Direct Care Operators in Board and Care Homes | ||
|---|---|---|
| Direct Care Operators | ||
| % | SE | |
| Length of time as operator of a board and care home | ||
| <2 years | 15 | 4.2 |
| 2-5 years | 35 | 4.3 |
| 5-10 years | 26 | 3.7 |
| >10 years | 24 | 3.0 |
| Mean length of time in years | 7 | 0.5 |
| Hours worked/week | ||
| 40 hours/week | 11 | 3.0 |
| Around the clock | 54 | 6.7 |
| Other (see below) | 36 | 7.9 |
| “Other” hours worked/week | ||
| 1-39 | 11 | 5.6 |
| 41-60 | 17 | 5.8 |
| 61-80 | 3 | 5.1 |
| 81-100 | 3 | 2.5 |
| 100+ | 3 | 2.2 |
| Mean “other” hours worked/week | 54 | 2.0 |
Although many staff members remained within a facility for relatively short time periods, a substantial proportion of staff and direct care operators reported a longer tenure in their current home. Almost one-fifth of all staff had worked for their current home for more than 5 years and one-fourth of direct care operators had over 10 years of experience.
About half of the staff in small facilities had been working at the same home from 1 to 5 years, compared to 40 percent of the staff in large facilities. Conversely, 40 percent of the staff in large facilities were relatively new (i.e., worked in facility for less than 1 year) as opposed to 34 percent of small facility staff (see Table B-2).
EXHIBIT 5-8. Work Schedule of Direct Care Operators by Facility Size
| EXHIBIT 5-9. Experience of Staff in Board and Care Homes | ||
|---|---|---|
| Staff | ||
| % | SE | |
| Length of time worked in this home | ||
| <1 month | 3 | 1.0 |
| 1-6 months | 14 | 1.9 |
| 6 months-1 year | 18 | 2.7 |
| 1-5 years | 45 | 1.4 |
| 5-10 years | 13 | 2.1 |
| >10 years | 7 | 1.1 |
| Mean length of time in years | 3 | 0.2 |
| Hours worked/week | ||
| 40 hours/week | 39 | 3.3 |
| Around the clock | 10 | 3.4 |
| Other (see below) | 51 | 5.1 |
| “Other” hours worked/week | ||
| 1-39 | 34 | 5.7 |
| 41-60 | 14 | 4.6 |
| 61-80 | 2 | 0.9 |
| 81-100 | 1 | 1.3 |
| 100+ | .5 | 0.5 |
| Mean “other” hours worked/week | 37 | 1.9 |
5.3.3 Duties
Personal care of residents, assisting residents with social and recreational activities, and medication supervision and management were the duties most commonly performed by board and care home staff members, with 93, 81, and 81 percent of the staff members, respectively, indicating they did so. Over two-thirds of the staff members (70 percent) reported passing medications to residents, and about two-thirds (65 percent) said that assisting residents in getting to places outside the home was one of their duties. Over half of the staff members included housekeeping and laundry in their duties; half cooked; and over one-fourth did maintenance, repairs, or yard work. Only 17 percent of the staff members reported giving shots or injections to the residents (Exhibit 5-10).
| EXHIBIT 5-10. Duties of Staff in Board and Care Homes | ||
|---|---|---|
| Total | ||
| % | SE | |
| Percentage of staff who... | ||
| Give shots | 17 | 3.2 |
| Pass medications | 70 | 6.2 |
| Percentage of staff whose duties include... | ||
| Housekeeping | 61 | 9.7 |
| Cooking | 50 | 8.4 |
| Laundry | 61 | 7.3 |
| Maintenance, repairs, yard work | 28 | 5.3 |
| Assisting residents with social/recreational activities | 81 | 1.3 |
| Driving/escorting residents outside home | 65 | 3.4 |
| Medication supervision/management | 81 | 2.7 |
| Personal care of resident | 93 | 1.1 |
Staff members in licensed facilities were more likely than those in unlicensed facilities to have certain duties in the homes, namely medication supervision and/or management (82 vs. 65 percent) and personal care of residents (94 vs. 74 percent).
Staff in small facilities tended to have a wider range of responsibilities. The vast majority of staff members were responsible for many of the duties in the home including medication supervision and/or management (93 percent), housekeeping (92 percent), cooking (91 percent), assisting residents with social and recreational activities (90 percent), laundry (88 percent), and passing medications (85 percent). In large facilities, these same duties are the responsibility of only 70, 27, 8, 69, 31, and 53 percent of the staff, respectively. In addition, over half of the staff members in small facilities (54 percent) did maintenance, repairs, and yard work as compared to only 6 percent of those large facilities (Exhibit 5-11).
5.4 Duties and Training
Only half of the staff members in board and care homes who gave shots were LVNs or LPNs, and another one-fifth were RNs. Over one-fourth of the staff members in board and care homes who gave shots were not licensed nurses (28 percent). The vast majority of staff members who gave shots (86 percent) had training in caring for the elderly, mentally ill, and/or people with mental retardation and developmental disabilities as well as medication management, while 10 percent had training in caring for the elderly, MI, and/or MR/DD only (Exhibit 5-12).
| EXHIBIT 5-11. Duties of Staff in Board and Care Homes by Size of Home | |||||||||
|---|---|---|---|---|---|---|---|---|---|
| Small | Medium | Large | Significance Level | Total | |||||
| % | SE | % | SE | % | SE | % | SE | ||
| Percentage of staff who... | |||||||||
| Give shots | 13 | 4.5 | 15 | 3.2 | 21 | 6.0 | NA | 17 | 3.2 |
| Pass medications | 85 | 4.5 | 77 | 4.8 | 53 | 3.6 | a | 70 | 6.2 |
| Percentage of staff whose duties include... | |||||||||
| Housekeeping | 92 | 2.1 | 70 | 5.2 | 27 | 10.2 | b | 61 | 9.7 |
| Cooking | 91 | 1.4 | 56 | 5.4 | 8 | 4.0 | a | 50 | 8.4 |
| Laundry | 88 | 2.2 | 68 | 4.5 | 31 | 5.8 | b | 61 | 7.3 |
| Maintenance, repairs, yard work | 54 | 4.4 | 24 | 3.1 | 6 | 2.6 | a | 28 | 5.3 |
| Assisting residents with social/ recreational activities | 90 | 2.0 | 88 | 2.8 | 69 | 3.2 | b | 81 | 1.3 |
| Driving/escorting residents outside home | 78 | 2.2 | 60 | 4.6 | 57 | 9.4 | NS | 65 | 3.4 |
| Medication supervision/ management | 93 | 1.8 | 82 | 3.0 | 70 | 5.2 | a | 81 | 2.7 |
| Personal care of resident | 94 | 1.8 | 87 | 5.2 | 97 | 1.0 | NS | 93 | 1.1 |
NS = Not significant.
| |||||||||
In terms of passing medications, 73 percent of the staff members who claimed this responsibility were not licensed nurses; 18 percent were LVNs or LPNs and only 10 percent were RNs. As with giving shots, 72 percent of those staff members who passed medications were trained in both caring for the elderly, MI, and/or MR/DD only. Almost 10 percent of staff who passed medications had none of the above-mentioned training.
5.5 Salary
5.5.1 Direct Care Operators
Almost half of the direct care operators of board and care homes (49 percent) earned between $15,000 and $49,999 annually; 26 percent earned less than $15,000, and 25 percent earned $50,000 or more annually. There were no significant differences between operator salary levels by facility licensure status.
Although 28 percent of the operators of small facilities reported earning less than $15,000 annually, only 7 percent of operators of large facilities reported this salary (Exhibit 5-13). However, more operators of small facilities than large facilities reported incomes greater than $75,000 annually (12 vs. 2 percent).
5.5.2 Staff
Almost half of staff members (46 percent) reported earning between $5.01 and $9.00 per hour; 33 percent earned between $3.00 and $5.00; and 22 percent reported earning more than $9.00 per hour. Staff in licensed and unlicensed homes received similar salaries.
Staff in large facilities appear to be somewhat better paid than their counterparts in small facilities: 18 percent reported earning more than $11.00 per hour as opposed to 8 percent of staff in small facilities. In addition, twice as many staff in small facilities as in large facilities reported earning between $3.00 and $4.00 per hour (14 vs. 7 percent).
The majority of staff members of board and care homes (83 percent) did not receive room and board as part of their pay. About half of the staff in small facilities, (49 percent) received room and board as part of their pay, while only 3 percent of staff in large facilities received room and board as part of their pay.
| EXHIBIT 5-12. Duties and Training of Staff in Board and Care Homes | ||||||||||
|---|---|---|---|---|---|---|---|---|---|---|
| Duties | ||||||||||
| Give Shots | Significance Level | Pass Medications | Significance Level | |||||||
| Yes | No | Yes | No | |||||||
| % | SE | % | SE | % | SE | % | SE | |||
| Not RN, LVN, or LPN | 28 | 12.8 | 89 | 2.6 | NS | 73 | 5.6 | 92 | 2.2 | NS |
| RN | 21 | 4.2 | 5 | 2.0 | 10 | 2.6 | 2 | 1.0 | ||
| LVN or LPN | 51 | 11.8 | 6 | 0.8 | 18 | 4.6 | 6 | 2.3 | ||
| Training in... | a | a | ||||||||
| Caring for the elderly, mentally ill, and/or people with MR/DD only | 10 | 5.6 | 37 | 4.1 | 17 | 2.7 | 69 | 3.1 | ||
| Medication management only | 1 | 0.8 | 2 | 0.4 | 2 | 0.6 | 0 | 0.1 | ||
| Caring for the elderly, MI, and/or MR/DD, and medication management | 86 | 4.5 | 49 | 3.6 | 72 | 2.3 | 18 | 3.2 | ||
| None of the above | 2 | 1.3 | 12 | 1.7 | 9 | 1.7 | 13 | 4.6 | ||
NS = Not significant.
| ||||||||||
| EXHIBIT 5-13. Salary of Staff in Board and Care Homes by Size of Home | |||||||||
|---|---|---|---|---|---|---|---|---|---|
| Small | Medium | Large | Significance Level | Total | |||||
| % | SE | % | SE | % | SE | % | SE | ||
| Direct Care Operators (annual salary) | b | ||||||||
| <$7,000 | 4 | 1.6 | 6 | 3.8 | 0 | 0.0 | 5 | 1.8 | |
| $7,000-$14,999 | 24 | 2.7 | 17 | 5.0 | 7 | 4.6 | 21 | 2.4 | |
| $15,000-$24,999 | 19 | 2.9 | 12 | 4.6 | 12 | 5.5 | 17 | 1.9 | |
| $25,000-$49,999 | 29 | 4.7 | 33 | 8.6 | 62 | 11.6 | 32 | 4.0 | |
| $50,000-$75,000 | 12 | 3.8 | 8 | 5.2 | 18 | 7.1 | 11 | 3.1 | |
| >$75,000 | 12 | 4.4 | 24 | 11.4 | 2 | 1.6 | 14 | 5.0 | |
| Staff (hourly salary) | a | ||||||||
| $3.00-$4.00 | 14 | 3.6 | 7 | 2.2 | 7 | 2.5 | 8 | 1.4 | |
| $4.01-$5.00 | 20 | 2.3 | 31 | 5.3 | 23 | 4.4 | 25 | 2.9 | |
| $5.01-$7.00 | 32 | 3.3 | 29 | 4.0 | 30 | 6.4 | 30 | 4.2 | |
| $7.01-$9.00 | 22 | 4.0 | 13 | 3.3 | 15 | 2.3 | 16 | 1.5 | |
| $9.01-$11.00 | 3 | 1.5 | 11 | 2.8 | 7 | 2.3 | 7 | 2.0 | |
| $11.01-$15.00 | 5 | 1.8 | 6 | 1.6 | 16 | 4.6 | 12 | 3.3 | |
| >$15.00 | 3 | 2.0 | 4 | 1.2 | 2 | 0.8 | 3 | 0.6 | |
| Room and board as part of pay (staff) | a | ||||||||
| Yes | 49 | 7.1 | 17 | 6.3 | 3 | 1.3 | 17 | 5.5 | |
| No | 51 | 7.1 | 83 | 6.3 | 97 | 1.3 | 83 | 5.5 | |
| |||||||||
Section 6: Resident Characteristics
In this section we use data from personal interviews with 3,257 residents in 510 board and care facilities to provide an overview of resident characteristics. We first consider demographic characteristics such as age, gender, and marital status. We next provide a summary of financial support available to the residents. Section 6.3 and Section 6.4 describe the prevalence of mental, cognitive, and functional impairment among board and care residents. The following sections look at physical status and the use of health care services. We also examine the social interactions of residents and their satisfaction with the board and care environment.
| EXHIBIT 6-1. Resident Demographic Characteristics | |||
|---|---|---|---|
| Total Residents (%) | Previous Studies | ||
| DRIa (%) | SSAb (%) | ||
| Age | |||
| 18-64 | 22 | 28 | Excluded |
| 65-74 | 14 | 22 | 68 |
| 75-84 | 30 | 38 | 18 |
| 85+ | 34 | 24 | |
| Average age | 75 | NA | NA |
| Length of Stay | |||
| Average years in facility | 2.8 | NA | NA |
| Race/Ethnicity | |||
| White | 91 | 86 | NA |
| African American | 7 | 14 | NA |
| Hispanic | 5 | NA | NA |
| Gender | |||
| Female | 66 | 58 | 67 |
| Male | 34 | 42 | 33 |
| Marital Status | |||
| Married | 13 | 6 | 6 |
| Divorced, widowed, separated | 68 | 58 | 63 |
| Never married | 19 | 36 | 31 |
NA = Not available.
| |||
6.1 Demographic Characteristics
6.1.1 Age
As show in Exhibit 6-1, most residents were among the “old old,” with approximately one-third age 85 and older and another 30 percent age 75 to 84 years. Indeed, the average age of the residents was 75 years. Residents residing in the extensively regulated States tended to be older (77 years) than those living in homes in States with limited regulations (71 years). Residents in licensed homes were slightly younger than residents in unlicensed homes (Exhibit 6-2).
Further, the residents in this study were older than those described in studies from the early to mid-1980s. The Denver Research Institute (DRI) study found that only 38 percent of residents of similar homes were 75 or older (Dittmar and Smith, 1983). Similarly, Sherwood and her colleagues excluded nonelderly residents and still found only 42 percent of the study residents were 75 or older (Mor et al., 1986).
EXHIBIT 6-2. Age Distribution of Residents by Facility Licensure Status
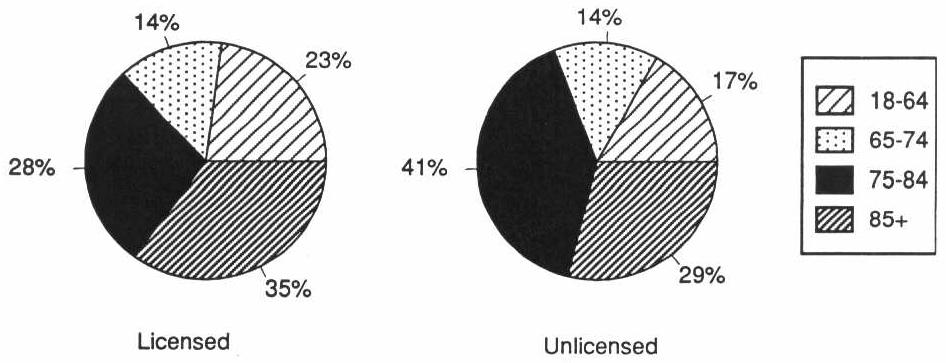
6.1.2 Race, Gender, and Marital Status
The board and care resident population was overwhelmingly white (91 percent), non-Hispanic (95 percent), female (66 percent), and widowed, divorced, or never married (87 percent). This population profile remains virtually unchanged from that described in the earlier board and care studies (Dittmar and Smith, 1983).
6.2 Financial Support
Residents use varying sources of funds to pay for board and care and the services they receive, with many residents having more than one payment source (Exhibit 6-3). Because SSI is widely thought to be one of the primary sources of income for residents in board and care facilities, it is surprising that less than one-third of the residents were SSI recipients. The fact that we limited study participation to facilities that served a mixed or primarily elderly population can perhaps partially explain this. SSI is an assistance program targeted to the disabled population. This younger disabled population would be more likely to reside in facilities that primarily serve mentally retarded/developmentally disabled or mentally ill residents rather than those included in this study. Because more than three-fourths of the residents were over 65, it is not surprising that a vast majority (90 percent) of the residents reported receiving Social Security income and being Medicare beneficiaries.
More residents in licensed extensively regulated facilities were Medicare beneficiaries and Social Security recipients than were residents of licensed homes in States with more limited regulations. Many of these differences are attributable to the fact that, on average, residents of licensed extensively regulated Stats were almost 6 years older than their counterparts in States with limited regulation.
Consistent with this finding is the fact that licensed home residents were more likely to have Medicaid coverage and to be SSI recipients than were those in unlicensed homes, regardless of size.
| EXHIBIT 6-3. Resident Financial Support | ||||||||||||
|---|---|---|---|---|---|---|---|---|---|---|---|---|
| Sources of Financial Support | Total Population | Licensed Homes | Licensure Status | |||||||||
| Extensively Regulated States | States with Limited Regulation | Licensed Homes | Unlicensed Homes | |||||||||
| % | SE | % | SE | % | SE | pa | % | SE | % | SE | pb | |
| Medicare beneficiary | 85 | 1.3 | 87 | 1.1 | 81 | 2.4 | c | 85 | 1.4 | 84 | 2.9 | |
| Social Security recipient | 86 | 0.9 | 88 | 0.8 | 83 | 1.6 | c | 86 | 1.0 | 87 | 2.7 | |
| Medicaid beneficiary | 34 | 4.7 | 34 | 5.6 | 33 | 8.8 | 37 | 4.9 | 8 | 2.4 | c | |
| SSI recipient | 31 | 4.1 | 31 | 5.0 | 30 | 7.2 | 33 | 4.1 | 8 | 2.2 | d | |
| VA pension recipient | 9 | 1.1 | 9 | 1.4 | 9 | 1.7 | 8 | 1.0 | 16 | 4.3 | C | |
| ||||||||||||
6.3 Mental Status
Disability levels in the area of psychiatric conditions, other than Alzheimer’s and other dementias, were about the same as in the 1980s, with one-third of the residents in the DRI study, as in this study, reporting a mental, emotional, or nervous condition. Similarly, as shown in Exhibit 6-4, the percentage of residents with a diagnosis of mental retardation or developmental disabilities (about 10 percent) is essentially the same.
Exhibit 6-5 compares cognitive and mental status of residents in facilities with different regulatory environments and characteristics. Mental and emotional problems were twice as prevalent among residents in licensed homes than those living in unlicensed facilities. Additionally, there was a substantially larger percentage of mentally retarded/developmentally disabled residents (11 vs. 4 percent) in licensed homes compared to unlicensed homes. Extensively regulated facilities tended to have a smaller percentage of mentally retarded/developmentally disabled residents than homes in States with more limited regulations.
Some of this increase in the average age of residents appears to be attributable to the aging-in-place of persons with psychiatric disorders. Although nearly a third of the residents reported having a mental, emotional, or nervous condition, and 11 percent had a diagnosis of mental retardation/developmental disabilities, only 22 percent of the residents were age 18 to 64.
6.3.1 Use of Psychotropic Medication
Although State licensure often prohibits the administration of medications in board and care, Dittmar and colleagues report that 43 percent of residents needed assistance in taking medications and that 34 percent were taking one or more psychotropic medications, with 50 percent of those on medications taking antipsychotic tranquilizers. Mor et al. (1986) reported that 23 percent of the older residents were taking an antipsychotic agent, 10 percent were taking a tranquilizer, and 9 percent were taking an antidepressant. Fully 32 percent of respondents were taking either an antipsychotic agent or a tranquilizer. Prior history of mental illness was related to taking psychotropic medication (61 vs. 20 percent), and those in large homes were more likely to be taking a psychotropic medication than were similar residents in small homes.
| EXHIBIT 6-4. Comparison of Health and Functional Status of Board and Care Residents: Results of Three Studies | |||
|---|---|---|---|
| Health and Functional Status | Total Population (%) (ASPE, 1993) | DRIa Study (%) (1983) | SSAb Study (%) (1986) |
| Bladder continence | 23 | 7 | 7 |
| Moderate to severe cognitive impairment | 40 | 30 confused | 24 |
| Mental/emotional/nervous condition | 33 | 33 | NA |
| Mental retarded/developmental disability | 11 | 11 | NA |
| Bedfast/chairfast | 7 | 2 | NA |
| Wheelchair | 15 | NA | NA |
| Received help in bathing | 45 | 27 | NA |
| Received help with medications | 75 | 43 | 71 |
NA = Not available.
| |||
Given the level of confusion and disorientation among the board and care residents in our study, the ability of staff to assist residents properly with medications is an important aspect of care and services, especially since residents appear to take as many as 5.6 medications, many of which are prescribed PRN and thus may require staff to make therapeutic decisions (Hartzema et a., 1985).
6.4 Cognitive and Functional Status
6.4.1 Cognitive Impairment
In the early 1980s, Dittmar and Smith (1983) found 30 percent of the residents were “confused,” while Sherwood and colleagues (1981) found 24 percent were cognitively impaired (Exhibit 6-4). A prevalence rate of 40 percent with moderate to severe cognitive impairment in this study indicates a significant increase in cognitive impairment among board and care residents in the past decade.
The difference in cognitive status between residents in licensed and unlicensed homes was substantial. The proportion of residents in licensed homes who were moderately to severely cognitively impaired was over two and a half times greater than that seen in unlicensed homes (42 percent compared to 16 percent).
Similarly, there was a difference in cognitive impairment between residents in homes in extensively regulated States compared to those residing in board and care facilities in States with more limited regulations. Almost half of the residents in extensively regulated States were cognitively impaired, compared to slightly over one-fourth of the residents in homes subjected to limited regulations.
| EXHIBIT 6-5. Resident Mental and Functional Status | |||||||
|---|---|---|---|---|---|---|---|
| Total Population | Licensure Status | ||||||
| Licensed Homes | Unlicensed Homes | ||||||
| % | SE | % | SE | % | SE | pa | |
| Functional Status | |||||||
| Received any help with | |||||||
| Bathing | 46 | 3.6 | 49 | 4.1 | 14 | 2.9 | |
| Dressing | 21 | 2.1 | 22 | 2.4 | 8 | 1.6 | |
| Toileting | 12 | 1.3 | 13 | 1.6 | 4 | 0.9 | |
| Locomotion | 9 | 1.4 | 9 | 1.6 | 4 | 0.8 | |
| Transferring | 8 | 1.1 | 9 | 1.3 | 4 | 0.9 | |
| Eating | 5 | 1.0 | 5 | 1.1 | 3 | 1.0 | |
| Received help with | |||||||
| 0-1 ADLs | 80 | 2.5 | 78 | 2.8 | 93 | 1.7 | |
| 2-3 ADLs | 13 | 2.3 | 14 | 2.5 | 4 | 1.2 | |
| 4-5 ADLs | 7 | 0.7 | 12 | 0.8 | 2 | 0.7 | |
| Cognitive Impairment | b | ||||||
| None | 60 | 3.5 | 58 | 3.9 | 87 | 1.9 | |
| Moderate | 19 | 3.1 | 20 | 3.3 | 9 | 1.7 | |
| Severe | 20 | 2.2 | 22 | 2.5 | 7 | 1.2 | |
| Mental Status | |||||||
| Mental/emotional/nervous condition | 33 | 3.2 | 35 | 3.3 | 17 | 3.2 | b |
| MR/DD | 11 | 2.6 | 11 | 2.8 | 4 | 1.2 | b |
| Incontinence | |||||||
| Any incontinence | 29 | 2.0 | 30 | 2.3 | 19 | 2.2 | b |
| |||||||
6.4.2 Functional Impairments
Exhibit 6-4 and Exhibit 6-5 also summarize the significant levels of functional impairment among residents. Twenty-nine percent of residents were incontinent. Seven percent were bedfast or chairfast, and 15 percent used a wheelchair as a primary model of locomotion. Further, 45 percent of the residents received assistance from another person with bathing. Approximately 20 percent received assistance with dressing, with over one-third of these receiving extensive help or being totally dependent on others do dress them. Nine percent received assistance with locomotion. Nearly 20 percent of the residents received help from another person with two or more activities of daily living (ADLs included dressing, bathing, locomotion, toileting, transferring, and eating).
The differences in physical functioning between residents of homes by licensure status was particularly stark. Residents of licensed homes were more impaired in virtually all ADLs (including incontinence) than were residents of unlicensed homes. On the other hand, probably related to the older age of the licensed extensively regulated sample, those residents were more likely to be incontinent and to have multiple ADL limitations than was the case for residents of licensed homes in limited regulation States.
| EXHIBIT 6-6. Resident Health Status and Health Care Use | ||
|---|---|---|
| Total Population | ||
| % | SE | |
| HEALTH STATUS | ||
| Diabetes | 11 | 0.9 |
| Arthritis/rheumatism | 42 | 1.2 |
| High blood pressure | 28 | 1.5 |
| Asthma | 11 | 1.1 |
| Stroke (past 12 months) | 6 | 0.9 |
| Heart attack (past 12 months) | 3 | 0.7 |
| Other | 19 | 1.0 |
| Fell in past 12 months | 32 | 0.9 |
| Self-rated health | ||
| Poor | 9 | 0.9 |
| Fair | 32 | 2.6 |
| Good | 39 | 1.7 |
| Very good | 15 | 1.9 |
| Excellent | 6 | 0.9 |
| Use of assistive devices | ||
| Dentures | 50 | 2.5 |
| Glasses | 73 | 1.8 |
| Hearing aid | 13 | 1.1 |
| Cane | 19 | 1.6 |
| Walker | 23 | 1.5 |
| Wheelchair | 15 | 1.0 |
| Continence pads | 15 | 2.5 |
| Pressure relieving devices | 6 | 2.0 |
| Urinary catheter | 0 | 0.3 |
| Ostomy | 1 | 0.5 |
| Other | 1 | 0.3 |
| HEALTH CARE USE | ||
| Physician visit in past 12 months | 89 | 1.4 |
| Overnight hospital stay in last 12 months | 32 | 1.1 |
| Number of hospital stays in last 12 months | ||
| 0 | 68 | 1.1 |
| 1 | 20 | 0.9 |
| 2+ | 12 | 1.2 |
| ER treatment in last 12 months | 28 | 2.0 |
| Use of psychotropic drug | 41 | |
| Psychiatric treatment in last 12 months | 30 | 2.0 |
The impairment among residents in this study was much higher than the levels found by Dittmar and Smith (1983) in the DRI study and by Sherwood and her colleagues in their study (Mor et al., 1986; Sherwood et al., 1981). For example, both found only 7 percent of the residents had urinary incontinence, compared to 23 percent in this study. Dittmar and Smith (1983) found only 2 percent of the residents in the elderly/mixed homes were bedfast or chairfast (vs. 7 percent); 27 percent received help in bathing (vs. 45 percent); and 43 percent received help with medications (vs. 75 percent). Surprisingly, the rates of psychotropic drug use were also higher. Forty-one percent of the residents in this study received one or more psychotropic drugs, compared to about one-third of residents in the other two studies.
Although these findings are not directly comparable because none of the studies produced generalizations to the entire population of homes and residents, they probably represent an essentially accurate picture of the increasing age and disability of board and care homes residents. However, we also should note that the age distribution and levels of functional impairment for these study residents were lower than the national estimates produced by the 1987 National Medical Expenditure Survey (NMES). Because the personal care homes included in NMES were restricted to those that provided hands-on assistance with ADLs and also excluded many small categories of homes, this probably explains their somewhat higher estimates of functional impairment in ADLs (Lair and Lefkowitz, 1990).
| EXHIBIT 6-7. Resident Health Status by Facility Licensure Status | |||||
|---|---|---|---|---|---|
| Health Status | Licensure Status | ||||
| Licensed Homes | Unlicensed Homes | ||||
| % | SE | % | SE | pa | |
| Diabetes | 11 | 1.0 | 11 | 1.4 | |
| Arthritis/rheumatism | 41 | 1.0 | 52 | 1.9 | b |
| High blood pressure | 28 | 1.7 | 36 | 1.7 | b |
| Asthma | 11 | 1.2 | 10 | 0.9 | |
| Stroke | 6 | 1.0 | 3 | 0.4 | b |
| Heart attack | 4 | 0.7 | 2 | 0.5 | c |
| Self-rated health | b | ||||
| Poor | 9 | 1.1 | 7 | 1.3 | |
| Fair | 33 | 3.0 | 24 | 1.5 | |
| Good | 39 | 2.0 | 38 | 2.0 | |
| Very good | 14 | 2.2 | 22 | 2.3 | |
| Excellent | 5 | 1.0 | 9 | 1.6 | |
| |||||
6.5 Health Status and Health Care Use
Over one-third of all board and care residents self-report poor or fair health. As shown in Exhibit 6-6, the most prevalent health problem was arthritis/rheumatism, reported by 42 percent of residents. High blood pressure (28 percent), diabetes (11 percent), and asthma, emphysema, or chronic bronchitis (11 percent) were other frequently mentioned health conditions. Overall, residents reported an average of one and one-half health conditions.
The use of assistive devices by board and care residents provides additional insight into their physical status. Almost one-fourth of residents reported using a walker within the past week. Other assistive devices frequently mentioned were those associated with an over-whelming elderly population such as glasses (73 percent), dentures (50 percent), hearing aid (13 percent), and cane (19 percent). Although more intrusive devices such as a urinary catheter or ostomy were rarely cited, it is perhaps significant that even 1 percent of the residents reported these, given the lack of medical training of most board and care staff.
Because falls are responsible for many serious injuries to a frail elderly population, the high prevalence rate of falls among board and care residents (32 percent) raises serious concerns.
EXHIBIT 6-8. Resident Health Status by Regulatory Environment and Licensure Status
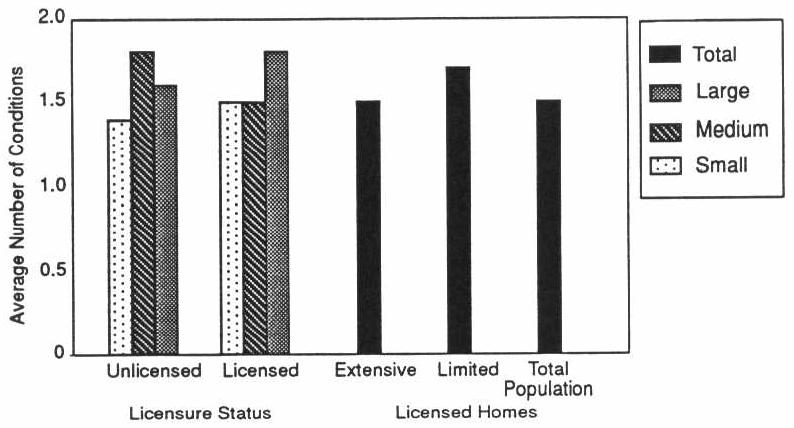
The differences in reported health conditions between residents in licensed homes and those in unlicensed facilities do not give a clear picture that one group of residents is more physically ill than the other (Exhibit 6-7). Although residents in unlicensed facilities were more likely to have chronic conditions such as arthritis/rheumatism and hypertension, licensed home residents were twice as likely to have recently suffered a stroke or heart attack. It is interesting that residents of large licensed homes were more likely to report poor health. On the other hand, the average number of reported health conditions was only greater in small licensed homes (Exhibit 6-8).
6.5.1 Health Care Use
Overall, most board and care residents appear to have access to some type of health care services. Almost 90 percent of residents reported a physician visit within the past year with three-fourths of residents having seen a doctor during the past 3 months (Exhibit 6-6). Additionally, more than one-fourth of the residents received treatment in a hospital emergency room. It is perhaps most disturbing that, although 41 percent of residents used some form of psychotropic medication, only 30 percent reported psychiatric treatment during the preceding 12 months.
Given the prevalence of both chronic and acute health conditions among survey respondents, it is perhaps not surprising that close to a third of all residents were hospitalized for at least one night during the preceding year. Over 10 percent had two or more hospital stays. Despite differences in reported health status, we observed no differences in the hospitalization or emergency room use rates as a function of licensure status, but did observe that residents of large licensed homes were more likely to have received psychiatric treatment and overall more physician visits than their unlicensed counterparts (Exhibit 6-9).
EXHIBIT 6-9. Residents who Received Psychiatric Treatment in the Past 12 Months by Facility Licensure Status
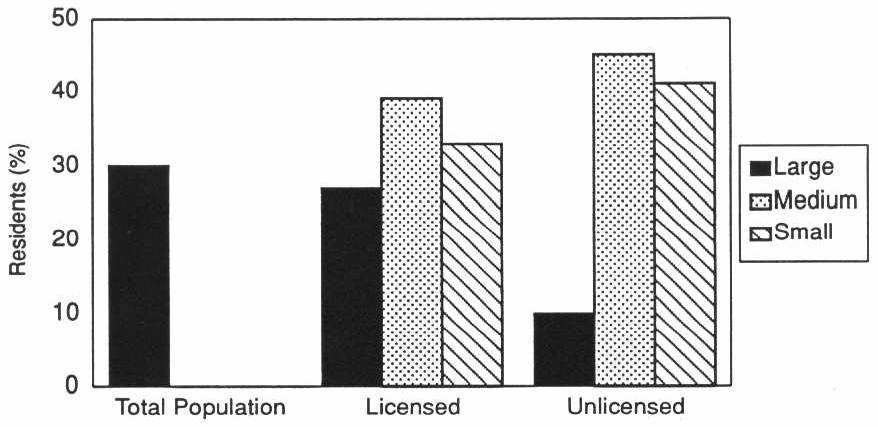
6.6 Social Interactions
Although board and care residents were not totally isolated from their community, family, and friends, they certainly were not an integral part of the community either (Exhibit 6-10). Close to 40 percent of the residents reported that they had not left the home in the past 14 days, with another fourth of the residents having left only one or two times in the past 2 weeks. Given this tendency to remain in the facility, it is not surprising that over a third of the residents would like to have participated in activities outside of the facility more than they did.
Visits with family and friends, either inside or outside the home, during the preceding 30 days were rare for a substantial proportion of the residents. Almost 20 percent of residents had no visits and another 24 percent visited with family or friends only one or two times during this time period. The frequency of telephone contact was very similar except that close to 20 percent of residents reported daily telephone contact compared to only 6 percent reporting daily visits. Lack of telephone contact with family and friends was somewhat higher in mid-sized and large licensed homes than among residents of comparable unlicensed homes (Exhibit 6-11).
Resident activity level within the home provides some insight into the degree to which facility residents interacted with each other. Only 6 percent of residents reported no involvement with facility activities, while over half of the residents were involved in some type of activity either all or most of their waking hours (Exhibit 6-10).
6.7 Resident Satisfaction
Most board and care residents seemed to feel that they are safe and that their needs are adequately met. Overwhelmingly residents who were able to respond for themselves reported that they rarely or never went without needed assistance with activities of daily living (Exhibit 6-12). Less than 5 percent of residents felt that they could use more assistance in dressing, toileting, locomotion, or eating than they received. Additionally, almost all residents reported that they were allowed to make telephone calls in private, that they received their mail unopened, that they were allowed privacy in their own rooms, that they were not required to do chores, and that they feel their possessions are safe.
| EXHIBIT 6-10. Resident Social Interactions | ||
|---|---|---|
| Total Population | ||
| % | SE | |
| Number of times resident left the home in the last 14 days | ||
| None | 36 | 2.8 |
| 1-2 | 25 | 1.0 |
| 3-5 | 14 | 1.2 |
| 6+ | 15 | 1.4 |
| Daily | 11 | 1.3 |
| Number of times the resident visited friends/relatives in past 30 days | ||
| None | 19 | 1.5 |
| 1-2 | 24 | 1.6 |
| 3-5 | 27 | 1.0 |
| 6+ | 23 | 2.5 |
| Daily | 6 | 0.7 |
| Number of times the resident telephoned friends/relatives in past 30 days | ||
| None | 29 | 2.7 |
| 1-2 | 29 | 2.3 |
| 3-5 | 18 | 1.6 |
| 6+ | 17 | 1.2 |
| Daily | 17 | 1.7 |
| Amount of time the resident is involved in activities in the home | ||
| None | 6 | 1.4 |
| Some of the time | 43 | 3.3 |
| Most of the time | 35 | 2.3 |
| All of the time | 16 | 2.8 |
Perhaps the degree to which residents feel secure in their current living situation is represented by their willingness to voice complaints. Close to three-fourths of the residents reported that they were not reluctant at all to express a complaint should they have one. Less than 10 percent felt very constrained to complain. However, it should be noted that only 57 percent would express their concerns to the operator or another staff person. One 2 percent reported that they would confide in an ombudsman or representative from legal aid.
6.8 Psychotropic Drug Use
Approximately 43 percent of board and care residents were prescribed and 41 percent used at least one psychotropic agent, primarily on a routinely scheduled basis. On average, residents were prescribed 0.64 (SE = 0.06) and used 0.59 (SE = 0.05) different psychotropic drugs. While some residents used no psychotropics, others use as many as six. Five percent of residents were prescribed and 4 percent used three or more different psychotropic drugs.
EXHIBIT 6-11. Residents with No Telephone Contact with Friends or Relative in Past 30 Days
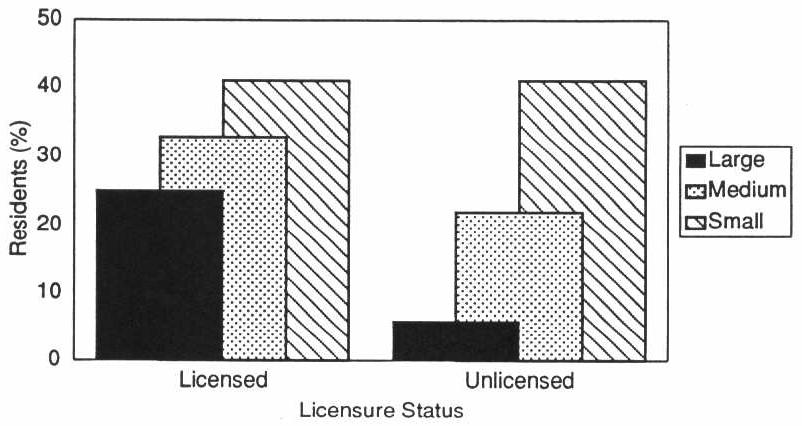
Antipsychotics were prescribed and used by slightly more than one-fifth of the residents with about half of these using such high-potency antipsychotics as fluphenanize and haloperidol. Sixteen percent of the residents used antidepressants, while slightly fewer, 14 percent, used anxiolytics, sedatives, or hypnotics. Half of the residents who used psychotropic drugs did not use mental health services in the previous year; one-fourth of these users had no psychiatric history.
| EXHIBIT 6-12. Resident Satisfaction with Facility Environment | ||
|---|---|---|
| Total Population | ||
| % | SE | |
| Safety of possessionsa | ||
| Not safe | 7 | 1.0 |
| Safe some of the time | 10 | 1.1 |
| Safe all/most of the time | 84 | 1.3 |
| Safety of neighborhooda | ||
| Not safe | 3 | 0.6 |
| Safe some of the time | 10 | 0.9 |
| Safe all/most of the time | 87 | 1.1 |
| Allowed privacy in room | 93 | 1.5 |
| Allowed to make telephone calls in private/do not use phone | 96 | 1.9 |
| Receive mail unopened/do not get mail | 99 | 0.7 |
| Receive inadequate help witha | ||
| Dressing | 4 | 1.2 |
| Toileting | 2 | 0.6 |
| Locomotion | 4 | 2.1 |
| Transferring | 11 | 3.3 |
| Eating | 0 | 0.0 |
| Reluctance to voice a complainta | ||
| Very reluctant | 8 | 0.9 |
| Somewhat reluctant | 18 | 1.1 |
| Not at all reluctant | 73 | 1.6 |
| Would report concerns toa | ||
| Operator/manager | 37 | 3.2 |
| Owner | 10 | 0.9 |
| Other staff member | 10 | 0.8 |
| Ombudsman/legal aid | 2 | 0.5 |
| Other | 21 | 1.6 |
| No one | 3 | 0.5 |
| Chores | ||
| Required to do | 4 | 1.0 |
| Allowed to do | 55 | 4.1 |
| Neither | 38 | 4.1 |
| ||
6.9 the “Niche” Served by Board and Care Homes
It seems clear that board and care residents fall somewhere between nursing home residents and residents of other residential settings with fewer services. In general, board and care home residents are more impaired than residents of congregate apartments, for example (Griffith, personal communication, 1995); however, on average, they are less impaired than nursing home residents. Using data from a comparable time period for approximately 2,100 nursing home residents in 10 States, we found that board and care residents were somewhat younger and, on average, less impaired than nursing home residents in cognition, ADLs, and other areas of functioning (Phillips et al., 1994). For example, 65 percent of nursing home residents received assistance in locomotion, whereas only 9 percent of board and care residents received such assistance. Fifty-eight percent of nursing home residents received hands-on assistance or supervision in eating, while only 6 percent of the board and care residents received such assistance. Nearly two-thirds of nursing home residents had urinary incontinence, while only 23 percent of the board and care residents were incontinent. Slightly more than two-thirds of the nursing home residents had moderate to severe cognitive impairment, but only 40 percent of the board and care residents were similarly impaired. However, there does appear to be some overlap in the two populations. For example, 15 percent of the board and care residents received assistance in three or more ADLs, a level of impairment similar to that experienced by the vast majority of nursing home residents.
| EXHIBIT 6-13. Prevalence of Psychotropic Prescriptions and Use Among Board and Care Facility Residents | ||||
|---|---|---|---|---|
| Drug Class | Prescribed | Any Use | ||
| % | SE | % | SE | |
| Antipsychotics | 22 | 2.9 | 21 | 2.9 |
| Antidepressants | 17 | 0.9 | 16 | 0.7 |
| Anxiolytics, Sedatives and Hypnotics | 17 | 2.2 | 14 | 1.9 |
| Barbiturates | 2 | 0.4 | 2 | 0.4 |
| Benzodiazepines | 13 | 1.8 | 10 | 1.5 |
| Miscellaneous | 4 | 0.7 | 3 | 0.7 |
| Antimanic agents | 4 | 0.7 | 4 | 0.7 |
Thus, according to these data, board and care homes do have a definite long-term care “niche.” The residents they serve place them closer to nursing homes than residential settings such as congregate apartments, even those with enriched supportive services. On the other hand, few board and care home residents are as impaired as the average nursing home resident.
Section 7. References
ABA (American Bar Association). 1983. Board and Care Report: An Analysis of State Laws and Programs Serving Elderly Persons and Disabled Adults. Report to the Department of Health and Human Services. Washington, DC.
Avorn, J., P. Dreyer, K. Connely, and S.B. Soumerai. 1989. Use of psychoactive medication and the quality of care in rest homes. New England Journal of Medicine 320(4):227-232.
Budden, F. 1985. Adverse drug reactions in long-term care facility residents. Journal of the American Geriatrics Society 33:449-450.
Clark, R., J. Turek-Brezina, C. Hawes, and C. Chu. 1994. The supply of board and care homes: Results from the 1990 National Health Provider Inventory. Presentation at the Gerontological Society of America, Atlanta, Georgia. November.
Dittmar, N.D., and G. Smith. 1983. Evaluation of the Board and Care Homes: Summary of Survey Procedures and Findings. Report to the Assistant Secretary for Planning and Evaluation, U.S. Department of Health and Human Services, Denver Research Institute. University of Denver, Denver, Colorado.
Dobkin, L. 1989. The Board and Care System: A Regulatory Jungle. The American Association of Retired Persons, Washington, DC.
DuNah, R., C. Harrington, and B. Bednew. 1993. Variations and Trends in Licensed Nursing Home Capacity in the States, 1978-1992. Institute on Health and Aging, University of California, San Francisco, CA.
GAO (General Accounting Office, United States Congress). 1989. Insufficient Assurances That Residents’ Needs Are Identified and Met. Report to Congressional Requesters.
GAO (General Accounting Office, United States Congress). 1992a. Board and Care Homes: Elderly at Risk from Mishandled Medications. Report to House Subcommittee on Health and Long-Term Care. U.S. Government Printing Office, Washington, DC.
GAO (General Accounting Office, United States Congress). 1992b. Drug Use and Misuse in America’s Board and Care Homes: Failure in Public Policy. Report to House Select Committee on Aging. U.S. Government Printing Office, Washington, DC.
Griffith, J. 1995. Personal Communication on the HUD-sponsored evaluation of the Congregate Housing With Services Program evaluation, Research Triangle Institute, Research Triangle Park, NC.
Hartzema, A.G., N.P. Godbout, S.D. Lee, T.R. Konrad, and F.M. Eckel. 1986. Evaluation of an Educational Intervention to Reduce Medication Administration Errors in Domiciliary Care Facilities. Unpublished manuscript. School of Pharmacy, University of North Carolina, Chapel Hill, NC.
Hartzema, A.G., J.M. McDermott, and T.R. Konrad. 1985. Drug Prescribing Frequencies in Extended Care Facilities. American Pharmaceutical Association Congress, San Antonio, TX.
Hawes, C., J. Wildfire, and L. Lux. 1993. The Regulation of Board and Care Homes: Results of a Survey in the 50 States and District of Columbia--National Summary. American Association of Retired Persons, Washington, DC.
Iannacchione, V., J. Wildfire, L. Lux, and C. Hawes. 1994. Covering the Population of Unlicensed Board and Care Homes: Problems and Solutions. Presented at the American Statistical Association Annual Meeting.
Manard, B., et al. 1990. Methodology for Developing a Comprehensive List of Licensed Board and Care Homes. Unpublished report from Lewin/ICF, Inc., and James Bell Associates to the Office of the Assistant Secretary for Planning and Evaluation, U.S. Department of Health and Human Services, Fairfax, VA.
Moon, M., G. Gaberlavage, and S.J. Newman. 1989. Preserving Independence, Supporting Needs: The Role of Board and Care Homes. American Association of Retired Persons, Washington, DC.
Moos, R.H., and S. Lemke. 1978. Assessing the physical and architectural features of sheltered care setting. Journal of Gerontology 35(4):471-583.
Mor, V., S. Sherwood, and C. Gutkin. 1986. A national study of residential care for the aged. The Gerontologist 26(4):405-417.
Morris, J., B. Fries, D. Mehr, C. Hawes, C. Phillips, V. Mor, and L. Lipsitz. 1994. MDS cognitive performance scale. The Journals of Gerontology: Medical Sciences 49(4):M174-M182.
Newcomer, R.J., and L.A. Grant. 1988. Residential Care Facilities. Understanding Their Role and Improving Their Effectiveness. Policy Paper No. 21. Institute for Health and Aging, University of California at San Francisco.
Phillips, C.D., J.N. Morris, C. Hawes, V. Mor, and B.F. Fries. 1994. The effects of the national nursing home Resident Assessment Instrument (RAI) on resident outcomes. Presentation at the annual meeting of the Gerontological Society of America, Atlanta, GA, November.
Reichstein, K.J., and L. Bergofsky. 1980. Report on the National Survey of STate Administered Domiciliary Care Programs in 50 States and the District of Columbia. Horizon House Institute, New York, NY.
RTI (Research Triangle Institute). 1995. Project Study Methods. Research Triangle Institute. Research Triangle Park, NC.
Sherwood, S., V. Mor, and C. Gutkin. 1981. Volumes 1-3: Domiciliary Care Clients and the Facilities in Which They Reside. Hebrew Rehabilitation Center for Aged, Boston, MA.
Stone, R., and R.J. Newcomer. 1985. The state role in board and care housing. In Long Term Care of the Elderly: Public Policy Issues. C. Harrington, R.J. Newcomer, C.L. Estes (eds.). Sage Publications, Beverly Hills, CA.
U.S. DHHS Inspector General (U.S. Department of Health and Human Services, Office of the Inspector General). 1990. Board and Care. U.S. Department of Health and Human Services, Regional Inspector General for Region II, Office of Evaluation and Inspection, New York, NY.
U.S. House of Representatives, Select Committee on Aging. 1989. Board and Care Homes in America: A National Tragedy. A report by the Chairman of the Subcommittee on Health and Long-Term Care, House of Representatives, Comm. Pub. No. 101-711.
Notes
The Keys Amendments to the Social Security Act (Section 1616[e]) were enacted in 1976 with the goal of preventing Supplemental Security Income (SSI) recipients from being in substandard board and care homes. Under Keys, the States are required to certify to DHHS that all facilities in which significant number of SSI recipients reside meet appropriate standards. GAO (1989) found that the oversight exercised by DHHS is limited, and the sanction for substandard care is rarely used.
Unlicensed homes may be subject to regulatory control of a number of different authorities other than board and care home regulators including health and public safety inspectors, and these agents may impose independent sanctions on unlicensed homes.
Appendixes
The data presented in the appendixes include data discussed in the text of the report, as well as information not previously presented. In Section 3, Section 4, and Section 5 of the report we sometimes reference specific appendix exhibits. We hope that this comprehensive presentation of the descriptive results will provide the reader with an overall picture of board and care facilities, their similarities, and their differences.
Appendix A. Facility Characteristics
Data from the two operator instruments are displayed in the exhibits in Appendix A. Tables A-1 through A-8 summarize board and care facility characteristics by facility licensure status and size. The tables present point estimates (usually percentages) with standard errors. Additionally, we performed chi-square tests for differences between licensed and unlicensed facilities by each size stratum, as well as for the overall effect of licensure.
Tables A-9 through A-16 present data for licensed facilities only. We compare the characteristics of licensed facilities in extensively regulated States to those in States with limited regulations. Percentages, standard errors, and the results of the chi-square tests are presented.
| TABLE A-1. Facility Characteristics by Licensure Status and Home Size: Background | |||||||
|---|---|---|---|---|---|---|---|
| Small | Medium | Large | Overall Effect of Licensure Status Chi-Square (Prob) | ||||
| Licensed Percent (SE) | Unlicensed Percent (SE) | Licensed Percent (SE) | Unlicensed Percent (SE) | Licensed Percent (SE) | Unlicensed Percent (SE) | ||
| OWNERSHIP | |||||||
| For Profit | 84.2 (2.6) | 61.1 (7.4) | 81.1 (4.2) | 69.6 (11.8) | 77.9 (7.0) | 54.0 (11.2) | 14.8 (<0.01) |
| Non-Profit | 15.8 (2.6) | 38.9 (7.4) | 18.9 (4.2) | 30.4 (11.8) | 22.1 (7.6) | 48.0 (11.2) | |
| LL Chi-Sq. | 18.0 | 1.3 | 2.1 | ||||
| LL Probability | (<0.01) | (0.27) | (0.17) | ||||
| ATTACHED TO NURSING HOME | |||||||
| Yes | 0.4 (0.4) | 0.0 (0.0) | 15.2 (5.3) | 7.8 (5.3) | 32.2 (9.3) | 31.6 (10.6) | 1.8 0.20 |
| No | 99.6 (0.4) | 100.0 (0.0) | 84.8 (5.3) | 92.2 (5.3) | 67.8 (9.3) | 68.4 (10.6) | |
| LL Chi-Sq. | --- | 0.8 | 0.0 | ||||
| LL Probability | --- | (0.38) | (0.96) | ||||
| OWNER/FACILITY LIVE IN HOME | |||||||
| Yes | 82.9 (31.1) | 85.1 (3.9) | 23.9 (4.2) | 32.1 (11.2) | 2.5 (1.9) | 14.5 (3.5) | 1.41 (.26) |
| No | 17.1 (3.1) | 14.9 (3.9) | 76.1 (4.2) | 67.9 (11.2) | 97.5 (1.9) | 85.5 (5.5) | |
| LL Chi-Sq. | .15 | .71 | 3.65 | ||||
| LL Probability | (.71) | (.42) | (0.1) | ||||
| AVE. MONTHLY FACILITY | |||||||
| Income/Resident | 1000.1 | 711.9 | 915.6 | 624.9 | 1142.8 | 1270 | <.01* |
| (Average for home) | (79.2) | (44.4) | (23.7) | 85.6 | (72.5) | (136.3) | |
| P-Value of t-Test | .01 | .01 | .37 | ||||
| Occupancy Rate | .79 | .71 | .83 | .82 | .80 | 1.0 | .76* |
| (Average for home) | (0.2) | (.05) | (0.2) | (0.6) | (0.2) | (.10) | |
| P-Value of t-Test | .13 | .95 | .09 | ||||
| * Probability value of regression coefficient for overall licensure effect | |||||||
| TABLE A-2. Facility Characteristics by Licensure Status and Home Size: Resident Case Mix Characteristics | ||||||||||
|---|---|---|---|---|---|---|---|---|---|---|
| Small | Medium | Large | Overall Effect of Licensure Status Chi-Square (Prob) | |||||||
| Licensed Percent (SE) | Unlicensed Percent (SE) | Licensed Percent (SE) | Unlicensed Percent (SE) | Licensed Percent (SE) | Unlicensed Percent (SE) | |||||
| SUMMARY CASE MIX MEASURE | ||||||||||
| Res. w/Beh. Prob. are 90%+ | 22.5 (5.2) | 42.1 (5.2) | 22.5 (4.7) | 41.5 (12.2) | 4.7 (2.5) | 7.0 (4.5) | 3.9 (0.18) | |||
| Elderly Res. are 90%+ | 56.0 (4.9) | 36.8 (3.9) | 45.5 (5.7) | 35.1 (16.6) | 73.4 (8.2) | 87.8 (7.0) | ||||
| Other Resident Mix | 21.5 (1.8) | 21.1 (4.9) | 32.0 (7.9) | 23.4 (12.6) | 21.9 (7.5) | 5.2 (3.7) | ||||
| LL Chi-Sq. | 7.0 | 3.4 | 8.7 | |||||||
| LL Probability | (0.06) | (0.22) | (0.04) | |||||||
| ANY BED FAST RESIDENTS | ||||||||||
| None | 94.3 (2.1) | 94.3 (2.1) | 97.8 (1.7) | 100.0 (0.0) | 94.6 (4.0) | 73.7 (14.5) | 1.2 (0.29) | |||
| Some | 5.7 (2.1) | 5.7 (2.1) | 2.2 (1.7) | 0.0 (0.0) | 5.4 (4.0) | 26.3 (14.5) | ||||
| LL Chi-Sq. | 0.0 | --- | 2.6 | |||||||
| LL Probability | (1.0) | --- | (0.13) | |||||||
| ANY CHAIR FAST RESIDENTS | ||||||||||
| None | 75.3 (3.4) | 76.5 (6.1) | 70.0 (5.4) | 66.6 (9.2) | 48.9 (7.3) | 53.4 (13.0) | 0.8 (0.37) | |||
| Some | 24.7 (3.4) | 23.5 (6.1) | 30.0 (5.4) | 33.4 (9.2) | 51.1 (7.3) | 46.6 (13.0) | ||||
| LL Chi-Sq. | 0.0 | 0.1 | 0.1 | |||||||
| LL Probability | (0.87) | (0.76) | (0.77) | |||||||
| ANY COGNITIVELY IMPAIRED RESIDENTS | ||||||||||
| None | 32.6 (5.2) | 53.7 (11.0) | 24.5 (6.4) | 28.4 (10.3) | 8.8 (4.5) | 14.7 (6.8) | 1.7 (0.22) | |||
| Some | 67.4 (5.2) | 46.3 (11.0) | 75.5 (6.4) | 71.6 (10.3) | 91.2 (4.5) | 85.3 (6.8) | ||||
| LL Chi-Sq. | 3.2 | 0.2 | 0.6 | |||||||
| LL Probability | (0.10) | (0.67) | (0.44) | |||||||
| ANY RESIDENTS WITH ALCOHOL PROBLEMS | ||||||||||
| None | 71.7 (2.8) | 69.6 (8.0) | 26.4 (6.4) | 35.6 (11.4) | 25.1 (5.6) | 19.0 (7.1) | 3.2 (0.10) | |||
| Some | 28.3 (2.8) | 30.4 (8.0) | 73.6 (6.4) | 64.4 (11.4) | 74.9 (5.6) | 81.0 (7.1) | ||||
| LL Chi-Sq. | 0.1 | 0.4 | 0.4 | |||||||
| LL Probability | (0.80) | (0.53) | (0.52) | |||||||
| ANY RESIDENTS WITH DRUG ABUSE | ||||||||||
| None | 92.3 (2.5) | 82.4 (5.0) | 67.9 (3.7) | 66.4 (11.0) | 62.9 (5.3) | 75.6 (10.1) | 2.1 (0.18) | |||
| Some | 7.7 (2.5) | 17.6 (5.0) | 32.1 (3.7) | 33.6 (11.0) | 37.1 (5.3) | 24.4 (10.1) | ||||
| LL Chi-Sq. | 3.6 | 0.0 | 1.0 | |||||||
| LL Probability | (0.08) | (0.90) | (0.34) | |||||||
| ANY HIV+ RESIDENTS | ||||||||||
| None | 100.0 (0.0) | 96.5 (2.2) | 96.1 (3.8) | 85.6 (11.2) | 100.0 (0.0) | 89.6 (5.2) | 4.4 (0.06) | |||
| Some | 0.0 (0.0) | 3.5 (2.2) | 3.9 (3.8) | 14.4 (11.2) | 0.0 (0.0) | 10.4 (5.2) | ||||
| LL Chi-Sq. | --- | 1.1 | --- | |||||||
| LL Probability | --- | (0.32) | --- | |||||||
| ANY MR/DD RESIDENTS | ||||||||||
| None | 68.8 (6.7) | 61.8 (4.6) | 61.6 (6.0) | 69.9 (8.0) | 57.0 (10.3) | 78.2 (7.6) | 0.1 (0.79) | |||
| Some | 31.2 (6.7) | 38.2 (4.6) | 34.4 (6.0) | 30.1 (8.0) | 43.0 (10.3) | 21.8 (7.6) | ||||
| LL Chi-Sq. | 0.6 | 0.6 | 1.8 | |||||||
| LL Probability | (0.47) | (0.47) | (0.21) | |||||||
| ANY RESIDENTS WITH PSYCHIATRIC HISTORY | ||||||||||
| None | 52.0 (3.9) | 34.4 (5.7) | 25.6 (5.9) | 32.5 (17.4) | 16.2 (5.7) | 44.2 (11.2) | 0.9 (0.35) | |||
| Some | 48.0 (3.9) | 65.6 (5.7) | 74.4 (5.9) | 67.5 (17.4) | 83.8 (5.7) | 55.8 (11.2) | ||||
| LL Chi-Sq. | 5.6 | 0.2 | 3.9 | |||||||
| LL Probability | (0.03) | (0.71) | (0.07) | |||||||
| ANY INCONTINENT RESIDENTS | ||||||||||
| None | 43.4 (3.4) | 59.3 (7.1) | 43.7 (3.2) | 56.2 (11.0) | 15.6 (5.7) | 31.7 (12.2) | 4.5 (0.05) | |||
| Some | 56.6 (3.4) | 40.7 (7.1) | 56.3 (3.2) | 43.8 (11.0) | 84.4 (5.7) | 68.3 (12.2) | ||||
| LL Chi-Sq. | 4.5 | 1.2 | 1.5 | |||||||
| LL Probability | (0.05) | (0.30) | (0.24) | |||||||
| PROPORTION OF RESIDENTS 65+ | ||||||||||
| None | 14.1 (3.5) | 28.1 (6.8) | 5.2 (3.2) | 25.9 (8.4) | 0.0 (0.0) | 9.6 (6.7) | 4.2 (0.16) | |||
| Some | 24.1 (1.2) | 22.6 (6.4) | 56.6 (4.0) | 34.8 (13.3) | 72.7 (6.7) | 44.3 (13.4) | ||||
| All | 61.7 (4.2) | 49.2 (4.2) | 38.2 (6.5) | 39.4 (15.8) | 27.3 (6.7) | 46.0 14.9) | ||||
| LL Chi-Sq. | 4.0 | 7.3 | --- | |||||||
| LL Probability | (0.18) | (0.06) | --- | |||||||
| % of Residents >65 Years | 75.1 | 60.2 | 71.6 | 53.8 | 84.5 | 86.2 | 1.63 (.13) | |||
| (Average per home) | 4.4 | 4.6 | 4.3 | 11.9 | 3.9 | 7.0 | ||||
| P-Value of t-Test | .05 | .18 | .85 | |||||||
| % of Residents Chair or Bedfast | 10.9 | 11.6 | 2.9 | 4.6 | 3.7 | 3.5 | .48 (.64) | |||
| (Average for home) | 2.4 | 3.2 | 0.5 | 1.4 | 1.0 | 1.4 | ||||
| P-Value of t-Test | .88 | .48 | .92 | |||||||
| % of Residents Paid for by SSI | 44.8 | 28.4 | 41.4 | 41.4 | 26.6 | 6.8 | 3.16 (.01) | |||
| (Average for home) | 4.0 | 5.2 | 5.2 | 9.6 | 5.3 | 3.3 | ||||
| P-Value of t-Test | 0.5 | 1.0 | .01 | |||||||
| * Probability value of regression coefficient for overall licensure effect | ||||||||||
| TABLE A-3. Facility Characteristics by Licensure Status and Home Size: Facility Rules | ||||||||||
|---|---|---|---|---|---|---|---|---|---|---|
| Small | Medium | Large | Overall Effect of Licensure Status Chi-Square (Prob) | |||||||
| Licensed Percent (SE) | Unlicensed Percent (SE) | Licensed Percent (SE) | Unlicensed Percent (SE) | Licensed Percent (SE) | Unlicensed Percent (SE) | |||||
| RESIDENTS MANAGE OWN MEDICATION | ||||||||||
| None | 4.6 (1.8) | 11.6 (5.6) | 3.3 (2.2) | 17.4 (8.4) | 9.3 (7.3) | 59.5 (12.6) | 23.7 (0.00) | |||
| Some | 95.4 (1.8) | 88.4 (5.6) | 96.7 (2.2) | 82.6 (8.4) | 90.7 (7.3) | 40.5 (12.6) | ||||
| LL Chi-Sq. | 2.0 | 6.0 | 6.8 | |||||||
| LL Probability | (0.18) | (0.03) | (0.02) | |||||||
| FACILITY WILL ADMIT MOBILITY IMPAIRED RES. | ||||||||||
| All Types | 10.0 (4.5) | 21.0 (8.0) | 1.0 (1.1) | 6.5 (5.5) | 0.9 (0.9) | 11.7 (5.2) | 1.4 (0.51) | |||
| Some Types | 41.9 (3.2) | 34.0 (6.2) | 49.4 (8.7) | 45.4 (9.7) | 68.5 (6.1) | 70.8 (8.6) | ||||
| None | 48.1 (5.5) | 45.0 (6.2) | 49.6 (8.8) | 48.1 (8.2) | 30.6 (6.0) | 17.5 (5.0) | ||||
| LL Chi-Sq. | 2.0 | 1.9 | 9.1 | |||||||
| LL Probability | (0.39) | (0.42) | (0.03) | |||||||
| FACILITY WILL DISCHARGE MOBILITY IMPAIRED RES. | ||||||||||
| ALL Types | 39.6 (5.8) | 45.8 (8.1) | 53.1 (8.3) | 34.7 (10.7) | 48.4 (11.2) | 13.7 6.3) | 2.2 (0.36) | |||
| Some Types | 31.1 (4.9) | 23.1 (7.5) | 37.9 (7.2) | 49.3 (12.6) | 40.0 (7.8) | 57.8 (11.3) | ||||
| None | 29.4 (9.8) | 31.2 (7.2) | 9.0 (3.8) | 16.0 (7.5) | 11.6 (5.5) | 28.5 (7.0) | ||||
| LL Chi-Sq. | 1.0 | 2.6 | 7.0 | |||||||
| LL Probability | (0.61) | (0.30) | (0.06) | |||||||
| FACILITY WILL ADMIT BEHAV. PROB. RES. | ||||||||||
| All Types | 5.0 (0.8) | 5.0 (2.8) | 4.3 (2.3) | 0.0 (0.0) | 0.9 (0.9) | 4.1 (3.1) | 2.4 0.33 | |||
| Some Types | 93.0 (1.2) | 91.8 (2.3) | 92.2 (2.5) | 97.7 (2.3) | 97.0 (2.1) | 87.9 (6.6) | ||||
| None | 2.0 (0.8) | 3.2 (1.9) | 3.5 (2.4) | 2.3 (2.3) | 2.1 (1.8) | 8.1 (4.6) | ||||
| LL Chi-Sq. | 0.4 | --- | 3.4 | |||||||
| LL Probability | 0.80 | --- | (0.22) | |||||||
| FACILITY WILL DISCHARGE BEHAB. PROB. RES. | ||||||||||
| All Types | 3.9 (1.5) | 1.7 (1.2) | 6.1 (4.8) | 10.8 (9.1) | 7.4 (6.2) | 3.4 (3.3) | 1.7 0.44 | |||
| Some Types | 86.0 (2.4) | 89.4 (2.6) | 85.0 (6.8) | 86.6 (8.4) | 91.5 (6.0) | 92.1 (6.5) | ||||
| None | 10.2 (2.3) | 8.9 (2.3) | 8.9 (3.0) | 2.6 (2.6) | 1.0 (1.1) | 4.5 (3.4) | ||||
| LL Chi-Sq. | 1.2 | 2.1 | 4.3 | |||||||
| LL Probability | (0.57) | (0.38) | (0.15) | |||||||
| FACILITY WILL ADMIT INCONTINENT RES. | ||||||||||
| All Types | 54.2 (5.0) | 42.6 (4.2) | 34.0 (5.7) | 32.5 (15.8) | 29.8 (8.1) | 39.1 (8.3) | 3.7 (0.19) | |||
| Some Types | 24.1 (5.0) | 24.1 (8.2) | 39.0 (6.5) | 19.8 (8.1) | 45.7 (5.8) | 35.5 (13.0) | ||||
| None | 21.7 (3.5) | 33.3 (7.3) | 27.0 (4.5) | 47.7 (13.1) | 24.5 (6.1) | 25.4 (8.7) | ||||
| LL Chi-Sq. | 6.4 | 9.5 | 0.7 | |||||||
| LL Probability | (0.07) | (0.03) | (0.71) | |||||||
| FACILITY WILL DISCHARGE INCONTINENT RES. | ||||||||||
| All Types | 19.6 (4.1) | 28.2 (5.6) | 26.0 (4.9) | 23.8 (8.1) | 19.5 (6.9) | 22.4 (10.6) | 1.1 (0.59) | |||
| Some Types | 11.2 (2.4) | 7.6 (4.3) | 18.9 (4.3) | 18.0 (10.3) | 34.5 (8.7) | 24.3 (14.6) | ||||
| None | 69.2 (4.7) | 64.2 (4.5) | 55.1 (3.7) | 59.0 (13.7) | 46.0 (5.9) | 53.3 (11.4) | ||||
| LL Chi-Sq. | 1.9 | 0.2 | 0.3 | |||||||
| LL Probability | (0.42) | (0.92) | (0.85) | |||||||
| FACILITY WILL ADMIT SSI RECIPIENTS | ||||||||||
| All Types | 82.0 (4.9) | 79.4 (4.7) | 78.8 (3.9) | 71.9 (9.7) | 76.3 (7.4) | 75.6 (7.0) | 10.0 (0.02) | |||
| Some Types | 0.3 (0.3) | 6.1 (2.0) | 2.6 (1.6) | 1.6 (1.7) | 0.0 (0.0) | 6.1 (4.5) | ||||
| None | 17.7 (4.9) | 14.5 (4.4) | 18.6 (4.1) | 26.5 (10.0) | 23.7 (7.4) | 18.3 (6.8) | ||||
| LL Chi-Sq. | 10.8 | 0.6 | --- | |||||||
| LL Probability | (0.02) | (0.75) | --- | |||||||
| FACILITY WILL DISCHARGE SSI RECIPIENTS | ||||||||||
| All Types | 8.1 (3.8) | 2.6 (2.2) | 7.0 (5.3) | 3.1 (3.2) | 9.5 (5.4) | 11.4 (4.8) | 0.9 (0.64) | |||
| Some Types | 0.1 (0.1) | 0.0 (0.0) | 1.0 (0.9) | 1.2 (1.3) | 0.0 (0.0) | 0.0 (0.6) | ||||
| None | 91.8 (3.8) | 97.4 (2.2) | 92.0 (6.2) | 95.7 (3.5) | 90.5 (5.4) | 88.6 (4.8) | ||||
| LL Chi-Sq. | --- | 0.7 | 0.1 | |||||||
| LL Probability | --- | (0.70) | (0.72) | |||||||
| RESIDENTS NEED PERMISSION TO LEAVE HOME | ||||||||||
| Yes | 48.5 (6.4) | 49.6 (8.6) | 42.5 (6.2) | 34.9 (9.9) | 32.5 (10.8) | 17.4 (13.8) | 4.1 (0.17) | |||
| No | 29.9 (6.1) | 28.9 (5.9) | 45.2 (9.7) | 53.5 (10.3) | 52.7 (7.9) | 82.6 (13.8) | ||||
| Varies | 21.6 (4.8) | 21.5 (5.0) | 12.2 (4.6) | 11.6 (5.4) | 14.8 (5.9) | 0.0 (0.0) | ||||
| LL Chi-Sq. | 0.0 | 0.5 | --- | |||||||
| LL Probability | (0.99) | (0.78) | --- | |||||||
| TABLE A-4. Facility Characteristics by Licensure Status and Home Size: Social Environment | |||||||
|---|---|---|---|---|---|---|---|
| Small | Medium | Large | Overall Effect of Licensure Status Chi-Square (Prob) | ||||
| Licensed Percent (SE) | Unlicensed Percent (SE) | Licensed Percent (SE) | Unlicensed Percent (SE) | Licensed Percent (SE) | Unlicensed Percent (SE) | ||
| RESIDENTS AND OWNER/MANAGER EAT TOGETHER | |||||||
| Always | 42.6 (3.3) | 29.1 (6.3) | 21.8 (7.3) | 25.5 (8.7) | 9.8 (5.7) | 17.4 (9.5) | 5.8 (0.09) |
| Sometimes | 40.2 (4.1) | 49.0 (4.0) | 62.0 (7.0) | 60.1 (12.0) | 62.2 (6.0) | 61.5 (11.0) | |
| Never | 17.2 (2.4) | 21.9 (7.5) | 16.2 (4.5) | 14.3 (9.8) | 28.0 (7.7) | 21.2 (7.9) | |
| LL Chi-Sq. | 6.6 | 0.1 | 0.8 | ||||
| LL Probability | (0.07) | (0.95) | (0.68) | ||||
| RESIDENTS ALLOWED TO EAT WHENEVER THEY WANT | |||||||
| None | 69.2 (3.7) | 55.4 (8.2) | 49.9 (4.7) | 48.1 (5.6) | 54.7 (7.6) | 75.9 (9.0) | 0.7 (0.42) |
| Some | 30.8 (3.7) | 44.6 (8.2) | 50.1 (4.7) | 51.9 (5.6) | 45.3 (7.6) | 24.1 (9.0) | |
| LL Chi-Sq. | 2.5 | 0.0 | 3.8 | ||||
| LL Probability | (0.14) | (0.14) | (0.07) | ||||
| OPERATOR OR FAMILY LIVE IN HOME | |||||||
| Yes | 82.9 (3.1) | 85.1 (3.9) | 23.9 (4.2) | 76.1 (4.2) | 2.5 (1.9) | 14.5 (5.5) | 1.4 (0.26) |
| No | 17.1 (3.1) | 14.9 (3.9) | 32.1 (11.2) | 67.9 (11.2) | 97.5 (1.9) | 85.5 (5.5) | |
| LL Chi-Sq. | 0.2 | 0.7 | 3.6 | ||||
| LL Probability | (0.71) | (0.42) | (0.08) | ||||
| TABLE A-5. Facility Characteristics by Licensure Status and Home Size: Operator and Staff Training and Characteristics | |||||||
|---|---|---|---|---|---|---|---|
| Small | Medium | Large | Overall Effect of Licensure Status Chi-Square (Prob) | ||||
| Licensed Percent (SE) | Unlicensed Percent (SE) | Licensed Percent (SE) | Unlicensed Percent (SE) | Licensed Percent (SE) | Unlicensed Percent (SE) | ||
| OPERATOR EDUCATION LEVEL | |||||||
| HS Diploma | 20.1 (4.7) | 30.8 (9.7) | 5.0 (1.2) | 10.8 (5.7) | 0.0 (0.0) | 17.2 (13.7) | 16.8 (0.02) |
| HS Graduate | 18.8 (1.9) | 27.2 (12.1) | 12.7 (3.8) | 20.7 (10.9) | 18.3 (4.0) | 1.5 (1.6) | |
| Some Post HS | 35.6 (3.8) | 32.2 (7.6) | 45.0 (9.7) | 35.0 (15.5) | 33.1 (8.6) | 31.4 (8.6) | |
| 4 Yr. College Grad | 14.4 (3.2) | 4.5 (3.5) | 27.6 (6.9) | 8.6 (4.6) | 21.5 (10.5) | 16.9 (5.0) | |
| Post Grad | 11.0 (2.8) | 5.2 (3.0) | 9.7 (3.9) | 24.9 (8.5) | 27.1 (8.2) | 32.9 (7.8) | |
| LL Chi-Sq. | 6.5 | 8.4 | --- | ||||
| LL Probability | (0.23) | (0.14) | --- | ||||
| OPERATOR PRIOR EXP. WORK IN HEALTH CARE | |||||||
| Yes | 71.1 (5.0) | 47.6 (10.4) | 77.2 (4.3) | 52.6 (12.3) | 76.2 (7.6) | 54.6 (12.8) | 5.6 (0.03) |
| No | 28.9 (5.0) | 52.4 (10.4) | 22.8 (4.3) | 47.4 (12.3) | 23.8 (7.6) | 45.4 (12.8) | |
| LL Chi-Sq. | 4.8 | 3.3 | 2.7 | ||||
| LL Probability | (0.05) | (0.09) | (0.12) | ||||
| Years as Operator/Supervisor | 7.5 | 6.8 | 7.4 | 6.2 | 5.5 | 3.5 | 2.5 (.03)* |
| (Average for home) | 0.5 | 0.7 | 0.5 | 1.5 | 1.0 | 0.5 | |
| P-Value of t-Test | .34 | .41 | 0.06 | ||||
| TRAINED BEFORE BECOMING OPERATOR | |||||||
| Yes | 64.3 (3.0) | 52.9 (8.6) | 71.5 (4.9) | 69.8 (9.8) | 80.0 (9.1) | 51.5 (11.2) | 2.8 (0.12) |
| No | 35.7 (3.0) | 47.1 (8.6) | 28.5 (4.9) | 30.2 (9.8) | 20.0 (9.1) | 48.5 (11.2) | |
| LL Chi-Sq. | 1.6 | 0.0 | 2.7 | ||||
| LL Probability | 0.22 | 0.89 | 0.12 | ||||
| HOURS OF TRAINING PROVIDED TO CARE STAFF | |||||||
| None | 24.7 (5.5) | 59.5 (14.7) | 13.5 (2.2) | 43.7 (13.6) | 1.5 (1.5) | 25.2 (9.6) | 13.9 0.02 |
| 1-16 | 27.4 (6.7) | 26.6 (12.9) | 35.7 (5.1) | 23.6 (13.5) | 25.5 (12.0) | 58.0 (10.3) | |
| 17-40 | 36.4 (9.4) | 8.4 (3.8) | 36.7 (8.0) | 25.3 (18.9) | 38.6 (4.9) | 7.9 (6.8) | |
| >40 | 11.5 (2.7) | 5.6 (5.0) | 14.0 (3.5) | 7.4 (6.0) | 34.4 (13.0) | 8.9 (5.1) | |
| LL Chi-Sq. | 15.4 | 9.0 | 17.7 | ||||
| LL Probability | 0.01 | 0.07 | 0.01 | ||||
| Residents/Direct Care Staff Person | 2.7 | 3.1 | 3.6 | 12.0 | 7.0 | 85.0 | -3.7 (<.01)* |
| (Average per home) | 0.1 | 0.2 | 0.5 | 3.1 | 1.2 | 27.0 | |
| P-Value of t-Test | .14 | .02 | .01 | ||||
| * Probability value of regression coefficient for overall licensure effect | |||||||
| TABLE A-6. Facility Characteristics by Licensure Status and Home Size: Regulatory Issues | |||||||
|---|---|---|---|---|---|---|---|
| Small | Medium | Large | Overall Effect of Licensure Status Chi-Square (Prob) | ||||
| Licensed Percent (SE) | Unlicensed Percent (SE) | Licensed Percent (SE) | Unlicensed Percent (SE) | Licensed Percent (SE) | Unlicensed Percent (SE) | ||
| MORE THAN ONE INSPECTOR IN PAST 12 MONTHS | |||||||
| No | 60.9 (7.0) | 89.5 (3.0) | 57.4 (17.3) | 89.2 (6.7) | 75.6 (6.8) | 87.6 (6.2) | 25.8 >(0.01) |
| Yes | 39.1 (7.0) | 10.5 (3.0) | 42.6 (17.3) | 10.8 (6.7) | 24.4 (6.8) | 12.4 (6.2) | |
| LL Chi-Sq. | 38.2 | 6.3 | 1.6 | ||||
| LL Probability | (>0.01) | (0.03) | (0.22) | ||||
| # Visits by Inspector in Last 12 Months | 3.3 | 4.3 | 3.9 | 6.5 | 8.9 | 7.3 | -1.5 (.15)* |
| (Average for home) | 0.4 | 1.1 | 0.9 | 1.8 | 3.8 | 2.2 | |
| P-Value of t-Test | .47 | .21 | .73 | ||||
| CORRECTIVE ACTION AGAINST HOME LAST 12 MONTHS | |||||||
| Yes | 16.4 (4.6) | 5.3 (2.9) | 23.8 (7.7) | 13.4 (10.1) | 30.7 (8.4) | 1.3 (1.3) | 4.7 (0.05) |
| No | 83.6 (4.6) | 94.7 (2.9) | 76.2 (7.7) | 86.6 (10.1) | 69.3 (8.4) | 98.7 (1.3) | |
| LL Chi-Sq. | 3.8 | 0.5 | 6.9 | ||||
| LL Probability | (0.07) | (0.51) | (0.02) | ||||
| * Probability value of regression coefficient for overall licensure effect | |||||||
| TABLE A-7. Facility Characteristics by Licensure Status and Home Size: Services Provided by the Home | ||||||||||
|---|---|---|---|---|---|---|---|---|---|---|
| Small | Medium | Large | Overall Effect of Licensure Status Chi-Square (Prob) | |||||||
| Licensed Percent (SE) | Unlicensed Percent (SE) | Licensed Percent (SE) | Unlicensed Percent (SE) | Licensed Percent (SE) | Unlicensed Percent (SE) | |||||
| RESPONSIBLE PERSON IN BUILDING | ||||||||||
| Yes | 98.9 (0.8) | 95.6 (2.6) | 99.7 (0.4) | 88.9 (5.1) | 98.9 (1.0) | 87.7 (5.6) | 16.8 (0.02) | |||
| No | 1.1 (0.8) | 4.4 (2.6 | 0.3 (0.4) | 11.1 (5.1) | 1.1 (1.0) | 12.3 (5.6) | ||||
| LL Chi-Sq. | 6.5 | 14.0 | 5.2 | |||||||
| LL Probability | (0.23) | (<0.01) | (0.04) | |||||||
| PERSONAL CARE ASSISTANCE | ||||||||||
| Yes | 91.9 (2.5) | 79.4 (4.6) | 91.2 (4.9) | 52.3 (8.6) | 93.5 (3.4) | 40.3 (11.8) | 2.5 (<0.01) | |||
| No | 8.1 (2.5) | 20.6 (4.6) | 8.8 (4.9) | 47.7 (8.9) | 6.5 (3.4) | 59.7 (11.8) | ||||
| LL Chi-Sq. | 7.7 | 9.0 | 11.7 | |||||||
| LL Probability | (0.02) | (0.01) | (<0.01) | |||||||
| TRANSPORTATION | ||||||||||
| Yes | 88.6 (3.4) | 92.4 (4.3) | 87.0 (4.7) | 93.2 (3.9) | 95.0 (1.0) | 70.4 (12.4) | 0.2 (0.66) | |||
| No | 11.4 (3.4) | 7.6 (4.3) | 13.0 (4.7) | 6.8 (3.9) | 5.0 (1.9) | 29.6 (12.4) | ||||
| LL Chi-Sq. | 0.4 | 0.6 | 5.3 | |||||||
| LL Probability | (0.52) | (0.45) | (0.04) | |||||||
| NURSING CARE | ||||||||||
| Yes | 20.6 (1.8) | 17.2 (4.0) | 32.2 (7.5) | 27.4 (12.3) | 40.7 (13.8) | 43.0 (11.9) | 0.2 (0.68) | |||
| No | 79.6 (1.8) | 82.8 (4.0) | 67.8 (7.5) | 72.6 (12.3) | 59.3 (13.8) | 57.0 (11.9) | ||||
| LL Chi-Sq. | 0.6 | 0.1 | 0.0 | |||||||
| LL Probability | (0.47) | (0.8) | (0.89) | |||||||
| THERAPY | ||||||||||
| Yes | 15.4 (2.2) | 4.4 (2.1) | 18.8 (1.8) | 6.6 (3.6) | 20.8 (7.7) | 8.9 (4.6) | 6.7 (0.02) | |||
| No | 84.6 (2.2) | 95.6 (2.1) | 81.2 (1.8) | 93.4 (3.6) | 79.2 (7.7) | 91.1 (4.6) | ||||
| LL Chi-Sq. | 7.2 | 3.9 | 1.5 | |||||||
| LL Probability | (0.02) | (0.07) | (0.25) | |||||||
| REMINDERS TO TAKE MEDICATION | ||||||||||
| Yes | 76.6 (4.3) | 69.7 (5.4) | 92.6 (2.2) | 75.4 (9.4) | 97.2 (1.4) | 60.8 (11.1) | 4.3 (0.06) | |||
| No | 23.4 (4.3) | 30.3 (5.4) | 7.4 (2.2) | 24.6 (9.4) | 2.8 (1.4) | 39.2 (11.1) | ||||
| LL Chi-Sq. | 1.0 | 5.1 | 12.9 | |||||||
| LL Probability | (0.33) | (0.04) | (<0.01) | |||||||
| MEDICATION STORAGE | ||||||||||
| Yes | 99.0 (0.8) | 93.4 (3.4) | 98.9 (0.9) | 73.8 (9.3) | 98.2 (1.8) | 47.1 (13.0) | 17.9 (<0.01) | |||
| No | 1.0 (0.8) | 6.3 (3.4) | 1.1 (0.9) | 26.2 (9.3) | 1.8 (1.8) | 52.9 (13.0) | ||||
| LL Chi-Sq. | 4.1 | 12.9 | 8.2 | |||||||
| LL Probability | (0.06) | (<0.01) | (0.01) | |||||||
| ORGANIZED ACTIVITIES | ||||||||||
| Yes | 83.1 (4.2) | 73.8 (7.4) | 97.8 (1.3) | 87.0 (5.7) | 100.0 (0.0) | 89.1 (5.5) | 0.9 (0.35) | |||
| No | 16.9 (4.2) | 26.2 (7.4) | 2.2 (1.3) | 13.0 (5.7) | 0.0 (0.0) | 10.9 (5.5) | ||||
| LL Chi-Sq. | 1.0 | 6.1 | --- | |||||||
| LL Probability | (0.33) | (0.03) | --- | |||||||
| RECREATIONAL TRIPS | ||||||||||
| Yes | 78.9 (5.4) | 72.2 (6.2) | 75.1 (3.7) | 79.9 (10.2) | 94.3 (4.0) | 75.4 (12.3) | 0.9 0.37 | |||
| No | 21.1 (5.4) | 27.8 (6.2) | 24.9 (3.7) | 20.1 (10.2) | 5.7 (4.0) | 24.6 (12.3) | ||||
| LL Chi-Sq. | 0.7 | 0.2 | 4.0 | |||||||
| LL Probability | (0.42) | (0.65) | (0.07) | |||||||
| MONEY MANAGEMENT | ||||||||||
| Yes | 34.8 (5.4) | 50.8 (5.9) | 53.4 (4.1) | 62.9 (15.4) | 40.3 (7.5) | 17.9 (7.8) | 0.9 (0.35) | |||
| No | 65.2 (5.4) | 49.2 (5.9 | 46.6 (4.1) | 37.1 (15.4) | 59.7 (7.5) | 82.1 (7.8) | ||||
| LL Chi-Sq. | 5.0 | 0.4 | 2.8 | |||||||
| LL Probability | (0.04) | (0.54) | (0.12) | |||||||
| # Health Services Provided by Home | 2.1 | 1.8 | 2.4 | 1.8 | 2.6 | 1.6 | 3.3 (.01) | |||
| (Average for home) | 0.1 | 0.1 | 0.1 | 0.3 | 0.2 | 0.3 | ||||
| P-Value of t-Test | .02 | .10 | .01 | |||||||
| # Social Services Provided by Home | 3.8 | 3.7 | 4.0 | 3.8 | 4.2 | 2.9 | 2.8 (.01) | |||
| (Average for home) | 0.1 | 0.2 | 0.1 | 0.2 | 0.05 | 0.2 | ||||
| P-Value of t-Test | .75 | .24 | <.01 | |||||||
| * Probability value of regression coefficient for overall licensure effect | ||||||||||
| TABLE A-8. Facility Characteristics by Licensure Status and Home Size: Outside Provided Services Arranged | ||||||||||
|---|---|---|---|---|---|---|---|---|---|---|
| Small | Medium | Large | Overall Effect of Licensure Status Chi-Square (Prob) | |||||||
| Licensed Percent (SE) | Unlicensed Percent (SE) | Licensed Percent (SE) | Unlicensed Percent (SE) | Licensed Percent (SE) | Unlicensed Percent (SE) | |||||
| HOME HAS FORMAL ARRANGEMENT FOR TEMPORARY NURSING | ||||||||||
| None | 15.3 (2.9) | 37.1 (6.3) | 28.3 (4.0) | 18.1 (5.8) | 18.2 (6.3) | 19.8 (9.3) | 2.2 (0.14) | |||
| Some | 84.7 (2.9) | 62.9 (6.3) | 71.7 (4.0) | 81.9 (5.8) | 81.8 (6.3) | 80.2 (9.3) | ||||
| LL Chi-Sq. | 13.6 | 1.6 | 0.0 | |||||||
| LL Probability | (<0.01) | (0.23) | (0.90) | |||||||
| HOME HAS FORMAL ARRANGEMENT FOR LONG TERM NURSING | ||||||||||
| None | 10.4 (2.2) | 30.5 (6.4) | 21.1 (4.4) | 14.0 (4.6) | 20.7 (6.4) | 13.8 (6.0) | 3.5 (0.08) | |||
| Some | 89.6 (2.2) | 69.5 (6.4) | 78.9 (4.4) | 86.0 (4.6) | 79.3 (6.4) | 86.2 (6.0) | ||||
| LL Chi-Sq. | 12.2 | 1.0 | 0.6 | |||||||
| LL Probability | (<0.01) | (0.34) | (0.46) | |||||||
| ARRANGE OUTSIDE PERSONAL CARE | ||||||||||
| Yes | 18.7 (4.0 | 16.9 (6.6) | 33.5 (5.3) | 34.4 (10.1) | 50.1 (9.4) | 59.3 (10.6) | 1.3 (0.28) | |||
| No | 81.3 (4.0 | 83.1 (6.6) | 66.5 (5.3) | 65.5 (5.3) | 49.9 (9.4) | 40.7 (10.6) | ||||
| LL Chi-Sq. | 0.1 | 0.0 | 0.3 | |||||||
| LL Probability | (0.81) | (0.94) | (0.58) | |||||||
| ARRANGE OUTSIDE SR. CTR./ADULT DAY CARE | ||||||||||
| Yes | 28.7 (3.7) | 43.0 (12.0) | 55.8 (11.5) | 22.3 (7.1) | 30.5 (5.2) | 18.6 (7.6) | 0.3 (0.61) | |||
| No | 71.3 (3.7) | 57.0 (12.0) | 44.7 (11.5) | 77.7 (7.1) | 69.5 (5.2) | 81.4 (7.6) | ||||
| LL Chi-Sq. | 1.5 | 8.7 | 1.7 | |||||||
| LL Probability | (0.24) | (0.01) | (0.21) | |||||||
| ARRANGE OUTSIDE TRANSPORTATION | ||||||||||
| Yes | 50.0 (4.8) | 51.3 (5.2) | 67.1 (7.4) | 35.2 (5.9) | 68.3 (7.2) | 37.0 (9.2) | 4.2 (0.06) | |||
| No | 50.0 (4.8) | 48.7 (5.2) | 32.9 (7.4) | 64.8 (5.9) | 31.7 (7.2) | 63.0 (9.2) | ||||
| LL Chi-Sq. | 0.0 | 8.6 | 7.6 | |||||||
| LL Probability | (0.16) | (0.23) | (0.87) | |||||||
| ARRANGE OUTSIDE NURSING CARE | ||||||||||
| Yes | 49.9 (3.5) | 31.1 (11.2) | 54.9 (6.7) | 38.2 (11.8) | 72.5 (8.6) | 74.6 (9.8) | 1.1 (0.32) | |||
| No | 50.1 (3.5) | 68.9 (11.2) | 45.1 (6.7) | 61.8 (11.8) | 27.5 (8.6) | 25.4 (9.8) | ||||
| LL Chi-Sq. | 2.3 | 1.6 | 0.0 | |||||||
| LL Probability | (0.16) | (0.23) | (0.87) | |||||||
| ARRANGE OUTSIDE THERAPY | ||||||||||
| Yes | 33.8 (5.2) | 24.2 (6.8) | 49.2 (4.0) | 20.0 (7.0) | 68.5 (4.0) | 77.8 (6.9) | 0.6 (0.45) | |||
| No | 66.2 (5.2) | 75.8 (6.8) | 50.8 (4.0) | 80.0 (7.0) | 31.5 (4.0) | 22.2 (6.9) | ||||
| LL Chi-Sq. | 1.4 | 6.7 | 1.1 | |||||||
| LL Probability | (0.25) | (0.02) | (0.32) | |||||||
| ARRANGE OUTSIDE CASE MANAGEMENT | ||||||||||
| Yes | 42.8 (4.2) | 42.2 (4.8) | 53.4 (6.1) | 34.4 (12.8) | 40.2 (10.9) | 30.3 (9.9) | 1.3 (0.28) | |||
| No | 57.2 (4.2) | 5738 (4.8) | 46.6 (6.1) | 65.6 (12.8) | 59.8 (10.9) | 69.7 (9.9) | ||||
| LL Chi-Sq. | 0.0 | 2.0 | 0.4 | |||||||
| LL Probability | (0.35) | (0.62) | (0.59) | |||||||
| ARRANGE OUTSIDE SHELTER WORKSHOP/DAY ACTIVITIES | ||||||||||
| Yes | 29.2 (6.6) | 38.0 (4.9) | 48.5 (8.2) | 40.4 (13.2) | 17.5 (7.1) | 12.0 (5.4) | 0.0 (0.95) | |||
| No | 70.8 (6.6) | 62..0 (4.9) | 51.5 (8.2) | 59.6 (13.2) | 82.5 (7.1) | 88.0 (5.4) | ||||
| LL Chi-Sq. | 1.0 | 0.3 | 0.3 | |||||||
| LL Probability | (0.35) | (0.62) | (0.59) | |||||||
| # Health Services Provided by Others | 0.8 | 0.6 | 1.6 | 0.6 | 1.4 | 1.5 | 1.1 (.28) | |||
| (Average for home) | 0.1 | 0.2 | 0.1 | 0.2 | 0.1 | 0.1 | ||||
| P-Value of t-Test | .15 | .03 | .59 | |||||||
| # Social Services Provided by Others | 1.7 | 1.9 | 2.6 | 1.7 | 2.1 | 1.6 | 1.1 (.29) | |||
| (Average for home) | 0.1 | 0.1 | 0.3 | 0.2 | 0.2 | 0.3 | ||||
| P-Value of t-Test | .16 | .02 | .20 | |||||||
| * Probability value of regression coefficient for overall licensure effect | ||||||||||
| TABLE A-9. Licensed Facility Characteristics by Regulatory Environment: Background | ||||||
|---|---|---|---|---|---|---|
| Background | Extensive | Limited | Log Likelihood Ratio Chi-Square | P-Value Value of Test Statistic | ||
| % | (SE) | % | (SE) | |||
| HOME SIZE | ||||||
| Small | 73.1 | (2.8) | 61.9 | (4.1) | 5.6 | .07 |
| Medium | 18.1 | (2.3) | 23.7 | (3.5) | ||
| Large | 8.8 | (2.1) | 14.4 | (2.6) | ||
| OWNERSHIP | ||||||
| For-Profit | 86.4 | (2.4) | 70.7 | (3.8) | 12.4 | >.01 |
| Non-Profit | 13.6 | (2.4) | 29.3 | (3.8) | ||
| ATTACHED TO NURSING HOME | ||||||
| Yes | 5.0 | (1.4) | 11.9 | (2.5) | 6.3 | .01 |
| No | 95.0 | (1.4) | 88.1 | (2.5) | ||
| Ave. Monthly Facility Income/Resident (Average for home) | 1076.7 | (47.3) | 711.6 | (50.0) | NA | >.01* |
| Occupancy Rate (Average for home) | .80 | (.01) | .80 | (.01) | NA | .94* |
| TABLE A-10. Licensed Facility Characteristics by Regulatory Environment: Resident Case Mix Characteristics | ||||||
|---|---|---|---|---|---|---|
| Resident Case Mix Characteristics | Extensive | Limited | Log Likelihood Ratio Chi-Square | P-Value Value of Test Statistic | ||
| % | (SE) | % | (SE) | |||
| SUMMARY CASE MIX MEASURE | ||||||
| Res. w/Beh. Prob. are 90%+ | 16.4 | (2.8) | 35.7 | (4.1) | 19.5 | <.01 |
| Elderly Res. are 90%+ | 61.7 | (3.8) | 35.7 | (4.7) | ||
| Other Resident Mix | 21.9 | (3.0) | 28.6 | (4.1) | ||
| ANY BED-FAST RESIDENTS | ||||||
| None | 95.0 | (1.8) | 95.0 | (1.7) | 0.0 | .98 |
| Some | 5.0 | (1.8) | 5.0 | (1.7) | ||
| ANY CHAIR-FAST RESIDENTS | ||||||
| None | 68.0 | (2.6) | 84.0 | (3.2) | 9.8 | <.01 |
| Some | 32.0 | (2.6) | 16.0 | (3.2) | ||
| ANY COGNITIVELY IMPAIRED RESIDENTS | ||||||
| None | 25.7 | (3.6) | 38.5 | (4.7) | 4.6 | .04 |
| Some | 74.3 | (3.6) | 61.5 | (4.7) | ||
| ANY RESIDENTS WITH ALCOHOL PROBLEMS | ||||||
| None | 56.8 | (4.0) | 65.1 | (4.0) | 2.1 | .15 |
| Some | 43.2 | (4.0) | 34.9 | (4.0) | ||
| ANY RESIDENTS WITH DRUG ABUSE | ||||||
| None | 85.9 | (2.6) | 82.0 | (2.1) | 1.4 | .25 |
| Some | 14.1 | (2.6) | 18.0 | (2.1) | ||
| ANY HIV+ RESIDENTS | ||||||
| None | 99.0 | (6.0) | 100.0 | (0.0) | 2.6 | .11 |
| Some | 1.0 | (6.0) | 0.0 | (0.0) | ||
| ANY RESIDENTS WITH MR/DD | ||||||
| None | 70.2 | (4.4) | 51.9 | (4.3) | 8.3 | .01 |
| Some | 29.8 | (4.4) | 48.1 | (4.3) | ||
| ANY RESIDENTS WITH PSYCHIATRIC HISTORY | ||||||
| None | 44.2 | (4.4) | 39.8 | (3.8) | 0.6 | .45 |
| Some | 55.8 | (4.4) | 60.2 | (3.8) | ||
| ANY INCONTINENT RESIDENTS | ||||||
| None | 36.4 | (4.1) | 55.6 | (4.6) | 9.3 | >.01 |
| Some | 63.6 | (4.1) | 44.4 | (4.6) | ||
| PROPORTION OF RESIDENTS 65+ | ||||||
| None | 8.6 | (2.4) | 20.0 | (3.3) | 15.1 | >.01 |
| Some | 32.3 | (3.2) | 44.3 | (4.0) | ||
| All | 59.1 | (3.7) | 35.7 | (4.5) | ||
| % of Residents >65 Years (Average per home) | 79.9 | (2.7) | 59.2 | (3.5) | NA | >.01* |
| % of Residents Chair or Bedfast (Average per home) | 10.0 | (1.3) | 3.6 | (.9) | NA | >.01* |
| % of Residents Paid for by SSI (Average per home) | 40.5 | (4.0) | 48.1 | (3.4) | Na | .15* |
| * Based on a t-test for the significance of the regression coefficient | ||||||
| TABLE A-11. Licensed Facility Characteristics by Regulatory Environment: Facility Rules | ||||||
|---|---|---|---|---|---|---|
| Facility Rules | Extensive | Limited | Log Likelihood Ratio Chi-Square | P-Value Value of Test Statistic | ||
| % | (SE) | % | (SE) | |||
| RESIDENTS MANAGES OWN MEDICATION | ||||||
| Yes | 5.2 | (1.6) | 3.6 | (1.4) | 0.5 | .48 |
| No | 94.8 | (1.6) | 96.4 | (1.4) | ||
| STAFF MANAGE RESIDENTS’ MEDICATION | ||||||
| Yes | 93.4 | (2.2) | 91.0 | (2.6) | 0.5 | .49 |
| No | 6.6 | (2.2) | 9.0 | (2.6) | ||
| FACILITY WILL ADMIT MOBILITY IMPAIRED RES. | ||||||
| All Types | 8.6 | (2.4) | 3.2 | (1.4) | 3.6 | .17 |
| Some Types | 45.1 | (4.5) | 49.3 | (3.9) | ||
| None | 46.3 | (4.4) | 47.5 | (3.9) | ||
| FACILITY WILL DISCHARGE MOBILITY IMPAIRED RES. | ||||||
| All Types | 43.0 | (3.3) | 42.6 | (4.0) | 4.74 | .10 |
| Some Types | 30.9 | (3.2) | 40.4 | (3.3) | ||
| None | 26.1 | (3.6) | 17.0 | (3.1) | ||
| FACILITY WILL ADMIT BEHAV. PROBLEM RESIDENTS | ||||||
| All Types | 4.0 | (1.4) | 5.8 | (2.1) | .92 | .63 |
| Some Types | 93.6 | (1.9) | 92.4 | (2.3) | ||
| None | 2.5 | (1.2) | 1.8 | (.8) | ||
| FACILITY WILL DISCHARGE BEHAV. PROBLEM RESIDENTS | ||||||
| All Types | 5.4 | (2.2) | 1.8 | (1.1) | 2.19 | .34 |
| Some Types | 85.7 | (2.7) | 88.5 | (3.0) | ||
| None | 8.9 | (2.3) | 9.7 | (2.9) | ||
| FACILITY WILL ADMIT INCONTINENT RESIDENTS | ||||||
| All Types | 49.6 | (2.4) | 41.9 | (4.0) | 3.28 | .20 |
| Some Types | 29.4 | (3.1) | 28.5 | (4.0) | ||
| None | 21.0 | (3.5) | 29.6 | (3.2) | ||
| FACILITY WILL DISCHARGE INCONTINENT RESIDENTS | ||||||
| All Types | 20.8 | (3.0) | 19.0 | (3.8) | 1.97 | .38 |
| Some Types | 14.8 | (1.9) | 15.0 | (2.4) | ||
| None | 64.40 | (3.2) | 66.0 | (4.0) | ||
| FACILITY WILL ADMIT SSI RECPIENTS | ||||||
| All Types | 78.7 | (2.9) | 87.8 | (3.3) | 9.62 | .01 |
| Some Types | .3 | (.35) | 1.9 | (1.2) | ||
| None | 21.0 | (2.9) | 10.3 | (2.7) | ||
| FACILITY WILL DISCHARGE RESIDENTS WHO GO ON SSI | ||||||
| All Types | 9.6 | (2.2) | 2.9 | (1.2) | 6.93 | .04 |
| Some Types | .2 | (.2) | .4 | (.4) | ||
| None | 90.2 | (2.2) | 96.8 | (1.3) | ||
| RESIDENTS NEED PERMISSION TO LEAVE HOME | ||||||
| Yes | 41.7 | (4.4) | 59.1 | (4.7) | 7.5 | .03 |
| No | 37.1 | (4.1) | 28.9 | (4.0) | ||
| Varies | 21.3 | (3.1) | 12.0 | (3.2) | ||
| * Based on a t-test for the significance of the regression coefficient | ||||||
| TABLE A-12. Licensed Facility Characteristics by Regulatory Environment: Social Environment | ||||||
|---|---|---|---|---|---|---|
| Social Environment | Extensive | Limited | Log Likelihood Ratio Chi-Square | P-Value Value of Test Statistic | ||
| % | (SE) | % | (SE) | |||
| RESIDENTS AND OWNER/OPERATOR EAT TOGETHER | ||||||
| Always | 31.4 | (4.5) | 47.8 | (3.9) | 9.8 | .01 |
| Sometimes | 48.5 | (4.2) | 40.6 | (4.6) | ||
| Never | 20.0 | (2.6) | 11.6 | (2.5) | ||
| RESIDENTS ALLOWED TO EAT WHENEVER THEY WANT | ||||||
| Yes | 63.6 | (3.4) | 64.7 | (3.9) | 0.0 | .83 |
| No | 36.4 | (3.4) | 35.3 | (3.9) | ||
| FAMILY WORK | ||||||
| No | 36.2 | (3.0) | 49.3 | (5.4) | 6.3 | .05 |
| Yes, Paid | 33.2 | (3.5) | 22.8 | (3.4) | ||
| Yes, Unpaid | 30.7 | (3.8) | 27.9 | (4.3) | ||
| OPERATOR OR FAMILY LIVE IN HOME | ||||||
| Yes | 66.2 | (3.5) | 53.9 | (3.8) | 5.62 | .02 |
| No | 33.8 | (3.5) | 46.0 | (3.8) | ||
| * Based on a t-test for the significance of the regression coefficient | ||||||
| TABLE A-13. Licensed Facility Characteristics by Regulatory Environment: Operator and Staff Training and Characteristics | ||||||
|---|---|---|---|---|---|---|
| Operator and Staff Training Characteristics | Extensive | Limited | Log Likelihood Ratio Chi-Square | P-Value Value of Test Statistic | ||
| % | (SE) | % | (SE) | |||
| OPERATOR EDUCATION LEVEL | ||||||
| HS Dip | 12.8 | (2.4) | 22.6 | (4.0) | 15.25 | .01 |
| HS Grad | 16.2 | (2.5) | 22.0 | (3.6) | ||
| Some Post HS | 38.2 | (3.6) | 33.9 | (4.7) | ||
| 4 Yr. College Grad | 20.4 | (2.5) | 8.9 | (2.0) | ||
| Post Grad | 12.4 | (2.7) | 12.6 | (3.5) | ||
| WHO IS IN HOME FOR OPERATOR RESPITE | ||||||
| Paid Staff | 84.9 | (3.2) | 69.9 | (5.1) | 7.21 | .03 |
| Friends/Fam | 13.3 | (3.1) | 29.2 | (5.2) | ||
| None | 1.8 | (1.0) | .9 | (.9) | ||
| OPERATOR PRIOR EXP. WORK IN HEALTH CARE | ||||||
| Yes | 76.9 | (3.4) | 59.3 | (4.8) | 8.94 | >.01 |
| No | 23.1 | (4.4) | 40.8 | (4.8) | ||
| Years as Operator/Supervisor (Average per home) | 7.3 | (.6) | 7.3 | (.5) | NA | .97* |
| TRAINED BEFORE BECOMING OPERATOR | ||||||
| Yes | 70.4 | (3.8) | 56.9 | (4.0) | 5.84 | .02 |
| No | 29.6 | (3.8) | 43.1 | (4.0) | ||
| HOURS OF TRAINING PROVIDED TO CARE STAFF | ||||||
| None | 15.9 | (3.3) | 36.3 | (5.6) | 22.63 | >.01 |
| 1-16 | 28.7 | (4.1) | 29.5 | (4.8) | ||
| 17-40 | 42.3 | (3.6) | 17.9 | (3.4) | ||
| >40 | 13.2 | (2.5) | 16.3 | (4.1) | ||
| Residents/Direct Care Staff Person (Average per home) | 3.4 | (.2) | 3.2 | (.24) | NA | .60* |
| * Based on a t-test for the significance of the regression coefficient | ||||||
| TABLE A-14. Licensed Facility Characteristics by Regulatory Environment: Regulatory Issues | ||||||
|---|---|---|---|---|---|---|
| Regulatory Issues | Extensive | Limited | Log Likelihood Ratio Chi-Square | P-Value Value of Test Statistic | ||
| % | (SE) | % | (SE) | |||
| MORE THAN 1 INSPECTOR VISITED HOME IN THE LAST 12 MONTHS | ||||||
| Yes | 56.4 | (3.5) | 77.5 | (2.4) | 12.0 | .01 |
| No | 43.6 | (3.5) | 22.5 | (2.4) | ||
| # Visits by Inspector in Last 12 Months (Average) | 3.7 | (.6) | 4.7 | (.8) | NA | .34 |
| CORRECTIVE ACTION AGAINST HOME LAST 12 MONTHS | ||||||
| Yes | 22.0 | (3.1) | 10.1 | (1.7) | 12.46 | >.01 |
| No | 78.0 | (3.1) | 89.9 | (1.7) | ||
| * Based on a t-test for the significance of the regression coefficient | ||||||
| TABLE A-15. Licensed Facility Characteristics by Regulatory Environment: Services Provided by the Home | ||||||
|---|---|---|---|---|---|---|
| Home Provided Services | Extensive | Limited | Log Likelihood Ratio Chi-Square | P-Value Value of Test Statistic | ||
| % | (SE) | % | (SE) | |||
| RESPONSIBLE PERSON IN BLDG | ||||||
| Yes | 99.4 | (.5) | 97.8 | (1.9) | 1.34 | .35 |
| No | .57 | (.5) | 2.23 | (1.9) | ||
| PERSONAL CARE/ASSISTANCE | ||||||
| Yes | 93.4 | (1.7) | 87.1 | (3.2) | 3.6 | .06 |
| No | 6.6 | (1.7) | 12.9 | (3.2) | ||
| MEDICATION STORAGE | ||||||
| Yes | 99.2 | (0.4) | 98.1 | (1.2) | 0.9 | .35 |
| No | 0.8 | (0.4) | 1.9 | (1.2) | ||
| REMINDERS TO TAKE MEDICATION | ||||||
| Yes | 79.3 | (3.9) | 89.8 | (2.6) | 5.1 | .03 |
| No | 20.7 | (3.9) | 10.2 | (2.6) | ||
| ORGANIZED ACTIVITIES | ||||||
| Yes | 89.9 | (2.3) | 80.4 | (3.5) | 5.4 | .02 |
| No | 10.1 | (2.3) | 19.6 | (3.5) | ||
| RECREATIONAL TRIPS | ||||||
| Yes | 80.0 | (3.1) | 78.7 | (3.5) | 0.1 | .77 |
| No | 20.0 | (3.1) | 21.3 | (3.5) | ||
| TRANSPORTATION | ||||||
| Yes | 88.4 | (2.4) | 90.7 | (2.5) | 0.5 | .49 |
| No | 11.6 | (2.4) | 9.3 | (2.5) | ||
| NURSING CARE | ||||||
| Yes | 24.3 | (3.5) | 26.8 | (3.3) | 0.3 | .60 |
| No | 75.7 | (3.5) | 73.2 | (3.3) | ||
| THERAPY | ||||||
| Yes | 15.7 | (2.8) | 19.4 | (3.6) | 0.7 | .41 |
| No | 84.3 | (2.8) | 80.6 | (3.6) | ||
| MONEY MANAGEMENT | ||||||
| Yes | 31.4 | (4.4) | 63.9 | (3.9) | 26.5 | .01 |
| No | 68.6 | (4.4) | 36.1 | (3.9) | ||
| # Health Services (Average per home) | 2.2 | (.1) | 2.3 | (.1) | NA | .12 |
| # Social Services Provided by Home (Average per home) | 3.8 | (.1) | 4.0 | (.1) | NA | .15 |
| * Based on a t-test for the significance of the regression coefficient | ||||||
| TABLE A-16. Licensed Facility Characteristics by Regulatory Environment: Outside Provided Services Arranged | ||||||
|---|---|---|---|---|---|---|
| Arrange for OutsideProvided Services | Extensive | Limited | Log Likelihood Ratio Chi-Square | P-Value Value of Test Statistic | ||
| % | (SE) | % | (SE) | |||
| HOME HAS FORMAL ARRANGEMENT FOR TEMPORARY NURSING | ||||||
| Yes | 17.0 | (3.4) | 22.0 | (3.4) | 1.1 | .30 |
| No | 83.0 | (3.4) | 78.0 | (3.4) | ||
| HOME HAS FORMAL ARRANGEMENT FOR LONG TERM NURSING | ||||||
| Yes | 11.8 | (2.7) | 19.3 | (3.5) | 2.9 | .09 |
| No | 88.2 | (2.7) | 80.7 | (3.5) | ||
| PERSONAL CARE/ASSISTANCE | ||||||
| Yes | 25.4 | (2.9) | 22.6 | (3.9) | 0.3 | .57 |
| No | 74.6 | (2.9) | 77.4 | (3.9) | ||
| SR. CTR/ADULT DAY CARE | ||||||
| Yes | 33.6 | (4.2) | 35.6 | (3.8) | 0.1 | .73 |
| No | 66.4 | (4.2) | 64.4 | (3.8) | ||
| TRANSPORTATION | ||||||
| Yes | 55.2 | (5.0) | 54.4 | (4.2) | 0.0 | .90 |
| No | 44.8 | (5.0) | 45.6 | (4.2) | ||
| NURSING CARE | ||||||
| Yes | 55.3 | (3.6) | 45.8 | (4.4) | 2.8 | .10 |
| No | 44.7 | (3.6) | 54.2 | (4.4) | ||
| THERAPY | ||||||
| Yes | 41.7 | (4.5) | 35.4 | (3.8) | 1.2 | .29 |
| No | 58.3 | (4.5) | 64.6 | (3.8) | ||
| CASE MANAGEMENT | ||||||
| Yes | 43.8 | (4.3) | 47.4 | (4.9) | 0.3 | .58 |
| No | 56.2 | (4.3) | 52.6 | (4.9) | ||
| SHELTER WRKSHP/DAY ACTIVITIES | ||||||
| Yes | 28.4 | (3.8) | 43.0 | (3.8) | 7.1 | .01 |
| No | 71.6 | (3.8) | 57.0 | (3.8) | ||
| # Health Services Provided by Others (Average per home) | 1.0 | (.1) | .8 | (.1) | NA | .09 |
| # Social Services Provided by Others (Average per home) | 1.9 | (.1) | 2.0 | (.1) | NA | .36 |
| * Based on a t-test for the significance of the regression coefficient | ||||||
Appendix B. Staff Characteristics
In Appendix B we present additional data reported by staff members. These data are stratified by facility size. We then examine the bivariate relationship between education and experience of staff and facility licensure status.
| TABLE B-1. Staff Education by Facility Licensure Status and Size | ||||||||||||||||||||
|---|---|---|---|---|---|---|---|---|---|---|---|---|---|---|---|---|---|---|---|---|
| Small | Medium | Large | Total | |||||||||||||||||
| Licensed | Unlicensed | Total | Licensed | Unlicensed | Total | Licensed | Unlicensed | Total | ||||||||||||
| % | SE | % | SE | % | SE | % | SE | % | SE | % | SE | % | SE | % | SE | % | SE | % | SE | |
| DIRECT CARE OPERATORS | ||||||||||||||||||||
| 8th grad or less | 5 | 1.77 | 5 | 3.39 | 5 | 1.65 | 0 | 0.00 | 0 | 0.00 | 0 | 0.00 | 0 | 0.00 | 0 | 0.00 | 0 | 0.00 | 4 | 1.15 |
| Some High School | 16 | 3.74 | 18 | 8.24 | 16 | 3.56 | 4 | 1.71 | 16 | 7.20 | 5 | 1.61 | 0 | 0.00 | 3 | 3.17 | 1 | 0.77 | 13 | 3.09 |
| High School Grad/GED | 21 | 2.54 | 50 | 21.57 | 22 | 2.71 | 18 | 4.35 | 38 | 15.89 | 19 | 4.38 | 25 | 13.07 | 0 | 0.00 | 19 | 9.99 | 21 | 1.82 |
| Vocational or Trade/Technical School | 4 | 2.69 | 6 | 4.25 | 4 | 2.57 | 7 | 4.34 | 7 | 4.56 | 7 | 4.20 | 0 | 0.00 | 0 | 0.00 | 0 | 0.00 | 4 | 2.82 |
| Some College or 2-year College Grad | 31 | 6.95 | 18 | 8.82 | 31 | 6.81 | 36 | 9.37 | 21 | 11.97 | 35 | 8.95 | 73 | 13.93 | 26 | 10.18 | 63 | 12.58 | 34 | 6.16 |
| 4-year College Grad | 16 | 3.58 | 3 | 2.94 | 15 | 3.49 | 28 | 8.60 | 4 | 4.30 | 28 | 8.34 | 2 | 2.38 | 19 | 8.67 | 6 | 2.72 | 17 | 3.72 |
| Postgraduate | 8 | 2.89 | 0 | 0.00 | 8 | 2.78 | 6 | 3.88 | 15 | 6.97 | 7 | 3.72 | 0 | 0.00 | 52 | 14.94 | 12 | 6.01 | 8 | 2.03 |
| STAFF | ||||||||||||||||||||
| 8th grad or less | 8 | 2.45 | 9 | 5.39 | 8 | 2.40 | 6 | 2.46 | 0 | 0.00 | 6 | 2.42 | 2 | 1.60 | 0 | 0.00 | 2 | 1.52 | 4 | 1.46 |
| Some High School | 13 | 1.75 | 8 | 3.87 | 13 | 1.75 | 18 | 3.75 | 18 | 4.74 | 18 | 3.67 | 10 | 4.14 | 15 | 7.73 | 10 | 4.04 | 13 | 3.19 |
| High School Grad/GED | 22 | 3.06 | 33 | 4.29 | 22 | 3.02 | 28 | 2.94 | 40 | 7.95 | 28 | 2.88 | 21 | 3.80 | 38 | 6.81 | 21 | 3.81 | 23 | 1.92 |
| Vocational or Trade/Technical School | 9 | 2.58 | 7 | 3.76 | 9 | 2.55 | 8 | 2.59 | 2 | 1.49 | 7 | 2.55 | 32 | 7.49 | 7 | 6.30 | 31 | 7.49 | 20 | 6.50 |
| Some College or 2-year College Grad | 28 | 4.38 | 28 | 8.11 | 28 | 4.30 | 29 | 3.74 | 28 | 6.50 | 29 | 3.70 | 28 | 2.95 | 31 | 5.81 | 28 | 2.85 | 28 | 2.03 |
| 4-year College Grad | 16 | 8.22 | 9 | 3.55 | 16 | 8.06 | 8 | 2.78 | 5 | 3.82 | 8 | 2.74 | 5 | 3.20 | 8 | 6.59 | 5 | 3.12 | 8 | 3.18 |
| Postgraduate | 5 | 1.59 | 7 | 5.58 | 5 | 1.57 | 3 | 1.48 | 7 | 3.70 | 3 | 1.47 | 4 | 1.78 | 1 | 0.97 | 4 | 1.74 | 4 | 1.35 |
| TABLE B-2. Staff Experience by Facility Licensure Status and Size | ||||||||||||||||||||
|---|---|---|---|---|---|---|---|---|---|---|---|---|---|---|---|---|---|---|---|---|
| Small | Medium | Large | Total | |||||||||||||||||
| Licensed | Unlicensed | Total | Licensed | Unlicensed | Total | Licensed | Unlicensed | Total | ||||||||||||
| % | SE | % | SE | % | SE | % | SE | % | SE | % | SE | % | SE | % | SE | % | SE | % | SE | |
| LENGTH OF TIME WORKED IN THIS HOME | ||||||||||||||||||||
| <1 month | 1 | 0.66 | 6 | 3.54 | 1 | 0.66 | 2 | 0.68 | 3 | 2.22 | 2 | 0.68 | 5 | 2.70 | 1 | 0.58 | 5 | 2.55 | 3 | 1.02 |
| >=1 month, <6 months | 19 | 3.52 | 31 | 6.10 | 19 | 3.46 | 17 | 4.37 | 3 | 2.02 | 17 | 4.30 | 11 | 1.69 | 16 | 5.33 | 11 | 1.67 | 14 | 1.91 |
| >=6 months, <1 year | 14 | 3.48 | 19 | 5.77 | 14 | 3.41 | 12 | 2.76 | 14 | 5.94 | 12 | 2.74 | 24 | 3.47 | 10 | 1.70 | 24 | 3.53 | 18 | 2.70 |
| >=1 year, <5 years | 52 | 5.44 | 28 | 4.00 | 52 | 5.35 | 49 | 6.49 | 66 | 3.85 | 49 | 6.35 | 39 | 2.51 | 67 | 7.54 | 40 | 2.45 | 45 | 1.40 |
| >=5 years, <10 years | 10 | 4.02 | 15 | 5.26 | 10 | 3.93 | 13 | 2.31 | 8 | 4.23 | 13 | 2.28 | 14 | 4.02 | 7 | 4.86 | 14 | 3.79 | 13 | 2.06 |
| >=10 years | 5 | 1.13 | 1 | 1.00 | 5 | 1.12 | 8 | 2.28 | 6 | 3.20 | 8 | 2.22 | 7 | 1.63 | 0 | 0.00 | 7 | 1.61 | 7 | 1.09 |
| Mean Length of Time in Years | 3 | 0.18 | 2 | 0.30 | 3 | 0.18 | 3 | 0.39 | 3 | 0.67 | 3 | 0.38 | 3 | 0.40 | 2 | 0.20 | 3 | 0.38 | 3 | 0.20 |
| HOURS WORKED PER WEEK | ||||||||||||||||||||
| 40 hours/week | 20 | 3.50 | 30 | 10.45 | 20 | 3.41 | 44 | 5.31 | 45 | 5.42 | 44 | 5.25 | 44 | 7.16 | 55 | 5.02 | 45 | 7.01 | 39 | 3.28 |
| Around the clock | 33 | 4.53 | 31 | 7.59 | 33 | 4.42 | 8 | 1.85 | 10 | 2.88 | 8 | 1.82 | 1 | 0.70 | 1 | 0.68 | 1 | 0.70 | 10 | 3.38 |
| Other (see below) | 47 | 3.19 | 39 | 5.35 | 47 | 3.11 | 49 | 4.43 | 46 | 5.15 | 49 | 4.40 | 55 | 7.65 | 45 | 4.86 | 55 | 7.49 | 51 | 5.11 |
| “OTHER” HOURS WORKED | ||||||||||||||||||||
| 1-39 hours/week | 51 | 9.53 | 58 | 17.49 | 51 | 9.36 | 64 | 4.02 | 37 | 15.64 | 64 | 3.80 | 74 | 5.78 | 89 | 8.27 | 74 | 5.68 | 67 | 5.71 |
| 41-60 hours/week | 31 | 7.11 | 24 | 17.83 | 30 | 7.00 | 31 | 3.62 | 32 | 12.02 | 31 | 3.60 | 26 | 5.78 | 7 | 6.33 | 26 | 5.68 | 28 | 4.62 |
| 61-80 hours/week | 8 | 2.56 | 19 | 13.37 | 8 | 2.51 | 3 | 1.77 | 19 | 9.26 | 4 | 1.70 | 0 | 0.00 | 4 | 4.56 | 0 | 0.14 | 3 | 0.90 |
| 81-100 hours/week | 8 | 4.68 | 0 | 0.00 | 8 | 4.58 | 2 | 0.99 | 13 | 10.59 | 2 | 0.98 | 0 | 0.00 | 0 | 0.00 | 0 | 0.00 | 2 | 1.33 |
| 100+ hours/week | 3 | 1.69 | 0 | 0.00 | 3 | 1.67 | 0 | 0.00 | 0 | 0.00 | 0 | 0.00 | 0 | 0.00 | 0 | 0.00 | 0 | 0.00 | 1 | 0.45 |
| Mean “other” hours/week | 44 | 3.99 | 38 | 7.04 | 43 | 3.93 | 38 | 1.43 | 51 | 8.11 | 38 | 1.29 | 34 | 1.35 | 33 | 1.75 | 34 | 1.33 | 37 | 1.87 |
Appendix C. Resident Characteristics
Resident characteristics are summarized in Appendix C. Our strategy for examining resident characteristics was similar to that described for facility characteristics. We stratified facilities by size and then assessed the impact of facility licensure status upon the distribution of key resident characteristics. We present the results of these analyses in Table C-1, Table C-2 and Table C-3. Table C-4, Table C-5 and Table C-6 present the characteristics of residents in licensed facilities only and examines the impact of regulatory environment upon key characteristics.
| TABLE C-1. Characteristics of Residents by Facility Licensure Status and Size: Background | |||||||
|---|---|---|---|---|---|---|---|
| Background | Small | Medium | Large | Overall Effect of Licensure Status Chi-Square (Prob) | |||
| Licensed % (SE) | Unlicensed % (SE) | Licensed % (SE) | Unlicensed % (SE) | Licensed % (SE) | Unlicensed % (SE) | ||
| RESIDENT AGE | |||||||
| 18-39 | 8.0 (2.3) | 16.2 (4.6) | 5.3 (2.3) | 16.2 (5.8) | 3.6 (1.7) | 6.1 (2.1) | 60.5 (<.01) |
| 40-64 | 15.6 (2.4) | 19.0 (3.3) | 26.2 (2.7) | 25.5 (6.9) | 14.2 (3.2) | 6.0 (1.9) | |
| 65-74 | 17.2 (1.1) | 27.5 (2.6) | 16.4 (2.8) | 6.2 (2.4) | 11.6 (0.9) | 14.4 (1.8) | |
| 75-84 | 25.9 (1.5) | 20.6 (5.2) | 26.3 (3.0) | 24.1 (8.0) | 30.4 (2.8) | 44.3 (5.1) | |
| 85+ | 33.3 (3.1) | 16.6 (2.8) | 25.8 (2.8) | 28.3 (13.5) | 40.2 (3.9) | 29.2 (3.9) | |
| LLChi-Sq. | 4.45 | 17.4 | 51.7 | ||||
| LLProbability | (<.01) | (</01) | (</01) | ||||
| GENDER | |||||||
| Male | 33.0 (2.8) | 49.3 (7.3) | 38.8 (2.4) | 52.1 (8.9) | 31.1 (2.3) | 33.2 (2.6) | 1.2 0.3 |
| Female | 67.0 (2.8) | 50.7 (7.3) | 61.2 (2.4) | 47.9 (8.9) | 68.9 (2.3) | 66.8 (2.6) | |
| LLChi-Sq. | 3.8 | 2.6 | 0.3 | ||||
| LLProbability | (0.07 | 0.13 | .62 | ||||
| RACE | |||||||
| White | 85.8 (2.6) | 69.5 (4.3) | 87.9 (2.9) | 85.2 (5.1) | 95.4 (1.2) | 91.0 (2.6) | 4.5 .39 |
| Black | 11.7 (2.6) | 27.7 (4.6) | 9.8 (3.1) | 13.5 (4.5) | 3.2 (0.9) | 7.9 (2.5) | |
| Asian/PacIsl | 1.7 (1.2) | 1.4 (0.7) | 0.6 (0.6) | 1.0 (0.8) | 0.7 (0.3) | 0.3 (0.2) | |
| AmerInd | 0.8 (0.3) | 0.5 (0.6) | 0.8 (0.5) | 0.0 (0.0) | 0.5 (0.4) | 0.8 (0.6) | |
| Other | 0.1 (0.1) | 1.0 (0.6) | 0.8 (0.4) | 0.4 (0.4) | 0.3 (0.2) | 0.1 (0.1) | |
| LLChi-Sq. | 14.7 | --- | 7.8 | ||||
| LLProbability | 0.03 | --- | .16 | ||||
| HISPANIC | |||||||
| Yes | 6.5 (2.8) | 16.1 (7.7) | 5.5 (1.4) | 11.1 (6.7) | 4.5 (2.5) | 1.5 (0.7) | 1.5 .25 |
| No | 93.5 (2.8) | 83.9 (7.7) | 94.5 (1.4) | 88.9 (6.7) | 95.5 (2.5) | 98.5 (0.7) | |
| LLChi-Sq. | 1.8 | 1.2 | 2.5 | ||||
| LLProbability | .20 | .30 | .14 | ||||
| HIGHEST EDUCATION LEVEL | |||||||
| <9th grade | 28.2 (5.6) | 29.0 (4.5) | 22.2 (1.8) | 27.5 (6.4) | 19.9 (2.1) | 7.6 (1.6) | 42.4 <0.01 |
| Some HS | 16.5 (2.0) | 20.0 (4.1) | 24.6 (3.4) | 20.0 (3.9) | 18.1 (2.5) | 14.0 (1.4) | |
| HS Grad | 22.7 (2.7) | 18.0 (2.3) | 23.1 (2.8) | 22.8 (4.6) | 26.4 (2.1) | 21.1 (2.9) | |
| Trade/Tech | 2.7 (0.8) | 4.2 (1.8) | 6.0 (1.7) | 3.8 (1.5) | 7.5 (1.9) | 6.6 (1.3) | |
| Some College | 13.9 (2.4) | 19.6 (6.7) | 12.2 (1.0) | 14.8 (4.8) | 16.2 (1.8) | 16.3 (2.2) | |
| 4 yr coll grad | 10.7 (2.6) | 5.2 (1.7) | 8.8 (2.9) | 8.8 (2.8) | 9.5 (1.2) | 19.0 (2.8) | |
| Postgrad | 5.3 (1.0) | 3.9 (2.0) | 3.1 (1.1) | 2.2 (1.2) | 2.4 (0.7) | 15.5 (3.9) | |
| LLChi-Sq. | 14.9 | 3.0 | 38.3 | ||||
| LLProbability | 0.08 | 0.79 | <.0.01 | ||||
| RESIDENT/SPOUSE 1992 TOTAL INCOME | |||||||
| <$1200 | 2.6 (0.8) | 0.0 (0.0) | 8.7 (5.1) | 2.1 (1.7) | 3.7 (3.3) | 2.1 (0.9) | 59.4 <0.01 |
| $1200-4999 | 3.0 (1.6) | 5.3 (3.4) | 3.5 (2.2) | 6.4 (2.6) | 1.7 (1.0) | 2.3 (1.5) | |
| $5000-8999 | 10.8 (1.2) | 14.7 (5.8) | 14.6 (3.5) | 1 5.2 (4.5) | 6.8 (2.2) | 3.3 (1.1) | |
| $9000-13,999 | 42.2 (4.2) | 38.7 (7.3) | 35.4 (6.2) | 35.4 (11.2) | 32.2 (6.2) | 12.5 (3.4) | |
| $14,000-24,999 | 24.2 (2.0) | 26.2 (5.5) | 16.9 (1.8) | 26.3 (11.4) | 27.7 (5.4) | 16.2 (3.9) | |
| $25,00-50K | 14.7 (3.8) | 12.4 (5.1) | 13.0 (3.2) | 6.9 (2.8) | 18.6 (3.1) | 21.7 (1.9) | |
| $50K | 2.6 (0.8) | 1.7 (1.1) | 6.2 (3.5) | 7.4 (4.6) | 8.0 (2.1) | 4.5 (18.6) | |
| None | 0.0 (0.0) | 0.9 (0.9) | 1.8 (1.5) | 0.3 (0.3) | 1.3 (1.2) | 18.6 (5.0) | |
| LLChi-Sq. | --- | 47.8 | 104.8 | ||||
| LLProbability | --- | <0.01 | <0.01 | ||||
| MEDICARE BENEFICIARY | |||||||
| Yes | 84.3 (2.5) | 66.6 (5.3) | 76.0 (3.2) | 69.8 (9.4) | 90.7 (2.3) | 87.0 (3.1) | 0.2 0.70 |
| No | 15.7 (2.5) | 33.4 (5.3) | 24.0 (3.2) | 30.2 (9.4) | 9.3 (2.3) | 13.0 (3.1) | |
| LLChi-Sq. | 9.4 | 0.5 | 0.9 | ||||
| LLProbability | 0.01 | 0.49 | 0.37 | ||||
| MEDICAID COVERAGE | |||||||
| Yes | 43.6 (4.6) | 32.1 (7.2) | 42.2 (5.1) | 27.4 (9.9) | 30.3 (7.1) | 4.6 (1.8) | 41.9 <0.01 |
| No | 56.4 (4.6) | 67.9 (7.2) | 57.8 (5.1) | 72.6 (9.9) | 69.7 (7.1) | 95.4 (1.8) | |
| LLChi-Sq. | 1.8 | 1.9 | 33.8 | ||||
| LLProbability | 0.20 | 0.19 | <0.01 | ||||
| SSI RECIPIENT | |||||||
| Yes | 39.8 (5.1) | 28.7 (5.6) | 36.4 (3.6) | 23.6 (8.8) | 29.0 (6.6) | 5.2 (1.7) | 47.8 <0.01 |
| No | 60.2 (5.1) | 71.3 (5.6) | 63.6 (3.6) | 76.4 (8.8) | 71.0 (6.6) | 94.8 (1.7) | |
| LLChi-Sq. | 3.6 | 2.1 | 34.8 | ||||
| LLProbability | 0.08 | 0.17 | <0.01 | ||||
| SOCIAL SECURITY RECIPIENT | |||||||
| Yes | 83.8 (2.8) | 77.9 (4.8) | 78.5 (2.6) | 81.0 (7.5) | 91.2 (2.0) | 88.2 (3.1) | 0.05 0.83 |
| No | 16.2 (2.8) | 22.1 (4.8) | 21.5 (2.6) | 19.0 (7.5) | 8.8 (2.0) | 11.8 (3.1) | |
| LLChi-Sq. | 1.1 | 0.1 | 0.4 | ||||
| LLProbability | 0.32 | 0.75 | 0.47 | ||||
| VA PENSION RECIPIENT | |||||||
| Yes | 9.2 (1.8) | 23.8 (5.0) | 13.1 (2.7) | 18.1 (4.9) | 5.3 (1.2) | 14.8 (5.2) | 4.8 .05 |
| No | 90.8 (1.8) | 76.2 (5.0) | 86.9 (2.7) | 81.9 (4.9) | 94.7 (1.2) | 85.2 (5.2) | |
| LLChi-Sq. | 12.3 | 1.4 | 7.3 | ||||
| LLProbability | <.01 | .25 | 0.2 | ||||
| RESIDENT AGE | 73.8 (1.8) | 65.7 (2.0) | 71.8 (2.1) | 66.8 (5.8) | 77.2 (1.9) | 76.3 (1.5) | (.84) |
| P-Value of t-Test | (.01) | (.42) | (.71) | ||||
| YEARS IN FACILITY | 2.8 (0.3) | 3.0 (0.4) | 2.8 (0.2) | 3.0 (0.5) | 2.5 (0.3) | 3.9 (0.3) | (.02) |
| P-Value of t-Test | (.60) | (.70) | (.01) | ||||
| TABLE C-2. Characteristics of Residents by Facility Licensure Status and Size: Health and Medical Utilization | |||||||
|---|---|---|---|---|---|---|---|
| Health and Medical Utilization | Small | Medium | Large | Overall Effect of Licensure Status Chi-Square (Prob) | |||
| Licensed % (SE) | Unlicensed % (SE) | Licensed % (SE) | Unlicensed % (SE) | Licensed % (SE) | Unlicensed % (SE) | ||
| SELF RATED HEALTH | |||||||
| Poor | 11.3 (3.7) | 9.9 (2.5) | 12.6 (1.6) | 13.4 (6.0) | 6.8 (1.5) | 5.9 (1.2) | 20.0 0.01 |
| Fair | 30.2 (2.5) | 32.7 (3.2) | 34.4 (3.6) | 21.1 (2.6) | 32.8 (4.2) | 24.0 (1.7) | |
| Good | 40.5 (2.4) | 31.4 (5.2) | 34.2 (2.0) | 41.3 (4.3) | 41.2 (2.8) | 38.2 (2.2) | |
| Very Good | 12.8 (3.3) | 12.6 (4.0) | 12.5 (1.6) | 16.5 (5.6) | 14.6 (3.3) | 22.8 (2.6) | |
| Excellent | 5.2 (1.3) | 13.3 (5.6) | 6.2 (2.2) | 7.7 (2.5) | 4.5 (1.5) | 9.1 (1.7) | |
| LLChi-Sq. | 9.3 | 11.0 | 11.1 | ||||
| LLProbability | 0.1 | 0.07 | 0.07 | ||||
| RESPONDENT HAS DIABETES | |||||||
| Yes | 11.0 (1.3) | 12.6 (3.4) | 8.3 (2.0) | 9.1 (5.1) | 12.3 (0.8) | 11.0 (1.6) | 0.02 0.90 |
| No | 89.0 (1.3) | 87.4 (3.4) | 91.7 (2.0) | 90.9 (5.1) | 87.7 (0.8) | 89.0 (1.6) | |
| LLChi-Sq. | 0.2 | 0.3 | 0.6 | ||||
| LLProbability | 0.6 | 0.87 | 0.46 | ||||
| ARTHRITIS/RHEUMATISM | |||||||
| Yes | 42.6 (2.8) | 27.7 (2.5) | 36.9 (2.4) | 47.0 (8.3) | 43.2 (1.2) | 53.7 (1.8) | 27.2 <0.01 |
| No | 57.4 (2.8) | 72.3 (2.5) | 63.1 (2.4) | 53.0 (8.3) | 56.8 (1.2) | 46.3 (1.8) | |
| LLChi-Sq. | 18.8 | 1.8 | 31.0 | ||||
| LLProbability | <0.01 | 0.20 | <0.01 | ||||
| HIGH BLOOD PRESSURE | |||||||
| Yes | 30.0 (2.5) | 26.8 (4.1) | 27.4 (2.4) | 26.9 (6.3) | 26.5 (2.4) | 37.4 (1.8) | 11.8 <0.01 |
| No | 70.0 (2.5) | 73.2 (4.1) | 72.6 (2.4) | 73.1 (6.3) | 73.5 (2.4) | 62.6 (1.8) | |
| LLChi-Sq. | 0.4 | 0.01 | 12.4 | ||||
| LLProbability | 0.53 | 0.94 | <0.01 | ||||
| RESPONDENT HAS MR/DD | |||||||
| Yes | 19.7 (4.7) | 22.9 (4.4) | 8.8 (2.8) | 9.3 (3.6) | 8.5 (2.2) | 2.0 (1.0) | 12.9 <0.01 |
| No | 80.3 (4.7) | 77.1 (4.4) | 91.2 (2.8) | 90.7 (3.6) | 91.5 (2.2) | 98.0 (1.0) | |
| LLChi-Sq. | 0.3 | 0.01 | 14.3 | ||||
| LLProbability | 0.61 | 0.92 | <0.01 | ||||
| MENTAL/EMOTIONAL CONDITIONS | |||||||
| Yes | 42.8 (5.1) | 45.0 (4.8) | 39.8 (4.1) | 52.6 (6.1) | 29.0 (2.4) | 10.2 (2.1) | 26.4 <0.01 |
| No | 57.2 (5.1) | 55.0 (4.8) | 60.2 (4.1) | 47.4 (6.1) | 71.0 (2.4) | 89.8 (2.1) | |
| LLChi-Sq. | 0.1 | 5.0 | 38.5 | ||||
| LLProbability | 0.76 | 0.04 | <0.01 | ||||
| ASTHMA/EMPHYSEMA/COPD | |||||||
| Yes | 13.0 (1.5) | 11.6 (2.9) | 9.6 (1.5) | 16.4 (3.4) | 11.7 (2.1) | 9.1 (0.9) | 0.9 0.35 |
| No | 87.0 (1.5) | 88.4 (2.9) | 90.4 (1.5) | 83.6 (3.4) | 88.3 (2.1) | 90.9 (0.9) | |
| LLChi-Sq. | 0.1 | 4.4 | 1.9 | ||||
| LLProbability | 0.72 | 0.06 | 0.19 | ||||
| # Health Conditions | 1.8 (0.2) | 1.6 (0.1) | 1.5 (0.1) | 1.8 (0.3) | 1.5 (0.05) | 1.4 (0.0) | (.84) |
| P-Value of t-Test | (.01) | (.42) | (.71) | ||||
| ANY HOSPITAL ADMISSIONS, PAST 12 MONTHS | |||||||
| Yes | 30.2 (1.5) | 33.7 (4.8) | 34.2 (3.0) | 43.0 (5.4) | 33.1 (2.6) | 27.6 (3.6) | 0.7 0.41 |
| No | 69.8 (1.5) | 66.3 (4.8) | 65.8 (3.0) | 57.0 (5.4) | 66.9 (2.6) | 72.4 (3.6) | |
| LLChi-Sq. | 1.5 | 2.1 | 0.6 | ||||
| LLProbability | 0.24 | 0.17 | 0.45 | ||||
| ANY ER VISITS, LAST 12 MONTHS | |||||||
| Yes | 29.5 (3.2) | 23.7 (4.8) | 27.2 (2.7) | 38.7 (5.9) | 27.9 (4.3) | 24.8 (3.7) | 0.2 0.67 |
| No | 70.5 (3.2) | 76.3 (4.8) | 72.8 (2.7) | 61.3 (5.9) | 72.1 (4.3) | 75.2 (3.7) | |
| LLChi-Sq. | 0.9 | 3.5 | 0.4 | ||||
| LLProbability | 0.36 | 0.09 | 0.56 | ||||
| ANY MD VISITS, LAST 12 MONTHS | |||||||
| Yes | 90.6 (1.8) | 87.0 (2.5) | 87.8 (2.7) | 83.8 (3.3) | 89.6 (0.8) | 87.0 (1.9) | 1.5 0.25 |
| No | 9.4 (1.8) | 13.0 (2.5) | 12.2 (2.7) | 16.2 (3.3) | 10.4 (1.8) | 13.0 (1.9) | |
| LLChi-Sq. | 1.9 | 1.0 | 0.9 | ||||
| LLProbability | 0.19 | 0.35 | 0.37 | ||||
| ANY PSYCHIATRIC TREATMENT, PAST 12 MONTHS | |||||||
| Yes | 32.8 (4.0) | 40.9 (5.7) | 39.2 (3.0) | 45.2 (9.0) | 26.9 (2.7) | 9.6 (2.7) | 18.9 <0.01 |
| No | 67.2 (4.0) | 59.1 (5.7) | 60.8 (3.0) | 54.8 (9.0) | 73.1 (2.7) | 90.4 (2.7) | |
| LLChi-Sq. | 1.4 | 0.7 | 17.1 | ||||
| LLProbability | 0.26 | 0.43 | <0.01 | ||||
| Total Doctor Visits in Last 12 Months | 5.1 (0.5) | 5.4 (0.7) | 5.3 (0.5) | 6.7 (0.8) | 5.8 (0.3) | 4.2 (0.2) | (.01) |
| P-Value of t-Test | (.80) | (.21) | (>.01) | ||||
| STROKE | |||||||
| Yes | 7.6 (1.6) | 5.6 (1.8) | 4.5 (0.7) | 1.7 (1.1) | 6.1 (1.5) | 2.7 (0.5) | 13.5 <0.01 |
| No | 92.4 (1.6) | 94.4 (1.8) | 95.5 (0.7) | 98.3 (1.1) | 93.9 (1.5) | 97.3 (0.5) | |
| LL Chi-Sq. | 0.6 | 2.0 | 9.5 | ||||
| LL Probability | 0.45 | 0.18 | 0.01 | ||||
| HEART ATTACK | |||||||
| Yes | 2.6 (0.6) | 3.9 (1.6) | 3.0 (0.7) | 2.4 (1.7) | 4.1 (1.3) | 1.9 (0.6) | 5.9 0.03 |
| No | 97.4 (0.6) | 96.1 (1.6) | 97.0 (0.7) | 97.6 (1.7) | 95.9 (1.3) | 98.1 (0.6) | |
| LL Chi-Sq. | 0.8 | 0.1 | 4.7 | ||||
| LL Probability | 0.39 | 0.78 | 0.05 | ||||
| TABLE C-3. Characteristics of Residents by Facility Licensure Status and Size: Physical and Social Functioning | |||||||
|---|---|---|---|---|---|---|---|
| Physical and Social Function | Small | Medium | Large | Overall Effect of Licensure Status Chi-Square (Prob) | |||
| Licensed % (SE) | Unlicensed % (SE) | Licensed % (SE) | Unlicensed % (SE) | Licensed % (SE) | Unlicensed % (SE) | ||
| ADL ASSISTANCE LEVEL: DRESSING | |||||||
| No Problem | 63.6 (3.9) | 74.9 (3.1) | 80.4 (2.0) | 94.4 (1.4) | 80.6 (3.0) | 92.6 (1.8) | 19.7 0.01 |
| No Assistance | 2.0 (0.5) | 2.7 (0.8) | 1.4 (0.5) | 0.0 (0.0) | 1.1 (0.7) | 0.4 (0.4) | |
| Limited/Superv | 19.8 (2.2) | 8.2 (2.4) | 12.4 (1.6) | 4.9 (1.5) | 12.2 (3.9) | 3.4 (1.5) | |
| Exten/Dependent | 14.6 (2.3) | 14.2 (2.0) | 5.7 (1.2) | 0.6 (0.4) | 6.2 (2.0) | 3.6 (1.0) | |
| LLChi-Sq. | 8.4 | --- | 9.6 | ||||
| LLProbability | 0.08 | --- | 0.06 | ||||
| ADL ASSISTANCE LEVEL: GETTING AROUND | |||||||
| No Problem | 73.5 (5.3) | 84.6 (3.0) | 87.1 (2.3) | 82.7 (9.0) | 87.2 (2.8) | 90.3 (1.4) | 11.7 0.03 |
| No Assistance | 7.8 (2.1) | 2.1 (0.9) | 6.1 (1.3) | 13.8 (9.8) | 6.1 (2.0) | 5.6 (1.9) | |
| Limited/Superv | 9.5 (2.7) | 5.5 (1.7) | 4.4 (1.7) | 3.0 (1.5) | 2.8 (1.2) | 1.0 (0.6) | |
| Exten/Dependent | 9.2 (2.1) | 7.8 (2.9) | 2.4 (0.6) | 0.6 (0.4) | 3.9 (0.7) | 3.2 (1.0) | |
| LLChi-Sq. | 8.7 | 6.2 | 3.2 | ||||
| LLProbability | 0.08 | 0.15 | 0.39 | ||||
| ADL ASSISTANCE LEVEL: EATING | |||||||
| No Problem | 81.8 (5.4) | 87.7 (4.3) | 93.6 (1.0) | 96.7 (1.4) | 95.7 (1.1) | 95.9 (1.2) | 6.2 0.15 |
| No Assistance | 6.0 (2.2) | 3.8 (1.8) | 3.4 (0.6) | 0.7 (0.4) | 0.8 (0.5) | 0.9 (0.4) | |
| Limited/Superv | 8.2 (3.0) | 4.0 (2.0) | 1.8 (0.9) | 2.0 (1.7) | 1.5 (0.4) | 1.5 (0.9) | |
| Exten/Dependent | 4.0 (1.3) | 4.4 (1.5) | 1.3 (0.8) | 0.6 (0.4) | 1.9 (0.7) | 1.7 (1.0) | |
| LLChi-Sq. | 2.1 | 12.0 | 0.02 | ||||
| LLProbability | 0.58 | 0.03 | 1.00 | ||||
| ADL ASSISTANCE LEVEL: TRANSFERING | |||||||
| No Problem | 81.8 (3.1) | 85.7 (2.6) | 91.5 (2.2) | 96.3 (2.1) | 94.3 (1.5) | 94.8 (0.9) | 19.4 0.01 |
| No Assistance | 0.9 (0.5) | 1.4 (0.5) | 0.4 (0.4) | 0.5 (0.4) | 0.3 (0.2) | 1.5 (0.8) | |
| Limited/Superv | 7.6 (1.1) | 4.6 (1.7) | 5.2 (1.4) | 2.0 (1.7) | 2.3 (0.9) | 0.4 (0.3) | |
| Exten/Dependent | 9.6 (2.3) | 8.2 (1.8) | 2.9 (1.2) | 1.2 (0.6) | 3.1 (1.1) | 3.3 (1.0) | |
| LLChi-Sq. | 2.6 | 2.4 | 7.0 | ||||
| LLProbability | 0.49 | 0.52 | 0.12 | ||||
| ADL ASSISTANCE LEVEL: TOILETING | |||||||
| No Problem | 65.6 (4.3) | 83.8 (3.1) | 82.5 (1.8) | 83.6 (9.7) | 80.3 (3.5) | 88.1 (2.1) | 20.4 0.01 |
| No Assistance | 9.7 (1.1) | 2.1 (0.7) | 9.6 (1.2) | 13.2 (10.5) | 10.2 (1.9) | 8.3 (1.9) | |
| Limited/Superv | 13.8 (3.2) | 6.5 (1.9) | 4.6 (1.3) | 2.5 (1.8) | 3.2 (1.7) | 0.4 (0.4) | |
| Exten/Dependent | 10.9 (2.5) | 7.7 (1.8) | 3.4 (1.6) | 0.7 (0.4) | 6.4 (1.8) | 3.2 (1.0) | |
| LLChi-Sq. | 22.0 | 5.1 | 6.3 | ||||
| LLProbability | <0.01 | 0.21 | 0.15 | ||||
| Funct Stat # ADLS Needing Help | 1.7 (0.2) | 1.1 (0.2) | 1.0 (0.1) | 0.4 (0.1) | 0.9 (0.1) | 0.4 (0.1) | (>.01) |
| P-Value of t-Test | (.06) | (>.01) | (>.01) | ||||
| ANY INCONTINENCE | |||||||
| Yes | 42.5 (3.6) | 27.2 (5.1) | 24.7 (2.9) | 25.2 (4.7) | 27.6 (2.0) | 18.1 (2.8) | 10.6 0.01 |
| No | 57.5 (3.6) | 72.8 (5.1) | 75.3 (2.9) | 74.8 (4.7) | 72.4 (2.0) | 81.9 (2.8) | |
| LLChi-Sq. | 5.63 | 0.01 | 4.8 | ||||
| LLProbability | 0.03 | 0.93 | 0.05 | ||||
| VISITED FRIENDS AND RELATIVES IN THE PAST 20 DAYS | |||||||
| None | 20.2 (2.2) | 29.6 (5.1) | 26.1 (3.2) | 23.7 (67.5) | 15.3 (3.0) | 11.8 (2.1) | 3.9 0.32 |
| 1-2 | 25.0 (2.1) | 31.9 (4.0) | 24.6 (2.0) | 24.0 (3.2) | 24.6 (2.5) | 21.4 (2.8) | |
| 3-5 | 23.4 (1.5) | 13.1 (2.3) | 24.6 (1.5) | 25.6 (2.7) | 30.0 (2.4) | 28.1 (2.7) | |
| 6+ | 31.4 (2.4) | 25.4 (7.4) | 24.7 (3.0) | 26.8 (5.0) | 30.2 (4.9) | 38.7 (4.2) | |
| LLChi-Sq. | 27.8 | 0.2 | 1.3 | ||||
| LLProbability | <0.01 | 0.97 | 0.72 | ||||
| PHONED FRIENDS AND RELATIVES IN THE PAST 30 DAYS | |||||||
| None | 40.6 (3.5) | 40.5 (5.1) | 32.8 (4.2) | 22.3 (5.6) | 24.6 (3.0) | 6.3 (2.3) | 53.7 <0.01 |
| 1-2 | 16.8 (1.6) | 18.6 (3.2) | 21.4 (3.2) | 16.2 (3.6) | 19.4 (3.2) | 14.7 (2.0) | |
| 3-5 | 17.3 (1.1) | 16.6 (2.5) | 18.7 (1.8) | 17.3 (2.7) | 17.6 (2.8) | 21.5 (3.8) | |
| 6+ | 25.2 (3.7) | 24.3 (4.0) | 27.1 (3.2) | 44.3 (4.5) | 38.4 (4.2) | 57.5 (4.7) | |
| LLChi-Sq. | 0.4 | 17.8 | 24.0 | ||||
| LLProbability | 0.94 | 0.01 | <0.01 | ||||
| PAST 14 DAYS, HOW OFTEN LEFT | |||||||
| None | 33.9 (2.3) | 26.9 (5.1) | 39.6 (2.6) | 17.3 (2.0) | 39.7 (4.0) | 11.4 (2.3) | 16.0 0.02 |
| Once/Twice | 24.5 (2.4) | 22.7 (3.9) | 23.7 (2.2) | 30.6 (9.5) | 27.4 (1.4) | 13.5 (1.2) | |
| 3 To 5 Time | 15.1 (1.6) | 11.6 (2.5) | 10.0 (1.1) | 14.6 (3.1) | 14.2 (1.8) | 19.0 (3.0) | |
| 6/More Times | 16.1 (1.6) | 23.9 (5.6) | 14.6 (1.7) | 17.0 (1.9) | 11.9 (2.6) | 26.3 (4.5) | |
| Daily | 10.4 (2.1) | 15.0 (4.1) | 12.1 (3.6) | 20.5 (8.3) | 6.7 (1.2) | 29.9 (4.1) | |
| LLChi-Sq. | 4.9 | 16.4 | 11.6 | ||||
| LLProbability | >0.1 | 0.02 | 0.06 | ||||
| LEFT HOME AT ALL, PAST 14 DAYS | |||||||
| Yes | 66.1 (2.3) | 74.8 (4.5) | 60.8 (2.6) | 82.9 (2.0) | 61.1 (4.0) | 88.6 (2.3) | 47.3 <0.01 |
| No | 33.9 (2.3) | 25.2 (4.5) | 39.2 (2.6) | 17.1 (2.0) | 38.9 (4.0) | 11.4 (2.3) | |
| LLChi-Sq. | 3.4 | 32.8 | 55.2 | ||||
| LLProbability | 0.09 | <0.01 | <0.01 | ||||
| Mood Last 30 Days | 10.4 (0.5) | 10.7 (0.5) | 10.6 (0.4) | 10.7 (0.4) | 10.4 (0.3) | 9.1 (0.4) | (.01) |
| P-Value of t-Test | (.67) | (.85) | (.02) | ||||
| TABLE C-4. Characteristics of Residents in Licensed Homes by Regulatory Environment: Background | ||||
|---|---|---|---|---|
| Background | Extensive (SE) | Limited (SE) | Log Likelihood Ratio Chi-Square/t-Test | Probability |
| RESIDENT AGE | ||||
| 18-39 | 4.2 (1.2) | 7.4 (1.4) | 9.4 | .06 |
| 40-64 | 14.3 (2.2) | 26.0 (3.5) | ||
| 65-74 | 13.6 (1.6) | 15.2 (1.2) | ||
| 75-84 | 29.8 (2.1) | 24.6 (2.1) | ||
| 85+ | 38.1 (3.4) | 26.7 (3.0) | ||
| GENDER | ||||
| Female | 67.0 (2.3) | 65.3 (2.6) | 0.2 | .64 |
| Male | 33.0 (2.3) | 34.7 (2.6) | ||
| RACE | ||||
| White | 92.8 (1.1) | 87.5 (2.3) | 22.0 | <.01 |
| Black | 4.9 (1.0) | 11.8 (2.3) | ||
| Asian/Pacific Islander | 1.1 (0.5) | 0.3 (0.3) | ||
| American Indian | 0.8 (0.4) | 0.0 (0.0) | ||
| Other | 0.4 (0.2) | 0.4 (0.2) | ||
| RESIDENT IS HISPANIC | ||||
| Yes | 6.4 (2.0) | 2.1 (0.8) | 4.8 | .03 |
| No | 93.6 (2.0) | 97.9 (0.8) | ||
| HIGHEST EDUCATION LEVEL | ||||
| < 9th grade | 18.1 (1.8) | 32.7 (2.0) | 48.1 | <.01 |
| Some high school | 18.0 (2.0) | 22.5 (2.5) | ||
| High school graduate | 26.0 (1.9) | 21.6 (1.6) | ||
| Trade/ technical | 6.6 (1.1) | 4.7 (0.8) | ||
| Some college | 16.8 (1.4) | 9.7 (1.3) | ||
| 4 year college grad | 10.8 (1.4) | 6.6 (1.3) | ||
| Postgrad | 3.6 (0.7) | 2.2 (0.5) | ||
| RESIDENT/SPOUSE TOTAL INCOME (1992) | ||||
| None | 1.4 (1.0) | 0.5 (0.4) | 13.7 | .07 |
| <$1200 | 5.8 (3.0) | 1.8 (0.8) | ||
| $1200-4999 | 2.0 (0.8) | 3.5 (2.1) | ||
| $5000-8999 | 9.2 (2.7) | 10.1 (1.9) | ||
| $9000-13,999 | 30.1 (5.0) | 48.2 (4.5) | ||
| $14,000-24,999 | 26.8 (4.2) | 17.1 (2.8) | ||
| $25,000-50,000 | 18.1 (3.6) | 12.0 (3.1) | ||
| >$50,000 | 6.5 (2.4) | 6.8 (2.5) | ||
| MEDICARE | ||||
| Yes | 87.4 (2.1) | 79.7 (2.8) | 4.9 | 0.03 |
| No | 12.6 (2.1) | 20.3 (2.8) | ||
| MEDICAID BENEFICIARY | ||||
| Yes | 34.6 (4.8) | 42.2 (4.4) | 1.3 | .25 |
| No | 65.4 (4.8) | 57.8 (4.4) | ||
| SSI RECIPIENT | ||||
| Yes | 32.0 (4.0) | 37.4 (5.2) | 6.7 | .41 |
| No | 68.0 (4.0) | 62.6 (5.2) | ||
| SOCIAL SECURITY RECIPIENT | ||||
| Yes | 87.9 (1.9) | 81.8 (2.1) | 4.6 | 0.04 |
| No | 12.1 (1.9) | 18.2 (2.1) | ||
| VA PENSION RECIPIENT | ||||
| Yes | 8.4 (1.3) | 7.4 (1.4) | 0.2 | .62 |
| No | 91.6 (1.3) | 92.6 (1.4) | ||
| AVERAGE AGE | 76.9 (1.3) | 70.2 (1.6) | 3.2 | <.01 |
| YEAR IN FACILITY | 2.4 (0.2) | 3.3 (0.3) | 2.3 | .02 |
| TABLE C-5. Characteristics of Residents in Licensed Homes by Regulatory Environment: Health and Medical Utilization | ||||
|---|---|---|---|---|
| Health and Medical Utilization | Extensive (SE) | Limited (SE) | Log Likelihood Ratio Chi-Square/t-Test | Probability |
| SELF-RATED HEALTH | ||||
| Poor | 9.0 (1.6) | 8.8 (1.3) | 2.9 | .58 |
| Fair | 30.8 (3.2) | 37.2 (1.9) | ||
| Good | 39.9 (2.3) | 38.3 (2.6) | ||
| Very good | 15.1 (2.7) | 11.0 (1.8) | ||
| Excellent | 5.1 (1.2) | 4.8 (1.3) | ||
| RESPONDENT HAS DIABETES | ||||
| Yes | 10.7 (0.9) | 11.8 (1.1) | 0.7 | .42 |
| No | 89.3 (0.9) | 88.2 (1.1) | ||
| ARTHRITIS/RHEUMATISM | ||||
| Yes | 40.2 (3.3) | 45.0 (2.2) | 1.5 | .22 |
| No | 59.8 (3.3) | 55.0 (2.2) | ||
| HIGH BLOOD PRESSURE | ||||
| Yes | 27.3 (3.3) | 28.0 (2.0) | 0.1 | .82 |
| No | 72.7 (2.4) | 72.0 (2.0) | ||
| RESPONDENT HAS MR/DD | ||||
| Yes | 7.6 (1.0) | 20.7 (2.8) | 27.2 | <0.01 |
| No | 92.4 (1.0) | 79.3 (2.8) | ||
| MENTAL/EMOTIONAL CONDITIONS | ||||
| Yes | 32.7 (2.9) | 40.6 (3.6) | 3.0 | .09 |
| No | 67.3 (2.9) | 59.4 (3.6) | ||
| ASTHMA/EMPHYSEMA/COPD | ||||
| Yes | 11.9 (1.4) | 10.4 (1.5) | 0.6 | .45 |
| No | 88.1 (1.4) | 89.6 (1.5) | ||
| STROKE | ||||
| Yes | 5.8 (0.9) | 6.9 (2.3) | 0.2 | 0.62 |
| No | 94.2 (0.9) | 93.1 (2.3) | ||
| HEART ATTACK | ||||
| Yes | 3.0 (0.6) | 4.7 (1.1) | 2.5 | .02 |
| No | 97.0 (0.6) | 95.3 (1.1) | ||
| # HEALTH COND. | 1.5 (0.1) | 1.7 (0.1) | ||
| ANY HOSPITAL ADMISSIONS, PAST 12 MONTHS | ||||
| Yes | 32.0 (1.7) | 34.6 (1.2) | 1.6 | .21 |
| No | 68.0 (1.7) | 65.4 (1.2) | ||
| ANY ER VISITS, LAST 12 MONTHS | ||||
| Yes | 29.4 (2.0) | 24.8 (1.9) | 2.7 | .11 |
| No | 70.6 (2.0) | 75.2 (1.9) | ||
| ANY MD VISITS, LAST 12 MONTHS | ||||
| Yes | 89.3 (1.8) | 89.6 (1.4) | 0.0 | .89 |
| No | 10.7 (1.8) | 10.4 (1.4) | ||
| ANY PSYCHIATRIC TREATMENT, LAST 12 MONTHS | ||||
| Yes | 29.0 (3.0) | 37.2 (4.2) | 2.6 | .11 |
| No | 71.0 (3.0) | 62.8 (4.2) | ||
| TOTAL MD 12 MONTHS | 5.8 (0.4) | 4.6 (0.4) | ||
| TABLE C-6. Characteristics of Residents in Licensed Homes by Regulatory Environment: Physical and Social Functioning | ||||
|---|---|---|---|---|
| Physical and Social Functioning | Extensive (SE) | Limited (SE) | Log Likelihood Ratio Chi-Square/t-Test | Probability |
| ADL ASSISTANCE LEVEL: DRESSING | ||||
| No problem | 74.1 (1.7) | 83.5 (4.0) | 17.2 | <.01 |
| No assistance | 1.6 (0.4) | 0.8 (0.3) | ||
| Limited/Supervision | 14.6 (2.1) | 12.2 (3.5) | ||
| Extensive/Dependent | 9.6 (1.3) | 3.6 (0.8) | ||
| ADL ASSISTANCE LEVEL: GETTING AROUND | ||||
| No problem | 82.1 (2.7) | 89.4 (1.7) | 12.5 | .01 |
| No assistance | 7.2 (1.9) | 4.7 (1.1) | ||
| Limited/Supervision | 5.0 (1.2) | 4.0 (1.1) | ||
| Extensive/Dependent | 5.8 (0.7) | 2.0 (0.8) | ||
| ADL ASSISTANCE LEVEL: EATING | ||||
| No problem | 90.5 (1.1) | 95.7 (0.8) | 14.6 | <0.01 |
| No assistance | 3.1 (0.8) | 1.6 (0.6) | ||
| Limited/Supervision | 3.6 (0.6) | 2.0 (0.5) | ||
| Extensive/Dependent | 2.8 (0.5) | 0.7 (0.4) | ||
| ADL ASSISTANCE LEVEL: TRANSFERRING | ||||
| No problem | 89.4 (1.2) | 94.0 (2.2) | 4.2 | .25 |
| No assistance | 0.4 (0.2) | 0.7 (0.3) | ||
| Limited/Supervision | 4.7 (0.8) | 3.2 (1.2) | ||
| Extensive/Dependent | 5.5 (0.9) | 2.1 (1.0) | ||
| ADL ASSISTANCE LEVEL: TOILETING | ||||
| No problem | 76.0 (2.9) | 81.6 (3.4 | 12.0 | 0.01 |
| No assistance | 8.9 (2.7) | 12.6 (1.6) | ||
| Limited/Supervision | 6.9 (1.2) | 3.2 (1.6) | ||
| Extensive/Dependent | 8.2 (1.4) | 2.5 (0.8) | ||
| FUNC. STAT # ADLS | 1.2 (0.1) | 0.8 (0.1) | ||
| ANY INCONTINENCE | ||||
| Yes | 33.2 (1.8) | 22.4 (2.9) | 8.4 | >0.01 |
| No | 66.8 (1.8) | 77.6 (2.9) | ||
| PAST 14 DAYS HOW OFTEN LEFT | ||||
| None | 38.0 (2.7) | 39.3 (3.6) | 3.0 | .10 |
| Once/Twice | 24.6 (1.9) | 29.4 (2.0) | ||
| 3 to 5 Times | 14.1 (1.5) | 11.3 (2.1) | ||
| 6/More Times | 14.2 (1.8) | 11.8 (1.8) | ||
| Daily | 9.2 (1.4) | 8.2 (2.3) | ||
| LEFT HOME AT ALL, PAST 14 DAYS | ||||
| Yes | 62.3 (2.6) | 61.9 (3.3) | 0.01 | .93 |
| No | 37.7 (2.6) | 38.1 (3.3) | ||
| MOOD | 10.3 (0.3) | 10.7 (0.2) | .95 | .34 |
| VISITED FRIENDS/RELATIVES PAST 30 DAYS | ||||
| None | 17.3 (2.1) | 23.9 (3.1) | 3.8 | 0.29 |
| 1-2 Times | 23.2 (1.6) | 28.7 (2.7) | ||
| 3-5 Times | 28.0 (2.3) | 24.8 (1.9) | ||
| 6+ Times | 31.5 (3.4) | 22.6 (2.6) | ||
| PHONED FRIENDS/RELATIVES PAST 30 DAYS | ||||
| None | 30.8 (2.5) | 30.0 (3.4) | 5.6 | 0.14 |
| 1-2 Times | 15.8 (1.5) | 28.3 (3.3) | ||
| 3-5 Times | 18.6 (1.6) | 15.8 (1.4) | ||
| 6+ Times | 34.8 (2.7) | 25.8 (3.7) | ||