
Age Group Differences in Progress toward Reducing Substance Use Disorders, 2015-2018
ASPE ISSUE BRIEF
Ellen Bouchery
Mathematica
March 2021
Link to Printer Friendly Version in PDF Format (7 PDF pages)
ABSTRACT: This brief presents an overview of trends in the prevalence of substance use disorders between 2015 and 2018. Rates are examined for three age groups: adolescents ages 12-17, young adults ages 18-26, and adults ages 26 and older. Overall, data from the National Survey on Drug Use and Health (NSDUH) suggest that rates of substance use disorders have declined among adolescents and young adults. Rates of substance use disorder have remained constant or increased among adults.
This brief was prepared under contract #HHSP233201600021I between the U.S. Department of Health and Human Services, Office of the Assistant Secretary for Planning and Evaluation, Office of Behavioral Health, Disability, and Aging Policy (BHDAP) and Mathematica. For additional information about this subject, you can visit the BHDAP home page at https://aspe.hhs.gov/bhdap or contact the ASPE Project Officers at HHS/ASPE/BHDAP, Room 424E, H.H. Humphrey Building, 200 Independence Avenue, S.W., Washington, D.C. 20201; Judith.Dey@hhs.gov, Laura.Jacobus-Kantor@hhs.gov, Helen.Lamont@hhs.gov.
DISCLAIMER: The opinions and views expressed in this brief are those of the authors. They do not reflect the views of the Department of Health and Human Services, the contractor or any other funding organization. This brief was completed and submitted on March 2020.
| From 2015 to 2018, the United States made progress reducing substance use disorders (SUDs) among adolescents ages 12-17 and young adults ages 18-25; however, rates of these disorders among adults ages 26 or older, have remained constant or increased. This brief explores the differences in trends across these age groups. |
Trends in Alcohol Use Disorders
The percentage of adolescents ages 12-17 and young adults ages 18-25 who had alcohol use disorders declined significantly from 2015 to 2018. There was a small decline in the percentage of adults ages 26 or older with alcohol use disorders, but this change was not statistically significant (Figure 1).
The reductions among adolescents were a continuation of declines for this age group observed over the last two decades. Past-month alcohol use among adolescents dropped from 17.6% in 2002 to 9.0% in 2018 (SAMHSA 2019a). From 2015 to 2018, binge drinking among adolescents overall declined from 6% to 5% (SAMHSA 2019a). The reasons for the declines in adolescent alcohol use and binge drinking are not fully understood and may be related social or technological changes, or to public health campaigns employed during this time period that targeted teen drinking such as Substance Abuse and Mental Health Services Administration's (SAMHSA's) "Talk. They hear you." campaign. Adolescent alcohol consumption is an important public health concern because early initiation of alcohol consumption is related to the development of alcohol use disorders in later life, and underage drinkers tend to have riskier consumption patterns than adults do, such as drinking more drinks per occasion (CDC 2020).
The rate of alcohol use among young adults ages 18-25 was similar to that for adults ages 26 or older, with 55% of both groups reporting alcohol use in the past month in 2018. However, young adults ages 18-25 are similar to adolescents in that they tend to have more problematic drinking patterns than adults ages 26 or older. Relative to adults 26 and older, young adults ages 18-25 had relatively higher rates of binge drinking (34.9% versus 25.1%) and heavy drinking (9.0% versus 6.2%) (SAMHSA 2019c). Rates of binge and heavy drinking among young adults continued to be higher than among adults ages 26 or older in 2018 despite significant declines in both binge and heavy drinking among young adults from 2015 to 2018 (SAMHSA 2019c).
Trends in Illicit Drug Use Disorders
Illicit drug use disorders consist of disorders associated with use of marijuana, cocaine, heroin, hallucinogens, inhalants, and methamphetamines and misuse of psychotherapeutics including pain relievers. Similar to alcohol use disorders, illicit drug use disorders declined substantially among adolescents ages 12-17 from 2015 to 2018 (Figure 2). The changes in the percentage of young adults ages 18-25 and older adults ages 26 or older indicate small increases in use, but they are not statistically significant. Trends in illicit drug use disorders varied by substance. As discussed below, the shifts in the rates for some substances were substantial.
Marijuana use disorders. Marijuana is considered an illicit drug in the estimates reported here because the Federal Government has not legalized it; however, from 2015 to 2018, some states changed their laws to provide increased legal access to marijuana. Likely in response to these changes, the percentage of young adults ages 18-25 with a marijuana use disorder increased 16%, representing an increase from 1.80 to 2.00 million persons (SAMHSA 2019b).[1] Similarly, the percentage of adults ages 26 or older with a marijuana use disorder increased 13% representing an increase from 1.56 to 1.91 million persons (SAMHSA 2019b).[2] Efforts to legalize marijuana did not focus on persons younger than 18, and some states implemented prevention efforts for adolescents. Thus, in contrast to increases in the rate of marijuana use disorders for older persons, the percentage of adolescents with marijuana use disorders declined 19% in this period, representing a decline from 651 to 512 thousand persons (SAMHSA 2019b).
Opioid use disorders. From 2015 to 2018, federal, state, and local government agencies implemented policies and programs to stem the opioid epidemic. Such initiatives included, for example, SAMHSA's State Targeted Response to the Opioid Crisis grant program, which administered approximately $1 billion in grants to states in fiscal years 2017 and 2018 to support expansion of SUD treatment and recovery support services. Potentially as a result of such efforts, the percentage of young adults ages 18-25 with opioid use disorders declined 40%, and the percentage misusing pain relievers declined 42%. More recently, from 2017 to 2018, the percentage of persons in this age group with heroin use disorders declined 40%. In contrast, the changes in the percentage of persons with these disorders in other age groups were not statistically significant (SAMHSA 2019b). The lack of progress for adults ages 26 or older is particularly troublesome, since this age group represents 79% of all opioid use disorders (Figure 3).
Methamphetamine use disorders. From 2016 to 2018, there was a 33% increase in the percentage of adults ages 26 or older with a methamphetamine use disorder representing an increase from 539 to 899 thousand persons (SAMHSA 2019b). The rates of these disorders in other age groups did not change significantly.
Discussion
Overall, for both alcohol and illicit drugs, progress in reducing the percentage of persons with SUDs was greatest among adolescents and young adults. Although the public health focus on alcohol use in adolescents and young adults is warranted given the higher rates of risky consumption in these age groups, it is notable that progress was not made in reducing rates of alcohol use disorders among adults ages 26 or older. Likewise, whereas opioid use disorders among young adults have declined substantially, the percentage of adults ages 26 or older with such disorders has not changed significantly despite the fact that this age group represents the vast majority of persons with these disorders. Future initiatives may wish to increase efforts specifically targeted to older individuals with SUDs.
| FIGURE 1. Percent Change in Rate of Alcohol Use Disorders from 2015 to 2018, by Age Group |
|---|
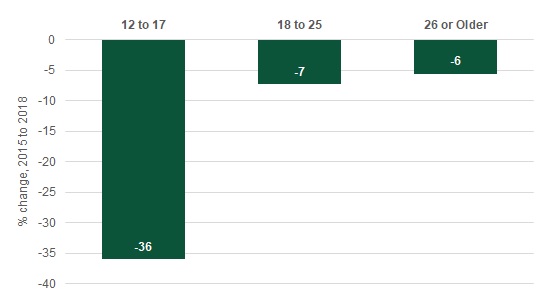 |
| SOURCE: Mathematica's analysis of estimates in SAMHSA 2019a. * The difference between the number with alcohol use disorders in 2018 and 2015 is statistically significant at the 0.05 level. |
| FIGURE 2. Percent Change in Rate of Illicit Drug Use Disorders from 2015 to 2018, by Age Group |
|---|
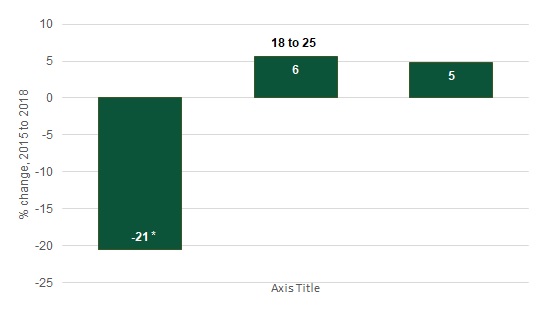 |
| SOURCE: Mathematica's analysis of estimates in SAMHSA 2019a. * The difference between the number with alcohol use disorders in 2018 and 2015 is statistically significant at the 0.05 level. |
| FIGURE 3. Distribution of Persons with Opioid Use Disorders by Age Group, 2018 |
|---|
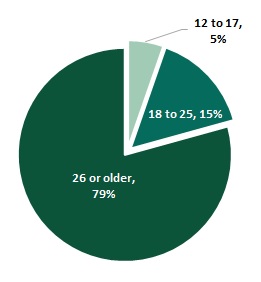 |
| SOURCE: Mathematica's analysis of estimates in SAMHSA 2019b. |
References
Centers for Disease Control and Prevention (CDC). "Underage Drinking." January 3, 2020. Available at https://www.cdc.gov/alcohol/fact-sheets/underage-drinking.htm. Accessed February 16, 2020.
Substance Abuse and Mental Health Services Administration (SAMHSA). "Results from the 2018 National Survey on Drug Use and Health: Detailed Tables Prevalence Estimates, Standard Errors, P Values, and Sample Sizes." Table 7.6B. Rockville, MD: SAMHSA, Center for Behavioral Health Statistics and Quality 2019a. Available at https://www.samhsa.gov/data/sites/default/files/cbhsq-reports/NSDUHDetailedTabs2018R2/NSDUHDetTabsSect7pe2018.htm. Accessed February 16, 2020.
Substance Abuse and Mental Health Services Administration (SAMHSA). "Results from the 2018 National Survey on Drug Use and Health: Detailed Tables Prevalence Estimates, Standard Errors, P Values, and Sample Sizes." Table 7.46A, ages 12 to 17; Table 7.48A, ages 18 to 25; Table 7.49A, ages 26 or older. Rockville, MD: SAMHSA, Center for Behavioral Health Statistics and Quality 2019b. Available at https://www.samhsa.gov/data/sites/default/files/cbhsq-reports/NSDUHDetailedTabs2018R2/NSDUHDetTabsSect7pe2018.htm. Accessed February 22, 2020.
Substance Abuse and Mental Health Services Administration (SAMHSA). "Results from the 2018 National Survey on Drug Use and Health: Detailed Tables Prevalence Estimates, Standard Errors, P Values, and Sample Sizes." Tables 7.12B and 7.15B. Rockville, MD: SAMHSA, Center for Behavioral Health Statistics and Quality 2019c. Available at https://www.samhsa.gov/data/sites/default/files/cbhsq-reports/NSDUHDetailedTabs2018R2/NSDUHDetTabsSect7pe2018.htm. Accessed February 16, 2020.
U.S. Census Bureau, Population Division. "Annual Estimates of the Resident Population by Single Year of Age and Sex for the United States: April 1, 2010 to July 1, 2018." Release Date: June 2019.
Endnotes
-
Note that the estimated increase in the number of young adults ages 18-25 with marijuana use disorders is not statistically significant at the 0.05 level, but the increase in the percentage is statistically significant at the 0.5 level.
-
Note that although the estimated increase in the number of adults ages 26 or older is statistically significant at the 0.5 level, the change in the proportion is not statistically significant at the 0.05 level.
Analyses of Disability, Aging and Long-Term Care Policy and Data
These reports summarize results from BHDAP work examining recent trends in mental health (MH) and substance use disorder (SUD) treatment needs, unmet needs, and system capacity to provide treatment. The reports synthesize data from a variety of existing sources including the National Mental Health Services Survey (N-MHSS), the National Survey of Substance Abuse Treatment Services (N-SSATS), the Treatment Episode Data Set (TEDS), and quality measurement data submitted to the Centers for Medicaid & Medicare Services. Overall, results indicate increasing numbers of individuals with unmet need for MH treatment, very high utilization rates for inpatient and residential MH treatment, and low rates of follow-up for individuals after hospitalization for mental illness. Taken together, these findings suggest that the MH treatment system may not have sufficient capacity to treat current rates of treatment need. The reports also highlight recent increases in the delivery of SUD treatment provided in private doctor’s offices and specialty outpatient settings, and the delivery of medication assisted treatment. Analyses also suggest that SUD prevalence rates have declined among adolescents and young adults, while rates have remained constant, or increased, among adults aged 26 or older. However, rates of unmet need for SUD treatment also remain very high.
Reports were prepared under contract #HHSP233201600021I between the U.S. Department of Health and Human Services, Office of the Assistant Secretary for Planning and Evaluation, Office of Behavioral Health, Disability, and Aging Policy (BHDAP) and Mathematica. For additional information about this subject, you can visit the BHDAP home page at https://aspe.hhs.gov/bhdap or contact the ASPE Project Officers at HHS/ASPE/BHDAP, Room 424E, H.H. Humphrey Building, 200 Independence Avenue, S.W., Washington, D.C. 20201; Judith.Dey@hhs.gov, Laura.Jacobus-Kantor@hhs.gov, Helen.Lamont@hhs.gov.
Reports Available
Has Treatment for Substance Use Disorders Increased? Issue Brief
Chartbook on Behavioral Health Treatment Demand and Provider Capacity in the United States
Mental Health Treatment Need and Treatment System Capacity Issue Brief
Age Group Differences in Progress toward Reducing Substance Use Disorders, 2015-2018 Issue Brief