
Over the 20 year period 1984-2004, use of assistive devices by older Americans (age 65 and older) residing in the community increased greatly. In 1984, 72% of chronically disabled older Americans made some use of assistive devices, with or without additional human help to perform activities of daily living (i.e., tasks such as bathing, dressing, transferring, indoor and outdoor mobility, toileting, and eating). By 2004, the percentage of chronically disabled older Americans who relied at least partially on assistive technologies had risen to 90%. The percentage relying solely on assistive devices to manage chronic disability doubled from 13%-26% between 1984 and 2004, although most of this increase had occurred by 1999. Between 1999 and 2004, the increase in use of assistive devices was primarily as a supplement to human help. The percentage of chronically disabled elders who relied only on human help fell from 28% in 1984 to 10% in 2004. Because assistive device use is becoming more prevalent among the more severely disabled elderly, including those who continue to require some human assistance, this trend may help explain the increasing rate at which older Americans with severe disabilities are remaining in the community rather than becoming long stay nursing home residents.
"Executive Summary
Overview of 20-Year Trends (1984-2004) in Assistive Device Use in the Older Population
Assistive device use by Medicare beneficiaries age 65 or older with chronic disabilities more than doubled over the 20-year period from 1984 to 2004, based on estimates from five nationally representative cross-sections from the National-Long Term Care Survey. In 2004, one in four chronically disabled elders relied on assistive devices only (without help from others), nearly two in three used both devices and help, and only one in seven relied solely on help. Simple devices for mobility, bathing, and toileting--walkers, canes and crutches, tub of shower seats, and raised toilet seats--were most common and saw the largest increases. Among mobility devices, wheelchairs and scooters nearly doubled in prevalence, but use of walkers was twice as prevalent as wheelchairs and scooters and increased the most. Older persons using devices typically also had at least one accommodative feature in their homes (60 percent of persons relying solely on devices and 70 percent of those receiving help and using devices, compared with only 30 percent who relied solely on help).
Comparison of Earlier and More Recent Trends
The large increases in the rate of device use observed between 1984 and 1999 continued in 2004, but contrary to the earlier trend, between 1999 and 2004, the increase was driven by combined use of devices and help rather than sole use of devices.
1984-1999
-
Between 1984 and 1999, the proportion of chronically disabled community residents using assistive devices, with or without help, for all activities in which they had limitation doubled to nearly 30 percent; the proportion relying solely on help fell. Almost 1 million more elders were using equipment with at least one activity in 1999 than in 1984.
-
Most of the increase in device use was in independent use. Nearly one-quarter of elders with chronic disabilities managed all disabilities with only devices in 1999, and almost two-thirds used devices independently for at least one activity.
1999-2004
-
The upward trend in assistive device use continued at about the same pace between 1999 and 2004, so that the overall prevalence rose from 86 percent of community residents with chronic disabilities to 90 percent.
-
The combined effect of the increase in the older population with disabilities from 5.1 million to 5.7 million and the higher prevalence of device use was an increase of nearly 800,000 persons using devices for at least one activity, nearly as large as the increase of 1 million persons in the preceding 15 years.
-
Contrary to the earlier trend, the increase in device use reflects increased use of both help and devices for at least one activity; the prevalence of sole use of devices for all activities was 26 percent in 2004, essentially unchanged from 1999.
Device Use, Hours of Disability Assistance, and Unmet Need for Help
Exploratory cross-sectional multivariate analyses controlling for disability level and other characteristics found statistically significant associations of independent use of devices with fewer hours of help but not with higher rates of reported unmet need for help. Results were generally similar for all persons using both help and devices and among the subset who received help but managed at least one activity with only device use.
-
Each activity performed independently with devices is associated with six fewer hours of care per week for the full sample of persons using devices and help and nearly five fewer hours among those using only devices for at least one activity.
-
For the full sample, each activity performed independently with devices was associated with three fewer informal hours per week; although the magnitude was only slightly smaller for those using devices only for at least one activity, the difference is not statistically significant.
-
In both samples each activity performed solely with devices was associated with significantly fewer formal care hours.
-
Although the magnitudes were small, each activity managed with devices alone was associated with significantly lower rates of unmet need for both activities of daily living (ADLs) and instrumental activities of daily living in the full sample and a significantly lower rate of unmet need for ADLs within the subset using devices only for at least one activity.
Implications for Long-Term Care Services Use
-
The proportion of community-residing elders with chronic disabilities accommodating their functional limitations through use of both help and devices reached nearly two in three in 2004.
-
The group using both assistive devices and help had higher levels of disability than those managing disabilities with only devices or only help, making them an important target for potential policies to promote independent functioning and supporting informal caregivers.
-
The change in the driver of rising assistive device use from sole reliance on devices to use of both devices and help may be related to the increasing rate at which elders with severe chronic disabilities are receiving care in community settings.
-
Findings from cross-sectional multivariate analyses suggest the potential for assistive device use to reduce hours of paid and unpaid help without increasing unmet need for help, but more research is needed to confirm this potential.
Implications for Long-Term Care Policy
-
Although Medicare is a third party payer for many devices through its coverage for durable medical equipment (DME), coverage policies have not changed substantially over the 20-year period of rising device use, so the increases in device use cannot be attributed to deliberate policy efforts.
-
More aggressive marketing to an aging population, Medicare provider behavior, and other market factors related to the Medicare DME benefit may have contributed, however.
-
An implication of the study findings is that policy interventions designed to assist elders and their caregivers in identifying and acquiring appropriate devices might be able to increase independence, reduce hours of formal and informal care needed, and reduce informal caregiver burden, without increasing unmet need. Subsidiary findings suggest that home modifications may be an important part of such interventions.
Introduction
This research updates an earlier study conducted to better understand the upward trend in assistive device use by older persons with disabilities between 1984 and 1999 observed in estimates from the National Long-Term Care Survey (NLTCS) and the implications for policy (Spillman 2005). The context of the earlier study was a declining overall disability rate among older Americans over the 1984-1999 period. The trend was characterized by large decreases in help with independent living activities, such as meal preparation and shopping, associated with lower levels of disability, and smaller decreases in help with personal care activities, such as bathing and dressing, associated with more serious disability (Spillman 2004a, 2004b). Estimates from several national surveys over the period also indicated declines since the mid-1990s in help with personal care activities (Freedman et al. 2004).
Since the original study was undertaken, two key developments have occurred that support the need to revisit device use trends in the NLTCS. The first and most important is the completion of the final 2004 wave of the NLTCS and findings that the longstanding decline in help with disabilities did not continue between 1999 and 2004 (Spillman 2011), although the upward trend in assistive device use continued. Other work examining trends in difficulty and help with personal care and independent living activities across five national surveys confirmed the flattening of the trend in both difficulty and use of help and indicated that it had persisted through 2008 (Freedman et al. 2013).
A substantial body of evidence indicates the potential importance of assistive device use for policy. The evidence suggests that assistive devices may substitute for human assistance under some circumstances, although the full scope and implications of such substitution remains undetermined (see Spillman 2005 for a review of the literature). Nevertheless, if device use is able to reduce or defer the need for help from other persons, it may be able to reduce the demands of disability care on both families and public programs, increase independence and quality of life for elders with disabilities, and have other desirable outcomes.
Besides updating trends, this new research was undertaken, like the original study, to elucidate trends in device use and identify where interventions to promote access to devices may be most effective. The analysis has the following primary aims:
-
To update information on trends in use of disability devices, using data from the 1984 through 2004 rounds of the NLTCS.
-
To describe differences in characteristics of device users and nonusers.
-
To examine differences in the hours of care received by device nonusers and by persons using devices with and without help.
In addition, this update incorporates exploratory multivariate models to examine cross-sectional associations between patterns of assistive device use, hours of care, and reported unmet need for help among those using a combination of assistive devices and help.
Data and Methodology
The NLTCS is a nationally representative survey of persons aged 65 or older residing in the community or institutions conducted from 1982 through 2004, its final year.1 The survey was designed to identify those with chronic disabilities and to collect detailed data on their disability, service use, family support, and health and demographic characteristics. This study relies on cross-sectional samples of community residents reporting chronic disability from the five waves of the survey conducted in 1984, 1989, 1994, 1999, and 2004.
Disability items included are six personal care activities, or activities of daily living (ADLs), and eight independent living activities, or instrumental activities of daily living (IADLs). The ADLs are bathing, dressing, getting around inside, getting in and out of bed (transfer), toileting and eating. The included IADLs are shopping, managing money, meal preparation, laundry, light housework, taking medicines, getting around outdoors, and telephoning. The NLTCS disability measures allow measurement of use of help, use of disability-related devices ("special equipment"), reported need for help with ADLs, and inability to perform IADLs. Detail on types of devices used is collected for four ADLs (transfer, getting around indoors, bathing, and toileting) and for getting around outside, the one IADL for which disability-related device use is collected. For eating and dressing, information is limited to whether respondents used such items as special dishes or utensils, or special clothing or equipment.
For this study and the original study, the disability information is used to describe trends in use of assistive devices with and without help and trends in the types of devices used, among community-residing persons reporting at least one chronic disabilities (defined as having lasted 90 days or longer). Assignment of respondents to categories of using help only, assistive devices only, or a combination of the two is based on all disabilities reported, including disabilities that have not yet met the criterion for being chronic.
The distinction between rates based on this measure and the overall disability rates reported in Spillman (2004, 2011a) is two-fold. First, the aim is to look within the population with chronic disabilities to understand the mix of accommodations used. Second, whereas Spillman (2011a) used a hierarchical measure that identified persons with chronic help versus those using assistive devices without help for all disabilities, this analysis further discriminates the use of both assistive devices and help, within the population receiving help with chronic disabilities. Use of both devices and help is defined as any combination of performing some individual activities independently with devices or using both help and devices for individual activities.
In addition, disability characteristics, human and environmental support, and socioeconomic characteristics are examined for chronically disabled elders in 2004, grouped by whether they used only devices, only help, or both. Hours of care are examined for persons using help only or help and devices, and, among those using both help and devices, for persons using devices with help and persons performing some activities with only devices.
Major Findings From the Original Study
Trends in Device Use
-
Between 1984 and 1999, the proportion of chronically disabled community residents using assistive devices, with or without help, for all activities doubled to nearly 30 percent; the proportion relying solely on help fell. Almost 1 million more elders were using devices with at least one activity in 1999 than in 1984.
-
Most of the increase in device use was in independent device use. Nearly one-quarter of disabled elders managed all chronic disabilities with only devices in 1999, and almost two-thirds used devices independently for at least one activity.
-
Bathing was the only activity with a strong upward trend in independent use of devices and a similarly strong downward trend in sole use of help, but significant increases in independent use of devices occurred for all four mobility-related ADLs--bathing, getting around inside, transferring, and toileting--and for getting around outside.
-
Simple devices for mobility, bathing, and toileting--walkers, canes and crutches, tub or shower seats, and raised toilet seats--continued to be the most common devices and saw the largest increases, although wheelchairs and scooters also nearly doubled in prevalence.
Characteristics of Users and Nonusers of Devices
-
In 1999, about one in four chronically disabled community residents used only devices for all disabilities; nearly 60 percent used a combination of help and devices; and only about 15 percent reported using only help with all chronic disabilities.
-
Persons managing all chronic disabilities with only devices were less disabled than persons using both help and devices, particularly with respect to mobility and the frequency with which accommodation was needed; those using only help were far less disabled than those using devices.
-
Essentially none of the group using only devices reported unmet need for help with ADLs, compared with about one in five persons using both help and devices, and about one in ten persons receiving only help.
-
Persons managing all disabilities with devices were most likely to live alone, and to live in some type of senior housing, while persons using both devices and help were most likely to live in an explicit community residential care setting, such as assisted living.
-
Persons using only help were most likely to live with a spouse and far less likely than persons using devices to have any environmental accommodations, such as railings or raised toilet seats, or to consider them desirable.
-
Both groups using devices were older and relatively similar in gender distribution compared with persons using only help, who were more likely to be male.
-
Persons relying solely on devices had higher education and income than either group using help.
Hours, Device Use, and Independent Device Use
-
Hours of care received in the last week rose with disability level and generally were higher for the group using both help and devices than for the group using only help.
-
Frequency of need for accommodations, especially for mobility or transfer was important; hours of help were more than doubled for respondents reporting they needed accommodation for any ADL most of the time.
-
Persons with at least three ADLs who used devices with help received far more hours of care than persons performing at least one activity only with devices; they also received more hours than similarly disabled persons receiving only help.
Updated Trends and New Analyses
The remainder of this memorandum first presents updated trends in use of assistive devices through 2004 for the community-residing population with chronic disabilities. Results are then presented for an exploratory cross-sectional multivariate analysis of the 2004 data, examining whether the earlier descriptive those using both help and devices who performed at least one activity independently with devices received fewer hours of help persists after controlling for physical and cognitive functional status, demographic and economic characteristics, and health. Because reduced hours also may imply unmet need, reported unmet need for help is also examined. All descriptive and multivariate estimates in this memorandum are produced using svy commands in Stata, which adjust standard errors for complex survey design.
Trends in Device Use
-
The upward trend in assistive device use continued at about the same pace between 1999 and 2004, rising from 86 percent of community residents with chronic disabilities to 90 percent (Figure 1).
-
The combined effects of the increase in the number with disabilities from 5.1 million to 5.7 million and the increased prevalence of device use resulted in an increase of nearly 800,000 persons using devices for at least one activity, nearly as large as the increase of 1 million persons between 1984 and 1999.
-
Also as in the earlier years, use of help only with all disabilities continued to decline, falling from 14 percent to 10 percent.
-
Contrary to the earlier trend, however, the increase in device use was not driven by increasing sole use of devices for all activities, which was 26 percent in 2004 essentially unchanged from 1999; rather, the increase reflects increased use of both help and devices for at least one activity.
-
The proportion of those with chronic disabilities using a combination of help and devices with disabilities rose slowly, from 58 percent in 1984 to 64 percent, but the proportion receiving help with at least one activity but using devices only for at least one activity remained roughly constant at 40 percent throughout (not shown).
| FIGURE 1. Trend in Assistive Device Use: Chronically Disabled Community Residents Age 65+ |
|---|
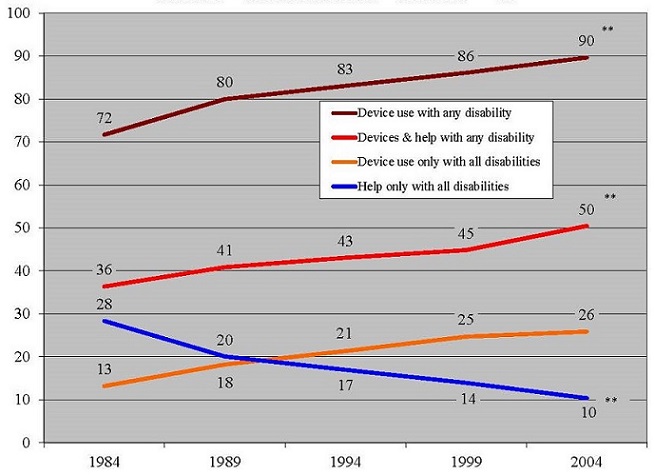 |
| NOTE: All trends statistically significant between 1984 and 2004. ** Indicates significant change between 1999 and 2004. |
Trends for Individual Activities
The prevalence of all seven activities for which information on use of devices is collected as well as the prevalence of device use increased significantly within the community population with chronic disabilities between 1984 and 2004 (Table 1).
-
Between 1999 and 2004, however, results for both the prevalence of disabilities and devices are more mixed.
- Disability in and of use of devices for bathing, getting around inside, and toileting increased between 1999 and 2004.
- No significant change occurred in the prevalence of limitation in getting around outside, dressing, or eating disability, and device use increased only for getting around outside.
- The prevalence of disability in transferring declined significantly, with no significant change in the prevalence of device use.
| TABLE 1. Trends in Use of Assistive Devices among Community Disabled Elderly, by Activity, 1984-2004 | |||||||
|---|---|---|---|---|---|---|---|
| 1984 (%) | 1989 (%) | 1994 (%) | 1999 (%) | 2004 (%) | Change 99-04 | Change 84-04 | |
| Getting around outside | 72.3 | 76.2 | 76.1 | 80.9 | 81.4 | 0.5 | 9.1** |
| Active or standby help only | 22.2 | 22.1 | 22.3 | 26.0 | 23.1 | -2.9** | 0.9 |
| Any equipment use | 50.1 | 54.1 | 53.7 | 55.0 | 58.3 | 3.4** | 8.2** |
| Equipment only | 31.6 | 36.3 | 35.3 | 35.9 | 29.8 | -6.1** | -1.8 |
| Equipment and help | 18.5 | 17.8 | 18.4 | 19.0 | 28.5 | 9.5** | 10.0** |
| Bathing | 52.6 | 58.6 | 60.9 | 64.8 | 68.9 | 4.1** | 16.4** |
| Active or standby help only | 24.1 | 21.9 | 19.1 | 13.5 | 10.0 | -3.5** | -14.1** |
| Any equipment use | 28.5 | 36.7 | 41.9 | 51.3 | 59.0 | 7.7** | 30.5** |
| Equipment only | 13.8 | 17.5 | 18.8 | 24.4 | 28.7 | 4.3** | 14.9** |
| Equipment and help | 14.6 | 19.2 | 23.0 | 26.8 | 30.3 | 3.4** | 15.6** |
| Getting around inside | 48.3 | 54.2 | 55.6 | 56.8 | 59.6 | 2.8* | 11.3** |
| Active or standby help only | 8.1 | 8.4 | 6.7 | 7.6 | 6.5 | -1.1 | -1.7** |
| Any equipment use | 40.1 | 45.8 | 48.9 | 49.2 | 53.1 | 3.9** | 13.0** |
| Equipment only | 23.5 | 27.1 | 28.6 | 28.0 | 30.9 | 2.9** | 7.3** |
| Equipment and help | 16.6 | 18.8 | 20.3 | 21.2 | 22.3 | 1.1 | 5.7** |
| Transfer | 33.2 | 36.4 | 36.5 | 44.5 | 41.8 | -2.7* | 8.6** |
| Active or standby help only | 9.7 | 9.1 | 8.0 | 9.0 | 8.3 | -0.7 | -1.4* |
| Any equipment use | 23.5 | 27.3 | 28.5 | 35.5 | 33.5 | -2.0 | 9.9** |
| Equipment only | 10.7 | 13.0 | 12.7 | 17.4 | 15.6 | -1.8* | 4.9** |
| Equipment and help | 12.9 | 14.4 | 15.7 | 18.1 | 17.9 | -0.2 | 5.0** |
| Toileting | 29.6 | 34.3 | 40.3 | 41.4 | 45.7 | 4.3** | 16.0** |
| Active or standby help only | 10.0 | 4.8 | 7.5 | 7.8 | 7.6 | -0.2 | -2.3** |
| Any equipment use | 19.6 | 29.5 | 32.8 | 33.6 | 30.8 | 4.4** | 18.4** |
| Equipment only | 9.7 | 14.1 | 19.1 | 18.3 | 23.0 | 4.7** | 13.3** |
| Equipment and help | 10.0 | 15.4 | 13.7 | 15.3 | 15.1 | -0.2 | 5.1** |
| Dressing | 25.4 | 26.7 | 26.6 | 27.3 | 28.1 | 0.8 | 2.6** |
| Active or standby help only | 23.6 | 24.4 | 23.6 | 24.4 | 24.7 | 0.3 | 1.1 |
| Any equipment use | 1.8 | 2.3 | 2.9 | 2.9 | 3.3 | 0.4 | 1.5** |
| Equipment onlya | 0.7 | 0.9 | 1.2 | 1.1 | 1.3 | 0.2 | 0.6** |
| Equipment and help | 1.2 | 1.4 | 1.7 | 1.8 | 2.1 | 0.2 | 0.9** |
| Eating | 12.9 | 13.4 | 14.3 | 16.0 | 16.4 | 0.4 | 3.5** |
| Active or standby help only | 11.9 | 11.8 | 12.8 | 14.1 | 14.7 | 0.6 | 2.8** |
| Any equipment use | 1.0 | 1.6 | 1.5 | 1.9 | 1.6 | -0.2 | 0.7** |
| Equipment onlya | 0.2 | 0.3 | 0.2 | 0.3 | 0.4 | 0.0 | 0.1 |
| Equipment and help | 0.7 | 1.3 | 1.3 | 1.6 | 1.3 | -0.3 | 0.5** |
NOTE:
**(*) Indicates that difference is significantly different from zero at the 5%(10%) level in a two-tailed test. | |||||||
-
Use of only help or only devices also showed a mixed pattern between 1999 and 2004.
- For bathing, use of only help continued to decline and sole use of devices continued to increase, but use of devices with help also increased.
- For toileting, the reduction in sole use of help did not continue, but there was a significant increase in sole use of devices and no change in use of devices with help.
- Getting around outside had the most dramatic change between 1999 and 2004, with reductions in use of only help and in use of only devices, absorbed by a nearly 10 percentage point increase in use of devices with help, so that overall prevalence did not change.2
-
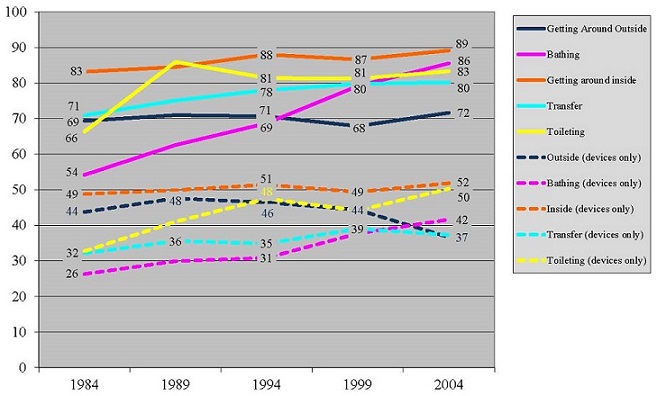
The prevalence of device use among those with each of the disabilities generally rose over the period and is high--from a little more than 70 percent to nearly 90 percent in 2004 (Figure 2, solid lines)--with the exception of dressing and eating (not shown), for which device users represent less than 10 percent.
- The prevalence of device use for each activity was roughly stable between 1994 and 2004 with the exception of bathing, for which device use rose by 15 percentage points in that decade after having increased by a similar amount between 1984 and 1994.
| FIGURE 2. Device Use and Sole Device Use by Activity (% of those with disability in each activity) |
|---|
 |
-
The percent using only devices among those with each disability ranged from 37 percent to 52 percent in 2004 (Figure 2, dashed lines), with notable changes for toileting, bathing, and getting around outside, whereas sole use of devices for getting around inside and transfer were relatively stable.
- For bathing, both the proportion using only devices and the proportion using devices with help rose, so that the 86 percent of those using devices for bathing were divided roughly equally between sole device use (42 percent) and device use with help (44 percent).
- For toileting, only sole use of devices increased, after a dip between 1994 and 1999, with no change in use of devices with help; in 2004, 60 percent of the 83 percent with disability in toileting who used devices were using them independently.
- Conversely, for getting around outside, both use of only help and use of only devices fell, while use of devices with help rose; by 2004, slightly more than half of those using devices to get around outside were using them independently, down from about two-thirds in the previous three survey waves.
Updated Trends in Types of Devices
The strong upward trend in use of devices of all types by elders with chronic disabilities continued in the 1999-2004 period.
-
The most common devices in all years are the major types of mobility aides (Figure 3), including canes, walkers, crutches, wheelchairs and scooters, which were used by 73 percent of elders with chronic disabilities.3
- The increase in use of mobility devices between 1999 and 2004 was attributable to increased use of walkers, from 18 percent to 23 percent; no significant occurred in the use of canes or wheelchairs and scooters (not shown).
| FIGURE 3. Trend in Mobility, Other Device Use (% of community residents with chronic disabilities) |
|---|
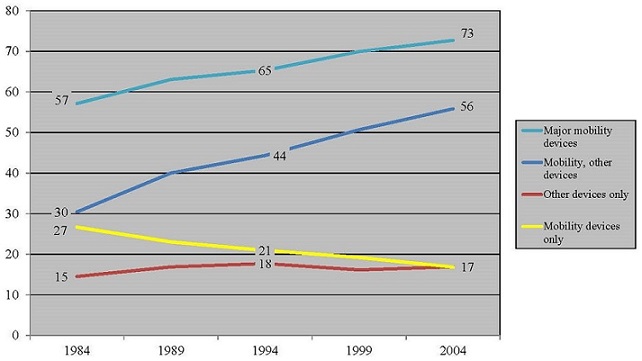 |
| NOTE: Major mobility devices are canes, walkers, crutches, wheelchairs, and scooters. |
-
The proportions using only mobility devices continued to decline, and the proportion using only other devices was stable, as the proportion using multiple devices for mobility and other activities rose continued to increase rapidly--by about 2.5 percent per year over the last decade.
-
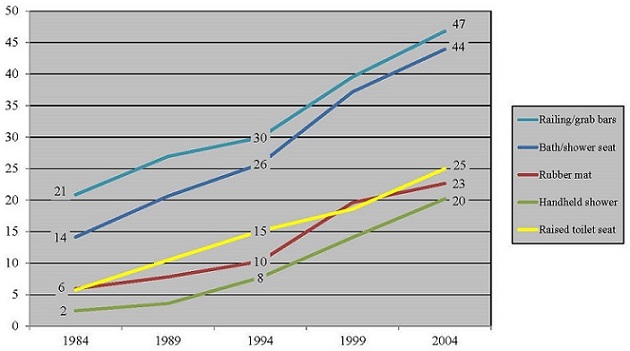
Aside from mobility devices, simple commonly available aides for bathing and toileting were the most common in 2004, as in the earlier years, and their prevalence continued to increase significantly between 1999 and 2004 (Figure 4).
- Railings or grab bars most commonly used for bathing or toileting, were most prevalent in 2004 (47 percent), followed by bath or shower seats (44 percent), having increased by 4.5 percent and 5.5 percent per year, respectively, over the last decade.
- Although less prevalent, use of raised toilet seats (25 percent in 2004) and hand-held showers (20 percent) continued to grow rapidly between 1999 and 2004, while use of rubber mats (23 percent in 2004) moderated somewhat.
| FIGURE 4. Prevalence of Devices with Fastest Growth (% of community residents with chronic disabilities) |
|---|
 |
Updated Characteristics of Device Users and Nonusers
Disability Characteristics
Estimates for 2004 indicate a similar profile of disability by device use as in 1999 among community residents with chronic disabilities, with about three in five using both help and devices, and about one in four relying solely on devices (Table 2).
| TABLE 2. Disability and Support Characteristics by Device Use or Nonuse, Community Residents with Age 65 or Older with Chronic Disabilities, 2004 | ||||||
|---|---|---|---|---|---|---|
| Devices Only for All Chronic Disabilitiesa | Both Devices & Help for Chronic Disabilitiesb | Help Only for All Chronic Disabilitiesc | ||||
| Number | Percent | Number | Percent | Number | Percent | |
| All | 1,513,680 | 100.0 | 3,572,393 | 100.0 | 659,379 | 100.0 |
| Disability Characteristics | ||||||
| Physical limitationsd | ||||||
| None or upper body only | 293,218 | 19.4** | 208,758 | 5.8** | 141,364 | 21.4 |
| Lower body only | 702,974 | 46.4** | 966,233 | 27.0* | 221,894 | 33.7** |
| Both upper and lower body | 517,489 | 34.2** | 2,397,402 | 67.1** | 296,121 | 44.9** |
| Cognitive impaired | 84,017 | 5.6** | 978,956 | 27.4** | 228,394 | 34.6** |
| Disability level | ||||||
| IADL only | 254,430 | 16.8** | 142,706 | 4.0** | 400,167 | 60.7** |
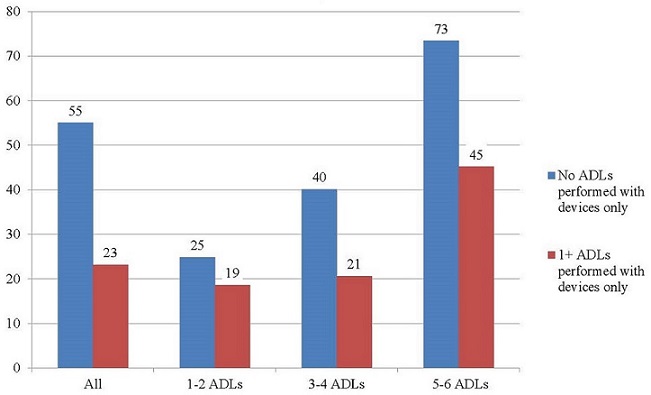
| 1-2 ADLs | 1,021,537 | 67.5** | 1,142,289 | 32.0** | 165,157 | 25.0** |
| 3-4 ADLs | 235,698 | 15.6** | 1,133,434 | 31.7** | 29,590 | 4.5** |
| 5-6 ADLs | 2,015 | 0.1**# | 1,153,964 | 32.3** | 64,465 | 9.8** |
| Duration of chronic disability | ||||||
| Less than 1 year | 186,167 | 12.3 | 357,702 | 10.0** | 93,732 | 14.2 |
| 1 year to 5 years | 708,143 | 46.8 | 1,778,609 | 49.8 | 350,582 | 53.2* |
| 5 years or longer | 619,370 | 40.9 | 1,436,082 | 40.2** | 215,065 | 32.6** |
| Help/equipment with any ADL most of the time | 923,589 | 61.0** | 3,033,550 | 84.9** | 71,755 | 10.9** |
| Unmet need for help/more help with any ADL | 7,268 | 0.5**# | 990,064 | 27.7** | 113,938 | 17.3** |
| Unmet need for help with any IADL | 409,494 | 27.1** | 1,872,018 | 52.4 | 311,572 | 47.3** |
| Support Characteristics | ||||||
| Living arrangement | ||||||
| Alone | 812,715 | 53.7** | 1,285,057 | 36.0** | 159,756 | 24.2** |
| With spouse | 513,932 | 34.0 | 1,268,438 | 35.5** | 288,208 | 43.7** |
| With others | 187,034 | 12.4** | 1,018,898 | 28.5 | 211,415 | 32.1** |
| Residential type | ||||||
| Private residence | 1,224,996 | 80.9 | 2,801,366 | 78.4** | 581,535 | 88.2** |
| Community residential caree | 84,259 | 5.6** | 434,418 | 12.2** | 34,118 | 5.2 |
| Other setting for older or disabled persons | 204,425 | 13.5** | 336,609 | 9.4* | 43,726 | 6.6** |
| Any home accommodative features presentf | 925,850 | 61.2** | 2,439,724 | 68.3** | 180,705 | 27.4** |
| Any home accommodative features desirablef | 548,871 | 36.3** | 1,670,536 | 46.8** | 213,571 | 32.4 |
| Education | ||||||
| Less than high school | 493,805 | 32.6** | 1,546,205 | 43.3 | 307,389 | 46.6** |
| High school graduate | 472,049 | 31.2* | 970,896 | 27.2 | 184,007 | 27.9 |
| Some college | 547,826 | 36.2** | 1,055,292 | 29.5 | 167,984 | 25.5** |
| Categorical income | ||||||
| Less than $10,000 | 263,915 | 17.4** | 905,449 | 25.3 | 151,148 | 22.9 |
| $10,000 - $20,000 | 570,487 | 37.7 | 1,308,197 | 36.6 | 216,862 | 32.9 |
| $20,000 - $30,000 | 314,761 | 20.8 | 682,561 | 19.1 | 152,751 | 23.2 |
| $30,000 or more | 364,517 | 24.1** | 676,186 | 18.9 | 138,618 | 21.0 |
NOTES: # estimate does not meet the precision criterion of standard error less than 30% of estimate. Significance assessed in two-tailed tests.
| ||||||
-
Those using both devices and help continued to have a higher disability level than those relying solely on either devices or help.
- Two in three of those using both devices and help had physical limitation in both upper and lower body activities, compared with about one in three of those using only devices and 45 percent of those relying solely on help.
- About two-thirds also reported at least three ADLs, whereas a similar proportion of those using only devices had 1-2 ADLs, and 60 percent of those relying solely on help had disability only in IADLs.
-
The rate of cognitive impairment, which could not be examined in the 1999 data, was highest (35 percent) in the less severely disabled group using only help, and very low (less than 6 percent) in the group using devices only.
-
As in 1999, there were no striking differences across the groups in the duration of disability, although those receiving only help were less likely to have very long duration of 5 years or more.
-
Rates of unmet need were higher in 2004 than in 1999 for all groups, although, as in 1999, the group using only both help and devices was most likely and those relying only on devices least likely to report unmet need.
- Unmet need for ADL help rose from about 21-28 percent among those using both help and devices and from about 11-17 percent among those using only help; unmet ADL need continued to be virtually nonexistent for those using only devices.
- Unmet need for IADL help was reported by more than half of those using help and devices and nearly of those using only help, but also by more than a quarter of those using only devices.
Support Characteristics
Some notable changes in support environment and resources occurred between 1999 and 2004.
-
Those managing all disabilities with devices were still most likely to live alone and those using only help were still most likely to live with a spouse, although the proportion of this group living with persons other than a spouse increased from about one-quarter to nearly one-third.
-
Residential care became more common for all three groups, but increased most for those using both help and devices, from about 7 percent in 1999 to about 12 percent in 2004, a little more than twice the proportion for the other two groups.
-
Larger proportions of all three groups had accommodative features in their homes and identified features that would be desirable in 2004. Nearly 70 percent of those using help and devices, more than 60 percent of those using only devices had at least one accommodative home feature, compared with less than 30 percent of those using only help.
-
The level of education, which can be associated with greater adaptation to changing function, also rose across all three groups, but continued to be highest among those relying solely on devices and lowest among the group using only help.
-
As in 1999, those using only devices were least likely to have income below $10,000 and most likely to have income of $30,000 or more, although the differences across the groups were not striking.
| TABLE 3. Mean Hours of Care in the Last Week for Device Users and Nonusers, 2004 | |||
|---|---|---|---|
| Devices and Personal Assistance | Personal Assistance Only | Difference | |
| All | 39 | 26 | 13** |
| Physical limitations | |||
| None or upper body only | 27 | 21 | 6 |
| Lower body only | 23 | 30 | -7 |
| Both upper and lower body | 46 | 26 | 20** |
| Cognitive impaired | 62 | 32 | 30** |
| Disability level | |||
| IADL only | 23 | 21 | 2 |
| 1-2 ADLs | 21 | 27 | -6 |
| 3-4 ADLs | 26 | 27 | -1 |
| 5-6 ADLs | 68 | 48 | 20* |
| Duration of chronic disability | |||
| Less than 1 year | 35 | 24# | 11 |
| 1 year to 5 years | 39 | 26 | 13** |
| 5 years or longer | 40 | 27 | 13** |
| Any ADLs with help/devices most of the time | 41 | 30# | 11 |
| Help needed or more help needed with any ADL | |||
| No | 35 | 23 | 12** |
| Yes | 47 | 37 | 10 |
| Help needed with any IADL for which no help received | |||
| No | 42 | 27 | 14** |
| Yes | 36 | 24 | 12** |
| NOTE: **(*) denotes that difference is significantly different from zero at the 5%(10%) level in a two-tailed test. # indicates that estimate does not meet the precision criterion of standard error less than 30% of estimate. | |||
Hours, Device Use, and Independent Device Use
-
As in 1999, hours of care in the last week generally rose with level of disability for both groups, and were higher for the group using both help and devices than for the group using only help, consistent with their higher average level of disability (Table 3).
-
The largest differences--20 hours or more per week--are for those with both upper and lower body limitations, cognitive impairment and very high levels of ADL disability.
-
Interestingly, for both groups, those reporting unmet need for help or more help with at least one ADL were receiving more hours of help those reporting no need.
-
-
Within the group using both help and devices, those able to manage at least one disability with only devices received significantly fewer hours of care in the previous week (Figure 5).
| FIGURE 5. Hours of Care in Last Week among Those Using Both Help and Devices |
|---|
 |
| NOTE: Difference in hours between those performing some activities with devices and those using devices with help statistically different at the 5% level in a two-tailed test. |
Analysis of Independent Device Use, Hours of Care, and Unmet Need
This new analysis takes a first multivariate look at factors associated with independent device use for some activities and the association of independent device use with hours of care and unmet need in cross-section. To abstract from the larger question of whether any devices are used and focus on the effect of independent use on care hours and unmet need, the analysis sample is limited to community-residing elders with disabilities using both help and devices.
Methodology
Separate models are used to examine the probability that an individual accommodating disabilities with any combination of help and device use manages at least one activity with only assistive devices, and the association between independent device use and hours of care received and unmet need reported. Models examine total hours of care, informal care hours, formal care hours, and unmet need for all persons using help and devices and for the subset managing at least one activity with devices only. The central explanatory variable is the number of activities for which devices alone are used, although interesting findings for the presence and need for home accommodative features also are discussed briefly. Other explanatory variables include physical limitations, number of disabilities, number of disabilities for which devices are used, health conditions, and basic demographic and economic characteristics. Probit regression is used estimate the probability of any independent device use and reports of unmet need and linear regression to estimate care hours.
Descriptive Results
Table 4 provides means and proportions of characteristics used in the multivariate models for elders using both help and assistive devices by whether any activities are performed with devices alone. Differences in the last column reflect how those performing no activities with devices only differ from those performing at least one activity with devices alone.
| TABLE 4. Characteristics of Community-Residing Elders Using Both Help and Devices for IADLs and ADLs by Whether Any Activity is Performed with Devices Only, 2004 | |||
|---|---|---|---|
| Mean/Proportion | Difference | ||
| None | Any | ||
| Physical limitations | |||
| None or upper body onlya | 5.2 | 5.7 | -0.5 |
| Lower body only | 18.1 | 31.9 | -13.9** |
| Both upper and lower body | 76.8 | 62.3 | 14.4** |
| Cognitive impaired | 40.9 | 18.0 | 22.9** |
| Total # of limitations (0-14) | 8.9 | 5.6 | 3.3** |
| # of ADLs with equipment (0-6) | 2.4 | 2.5 | -0.1* |
| # of ADLs with equipment only (0-6) | --- | 1.9 | --- |
| Any ADL with help/equipment most of the time | 83.0 | 89.4 | -6.4** |
| Any home accommodative features present | 64.0 | 73.2 | -9.1** |
| Any home accommodative features desirable | 51.2 | 44.0 | 7.2** |
| Duration of chronic disability | |||
| Less than 1 yeara | 11.2 | 9.7 | 1.4 |
| 1 year to 5 years | 49.8 | 49.5 | 0.3 |
| 5 years or longer | 39.0 | 40.8 | -1.8 |
| Age | |||
| 65 - 74a | 31.1 | 23.7 | 7.4** |
| 75 - 84 | 39.5 | 40.2 | -0.7 |
| 85 - 94 | 23.5 | 30.8 | -7.3** |
| 95+ | 5.9 | 5.3 | 0.6 |
| Female | 64.5 | 74.7 | -10.2** |
| Living arrangement | |||
| Lives with spouse | 22.1 | 45.0 | -23.0** |
| Lives with others | 45.2 | 30.1 | 15.0** |
| Lives alonea | 32.8 | 24.8 | 8.0** |
| Residential type | |||
| Private residence | 84.8 | 73.3 | 11.5** |
| Community residential care | 9.3 | 15.2 | -5.9** |
| Other setting for older or disabled persons | 5.9 | 11.5 | -5.6** |
| Number of nonresident daughters nearby | 0.7 | 0.7 | 0.0 |
| Education | |||
| Less than high schoola | 47.8 | 40.0 | 7.9** |
| High school | 24.6 | 29.3 | -4.7* |
| Some college | 27.5 | 30.7 | -3.2 |
| Medicaid eligible | 28.7 | 23.6 | 5.1** |
| Annual Income | |||
| <$10,000# | 26.3 | 25.1 | 1.2 |
| $10,000 - <$20,000 | 33.6 | 37.9 | -4.3* |
| $20,000 - <$30,000 | 19.4 | 18.4 | 0.9 |
| $30,000 - <$40,000 | 9.9 | 9.2 | 0.7 |
| $40,000 or more | 10.8 | 9.3 | 1.5 |
| Race/ethnicity | |||
| Black | 10.5 | 8.2 | 2.3 |
| NonBlacka | 89.5 | 91.8 | -2.3 |
| Hispanic | 7.3 | 5.6 | 1.7 |
| Health conditions/events | |||
| Disabetes | 29.1 | 28.3 | 0.8 |
| Heart attack/other heart problem in the last 12 months | 29.0 | 28.4 | 0.6 |
| Paralysis/other nervous system disorder | 20.0 | 12.4 | 7.6** |
| Asthma/bronchitis in the last 12 months | 26.6 | 22.5 | 4.1 |
| Pneumonia in the last 12 months | 10.4 | 8.8 | 1.6 |
| Broken hip or other bone in last 12 months | 11.7 | 10.0 | 1.7 |
| Stroke in the last 12 months | 14.7 | 8.1 | 6.6** |
| Recent utilization events | |||
| Hospitalization in last 6 months | 19.7 | 17.3 | 2.4 |
| Home health use in last 6 months | 23.6 | 18.5 | 5.1** |
| SNF use in last 6 months | 6.2 | 6.3 | -0.1 |
| Hospice use in last 6 months | 3.3 | 0.6 | 2.7** |
| Proxy respondent | 67.5 | 34.5 | 33.0** |
| Survive less than 1 year | 17.1 | 10.0 | 7.0** |
| Region | |||
| Northeast | 18.6 | 20.0 | -1.4 |
| Midwesta | 21.6 | 24.5 | -3.0 |
| South | 40.0 | 35.3 | 4.8* |
| West | 19.8 | 20.2 | -0.4 |
**(*) difference significantly different from zero at the 5%(10%) level in a two-tailed test. | |||
Those performing no activities with devices only have higher levels of physical and cognitive impairment, although they are generally similar with respect to health conditions and events examined. They have a greater level of disability as measured by the proportion with both upper and lower body limitations, their rate of cognitive impairment, and their larger average number of ADL and IADL disabilities. Both groups use devices for an average 2.5 ADLs, but despite their higher disability level, those performing no activities independently with devices are less likely to report needing help or using devices most of the time. They are also less likely to have accommodative features in the home and more likely to identify accommodative features that would "make things easier or more comfortable."
Those with no independent device use also are more likely to be under age 75 and less likely to be age 85 or older, although the two groups are about equally likely to be age 95 or older. They also are less likely to be female. As for potential informal support resources, they are less likely to be living with a spouse and more likely to be living with others or alone, although there is no difference in the average number of nonresident daughters living nearby. They are more likely to be living in a traditional private residence and less likely to be in either residential care or other settings for older persons or those with disabilities. They are more likely to have less than a high school education and to be enrolled in Medicaid, but there are inconsequential differences in the income and race/ethnicity distribution within the two groups.
The only significant differences in the health conditions examined are their higher likelihood of having paralysis or a nervous system disorder and having had a stroke within the previous year. They are more likely to have had Medicare home health or hospice care within the previous 6 months. They also are nearly twice as likely to have a proxy respondent and significantly more likely to be in their last year of life, two measures included to capture the potential for unmeasured differences in illness or frailty. Their distribution across geographic regions is similar to that for persons managing at least one activity with only assistive devices.
| TABLE 5. Mean Hours of Care and Proportion Reporting Unmet Need for help among Community-Residing Elders Using Both Help and Devices for IADLs or ADLs by Whether Any Activity is Performed with Devices Only, 2004 | |||||
|---|---|---|---|---|---|
| Activities with Devices but No Help | |||||
| None | Any | Difference | |||
| Mean or Proportion | Mean or S.E. | Mean or Proportion | Mean or S.E. | ||
| Total hours of care | 55 | 1.81 | 23 | 1.19 | 32** |
| Informal hours | 41 | 1.65 | 17 | 1.12 | 24** |
| Formal hours | 14 | 1.16 | 6 | 0.56 | 8** |
| Unmet need | |||||
| Any unmet need for help | 67.4 | 1.8 | 60.7 | 1.67 | 6.7** |
| Need help/more help with ADLs | 24.3 | 1.9 | 19.2 | 1.64 | 5.1** |
| Need help with IADLs | 68.8 | 3.2 | 68.0 | 3.01 | 0.8 |
| **(*) difference significantly different from zero at the 5%(10%) level in a two-tailed test. | |||||
Means and proportions of hours of care and unmet need are provided in Table 5. Those who perform no activities with only devices clearly receive significantly more hours per week of both informal care (24 hours) and formal care (8 hours). They also are more likely to report unmet need for help with any activity, and with additional ADLs or more help with ADLs for which they already are receiving help, but equally likely to report unmet need for help with IADLs.
Multivariate Results
Results presented and discussed in this section focus on identifying explanatory variables significantly related to the probability of managing any activity with devices alone, and on the association of independent device use with hours of care received in the last week and reports of unmet need in cross-section. Therefore, they cannot be interpreted as reflecting causal relationships. Full regression results are provided in the appendix.
| TABLE 6. Probability of Any Independent Use of Devices among Community-Residing Elders Receiving Assistance and Using Devices for IADLs or ADLs, 2004 | |
|---|---|
| Marginal Effect | |
| Total # of limitations (0-14) | -0.09** |
| # of ADLs with equipment (0-6) | 0.15** |
| Any ADL with help/equipment most of the time | 0.20** |
| Any home accommodative features present | 0.08* |
| Age | |
| 75 - 84 | 0.10** |
| 85 - 94 | 0.17** |
| 95+ | 0.16** |
| Living arrangement | |
| Lives with spouse | -0.20** |
| Lives with others | -0.10** |
| Recent utilization events | |
| Hospice use in last 6 months | -0.22* |
| Proxy respondent | -0.11** |
| NOTE: **(*) marginal effect significantly different from zero at the 5%(10%) level in a two-tailed test. Full regression results provided in Appendix Table A1. | |
Factors Associated with Independent Device Use
Only a handful of factors included in the models are significantly related to the probability that an elder uses assistive devices independently for at least one activity (Table 6). Not surprisingly, the likelihood of independent device use falls as the total number of limitations increases and rises as the total number of devices used for ADLs (with or without help) rises. The frequency with which accommodation is needed also is associated with a higher likelihood of independent use, as is the presence of accommodative features in the home. The presence of accommodate features, like living arrangements more generally, is likely to be jointly determined with other accommodations including device use, and so is not truly independent. Perhaps counterintuitively, being age 75 or older and even age 95 or older was associated with a higher likelihood of independent device use. This result may suggest unmeasured severity of illness or limitation among those with earlier onset disabilities. Living with either a spouse or others is associated with a lower likelihood of independent device use. This finding may be consistent with the argument sometimes advanced that the likelihood and amount of help received for any level of need is affected by the availability of potential caregivers, and that help, once received, may persist even during periods when need is less. Being a hospice patient and having a proxy respondent both are associated with a lower likelihood of independent device use, which, again, may reflect that these factors indicate otherwise unmeasured severity of illness or frailty. Being in the last year of life itself was not significantly related to use of devices independently.
Association of Independent Device Use with Hours of Care and Unmet Need
Independent use of devices is strongly associated with reduced hours of care both in the full sample using help and devices and in the subset managing one or more activities with only devices (Table 7), but is not associated with increased reports of unmet need for help. Each activity performed independently with devices is associated with six fewer hours of care per week for the full sample and nearly five fewer hours among those using only devices for at least one activity. For the full sample each activity performed independently with devices is associated with three fewer informal hours per week. Although the magnitude is only slightly smaller for those using devices only for at least one activity, the difference is not statistically significant. In both samples each activity performed solely with devices is associated with significantly lower formal care hours.
| TABLE 7. Effect of Independent Device Use on Hours of Care and Reports of Unmet Need for Help for Community-Residing Elders Receiving Assistance and Using Devices for IADLs or ADLs, 2004 | ||||
|---|---|---|---|---|
| Outcomes | All Elders Using Help and Equipment | Elders Using Devices Only for at Least One Activity | ||
| Coefficient of Marginal Effect | P-Value | Coefficient of Marginal Effect | P-Value | |
| Total hours of carea | -6.12 | 0.000** | -4.92 | 0.021** |
| Informal hours | -3.15 | 0.002** | -2.70 | 0.158 |
| Formal hours | -2.98 | 0.000** | -2.21 | 0.030** |
| Any unmet need for helpb | -0.05 | 0.000** | -0.02 | 0.334 |
| Unmet need for help/more help with ADLs | -0.04 | 0.001** | -0.06 | 0.004** |
| Unmet need for help with IADLs | -0.04 | 0.002** | 0.03 | 0.198 |
NOTES: **(*) coefficient is significantly different from zero at the 5%(10%) level in a two-tailed test.
| ||||
Although the magnitude is small, each activity managed with devices alone is associated with significantly lower rates of unmet need for both ADLs and IADLs in the full sample and a significantly lower rate of unmet need for ADLs within the subset using devices only for at least one activity. This result supports a tentative conclusion that lower hours of care associated with independent device use are not associated with higher unmet need for care.
All equations were run with and without indicators of home accommodative features present or considered desirable, which may be considered as a complement to device use. Inclusion has essentially no effect on sign, magnitude, or significance of independent device use, but reveals interesting findings with respect to the association of accommodative features with outcomes (see Appendix Tables A2-A5). Presence of home accommodations is associated with greater hours of formal care, while perceived desirability of features not present in the home was associated with about three additional hours of informal care and nearly 3 hours less formal care in the previous week. A similar pattern was evident within the subset using devices independently, with equivalent but offsetting effects on hours of formal and informal care, although the positive effect for informal care hours was not significant.
On the other hand, accommodative features present were not associated with unmet need, but identification of desirable features not present was positively and significantly associated with unmet need for both ADL and IADL help for the full sample using help and devices. Again, results were similar for the subset using devices alone for at least one activity. But, although the negative associations of accommodative features with lower unmet need overall and unmet for ADL help were statistically significant, the association for unmet need for IADL help, although positive and of similar magnitude to that for the full sample, was not significant in the smaller sample.
Summary and Conclusion
The historical increases in use of assistive devices continued between 1999 and 2004, so that in 2004, nine in ten elders with disabilities were using at least one device. This represented an increase of nearly a million elders using devices, roughly equivalent to the increase in the 15 years between 1984 and 1999. What was different between 1999 and 2004 was that most of the increase was in the proportion using both personal assistance and devices. Across the 1984-1999 period, independent use of devices for all disabilities had driven the increases.
This change in the driver of assistive device use trends may be related to the increasing rate at which those with even high levels of disabilities are remaining in community settings. A number of factors may contribute to the higher rate of community residence and, thus, indirectly to greater demand for assistive devices. These include the greater array of supportive settings other than nursing homes available for the older population (Spillman and Black 2005), evolution in nursing homes toward a more seriously impaired and medically frail population (Decker 2005), and the increased availability of community care options through the Medicaid program (Eiken et al. 2011). However, although Medicare is a third party payer for many assistive devices through its coverage for durable medical equipment (DME), coverage policies have not changed substantially over the 20-year period of rising device use, so the increases in device use cannot be attributed to deliberate policy efforts to improve access (Wolff, Agree, and Kasper 2005). More aggressive marketing to an aging population, Medicare provider behavior, and other market factors related to the DME benefit may have contributed, however (Reschovsky et al. 2012).
Those who use both help and devices to accommodate their limitations represent nearly two in three community-residing elders, and they have higher levels of disability than elders managing all disabilities with either devices only or help only, making them an important potential target for long-term care policy. Descriptive findings indicated that within this important group using both help and devices, those who were able to accommodate limitation in at least one activity with devices alone received significantly fewer hours of care per week. Multivariate analysis confirmed that a significant association of independent device use with lower hours of care persisted after controlling for disability level and other characteristics. This was also true within the subset of persons using devices independently for at least one activity. Moreover, despite the lower weekly hours of care, use of devices only for at least one activity was not associated with higher rates of reported unmet need.
This result suggests the potential that interventions designed to assist elders and their caregivers in identifying and acquiring appropriate devices might be able to increase independence, reduce hours of formal and informal care needed, and reduce informal caregiver burden, without increasing unmet need. In addition, subsidiary findings suggest that home modifications may be an important part of such interventions.
The results presented here are cross-sectional associations, and as such cannot be interpreted as causal. They also cannot shed light on factors associated with adoption or abandonment of assistive devices, initiation of help, and the relationship between the two. Understanding these dynamics would require longitudinal data capable of observing changes in accommodations in response to changes in health and functioning. The NLTCS, with its 5-year cycle, cannot meet that need. New data collected in the National Health and Aging Trend Study are specifically designed to better understand both trends and trajectories of disability and accommodations, with a one year cycle and retrospective information about events since last interview (Kasper and Freedman 2013). This new data source will provide a platform for better understanding not only the potential for improving outcomes through interventions to support independence and informal caregivers but also when in the disability trajectory such interventions might be most effective.
References
Decker, FH. 2005. Nursing homes, 1977-99: What has changed, what has not? Hyattsville, MD: National Center for Health Statistics.
Eiken, S, K Sredl, B Burwell, and L Gold. 2011. Medicaid expenditures for long-term services and supports: 2011 update. Cambridge, MA: Thomson Reuters.
Freedman, VA, E Crimmins, RF Schoeni, BC Spillman, H Aykan, E Kramarow, K Land, J Lubitz, K Manton, LG Martin, D Shinberg, and T Waidmann. 2004. Resolving inconsistencies in old-age disability trends: Report from a technical working group. Demography 41(3): 417-441.
Freedman, VA, BC Spillman, PM Andreski, JC Cornman, EM Crimmins, E Kramarow, J Lubitz, LG Martin, SS Merkin, RF Schoeni, TE Seeman, and TA Waidmann. 2013. Trends in late-life activity limitations: An update from 5 national surveys. Demography 50(2): 661-671.
Kasper, JD, and VA Freedman. 2013. National health and aging trends study user guide: Rounds 1 & 2, Beta Release. Baltimore, MD: Johns Hopkins University School of Public Health. Available at http://www.nhats.org/scripts/documents/NHATS_User_Guide_Beta_Release_Sept2013.pdf.
Reschovsky, JD, A Ghosh, KA Stewart and DJ Chollet. 2012. Durable medical equipment and home health among the largest contributors to area variations in use of Medicare services. Health Affairs 31(5): 956-964.
Spillman, BC. 2004a. Changes in elderly disability rates and the implications for health care utilization and cost. Report to the HHS/ASPE/Office of Disability, Aging and Long-Term Care Policy. Available at http://aspe.hhs.gov/daltcp/reports/2003/hcutlcst.htm.
Spillman, BC. 2004b. Changes in elderly disability rates and the implications for health care utilization and cost. The Milbank Quarterly 82(1): 157-194.
Spillman, BC. 2005. Assistive device use among the elderly: Trends, characteristics of users, and implications for modeling. Report to the HHS/ASPE/Office of Disability, Aging and Long-Term Care Policy. Available at http://aspe.hhs.gov/daltcp/reports/astdev.htm.
Spillman, BC, and K Black. 2005. The size of the long-term care population in residential care: A review of estimates and methodology. Report to the HHS/ASPE/Office of Disability, Aging and Long-Term Care Policy. Available at http://aspe.hhs.gov/daltcp/reports/2005/ltcpopsz.htm.
Spillman, BC. 2011a. Task 4.1: Memorandum on updated analyses of trends in elderly disability. Report to the HHS/ASPE/Office of Disability, Aging and Long-Term Care Policy.
Spillman, BC. 2011b. Technical documentation: Adjusted 1994, 1999 and 2004 cross-sectional weights for the National Long-Term Care Survey. Report to the HHS/ASPE/Office of Disability, Aging and Long-Term Care Policy.
Wolff, JL, EM Agree, and JD Kasper. 2005. Wheelchairs, walkers, and canes: What does Medicare pay for, and who benefits? Health Affairs 24(4): 1140-1149.
Notes
-
The National Institute on Aging-funded survey was conducted by the Census and directed by the former Center for Demographic Studies at Duke University. The data are distributed through the National Archives of Computerized Data on Aging (http://www.icpsr.umich.edu/NACDA).
-
This result seems particularly surprising because of the relative stability of help and device use patterns prior to 2004, but it may be consistent with the continued trend toward increased community care for those with more severe disabilities.
-
Less than 10 percent used reported other types of mobility devices.
To obtain a printed copy of this report, send the full report title and your mailing information to:
U.S. Department of Health and Human Services
Office of Disability, Aging and Long-Term Care Policy
Room 424E, H.H. Humphrey Building
200 Independence Avenue, S.W.
Washington, D.C. 20201
FAX: 202-401-7733
Email: webmaster.DALTCP@hhs.gov
RETURN TO:
Office of Disability, Aging and Long-Term Care Policy (DALTCP) Home [http://aspe.hhs.gov/office_specific/daltcp.cfm]
Assistant Secretary for Planning and Evaluation (ASPE) Home [http://aspe.hhs.gov]
U.S. Department of Health and Human Services (HHS) Home [http://www.hhs.gov]
Appendices
Appendix A. Full Regression Results
| TABLE A1. Probit Estimation of the Probability of Any Activities with Devices Only among Community-Residing Elders Receiving Assistance and Using Devices for IADLs or ADLs, 2004 | ||
|---|---|---|
| Probability of Any Activities with Devices Only | ||
| Marginal Effect | P-Value | |
| Physical limitations | ||
| Lower body only | 0.04 | 0.640 |
| Both upper and lower body | -0.01 | 0.937 |
| Cognitive impaired | 0.00 | 0.934 |
| Total # of limitations (0-14) | -0.09 | 0.000** |
| # of ADLs with equipment (0-6) | 0.15 | 0.000** |
| Any ADL with help/equipment most of the time | 0.20 | 0.000** |
| Any home accommodative features present | 0.08 | 0.056* |
| Any home accommodative features desirable | -0.04 | 0.285 |
| Duration of chronic disability | ||
| 1 year to 5 years | 0.03 | 0.648 |
| 5 years or longer | 0.04 | 0.510 |
| Age | ||
| 75 - 84 | 0.10 | 0.020** |
| 85 - 94 | 0.17 | 0.001** |
| 95+ | 0.16 | 0.003** |
| Female | 0.02 | 0.604 |
| Living arrangement | ||
| Lives with spouse | -0.20 | 0.000** |
| Lives with others | -0.10 | 0.030 |
| Residential type | ||
| Community residential care | 0.08 | 0.162 |
| Other setting for older or disabled persons | 0.05 | 0.485 |
| Number of nonresident daughters nearby | 0.01 | 0.652 |
| Education | ||
| High school | 0.03 | 0.510 |
| Some college | 0.04 | 0.393 |
| Medicaid eligible | -0.03 | 0.451 |
| Annual Income | ||
| $10,000 - <$20,000 | 0.04 | 0.373 |
| $20,000 - <$30,000 | 0.04 | 0.422 |
| $30,000 - <$40,000 | 0.05 | 0.482 |
| $40,000 or more | -0.03 | 0.634 |
| Race/ethnicity | ||
| Black | 0.06 | 0.364 |
| Hispanic | 0.02 | 0.815 |
| Health conditions/events | ||
| Disabetes | 0.04 | 0.311 |
| Heart attack/other heart problem in the last 12 months | 0.05 | 0.222 |
| Paralysis/other nervous system disorder | 0.01 | 0.827 |
| Asthma/bronchitis in the last 12 months | -0.03 | 0.521 |
| Pneumonia in the last 12 months | 0.02 | 0.753 |
| Broken hip or other bone in last 12 months | -0.02 | 0.758 |
| Stroke in the last 12 months | -0.08 | 0.191 |
| Recent utilization events | ||
| Hospitalization in last 6 months | 0.05 | 0.322 |
| Home health use in last 6 months | -0.07 | 0.205 |
| SNF use in last 6 months | 0.08 | 0.370 |
| Hospice use in last 6 months | -0.22 | 0.067* |
| Proxy respondent | -0.11 | 0.028** |
| Survive less than 1 year | -0.02 | 0.775 |
| Region | ||
| Northeast | 0.01 | 0.775 |
| South | -0.02 | 0.634 |
| West | -0.03 | 0.532 |
| NOTE: **(*) marginal effect is significantly different from zero at the 5%(10%) level in a two-tailed test. | ||
| TABLE A2. Linear Regression Estimation of Weekly Hours of Care among Community-Residing Elders Receiving Assistance and Using Devices for IADLs or ADLs, 2004 | ||||||
|---|---|---|---|---|---|---|
| Total Hours of Care | Hours of Informal Care | Hours of Formal Care | ||||
| Coefficient | P-Value | Coefficient | P-Value | Coefficient | P-Value | |
| Physical limitations | ||||||
| Lower body only | -2.76 | 0.456 | -0.61 | 0.836 | -2.15 | 0.461 |
| Both upper and lower body | -0.67 | 0.862 | 0.93 | 0.766 | -1.60 | 0.58 |
| Cognitive impaired | 6.28 | 0.048** | 0.05 | 0.987 | 6.23 | 0.000** |
| Total # of limitations (0-14) | 5.06 | 0.000** | 3.48 | 0.000** | 1.59 | 0.000** |
| # of ADLs with equipment (0-6) | 0.49 | 0.741 | -0.40 | 0.768 | 0.89 | 0.290 |
| # of ADLs with equipment only (0-6) | -6.12 | 0.000** | -3.15 | 0.002** | -2.98 | 0.000** |
| Any ADL with help/equipment most of the time | -2.98 | 0.310 | 0.61 | 0.807 | -3.59 | 0.048** |
| Any home accommodative features present | 4.67 | 0.025** | 0.88 | 0.666 | 3.79 | 0.001** |
| Any home accommodative features desirable | 0.25 | 0.897 | 3.04 | 0.097* | -2.80 | 0.023** |
| Duration of chronic disability | ||||||
| 1 year to 5 years | 3.88 | 0.229 | 3.73 | 0.133 | 0.15 | 0.954 |
| 5 years or longer | 5.96 | 0.079* | 4.45 | 0.092* | 1.52 | 0.568 |
| Age | ||||||
| 75 - 84 | -2.44 | 0.371 | -2.48 | 0.372 | 0.04 | 0.977 |
| 85 - 94 | 3.16 | 0.397 | 0.66 | 0.825 | 2.50 | 0.276 |
| 95+ | -1.37 | 0.735 | -4.82 | 0.170 | 3.45 | 0.223 |
| Female | 2.66 | 0.276 | 2.22 | 0.297 | 0.44 | 0.778 |
| Living arrangement | ||||||
| Lives with spouse | 4.50 | 0.122 | 16.76 | 0.000** | -12.27 | 0.000** |
| Lives with others | 2.64 | 0.275 | 13.20 | 0.000** | -10.57 | 0.000** |
| Residential type | ||||||
| Community residential care | -6.14 | 0.042** | -19.48 | 0.000** | 13.35 | 0.000** |
| Other setting for older or disabled persons | 0.34 | 0.907 | 1.74 | 0.541 | -1.39 | 0.356 |
| Number of nonresident daughters nearby | 0.84 | 0.435 | 0.55 | 0.524 | 0.29 | 0.642 |
| Education | ||||||
| High school | 1.84 | 0.412 | -0.01 | 0.996 | 1.85 | 0.258 |
| Some college | 2.50 | 0.293 | 0.84 | 0.690 | 1.66 | 0.297 |
| Medicaid eligible | -2.56 | 0.377 | -3.15 | 0.202 | 0.59 | 0.757 |
| Annual Income | ||||||
| $10,000 - <$20,000 | -3.26 | 0.274 | -2.85 | 0.276 | -0.41 | 0.822 |
| $20,000 - <$30,000 | -4.06 | 0.238 | -2.24 | 0.484 | -1.82 | 0.377 |
| $30,000 - <$40,000 | -4.78 | 0.313 | -8.43 | 0.042** | 3.65 | 0.241 |
| $40,000 or more | -1.87 | 0.690 | -4.84 | 0.183 | 2.97 | 0.373 |
| Race/ethnicity | ||||||
| Black | 1.16 | 0.781 | 1.43 | 0.731 | -0.27 | 0.897 |
| Hispanic | 2.26 | 0.605 | -1.54 | 0.680 | 3.80 | 0.158 |
| Health conditions/events | ||||||
| Disabetes | 0.93 | 0.689 | 0.97 | 0.627 | -0.04 | 0.978 |
| Heart attack/other heart problem in the last 12 months | 1.07 | 0.659 | -0.01 | 0.995 | 1.08 | 0.457 |
| Paralysis/other nervous system disorder | -1.94 | 0.480 | 0.82 | 0.743 | -2.76 | 0.116 |
| Asthma/bronchitis in the last 12 months | 0.64 | 0.787 | 0.70 | 0.752 | -0.06 | 0.967 |
| Pneumonia in the last 12 months | 11.16 | 0.012** | 11.26 | 0.013** | -0.10 | 0.962 |
| Broken hip or other bone in last 12 months | 2.88 | 0.417 | -3.90 | 0.206 | 6.78 | 0.009** |
| Stroke in the last 12 months | 3.94 | 0.290 | 2.55 | 0.449 | 1.39 | 0.533 |
| Recent utilization events | ||||||
| Hospitalization in last 6 months | -1.97 | 0.507 | -1.29 | 0.684 | -0.69 | 0.723 |
| Home health use in last 6 months | 0.60 | 0.833 | 2.26 | 0.434 | -1.66 | 0.307 |
| SNF use in last 6 months | -0.84 | 0.864 | -1.28 | 0.788 | 0.44 | 0.889 |
| Hospice use in last 6 months | -14.17 | 0.068* | -15.42 | 0.028** | 1.25 | 0.837 |
| Proxy respondent | 3.45 | 0.140 | 4.62 | 0.042** | -1.16 | 0.328 |
| Survive less than 1 year | 5.57 | 0.164 | 5.60 | 0.121 | -0.03 | 0.990 |
| Region | ||||||
| Northeast | -3.20 | 0.250 | -8.95 | 0.002** | 5.74 | 0.002** |
| South | 1.29 | 0.575 | -0.38 | 0.864 | 1.67 | 0.248 |
| West | 0.61 | 0.817 | -3.83 | 0.101 | 4.44 | 0.028** |
| Constant | -5.48 | 0.422 | -6.72 | 0.232 | 1.23 | 0.816 |
| R-squared | 0.360 | 0.320 | 0.243 | |||
| NOTE: Unweighted sample size = 1,831. **(*) coefficient is significantly different from zero at the 5%(10%) level in a two-tailed test. | ||||||
| TABLE A3. Linear Regression Estimation of Weekly Hours of Care among Community-Residing Elders Using Devices Alone for at Least One Activity, 2004 | ||||||
|---|---|---|---|---|---|---|
| Total Hours of Care | Hours of Informal Care | Hours of Formal Care | ||||
| Coefficient | P-Value | Coefficient | P-Value | Coefficient | P-Value | |
| Physical limitations | ||||||
| Lower body only | -0.67 | 0.881 | 2.97 | 0.28 | -3.64 | 0.414 |
| Both upper and lower body | -0.51 | 0.906 | 30.03 | 0.235 | -3.54 | 0.421 |
| Cognitive impaired | 6.26 | 0.042** | 2.25 | 0.411 | 4.00 | 0.029** |
| Total # of limitations (0-14) | 4.23 | 0.000** | 2.80 | 0.000** | 1.43 | 0.000** |
| # of ADLs with equipment (0-6) | 0.53 | 0.779 | -0.85 | 0.633 | 1.37 | 0.098* |
| # of ADLs with equipment only (0-6) | -4.92 | 0.021** | -2.70 | 0.158 | -2.21 | 0.030** |
| Any ADL with help/equipment most of the time | -3.18 | 0.403 | 0.79 | 0.782 | -3.97 | 0.168 |
| Any home accommodative features present | 4.85 | 0.051* | 1.10 | 0.605 | 3.75 | 0.014** |
| Any home accommodative features desirable | 0.00 | 1.000 | 2.64 | 0.103 | -2.64 | 0.019** |
| Duration of chronic disability | ||||||
| 1 year to 5 years | 2.14 | 0.444 | 2.97 | 0.179 | -0.83 | 0.663 |
| 5 years or longer | 2.25 | 0.464 | 3.83 | 0.130 | -1.58 | 0.372 |
| Age | ||||||
| 75 - 84 | -2.61 | 0.354 | -3.76 | 0.166 | 1.15 | 0.315 |
| 85 - 94 | -1.42 | 0.697 | -2.93 | 0.311 | 1.51 | 0.561 |
| 95+ | -5.01 | 0.228 | -5.68 | 0.102 | 0.67 | 0.808 |
| Female | 0.99 | 0.724 | 2.95 | 0.175 | -1.96 | 0.340 |
| Living arrangement | ||||||
| Lives with spouse | 8.61 | 0.003** | 12.63 | 0.000** | -4.02 | 0.048** |
| Lives with others | 3.13 | 0.261 | 8.57 | 0.000** | -5.44 | 0.003** |
| Residential type | ||||||
| Community residential care | -5.42 | 0.035** | -11.97 | 0.000** | 6.55 | 0.001** |
| Other setting for older or disabled persons | -0.72 | 0.807 | 0.81 | 0.766 | -1.53 | 0.244 |
| Number of nonresident daughters nearby | -0.90 | 0.473 | 0.19 | 0.862 | -1.09 | 0.073* |
| Education | ||||||
| High school | 0.56 | 0.812 | 0.27 | 0.898 | 0.29 | 0.872 |
| Some college | 1.76 | 0.496 | 1.26 | 0.576 | 0.50 | 0.756 |
| Medicaid eligible | 4.41 | 0.086 | -0.60 | 0.794 | 5.01 | 0.010** |
| Annual Income | ||||||
| $10,000 - <$20,000 | -0.80 | 0.786 | -0.79 | 0.742 | -0.02 | 0.994 |
| $20,000 - <$30,000 | -1.77 | 0.594 | -0.91 | 0.738 | -0.85 | 0.692 |
| $30,000 - <$40,000 | 3.32 | 0.515 | 1.28 | 0.790 | 2.03 | 0.441 |
| $40,000 or more | -2.68 | 0.595 | -3.39 | 0.362 | 0.71 | 0.876 |
| Race/ethnicity | ||||||
| Black | -0.29 | 0.952 | 2.08 | 0.674 | -2.38 | 0.242 |
| Hispanic | 6.56 | 0.272 | 7.30 | 0.192 | -0.74 | 0.722 |
| Health conditions/events | ||||||
| Disabetes | 0.61 | 0.805 | -0.24 | 0.911 | 0.85 | 0.551 |
| Heart attack/other heart problem in the last 12 months | -2.25 | 0.336 | -0.38 | 0.855 | -1.87 | 0.095* |
| Paralysis/other nervous system disorder | -0.12 | 0.974 | 3.04 | 0.380 | -3.16 | 0.043** |
| Asthma/bronchitis in the last 12 months | -2.29 | 0.340 | -1.88 | 0.391 | -0.41 | 0.748 |
| Pneumonia in the last 12 months | 13.61 | 0.050** | 10.50 | 0.087* | 3.11 | 0.417 |
| Broken hip or other bone in last 12 months | -3.71 | 0.225 | -3.40 | 0.208 | -0.31 | 0.843 |
| Stroke in the last 12 months | -0.11 | 0.978 | 0.10 | 0.976 | -0.21 | 0.919 |
| Recent utilization events | ||||||
| Hospitalization in last 6 months | -4.36 | 0.086* | -3.58 | 0.131 | -0.78 | 0.676 |
| Home health use in last 6 months | 3.72 | 0.261 | 1.85 | 0.502 | 1.86 | 0.431 |
| SNF use in last 6 months | -0.34 | 0.941 | 3.27 | 0.416 | -3.61 | 0.158 |
| Hospice use in last 6 months | -6.49 | 0.396 | -7.23 | 0.303 | 0.74 | 0.886 |
| Proxy respondent | 4.08 | 0.157 | 4.75 | 0.091* | -0.67 | 0.601 |
| Survive less than 1 year | 4.85 | 0.274 | 4.46 | 0.256 | 0.39 | 0.895 |
| Region | ||||||
| Northeast | 0.42 | 0.881 | -0.74 | 0.766 | 1.16 | 0.522 |
| South | 6.09 | 0.029** | 5.28 | 0.019** | 0.80 | 0.606 |
| West | 4.32 | 0.076* | 0.37 | 0.863 | 3.95 | 0.007** |
| Constant | -3.18 | 0.733 | -8.96 | 0.149 | 5.78 | 0.517 |
| R-squared | 0.284 | 0.277 | 0.200 | |||
| NOTE: Unweighted sample size = 1,831. **(*) coefficient is significantly different from zero at the 5%(10%) level in a two-tailed test. | ||||||
| TABLE A4. Probit Estimation of the Probability of Unmet Need for Help among Community-Residing Elders Receiving Assistance and Using Devices for IADLs or ADLs, 2004 | ||||||
|---|---|---|---|---|---|---|
| Any Unmet Need for Help | Unmet Need for ADL Help | Unmet Need for IADL Help | ||||
| Marginal Effect | P-Value | Marginal Effect | P-Value | Marginal Effect | P-Value | |
| Physical limitations | ||||||
| Lower body only | 0.07 | 0.230 | 0.00 | 0.993 | 0.13 | 0.028** |
| Both upper and lower body | 0.14 | 0.022** | 0.08 | 0.131 | 0.16 | 0.005** |
| Cognitive impaired | -0.01 | 0.860 | 0.00 | 0.891 | 0.00 | 0.956 |
| Total # of limitations (0-14) | -0.01 | 0.004** | -0.01 | 0.237 | -0.03 | 0.000** |
| # of ADLs with equipment (0-6) | 0.03 | 0.051* | 0.02 | 0.078* | 0.04 | 0.037** |
| # of ADLs with equipment only (0-6) | -0.05 | 0.000** | -0.04 | 0.001** | -0.04 | 0.002** |
| Any ADL with help/equipment most of the time | 0.06 | 0.120 | 0.04 | 0.186 | 0.07 | 0.092* |
| Any home accommodative features present | -0.01 | 0.838 | -0.01 | 0.702 | 0.00 | 0.955 |
| Any home accommodative features desirable | 0.10 | 0.001** | 0.10 | 0.000** | 0.05 | 0.089* |
| Duration of chronic disability | ||||||
| 1 year to 5 years | 0.01 | 0.909 | 0.01 | 0.864 | 0.00 | 0.960 |
| 5 years or longer | 0.00 | 0.923 | 0.00 | 0.912 | -0.01 | 0.833 |
| Age | ||||||
| 75 - 84 | 0.01 | 0.786 | 0.02 | 0.465 | 0.00 | 0.907 |
| 85 - 94 | 0.02 | 0.669 | 0.02 | 0.568 | 0.02 | 0.613 |
| 95+ | 0.03 | 0.427 | -0.01 | 0.861 | 0.08 | 0.108 |
| Female | 0.02 | 0.454 | 0.02 | 0.484 | -0.01 | 0.792 |
| Living arrangement | ||||||
| Lives with spouse | 0.02 | 0.536 | 0.02 | 0.425 | 0.01 | 0.762 |
| Lives with others | 0.00 | 0.990 | 0.04 | 0.227 | -0.02 | 0.622 |
| Residential type | ||||||
| Community residential care | -0.02 | 0.633 | 0.05 | 0.270 | -0.06 | 0.243 |
| Other setting for older or disabled persons | 0.07 | 0.118 | 0.10 | 0.012** | 0.07 | 0.152 |
| Number of nonresident daughters nearby | 0.03 | 0.068* | 0.00 | 0.942 | 0.02 | 0.203 |
| Education | ||||||
| High school | 0.03 | 0.357 | -0.02 | 0.511 | 0.02 | 0.577 |
| Some college | 0.07 | 0.053* | -0.02 | 0.455 | 0.04 | 0.239 |
| Medicaid eligible | 0.05 | 0.244 | 0.01 | 0.668 | 0.05 | 0.266 |
| Annual Income | ||||||
| $10,000 - <$20,000 | 0.00 | 0.969 | 0.02 | 0.547 | 0.03 | 0.457 |
| $20,000 - <$30,000 | 0.01 | 0.912 | 0.03 | 0.393 | 0.05 | 0.266 |
| $30,000 - <$40,000 | 0.05 | 0.344 | 0.04 | 0.447 | 0.06 | 0.249 |
| $40,000 or more | 0.03 | 0.532 | 0.08 | 0.093* | 0.07 | 0.241 |
| Race/ethnicity | ||||||
| Black | 0.02 | 0.692 | 0.01 | 0.858 | -0.02 | 0.692 |
| Hispanic | 0.09 | 0.100* | 0.09 | 0.147 | 0.07 | 0.358 |
| Health conditions/events | ||||||
| Disabetes | 0.00 | 0.907 | 0.01 | 0.714 | 0.00 | 0.907 |
| Heart attack/other heart problem in the last 12 months | -0.01 | 0.663 | 0.03 | 0.248 | -0.04 | 0.211 |
| Paralysis/other nervous system disorder | 0.02 | 0.563 | -0.01 | 0.682 | 0.03 | 0.411 |
| Asthma/bronchitis in the last 12 months | 0.02 | 0.499 | 0.03 | 0.365 | -0.01 | 0.873 |
| Pneumonia in the last 12 months | -0.02 | 0.734 | -0.06 | 0.067* | 0.04 | 0.432 |
| Broken hip or other bone in last 12 months | -0.04 | 0.371 | -0.04 | 0.243 | 0.00 | 0.963 |
| Stroke in the last 12 months | 0.00 | 0.988 | -0.07 | 0.055* | 0.04 | 0.411 |
| Recent utilization events | ||||||
| Hospitalization in last 6 months | 0.02 | 0.595 | -0.02 | 0.641 | 0.01 | 0.779 |
| Home health use in last 6 months | -0.01 | 0.876 | 0.02 | 0.520 | 0.04 | 0.320 |
| SNF use in last 6 months | 0.02 | 0.743 | 0.00 | 0.913 | 0.02 | 0.782 |
| Hospice use in last 6 months | 0.08 | 0.242 | -0.05 | 0.495 | 0.02 | 0.797 |
| Proxy respondent | -0.08 | 0.005** | -0.03 | 0.219 | -0.03 | 0.397 |
| Survive less than 1 year | 0.01 | 0.874 | -0.02 | 0.451 | 0.08 | 0.039** |
| Region | ||||||
| Northeast | 0.03 | 0.483 | -0.01 | 0.786 | -0.01 | 0.822 |
| South | 0.04 | 0.185 | -0.01 | 0.797 | 0.05 | 0.135 |
| West | 0.01 | 0.806 | 0.00 | 0.946 | -0.02 | 0.696 |
| NOTE: Unweighted sample size = 1,831. **(*) coefficient is significantly different from zero at the 5%(10%) level in a two-tailed test. | ||||||
| TABLE A5. Probit Estimation of the Probability of Unmet Need for Help Among Community-Residing Elders Using Devices Alone for at Least One Activity, 2004 | ||||||
|---|---|---|---|---|---|---|
| Any Unmet Need for Help | Unmet Need for ADL Help | Unmet Need for IADL Help | ||||
| Marginal Effect | P-Value | Marginal Effect | P-Value | Marginal Effect | P-Value | |
| Physical limitations | ||||||
| Lower body only | 0.07 | 0.365 | -0.02 | 0.732 | 0.18 | 0.051* |
| Both upper and lower body | 0.17 | 0.034** | 0.07 | 0.242 | 0.25 | 0.005** |
| Cognitive impaired | 0.06 | 0.201 | 0.00 | 0.960 | 0.13 | 0.011** |
| Total # of limitations (0-14) | -0.02 | 0.071 | 0.01 | 0.030** | -0.04 | 0.000** |
| # of ADLs with equipment (0-6) | 0.05 | 0.101 | 0.05 | 0.014** | -0.01 | 0.793 |
| # of ADLs with equipment only (0-6) | -0.02 | 0.334 | -0.06 | 0.004** | 0.03 | 0.198 |
| Any ADL with help/equipment most of the time | 0.05 | 0.481 | 0.04 | 0.342 | 0.06 | 0.346 |
| Any home accommodative features present | 0.03 | 0.483 | 0.00 | 0.926 | 0.01 | 0.814 |
| Any home accommodative features desirable | 0.07 | 0.070* | 0.09 | 0.002** | 0.05 | 0.225 |
| Duration of chronic disability | ||||||
| 1 year to 5 years | -0.02 | 0.765 | -0.01 | 0.826 | 0.00 | 0.985 |
| 5 years or longer | -0.02 | 0.770 | -0.02 | 0.700 | 0.05 | 0.418 |
| Age | ||||||
| 75 - 84 | -0.07 | 0.226 | -0.03 | 0.406 | -0.08 | 0.119 |
| 85 - 94 | -0.04 | 0.535 | -0.03 | 0.419 | -0.03 | 0.631 |
| 95+ | 0.01 | 0.890 | -0.04 | 0.302 | 0.10 | 0.159 |
| Female | 0.08 | 0.050** | 0.03 | 0.240 | 0.05 | 0.260 |
| Living arrangement | ||||||
| Lives with spouse | 0.00 | 0.958 | -0.01 | 0.831 | 0.02 | 0.708 |
| Lives with others | -0.08 | 0.100* | -0.02 | 0.522 | -0.08 | 0.147 |
| Residential type | ||||||
| Community residential care | -0.01 | 0.808 | 0.03 | 0.516 | -0.06 | 0.326 |
| Other setting for older or disabled persons | -0.01 | 0.899 | 0.00 | 0.945 | 0.04 | 0.483 |
| Number of nonresident daughters nearby | 0.02 | 0.396 | -0.01 | 0.595 | 0.02 | 0.449 |
| Education | ||||||
| High school | -0.01 | 0.875 | -0.02 | 0.600 | 0.03 | 0.629 |
| Some college | 0.08 | 0.101 | -0.01 | 0.809 | 0.06 | 0.203 |
| Medicaid eligible | 0.04 | 0.529 | 0.02 | 0.618 | 0.06 | 0.285 |
| Annual Income | ||||||
| $10,000 - <$20,000 | -0.07 | 0.183 | -0.05 | 0.216 | 0.00 | 0.953 |
| $20,000 - <$30,000 | -0.07 | 0.321 | -0.07 | 0.105 | 0.04 | 0.544 |
| $30,000 - <$40,000 | 0.06 | 0.457 | 0.05 | 0.471 | 0.09 | 0.301 |
| $40,000 or more | -0.07 | 0.285 | 0.07 | 0.241 | 0.03 | 0.604 |
| Race/ethnicity | ||||||
| Black | 0.06 | 0.368 | 0.00 | 0.965 | -0.01 | 0.931 |
| Hispanic | 0.11 | 0.191 | 0.14 | 0.058* | 0.14 | 0.108 |
| Health conditions/events | ||||||
| Disabetes | -0.02 | 0.656 | 0.02 | 0.535 | -0.03 | 0.454 |
| Heart attack/other heart problem in the last 12 months | -0.01 | 0.768 | -0.01 | 0.765 | -0.02 | 0.613 |
| Paralysis/other nervous system disorder | 0.03 | 0.602 | 0.04 | 0.416 | 0.02 | 0.744 |
| Asthma/bronchitis in the last 12 months | 0.05 | 0.320 | 0.05 | 0.171 | 0.00 | 0.956 |
| Pneumonia in the last 12 months | -0.05 | 0.490 | -0.07 | 0.058* | -0.02 | 0.758 |
| Broken hip or other bone in last 12 months | -0.07 | 0.396 | -0.04 | 0.312 | -0.03 | 0.654 |
| Stroke in the last 12 months | -0.03 | 0.688 | -0.05 | 0.365 | -0.02 | 0.798 |
| Recent utilization events | ||||||
| Hospitalization in last 6 months | 0.01 | 0.842 | -0.03 | 0.517 | 0.05 | 0.334 |
| Home health use in last 6 months | 0.02 | 0.670 | -0.03 | 0.432 | 0.04 | 0.543 |
| SNF use in last 6 months | 0.03 | 0.713 | 0.02 | 0.781 | 0.12 | 0.153 |
| Hospice use in last 6 months | 0.13 | 0.393 | -0.12 | 0.065* | 0.21 | 0.242 |
| Proxy respondent | -0.01 | 0.732 | 0.02 | 0.504 | 0.00 | 0.964 |
| Survive less than 1 year | 0.06 | 0.296 | -0.02 | 0.734 | 0.10 | 0.127 |
| Region | ||||||
| Northeast | -0.01 | 0.850 | 0.00 | 0.940 | -0.09 | 0.128 |
| South | 0.02 | 0.694 | 0.02 | 0.650 | 0.01 | 0.826 |
| West | -0.02 | 0.725 | -0.01 | 0.864 | -0.07 | 0.137 |
| NOTE: Unweighted sample size = 1,831. **(*) coefficient is significantly different from zero at the 5%(10%) level in a two-tailed test. | ||||||