
Final White Paper
Contract # HHSP2333700IT
Prepared for:
James Sorace, MD, MS, Michael Millman, PhD
Assistant Secretary for Planning and Evaluation
U.S. Department of Health & Human Services
200 Independence Ave. S.W. Washington, DC 20201
Prepared by:
Abt Associates Inc.
Cambridge, MA
Lisa LeRoy, MBA, PhD
Melanie Wasserman, PhD
Michael Rezaee, MPH
Alan White, PhD
The information contained in this white paper was compiled by Abt Associates, Inc. under contract #HHSP2333700IT to the Assistant Secretary for Planning and Evaluation (ASPE) in September 2013. The findings and conclusions of this report are those of the authors and do not necessarily represent the views of ASPE or HHS.
Understanding how to provide better care for individuals with multiple chronic conditions (MCC) is a priority for the Department of Health and Human Services. Persons with MCC represent almost one-third of the U.S. population and account for two-thirds of health care spending, yet most research on chronic conditions focuses on single diseases. In response to this growing challenge, the Department of Health and Human Services (HHS) led the development of the Strategic Framework on Multiple Chronic Conditions, a roadmap for federal MCC priorities.
"1. Executive Summary
Understanding how to better care for individuals with multiple chronic conditions (MCC) is a priority for the Department of Health and Human Services. Persons with MCC represent almost one-third of the U.S. population and account for two-thirds of health care spending, yet most research on chronic conditions focuses on single diseases. In response to this growing challenge, the Department of Health and Human Services (HHS) led the development of the Strategic Framework on Multiple Chronic Conditions(HHS 2010).
This white paper contributes to meeting the goals outlined by the HHS strategic framework by examining promising data, methods, and topics for future disparities research within the MCC population. It builds on a previous white paper titled “Understanding the High Prevalence of Low-Prevalence Chronic Disease Combinations: Databases and Methods for Research”, which describes the “long tail” of the MCC distribution: approximately one-third of all Medicare patients have one of the most common combinations of MCC, but another third of all patients have one of two million unique combinations of MCC and account for 79% of health care costs. This poses a unique challenge for research because of the small number of persons within each unique combination of MCC in the “long tail” of the distribution (Exhibit 1). For disparities research, the challenge is even greater as stratification by race, ethnicity and sociodemographic variables further reduces sample size.
The present paper summarizes the current literature on MCC disparities, describes how the methodological challenges of disparities research are further manifested in MCC research, reviews promising methods, and assesses the usability of various data systems and datasets for MCC disparities research.
Study methods for this paper included a literature review (Appendix B), interviews with nine key informants (Appendix C) who were identified by ASPE project officers and our Technical Advisory Group (Appendix D), a review of datasets and data systems identified in the first White Paper (Appendix E), to assess their potential for MCC disparities research, and integration of input and feedback from key informants and the Technical Advisory Group.
Study results showed that most of the existing disparities research to date has focused on individual chronic conditions. There has been little research on the extent, causes, and strategies for reducing disparities within the MCC population. Further research is needed to test and replicate findings from recent studies before patterns can be confirmed. Results from our literature review suggest that:
- Women are more likely than men to be classified as having MCC (Ashman et al., 2013; CMS, 2012; Ward et al., 2012; Machlin et al., 2013).
- The number of chronic conditions rises with age (Freid et al., 2012).
- Hispanic patients have the lowest MCC prevalence (Ward et al., 2013; Steiner et al., 2013). Mexican-Americans have lower initial levels of MCC and slower accumulation of comorbidity compared to non-Hispanic White and non-Hispanic Black patients (Quinones et al., 2011).
- MCC prevalence among Asian Americans is lower compared to white or black MCC patients (Machlin et al. 2013), though Asians/Pacific Islanders had the highest mortality and cost per case compared to all other groups (Steiner et al., 2013).
Exhibit 1: Percent of Disease Prevalence and Cost in the Beginning of Medicare’s Long Tail
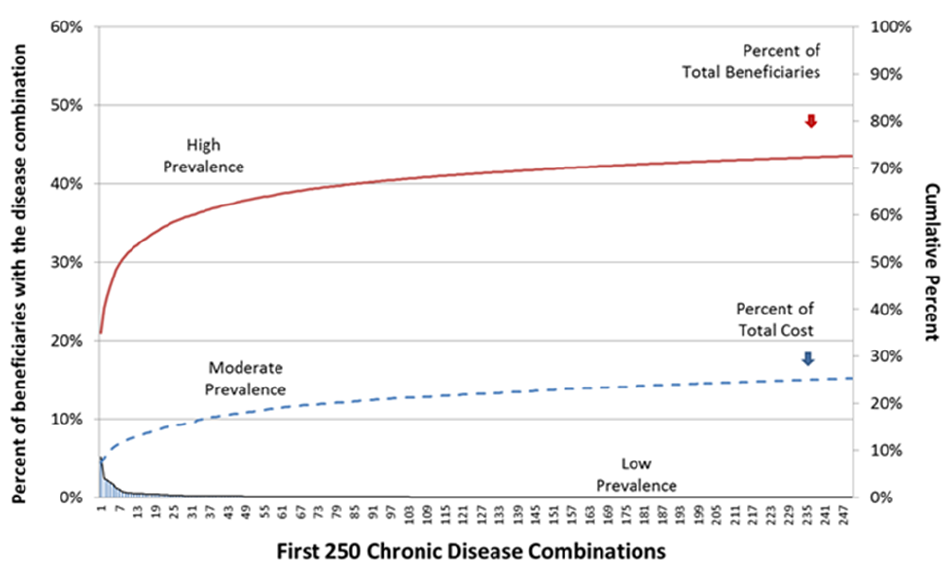
Note on the Exhibit: The exhibit displays the first 250 Disease Combinations (ranked by prevalence) from the baseline HCC
analysis as calculated by Sorace and colleagues (Sorace et al. 2011). Chronic disease combination classifications (e.g. high,
moderate and low) were assigned, but only represent rough approximations; specific criteria for each classification have not been
defined. Note that the left Y-axis represents the proportion of the population that is included in each unique disease combination,
and is adjusted for the 32% of beneficiaries and 6% of expenditures that are associated with the no-HCC population. The right Y-
axis represents the cumulative percent of the total population (red format) and the total expenditure (blue format). Note that
approximately 75% of expenditures are associated with the 27% of patients that are not represented by the most prevalent 250
disease combinations. As there are over 2 million disease combinations calculated by this methodology, the figure’s X-axis
would need to be extended over 8,000 fold to the reader’s right before both cumulative lines reached 100%.
Future research on disparities in the MCC population would be facilitated by the development of a conceptual model of MCC disparities that incorporates the roles of biological, behavioral, health care, socio-economic, community and environmental factors; and by further development of the research infrastructure, for example through continued efforts to improve the reporting of patient race, ethnicity, language, and other sociodemographic variables.
Several immediate MCC disparities research opportunities are identified in this paper, including secondary data analyses, intervention research, and research using complementary methods such as qualitative methods, positive deviance research, metasynthesis and rare disease surveillance.
2. Introduction
Adults with multiple chronic conditions (MCC) represent a growing percentage of the population as well as a large percentage of health care services utilization and cost. To date, however, most research on chronic conditions focuses on individual conditions, in isolation from chronic comorbidities. Consequently, research results often are not applicable to the population of persons with MCC. Research on the unique challenges facing individuals with multiple chronic conditions (MCC) is an emerging field of study supported by the Department of Health and Human Services (HHS). In 2008 HHS formed the Interagency Workgroup on Multiple Chronic Conditions which developed a strategic framework for improving health care for people with multiple chronic conditions and created an inventory of HHS activities focused on MCC (HHS 2010 & 2011).
As part of its MCC strategic framework, HHS specified a goal related to research gaps with a sub goal (objective) and strategies related to addressing disparities:
- “Goal 4: Facilitate research to fill knowledge gaps about, and interventions and systems to benefit, individuals with multiple chronic conditions.
- Objective D: Address disparities in multiple chronic conditions populations.
- Strategy 4.D.1: Stimulate research to more clearly elucidate differences between and opportunities for prevention and intervention in MCC among various sociodemographic groups.
- Strategy 4.D.2: Use research findings on group-specific indicators for MCC risk and intervention options to leverage HHS disparities programs and initiatives to address the MCC population.”
- Objective D: Address disparities in multiple chronic conditions populations.
This white paper advances HHS’s Goal 4 by describing health disparities research challenges, accomplishments, and opportunities in the MCC field.
The standard challenges of studying disparities are compounded by similar research challenges relating to MCC. These challenges include:
- Sample size: Only a limited number of administrative and epidemiological datasets provide a sufficiently large sample size to study MCC, let alone detect disparities in persons with MCC. (For a full discussion of issues related to studying MCC see Understanding the High Prevalence of Low- Prevalence Chronic Disease Combinations: Databases and Methods for Research. Rezaee M. et al. September 2013, available at: http://aspe.hhs.gov/.
- Data quality: Of the datasets that are large enough to study the numerous unique combinations of MCC, many have data quality issues that result in the misclassification of persons into (or out of) groups burdened by disparities.
- Data capture: Datasets developed through healthcare provider and insurance systems only capture people with MCC who utilize the health care system.
- Lack of standard definitions: The concepts of disparities and MCC are defined differently by different researchers, making it difficult for researchers in the field to build on each other’s findings.
- Constantly evolving methods: Methods used to study both MCC and disparities are continually evolving, complicating disparities-sensitive measures of health care quality for patients with MCC.
- Limited information: The factors that drive differences in MCC prevalence and healthcare utilization/cost in race/ethnic groups may include genetics, circumstances (e.g. health immigrant effect), inaccurate data collection procedures, patient access to healthcare (sampling issues), etc. When interpreting the research on racial/ethnic disparities it is important to understand the potential limitations of the data.
Despite these methodological challenges, the body of knowledge on MCC disparities is growing as discussed later in the report.
2.1 Study Purpose
The current report is the second of two related papers commissioned by Health and Human Services. The first paper outlined the research challenges and techniques of studying multiple chronic conditions, with an emphasis on studying the “long tail” of the distribution of multiple chronic conditions (Rezaee, et.al. 2013). There are many unique combinations of chronic conditions with a relatively small number of people experiencing each combination. Any one provider or insurer will have a subset of patients with a particular combination, making it difficult to study or develop optimal care plans for each group of patients.
The purpose of the study is to assess the existing data sources and methods that can be used to investigate disparities and MCC. The paper is intended to serve as a resource for investigators working on disparities MCC with a goal of identifying promising areas for research, data sources and methods. The information can help both researchers and stakeholders better understand and interpret research results, as well as consider what steps might be taken in the future to improve the knowledgebase on health care for MCC. It may also be useful to researchers implementing the National Strategic Disparities Plans produced by other agencies and stakeholders (See Exhibit 2).
The white paper addresses the following questions:
- What combinations of comorbidities are most critical in terms of identifying opportunities for targeting and reducing disparities in care utilization and cost in MCC adult populations?
- What data systems and datasets exist that can be analyzed to better improve our understanding of and approaches to addressing disparities in MCC adult populations?
Exhibit 2: National Strategic Disparities Plans
| HHS Agency/ Organization | Title | Year | Summary | Citation |
|---|---|---|---|---|
| Agency for Healthcare Research and Quality (AHRQ) | National Healthcare Disparities Report | 2012 | Highlights healthcare access for racial and ethnic groups from 2002–2008. | Agency for Healthcare Research and Quality. (2013). 2012 National Healthcare Disparities Report. Rockville, MD. |
| Centers for Disease Control and Prevention (CDC) | CDC Health Disparities and Inequalities Report – United States, 2011 | 2011 | Consolidates national data on disparities in mortality, morbidity, behavioral risk factors, healthcare access, preventive health services, and social determinants of critical health problems in the US. | Centers for Disease Control and Prevention. (2011). CDC Health Disparities and Inequalities Report – United States, 2011. Morbidity and Mortality Weekly Report,60 (Suppl),1-114. |
| Institute of Medicine (IOM) | How Far Have We Come in Reducing Health Disparities?: Progress Since 2000: Workshop Summary | 2012 | Summarizes an IOM workshop on April 8th, 2010 during which progress to address health disparities through a number of federal initiatives was discussed. | IOM Institute of Medicine. (2012). How far have we come in reducing health disparities: Progress since 2000: Workshop summary. Washington, D.C.: The National Academies Press. |
| National Institutes of Health (NIH) | NIH Health DisparitiesStrategic Plan and Budget Fiscal Years 2009-2013 | 2009 | Details the major priorities and NIH initiatives currently being undertaken to eliminate health disparities. | National Institutes of Health. NIH Health Disparities Strategic Plan and Budget Fiscal Years 2009-2013. U.S. Department of Health and Human Services, Bethesda, MD. |
| National Partnership for Action to End Health Disparities (NPA) | HHS Action Plan to Reduce Racial and Ethnic Health Disparities National Stakeholder Strategy for Achieving Health Equity | 2011 | Outlines goals and actions HHS will take to reduce health disparities among racial and ethnic minorities. | U.S. Department of Health and Human Services. (2011). HHS Action Plan to Reduce Racial and Ethnic Disparities: A Nation Free of Disparities in Health and Health Care. Washington, DC. |
| National Partnership for Action to End Health Disparities (NPA) | National Stakeholder Strategy for Achieving Health Equity | 2011 | Provides a common set of goals and objectives for public and private sector initiatives and partnerships to help racial and ethnic minorities–and other underserved groups – reach their full health potential. | National Partnership for Action to End Health Disparities. (2011). National Stakeholder Strategy for Achieving Health Equity. Rockville, MD: U.S. Department of Health & Human Services, Office of Minority Health. |
2.2 Organization of the Paper
The first section of the report presents common definitions of disparities and reviews variables currently used to identify disparities. We then describe the methods we used in developing the paper, and report on the findings from the literature review and data systems review. We conclude with considerations for future research priorities, which were developed in collaboration with HHS and the Technical Advisory Panel.
3. Methods
The methods for addressing the two disparities research questions included a review of the peer-reviewed and grey literature, key informant interviews with academic and disparities policy experts, a review of databases that can be used to study disparities in the MCC population and discussion of the findings and recommendations by a Technical Advisory Group. Each method is described below.
It is important to note that definitions of disparities have changed over time and also vary according to different scholars and practitioners. As background for the methods description, we provide a short summary of definitions of disparities and variables used to discern disparities.
3.1 Definitions of Disparities
The multiple ways of defining and measuring disparities make it difficult to synthesize research on disparities and health equity. In a 2012 report by the IOM, one of the recommendations was to standardize the definition of disparities (IOM 2012). A seminal paper by Braverman (2006) provides a history of definitions and measures beginning with Whitehead’s (1992) notion that disparities in health are differences that are avoidable, unjust and unfair. While other authors define any difference in health outcomes as a disparity (Murray, et. al 1999), most incorporate the concept that disparities are due to a disadvantage of one kind or another, e.g. discrimination, place of residence, etc. Because inequity is a result of disadvantage, if one employs Whitehead’s interpretation of disparities, they are avoidable and unjust.
Because it is not always possible to identify differences that are unjust, simple differences by race, ethnicity and other variables such as disability status have been used historically to explore disparities. Many disparities researchers focus their research exclusively on differences by race and ethnicity. In addition, a considerable body of evidence exists on gender disparities. More recently, researchers have also stratified results by socioeconomic status, level of education, geographic region, disability, and sexual preference and orientation. There is tremendous overlap among categories like minority groups, the disabled, low educational attainment, dual-eligibles (Medicaid and Medicare eligible beneficiaries), poverty level, and zip code. With growing discussion of race as a social construct rather than a biological characteristic, measurement of race and ethnicity1 becomes increasingly complicated. Alternative variables that are associated with health outcomes, like zip code and education level, are becoming more attractive to health researchers who wish to move away from using race and ethnicity categories that can lead to stigmatization, discrimination and profiling. The new variables may be more precise in identifying disparities without the negative connotations.
The HHS Action Plan to Reduce Racial and Ethnic Health Disparities (2011) included explanatory information on the many factors that affect health outcomes, as follows, “the World Health Organization (WHO) defines these ‘social determinants of health’ as the conditions in which people are born, grow, live, work and age that can contribute to or detract from the health of individuals and communities. Marked difference in social determinants, such as poverty, low socioeconomic status (SES), and lack of access to care, exist along racial and ethnic lines. These differences can contribute to poor health outcomes” (p. 3). The social determinants of health illustrate how the health care system alone cannot address all health disparities.
A recent National Institute on Aging (NIA) Council report urged the adoption of an integrative conceptual model to approach health disparities research, which conveys that health disparities are multidimensional, and are caused by factors operating at various levels of analysis, including the biological, behavioral, sociocultural, and environmental. The report urges the NIA to identify which factors are important to examine and how various dimensions or factors leading to health disparities interact. It further states that these interactions are important, because the biological factors underlying health disparities are not independent of socioeconomic factors, and health disparities will not be understood simply by focusing on one level of analysis.
While the definitions above convey a nuanced understanding of what causes disparities and how disparities should ideally be studied, to-date most research on disparities in the MCC population has primarily utilized demographic variables to identify differences between groups.
Given the sparse literature specifically focused on MCC disparities, for the purpose of the paper we define disparities as any observed difference in health care quality or health outcomes between population groups characterized by sociodemographic variables such as by race, ethnicity, gender, and socioeconomic status. This broad definition allows us to cast a wide net in identifying relevant research.
1 Race is defined as the biological differences among groups, while ethnicity is defined as a common cultural identity in a group (Cunningham, 2012).
3.2 Socio-demographic Variables Used to Identify Disparities
To study trends in disparities over time, consistent race and ethnicity variables are necessary. The federal government has tried to develop more sensitive variables over time, but also preserve the ability to examine longitudinal trends. The Census Bureau, Office of Management and Budget, Institute of Medicine and Department of Health and Human Services have all grappled with this issue. The current HHS standards for collecting disparities data is provided in Appendix A. The Affordable Care Act mandated that these data variables be included in all federal health surveys. More information on these standards is included in Section 5.2.1.
3.3 Literature Review
Abt Associates conducted a review of the peer-reviewed and grey literature related to disparities and multiple chronic conditions over the last 10 years. Of the 751 peer-reviewed articles identified in our targeted PubMed search only 16 (2.1%) pertained to disparities in the MCC population. Our MEDLINE search strategy can be found in Appendix B. The purpose of the literature review was to identify recent MCC research studies and methods papers addressing health disparities. Studies that focused on individual chronic diseases were excluded from the review. The findings are described in Section 4 of the white paper.
3.4 Key Informant interviews
To further inform the study of disparities in MCC populations, Abt and ASPE conducted key informant interviews with six experts from academic, research and policy organizations. A list of key informants can found be found in Appendix C. Each expert was asked to share his or her perspective and knowledge regarding a framework and research priorities for studying disparities within MCC populations. The information gleaned from key informants is integrated throughout the report.
Key Informant Perspectives
- Health Disparities Research
- Large-scale Demonstrations
- Minority Health Policy
- Clinicians
3.5 Review of Databases
The Abt Associates team conducted a detailed review of 17 databases that may potentially be used for research on disparities in MCC populations. The datasets were initially reviewed to assess their potential for studying the “long tail” of people with MCC, then re-reviewed to assess their capacity for disparities research on groups with MCC. An example of the detailed description of the datasets can be found in Exhibit 7 and the full review of datasets is contained in Appendix E.
3.6 Technical Advisory Group
A Technical Advisory Group (TAG) comprised of nine disparities and MCC experts from a several key HHS agencies provided advice and feedback on the project. A list of TAG members and their affiliations is contained in Appendix D. On December 18th, 2012, Abt and ASPE conducted an initial in-person meeting with the TAG, the last portion of which was devoted to discussing the white paper on disparities and MCC. The objectives were to:
- Outline an initial framework and approach to studying disparities in MCC populations.
- Discuss the findings from the preliminary literature and database review related to disparities and MCC, as well as the search strategy itself.
- Technology (ONC) Identify additional peer-reviewed articles and grey literature, and databases that were relevant for the project.
On August 14th, 2013, the TAG was reconvened by teleconference to review and provide edits and suggestions on the first draft of the paper. TAG input was incorporated into the final draft.
HHS Agencies Represented by the TAG
- Agency for Healthcare Research and Quality (AHRQ)
- Assistant Secretary for Planning and Evaluation (ASPE)
- Centers for Medicare & Medicaid Services(CMS)
- Centers for Disease Control and Prevention (CDC)
- National Institute on Aging (NIA)
- Office of the Assistant Secretary for Health (ASH)
- Office of Minority Health (OMH)
- Office of the National Coordinator for Health Information
- Technology (ONC)
4. Findings from MCC Literature on Disparities
Research on disparities among the MCC population is not well-developed. Many studies have looked at disparities among individuals with a specific chronic condition, even with two and three chronic conditions, but the research has not been synthesized or considered as a body of research on MCC. Governmental priorities such as the HHS Interagency Workgroup’s objective to address disparities in MCC patients through research on different socio-demographic groups, are intended to spur studies to fill the knowledge gap. As stated earlier in the report, research on multiple chronic conditions is lacking in general, and research on disparities in the MCC population even more so.
Similar to other forms of disparities research, the studies that have been conducted on the MCC population to-date have been descriptive in nature. The research has focused on identifying the existence of potential disparities in the MCC population, rather than examining the root-causes of these disparities or potential measures for resolution, and is limited in its ability to suggest evidence-based interventions to reduce disparities among persons with MCC.
Based on the findings from our literature review, key informant interviews, and TAG meetings, we summarized the available MCC disparities research into the following topic areas:
- Non-disease specific disparities
- Most common disease clusters in men and women
- Disease-specific disparities
The literature related to each topic is summarized in turn, below. We describe the kinds of research being conducted under each topic and highlight the findings.
4.1 Non-Disease Specific Disparities in the MCC Population
For the purposes of this white paper, non-disease specific disparities are defined as disparities that relate to MCC in general, rather than a specific combination of chronic conditions. As discussed in depth in the first white paper (Rezaee, 2013) many MCC studies use counts of chronic conditions as a way of categorizing groups because of the complexity of parsing the myriad disease combinations that exist. Groups of consumers are categorized as having two, three, four, etc. chronic conditions but the conditions are not necessarily the same ones. One person in a group with three chronic conditions may have diabetes, hypertension and Multiple Sclerosis while another might have diabetes, COPD and arthritis. By contrast, disease specific disparities investigate differences that occur among patients with a specific combination of chronic conditions (e.g. hypertension, diabetes, and MS). Only individuals with those specific MCC combinations are considered in the research.
Non-disease specific disparities research has examined MCC prevalence, healthcare utilization and cost, and the occurrence of common chronic disease combinations across different MCC patient groups. Exhibit 3 describes studies conducted on non-disease specific disparities to-date. Several of the papers represent a coordinated effort by the HHS Interagency Workgroup to review national datasets that could be used for MCC research, and the findings were published in the Journal of Preventing Chronic Disease The articles are available online at: http://www.cdc.gov/pcd/collections/pdf/PCD_MCC_Collection_5-17-13.pdf. The authors chose 20 chronic conditions in order to compare the ability of each dataset to address specific MCC (Goodman, 2013).
The datasets focus on adult and elderly populations (versus children) and use the number of chronic conditions a person has to create groups. The most common differences explored in MCC groups are by gender, age, and race/ethnicity differences. In the sections that follow, we discuss the findings of the research conducted to investigate disparities among people with the same number (non-disease specific) of MCC. The findings are organized by gender, age, race/ethnicity, insurance status, and education.
Exhibit 3: Summary of Non Disease Specific MCC Disparities Studies
| Citation | Year | Sample | Data Source | # of CC studied by authors | Disparities Investigated | Disease Clusters Investigated |
|---|---|---|---|---|---|---|
| Note: The Office of the Assistant Secretary for Health (OASH ) developed a list of 20 CCs that they then studied across a number of datasets (Goodman,For these studies, the number of CCs from this list that authors chose to look at is represented by an asterisk, *. | ||||||
| Ashman JJ, Beresovsky V. Multiple chronic conditions among US adults who visited physician offices: data from the National Ambulatory Medical Care Survey, 2009. Prev Chronic Dis 2013; 10:120308. | 2013 | Adult Civilian Patients N=28,693 | National Ambulatory Medical Care Survey | 13* | Gender Age Race/Ethnicity Insurance Type | Yes |
| Centers for Medicare & Medicaid Services (CMS). Chronic Conditions among Medicare Beneficiaries, Chartbook. 2012 Edition. Baltimore, MD. 2012. | 2012 | Medicare Patients N=31,313,344 | CMS Chronic Condition Warehouse | 15 | Gender Age Race/Ethnicity Dual Eligibility Status | No |
| Ford ES, Croft JB, Posner SF, Goodman RA, Giles WH. Co-occurrence of leading lifestyle-related chronic conditions among adults in the United States, 2002-2009. Prev Chronic Dis 2013;10:120316. | 2013 | Adult Civilians N =196,240 | National HealthInterview Survey | 9* | Gender Age Race/Ethnicity Education | No |
| Freid VM, Bernstein AM, and Bush MA. Multiple chronic conditions among adults aged 45 and over: Trends over the past 10 years. NCHS data brief, no.100. Hyattsville, MD: National Center for Health Statistics. 2012. | 2012 | Adult Civilians N = 30,682 | National HealthInterview Survey | 9 | Age Race/Ethnicity | No |
| Hidalgo CA, Blumm N, Barabási A-L, Christakis NA(2009) A Dynamic Network Approach for the Study of Human Phenotypes. PLoS Comput Biol 5(4): e1000353. | 2009 | Medicare Patients | Medicare Provider and Analysis Review File | 16,459 | Race & Ethnicity | Yes |
| Lochner KA, Cox CS. Prevalence of multiple chronic conditions among Medicare beneficiaries, United States, 2010. Prev Chronic Dis 2013;10:120137. | 2013 | Medicare Patients N=31 million | Medicare Claims | 15* | Gender Age Race & Ethnicity Dual Eligibility Status | Yes |
| Machlin SR, Soni A. Health care expenditures for adults with multiple treated chronic conditions: estimates from the Medical Expenditure Panel Survey, 2009. Prev Chronic Dis 2013;10:120172. | 2013 | Adult Civilians N=24,870 | Medical Expenditure Panel Survey | 20* | Gender Age Race & Ethnicity Insurance Type Utilization | No |
| Steiner CA, Friedman B. Hospital utilization, costs, and mortality for adults with multiple chronic conditions, Nationwide Inpatient Sample, 2009. Prev Chronic Dis 2013;10;120292. | 2013 | Adult Inpatients N=7,810,762 | Nationwide Inpatient Sample | 15* | Gender Age Race & Ethnicity Insurance Type Mortality Utilization & Cost | Yes |
| Steinman, M.A., Lee, S.J., John, B.W. et al. Patterns of Multimorbidity in elderly veterans. J Am Geriatr Soc. 2012 Oct;60(10):1872-80. | 2012 | VA Patients N=2,002,693 | VA Databases | 23 | Gender | Yes |
| Ward BW, and Schiller JS. Prevalence of multiple chronic conditions among US adults: estimates from the National Health Interview Survey, 2010. Prev Chronic Dis. 2013;10:E65. | 2013 | Adult Civilians N=27,157 | National HealthInterview Survey | 10* | Gender Age Race & Ethnicity Insurance Type | Yes |
4.1.1 Gender
Evidence suggests that small, yet significant, disparities may exist between men and women who have MCC. A number of studies report that women are more likely to have, and be treated for, MCC compared to men (Ashman et al., 2013; CMS, 2012; Ward et al., 2013; Machlin et al., 2013). For example, the 2012 Edition of the CMS Chronic Conditions Chartbook reports that over 72% of women in the Medicare program have two or more chronic conditions compared to 65% of men; a difference of 7% (CMS, 2012). This difference is similar when comparing prevalence rates for men and women across different study populations, and across higher numbers of chronic conditions, as shown below in Exhibit 4A-C. The MCC prevalence rates are higher for women than men, with few exceptions.
Exhibits 4A-C: Differences in MCC Prevalence Rates between Men and Women in Six Studies
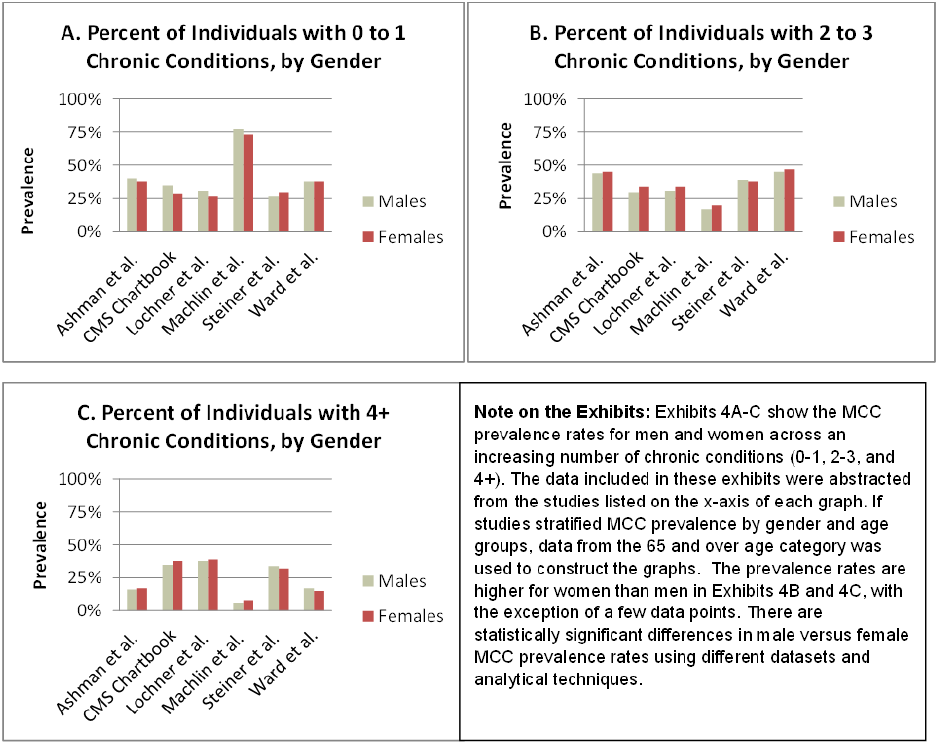
It is important to note that the difference in MCC prevalence between men and women may be explained by intrinsic gender-specific characteristics. The accumulation of chronic conditions is time-dependent, meaning that individuals who live longer are at greater risk for acquiring a chronic condition. Since women live on average 5 years longer than men (81.1 vs. 76.3), it is possible that women in each of the studies referenced above are, on average, older than the men, resulting in a difference in MCC prevalence that is driven by age rather than by gender specifically (CDC, 2011).
Similarly, women are more likely to utilize healthcare services than men (CDC, 2001) accounting for part of the service utilization disparities. Consequently, at least one investigator has concluded that clinically meaningful differences in MCC prevalence between men and women may not exist (Quinones et al., 2011).
4.1.2 Age
As discussed previously, there is a temporal aspect to accumulating chronic conditions for patients; the longer a person lives the higher the probability of disease onset. Consequently, the older the person, the more likely they are to have MCC and the more conditions they are likely to have. Freid and colleagues
found over 24% difference in MCC prevalence rates between adults age 45-64 (21.0%) and 65 and older (45.3%) using the 2009-2010 National Health Interview Survey data (Freid et al., 2012).
Machlin and colleagues found that the number of inpatient stays and average expenditures for MCC patients did not necessarily increase with patient age. For example, average patient expenditures ranged from $22,911 for patients 18-44 years old, to $25,814 and $24,532 for patients 45-65 and 65 and older, respectively. This finding suggests that expenditures and utilization may be more related to the number of chronic conditions a person has than age. However, more research is needed to better understand the impact of patient age in the MCC population.
A National Institute on Aging (NIA) council subcommittee recently completed a report on aging and health disparities (Perez-Stable et al. 2012). While the report did not discuss the need for MCC research per se, it called for more research on aging and disparities, and for the adoption of an integrated conceptual model for disparities research, which is multi-level, multi-sectorial, and multi-dimensional, and includes biological, behavioral and socio-economic elements.
4.1.3 Race/Ethnicity
MCC prevalence across racial/ethnic groups varies according to the population included in the study. Non-Hispanic whites had the highest MCC prevalence rates in the Medicare and Adult Civilian populations (Lochner et al. 2013, Machlin et al. 2013), while Freid, et al. found that non-Hispanic Blacks had the highest MCC prevalence rates in the adult civilian population (Freid et al. 2012) while differences between racial/ethnic groups in Medicare were minimal (CMS 2012). These varying results point to the need to for research on subsamples that are hypothesized to be disparate. However, one commonality across studies is that Hispanic patients had lower MCC prevalence rates when compared to white and black populations (See Exhibit 5). Ward and colleagues found that among the same gender and age group, non-Hispanic white (33.6%) and non-Hispanic Black men (38.4%) were more likely to have two or more MCC compared to Hispanic men (23.4%) (Ward et al. 2013). Steiner and colleagues also found that the proportion of adults discharged with four or more MCC was lowest among Hispanic patients when analyzing the Nationwide Inpatient Sample (Steiner et al. 2013). Other race/ethnic groups, such as Asian/Pacific Islander or Native Americas, have not been as well studied. Although some evidence suggests that MCC prevalence estimates in these populations are also smaller compared to white or black MCC patients (Machlin et al. 2013).
Although only supported by one study in the literature review, the accumulation of chronic conditions over time may vary across different race/ethnic groups. In an 11-year longitudinal study of Health & Retirement Study data, Quinones and colleagues examined the trajectory of multimorbidity across different race/ethnic groups and found that Mexican Americans had lower initial levels and slower accumulation of comorbidity than white and black MCC patients (Quinones et al. 2011). In addition, blacks were found to have an elevated level of multimorbidity at baseline, but slower rate of increase in multimorbidity over the study period relative to white patients. Prevalence rates among black and white MCC patients appeared to converge over time. There was a clear difference in MCC prevalence between Hispanic/Mexican and white/black individuals, but less between white and black groups.
Exhibit 5: MCC Prevalence by Race/Ethnic Group in Four Studies from 2010 to 2013*
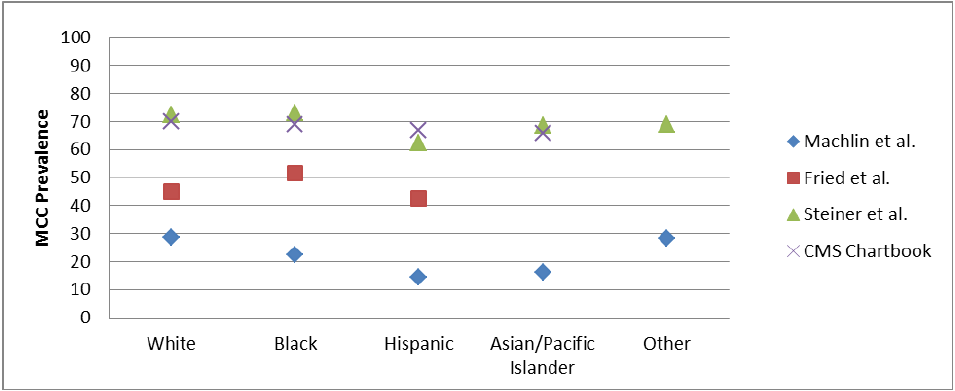
*Note: although the studies include different age groups, the relative trends are consistent.
Differences in chronic condition clusters among race/ethnic groups were examined by one study to-date. Using ICD-9 codes to create a Phenotypic Disease Network, Hidalgo and colleagues were able to examine differences in the strengths of disease comorbidities between white and black males (Hidalgo et al., 2009). Although not reported here, their analysis suggests that significantly different disease networks may exist among different race/ethnic groups. However, their investigation is their first of its kind and cannot be compared with other evidence at this time.
Only one study investigated healthcare utilization, cost and outcomes across different race/ethnic groups. Steiner and colleagues found that Asian/Pacific Islanders had the highest mortality and cost per case compared to all other groups, including Native Americans (Steiner et al., 2013).
4.1.4 Insurance Status
It has been well documented that dual-eligible (Medicare & Medicaid) beneficiaries have higher prevalence of MCC than non-dual eligible beneficiaries (CMS 2012 & Lochner et al. 2013). The 2012 CMS Chartbook reports that 72% of dual eligible beneficiaries have MCC compared to 67% of non-dual patients. Dual eligible beneficiaries were also found to be 1.7 times more likely to have 6 or more chronic conditions compared to non-dual eligible beneficiaries (CMS 2012). This is not surprising because the dual-eligible program serves people with multiple disabilities.
Potential disparities in the MCC population in other types of insurance programs are not as well studied. Of the four studies that investigated potential disparities in the MCC population by insurance type, each study used a different insurance classification variable (i.e. private vs. public, Medicare vs. Medicaid) or unit of observation (i.e. patients, discharges, visits), making the results difficult to compare (Ashman et al. 2013, Machlin et al. 2013, Ward et al. 2013 and Steiner et al. 2013).
4.1.5 Education
Although limited, the existing data on the relationship of educational attainment and MCC prevalence shows that there may be a decrease in MCC for more educated individuals. In a 2013 study by Ford and colleagues, 2009 results from the National Health Interview Survey suggested that higher education attainment was associated with decreased MCC prevalence. Specifically, among respondents with less than a high school education, 18.9% had MCC compared to 16.1% of those with a high school degree and 12.9% of those with more than a high school degree (Ford et al. 2013). The role of educational attainment may also cross race/ethnic boundaries, as Liao and colleagues found that educational attainment is associated with the occurrence of fewer chronic conditions for both whites and blacks (Liao et al. 1999).
4.2 Most Common Disease Clusters in Men and Women
A number of studies have examined the most common chronic condition clusters in men and women (Ashman et al. 2013, Lochner et al. 2013, Steiner et al. 2013, Steinman et al. 2012, Ward et al. 2013). Exhibit 6 contains chronic condition dyads (2) and triads (3) that were examined in the studies. Although many chronic condition clusters, such as hypertension, hyperlipidemia and heart disease occur in both men and women, they occur at different rates. Other MCC clusters are found predominately in one gender, for example depression, osteoporosis, asthma and chronic obstructive pulmonary disease are more common in women.
Exhibit 6: Most Prevalent Chronic Disease Clusters in Men and Women in National Datasets; Preventing Chronic Disease Supplement, May 2013
| Author | Dyads | Triads | ||
|---|---|---|---|---|
| Males | Females | Males | Females | |
| Legend: Dyads, two-way chronic disease combinations; Triads, three-way chronic disease combinations. | ||||
| Ashman et al. 2013 Adult Civilian Patients (≥65 years) National Ambulatory Medical Care Survey |
|
|
|
|
| Lochner et al. 2013 Medicare Patients (≥65 years) Medicare Claims |
|
|
|
|
| Steiner et al. 2013 Adult Inpatients (≥65 years) Nationwide |
|
|
|
|
| Steinman et al. 2012 VA Patients (≥65 years) VA Databases | Not Reported | Not Reported |
|
|
| Ward et al. 2013 Adult Civilians (≥65 years) National Health Interview Survey |
|
|
|
|
4.3 Disease Specific Disparities in the MCC Population
For the purposes of the paper, disease-specific disparities are defined as disparities affecting individuals with a specific combination of chronic conditions. For example, using CMS administrative data Shaya and colleagues (2009) found that African American patients with both COPD and asthma had fewer outpatient visits, hospitalizations and used fewer medical services overall compared to white patients with the same disease combination. Likewise, a study of patients with chronic kidney disease and hypertension found that African American men had poorly controlled hypertension compared to African American women and white patients (Duru et al. 2009). A potential gender disparity was also noted by Kramer and colleagues after investigating patients with type II diabetes and coronary heart disease; men were found to be more thoroughly treated compared to women (Kramer et al. 2012).
Research that is conducted to investigate disparities in patients with specific chronic disease combinations is plentiful. Numerous studies have looked at patients with co-morbid conditions and have evaluated whether differences exist across different patient groups as in the Shaya study described above. Typically, however, one type of disparity (i.e. gender or race/ethnicity) is studied in a two-condition combination for one type of measure (i.e. utilization, cost, prevalence). Researchers have not “dissected” particular disease combinations to explore all the potential disparities that may exist. As a result, it is challenging to identify overall patterns across the individual studies. Reviewing the literature on the myriad studies of unique combinations of MCC was beyond the scope of the project.
5. Challenges in Disparities Research
The quality of demographic variables, especially race and ethnicity, has suffered from inconsistencies and challenges in data collection for all types of data, not just health data. The same conditions that compromise disparities data in general, compromise disparities research on groups with MCC. Currently national surveys and databases lack standardization among the demographic variables collected, observer bias and inadequate and insensitive response categories can prevent minority populations from being accurately represented in data capture efforts. Analytical challenges also complicate disparities research in general (and therefore MCC research.) The challenges are described below.
Fortunately, as discussed later, a broad range of efforts are being put into place to standardize and improve data collection methods, and improve the overall quality of demographic data. The Affordable Care Act, for instance, called for the creation and use of uniform demographic variables in national surveys. While improved data collection methodologies will help researchers create a more accurate picture of the health challenges facing specific racial and ethnic groups in our nation, it is important to note the potential risks of improving coding of small subgroups of the population, and to ensure that as the methods for identifying and analyzing ever smaller populations improves, safeguards will be put in place to preserve the privacy of these individuals and shield them from potential discrimination.
5.1 Quality of Race and Ethnicity Variables
Accuracy and completeness of demographic information is a concern in studying disparities. Race and ethnicity variables, in particular, have suffered from inconsistent measurement over time, evolving definitions and categories, insufficiently sensitive categories, and a variety of data collection challenges. The first U.S. census in 1790 recognized three racial categories: whites, blacks (as three fifths a person) and Indians who paid taxes; an unbalanced and racially motivated classification scheme (Williams, 1999). Within the past decade, the Office of Management and Budget (OMB) has approved the use of increasing numbers of racial and ethnic categories up to the current standard of 14 racial and 5 ethnic categories for use in federal data collection initiatives (Cunningham 2012). Federal efforts to collect disparities data are also hindered by non-uniform data collection practices across states. Medicaid in particular lacks federal disparities data collection standards, resulting in a large range between states in the type and quality of disparities data collected. Even within individual states the use of different healthcare provider organizations leads to further variability in the disparities data that is collected (Byrd & Verdier, 2011).
The quality of race and ethnicity variables is a limitation of most federal and private databases. For example, the Medicare enrollment database (EDB) at CMS contains race/ethnicity variables that are highly specific (low false positive rate), but insensitive (low true positive rate) for categories other than white or black. In other words, race/ethnicity coding for white and black beneficiaries is considerably more accurate than other minority groups, such as Asian or American Indians (Waldo, 2005). The Hispanic ethnicity code in the EDB captures only one third of beneficiaries who identify as Hispanic, leading to significant underestimation. Overall, minority populations are more likely to be missing race/ethnicity information or have misclassified information, and those minorities who are misclassified are most often misclassified as white (Waldo, 2005; Williams, 1999). Other examples of databases that suffer from inadequate race/ethnicity coding include the National Ambulatory Medical Care Survey and Healthcare Cost & Utilization Project - Nationwide Inpatient Sample.
5.1.1 Observer Bias and Self Identification of Race/Ethnicity
The quality of race and ethnicity information is compromised for many reasons. Observer bias is a significant source of error because an interviewer or data collector may incorrectly classify an individual as belonging to a race or ethnicity other than the self-identified ones. When comparing self-reported to interviewer-generated generated race and ethnicity information using an earlier version of the National Health Interview Survey (NHIS), Massey found that the 6% of individuals who self-identified as black, 29% as Asian or Pacific Islander, 62% as American Indian and 80% as other, were classified as white by their interviewer (Massey, 1980). Demographic data that is collected via self-reported information is considered to be the “gold standard” in disparities research.
Another example of observer bias relates to the National Death Index. Race/ethnicity data on death certificate is inaccurate because of inferred information on the deceased. Scott and colleagues found that only 63% of medical examiners, 50% of coroners and 37% of funeral directors communicate with family members to obtain a decedent’s race/ethnicity (Williams, 1999).
Respondent reliability is also a major source of error for race/ethnicity data. Researchers have estimated that up to one-third of the U.S. population has reported different race or ethnicity information from one year to the next (Johnson, 1986). There are also opportunistic self-identification shifts that can occur within the U.S. population. For example, from 1960 to 1990 there was a dramatic increase in the Native American population in the U.S. that could not be explained by increased reproductive rates or international migration. Instead, individuals who previously self-identified as white began to self-identify as Native American, most likely due to economic incentives and decreased societal discrimination (Passel & Berman, 1986).
5.1.2 Response Categories
Data collection procedures can significantly impact the quality of demographic and SES information obtained from patients. Studies have shown that preferred response options for self-identification impact racial/ethnic coding (Williams, 1999); for example an individual who self-identifies as Latino, but must choose either “Hispanic” or “white” on a survey must self-identify incorrectly, select an unknown category, or skip the question entirely. The limited number of race/ethnicity groups that patients are able to choose from represents a fraction of the race/ethnicity groups that exist. The fact that data collection policies and procedures across public and private efforts lack coordination and standardization also complicates our ability to examine disparities. One group may use three race/ethnic classes, while another collects four. The lack of standardized and reliable methods for collecting race/ethnicity data is the most commonly cited concern by health plans that choose not to collect this type of data (AHIP-RWJF 2006). Despite efforts to improve and expand racial/ethnic groups there is general consensus in the literature that current categories are more limiting than they are illustrative. Some believe there is more variation within race/ethnicity groups than between groups (Williams 1999). For example, the NHIS Hispanic code contains more than 25 different national origin populations that vary significantly in terms of health status (Sandefur et al., 2004).
5.1.3 Response Rate Bias
The phenomenon known as response rate bias, wherein public health surveys have low response rates in non-white populations and non-English speakers leads to poor representation of minority demographic groups. The reasons for low response rates, include, “disproportionate mistrust of government and the research community, cultural and language barriers, lower rates of literacy and health literacy, high mobility patterns, reluctance to reveal personal information, and data-collection procedures” (Link et al., 2006). Even when a minority population participates in a research survey, certain patient populations, such as Asian Americans, are numerically small and very diverse, and can be easily missed by non-sensitive sampling strategies (Sandefur 2004). Data obtained via sampling strategies that fail to achieve widespread demographic and geographic representation should be interpreted with caution. Research studies must be culturally and linguistically accessible for minority populations, and additional steps must be taken to guarantee privacy to minority populations who do participate in research studies.
5.2 Analytical Challenges in Assessing Disparities
Comparing data across studies to look at trends can be thwarted by different aggregation schemes. For example, one study may examine prevalence by gender, race and age, while another looks at prevalence by age and race; making it difficult to interpret results. In addition, studies often use different definitions for variables. For example, researchers use different “cut offs” for age (<65 or >65...or 50–60, 60–70, etc.).
Researchers are only beginning to develop quality measures intended for disparities research. Weissman et. al. (2011) released a report outlining recommendations for the development of quality measures to monitor potential healthcare disparities from the National Quality Forum’s (NQF) 700 available quality measures. The report recommended a three-step process for identifying disparities-sensitive quality measures: 1) Assess the NQF’s quality measures using disparities-sensitive principles, 2) Apply new criteria for disparities sensitivity for quality measures that do not stratify data by race/ethnicity, or other disparities variables, and 3) develop new disparities specific measures (pg. 7).
There are challenges in obtaining state and local data to for intervention research at the local level, as well.
6. Methods and Analytical Techniques for Addressing Challenges
Efforts to improve the validity and reliability of race/ethnicity information in the U.S. are described below and fall primarily into techniques to improve data collection and ways of imputing missing values for race and ethnicity data.
6.1.1 Improving Data Collection Techniques
Section 4302 of the Affordable Care Act mandated the creation of uniform data collection standards for use in the federal population health surveys which utilize self-reported data, such as the National Health Interview Survey (NHIS) and the National Health and Nutrition Examination Survey (NHANES). The final standards, which were published on October 31st, 2011, address the collection of race, ethnicity, gender, language, and disability items. The Affordable Care Act also instructed HHS that its data standards comply with any data collection standards published by the Office of Management and Budget (OMB). The data standards go into effect at the time of major revisions for each national population health survey (Office of Minority Health, 2013). The Office of Minority Health is working closely with ASPE, AHRQ and CMS to implement ACA data collection standards in NHIS, NHANES, and other population health surveys.
In addition to the changes required by the ACA, Cunningham et. al. recommend additional measures to improve the data:
- HHS should draft a consensus statement defining race, ethnicity, and ancestry.
- HHS should disseminate best practices for asking respondents for race and ethnicity data, including guidance on how to address respondents’ concerns about the uses of the data. Additionally, it would be helpful for HHS to encourage organizations to provide formal training to individuals who collect these data, including researchers, funeral directors, and clinical staff who register patients.
- HHS may consider issuing guidance to researchers and organizations about common resources and methods to determine appropriate granular ethnicity categories for their settings. Alternatively, HHS may consider disseminating a standard list of granular ethnicity categories.
- HHS should provide guidance on how multiracial data should be tabulated and analyzed.
- A question for “socially assigned race” should be further developed and tested.
- The Center for Medicare and Medicaid Services should verify the accuracy of current Medicare enrollees’ race and ethnicity data, which may have been imported from the Social Security Administration prior to the implementation of improved standards for data collection.
- HHS should develop guidance indicating appropriate circumstances under which indirect means, such as surname and geocoding, can be used for ascertaining race and ethnicity of populations when directly collected data are not available.
- HHS should require that electronic health technology software packages include fields for race, Hispanic/Latino origin, and granular ethnicity to obtain certification.
- As these standards are extended into health care delivery, HHS should consider the risks and benefits of collecting and sharing race and ethnicity data, as race and ethnicity data are not covered by the Health Insurance Portability and Accountability Act (HIPAA).
- As these data standards are extended into health delivery settings, HHS should require the analysis of health care quality metrics by race and ethnicity, and consider creating pay for performance incentives aimed at reducing racial and ethnic disparities.
Over the years Medicare has implemented a number of strategies to correct miscoded and address missing race/ethnicity information; such as the 1997 postcard survey of 2 million beneficiaries with Hispanic surnames or who were born in Latino countries and whose race/ethnicity data was either missing or “other”. The survey resulted in changes for approximately 885,000 beneficiaries (Eicheldinger 2008.)
AHRQ has published strategies that organizations can use to improve race/ethnicity information and by improving data collection procedures, enhancing legacy health IT systems, and implementing staff training (AHRQ, 2010).
The National Health Plan Collaborative (NHPC) to Reduce Disparities and Improve Quality is a nine health system partnership (public and private) that aims to address racial/ethnic disparities in care through improved data collection, data sharing, intervention implementation and shared learning (Lurie et al., 2008).
6.1.2 Methods for Imputing Race/Ethnicity
Rand Corporation developed an algorithm that incorporates U.S. Census Bureau latest surname list with a Bayesian method to integrate surname and geocode information (residence) to better estimate self-reported race/ethnicity information. The new approach greatly improved the accuracy of race/ethnic coding for Blacks and Asians, but imputing Native American and multiracial individuals from surname and residence remains difficult (Elliot et al., 2009)
Eicheldinger and colleagues (2008) developed a methodology using primarily surname lists (U.S. Census Bureau) to more accurately impute race/ethnicity codes for beneficiaries Hispanic and Pacific Islander origin; the method increased the number of identified Hispanics three-fold.
The use of census data (geocode data) to impute race and SES information is more accurate for majority populations (white and black) than minorities. Using census-level information to determine individual level characteristics is possible, but subject to ecological biases (Kwok & Yankaskas, 2001).
Roblin and colleagues (2010) developed an algorithm to electronically abstract race/ethnicity information from electronic health records notes. The algorithm was found to be highly reliable in identifying white, black and Asian/pacific islander race based on specific strings of characters. However, the algorithm requires exact string matches and cannot overcome misspellings or abbreviations.
Research Triangle Inc. developed an algorithm to improve the imputation of race and ethnicity in the Medicare Enrollment Database (EDB) and developed a method to calculate an SES index for each Medicare beneficiary. The race/ethnicity algorithm is a SAS program that imputes race/ethnicity for Hispanics and Asians/Pacific Islanders based on preferred language to receive materials, residence in Puerto Rico or Hawaii, and first and last names. It was validated using HCAHPS survey data as the gold standard. Compared to raw enrollment database data, the algorithm significantly improved the accuracy of race/ethnicity coding. The SES index is based on a composite of neighborhood characteristics drawn from Census data, based on work by Krieger (2003). It was validated against income data from the social security administration, HCAHPS survey data on insurance coverage, health status, and educational attainment, and dual eligibility status.
HCUP is linked with a 20% sample of the NIS database, which contains information from healthcare organizations that have high-quality demographic data. Cases with suspect or missing information are not included in the subsample. Validity/reliability is improved by dropping “bad” information.
6.1.3 Potential Risks of Improved Coding of Small Subgroups
More accurate and expanded demographic information in healthcare enables investigators to document equity and disparities among different patients groups (Brooks & King, 2008). However, with the ability to obtain detailed information on small populations come potential risks:
- Healthcare disparities may be perpetuated by assigning individuals to socially constructed, yet government-defined categories. In addition, assignment to racial categories can take emphasis away from other important determinants of health (Brooks & King, 2008).
- Scientific racism is possible due to the ability to “link” race to specific disease. For example, if a condition occurs more commonly in one population vs. another, or if one population is more susceptible to a condition vs. another, then a high-risk population is at risk of being discriminated against, such as denial of health coverage (Brooks & King, 2008).
- Several key informants cautioned that because race/ethnicity data can be used to discriminate, it is important to engage local communities and ensure that the population being studied is aware of and endorses the purpose of the research.
7. National Datasets and Data Systems Review
To determine which data systems and data sets can be analyzed to better improve our understanding of disparities among persons with MCC, the Project Team revisited the data systems and datasets that were reviewed for the first White Paper funded by this project, (Rezaee, 2013). Appendix E provides: 1) a description of each database, 2) diagnostic variables, 3) cost, utilization, and clinical information, and 4) the strengths, limitations and feasibility of the database for MCC research. We conducted a supplemental review of each database to assess its appropriateness for MCC disparities research and results are shown below in Exhibit 7.
Almost all of the data sources included information on patient age, gender, and race/ethnicity. The availability of other disparity-related variables varied substantially by dataset, however. For example, the Medical Expenditure Panel Survey (MEPS) collects information on patient disability status, family income, family size and employment status, in addition to age, gender, and race/ethnicity, while the National Health Interview Survey (NHIS) collects information on sexual orientation, availability of paid sick leave and length of time at current residence.
| Data Source | Demographic and Socioeconomic Variables Included | Considerations for MCC Disparities Research |
|---|---|---|
| Agency for Healthcare Research and Quality | ||
| Consumer Assessment of Healthcare Provider & Systems (CAHPS) | Age, Gender, Educational Attainment, Hispanic or Latino, Race/Ethnicity, Language, and Health Literacy. |
|
| Healthcare Cost & Utilization Project - Kids’ Inpatient Database (KID) | Age, Gender, Race/Ethnicity, Place of Residence and Median Household Income. |
|
| Healthcare Cost & Utilization Project–Nationwide Emergency Department Sample (NEDS) | Age, Gender, Urban-Rural designation, Expected Payment Sources, and Zip Code. |
|
| Healthcare Cost & Utilization Project-Nationwide Inpatient Sample (NIS) | Age, Gender, Race/Ethnicity, Zip Code, Expected Primary and Secondary Payment Sources, and Place of Residence. |
|
| Medical Expenditure Panel Survey (MEPS) | Age, Gender, Race/Ethnicity, Insurance Status, Marital Status, Disability Status, Family Income as Percent of Poverty Line, Employment Status, Total Income, Geographic Location, and Size of Family. |
|
| Center for Disease Control and Prevention | ||
| Behavioral Risk Factor Surveillance System (BRFSS) | Age, Gender, Race/Ethnicity, Hispanic vs. Latino, Military Status, Insurance Status/Type, Educational Obtainment, Disability Status, Income, Household Size, Employment Status, Household Income, Zip Code, and Own vs. Rent Home Status. |
|
| National Ambulatory Medical Care Survey | Age, Gender, Race/Ethnicity, and Place of Residence |
|
| National Health Interview Survey (NHIS) | Age, Gender, Sexual Orientation, Employment Status, Type of Employment, Employment-related Activities, Size of Business, Paid by Hour or Salaried, Paid Sick Leave, Multiple Job Held Status, and Time at Current Residence. |
|
| National Health and Nutrition Examination Survey (NHANES) | Age, Gender, Race/Ethnicity (including subgroups), Language, Educational Attainment, Marital Status, Health Insurance Status, Veteran Status, Occupation, Employment Status, and Income. |
|
| Centers for Medicare & Medicaid Services | ||
| Medicare Claims | Age, Gender, Race/Ethnicity, Geographic Location (including mailing zip code), Dual Eligibility Status, and Medicare Enrollment Dates. |
|
| Medicaid Claims | Age, Gender, Race/Ethnicity, Marital Status, Insurance Type, Dual Eligibility Status, Geographic Location, and Enrollment Dates. |
|
| CMS Chronic Condition Warehouse | Age, Gender, Race/Ethnicity, Insurance Type, Dual Eligibility Status, Age, Preferred Language, Marital Status, Zip Code, Primary Payment Source. |
|
| CMS Medicare Provider Analysis and Review (MedPAR) File | Age, Gender, Race/Ethnicity, and Geographic Location. |
|
| Medicare Health Outcomes Survey | Gender, Age, Race/Ethnicity, Educational Attainment, Marital Status, Annual Household Income, English Language Skills, Household Size, and Place of Residence. |
|
| Other | ||
| HMO Research Network | Age, Gender, Race/Ethnicity, Insurance Type, Hispanic vs. non-Hispanic, Educational Attainment, Employment Status, Geographic Location, and Income. |
|
| National Institute on Aging | Age, Gender, Race/Ethnicity, Insurance Type, Hispanic vs. non-Hispanic, Educational Attainment, Employment Status,income, assets, housing status. Non-Hispanic Blacks are oversampled |
|
| State All Payer Claims Databases (general) | Age, Gender, Race/Ethnicity, Insurance Type, Marital Status, and Geographic Location. |
|
| Health and Retirement Study | Age, Gender, Race/Ethnicity, Educational Attainment, Disability Status, Language, Marital Status, Occupation, Employment Status and Income. |
|
| Health insurer databases | Race/Ethnicity |
|
8. Conclusions and Considerations for Future Research on Disparities in Groups with MCC
8.1 Conclusions
Reducing disparities in health outcomes, access to care, and healthcare quality are ongoing priorities in the United States and other countries. As part of the initiatives to achieve health equity, HHS has made a priority in the report, Multiple Chronic Conditions: A Strategic Framework, to assess disparities among the adult MCC population. Most of the existing disparities research focuses on individual chronic conditions, and there has been little research on the extent, causes, and strategies for reducing disparities within the MCC population.
The limited research is a reflection of the complexities involved in analyzing disparities within the MCC population. Disparities research in the MCC population is impeded by several methodological challenges including sample size issues; data quality issues, particularly unreliable sociodemographic variables in many databases; data capture issues regarding patients who do not access the health care system; lack of standard definitions of disparities and MCC; constantly evolving methods; and limited information about the underlying causes of disparities or interventions to reduce disparities. Additionally, meta-analysis is difficult in MCC disparities research due to the lack of standard ways to aggregate socio-demographic categories. For example, researchers use different age cutoffs to investigate disparities by age. Another analytical challenge affecting the potential for meta-analysis is the lack of standardized measures sensitive to MCC disparities.
Despite these methodological challenges, the body of knowledge on MCC disparities is growing. As more studies are published, early results can be tested for replication. Results from our literature review, included in this paper, suggest that
- Women are more likely than men to be classified as having MCC (Ashman et al., 2013; CMS, 2012; Ward et al., 2012; Machlin et al., 2013).
- The number of chronic conditions rises with age (Freid et al., 2012).
- Hispanic patients have the lowest MCC prevalence (Ward et al., 2013; Steiner et al., 2013). Mexican-Americans have lower initial levels of MCC and slower accumulation of comorbidity compared to non-Hispanic White and non-Hispanic Black patients (Quinones et al., 2011).
- MCC prevalence among Asian Americans is lower compared to white or black MCC patients (Machlin et al. 2013), though Asians/Pacific Islanders had the highest mortality and cost per case compared to all other groups (Steiner et al., 2013).
- Patients with dual eligibility status (Medicare and Medicaid) have an elevated prevalence of MCC compared to non-dual-eligible beneficiaries (CMS, 2012).
Numerous papers examine one dimension of disparities among patients with combinations of two conditions. For example, utilization of care is lower for African-American patients with COPD and asthma, compared to non-Hispanic White patients with the same conditions (Shaya et al., 2009); African-Americans with hypertension and chronic kidney disease had more poorly controlled hypertension compared to African-American women and non-Hispanic White patients with the same conditions (Duru et al., 2009); and men with type II diabetes and coronary heart disease were more thoroughly treated compared to women (Kramer et al., 2012). However, the narrow focus of such analyses makes it challenging to identify overall patterns of disparities.
Future research on MCC disparities may be facilitated by efforts to improve reporting on race, ethnicity and other socio-demographic variables, by efforts to identify disparities-sensitive measures of the quality of care, and by the future availability of new databases such as electronic health record based registries, large employer databases, managed care patient registries, practice-based network data, and other data sharing and collection initiatives.
It is important to acknowledge the overlap of persons with MCC and the disabled, dual eligible Medicare/Medicaid beneficiaries, and common combinations of chronic conditions that have been studied (e.g. diabetes, hypertension and hyperlipidemia). There may be disparities research on these groups that can be synthesized to contribute to the body of MCC disparities research.
8.2 Considerations for Future Research
One of the strategies identified by the Interagency Workgroup on MCC is to “stimulate research to more clearly elucidate differences between and opportunities for prevention and intervention in MCC among various sociodemographic groups” (DHHS 2010.) To that end, we offer below a list of considerations and opportunities for future research. Disparities research on persons with MCC is at an early stage of development. Therefore it is important to carefully review results, and to look for replication of the study findings.
8.2.1 Definitional/conceptual work
Our key informants and technical advisory group members mentioned the importance of developing a multi-level, multi-sectorial model of MCC and MCC disparities that incorporates the roles of biological, behavioral, health care, socio-economic, community and environmental factors. This model could then serve as a framework for analyses focused on the MCC population.
Developing such a model may facilitate consensus-building on a definition of disparities to be used for MCC disparities research.
8.2.2 Research infrastructure development
To facilitate further research in MCC, elements of the research infrastructure will need to be improved. For example:
- Improving existing datasets to allow MCC disparities analyses. For example, efforts to improve the reporting of race, ethnicity and language data in HCUP and other datasets should continue, and researchers should report on what additional variables (e.g., socioeconomic variables, neighborhood indicators) should be added to existing datasets to enhance researchers’ ability to study MCC disparities.
- Developing scientific standards for the enrollment of persons with MCC into research studies. Persons with MCC are typically excluded from studies on chronic conditions, resulting in the production of research findings that are inapplicable to the MCC population. This situation should be addressed by funding bodies, since many patients have more than one chronic condition.
- Defining the appropriate unit(s) of analysis to examine disparities among people with MCC. For example, is it most appropriate to examine health care and health outcome disparities across groups that have the same number or combination of chronic conditions?
8.2.3 Data sources and analysis
Needed analyses:
- Most prior studies on MCC disparities have only examined MCC and disparities at a crude level. There is still a need for basic research using large datasets to examine disparities for the most common combinations of health conditions.
- Disparities related to socioeconomic factors such as income, occupation/employment, wealth/poverty, place of birth/geography, housing and disability have not yet been explored, and little is known about disparities in cost and utilization patterns.
- Research is needed to examine how well the health needs of different MCC populations are being served by the health care system, and how this contributes to or mitigates disparities.
- Data analysis could also help to identify disparities “hot spots” to be targeted for intervention, i.e. population subsets that have worse trajectories and cause lower performance or higher cost for a health plan.
Promising datasets for analysis:
- Some of the more reliable HCUP datasets may be useful to explore MCC disparities by race, ethnicity and socio-economic factors. To identify states that provide high-quality data, researchers can rank states based on the extent of missing/incomplete data on key variables of interest, and use data from states with the least amount of missing data.
- It may also be useful to conduct analyses on disparities in care affecting the Medicare-eligible population under age 65. This population is eligible for Medicare because of disabilities. Disability is both a chronic condition and a stratifying variable for disparities analysis. Research could focus on challenges experienced by persons with disabilities to receive care for any conditions other than their main disability.
Analytic methods:
- Publications are needed to describe what types of statistical models and advanced multivariate techniques can provide insights into the drivers of disparities for the MCC population
- In developing analytic methods, researchers should be aware that certain types of analyses can increase risks for communities of color. For example, employers may discriminate against employees or potential employees based on information that is reported to them about the MCC risks and costs experienced by various populations. One way to minimize this risk is to focus analyses on how well various populations are being served by the health care system. Such analyses are less likely to perpetuate disparities compared to research examining disparities in the prevalence and incidence of MCC in various populations.
8.2.4 Intervention research
Most of the disparities research that has been conducted on the MCC population to-date has been focused on measuring the magnitude of disparities rather than analyzing the causes of the disparities or methods of reducing disparities. The following types of research may be useful to develop interventions aimed at eliminating disparities.
- Local intervention research, which takes into consideration the populations, resources and infrastructure that are specific to each setting. Such research is more likely than national research to allow analyses on and adaptations for within-group variations (e.g. Puerto-Rican or Mexican-American instead of Hispanic)
- Interventions leveraging electronic medical records (EMRs). Due to the adoption of EMRs, health plans and health practices are becoming increasingly able to analyze causes of disparities and address them within their patient population. It may be useful to produce case studies of EMR use to reduce disparities, for example focusing on patients with HIV or diabetes, and pediatric patients with special needs.
- Supplemental analyses on grants from the Centers for Medicare and Medicaid Innovation. Some CMMI grantees who are testing health system interventions are finding that enrolled patients include a high proportion of minority patients and persons with multiple chronic conditions. While the CMMI studies are not focused on MCC per se, they have an opportunity to provide new insights to the MCC field.
8.2.5 Complementary Methods
In addition to the analysis of large databases and intervention research, several other research methods
may shed light on the epidemiology of and remedies for MCC disparities.
- Qualitative Methods such as interviews, focus groups, and observation can be enlightening when there are a small number of cases to study (as in the case of the “long tail” of the MCC distribution, described above). Qualitative methods are also useful when the research is at a formative stage, or when insights are needed to interpret quantitative findings. Finally, qualitative research can also address disparities by helping to identify best practices in personalized care and self-management, so that these practices can be extended to populations that bear a disproportionate burden of disease or poor outcomes.
- Metasynthesis, a technique to facilitate comparisons across qualitative studies, might uncover potential disparities that could be tested with quantitative methods, or shed light on the different kinds of obstacles faced by people with specific combinations of MCC.
- Analyzing data from rare disease surveillance systems may point to disparities that could also be tested in other datasets.
- A positive deviance approach is recommended by Rust et al. wherein researchers look for example of health equity, or the absence of disparities, or trends in disparities reductions, and look for explanations and interventions that can be tried in other communities. (Rust et al. 2012). A promising area for a positive deviance study is research to understand why the Hispanic population has a lower burden and slower accumulation of MCC compared to non-Hispanic White and non-Hispanic Black populations.
9. References
Agency for Healthcare Research and Quality. (2008). Creation of new race-ethnicity codes and socioeconomic status (SES) indicators for Medicare beneficiaries. (AHRQ Publication No. 08-0029-EF). Rockville, MD.
Agency for Healthcare Research and Quality. (2010). 5. Improving Data Collection Across the Health Care System: Race, Ethnicity, and Language Data: Standardization for Health Care Quality Improvement. Rockville, MD. Retrieved from: http://www.ahrq.gov/research/findings/final-reports/iomracereport/reldat....
Agency for Healthcare Research and Quality. (2013). 2012 National Healthcare Disparities Report. Rockville, MD.
American Indian Health Care Association. (1992). Enhancing health statistics for American Indian and Alaskan Native communities: an agenda for action. St. Paul, MN: Scott, S. & Suagee, M.
American’s Health Insurance Plans and the Robert Wood Johnson Foundation. (2006). Collection and use of race/ethnicity data for quality improvement (Issue Brief). Washington, DC: 2006 AHIP-RWJF Survey of Health Insurance Plans.
Anderson, N.B., Bulatao, R.A., & Cohen, B. (2004). Chapter 2: Racial Ethnic Identification, Official Classifications, and Health Disparities. In National Research Council (US) Panel on Race, Ethnicity, and Health in Later Life, Critical perspectives on racial and ethnic disparities in health in late life. Washington, DC: National Academies Press.
Ashman, J.J., & Beresovsky, V. (2013). Multiple chronic conditions among US adults who visited physician offices: data from the National Ambulatory Medical Care Survey, 2009. Prev Chronic Dis,10, E64.
Barrett, M., Wilson, E., & Whalen, D. (2010). 2007 HCUP Nationwide Inpatient Sample (NIS) comparison report (HCUP Methods Series Report # 2010-03). Rockville, MD: Agency for Healthcare Research and Quality. Retrieved from: http://www.hcup-us.ahrq.gov/reports/methods/2010_03.pdf
Braverman (2006). Health disparities and health equity: concepts and measurement. Annu Rev Public Health, 27, 167–94.
Center for American Progress (2008). Geneticizing Disease: Implications for Racial Health Disparities.Washington, DC: Brooks, J.D. & Ledford, M.K.
Center for Health Care Strategies, Inc. (2007). The faces of Medicaid II: recognizing the care needs of people with multiple chronic conditions. Hamilton, NJ: Kronick, R.G., Bella, M., Gilmer, T.P., and Somers, S.A.
Centers for Disease Control and Prevention (CDC). (2011). CDC Health Disparities and Inequalities Report – United States, 2011. Morbidity and Mortality Weekly Report,60 (Suppl),1–114.
Centers for Disease Control and Prevention (CDC). (2012). National Ambulatory Medical Care Survey: 2010 summary tables. Atlanta, GA. Retrieved from:
http://www.cdc.gov/nchs/data/ahcd/namcs_summary/2010_namcs_web_tables.pdf
Centers for Disease Control and Prevention, National Center for Health Statistics. (2001). Utilization of ambulatory medical care by women: United States, 1997-98. Atlanta, GA. Retrieved from: http://www.cdc.gov/nchs/data/series/sr_13/sr13_149.pdf
Centers for Medicare & Medicaid Services (CMS). (2013). Chronic Conditions Data Warehouse - Medicare administrative data user guide. Retrieved from: http://www.ccwdata.org/cs/groups/public/documents/document/ccw_userguide...
Centers for Medicare & Medicaid Services (CMS). (2012). Chronic conditions among Medicare beneficiaries, chartbook: 2012 edition. Baltimore, MD.
Duru, O.K., Li, S., Jurkovitz, C., et al. (2008). Race and sex differences in hypertension control in CKD: results from the kidney early evaluation program (KEEP). Am J Kidney Disease, 51(2),192–198.
Eicheldinger, C. & Bonito, A. (2008). More accurate racial and ethnic codes for Medicare administrative data. Health Care Financing Review, 29 (3), 27–42.
Elliott, M. (2009). Presentation to the IOM Committee on Future Directions for the National Healthcare Quality and Disparities Reports: Use of indirect measures of race/ethnicity to target disparities. March 12, 2009. Newport Beach, CA.
Elliot, M.N., Edwards, C., Angeles, J., Hambarsoomians, K., & Hays, R.D. (2005). Patterns of unit and item nonresponse in the CAHPS Hospital Survey. Health Ser Res, 40(6 Pt 2),2096–2119.
Ford, E.S., Croft, J.B., Posner, S.F., Goodman, R.A., Giles, W.H.. (2006). Co-occurrence of leading lifestyle-related chronic conditions among adults in the United States, 2002–2009. Prev Chronic Dis, 10, 120316.
Freid, V.M., Bernstein, A.M., & Bush, M.A. (2012). Multiple chronic conditions among adults aged 45 and over: trends over the past 10 years (NCHS data brief, no.100). Hyattsville, MD: National Center for Health Statistics.
Goodman, R.A., Posner, S.F., Huang, E.S., Parekh, A.K.,& Koh, H.K. (2013). Defining and measuring chronic conditions: imperatives for research, policy, program, and practice. Prev Chronic Dis, 10,120239.
Hidalgo, C.A., Blumm, N., Barabási, A-L., Christakis, N.A. (2009). A Dynamic Network Approach for the Study of Human Phenotypes. PLoS Comput Biol, 5(4), e1000353.
Institute of Medicine. (2012). How far have we come in reducing health disparities: progress since 2000: workshop summary. Washington, DC: The National Academies Press.
Johnson, C.E., (1974). Consistency of reporting ethnic origin in the current population survey. U.S. Department of Commerce Tech. Pap (No. 31). Washington, DC: Bureau of the Census, 1974.
Joint Center for Political and Economic Studies. (2012). Race and ethnicity data collection: beyond standardization. Washington, DC: Cunningham, B.
Kramer, H.U., Raum, E., & Ruter, G. et. Al. (2012). Gender disparities in diabetes and coronary heart disease medication among patients with type 2 diabetes: results from the DIANA study. Cardiovascular Diabetology, 11(88).
Krieger, N., Waterman, P.D., Chen, J.T., Soobader, M.J., & Subramanian, S.V. (2003). Monitoring socioeconomic inequalities in sexually transmitted infections, tuberculosis, and violence: geocoding and choice of area-based socioeconomic measures—the public health disparities geocoding project (US). Public Health Rep, 118 (3), 240–60.
Kwok, R. K., & Yankaskas, B. C. (2001). The use of census data for determining race and education as SES indicators: A validation study. Annals of Epidemiology, 11(3), 171–177.
Liao, Y., McGee, D.L., Cao, G., & Cooper, R.S. (1999). Black-white difference in disability and morbidity in the last years of life. Am J Epidemiol, 149 (12),1097–1103.
Link, M.W., Mokdad, A.H., Stackhouse, H.F., & Flowers, N.T. (2006). Race, ethnicity and linguistic isolation as determinants of participation in public health surveillance surveys. Prev Chron Dis, 3(1),1–11.
Lochner, K.A., Cox, C.S. (2013) Prevalence of multiple chronic conditions among Medicare beneficiaries, United States, 2010. Prev Chronic Dis, 10, 120137.
Lurie et al. (2008). The National Health Plan Collaborative to reduce disparities and improve quality. Jt Comm J Qual Patient Saf, 34(5), 256-65.
Machlin, S.R., and Soni, A (2013). Health care expenditures for adults with multiple treated chronic conditions: estimates from the Medical Expenditure Panel Survey, 2009. Prev Chronic Dis, 10,E63.
Massey, J.T. (1980). Proceedings from American Statistical Association, Social Security Statistics Section: A comparison of interviewer observed race and respondent reported race in the National Health Interview Survey. Washington, DC.
Mathematica Policy Research. (2011) Collecting, using, and reporting Medicaid encounter data: a primer for states. Baltimore, MD.: Byrd, V.L.H., & Verdier, J.
McAlpine, D.D., Beebe, T.J., Davern, M., Call, K.T (2007). Agreement between self-reported and administrative race and ethnicity data among Medicaid enrollees in Minnesota. Health Services Research, 42 (6 Pt 2), 2373–2388.
McBean, M. (2004). Medicare Race and Ethnicity Data. Minneapolis, MN. Retrieved from: http://www.nasi.org/sites/default/files/private/research/McBean.pdf
Mokdad, A.H. (2009). The behavioral risk factors surveillance system: past, present and future. Annul Rev Public Health, 30,43–54.
Murray, C.J., Gakidou, E.E., Frenk, J. (1999). Health inequalities and social group differences: what should we measure. Bull World Health Organ, 77, 537–543.
National Center for Health Statistics. Health, United States, 2011 with special feature on socioeconomic status and health. Atlanta, GA. Retrieved from: http://www.cdc.gov/nchs/data/hus/hus11.pdf#fig32.
Perez-Stable, E., Anderson, N., Cuervo, A.M., Hendrie, H., LaCroix, A., Morimoto R.Wetle, F.National Institute on Aging (2012). Health Disparities Research and Minority Aging Researcher Training Review: National Institute on Aging 2012. Accessed 8/21/2013 at: http://www.nia.nih.gov/about/health-disparities-research-and-minority-ag...
National Institutes of Health. NIH Health Disparities Strategic Plan and Budget Fiscal Years 2009–2013. U.S. Department of Health and Human Services, Bethesda, MD.
National Partnership for Action to End Health Disparities. (2011). National Stakeholder Strategy for Achieving Health Equity. Rockville, MD: U.S. Department of Health & Human Services, Office of Minority Health.
National Quality Forum (2011). Healthcare disparities measurement. Washington, DC: Weissman, J.S., Betancourt, J.R., Green, A.R., et al. Retrieved from: http://www2.massgeneral.org/disparitiessolutions/z_files/Disparities%20C...
Office of Minority Health. (2013). Final Data Collection Standards for Race, Ethnicity, Primary Language, Sex, and Disability Status Required by Section 4302 of the Affordable Care Act. Retrieved from: http://minorityhealth.hhs.gov/templates/browse.aspx?lvl=2&lvlid=208
Passel, J.S., & Berman, P.A. (1986). Quality of 1980 census data for American Indians. Social Biology, 33,163–82.
The Pennsylvania State University. Using the Health and Retirement Survey to investigate health disparities. Hayward, M.D. Retrieved from: http://hrsonline.isr.umich.edu/sitedocs/dmc /hrs_healthdisparities_hayward.pdf
Quinones, A.R., Lian, J., Bennet, J.M., Xu, X., & Ye, W. (2011). How does the trajectory of multimorbidity vary across black, white and Mexican Americans in middle and old age? The Journals of Gerontology, Series B: Psychological Sciences and Social Sciences, 66(6), 739–749.
Rezaee, M., LeRoy, L., White, A., Oppenheim, E., & Carlson, K. (2013). Understanding the High Prevalence of Low-Prevalence Chronic Disease Combinations: Databases and Methods for Research. Available at: http://aspe.hhs.gov/.
Roblin, D., Ren, J., Hart, G., et al. (2010). Proceedings from HMO Research Network Annual Meeting: A simple accurate SAS algorithm for electronic abstraction of race from digitized progress notes. Austin, TX.
Rust G, Levine RS, Fry-Johnson Y, Baltrus P. (2012). Paths to Success: Optimal and Equitable Health Outcomes for All. JHealth Care for the Poor and Underserved, 23 ( 2), 7–19.
Sandefur, G.D., Campbell, M.E., & Eggerling-Boeck, J. (2004). Racial and ethnic identification, official classifications, and health disparities. In Anderson, N.B., Bulatao, R.A., & Cohen, B., National Research Council Panel on Race, Ethnicity, and Health in Later Life. Washington, DC: National Academies Press.
Shaya, F.T., Maneval, M.S., Gbarayor, et al. (2009). Burden of COPD, asthma and concomitant COPD and asthma among adults: racial disparities in the Medicaid population. Chest, 136 (2), 405–411.
State Health Access Data Assistance Center (SHADAC). (2009). REI: Data availability for race, ethnicity, and immigrant groups in federal surveys (Issue Brief #17). Minneapolis, MN: University of Minnesota.
Steiner, C.A., & Friedman B. (2013). Hospital utilization, costs, and mortality for adults with multiple chronic conditions, Nationwide Inpatient Sample, 2009. Prev Chronic Dis, 10:E62
Steinman, M.A., Lee, S.J., Boscardin, W.J, et al. (2012). Patterns of multimorbidity in elderly veterans. JAGS, 60 (10), 1872–1880.
U.S. Department of Health & Human Services (2010). Multiple chronic conditions - a strategic framework: optimum health and quality of life for individuals with multiple chronic conditions. Washington, DC.
U.S. Department of Health and Human Services. (2011). HHS Action Plan to Reduce Racial and Ethnic Disparities: A Nation Free of Disparities in Health and Health Care. Washington, DC.
U.S. Department of Health and Human Services. (2011). Standards for race, ethnicity, sex, primary language, and disability status. Retrieved from: http://minorityhealth.hhs.gov/templates/content.aspx?ID=9227&lvl=2&lvlID....
Waldo, D.R. (Winter 2004 – 2005). Accuracy and bias of Race/Ethnicity codes in the Medicare enrollment database. Health Care Financing Review, 26 (2), 61–72.
Ward, B.W., & Schiller, J.S. (2013). Prevalence of multiple chronic conditions among US adults: estimates from the National Health Interview Survey, 2010. Prev Chronic Dis,10, E65.
Whitehead, M. (1992). The concepts and principles of equity and health. International Journal of Health Services, 22, 429–445.
Williams, D.R. (1999). The monitoring of racial/ethnic status in the USA: data quality issues. Ethnicity & Health, 4(3): 121–137.
World Health Organization, Website. (2009). Social Determinants of Health, 2009. Geneva, Switzerland. Retreived from: http://www.who.int/social_determinants/en/
Appendices
The appendices listed below are attached.
Appendix A – HHS Standards for Race, Ethnicity, Sex, Primary Language, and Disability Status (2011)
The HHS Standards for Race, Ethnicity, Sex, Primary Language, and Disability Status are the current standards for collecting disparities data in federal surveys. These standards were developed in response to an Affordable Care Act mandate to collect specific socio-demographic and health information.
Appendix B – Literature Search Methodology
The literature search methodology outlines the MEDLINE search terms that were used to conduct the literature review related to multiple chronic conditions, disparities, and analytic techniques for chronic disease and disparities research. The search strategy outlined in this Appendix was used to identify MCC research studies and methods papers on multiple chronic conditions research and disparities.
Appendix C - Key Informants
The Key Informant List provides a list of the individually interviewed experts and their affiliations. Key informants were identified by the ASPE Project Officers and the Technical Advisory Group (TAG). Key informant interviews were conducted to provide the Project Team with in-depth expertise on topics covered in the White Paper. Findings from the Key Informant Interviews have been incorporated throughout the White Paper.
Appendix D – Technical Advisory Group Members
Technical Advisory Group (TAG) List provides of experts consulted about the overall conduct of the studies and their affiliations. TAG members participated in the initial in-person December 2012 TEP meeting and provided feedback on the original literature review to determine additional databases, grouping systems, and methods for studying MCC in disparities populations. They also participated in a second meeting by teleconference in May 2013 to review and provide feedback and revisions for the first draft of the White Paper, “Understanding the High Prevalence of Low-Prevalence Chronic Disease Combinations: Databases and Methods for Research,” and a third meeting by teleconference in August 2013 to review and provide feedback and revisions for the first draft of the White Paper, “Understanding Disparities in Persons with Multiple Chronic Conditions: Research Approaches and Datasets.”
Appendix E – Review of Datasets and Data Systems: Summary Tables
The Data Systems Datasets Review provides an overview of sixteen potential datasets that can be used for multiple chronic conditions and disparities research, including a description of each datasystem, the diagnosis information measured in each data system, the cost, utilization, and clinical information captured in each datasystem, and the strengths, limitations, and feasibility of each datasystem for MCC research.
Appendix A – HHS Standards for Race, Ethnicity, Sex, Primary Language, and Disability Status (2011)
I and II. Race and Ethnicity
| Ethnicity Data Standard | Categories |
|---|---|
| Are you Hispanic, Latino/a, or Spanish origin (One or more categories may be selected) a. ____No, not of Hispanic, Latino/a, or Spanish origin b. ____Yes, Mexican, Mexican American, Chicano/a c. ____Yes, Puerto Rican d. ____Yes, Cuban e. ____Yes, another Hispanic, Latino, or Spanish origin | These categories roll-up to the Hispanic or Latino category of the OMB standard |
| Race Data Standard | Categories |
|---|---|
| What is your race? (One or more categories may be selected) a. ____White b. ____Black or African American c. ____American Indian or Alaska Native | These categories are part of the current OMB standard |
| d. ____Asian Indian e. ____Chinese f. ____Filipino g. ____Japanese h. ____Korean i. ____Vietnamese j. ____Other Asian | These categories roll-up to the Asian category of the OMB standard |
| k. ____Native Hawaiian l. ____Guamanian or Chamorro m. ____Samoan n. ____Other Pacific Islander | These categories roll-up to the Native Hawaiian or Other Pacific Islander category of the OMB standard |
III. Sex
| Sex Data Standard |
|---|
| What is your sex? a. ____Male b. ____Female |
IV. Primary language
| Data Standard for Primary Language |
|---|
| How well do you speak English? (5 years old or older) a. ____Very well b. ____Well c. ____Not well d. ____Not at all |
| Data Collection for Language Spoken (Optional) |
|---|
| 1. Do you speak a language other than English at home? (5 years old or older) For persons speaking a language other than English (answering yes to the question above): 2.What is this language? (5 years old or older) |
V. Disability Status
| Data Standard for Disability Status |
|---|
| 1. Are you deaf or do you have serious difficulty hearing? 2. Are you blind or do you have serious difficulty seeing, even when wearing glasses? 3. Because of a physical, mental, or emotional condition, do you have serious difficulty 4. Do you have serious difficulty walking or climbing stairs? (5 years old or older) 5. Do you have difficulty dressing or bathing? (5 years old or older) 6. Because of a physical, mental, or emotional condition, do you have difficulty doing errands alone |
Appendix B – Literature Search Methodology
Search Strategy
MEDLINE
Date - Last 10 Years (as of January 1, 2013)
Language - English
Limits - Human
Limits - Abstract Available
Search Field Tags - All fields
Key terms
| Search # | Key Terms/Search Strategy/History | Number of Articles |
|---|---|---|
| #1 | Chronic Disease/classification/epidemiology/economics | 2,425 |
| #2 | Multiple Chronic Conditions | 127 |
| #3 | Multimorbidity | 207 |
| #4 | Comorbidity | 42,895 |
| #5 | Disease Combinations | 11 |
| #6 | Aging Chronic Disease | 3,236 |
| #7 | Disparities | 15,740 |
| #8 | # 4 AND #7 | 503 |
| #9 | # 3 AND #7 | 3 |
| #10 | # 2 AND #7 | 5 |
| #11 | # 1 AND #7 | 240 |
Article Selection
A title review of 732 articles.
- 695 articles eliminated due to one of following:
- Single disease focus
- Unrelated to topic
- Commentary
An abstract review of 37 articles.
- 15 articles eliminated due to one of the following:
- Single disease focus
- Unrelated to topic
22 relevant articles were identified during the abstract review for potential incorporation into the white paper. Additional relevant articles, not identified by the search methodology, were identified by the co-project officers, TAG and Key Informants.
Appendix C – Key Informants
| Key Informants | |
|---|---|
| Susan Fleck, RN, MMHS Government Task Leader Health Disparities Program Centers for Medicare and Medicaid Services (CMS) | Allen Freemont, MD, PhD Natural Scientist Rand Corporation |
| Robert Fullilove, EdD, MS Associate Dean Mailman School of Public Health Columbia University | Nadine Gracia, MD, MSCE Deputy Assistant Secretary for Minority Health & Director of the Office of Minority Health Office of Minority Health |
| Warren Jones, MD xecutive Director Mississippi Institute for the Improvement of eographical Minority Health Disparities niversity of Mississippi Medical Center | David Meltzer, PhD, MD Associate Professor Department of Medicine University of Chicago |
| Ernest Moy, MD, MPH Medical Officer Center for Quality Improvement and Patient Safety Agency for Healthcare Research and Quality (AHRQ) | Sally Okun, RN, MMHS Vice President, Advocacy, & Patient Safety PatientsLikeMe |
| George Rust, MD, MPH Professor of Family Medicine & Director of thNational Center for Primary Care Morehouse School of Medicine | |
Appendix D - Technical Advisory Group Members
| Technical Advisory Group Members | |
|---|---|
| David Bott, PhD Editor-in-Chief, Medicare & Medicaid Research Review | Sharon Donovan Director, Program Alignment Group, Medicare-Medicaid Coordination Office |
| Richard Goodman, MD, JD, MPH Senior Medical Advisor | Kevin Larsen, MD Medical Director, Meaningful Use Office of the National Coordinator of Health Information Technology Washington, D.C. |
| Ernest Moy, MD, MPH Medical Officer, Center for Quality Improvement aPatient Safety | Ric Ricciardi, Ph.D, NP Health Scientist, Center for Primary Care, Prevention, and Clinical Partnerships |
| Marcel Salive, MD, MPH Medical Officer, Division of Geriatrics and Clinical Gerontology | Susan Fleck, RN, MMHS Government Task Leader CMS Health Disparities Program |
| Jesse James, MD, MBA Senior Medical Officer, Meaningful Use Office of the National Coordinator for HealthIT | Valerie Welsh, MS, CHES Division of Policy and Data |
Appendix E – Review of National Datasets and Data Systems: Summary Tables
Disclaimer:
The information contained in this appendix was compiled by Abt Associates Inc. under contract #HHSP2333700IT to the Assistant Secretary for Planning and Evaluation (ASPE) in September 2013. Abt and ASPE are not liable for the accuracy or completeness of the information contained in this document, as the specifications of each data system described below are subject to change. For the most up to date and accurate information on each data system, please visit the website or contact the sponsor for more detail.
Agency for Healthcare Research and Quality Datasets
| Consumer Assessment of Healthcare Providers & Systems (CAHPS) | |
|---|---|
| References Agency for Healthcare Research & Quality. Consumer Assessment of Healthcare Providers and Systems (CAPHS). 2013. http://cahps.ahrq.gov/about.htm | |
| Database Description | |
| White Paper(s): | Multiple Chronic Conditions and Disparities |
| Sponsorship: | Agency for Healthcare Research and Quality |
| Description: | CAHPS is a series of surveys that are used to ask consumers and patients about their experiences with healthcare. These surveys cover a wide spectrum of topics, such as provider communication skills and healthcare access. The goal of CAHPS is two-fold: 1) to develop standardized patient surveys that can be used to compare results across providers over time and 2) to generate tools and resources users can use to create comparative information for all stakeholders. There are CAHPS surveys for a variety of different care settings, including hospital, home health care, health plans, and in- center hemodialysis and clinician groups. |
| Database (Scope, Size, Setting, Population, Age Range) | CAHPS surveys are used at various levels in the healthcare delivery system; anywhere from individual practices to national samples. |
| Database Type: (Survey, Registry, Research Study, Program Database, Claims, Administrative Data, and Clinical Databases) | Survey & Program Database. The CAHPS Database is a compilation of survey results from a large pool of healthcare consumers that are maintained in a national database. |
| Database Source/Origin: | Survey Data |
| Date or Frequency of Data Collection: | Annually, since 1995. |
| Longitudinal vs. Cross-sectional Database: | Serial Cross-Sectional Survey |
| Data Collection Methodology: | Data collection methodology varies by CAHPS sponsor and vendors administering the CAHPS survey. Surveys can be completed via the mail, telephone or internet. |
| Sampling Strategy: | Sampling strategies for CAHPS vary by sponsor. CAHPS provides guidelines for sampling, including determining eligibility, calculating the estimated sample size needed for reporting, and creating a sub-sample of a specific patient population. |
| Unit of Analysis: | Multiple (patients, providers, health plan, etc.) and dependent on survey type. |
| Diagnosis Information | |
| Diagnosis Variable Type: (Chronic Condition Status, Principal Diagnosis, Primary Diagnosis, Secondary Diagnosis, Admit/Discharge Diagnosis and Self-Reported Diagnosis) | A patient’s principal diagnosis at discharge is used to determine whether he or she falls into a specific service line for CAHPS eligibility. Diagnosis is not capture on the survey itself. |
| Diagnosis Codes: (ICD-9, ICD-10, SNOMED, CPT) | Principal diagnosis ICD-9 codes at discharge. |
| Number of Diagnoses Captured: | Only the principal diagnosis at discharge is used to determine CAHPS eligibility. |
| Cost, Utilization & Clinical Information | |
| Measures of Cost: (Claims, Out-of-pocket expenses, Self-reported expenditures, and Prescription Drug Costs) | CAHPS does not include measures of cost. |
| Measures of Healthcare Utilization: (Number of Visits, Any Procedures/Number of Procedures/Type of Procedure, Number of Admission/Type of Admission, Length of Stay, Hospitalizations, Emergency Department Utilization, etc.) | CAHPS does not include measures of healthcare utilization, but the number of survey respondents can be used as a proxy for the number of discharges. |
| Measures of Healthcare Access: | Ease of access to healthcare services. |
| Demographic Information: (Sex, Age, Race, Ethnicity, Marital Status, Disability Status, Language, Insurance Type, Educational Attainment). | Age, Sex, Educational Attainment, Hispanic or Latino, Race/Ethnicity, Language |
| Clinical Information: (BMI, Medical Conditions [high blood pressure], Smoker Status, History of Various Conditions, Preventative Health Measures, Activities of Daily Living, Instrumental Activities of Daily Living) | CAHPS does not include additional clinical information. |
| Measures of Socioeconomic Status: (Occupation, Employment Status, Income, Wealth, Place of Residence, Household Size & Composition, geographic location) | Health Literacy/Understanding |
| Site of Service Information: | Limited - Department Based |
| Measures of Healthcare Outcomes: (Mortality, Morbidity, Mobility, Functional Status, Quality of Life, Quality Measures, Quality of Care, Readmissions) | Self-reported health status, Self-reported mental health status, Quality of Care, Quality Measures and Patient Satisfaction |
| Strengths, Limitations & Feasibility | |
| Data Strengths: | Select CAHPS datasets contain a large number of minority respondents. Data are collected on key health policy issues, including health status. |
| Data Limitations: | The CAHPS survey is not administered in a consistent fashion. The CAHPS database is a collection of surveys administered at various levels. As such, not all providers participate each year, so the mix of users will vary across years. Sampling and data collection methods also vary by user and are cross-sectional. |
| Data Access Restrictions: | To access CAHPS data, a data release agreement, description of the planned research, and IRB documentation must be submitted to AHRQ. Survey instruments are publically available. |
| Data Linking Feasibility (Unique identifiers or sufficient demographics to allow for data linkages) | No unique identifiers. However, CAHPS surveys have been administered to Medicare Fee-for-Service patients, which may have resulted in a linked CAHPS-claim dataset. |
| Related Grouping Systems: | n/a |
| Healthcare Cost & Utilization Project–Kids’ Inpatient Database | |
|---|---|
| References Overview of the Kids’ Inpatient Database (KID). 2013. http://www.hcup-us.ahrq.gov/kidoverview.jsp Introduction to The HCUP KID’s Inpatient Database (KID) 2009. Healthcare Cost and Utilization Project (HCUP). 2013. http://www.hcup-us.ahrq.gov/db/nation/kid/KID_2009_Introduction.pdf | |
| Database Description | |
| White Paper(s): | Data Systems and the Prevalence of Chronic Disease Combinations & Multiple Chronic Conditions and Disparities |
| Sponsorship: | Agency for Healthcare Research & Quality |
| Description: | The Kids' Inpatient Database (KID) is a unique and powerful database of hospital inpatient stays for children. The KID was specifically designed to permit researchers to study a broad range of conditions and procedures related to child health issues. Researchers and policymakers can use the KID to identify, track, and analyze national trends in health care utilization, access, charges, quality, and outcomes. It is the only all-payer inpatient claims database for children in the U.S. |
| Database (Scope, Size, Setting, Population, Age Range) | National; Adolescents Only (< 20 years old); 2-3 million records a year. |
| Database Type: (Survey, Registry, Research Study, Program Database, Claims, Administrative Data, and Clinical Databases) | A Federal-State-Industry database of Medicare, Medicaid, Private Insurance and Uninsured patient discharges. |
| Database Source/Origin: | Administrative data from 4,121 community, non-rehabilitation hospitals in 44 states. |
| Date or Frequency of Data Collection: | 1997-2009; updated every three years. |
| Longitudinal vs. Cross-sectional Database: | Longitudinal |
| Data Collection Methodology: | Discharge data submitted by participating organizations. |
| Sampling Strategy: | Sampling frame is limited to pediatric discharges from community, non-rehabilitation hospitals in participating HCUP partner states. For sampling, pediatric discharges in participating States are stratified by uncomplicated birth, complicated birth, and all other cases. To ensure an accurate representation of each hospital’s case-mix, the discharges are sorted by State, hospital, DRG and a random with each DRG. Systematic random sampling is then used to select 10% of uncomplicated births and 80% of complicated births and other cases form each from hospital |
| Unit of Analysis: | Multiple (patient, region, etc.) |
| Diagnosis Information | |
| Diagnosis Variable Type: (Chronic Condition Status, Principal Diagnosis, Primary Diagnosis, Secondary Diagnosis, Admit/Discharge Diagnosis and Self-Reported Diagnosis) | Number of Chronic Conditions (based on a list of 25 possible chronic condition indicators) Primary and Secondary Diagnoses Admission and Discharge Status |
| Diagnosis Codes: (ICD-9, ICD-10, SNOMED) | ICD-9-CM codes |
| Number of Diagnoses Captured: | KID contains up to 25 diagnoses per patient per record. This number can vary by State. |
| Cost, Utilization & Clinical Information | |
| Measures of Cost: (Claims, Out-of-pocket expenses, Self-reported expenditures, and Prescription Drug Costs) | Expected Primary and Secondary Payer Total Charges |
| Measures of Healthcare Utilization: (Number of Visits, Any Procedures/Number of Procedures/Type of Procedure, Number of Admission/Type of Admission, Length of Stay, Hospitalizations, Emergency Department Utilization, etc.) | Admission Type Procedure Type ED Visits Length of Stay Number of Discharges |
| Measures of Healthcare Access: | Database used to evaluate healthcare access through the use of geographic and hospital type variables (i.e. critical access). |
| Demographic Information: (Sex, Age, Race, Ethnicity, Marital Status, Disability Status, Language, Insurance Type, Educational Attainment). | Age at Admission Gender Race Hospital Characteristics Physician Identifiers |
| Clinical Information: BMI, Medical Conditions [high blood pressure], Smoker Status, History of Various Conditions, Preventative Health Measures, Activities of Daily Living, Instrumental Activities of Daily Living) | Comorbidity Measures Birth Weight |
| Measures of Socioeconomic Status: (Occupation, Employment Status, Income, Wealth, Place of Residence, Household Size & Composition, geographic location) | Place of Residence Median Household Income |
| Site of Service Information: | Hospital Location (e.g. State, zip code, etc.) Site of Service Transition Information |
| Measures of Healthcare Outcomes: (Mortality, Morbidity, Mobility, Functional Status, Quality of Life, Quality Measures, Quality of Care, Readmissions) | In-Hospital Mortality Disposition of Patient |
| Strengths, Limitations & Feasibility | |
| Data Strengths: | Representative of all insurance types. Large sample size that allows researchers to study rare conditions. |
| Data Limitations: | Missing data values can compromise the quality of estimates. If the outcome for discharges with missing values is different from the outcome for discharges with valid values, then sample estimates for that outcome will be biased and inaccurately represent the discharge population. For example, race is missing on 15% of discharges in the 2009 KID because some hospitals and HCUP State Partners do not supply it. |
| Data Access Restrictions: | Access to KIDs is open to users who complete a Data Use Agreement and purchase the data. Uses are limited to research and aggregate statistical reporting. |
| Data Linking Feasibility (Unique identifiers or sufficient demographics to allow for data linkages) | The database contains AHA hospital identifiers. However, many states do not report this information. |
| Related Grouping Systems: | HCUP Clinical Classifications System (CCS) |
| Healthcare Cost & Utilization Project - Nationwide Emergency Department Sample | |
|---|---|
| References Overview of the Nationwide Emergency Department Sample (NEDS). 2013. http://www.hcupus.ahrq.gov/nedsoverview.jsp | |
| Database Description | |
| White Paper(s): | Data Systems and the Prevalence of Chronic Disease Combinations & Multiple Chronic Conditions and Disparities |
| Sponsorship: | Agency for Healthcare Research & Quality |
| Description: | The Nationwide Emergency Department Sample (NEDS) is a unique and powerful database that yields national estimates of emergency department (ED) visits. The NEDS was created to enable analyses of emergency department (ED) utilization patterns and support public health professionals, administrators, policymakers, and clinicians in their decision-making regarding this critical source of care. NEDS is the largest all-payer ED database in the U.S. |
| Database (Scope, Size, Setting, Population, Age Range) | National; 25 - 30 million records |
| Database Type: (Survey, Registry, Research Study, Program Database, Claims, Administrative Data, and Clinical Databases) | A Federal-State-Industry database of Medicare, Medicaid, Private Insurance and Uninsured ED patient discharge records. |
| Database Source/Origin: | As of 2010, NEDS contains administrative data from over 961 hospitals in 28 States. |
| Date or Frequency of Data Collection: | 2006-2010; updated yearly. |
| Longitudinal vs. Cross-sectional Database: | Longitudinal |
| Data Collection Methodology: | NEDS is developed from data from ED visits submitted by participating States. |
| Sampling Strategy: | Similar to the design of the Nationwide Inpatient Sample (NIS), NEDS is developed using a 20% stratified sample of institutions; NEDS is a sample of U.S. hospital-based EDs who participate in the program (n=28). Sampling rate is 20% NEDS to Universe and 37.6% NEDS to Frame. |
| Unit of Analysis: | Episode |
| Diagnosis Information | |
| Diagnosis Variable Type: (Chronic Condition Status, Principal Diagnosis, Primary Diagnosis, Secondary Diagnosis, Admit/Discharge Diagnosis and Self-Reported Diagnosis) | Number of Chronic Conditions Primary and Secondary Diagnoses Injury Descriptive Variables |
| Diagnosis Codes: (ICD-9, ICD-10, SNOMED) | ICD-9-CM, CPT-4 |
| Number of Diagnoses Captured: | NEDS contains up to 15 diagnoses per record. This number may differ by State. |
| Cost, Utilization & Clinical Information | |
| Measures of Cost: (Claims, Out-of-pocket expenses, Self-reported expenditures, and Prescription Drug Costs) | Total ED charges and total hospital charges (for inpatient stays for those ED visits that result in admission. ED Event Type/Number of Visits Length of Stay Number of Discharges |
| Measures of Healthcare Utilization: (Number of Visits, Any Procedures/Number of Procedures/Type of Procedure, Number of Admission/Type of Admission, Length of Stay, Hospitalizations, Emergency Department Utilization, etc.) | ED Event Type/Number of Visits Length of Stay Number of Discharges |
| Measures of Healthcare Access: | Database used to evaluate healthcare access through the use of geographic and hospital type variables (i.e. critical access). |
| Demographic Information: (Sex, Age, Race, Ethnicity, Marital Status, Disability Status, Language, Insurance Type, Educational Attainment). | Gender, Age, Urban-Rural designation of resident, expected payment source (e.g. Medicare, Medicaid, self-pay) |
| Clinical Information: (BMI, Medical Conditions [high blood pressure], Smoker Status, History of Various Conditions, Preventative Health Measures, Activities of Daily Living, Instrumental Activities of Daily Living) | ICD-9-CM and CPT-4 procedures and diagnoses Identification of injury-related ED visits including mechanism and intent of injury and severity of injury Discharge status from the ED |
| Measures of Socioeconomic Status: (Occupation, Employment Status, Income, Wealth, Place of Residence, Household Size & Composition, geographic location) | National quartile of median household income (from patient’s ZIP Code) |
| Site of Service Information: | Hospital location (e.g. State, zip code, etc.) and characteristics (e.g. teaching status, region, ownership type). |
| Measures of Healthcare Outcomes: (Mortality, Morbidity, Mobility, Functional Status, Quality of Life, Quality Measures, Quality of Care, Readmissions) | Discharge Status |
| Strengths, Limitations & Feasibility | |
| Data Strengths: | NEDS is the largest all-payer ED database in the U.S., with many research applications. It includes information on patients covered by all types of insurances. |
| Data Limitations: | The NEDS contains event-level records, not patient-level records. This means that individual patients who visit the ED multiple times in one year may be present in NEDS multiple times. There is no uniform patient identifier available that would allow a patient-level analysis with the NEDS. In contrast, the HCUP state databases may be used for this type of analysis |
| Data Access Restrictions: | Access to NEDS is open to users who complete a Data Use Agreement and purchase the data. Uses are limited to research and aggregate statistical reporting. |
| Data Linking Feasibility (Unique identifiers or sufficient demographics to allow for data linkages) | For most States, the NIS includes hospital identifiers that permit linkages to the American Hospital Association Annual Survey Database and county identifiers that permit linkages to the Area Resource File. |
| Related Grouping Systems: | HCUP Clinical Classifications System (CCS) |
| Name: Healthcare Cost & Utilization Project - Nationwide Inpatient Sample | |
|---|---|
| References Overview of Nationwide Inpatient Sample (NIS). 2013. http://www.hcup-us.ahrq.gov/nisoverview.jsp | |
| Database Description | |
| White Paper(s): | Data Systems and the Prevalence of Chronic Disease Combinations & Multiple Chronic Conditions and Disparities |
| Sponsorship: | Agency for Healthcare Research & Quality |
| Description: | The Nationwide Inpatient Sample (NIS) is a unique and powerful database of hospital inpatient stays. Researchers and policymakers use the NIS to identify, track, and analyze national trends in health care utilization, access, charges, quality, and outcomes. It is the largest publicly available all- payer patient care database in the U.S. |
| Database (Scope, Size, Setting, Population, Age Range) | National; Information available on approximately 8 million hospital stays per year. |
| Database Type: (Survey, Registry, Research Study, Program Database, Claims, Administrative Data, and Clinical Databases) | A Federal-State-Industry database of Medicare, Medicaid, Private Insurance and Uninsured patient discharges. |
| Database Source/Origin: | Administrative data from 1,051 hospitals from 44 states. |
| Date or Frequency of Data Collection: | 1988 - 2010; updated yearly |
| Longitudinal vs. Cross-sectional Database: | Longitudinal |
| Data Collection Methodology: | NIS contains clinical and resource use information included in a patient discharge abstract and is submitted to HCUP by over 1,000 hospitals in the U.S. |
| Sampling Strategy: | The NIS is a stratified probability sample of hospitals, with sampling probabilities calculated to select 20% of the universe of community, non-rehabilitation hospitals in specific strata for ease of use. The entire sampling frame from 46 states includes >90% of hospitals and >95% of discharges from community hospitals. |
| Unit of Analysis: | Multiple (patient, hospital, region, etc.) |
| Diagnosis Information | |
| Diagnosis Variable Type: (Chronic Condition Status, Principal Diagnosis, Primary Diagnosis, Secondary Diagnosis, Admit/Discharge Diagnosis and Self-Reported Diagnosis) | Major Diagnosis Category (MDC) Primary and secondary diagnosis Admission and discharge status Number of Chronic Conditions |
| Diagnosis Codes: (ICD-9, ICD-10, SNOMED) | ICD-9 |
| Number of Diagnoses Captured: | NIS contains up to 25 diagnoses per record (15 prior to the 2009 NIS). The number of diagnoses varies by State; some states provide as many as 66 diagnoses while other states provide as few as 9 diagnoses. |
| Cost, Utilization & Clinical Information | |
| Measures of Cost: (Claims, Out-of-pocket expenses, Self-reported expenditures, and Prescription Drug Costs) | Total Charges |
| Measures of Healthcare Utilization: (Number of Visits, Any Procedures/Number of Procedures/Type of Procedure, Number of Admission/Type of Admission, Length of Stay, Hospitalizations, Emergency Department Utilization, etc.) | Length of Stay Type of Admission Number of Discharges |
| Measures of Healthcare Access: | Database used to evaluate healthcare access through the use of geographic and hospital status variables (e.g. CAH status). |
| Demographic Information: (Sex, Age, Race, Ethnicity, Marital Status, Disability Status, Language, Insurance Type, Educational Attainment). | Gender, age, race, median income for zip code, and Expected Primary and Secondary Payment Sources. |
| Clinical Information: (BMI, Medical Conditions [high blood pressure], Smoker Status, History of Various Conditions, Preventative Health Measures, Activities of Daily Living, Instrumental Activities of Daily Living) | Primary and secondary procedures Disease Severity Measures Comorbidity Measures |
| Measures of Socioeconomic Status: (Occupation, Employment Status, Income, Wealth, Place of Residence, Household Size & Composition, geographic location) | Place of Residence Median household income for patient’s ZIP Code |
| Site of Service Information: | Hospital location (e.g. State, zip code, etc.) and characteristics (e.g. teaching status, region, ownership type). |
| Measures of Healthcare Outcomes: (Mortality, Morbidity, Mobility, Functional Status, Quality of Life, Quality Measures, Quality of Care, Readmissions) | Disposition of Patient In-hospital Death |
| Strengths, Limitations & Feasibility | |
| Data Strengths: | The NIS is the largest publicly available all-payer inpatient care database in the U.S. with information from 45 states, comprising over 96% of the U.S. population. The NIS’ large sample size enables analyses of rare conditions, uncommon treatments, and special patient populations (such as the uninsured). |
| Data Limitations: | Missing data values can compromise the quality of estimates. If the outcome for discharges with missing values is different from the outcome for discharges with valid values, then sample estimates for that outcome will be biased and inaccurately represent the discharge population. For example, race is missing on over 11% of discharges in the 2010 NIS because some hospitals and HCUP State Partners do not supply it. Not all states report patient identifiers and complete diagnostic information. |
| Data Access Restrictions: | Access to NIS is open to users who complete a Data Use Agreement and purchase the data. |
| Data Linking Feasibility (Unique identifiers or sufficient demographics to allow for data linkages) | The database contains AHA hospital identifiers. However, many states do not report this information. |
| Related Grouping Systems: | HCUP Clinical Classifications System (CCS) |
| Medical Expenditure Panel Survey | |
|---|---|
| References Medicare Expenditure Panel Survey (MEPS). 2013. http://meps.ahrq.gov/mepsweb/ | |
| Database Description | |
| White Paper(s): | Data Systems and the Prevalence of Chronic Disease Combinations & Multiple Chronic Conditions and Disparities |
| Sponsorship: | Agency for Healthcare Research and Quality |
| Description: | The Medical Expenditure Panel Survey (MEPS) is a set of large-scale surveys of families and individuals, their medical providers, and employers across the United States. MEPS is the most complete source of data on the cost and use of health care and health insurance coverage. |
| Database (Scope, Size, Setting, Population, Age Range) | National; approximately 35,000 persons interviewed annually. |
| Database Type: (Survey, Registry, Research Study, Program Database, Claims, Administrative Data, and Clinical Databases) | Survey/Interviews
|
| Database Source/Origin: | Survey data from a set of large-scale surveys of families and individuals, their medical providers, and employers in the U.S. |
| Date or Frequency of Data Collection: | 1996-2012; updated annually. |
| Longitudinal vs. Cross-sectional Database: | Longitudinal |
| Data Collection Methodology: | For the Household Component, a panel survey design in used to collect data via multiple rounds of interviewing over a two year period of time. For the Insurance component, an annual survey of employers is conducted that collections information on health insurance offerings. |
| Sampling Strategy: | The Household Component collects data from a sample of families and individuals in selected communities across the U.S., drawn from a nationally representative subsample of households that participated in the prior year’s National Health Interview Survey. The Insurance Component collects information from Household Component respondent employers or other non-related employers. |
| Unit of Analysis: | Household or Employer |
| Diagnosis Information | |
| Diagnosis Variable Type: (Chronic Condition Status, Principal Diagnosis, Primary Diagnosis, Secondary Diagnosis, Admit/Discharge Diagnosis and Self-Reported Diagnosis) | Self-Reported Diagnosis transformed into ICD-9 Codes |
| Diagnosis Codes: (ICD-9, ICD-10, SNOMED) | ICD-9 |
| Number of Diagnoses Captured: | MEPS identifies specific physical and mental health conditions, accidents, or injuries affecting each respondent. 670 clinical categories are created. |
| Cost, Utilization & Clinical Information | |
| Measures of Cost: (Claims, Out-of-pocket expenses, Self-reported expenditures, and Prescription Drug Costs) | Total Health Care Expenditures, Total Expenditures Paid by Insurance, Hospital Outpatient Expenditures, Hospital Emergency Room Expenditures, Hospital Inpatient Expenditures, Dental Expenditures, Home Health Care Expenditures, Vision Aid Expenditures, Other Medical Equipment and Service Expenditures, and Prescription Drug Expenditures |
| Measures of Healthcare Utilization: (Number of Visits, Any Procedures/Number of Procedures/Type of Procedure, Number of Admission/Type of Admission, Length of Stay, Hospitalizations, Emergency Department Utilization, etc.) | Medical Provider Visits (Physician, etc.), Hospital Outpatient Visits, Hospital Emergency Room Visits, Hospital Inpatient Visits, Dental Visits, Home Health Care Visits, Number of Drugs Prescribed , and Length of Stay |
| Measures of Healthcare Access: | Presence of provider who provides the usual source of care, reasons why members without usual care do not have it, various aspects of satisfaction with usual care providers, and problems experience in obtaining needed health care |
| Demographic Information: (Sex, Age, Race, Ethnicity, Marital Status, Disability Status, Language, Insurance Type, Educational Attainment). | Age, Sex, Race/Ethnicity, Insurance Status, Marital Status, and Disability Status |
| Clinical Information: (BMI, Medical Conditions [high blood pressure], Smoker Status, History of Various Conditions, Preventative Health Measures, Activities of Daily Living, Instrumental Activities of Daily Living) | Prescribed Medicine, Pregnancy Detail, |
| Measures of Socioeconomic Status: (Occupation, Employment Status, Income, Wealth, Place of Residence, Household Size & Composition, geographic location) | Family Income as Percent of Poverty Line, Employment Status, Total Income, geographic location, and Size of Family |
| Site of Service Information: | Type of Service (e.g. hospital, nursing home, etc.) |
| Measures of Healthcare Outcomes: (Mortality, Morbidity, Mobility, Functional Status, Quality of Life, Quality Measures, Quality of Care, Readmissions) | Self-Reported Overall Health Status Self-Reported Physical Health Status Self-Reported Mental Health Status |
| Strengths, Limitations & Feasibility | |
| Data Strengths: | MEPS provides a level of breadth and depth of healthcare utilization information that is not captured in other surveys. |
| Data Limitations: | Even after pooling several years of MEPS data, sample size limitations and confidentiality restrictions make MEPS data unsuitable for certain types of analysis. For example, the MEPS data do not support research on rare conditions. Moreover, information on conditions is household-reported and not verified by clinical records. All MEPS data are reported by one designated household respondent. |
| Data Access Restrictions: | Some files are accessible to the public; however only researchers and users with approved access can gain access to restricted files. |
| Data Linking Feasibility (Unique identifiers or sufficient demographics to allow for data linkages) | Data can only be linked be survey number, which limits the feasibility of linking to non-MEPS-related data sources. |
| Related Grouping Systems: | ICD-based grouping systems. |
Centers for Disease Control and Prevention Datasets
| Behavioral Risk Factor Surveillance System | |
|---|---|
| References Centers for Disease Control and Prevention. Behavioral Risk Factor Surveillance System. 2013. http://www.cdc.gov/brfss/ | |
| Database Description | |
| White Paper(s): | Data Systems and the Prevalence of Chronic Disease Combinations & Multiple Chronic Conditions and Disparities |
| Sponsorship: | Center for Disease Control and Prevention |
| Description: | The Behavioral Risk Factor Surveillance System (BRFSS) is the world’s largest, on-going telephone health survey system, tracking health conditions and risk behaviors in the United States yearly since 1984. Currently, data are collected monthly in all 50 states, the District of Columbia, Puerto Rico, the U.S. Virgin Islands, and Guam. |
| Database (Scope, Size, Setting, Population, Age Range) | National; approximately 350,000 non-institutionalized adults (aged 18 years or older) are interviewed each year. One adult is interviewed per household. |
| Database Type: (Survey, Registry, Research Study, Program Database, Claims, Administrative Data, and Clinical Databases) | Multi-mode survey (mail, landline, and cell phone) |
| Database Source/Origin: | Initiated in 1894 with 15 states collecting surveillance data on risk behaviors through monthly telephone interviews. By 2001 the 50 states, District of Columbia, Puerto Rico, and Virgin Islands were participating in the BRFSS. |
| Date or Frequency of Data Collection: | 1984–2012; survey conducted monthly and report compiled by the CDC annually |
| Longitudinal vs. Cross-sectional Database: | Cross-sectional |
| Data Collection Methodology: | With technical assistance from the CDC, state health departments use in-house interviewers or contract with telephone call centers of universities to conduct BRFFS survey. |
| Sampling Strategy: | The survey is conducted using Random Digit Dialing (RDD) techniques on both landlines and cell phones. |
| Unit of Analysis: | Respondent |
| Diagnosis Information | |
| Diagnosis Variable Type: (Chronic Condition Status, Principal Diagnosis, Primary Diagnosis, Secondary Diagnosis, Admit/Discharge Diagnosis and Self-Reported Diagnosis) | Self-reported conditions |
| Diagnosis Codes: (ICD-9, ICD-10, SNOMED) | The BRFSS does not utilized diagnosis codes. |
| Number of Diagnoses Captured: | BRFSS asks respondents about the following conditions: MI, CHD, Stroke, Asthma, Skin Cancer, Other Cancer, COPD, Arthritis, Depression, Kidney Disease, Vision Impairment, Diabetes, and HIV/AIDS. |
| Cost, Utilization & Clinical Information | |
| Measures of Cost: (Claims, Out-of-pocket expenses, Self-reported expenditures, and Prescription Drug Costs) | The BRFSS only asks if cost is a barrier to obtaining healthcare services for specific conditions. |
| Measures of Healthcare Utilization: (Number of Visits, Any Procedures/Number of Procedures/Type of Procedure, Number of Admission/Type of Admission, Length of Stay, Hospitalizations, Emergency Department Utilization, etc.) | Utilization of preventive healthcare services information is collected. |
| Measures of Healthcare Access: | Questions are included related to insurance, regular care provider, and last health checkup. |
| Demographic Information: (Sex, Age, Race, Ethnicity, Marital Status, Disability Status, Language, Insurance Type, Educational Attainment, Income). | Age, Gender, Hispanic vs. Latino, Race, Military Status, Insurance Status/Type, Educational Obtainment, Disability Status and Income. |
| Clinical Information: (BMI, Medical Conditions [high blood pressure], Smoker Status, History of Various Conditions, Preventative Health Measures, Activities of Daily Living, Instrumental Activities of Daily Living) | Hypertension Status, High Cholesterol Status, Risky Health, Behaviors (i.e. tobacco use), Pregnancy Status, Fruit and Vegetable Consumption, Physical Activity Level, and Immunizations. |
| Measures of Socioeconomic Status: (Occupation, Employment Status, Income, Wealth, Place of Residence, Household Size & Composition, geographic location) | Household Size, Employment Status, Household Income, Zip Code, and Own vs. Rent Home. |
| Site of Service Information: | The BRFSS does not include information on site of service. |
| Measures of Healthcare Outcomes: (Mortality, Morbidity, Mobility, Functional Status, Quality of Life, Quality Measures, Quality of Care, Readmissions) | Self-reported Health Status Self-reported Health-Related Quality of Life |
| Strengths, Limitations & Feasibility | |
| Data Strengths: | THE BRFSS raking methodology includes categories of age by gender, detailed race and ethnicity groups, education levels, marital status, regions within states, gender by race and ethnicity, telephone source, renter/owner status, and age groups by race and ethnicity. In 2011, 50 states, the District of Columbia, Guam, and Puerto Rico collected samples of both landline and cell phone interviews, while the Virgin Islands collected a sample of landline-only interviews. |
| Data Limitations: | Limitations on the reliability and validity of self-reported behaviors, with some over-reported, and others underreported. Only administered in English and Spanish. An increasing numbers of households lack landlines. |
| Data Access Restrictions: | BRFSS data is publicly available. |
| Data Linking Feasibility (Unique identifiers or sufficient demographics to allow for data linkages) | No direct identifiers, except telephone number. |
| Related Grouping Systems: | n/a |
| National Ambulatory Medical Care Survey | |
|---|---|
| References Centers for Disease Control and Prevention. Ambulatory Health Care Data. 2013. http://www.cdc.gov/nchs/ahcd.htm | |
| Database Description | |
| White Paper(s): | Data Systems and the Prevalence of Chronic Disease Combinations |
| Sponsorship: | Centers for Disease Control and Prevention |
| Description: | The National Ambulatory Medical Care Survey (NAMCS) is a national survey designed to provide information about the provision and use of ambulatory medical care services in the United States. Data are obtained on patients' symptoms, physicians' diagnoses, and medications ordered or provided. Information on services provided, including information on diagnostic procedures, patient management, and planned future treatment. |
| Database (Scope, Size, Setting, Population, Age Range) | National; the NAMCS includes data on approximately 11,000 physicians from office-based settings and more than 6,000 CHC providers. |
| Database Type: (Survey, Registry, Research Study, Program Database, Claims, Administrative Data, and Clinical Databases) | Survey of physicians and providers. |
| Database Source/Origin: | Findings are based on a sample of visits to non-federal employed office-based physicians who are primarily engaged in direct patient care. Physicians in the specialties of anesthesiology, pathology, and radiology are excluded from the survey. |
| Date or Frequency of Data Collection: | The survey was conducted annually from 1973 to 1981, in 1985, and annually since 1989. |
| Longitudinal vs. Cross-sectional Database: | Cross-sectional. |
| Data Collection Methodology: | Specially trained interviewers visit physicians prior to their participation in the survey in order to provide them with survey materials and instruct them on how to complete the forms. Data collection is from physicians, rather than from patients, which provides an analytic base that expands information on ambulatory care collected through other ambulatory surveys. Each physician is randomly assigned to a 1-week reporting period. During this period, data for a systematic random sample of visits are recorded by the physician or office staff on an encounter form provided for that purpose. |
| Sampling Strategy: | Data is obtained from sample of visits to non-federal employed office-based physicians who are primarily engaged in direct patient care. |
| Unit of Analysis: | Physicians |
| Diagnosis Information | |
| Diagnosis Variable Type: (Chronic Condition Status, Principal Diagnosis, Primary Diagnosis, Secondary Diagnosis, Admit/Discharge Diagnosis and Self-Reported Diagnosis) | Common primary diagnosis. |
| Diagnosis Codes: (ICD-9, ICD-10, SNOMED) | ICD-9-CM. Drug data are coded using a unique classification scheme developed at NCHS. |
| Number of Diagnoses Captured: | Information is collected on the following chronic conditions: Cerebrovascular disease, Congestive heart failure, Chronic renal failure, HIV, and diabetes. |
| Cost, Utilization & Clinical Information | |
| Measures of Cost: (Claims, Out-of-pocket expenses, Self-reported expenditures, and Prescription Drug Costs) | Source of payment |
| Measures of Healthcare Utilization: (Number of Visits, Any Procedures/Number of Procedures/Type of Procedure, Number of Admission/Type of Admission, Length of Stay, Hospitalizations, Emergency Department Utilization, etc.) | Number of past visits in last 12 months, major reason for visit, time spent with the physician, previous care – seen in ED in last 72 hours/ discharged from hospital in last 7 days, counseling/ education/ therapy, surgical procedures, patient’s primary care physician provider, was patient referred for visit, and patient seen before. |
| Measures of Healthcare Access: | NAMCS does not have measures of healthcare access. |
| Demographic Information: (Sex, Age, Race, Ethnicity, Marital Status, Disability Status, Language, Insurance Type, Educational Attainment). | Age, Sex, and Ethnicity/Race. |
| Clinical Information: (BMI, Medical Conditions [high blood pressure], Smoker Status, History of Various Conditions, Preventative Health Measures, Activities of Daily Living, Instrumental Activities of Daily Living) | Pain level, Tobacco use, Respiratory rate, Episode of care, Glasgow coma scale (GCS), and On oxygen on arrival. |
| Measures of Socioeconomic Status: (Occupation, Employment Status, Income, Wealth, Place of Residence, Household Size & Composition, geographic location) | Place of residence |
| Site of Service Information: | Hospitals and community health centers identified. |
| Measures of Healthcare Outcomes: (Mortality, Morbidity, Mobility, Functional Status, Quality of Life, Quality Measures, Quality of Care, Readmissions) | Discharge status |
| Strengths, Limitations & Feasibility | |
| Data Strengths: | Data are collected on key policy issues pertaining to health. There are multiple years of data available. |
| Data Limitations: | The item nonresponse rate for ethnicity and race is approximately 20%. |
| Data Access Restrictions: | Data are available to the public at no cost. Restricted files which contain additional variables and non-masked data can be accessed by applying to the NCHS Research Data Center and paying a fee. |
| Data Linking Feasibility (Unique identifiers or sufficient demographics to allow for data linkages) | The NAMCS does not include unique identifiers to link patients. |
| Related Grouping Systems: | ICD-based grouping systems. |
| National Health Interview Survey | |
|---|---|
| References Centers for Disease Control and Prevention. National Health Interview Survey. 2013. http://www.cdc.gov/nchs/nhis.htm | |
| Database Description | |
| White Paper(s): | Data Systems and the Prevalence of Chronic Disease Combinations & Multiple Chronic Conditions and Disparities |
| Sponsorship: | Centers for Disease Control and Prevention |
| Description: | The National Health Interview Survey is the principal source of information on the health of the civilian non-institutionalized population of the United States and is one of the major data collection programs of the National Center for Health Statistics. |
| Database (Scope, Size, Setting, Population, Age Range) | National; approximately 100,000 individuals. |
| Database Type: (Survey, Registry, Research Study, Program Database, Claims, Administrative Data, and Clinical Databases) | Household survey |
| Database Source/Origin: | Surveys of households. |
| Date or Frequency of Data Collection: | Annually since 1957, but revised every 10-15 years. Sampling and interviewing are continuous throughout the year |
| Longitudinal vs. Cross-sectional Database: | The National Health Interview Survey is a cross-sectional household interview survey. |
| Data Collection Methodology: | Sampled by household – one child and one adult are selected to complete the Sample Adult and Sample Child components of the survey. Sampling methods are redesigned after every census. |
| Sampling Strategy: | Sampling and interviewing are continuous throughout each year. The sampling plan follows a multistage area probability design that permits the representative sampling of households and non-institutional group quarters (e.g., college dormitories). The sampling plan is redesigned after every decennial census. The current sampling plan was implemented in 2006. It has many similarities to the previous sampling plan, which was in place from 1995 to 2005. The first stage of the current sampling plan consists of a sample of 428 primary sampling units (PSU's) drawn from approximately 1,900 geographically defined PSU's that cover the 50 States and the District of Columbia. A PSU consists of a county, a small group of contiguous counties, or a metropolitan statistical area. |
| Unit of Analysis: | Households, Individuals and Geographic Region. |
| Diagnosis Information | |
| Diagnosis Variable Type: (Chronic Condition Status, Principal Diagnosis, Primary Diagnosis, Secondary Diagnosis, Admit/Discharge Diagnosis and Self-Reported Diagnosis) | Self-reported diagnosis information. |
| Diagnosis Codes: (ICD-9, ICD-10, SNOMED) | Self-report diagnosis. |
| Number of Diagnoses Captured: | Self-reported diagnosis information collected on: Hypertension/ high blood pressure, High cholesterol, Coronary heart disease, Angina, Heart attack, Heart condition/ heart disease, Stroke, Emphysema, COPD, Asthma, Ulcer, Cancer or malignancy of any kind/ benign tumors/cysts, Diabetes, Seizure disorder or epilepsy, Sinsuitis, Chronic bronchitis, Weak or failing kidneys, bladder or renal problem, Liver condition, Fibromyalgia, lupus, Multiple Sclerosis, Muscular Dystrophy, Osteoporosis or tendinitis, Pilio, paralysis, para/quadriplegia, Parkinson’s disease, other tremors, Hernia, Varicose veins, hemorrhoids, Thyroid problems, Grave’s disease, gout, Hearing problems, Depression, anxiety, or an emotional problem, Pain, ache, stiffness in or around a joint, bone injury, Arthritis, Birth defect, intellectual disability/ developmental problem, Senility, Weight problems, Missing limbs, Circulation problems / blood clots, Severe headache or migraine, Stomach or intestinal illness, Pregnant, Vision/ blindness, Teeth loss, Weak immune system (due to leukemia, lymphoma, HIV), Nerve damage/carpal tunnel syndromes, and Hepatitis. |
| Cost, Utilization & Clinical Information | |
| Measures of Cost: (Claims, Out-of-pocket expenses, Self-reported expenditures, and Prescription Drug Costs) | Affordability of prescription medicines, Affordability of doctors, Affordability of dental care, and Affordability of insurance. |
| Measures of Healthcare Utilization: (Number of Visits, Any Procedures/Number of Procedures/Type of Procedure, Number of Admission/Type of Admission, Length of Stay, Hospitalizations, Emergency Department Utilization, etc.) | Emergency room visit/ hospital visit , Asthma action plan/ class on managing asthma, Routine checkup for asthma, Taking insulin, Use hearing aid, Usual place to go when sick, Health care change due to health insurance change, Received home health visits, Received surgery, Received flu/ tetanus/ hepatitis/ HPV shot and Pap smear/ mammogram. |
| Measures of Healthcare Access: | Lack of transportation to health care, Lack of available doctors, Lack of doctors’ offices open at convenient times, Worried about paying medical bills, Health care coverage compared to past year, Skipped medication to save money, and Communicate with a healthcare provider online. |
| Demographic Information: (Sex, Age, Race, Ethnicity, Marital Status, Disability Status, Language, Insurance Type, Educational Attainment). | Age, sex, sexual orientation. |
| Clinical Information: (BMI, Medical Conditions [high blood pressure], Smoker Status, History of Various Conditions, Preventative Health Measures, Activities of Daily Living, Instrumental Activities of Daily Living) | Smoker status, Exercise, Drinker status, Height and Weight. |
| Measures of Socioeconomic Status: (Occupation, Employment Status, Income, Wealth, Place of Residence, Household Size & Composition, geographic location) | Employment status, Business/ industry, Activities at job, Size of business, Paid by the hour or salaried, Paid sick leave, Multiple jobs held, and time at current residence. |
| Site of Service Information: | Site of Service is not collected of the NHIS. |
| Measures of Healthcare Outcomes: (Mortality, Morbidity, Mobility, Functional Status, Quality of Life, Quality Measures, Quality of Care, Readmissions) | Morbidity and Mortality. |
| Strengths, Limitations & Feasibility | |
| Data Strengths: | Includes questions that can be used to analyze demographic and socioeconomic characteristics and health trends. |
| Data Limitations: | Cross-sectional data; it cannot be used study patients over time. Sample sizes are too small to provide accurate state-level statistics. |
| Data Access Restrictions: | NHIS data files are available to download at no charge. All files from 1963-2011 are available online |
| Data Linking Feasibility (Unique identifiers or sufficient demographics to allow for data linkages) | AHRQ provides a crosswalk to merge the MEPS and NHIS data. Mortality data, Medicare enrollment and claims data, and social security and benefit history data are all linked to NHIS data. The National Immunization Provider Records Check Survey is also linked to NHIS data. |
| Related Grouping Systems: | n/a |
| National Health and Nutrition Examination Survey | |
|---|---|
| References Centers for Disease Control and Prevention. National Health and Nutrition Examination Survey (NHANES). 2013. http://www.cdc.gov/nchs/nhanes.htm | |
| Database Description | |
| White Paper(s): | Data Systems and the Prevalence of Chronic Disease Combinations & Multiple Chronic Conditions and Disparities |
| Sponsorship: | Center for Disease Control and Prevention |
| Description: | The National Health and Nutrition Examination Survey (NHANES) is a program of studies designed to assess the health and nutritional status of adults and children in the United States. The survey is unique in that it combines interviews and physical examinations. Findings from this survey are used to determine prevalence of major diseases and risk factors for diseases. |
| Database (Scope, Size, Setting, Population, Age Range) | National; 5,000 Surveys conducted annually. |
| Database Type: (Survey, Registry, Research Study, Program Database, Claims, Administrative Data, and Clinical Databases) | Survey and Physical Examination |
| Database Source/Origin: | Health interviews are conducted in respondents’ homes. Health measurements are performed in specially-designed and equipped mobile centers, which travel to locations throughout the country. The study team consists of a physician, medical and health technicians, as well as dietary and health interviewers. |
| Date or Frequency of Data Collection: | As of 1999, NHANES has been conducted on an annual basis. |
| Longitudinal vs. Cross-sectional Database: | Cross-sectional Survey |
| Data Collection Methodology: | NHANES includes clinical examinations, selected medical and laboratory tests, and self-reported data. Medical examinations and laboratory tests follow very specific protocols and are as standard as possible to ensure comparability across sites and providers. Beginning in 1999, NHANES became a continuous, annual survey. Data are collected every year from a representative sample of the civilian non-institutionalized U.S. population, newborns and older, by in-home personal interviews and physical examinations in the mobile examination centers. |
| Sampling Strategy: | The sample design is a complex, multistage, clustered design using unequal probabilities of selection. Low-income persons, adolescents 12-19 years of age, persons 60 years of age and over, African Americans, and persons of Mexican origin are oversampled. The sample is not designed to provide nationally representative estimates for the population of U.S Hispanics. |
| Unit of Analysis: | Respondent/Interviewee |
| Diagnosis Information | |
| Diagnosis Variable Type: (Chronic Condition Status, Principal Diagnosis, Primary Diagnosis, Secondary Diagnosis, Admit/Discharge Diagnosis and Self-Reported Diagnosis) | Self-Reported Conditions |
| Diagnosis Codes: (ICD-9, ICD-10, SNOMED) | Self-Reported Conditions |
| Number of Diagnoses Captured: | NHANES primarily studies nine categories of conditions: Obesity, Cardiovascular Health, Oral Health, Arthritis/Body Pain, Bone Density/Osteoporosis, Pulmonary Function, Endocrine Health, Renal Disease, and Allergy Inflammation. |
| Cost, Utilization & Clinical Information | |
| Measures of Cost: (Claims, Out-of-pocket expenses, Self-reported expenditures, and Prescription Drug Costs) | NHANES does not capture information on cost. |
| Measures of Healthcare Utilization: (Number of Visits, Any Procedures/Number of Procedures/Type of Procedure, Number of Admission/Type of Admission, Length of Stay, Hospitalizations, Emergency Department Utilization, etc.) | Hospital Utilization/Stays ED Utilization |
| Measures of Healthcare Access: | NHANES includes specific questions on healthcare access. |
| Demographic Information: (Sex, Age, Race, Ethnicity, Marital Status, Disability Status, Language, Insurance Type, Educational Attainment). | Age, Sex, Educational Attainment, Marital Status, Language, Race/Ethnicity, including subgroups and Health Insurance Status. |
| Clinical Information: (BMI, Medical Conditions [high blood pressure], Smoker Status, History of Various Conditions, Preventative Health Measures, Activities of Daily Living, Instrumental Activities of Daily Living) | Health Risk Behaviors, Health Risk Exposure Data, Weight History, Oral Health History, other clinical metrics are obtained during the interview by clinicians (i.e. blood pressure). |
| Measures of Socioeconomic Status: (Occupation, Employment Status, Income, Wealth, Place of Residence, Household Size & Composition, geographic location) | Veteran Status, Occupation, Employment Status and Income. |
| Site of Service Information: | For each condition, NHANES asks patients if they received care at a certain type of facility (ED, doctor’s office, etc.). |
| Measures of Healthcare Outcomes: (Mortality, Morbidity, Mobility, Functional Status, Quality of Life, Quality Measures, Quality of Care, Readmissions) | Self-reported Health Status Self-reported Physical Functioning |
| Strengths, Limitations & Feasibility | |
| Data Strengths: | Estimates for previously undiagnosed conditions are produced from NHANES. |
| Data Limitations: | A major limitation of NHANES is that it is not geographically representative of the U.S. The sample selected to be demographically representative, but because two teams can only visit a total of 16 sites a year, it is impossible to achieve a good geographic spread. NHANES may not be optimal for detecting changes over time because one doesn’t know if the changes observed are due to geographic irregularities of the survey. |
| Data Access Restrictions: | Certain public use data files are open to the file. Many survey data elements are not available for public use. |
| Data Linking Feasibility (Unique identifiers or sufficient demographics to allow for data linkages) | NHANES data have been linked with multiple years of Social Security Administrative Data, CMS Medicare enrollment and claims files include Part D data, and the National Death Index. |
| Related Grouping Systems: | n/a |
Centers for Medicare & Medicaid Services Datasets
| CMS Chronic Conditions Warehouse | |
|---|---|
| References Chronic Conditions Data Warehouse. 2013. http://www.ccwdata.org/web/guest/home | |
| Database Description | |
| White Paper(s): | Data Systems and the Prevalence of Chronic Disease Combinations |
| Sponsorship: | Centers for Medicare & Medicaid Services |
| Description: | The Chronic Condition Data Warehouse (CCW) is a research database designed to make Medicare, Medicaid, Assessments, and Part D Prescription Drug Event data more readily available to support research designed to improve the quality of care and reduce costs and utilization for chronic disease patients. Data is available across beneficiaries’ continuum of care. |
| Database (Scope, Size, Setting, Population, Age Range) | National-Population-specific; All Medicare patients. |
| Database Type: (Survey, Registry, Research Study, Program Database, Claims, Administrative Data, and Clinical Databases) | The CMS Chronic Condition Warehouse is an amalgamation of linked datasets, including Medicare, Medicaid, and Part D Claims and Assessment data. |
| Database Source/Origin: | CCW contains the following 100% Medicare files for years 1999–2010:
100% Medicaid files for years 1999 - 2008 and 2009/partial states available. 100% Part D Prescription Drug Event data for years 2006–2010
|
| Date or Frequency of Data Collection: | Ongoing; Data from 1999–2010. |
| Longitudinal vs. Cross-sectional Database: | Longitudinal |
| Data Collection Methodology: | CCW data are linked by a unique, unidentifiable beneficiary key, which allows researchers to analyze information across the continuum of care. |
| Sampling Strategy: | All Medicare beneficiaries |
| Unit of Analysis: | Medicare Beneficiary |
| Diagnosis Information | |
| Diagnosis Variable Type: (Chronic Condition Status, Principal Diagnosis, Primary Diagnosis, Secondary Diagnosis, Admit/Discharge Diagnosis and Self-Reported Diagnosis) | CCW has a specific condition algorithm to determine chronic condition categories. For each chronic condition category, specific primary, principal or secondary diagnosis codes are used to “flag” the event. |
| Diagnosis Codes: (ICD-9, ICD-10, SNOMED) | ICD-9, CPT4, HCPCS codes |
| Number of Diagnoses Captured: | Twenty-seven chronic conditions are maintained in the CCW. |
| Cost, Utilization & Clinical Information | |
| Measures of Cost: (Claims, Out-of-pocket expenses, Self-reported expenditures, and Prescription Drug Costs) | Medicare & Medicare Claims; Part D Prescription Drug Costs |
| Measures of Healthcare Utilization: (Number of Visits, Any Procedures/Number of Procedures/Type of Procedure, Number of Admission/Type of Admission, Length of Stay, Hospitalizations, Emergency Department Utilization, etc.) | Number of Claims, Number of Visits, and Type of Procedure. |
| Measures of Healthcare Access: | CCW includes an Access to Care File. |
| Demographic Information: (Sex, Age, Race, Ethnicity, Marital Status, Disability Status, Language, Insurance Type, Educational Attainment). | Sex, Race, Insurance Type, Dual Eligibility Status, Age, preferred language, marital status, etc. |
| Clinical Information: (BMI, Medical Conditions [high blood pressure], Smoker Status, History of Various Conditions, Preventative Health Measures, Activities of Daily Living, Instrumental Activities of Daily Living) | n/a |
| Measures of Socioeconomic Status: (Occupation, Employment Status, Income, Wealth, Place of Residence, Household Size & Composition, geographic location) | Zip code |
| Site of Service Information: | CCW includes information on site of service (hospital, nursing home, etc.) |
| Measures of Healthcare Outcomes: (Mortality, Morbidity, Mobility, Functional Status, Quality of Life, Quality Measures, Quality of Care, Readmissions) | Mortality, morbidity, Mobility, functional status, quality of life, quality measures, quality of care. |
| Strengths, Limitations & Feasibility | |
| Data Strengths: | Links beneficiaries across multiple care settings and representative of all Medicare patients. |
| Data Limitations: | Since claims for most services provided to Medicare beneficiaries in managed care do not reach the claim data files, the CCW Medicare claims should be viewed as providing utilization information primarily for the fee-for-service population. |
| Data Access Restrictions: | CCW data files may be requested for any of the predefined chronic condition cohorts, or users may request a customized cohort(s) specific to research focus areas. |
| Data Linking Feasibility (Unique identifiers or sufficient demographics to allow for data linkages) | CCW files can be linked together via a single unique identifier for each beneficiary. ICD-based grouping systems. |
| CMS Medicare Provider Analysis and Review (MedPAR) File | |
|---|---|
| References CMS MedPAR Hospital Data File. 2013. http://www.healthdatastore.com/cms-medpar-hospital-data-file.aspx# | |
| Database Description | |
| White Paper(s): | Data Systems and the Prevalence of Chronic Disease Combinations |
| Sponsorship: | Centers for Medicare & Medicaid Services |
| Description: | The Medicare Provider Analysis and Review (MEDPAR) File contains data from claims for all services provided to beneficiaries admitted to Medicare certified inpatient hospitals and skilled nursing facilities (SNF). |
| Database (Scope, Size, Setting, Population, Age Range) | National; representative of Medicare patients; 12 million in- patient visits |
| Database Type: (Survey, Registry, Research Study, Program Database, Claims, Administrative Data, and Clinical Databases) | Medicare Claims |
| Database Source/Origin: | Medicare claims for inpatient visits from over 6,000 hospitals. |
| Date or Frequency of Data Collection: | 1991–2012; updated yearly. |
| Longitudinal vs. Cross-sectional Database: | Longitudinal |
| Data Collection Methodology: | The Centers for Medicare and Medicaid Services (CMS) collects and releases data for all U.S. hospital inpatient stays for Medicare beneficiaries. Each record in the MedPAR file represents an inpatient stay during the calendar year of the file and has information on diagnosis, procedure, charge, payment, provider and patient for the claim. |
| Sampling Strategy: | All Medicare related inpatient hospital stays. |
| Unit of Analysis: | Inpatient Stay |
| Diagnosis Information | |
| Diagnosis Variable Type: (Chronic Condition Status, Principal Diagnosis, Primary Diagnosis, Secondary Diagnosis, Admit/Discharge Diagnosis and Self-Reported Diagnosis) | Principal Diagnosis Admission Diagnosis |
| Diagnosis Codes: (ICD-9, ICD-10, SNOMED) | ICD-9-CM |
| Number of Diagnoses Captured: | Up to 9 diagnoses and 6 surgical procedure codes are captured in the MedPAR file. |
| Cost, Utilization & Clinical Information | |
| Measures of Cost: (Claims, Out-of-pocket expenses, Self-reported expenditures, and Prescription Drug Costs) | TotalTotalCharges Payments |
| Measures of Healthcare Utilization: (Number of Visits, Any Procedures/Number of Procedures/Type of Procedure, Number of Admission/Type of Admission, Length of Stay, Hospitalizations, Emergency Department Utilization, etc.) | Number of Inpatients Visits Length of Stay |
| Measures of Healthcare Access: | n/a |
| Demographic Information: (Sex, Age, Race, Ethnicity, Marital Status, Disability Status, Language, Insurance Type, Educational Attainment). | Age, Gender and Race. |
| Clinical Information: (BMI, Medical Conditions [high blood pressure], Smoker Status, History of Various Conditions, Preventative Health Measures, Activities of Daily Living, Instrumental Activities of Daily Living) | n/a |
| Measures of Socioeconomic Status: (Occupation, Employment Status, Income, Wealth, Place of Residence, Household Size & Composition, geographic location) | State, Country Zip Code |
| Site of Service Information: | Hospital provider number can be used to identify geographic region. |
| Measures of Healthcare Outcomes: (Mortality, Morbidity, Mobility, Functional Status, Quality of Life, Quality Measures, Quality of Care, Readmissions) | Discharge Status |
| Strengths, Limitations & Feasibility | |
| Data Strengths: | Representative of all Medicare-related hospital inpatient admissions. |
| Data Limitations: | MedPAR data is generally available with one year lag time and covers around one-third of all hospital inpatients; and almost all of its patients are 65 plus. Consequently, some specialties such as Pediatrics and Obstetrics are practically absent. |
| Data Access Restrictions: | Because of data use restrictions, CMS cannot sell access to the raw data, but can provide a wide array of tabulations and descriptive statistics. |
| Data Linking Feasibility (Unique identifiers or sufficient demographics to allow for data linkages) | n/a |
| Related Grouping Systems: | ICD-based grouping systems. |
| Medicare Health Outcomes Survey | |
|---|---|
| References: Medicare Health Outcomes Survey. 2013. http://www.hosonline.org/Content/Default.aspx | |
| Database Description | |
| White Paper(s): | Data Systems and the Prevalence of Chronic Disease Combinations |
| Sponsorship: | Centers for Medicare & Medicaid Services |
| Description: | The Medicare HOS is the first outcomes measure used in Medicare managed care programs. The goal of the Medicare HOS program is to gather valid and reliable health status data in Medicare managed care for use in quality improvement activities, plan accountability, public reporting, and improving health. The Medicare HOS 2.0 contains four major components:
|
| Database (Scope, Size, Setting, Population, Age Range) | Medicare beneficiaries 18 years or older enrolled in Medicare Advantage Organizations with a minimum of 500 enrollees. |
| Database Type: (Survey, Registry, Research Study, Program Database, Claims, Administrative Data, and Clinical Databases) | Survey |
| Database Source/Origin: | Patient Survey Data |
| Date or Frequency of Data Collection: | Once a year, starting in 1998. |
| Longitudinal vs. Cross-sectional Database: | Longitudinal |
| Data Collection Methodology: | Data is collected from participating Medicare Advantage Organizations (MAOs) with a minimum of 500 enrollees |
| Sampling Strategy: | Each spring a random sample of Medicare beneficiaries is drawn from each participating MAO, that has a minimum of 500 enrollees and is surveyed (i.e., a survey is administered to a different baseline cohort, or group, each year). Two years later, these same respondents are surveyed again. Effective 2007, the MAO sample size is increased to twelve hundred. |
| Unit of Analysis: | Respondent, MAO’s, etc. |
| Diagnosis Information | |
| Diagnosis Variable Type: (Chronic Condition Status, Principal Diagnosis, Primary Diagnosis, Secondary Diagnosis, Admit/Discharge Diagnosis and Self-Reported Diagnosis) | Self-reported diagnosis |
| Diagnosis Codes: (ICD-9, ICD-10, SNOMED) | Self-reported diagnosis |
| Number of Diagnoses Captured: | Hypertension or high blood pressure, Angina pectoris or coronary artery disease, Congestive heart failure, Myocardial infarction or heart attack, Other heart conditions such as problems with heart valves or the rhythm of heartbeat, Stroke, Emphysema, or asthma, or COPD, Crohn’s disease, ulcerative, colitis, or inflammatory bowel disease, Arthritis of the hip or knee, Arthritis of the hand or wrist, Osteoporosis, Sciatica, Diabetes, high blood sugar, or sugar in the urine, Any cancer other than skin cancer, and Poor eyesight. |
| Cost, Utilization & Clinical Information | |
| Measures of Cost: (Claims, Out-of-pocket expenses, Self-reported expenditures, and Prescription Drug Costs) | n/a |
| Measures of Healthcare Utilization: (Number of Visits, Any Procedures/Number of Procedures/Type of Procedure, Number of Admission/Type of Admission, Length of Stay, Hospitalizations, Emergency Department Utilization, etc.) | Enrollment duration Caregiving for others in household |
| Measures of Healthcare Access: | Difficulty of getting around |
| Demographic Information: (Sex, Age, Race, Ethnicity, Marital Status, Disability Status, Language, Insurance Type, Educational Attainment). | Age, Gender, Marital Status, Race, and Education. |
| Clinical Information: (BMI, Medical Conditions [high blood pressure], Smoker Status, History of Various Conditions, Preventative Health Measures, Activities of Daily Living, Instrumental Activities of Daily Living) | BMI, Depression screen indicator, History of pain, Height History of falls, Comorbid Medical Conditions (Beneficiary reported) |
| Measures of Socioeconomic Status: (Occupation, Employment Status, Income, Wealth, Place of Residence, Household Size & Composition, geographic location) | Annual household income English language skills Household size Place of residence |
| Site of Service Information: | n/a |
| Measures of Healthcare Outcomes: (Mortality, Morbidity, Mobility, Functional Status, Quality of Life, Quality Measures, Quality of Care, Readmissions) | Health Status Activity Level |
| Strengths, Limitations & Feasibility | |
| Data Strengths: | Data can be used to assess the performance of MAOs and to reward high performers. Data can be used by health researchers to advance the state of the science in functional health outcomes measurement. Data can be used by managed care organizations, providers, and quality improvement organizations to monitor and improve health care quality. |
| Data Limitations: | Lacks cost information. Lacks information on chronic conditions besides the ones specifically inquired about. |
| Data Access Restrictions: | Several types of Medicare HOS data files are available for research purposes. Medicare HOS data files are available as public use files, limited data sets, and research identifiable files. |
| Data Linking Feasibility (Unique identifiers or sufficient demographics to allow for data linkages) | Beneficiaries are identified through their health insurance claims numbers. However, a beneficiary’s HIC number can change through special circumstances. |
| Related Grouping Systems: | n/a |
HMO Research Network Dataset
| HMO Research Network Virtual Data Warehouse | |
|---|---|
| References National Cancer Institute. HMO Research Network. 2013. http://epi.grants.cancer.gov/pharm/pharmacoepi_db/hmorn.html | |
| Database Description | |
| White Paper(s): | Data Systems and the Prevalence of Chronic Disease Combinations & Multiple Chronic Conditions and Disparities. |
| Sponsorship: | HMO Research Network |
| Description: | The HMORN Virtual Data Warehouse is a series of datasets developed from data submitted from 19 healthcare delivery organizations with integrated research practices. The purpose of the HMORN VDW is to provide a means by which to conduct broad spectrum population-based research studies to ultimately improve patient health and transform health care practice. HMORN research includes the following topics: biostatistics, mental health, cancer research, comparative effectiveness research, complementary & alternative medicine, communication & health literacy research, dissemination & implementation, epidemiology, genetic research, disparities research, health informatics, health services, infectious & chronic disease surveillance, patient-centered care, pharmaco- epidemiology, primary & secondary prevention, systems change and organizational behavior. |
| Database: (Scope, Size, Setting, Population, Age Range) | The HMORN VDW is a consortium of 19 healthcare delivery systems that submit claims and EHR data for all patients. |
| Database Type: (Survey, Registry, Research Study, Program Database, Claims, Administrative Data, and Clinical Databases) | Virtual Database - Data is housed at individual HMOs but can be accessed from anywhere. |
| Database Source/Origin: | Administrative Data, Claims Data, & Electronic Health Record Data (which includes clinical data). |
| Date or Frequency of Data Collection: | n/a |
| Longitudinal vs. Cross-sectional Database: | Longitudinal |
| Data Collection Methodology: | Programmers at participating sites transform EHR and claims data elements from local data systems to a VDW standardized set of variable definitions, names, and codes. The common structure allows for programming code developed at one site to be used at other sites to extract and analyze data for a research throughout the network. |
| Sampling Strategy: | All Patients |
| Unit of Analysis: | Patient |
| Diagnosis Information | |
| Diagnosis Variable Type: (Chronic Condition Status, Principal Diagnosis, Primary Diagnosis, Secondary Diagnosis, Admit/Discharge Diagnosis and Self-Reported Diagnosis) | Primary and secondary diagnoses. |
| Diagnosis Codes: (ICD-9, ICD-10, SNOMED) | ICD-9-CM (other: CPT-4 & HCPCS, NGC, CPI) |
| Number of Diagnoses Captured: | n/a |
| Cost, Utilization & Clinical Information | |
| Measures of Cost: (Claims, Out-of-pocket expenses, Self-reported expenditures, and Prescription Drug Costs) | Insurance Claims |
| Measures of Healthcare Utilization: (Number of Visits, Any Procedures/Number of Procedures/Type of Procedure, Number of Admission/Type of Admission, Length of Stay, Hospitalizations, Emergency Department Utilization, etc.) | Inpatient & Outpatient Visits |
| Measures of Healthcare Access: | n/a |
| Demographic Information: (Sex, Age, Race, Ethnicity, Marital Status, Disability Status, Language, Insurance Type, Educational Attainment). | Age, gender, race, ethnicity, insurance type, Hispanic vs. non- Hispanic, Educational Obtainment. |
| Clinical Information: (BMI, Medical Conditions [high blood pressure], Smoker Status, History of Various Conditions, Preventative Health Measures, Activities of Daily Living, Instrumental Activities of Daily Living) | Height, Weight, BMI, blood pressure, Laboratory Results, Tumor Status, Tumor Staging, prescription drug use. |
| Measures of Socioeconomic Status: (Occupation, Employment Status, Income, Wealth, Place of Residence, Household Size & Composition, geographic location) | County, State, Zip, Income |
| Site of Service Information: | Type of encounter, provider type, facility type. |
| Measures of Healthcare Outcomes: (Mortality, Morbidity, Mobility, Functional Status, Quality of Life, Quality Measures, Quality of Care, Readmissions) | Discharge Disposition |
| Strengths, Limitations & Feasibility | |
| Data Strengths: | Data submitted to this warehouse is continuously vetted and cleaned. Data maintained in this warehouse can be analyzed using programs written at any HMO. |
| Data Limitations: | Data is only submitted from health plans in twelve states. |
| Data Access Restrictions: | n/a |
| Data Linking Feasibility (Unique identifiers or sufficient demographics to allow for data linkages) | Although demographic information is available, a special emphasis of this database is to keep records anonymous. |
| Related Grouping Systems: | All ICD-related grouping systems. |
National Institute on Aging Dataset
| National Health & Aging Trends Study | |
|---|---|
| References Full bibliography available at http://www.nhats.org/scripts/biblioRep.htm | |
| Database Description | |
| White Paper(s): | Data Systems and the Prevalence of Chronic Disease Combinations & Multiple Chronic Conditions and Disparities. |
| Sponsorship: | National Institute on Aging |
| Description: | The National Health and Aging Trends Study (NHATS) is a new resource for the scientific study of functioning in later life. The NHATS is being conducted by the Johns Hopkins University Bloomberg School of Public Health, with data collection by Westat, and support from the National Institute on Aging. In design and content, NHATS is intended to foster research that will guide efforts to reduce disability, maximize health and independent functioning, and enhance quality of life at older ages. The NHATS will gather information on a nationally representative sample of Medicare beneficiaries ages 65 and older. In-person interviews will be used to collect detailed information on activities of daily life, living arrangements, economic status and well-being, aspects of early life, and quality of life. Among the specific content areas included are: the general and technological environment of the home, health conditions, work status and participation in valued activities, mobility and use of assistive devices, cognitive functioning, and help provided with daily activities (self-care, household, and medical). Study participants will be re-interviewed every year in order to compile a record of change over time. The content and questions included in NHATS were developed by a multidisciplinary team of researchers from the fields of demography, geriatric medicine, epidemiology, health services research, economics, and gerontology. As the population ages, NHATS will provide the basis for understanding trends in late-life functioning, how these differ for various population subgroups, and the economic and social consequences of aging and disability for individuals, families, and society. |
| Database: (Scope, Size, Setting, Population, Age Range) | National; persons >=65 years old; Adolescents Only (< 20 years old); 2–3 million records a year. |
| Database Type: (Survey, Registry, Research Study, Program Database, Claims, Administrative Data, and Clinical Databases) | Survey |
| Database Source/Origin: | Sample of Medicare beneficiaries |
| Date or Frequency of Data Collection: | Annual (round 1 completed in 2011) |
| Longitudinal vs. Cross-sectional Database: | Longitudinal |
| Data Collection Methodology: | Interview |
| Sampling Strategy: | Sample of over 8,000 Medicare beneficiaries ages 65 and older living in the contiguous U.S. Age-stratified so that persons are selected from 5 year age groups between the ages of 65 and 90, and from among persons age 90 and older. Oversample of persons at older age groups and persons whose race is listed as Black on the CMS enrollment file. Replenishment of the sample to maintain the ability to represent the older Medicare population is planned at regular intervals. |
| Unit of Analysis: | Patient |
| Diagnosis Information | |
| Diagnosis Variable Type: (Chronic Condition Status, Principal Diagnosis, Primary Diagnosis, Secondary Diagnosis, Admit/Discharge Diagnosis and Self-Reported Diagnosis) | Number of Chronic Conditions (based on a list of 25 possible chronic condition indicators) Primary and Secondary Diagnoses Admission and Discharge Status |
| Diagnosis Codes: (ICD-9, ICD-10, SNOMED) | None (self-report by patient) |
| Number of Diagnoses Captured: | 10 basic diagnoses (heart attack, heart disease, high blood pressure, arthritis, osteoporosis, diabetes, lung disease, stroke, dementia, cancer); more detailed questions are asked about each one if interviewee reports having or having had one or more of these illnesses. Additional questionnaires ask about cognitive status, mobility, sensory and physical impairments, and ACS disability questions |
| Cost, Utilization & Clinical Information | |
| Measures of Cost: (Claims, Out-of-pocket expenses, Self-reported expenditures, and Prescription Drug Costs) | Out-of-pocket cost of home environment modifications |
| Measures of Healthcare Utilization: (Number of Visits, Any Procedures/Number of Procedures/Type of Procedure, Number of Admission/Type of Admission, Length of Stay, Hospitalizations, Emergency Department Utilization, etc.) | Hospital stays/surgery, use of a medical doctor |
| Measures of Healthcare Access: | Measures of ability to handle medical care activities by oneself, whether patient has a regular doctor |
| Demographic Information: (Sex, Age, Race, Ethnicity, Marital Status, Disability Status, Language, Insurance Type, Educational Attainment). | Sex, Age, Race, Ethnicity, Marital Status, Disability Status, Language, insurance, education |
| Clinical Information: (BMI, Medical Conditions [high blood pressure], Smoker Status, History of Various Conditions, Preventative Health Measures, Activities of Daily Living, Instrumental Activities of Daily Living) | Various indicators of physical, social, sensory and cognitive functioning |
| Measures of Socioeconomic Status: (Occupation, Employment Status, Income, Wealth, Place of Residence, Household Size & Composition, geographic location) | Income, assets, housing, car ownership, labor force participation, helpers |
| Site of Service Information: | |
| Measures of Healthcare Outcomes: (Mortality, Morbidity, Mobility, Functional Status, Quality of Life, Quality Measures, Quality of Care, Readmissions) | Mortality (year to year), mobility, ability to complete activities of daily living, functional status |
| Strengths, Limitations & Feasibility | |
| Data Strengths: | Survey, longitudinal |
| Data Limitations: | Small sample size (8,000), little information about rarer conditions |
| Data Access Restrictions: | Users must register before downloading the data. Registration is instant and free online. |
| Data Linking Feasibility: Does not appear to be linkable to Medicare file. (Unique identifiers or sufficient demographics to allow for data linkages) | Does not appear to be linkable to Medicare file. |
| Related Grouping Systems: | N/A |
Utah Department of Health Dataset
| Utah All Payer Claims Database | |
|---|---|
| References Office of Health Care Statistics Utah Health Data Committee. The Utah All Payer Claims Database (APCD). 2013. http://health.utah.gov/hda/apd/ | |
| Database Description | |
| White Paper(s): | Data Systems and the Prevalence of Chronic Disease Combinations & Multiple Chronic Conditions and Disparities. |
| Sponsorship: | Office of Health Care Statistics; Utah Health Data Committee; Utah Department of Health |
| Description: | The Utah All Payer Claims Database (APCD) became the fifth operating APCD in the nation on September 13th, 2009 with the receipt of the very first data submissions. Participating plans submit enrollment, medical, and pharmacy files starting from 1/1/2007 until they are current. As of 2010, there are 11 plans in full production; that is, they have submitted all required historic data and are reporting new data on determined schedule |
| Database (Scope, Size, Setting, Population, Age Range) | State of Utah; all-payer claims data. |
| Database Type: (Survey, Registry, Research Study, Program Database, Claims, Administrative Data, and Clinical Databases) | Claims and administrative enrollment files. All payer claims database. |
| Database Source/Origin: | Medicaid Claims, CHIP, PPO’s and HMO’s in Colorado, Medicare claims are pending inclusion due to cost/infrastructure. |
| Date or Frequency of Data Collection: | Inpatient Hospital Discharge Data (1992–2010) Ambulatory Surgery Data (1996–2009) Emergency Department Data (1996–2010) |
| Longitudinal vs. Cross-sectional Database: | Longitudinal |
| Data Collection Methodology: | Health insurance carriers are required to submit health insurance files. |
| Sampling Strategy: | All patients receiving and paying for healthcare services in the State of Utah. |
| Unit of Analysis: | Patient |
| Diagnosis Information | |
| Diagnosis Variable Type: (Chronic Condition Status, Principal Diagnosis, Primary Diagnosis, Secondary Diagnosis, Admit/Discharge Diagnosis and Self-Reported Diagnosis) | Principal Diagnosis Secondary Diagnosis |
| Diagnosis Codes: (ICD-9, ICD-10, SNOMED) | ICD-9 or ICD-10 |
| Number of Diagnoses Captured: | Up to nine diagnoses are captured for each patient. |
| Cost, Utilization & Clinical Information | |
| Measures of Cost: (Claims, Out-of-pocket expenses, Self-reported expenditures, and Prescription Drug Costs) | Total Charges, Facility Charges, and Professional Charges |
| Measures of Healthcare Utilization: (Number of Visits, Any Procedures/Number of Procedures/Type of Procedure, Number of Admission/Type of Admission, Length of Stay, Hospitalizations, Emergency Department Utilization, etc.) | Length of Stay Discharges Type of Procure Admissions/Hospitalizations |
| Measures of Healthcare Access: | Yes, but specific measures not reported. |
| Demographic Information: (Sex, Age, Race, Ethnicity, Marital Status, Disability Status, Language, Insurance Type, Educational Attainment). | Age, Gender, Marital Status, and Race/Ethnicity. |
| Clinical Information: (BMI, Medical Conditions [high blood pressure], Smoker Status, History of Various Conditions, Preventative Health Measures, Activities of Daily Living, Instrumental Activities of Daily Living) | Yes, extensive clinical data from EHRs. |
| Measures of Socioeconomic Status: (Occupation, Employment Status, Income, Wealth, Place of Residence, Household Size & Composition, geographic location) | Place of Residence |
| Site of Service Information: | Zip Code, Residential County |
| Measures of Healthcare Outcomes: (Mortality, Morbidity, Mobility, Functional Status, Quality of Life, Quality Measures, Quality of Care, Readmissions) | Discharge Status Patient Severity Subclass Values Patient Risk of Mortality Values |
| Strengths, Limitations & Feasibility | |
| Data Strengths: | Large patient sample size; represents all types of payment sources. |
| Data Limitations: | Only representative of the State of Utah; still in development and missing claims data for some periods of time. |
| Data Access Restrictions: | Some files are publically available. However, more advanced files for health care cost, quality and access need to be purchased after IRB and HDC consent is achieved. |
| Data Linking Feasibility (Unique identifiers or sufficient demographics to allow for data linkages) | Patient and Physician Identifiers. Data is very easy to link; there are a number of personal identifiers. |
| Related Grouping Systems: | All ICD-related grouping systems. |
State of Colorado Dataset
| Colorado All Payer Claims Database | |
|---|---|
| References Colorado All-Payer Claims Database. 2013. http://www.colorado.gov/cs/Satellite/HCPF/HCPF/1249996141729 | |
| Database Description | |
| White Paper(s): | Data Systems and the Prevalence of Chronic Disease Combinations & Multiple Chronic Conditions and Disparities. |
| Sponsorship: | State of Colorado, Colorado Health Foundation, The Colorado Trust, Caring for Colorado Foundation, Rose Community Foundation and Kaiser Permanente Community Benefit Program; Center for Improving Value in Health Care (CIVHC). |
| Description: | The APCD is a secure database that includes claims data from commercial health plans, Medicare and Medicaid. Created by legislation in 2010 and administered by the Center for Improving Value in Health Care (CIVHC), the APCD is the only comprehensive source of health care claims data from public and private payers in Colorado. |
| Database (Scope, Size, Setting, Population, Age Range) | State All Payer Database (Commercial carriers, Medicaid, Medicare, Self-funded plans and small group). By 2014, the APCD will have collected claims data for 90% of Colorado’s 4.2 million insured. |
| Database Type: (Survey, Registry, Research Study, Program Database, Claims, Administrative Data, and Clinical Databases) | All Payer Claims Database |
| Database Source/Origin: | All claims: commercial carriers, Medicaid, Medicare, self- funded plans and small group plans. |
| Date or Frequency of Data Collection: | 2008-2011; update regularly |
| Longitudinal vs. Cross-sectional Database: | Longitudinal |
| Data Collection Methodology: | Health insurance carriers are required to submit health insurance files. |
| Sampling Strategy: | Information is collected on all Colorado healthcare expenditures. |
| Unit of Analysis: | Patient |
| Diagnosis Information | |
| Diagnosis Variable Type: (Chronic Condition Status, Principal Diagnosis, Primary Diagnosis, Secondary Diagnosis, Admit/Discharge Diagnosis and Self-Reported Diagnosis) | Admitting Diagnosis Principal Diagnosis 12 “Other Diagnosis” Categories |
| Diagnosis Codes: (ICD-9, ICD-10, SNOMED) | ICD-9 |
| Number of Diagnoses Captured: | n/a |
| Cost, Utilization & Clinical Information | |
| Measures of Cost: (Claims, Out-of-pocket expenses, Self-reported expenditures, and Prescription Drug Costs) | Total Cost Inpatient Facility Cost Outpatient Facility Cost (including ER cost) Profession Cost Drug Cost |
| Measures of Healthcare Utilization: (Number of Visits, Any Procedures/Number of Procedures/Type of Procedure, Number of Admission/Type of Admission, Length of Stay, Hospitalizations, Emergency Department Utilization, etc.) | Hospital Admissions Type of Service (ortho vs. pediatric) Readmissions |
| Measures of Healthcare Access: | Provider Density Variable |
| Demographic Information: (Sex, Age, Race, Ethnicity, Marital Status, Disability Status, Language, Insurance Type, Educational Attainment). | Sex Gender Age Insurance Status |
| Clinical Information: (BMI, Medical Conditions [high blood pressure], Smoker Status, History of Various Conditions, Preventative Health Measures, Activities of Daily Living, Instrumental Activities of Daily Living) | Yes, extensive clinical data from EHRs. |
| Measures of Socioeconomic Status: (Occupation, Employment Status, Income, Wealth, Place of Residence, Household Size & Composition, geographic location) | n/a Zip Code, County, Type of Service (inpatient vs. outpatient). |
| Site of Service Information: | Zip Code, County, Type of Service (inpatient vs. outpatient). |
| Measures of Healthcare Outcomes: (Mortality, Morbidity, Mobility, Functional Status, Quality of Life, Quality Measures, Quality of Care, Readmissions) | Discharge Status Readmissions |
| Strengths, Limitations & Feasibility | |
| Data Strengths: | Large patient sample size; represents all types of payment sources. |
| Data Limitations: | Only representative of the State of Colorado; still in development and missing claims data for some periods of time. |
| Data Access Restrictions: | Data is publically available. |
| Data Linking Feasibility (Unique identifiers or sufficient demographics to allow for data linkages) | Social Security Number, Plan Number, Employee Number, Provider Number. Information is grouped by zip code or region to protect personal health information. |
| Related Grouping Systems: | All ICD-related grouping systems. |
University of Michigan Dataset
| Health & Retirement Study | |
|---|---|
| References National Institute on Aging, National Institutes of Health, U.S. Department of Health and Human Services. Growing Older in America: The Health & Retirement Study. 2007. NIH Publication No. 07-5757 | |
| Database Description | |
| White Paper(s): | Data Systems and the Prevalence of Chronic Disease Combinations & Multiple Chronic Conditions and Disparities. |
| Sponsorship: | University of Michigan |
| Description: | The University of Michigan Health and Retirement Study (HRS) is a longitudinal panel study that surveys a representative sample of more than 27,000 Americans over the age of 50 every two years. This study is supported by the National Institute on Aging and the Social Security Administration and is designed to examine changes in labor force participation and the health transitions that individuals experience at the end of their working lives and into the years that follow. It is the leading resource for data on combined health and economic circumstance of Americans over the age of 50. |
| Database (Scope, Size, Setting, Population, Age Range) | The HRS study surveys more than 27,000 Americans over the age of 50 who represent the Nation’s diversity of economic conditions, racial and ethnic backgrounds, health, marital histories and family compositions, occupations and employment histories, living arrangements, and other aspects of life. As individuals drop out of the sample, they are replaced by new participants in their 50’s; it is nationally representative of the U.S. population over age 50. |
| Database Type: (Survey, Registry, Research Study, Program Database, Claims, Administrative Data, and Clinical Databases) | Research study and associated database. |
| Database Source/Origin: | Participant Interviews |
| Date or Frequency of Data Collection: | Interviews are conducted every two years. |
| Longitudinal vs. Cross-sectional Database: | This is a longitudinal panel survey that following individuals over multiple years. |
| Data Collection Methodology: | The majority of interviews are done by telephone, although exceptions are made when respondents have health limitations that would make an hour-long session on the telephone difficult of impossible. The preferred mode of data collection is face-to- face for the first wave of data collect, followed by subsequent waves of data collection conducted over the phone. |
| Sampling Strategy: | HRS uses a national area probability sample of U.S. households with supplemental oversamples of Blacks, Hispanics and residents of the state of Florida. Participation in this study/survey is optional, but there are incentives. |
| Unit of Analysis: | Individual |
| Diagnosis Information | |
| Diagnosis Variable Type: (Chronic Condition Status, Principal Diagnosis, Primary Diagnosis, Secondary Diagnosis, Admit/Discharge Diagnosis and Self-Reported Diagnosis) | Self-reported Diagnosis |
| Diagnosis Codes: (ICD-9, ICD-10, SNOMED) | Self-reported Diagnosis |
| Number of Diagnoses Captured: | n/a |
| Cost, Utilization & Clinical Information | |
| Measures of Cost: (Claims, Out-of-pocket expenses, Self-reported expenditures, and Prescription Drug Costs) | Out-of-pocket expenditures |
| Measures of Healthcare Utilization: (Number of Visits, Any Procedures/Number of Procedures/Type of Procedure, Number of Admission/Type of Admission, Length of Stay, Hospitalizations, Emergency Department Utilization, etc.) | Health Service Use by Type (i.e. Hospital, Nursing Home, etc.), Number of visits, etc. |
| Measures of Healthcare Access: | n/a |
| Demographic Information: (Sex, Age, Race, Ethnicity, Marital Status, Disability Status, Language, Insurance Type, Educational Attainment). | Age, Educational Attainment, Disability Status, Race, Ethnicity, Language, Sex, and Marital Status. |
| Clinical Information: (BMI, Medical Conditions [high blood pressure], Smoker Status, History of Various Conditions, Preventative Health Measures, Activities of Daily Living, Instrumental Activities of Daily Living) | Disease history, Medicare Use, Physical Activity, Height, Weight, Measurements of Lung Function, Blood Pressure, Grip Strength, and Walking Speed. |
| Measures of Socioeconomic Status: (Occupation, Employment Status, Income, Wealth, Place of Residence, Household Size & Composition, geographic location) | Occupation, Employment Status, Income |
| Site of Service Information: | Location of Health Service Type |
| Measures of Socioeconomic Status: (Occupation, Employment Status, Income, Wealth, Place of Residence, Household Size & Composition, geographic location) | Self-reported health status and measure of functional status. |
| Strengths, Limitations & Feasibility | |
| Data Strengths: | There are multiple years of data available (longitudinal data). Comprehensive documentation is available for all respondents across a variety of key policy issues. There is a low sample attrition rate. |
| Data Limitations: | Limited granularity in diagnosis coding, unless linked with Medicare claims data. |
| Data Access Restrictions: | Data are available to the public at no cost. Detailed race/ethnicity data are available on a restricted basis. |
| Data Linking Feasibility (Unique identifiers or sufficient demographics to allow for data linkages) | Respondent information can be linked to social security data, Medicare claims data and supplemental employer surveys. |
| Related Grouping Systems: | n/a |