
U.S. Department of Health and Human Services
Supportive Health Services Needs of Children with Disabilities
Elaine Maag
The Urban Institute
September 2000
PDF Version: http://aspe.hhs.gov/daltcp/reports/2000/suphsnd.pdf (22 PDF pages)
This report was prepared under contract #HHS-100-97-0010 between the U.S. Department of Health and Human Services (HHS), Office of Disability, Aging and Long-Term Care Policy (DALTCP) and the Urban Institute. For additional information about the study, you may visit the DALTCP home page at http://aspe.hhs.gov/daltcp/home.shtml or contact the ASPE Project Officer, William Marton, at HHS/ASPE/DALTCP, Room 424E, H.H. Humphrey Building, 200 Independence Avenue, SW, Washington, DC 20201. His e-mail address is: William.Marton@hhs.gov.
The opinions and views expressed in this report are those of the authors. They do not necessarily reflect the views of the Department of Health and Human Services, the contractor or any other funding organization.
TABLE OF CONTENTS
- SUPPORTIVE HEALTH SERVICE USE AND UNMET NEEDS OF CHILDREN WITH DISABILITIES
- Expanding the Measure of Unmet Need to Include Under Met Need
- Greatest Unmet Service Needs by Type and Severity of Limitation
- Unmet Service Needs Within Service Group, by Type of Limitation
- Unmet Need and Family Income
- Policy Implications
- LIST OF FIGURES
- FIGURE 1: Distribution of Supportive Health Service Use for Children with Disabilities
- FIGURE 2: Service Use and Unmet Need
- FIGURE 3: Average Service Needs by Limitation Type
- FIGURE 4: Average Service Needs by Severity
- FIGURE 5: Distribution of Children with Disabilities Across Income Types and Service Needs
- LIST OF TABLES
- TABLE 1: Children Ages 5-17 with Functional Disabilities by Type of Limitation
- TABLE 2: Children Ages 5-17 with Functional Disabilities by Severity of Limitation
- TABLE 3: Percent of Children with Disabilities Who Have Unmet Service Needs, by Type of Limitation and Service Type
- TABLE 4: Percent of Children with Disabilities and Severe Needs Who Have Unmet Service Need, by Severity of Limitation and Service Type
- TABLE 5: Distribution of Unmet Service Needs for Children with Disabilities, by Family Income and Service
Expanding health insurance coverage for children is a major thrust of recent health care policy. In 1997, for example, Congress enacted the State Childrens Health Insurance Program (SCHIP), a federal initiative to improve childrens health by increasing access to health care for children in low-income families. Because of its low- income focus, assessing the potential effectiveness of SCHIP in improving childrens health requires a look at health care needs and how they relate to family income.
The analysis reported here contributes to such an examination by focusing on the needs of a particular group of children -- children with disabilities.1 This focus is important for three reasons. First, children with disabilities typically use more health services than their non-disabled peers.2 Second, not receiving services they need is likely to affect children with disabilities more than other children. Third, the services used by children with disabilities are among the most costly health-related services children use.3
To sharpen the focus on the differential need4 of children with disabilities, this paper focuses on a subset of health-related services that are used almost exclusively by children with disabilities -- supportive services. The basic finding is that policies focused on low-income children will reach the majority of children with disabilities who have unmet supportive service needs. These needs range widely across types of services, however, making the effectiveness of public health insurance policies in reaching these children dependent also on how comprehensive the service coverage is.
DATA AND DEFINITIONS
An excellent data source for the study of children with disabilities and their service needs comes from the 1994 and 1995 waves of the National Health Interview Survey (NHIS), a nationally representative survey.5 In both these years the NHIS was administered in two parts. The first part contained a Disability Supplement designed to capture basic information on disability, which was used to identify a broad group of children with disabilities. The second part was a Disability Follow-Back Survey, administered typically six to eight months after the initial interview to the group of children the Disability Supplement had identified as having disabilities. The resulting data provide a unique opportunity to look at the service use and service needs of this population.6
Defining Disability. The definition of disability chosen for this analysis is functional disability.7 It identifies school-age children who have a limitation in any of four key areas of functional capacity: mobility, self-care, communication, and learning ability/social cognition. Of the 5,757 children who completed follow-back surveys in the 1994 and 1995 NHIS, the functional definition used here resulted in a subsample of 2,617 children representing 3.9 million children with disabilities. A severity index was created to group the children into three severity categories: mildly disabled (mild limitations only),8 moderately disabled (only one severe limitation), and severely disabled (two or more severe limitations).
Identifying Health Supportive Services. As noted, this paper focuses on supportive health services. The reason is that -- unlike the more traditional health service categories such as prescription drugs, annual doctor visits, or emergency care -- supportive health services tend to be unique to children with disabilities, and may, in consequence, be more likely to be overlooked in current childrens health care debates. Supportive services also tend to be used on a continuing basis, making it particularly appropriate to identify the need for them and to plan for their provision. These services are usefully divided into five categories, based on the general goals of each service.
- Services that assist in family-related activities:
- having respite care
-
having a social worker
- Services that improve the childs development:
- having a recreational therapist
- having a physical therapist
-
having an occupational therapist
- Services that help the child talk or hear:
- having a speech therapist
- having an audiologist
-
receiving special education communication services
- Services that assist the child in day-to-day functioning:
- having a reader or interpreter
- having independent living services or transportation
-
having a personal care attendant
- Medical services:
- receiving doctor home visits
- having a respiratory therapist
- receiving visiting nurse home visits
Measuring Unmet Need. Unmet need for a particular supportive service can be indicated for children in two sections of the NHIS -- in the section on other services and in the section on educational services. The same services often are asked about in both sections. But the treatment of unmet need is not consistent in the two sections. In the former, respondents who indicate the child is using a particular service are not also asked whether there is an unmet need for that service. In the latter, respondents who indicate the child is using a particular service can also indicate they are seeking that service. In the analysis reported here, children described by respondents as using a service are classified as receiving it and not having an unmet need for it. This leads to a conservative estimate of unmet service demand. A child can both use and have an unmet need within the five broad service categories, (e.g.; if a child has a recreational therapist and an unmet need for a physical therapist).
THE TYPES AND SEVERITY OF FUNCTIONAL LIMITATIONS FOR CHILDREN WITH DISABILITIES
Almost 8 percent of American children ages 5 to 17 (3.9 million children) have some form of functional limitation (Table 1). The most prevalent type of limitation is learning, involving 6.8 percent (3.5 million children). The least prevalent is self-care, involving less than one percent (431,000 children). Overall, 28 percent of the children with disabilities have multiple limitations (last column of Table 1). This proportion varies widely by type of limitation, however. Of the children with self-care limitations, for example, more than nine out of ten have at least one other limitation. For children with communication or mobility limitations, the proportions are not much lower -- eight out of ten and seven out of ten, respectively. For the most prevalent functional limitation (learning), however, only three out of ten have multiple limitations. In other words, most children with learning limitations have no other limitation, but most children with some other limitation have learning limitations as well. Only 3 percent of all children with disabilities are functionally limited on all four dimensions (not shown).
| TABLE 1. Children Ages 5-17 with Functional Disabilities by Type of Limitation | |||
| Number (1,000s) | Percent of All Children | Percent of DisabledGroup with More Than One Limitation | |
| Type of Limitationa: | |||
| Mobility | 604b | 1.2% | 72% |
| Self-Care | 431b | 0.8% | 91% |
| Communication | 1,006b | 2.0% | 81% |
| Learning | 3,482b | 6.8% | 30% |
| All Children with Disabilities | 3,936 | 7.7% | 28% |
SOURCE: National Health Interview Survey, 1994-1995.
| |||
With respect to severity, nearly three-fourths of children with disabilities (almost 73 percent) fall into the moderately disabled range (Table 2). Almost all the rest (22 percent) fall into the severely disabled range. Only 5 percent of children with disabilities fall into the mildly disabled range on the classification scale used here.9
| TABLE 2. Children Ages 5-17 with Functional Disabilities by Severity of Limitation | |||
| Number (1,000s) | Percent of All Children | Percent of Children with Disabilities | |
| Milda | 207 | 0.4% | 5.2% |
| Moderate | 2,860 | 5.6% | 72.7% |
| Severe | 868 | 1.7% | 22.1% |
| All Children with Disabilities | 3,936 | 7.7% | 100% |
SOURCE: National Health Interview Survey, 1994-1995.
| |||
SUPPORTIVE HEALTH SERVICE USE AND UNMET NEEDS OF CHILDREN WITH DISABILITIES
Most children with functional disabilities report either getting the supportive health services they need or not needing such services (Figure 1).10 The majority (58 percent) of children with disabilities do not report needing any supportive health services. Another 34 percent report receiving services and having no unmet need. For the remainder, 6 percent report using services but having an unmet need as well; 2 percent report using no services and having unmet need. This also means that of children with service needs, nearly 1 in 5 report at least one unmet need.
| FIGURE 1. Distribution of Supportive Health Service Use for Children with Disabilities |
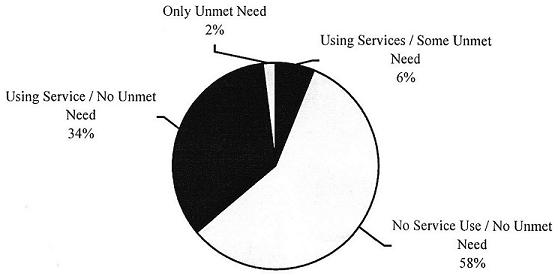 |
| SOURCE: National Health Interview Survey, 1994-1995. |
Of the 42 percent of children with functional disabilities who are receiving services and/or report unmet need, Figure 2 shows the number who report using, and the number having an unmet need for, each service group and each service in each group. The length of each bar (light plus dark shading) represents the total number of children with disabilities who need the service (i.e., the total number reporting use of the service plus the total number reporting unmet need). To the right of each bar, the percentage of service need that remains unmet is shown. The service groups are listed in descending order of total need.
Of the five service groups, communication services is both needed and used by the largest numbers of children with disabilities. It is also the service group with the lowest proportion of unmet need (5 percent, representing 79,000 children out of a total of 1.45 million children reporting a need for this service group). Within the communication services group, speech therapy has the largest total need and the smallest proportion of need that remains unmet (4 percent). Special education services has the smallest total need in the communication category, but the highest proportion of need that remains unmet (10 percent).
| FIGURE 2. Service Use and Unmet Need |
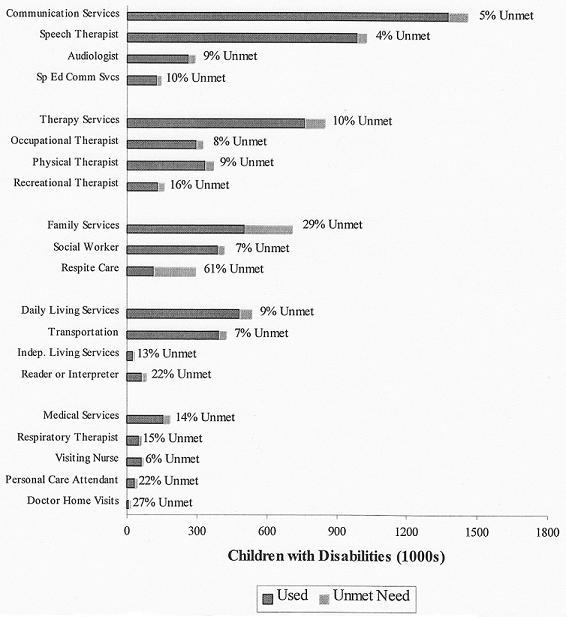 |
The next largest service need is for therapy services, with 846,000 children needing the service and 761,000 children using it. Unmet need for therapy services amounts to 10 percent of total need. Within this service group, physical therapy and occupational therapy are needed and used by substantially more children than recreational therapy. But the unmet need for the two services (8-9 percent of total need) is lower than for recreational therapy (16 percent of total need).
Family services is the third most needed service group. But the highest proportions of unmet need are in this service group. For the family service group as a whole, 29 percent of the need remains unmet. For respite care, the majority (61 percent) of the need is unmet.
Daily living services are needed by slightly over half a million (534,000) children with disabilities. Of these, transportation accounts for most of the service use but proportionately least (7 percent) of the need that is unmet. Reader or interpreter services have proportionately more unmet need (22 percent) than transportation or independent living services (13 percent).
Medical supportive services is the least used service group, with doctor home visits used by fewer children than the other medical supportive services in the group. For the service group as a whole, 14 percent of the need remains unmet, most of which is accounted for by unmet need for personal care attendants (22 percent) and doctor home visits (27 percent).
Expanding the Measure of Unmet Need to Include Under Met Need
A growing concern when discussing unmet need is the concept of under met need, a recognition that a child can be receiving a service, yet need more. While there are no questions in this survey that ask if a child needed more of a particular service, a parent could indicate that a child used a special education service and that they tried to get more of the service. For the selected special education services studied in this paper, the proportion of children with disabilities who have some unmet need is 2.5 percent, and the proportion of children with disabilities who have some unmet or under met need is 4.1 percent. While the overall proportion of children with disabilities who have unmet or under met needs is fairly small, the impact of adding under meet need to unmet need is relatively large -- an increase of 64 percent. Because it is unclear whether this represents all under met need (parents may not always report trying to get a service if the child is using the service) and because it is only asked of some questions, under met need is not included in further analysis.
Greatest Unmet Service Needs by Type and Severity of Limitation
The average service need among children with disabilities who report some service need is modest -- 2.24 services. Most (88 percent) of this need, which averages 1.98 services, is reported as being met, with met service needs for a child reaching a maximum of 13 services. The proportion of service need that remains unmet is 12 percent (.27 services per child on average), with unmet service needs reaching a maximum of 7 services. Of the children reported as having at least one need, 50 percent are reported to need only that service, and 80 percent report no unmet need.
Average service need, use, and unmet need vary by type of limitation (Figure 3). Children with self-care limitations use the highest number of services on average (2.7 services). Children with mobility limitations and with communication limitations are next, each with an average service need of 1.8 services. The lowest average service use is reported by children with learning limitations (0.8 services). The average amounts of total need and total unmet need follow the same general pattern. Interestingly, the proportion of need remaining unmet is virtually the same for all three types of limitation (12-13 percent on average). Thus, the type of limitation a child has does not seem importantly related to the proportion of unmet service need.
| FIGURE 3. Average Service Needs by Limitation Type |
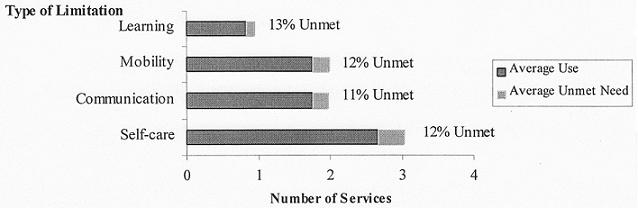 |
With respect to severity of limitation, hardly surprising, children with severe limitations have the most service needs -- 2.25 on average, between three and four times as many as for the two less severely limited groups (at .65 for mildly limited and .57 for moderately limited children), as shown in Figure 4. The proportions of total need remaining unmet are modest and not strongly related to severity of limitation, ranging from 10 percent for the mildly limited to 13 percent for the moderately limited.11
| FIGURE 4. Average Service Needs by Severity |
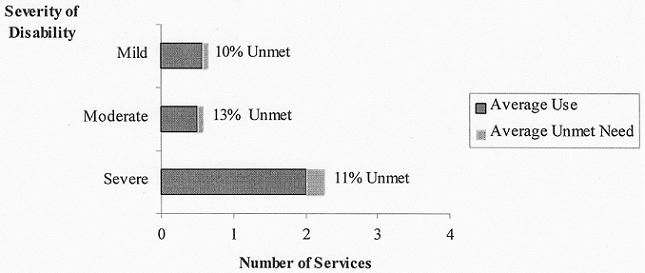 |
Unmet Service Needs within Service Group, by Type of Limitation
The large number of children with moderate or severe limitations and the wide variety of services children with disabilities use combine to suggest that children with disabilities experience limitations in multiple ways. It is useful to look more systematically at whether unmet need is concentrated in particular limitation or service categories. Table 3 shows how unmet need for particular services breaks down by type of limitation. Although the proportion of unmet need differs by limitation, the pattern of unmet service need for each limitation group is proportionately highest for family services and lowest for medical supportive services. The very low unmet need rates for medical supportive services may be due in good part to the dire consequences that often accompany unmet need for this type of service. Therapy services, communication services, and daily living services are arrayed in generally descending order between the two extremes. The only exception to this is a higher proportion of unmet need for communication services than for therapy services for children with learning limitations.
| TABLE 3. Percent of Children with Disabilities Who Have Unmet Service Needs, by Type of Limitation and Service Type | ||||||||
| Service Type | Type of Limitationa | |||||||
| Mobility | Self-Care | Communication | Learning | |||||
| Percent | Number | Percent | Number | Percent | Number | Percent | Number | |
| Any | 14.7% | 89,000 | 24.4% | 105,300 | 15.4% | 155,000 | 8.5% | 295,200 |
| Family | 8.9% | 53,600 | 17.7% | 76,400 | 10.4% | 104,400 | 5.1% | 177,100 |
| Therapy | 4.9% | 29,400 | 5.8% | 25,200 | 3.9% | 38,800 | 1.8% | 64,200 |
| Communication | 2.7% | 16,500 | 3.3% | 14,300 | 2.8% | 28,000 | 2.1% | 74,200 |
| Daily Living | 2.7% | 16,200 | 2.7% | 11,800 | 1.7% | 17,100 | 1.2% | 42,100 |
| Medical Supportive | 1.5% | 9,200 | 2.7% | 11,900 | 1.2% | 11,900 | 0.5% | 17,300 |
SOURCE: National Health Interview Survey, 1994-1995.
| ||||||||
As can be seen, the largest proportion of children with unmet needs is in the area of self-care limitations. Almost a quarter (24.4 percent) of the children with self-care limitations have some unmet service need. Unmet service need for this group ranges from 17.7 percent with unmet need for family services down to 2.7 percent for daily living services and medical supportive services. About the same proportions of children with mobility limitations (14.7 percent) and with communication limitations (15.4 percent) have some unmet service need, ranging from 8.9 percent and 10.4 percent, respectively, for family services, down to 1.5 percent and 1.2 percent for medical supportive services. The lowest proportion (8.5 percent) of children with any unmet need is among children with learning limitations, ranging from 5.1 percent for family services down to 0.5 percent for supportive medical services.
| TABLE 4. Percent of Children with Disabilities and Severe Needs Who Have Unmet Service Need, by Severity of Limitation and Service Type | ||||||
| Service Type | Severity of Limitation | |||||
| Mild | Moderate | Severe | ||||
| Percent | Number | Percent | Number | Percent | Number | |
| Any | 5.0% | 10,300 | 5.4% | 154,500 | 18.3% | 159,200 |
| Family | 1.2% | 2,500 | 2.8% | 80,500 | 12.8% | 111,500 |
| Therapy | 3.2% | 6,700 | 0.9% | 25,400 | 4.6% | 40,400 |
| Communication | 0.5% | 1,100 | 1.8% | 51,700 | 3.0% | 25,800 |
| Daily Living | 0.9% | 1,800 | 1.0% | 27,100 | 1.8% | 16,000 |
| Medical Supportive | a | a | 0.2% | 5,500 | 1.4% | 11,900 |
SOURCE: National Health Interview Survey, 1994-1995.
| ||||||
How unmet need relates to service type for different degrees of limitation is shown in Table 4. For services overall, children with severe limitations are most likely to have unmet need -- 18.3 percent of them have some unmet need, compared with just over 5 percent for the two less severely limited groups. It should be noted that, although the proportion of unmet need is substantially higher for children with severe limitations than for children with moderate limitations, the absolute number of children with unmet need in the two groups is closely comparable (159,000 children and 155,000 children, respectively).
This pattern of proportional unmet need appears consistently for every service group, although (as for service use and total need) the scale of the unmet need differs by service. For all but the group with mild limitations, the greatest proportional unmet need is family services -- 12.8 percent of children with severe limitations and 2.8 percent of children with moderate limitations have unmet needs for this service. Unmet service need then declines steadily by service for all degrees of limitation -- from therapy services, to communication services, to daily living services, to medical supportive services (at the low end).
Unmet Need and Family Income
Current policy efforts to expand health insurance coverage, as noted, focus on providing public health insurance to low-income children (those at or below 200 percent of the official poverty line). The rationale for such a strategy is that low-income children are least likely to have private health coverage and can be expected, in consequence, to have the greatest problems accessing care. This section addresses the unmet needs of children with disabilities in relation to whether their household incomes are below or above 200 percent of poverty.
The pattern, as shown in Figure 5, is quite clear. About 60 percent of the children with disabilities live in low-income families. Similarly high percentages of children with disabilities and service needs, and of children with disabilities and unmet service needs, live in such families. Thus, coverage policies directed towards low-income families with children will have a favorable impact on the low-income group within the population of children with disabilities.
| FIGURE 5. Distribution of Children with Disabilities Across Income Types and Service Needs |
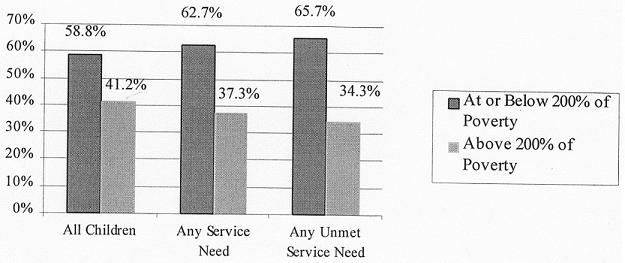 |
How family income relates to unmet service needs for specific services is shown in Table 5. Over 9 percent of children with disabilities in low-income families have unmet needs for some service compared with 6.9 percent of such children in higher income families. This reflects absolute need almost twice as high for the low-income as for the higher income group (213,000 children versus 111,000 children). The same pattern of greater proportional need for low-income children with disabilities carries through for all service categories except therapy services.
| TABLE 5. Distribution of Unmet Service Needs for Children with Disabilities, by Family Income and Service | ||||
| Service Type | Household Income (Percent of Poverty) | |||
| At or Below 200% | Above 200% | |||
| Percent | Number | Percent | Number | |
| Any | 9.3% | 212,900 | 6.9% | 111,100 |
| Family | 5.8% | 134,500 | 3.7% | 60,000 |
| Therapy | 1.6% | 37,800 | 2.1% | 34,700 |
| Communication | 2.1% | 49,600 | 1.8% | 28,900 |
| Daily Living | 1.4% | 32,900 | 0.7% | 12,100 |
| Medical Supportive | 0.5% | 10,900 | 0.4% | 6,400 |
| SOURCE: National Health Interview Survey, 1994-1995. | ||||
The dominance of family services in the unmet needs category appears here as in previous comparisons, with almost 6 percent of low-income children and 3.7 percent of their higher income counterparts having unmet need for this service. For no other service category does the proportional unmet need rise above 2.1 percent for either low-income or higher income children with disabilities.
Policy Implications
Of the population of children with functional disabilities, less than one out of ten report having an unmet supportive health service need. However, when considering only those children who have service needs, one in five report having that need unmet. Of the children with disabilities who report an unmet need, about two out of three live in families with incomes below 200 percent of poverty. Thus, policies to expand child health care coverage that focus on low-income families will reach the majority of children with disabilities who have unmet needs -- as long as these expansion policies cover the needed services.
The children who report unmet supportive health needs span a wide range of types and severity of limitation and types of services -- yielding no unambiguous primary target group for policy focus. The fundamental policy tradeoff highlighted by the findings reported here is between focusing on the greatest relative amount of unmet need versus trying to reach the largest group of children with unmet need.
It is quite clear from the findings, for example, that children with self-care limitations and children with severe limitations -- heavily overlapping groups -- are much more likely to have unmet service needs than children with non-self-care limitations and less severe limitations. Children with self-care limitations have, on average, over three times as much unmet need per child as all children with disabilities. However, self-care limitations are the least common type of disability (affecting 431,000 out of 3.9 million children with disabilities). Severely disabled children are also in the minority, constituting 22 percent of children with disabilities.
If policymakers wish to target the largest group of children with disabilities, they will do so by focusing on the nearly 90 percent of children with disabilities who have a learning limitation. Policies focusing on this group could potentially reach 3.5 million children, almost 13 percent of whose need for supportive services is unmet. Such policies would also potentially reach a proportion of children with other types of disability as well, since 30 percent of children with learning limitations have other functional limitations as well.
The plausible expectation that using one service will increase a childs access to other services -- and thus reduce their unmet service need -- is not borne out by the findings reported here. If this were the case, the proportion of need that remains unmet would be inversely related to the severity of the functional limitation (since the more severely disabled use more services on average). In fact, the proportion of unmet service needs is relatively similar across severity groups -- 10.3 percent for the mildly limited, 13 percent for the moderately limited, and 11 percent for the severely limited.
Finally, if policymakers wish to focus on the type of services with greatest unmet need, family services heads the list for every type of limitation and every degree of severity. For children with self-care limitations and children with severe limitations, for example, covering such services would reduce unmet need by 17.7 percent and 12.8 percent, respectively. For the whole group of children with disabilities, covering this service would reduce overall unmet need by almost 50 percent, though from a much lower base of current need.
END NOTES
-
The paper is based on Maag, E, Unmet Service Needs of Children with Disabilities. This paper is available upon request for readers interested in the full technical discussion.
-
This is particularly true for children with functional limitations, which is my focus here. See Newacheck, PW & MA McManus, Financing Health Care for Disabled Children, Pediatrics, Vol.81:3, March 1988; and Newacheck PW & MA McManus, Financing Health Care for Chronically Ill Children, Pediatrics, Vol.85:1, January 1990.
-
Regenstein, M & JA Meter, Low Income Children with Disabilities: How Will They Fare Under Health Care Reform?, The Economic and Social Research Institute, August 1994.
-
Other studies have documented differential service use. (See, for example, Newacheck, PW & MA McManus, Financing Health Care for Disabled Children, Pediatrics, Vol.81:3, March 1998.) I document differential need as well.
-
The NHIS is a personal interview household survey of the civilian, noninstitutionalized population of the United States. The core is administered every year, with supplements that differ by year.
-
Administrative or waiting list data restrict the focus to those actually seeking services.
-
Studying disability in the context of functional limitations allows a focus on needs in relation to life activities. This makes it possible to look at the similarities between children with different conditions but similar needs. It also avoids problems of inconsistent or misreported diagnoses that are associated with specific condition listings. It should be noted that this definition misses 38 percent of children who quality for disability under the Supplemental Security Income (SSI) program, either because they are receiving services that prevent them from having a functional limitation or because qualifying conditions for SSI do not always manifest in functional limitations. The SSI population is not an appropriate option for a population study, however, because the income-conditioned nature of the SSI benefit will impart a downward bias to the income distribution estimates. The precise definition of the functional disability used here is a slight modification of the one developed by Hogan, DP, ME Msall, ML Rogers, and RC Avery, Improved Disability Population Estimates of Functional Limitation Among American Children Age 5-17, March 23, 1998.
-
In the NHIS, children reporting a limitation in either communication or learning ability, as defined by Hogan et al., were only administered the Disability Follow-Back Survey if they had two identifying characteristic rather than one. This effectively removes from the mildly disabled category, as specified for this analysis, those classified by Hogan et al. as having only a mild communication or learning limitation. In the communication and learning functional areas, over 20 percent of the children included in Hogans definition were not flagged to receive the NHIS follow-back survey. Thus, the mildly disabled category here is considerably smaller and relatively more functionally limited than the group classified as mildly disabled by Hogan et al.
-
When the Hogan et al. (1998) less restrictive definition of mild communication and learning limitation is used (into which a large number of children fall), the majority of children with disabilities fall into the mildly disabled category.
-
It is important to keep in mind that the services on which this analysis focuses do not include medical care or surgery. This, as noted, is because such services are not unique to children with disabilities (although they are typically used more by such children) and will, in any case, be included in any broad legislation aimed at improving childrens health. Unmet need would increase from 8 percent to 12 percent if these were included. The services focused on here also do not include selected special education services. This is because the NHIS survey did not capture the substantial amount of such services that are accessed outside the special education system, imparting unknown bias to any estimates of use. Special education services that were not included are mental health or counseling services, developmental testing, eyeglasses, hearing aids, wheelchairs, other assistive devices and training in their use, medical services for diagnostic and evaluation purposes, and ?other services.
-
The differences between the mildly and moderately limited in average number of service needs, use, and unmet needs are not statistically significant. If the children who are only mildly limited in learning and communication were included, average service need, use, and unmet need would probably fall, since these limitations are generally tied to lower service use.
REPORTS AVAILABLE
- Barriers to and Supports for Work Among Adults with Disabilities: Results from the NHIS-D
- Executive Summary http://aspe.hhs.gov/daltcp/reports/barrses.htm
- Full HTML Version http://aspe.hhs.gov/daltcp/reports/barriers.htm
- Full PDF Version
- Supportive Health Service Needs of Children with Disabilities
- Full HTML Version http://aspe.hhs.gov/daltcp/reports/2000/suphsnd.htm
- Full PDF Version http://aspe.hhs.gov/daltcp/reports/2000/suphsnd.pdf
To obtain a printed copy of this report, send the full report title and your mailing information to:
U.S. Department of Health and Human ServicesOffice of Disability, Aging and Long-Term Care PolicyRoom 424E, H.H. Humphrey Building200 Independence Avenue, S.W.Washington, D.C. 20201FAX: 202-401-7733Email: webmaster.DALTCP@hhs.gov
RETURN TO:
Office of Disability, Aging and Long-Term Care Policy (DALTCP) Home [http://aspe.hhs.gov/_/office_specific/daltcp.cfm]Assistant Secretary for Planning and Evaluation (ASPE) Home [http://aspe.hhs.gov]U.S. Department of Health and Human Services Home [http://www.hhs.gov]